The Percolation Properties of Electrical Conductivity and Permeability for Fractal Porous Media

1
State Key Lab of Marine Geology, Tongji University, Shanghai 200092, China
2
College of Earth and Mineral Sciences, The Pennsylvania State University, University Park, PA 16802, USA
3
Research Institute of Petroleum Exploration and Development, PetroChina, Langfang 065007, China
*
Author to whom correspondence should be addressed.
Energies 2019, 12(6), 1085; https://doi.org/10.3390/en12061085
Submission received: 13 February 2019
/
Revised: 14 March 2019
/
Accepted: 15 March 2019
/
Published: 21 March 2019
(This article belongs to the Special Issue Mathematical Modeling of Fluid Flow and Heat Transfer in Petroleum Industries and Geothermal Applications)
Abstract
:Many cases have indicated that the conductivity and permeability of porous media may decrease to zero at a nonzero percolation porosity instead of zero porosity. However, there is still a lack of a theoretical basis for the percolation mechanisms of the conductivity and permeability. In this paper, the analytical percolation expressions of both conductivity and permeability are derived based on fractal theory by introducing the critical porosity. The percolation models of the conductivity and permeability were found to be closely related to the critical porosity and microstructural parameters. The simulation results demonstrated that the existence of the critical could lead to the non-Archie phenomenon. Meanwhile, the increasing critical porosity could significantly decrease the permeability and the conductivity at low porosity. Besides, the complex microstructure could result in more stagnant pores and a higher critical porosity. This study proves the importance of the critical porosity in accurately evaluating the conductivity and permeability, and reveals the percolation mechanisms of the conductivity and permeability in complex reservoirs. By comparing the predicted conductivity and permeability with the available experimental data, the validity of the proposed percolation models is verified.
1. Introduction
Electrical conductivity and permeability are the crucial macroscopic parameters in characterizing current and fluid flow behaviors in porous media, and have numerous applications in the geology, petroleum, and chemical engineering, hydrology, and soil science. Although electrical conductivity and permeability have been studied over the past decades, modeling and predicting conductivity and permeability are still great challenges. The inherent complexity of both conductivity and permeability is due to its dependence on microscopic, pore-scale properties such as connectivity, tortuosity, and pore sizes. Because the conductivity and permeability of a porous medium are strongly affected by the pore structure, the reliable theoretical assessment of the conductivity and permeability based on the medium structural characteristics is important.
Due to the complex geometric microstructure and multiscale pore structure [1,2,3], it is difficult to use conventional geometric methods to accurately describe the conductivity and permeability of porous media. Since fractal theory was introduced by Mandelbrot [4], it has contributed significantly to the research on the rock-electric and seepage characteristics in complex reservoirs [5,6,7,8,9,10,11,12,13]. Direct experimental measurements have been applied to the study of fractal characterizations [14], and fractal analysis has become a powerful tool for quantifying the irregularity and complexity of porous media [15,16,17,18,19,20,21]. In the application, there are numerous examples that present the application of fractal theory to analyze porous media. Roy and Tarafdar [22] simulated a realistic Archie exponent by using a three-dimensional fractal model, and used a random walk parameter to show the fractal nature of the pore space. Coleman and Vassilicos [11,12] further proved the validity of that method. Nigmatullin et al. [23] assumed that the minimum pore size involved in electrical conduction through saturated rocks is the same as the minimum pore size in the fractal pore structure, and presented a fractal model that led to the Archie’s equation. By means of the fractal geometry method, Wei et al. [24] derived an analytical model for electrical conductivity that has a direct physical basis. In addition, Pitchumani and Ramakrishnan [25] gave the permeability in terms of pore fractal dimension and tortuosity fractal dimension, which respectively describe the size distribution and the tortuous degree of the capillaries. Yu and Li [21] deduced a unified model to study the fractal character of porous media, and proposed a criterion to determine whether a porous medium can be characterized by fractal theory. Xu and Yu [26] developed a new form of permeability and Kozeny–Carman constant by means of fractal geometry. However, several observations and studies have suggested that there exists a percolation porosity below which the remaining porosity is disconnected and does not contribute to current and fluid flow [27,28,29]. Many traditional and recently presented fractal models have been unable to explain this phenomenon. Many experimental studies have shown that the percolation behavior of pore space is one of the most important characteristics, having a huge influence on the conductivity and permeability. Several empirical percolation models were proposed by the analysis of the experimental data to model and study the electrical and fluid transport properties in porous media [30,31,32,33,34,35,36,37,38], but a theoretical basis for the percolation mechanisms of the conductivity and permeability is still lacking.
In order to develop a good understanding of the percolation mechanisms of the conductivity and permeability in porous media (especially in tight sandstones and microporous carbonates), in this paper, the analytical expressions are developed using the fractal geometry theory to link the conductivity and permeability to the critical porosity and microstructural parameters. The objectives of this work were to provide the theoretical basis for the percolation mechanisms of the conductivity and permeability, study the significant effect of the critical porosity and microstructure on the rock-electric and seepage characteristics, and estimate the conductivity and permeability more accurately. Both the conductivity and permeability percolation models are experimentally verified.
2. Theoretical Formulation
2.1. Fractal Characteristics of Porous Media
In porous media, studies have shown that pore microstructure (e.g., the pore size distribution) displays fractal characteristics [39,40,41,42]. It is assumed that porous media consist of tortuous capillaries with variable lengths and diameters. According to fractal theory, the number of cumulative capillaries has been proven to obey the fractal scaling law [43]:
where N is the number of capillaries whose diameters are greater than or equal to r, Df is the fractal dimension for pore space, the typical range of Df is 1 < Df < 2 in two dimensions or 2 < Df < 3 in three dimensions, and rmax is the maximum diameter of capillaries.
Replacing r with rmin in Equation (1) yields the total number of pores/capillaries:
where Nt is the total number of capillaries in porous media, and rmin is the minimum diameter of capillaries.
For fractal porous media, pore size distribution is considered as a continuous and differentiable function. Through differentiating Equation (1) with respect to r, one can obtain the number of capillaries/pores whose sizes are within the infinitesimal range r to r + dr:
The negative sign on the left side means that the number of pores decreases with increasing pore diameter. Dividing Equation (3) by Equation (2) yields the probability density function of pore size distribution [44]:
According to probability theory, the integration result of f(r) should satisfy the normalization relationship:
Thus, one can obtain the following equation from Equation (5):
Generally, rmin is assumed to be much smaller than rmax, thereby Equation (6) holds for fractal porous media.
As for the complex pore space, suppose that there exist tortuous capillaries rather than straight capillaries. Tortuous capillaries in porous media have been proven to show self-similar and fractal behaviors, and thus the tortuous length of capillaries also follows the fractal scaling law [45]:
where Dt is the tortuosity fractal dimension of pore space, with 1 ≤ Dt ≤ 2 and 1 ≤ Dt ≤ 3 for two- and three-dimensional spaces, respectively. A value of Dt = 1 represents a straight capillary, while a greater value of Dt > 1 corresponds to a tortuous capillary.
Then, the tortuosity is defined as the ratio of the tortuous length L to the straight-line length L0 [46], and the tortuosity is also scale dependent. Therefore, the fractal tortuosity can be derived from Equation (7):
where τ is the fractal tortuosity.
For the case of tortuous capillaries, the total cumulative volume of pores can be obtained by:
Meanwhile, the pore volume with pore diameter less than rc can be expressed as follows:
where rc denotes the critical pore diameter, which controls the conductive or seepage properties, and below the critical pore diameter, it is considered that there is no current and fluid flowing through a porous medium (i.e., the conductivity and permeability become zero).
It is possible to relate the critical porosity to the corresponding critical pore diameter using Equations (9) and (10):
where represents the critical porosity or stagnant porosity, which corresponds to the critical pore diameter and reflects the pore connectivity, and the greater the critical porosity is, the worse the connectivity is.
The porosity, pore sizes, and the fractal dimensions are related by:
where De is the Euclidean dimension, with De = 2 and 3 for two- and three-dimensional spaces. In the following analysis and discussion, the taken value of De is 3.
Assuming , and using Equation (12) can simplify Equation (11) as:
2.2. Fractal Analysis of the Rock-Electric Property
As for the tortuous pore space fully saturated with water, Archie’s equation can be expressed in terms of the tortuosity factor [47]:
where and are the electrical conductivity of water and porous media, respectively, and and are the porosity and tortuosity, respectively.
Considering that only effective connected pores contribute to the conductivity, by taking the critical porosity into account, Equation (14) is further modified as follows:
where is an undetermined coefficient, and represents the effective tortuosity of the electrically connected pores. Moreover, Equation (15) should satisfy the following boundary condition: , , and taking it into Equation (15) gives . Then, Equation (15) becomes:
As mentioned above, only the pore space above the critical porosity forms the effective conductive pathway, and it is appropriate to use the effective tortuosity to describe the effective conductive pathway. Therefore, averaging the tortuosity over the pores with pore diameter larger than rc yields the effective tortuosity:
Using Equation (6) further simplifies Equation (17) as:
Substituting Equations (12) and (13) into Equation (18) expresses the effective tortuosity as:
Then, we can obtain the following expression:
Furthermore, substituting Equations (19) and (20) into Equation (16) yields the conductivity:
Equations (21) and (22) give the analytical percolation expression of the conductivity, which reveals that Archie’s equation is closely related to the critical porosity and microstructure.
2.3. Fractal Analysis of the Permeability Property
The flow in a single tortuous capillary is assumed to obey the Hagen–Poiseuille equation:
where q is the flow rate of a single capillary, μ is the viscosity, and ΔP is the pressure drop.
For a porous medium, the total volumetric flow rate is the sum of the flow rates through all the capillaries. Considering that the pore sizes below the critical pore size cannot contribute to the flow rate, integrating the individual flow rate over the pores with pore diameter larger than rc gives the total flow rate Q as:
Moreover, the total flow rate Q can also be given by Darcy’s law:
Then, combining Equations (24) and (25) can obtain the absolute permeability as:
where K denotes the absolute permeability, and A0 represents the cross-sectional area of a porous medium, which is written as follows:
Substituting Equation (9) into Equation (27) obtains:
Then, combining Equations (11), (26), and (28) yields the analytical percolation expression of the permeability:
Without involving the empirical constants, Equation (29) gives the permeability in terms of the porosity, critical porosity, fractal dimension Df, tortuosity fractal dimension Dt, and structural parameters L0 and rmax, which can better describe the seepage property in porous media with complex pore structure. Equation (29) also indicates that the permeability is very sensitive to the maximum pore diameter rmax: the larger the maximum pore diameter is, the greater the permeability becomes, which is consistent with the practical situation. Note that the critical pore diameter or critical porosity is not necessarily the same for the electrical conductivity and permeability in a porous medium.
3. Results and Discussion
In porous media, fluid transport is dominated by the amount of pore space available for flow. Usually, fluid and electrical current flow through the effective pore space, while the stagnant pore space plays a passive role in fluid transport. Therefore, using total porosity values rather than effective porosity in the conductivity and permeability modeling will lead to erroneous results. In this work, the critical pore diameter or critical porosity—which reflects the effective pore space available for flow—is introduced into the fractal geometry to describe the percolation behaviors of the conductivity and permeability. In the following discussion, the percolation models of the conductivity and permeability are utilized to model the rock-electric and seepage characteristics at different critical porosity, study the effect of microstructure on the critical porosity, and compare with the experimental data. The analytical percolation expressions on the one hand provide insights into the significant influence of the critical porosity and microstructural parameters (e.g., pore fractal dimension, tortuosity fractal dimension) on the conductivity and permeability. On the other hand, they also reveal the correlation between the critical porosity and microstructural parameters. Besides, the percolation models could be used to fit and interpret the experimental data well.
3.1. The Rock-Electric Characteristics
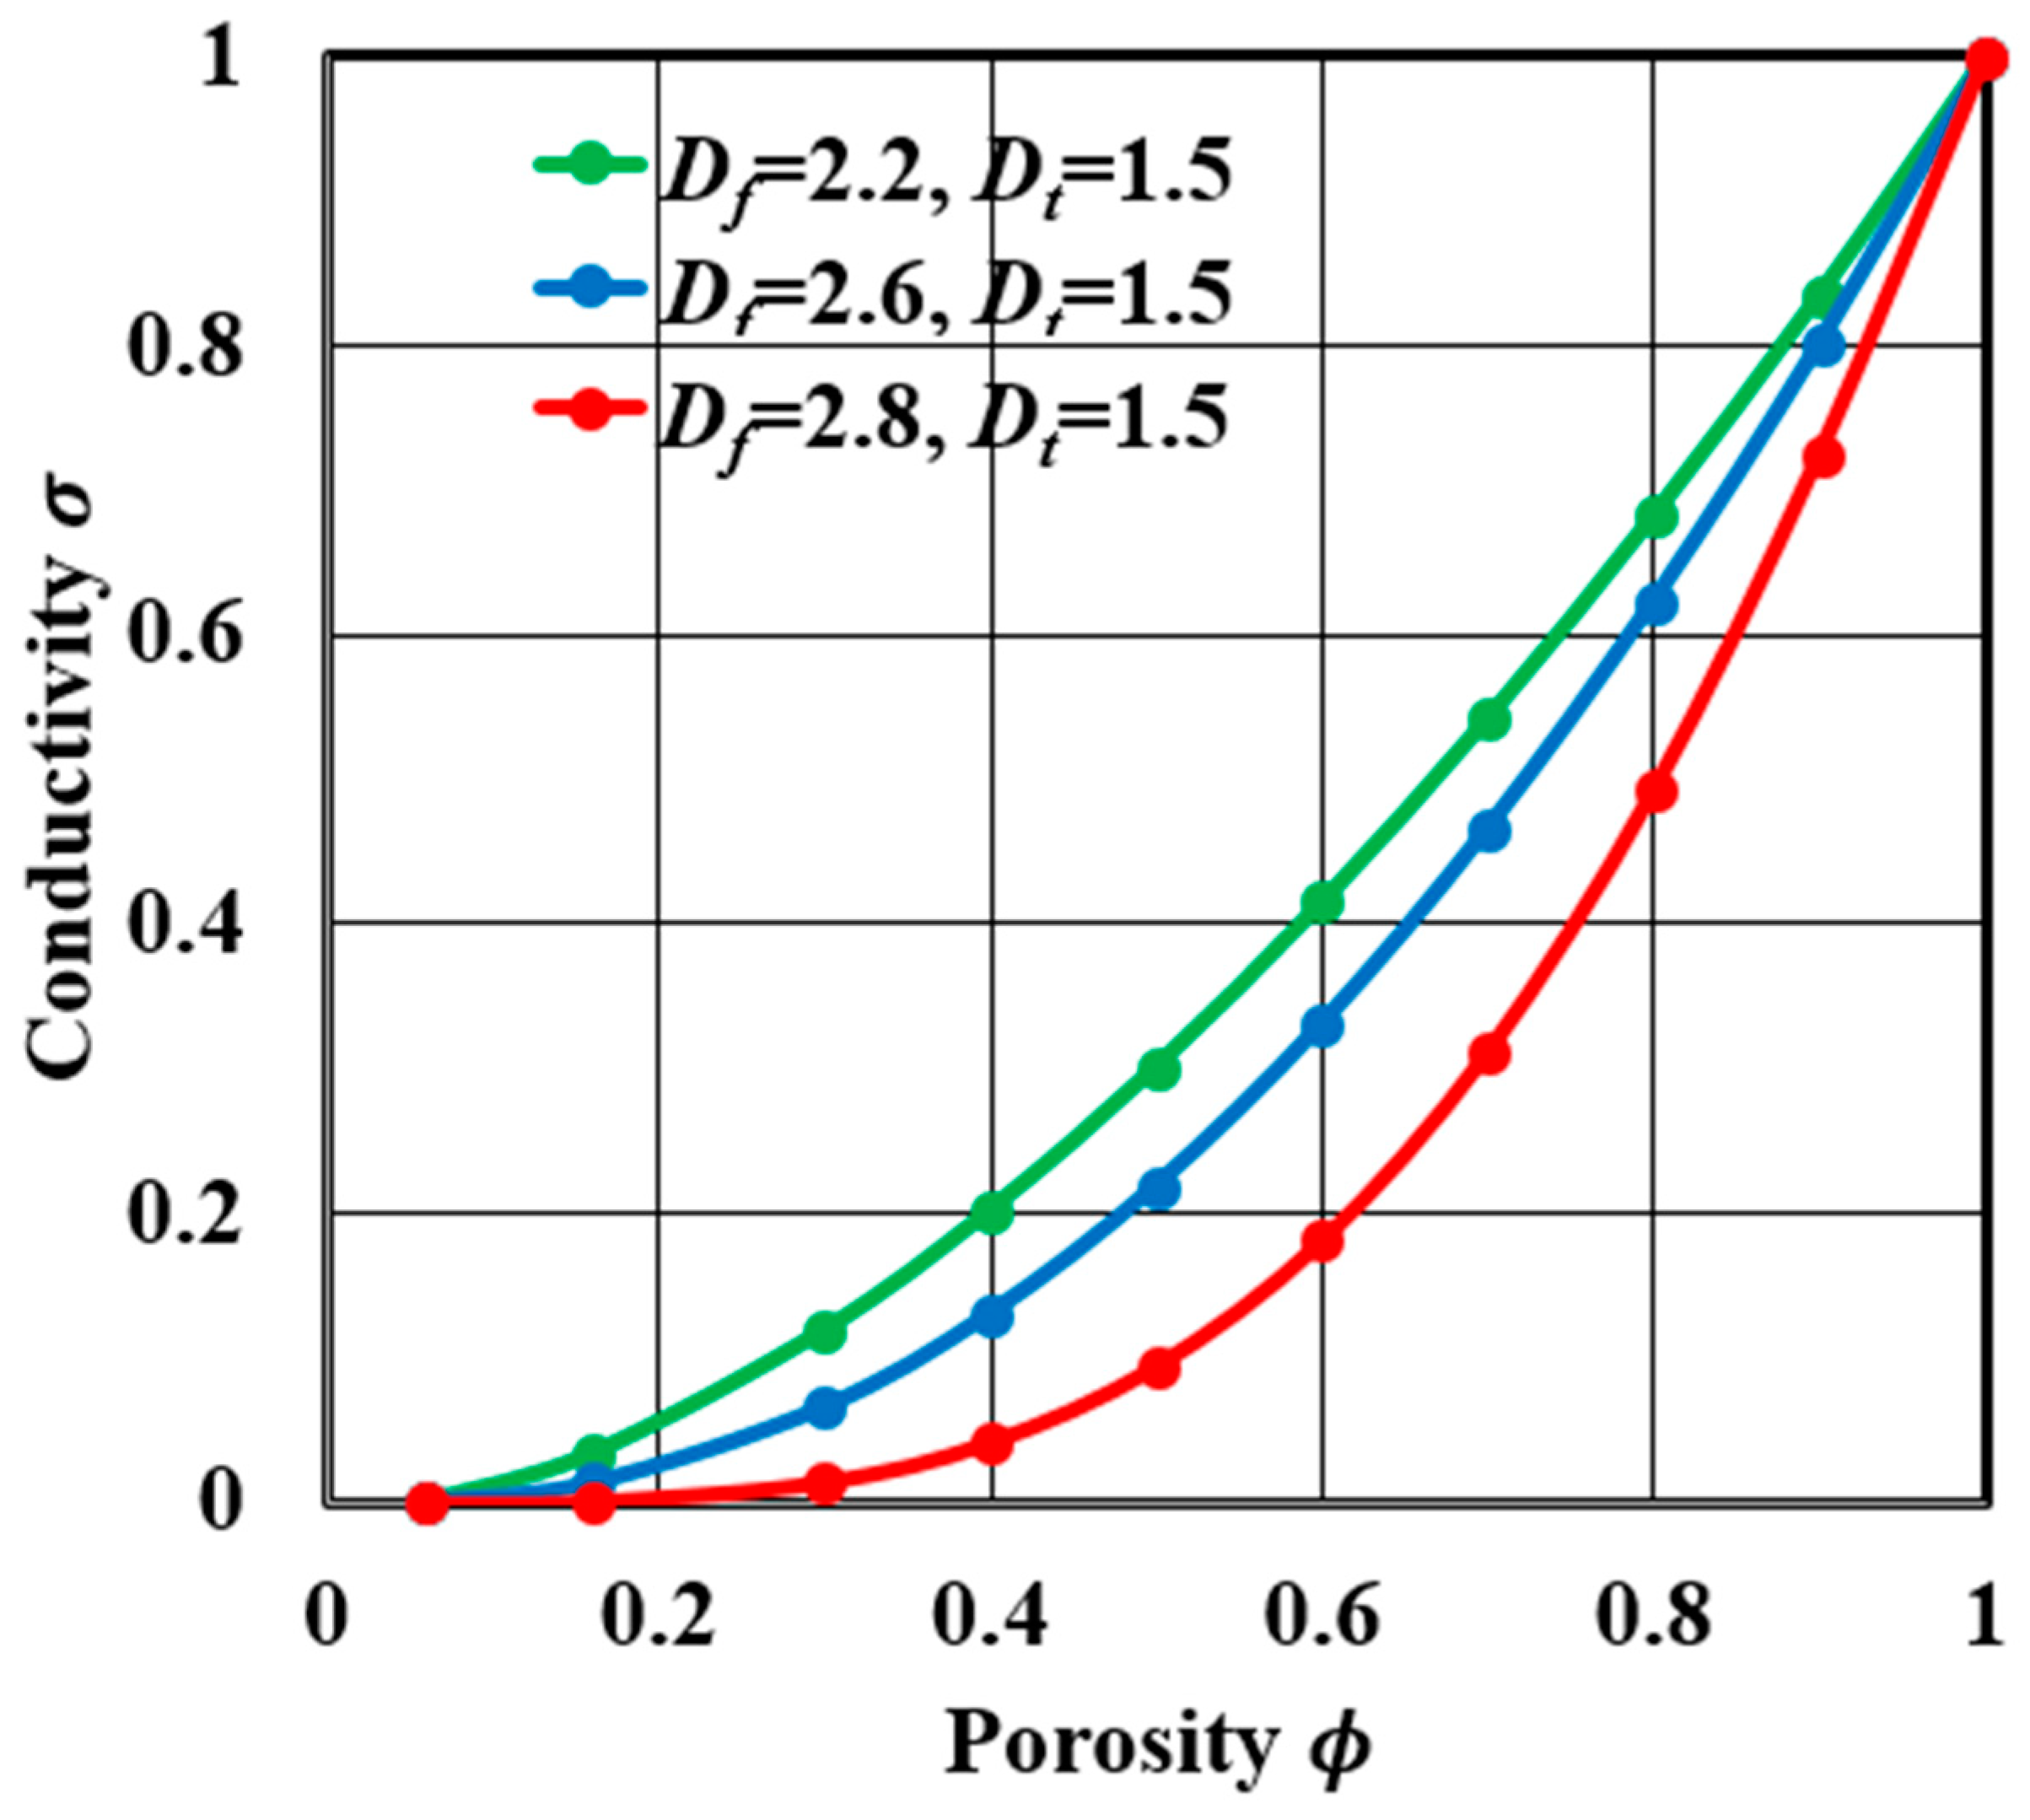
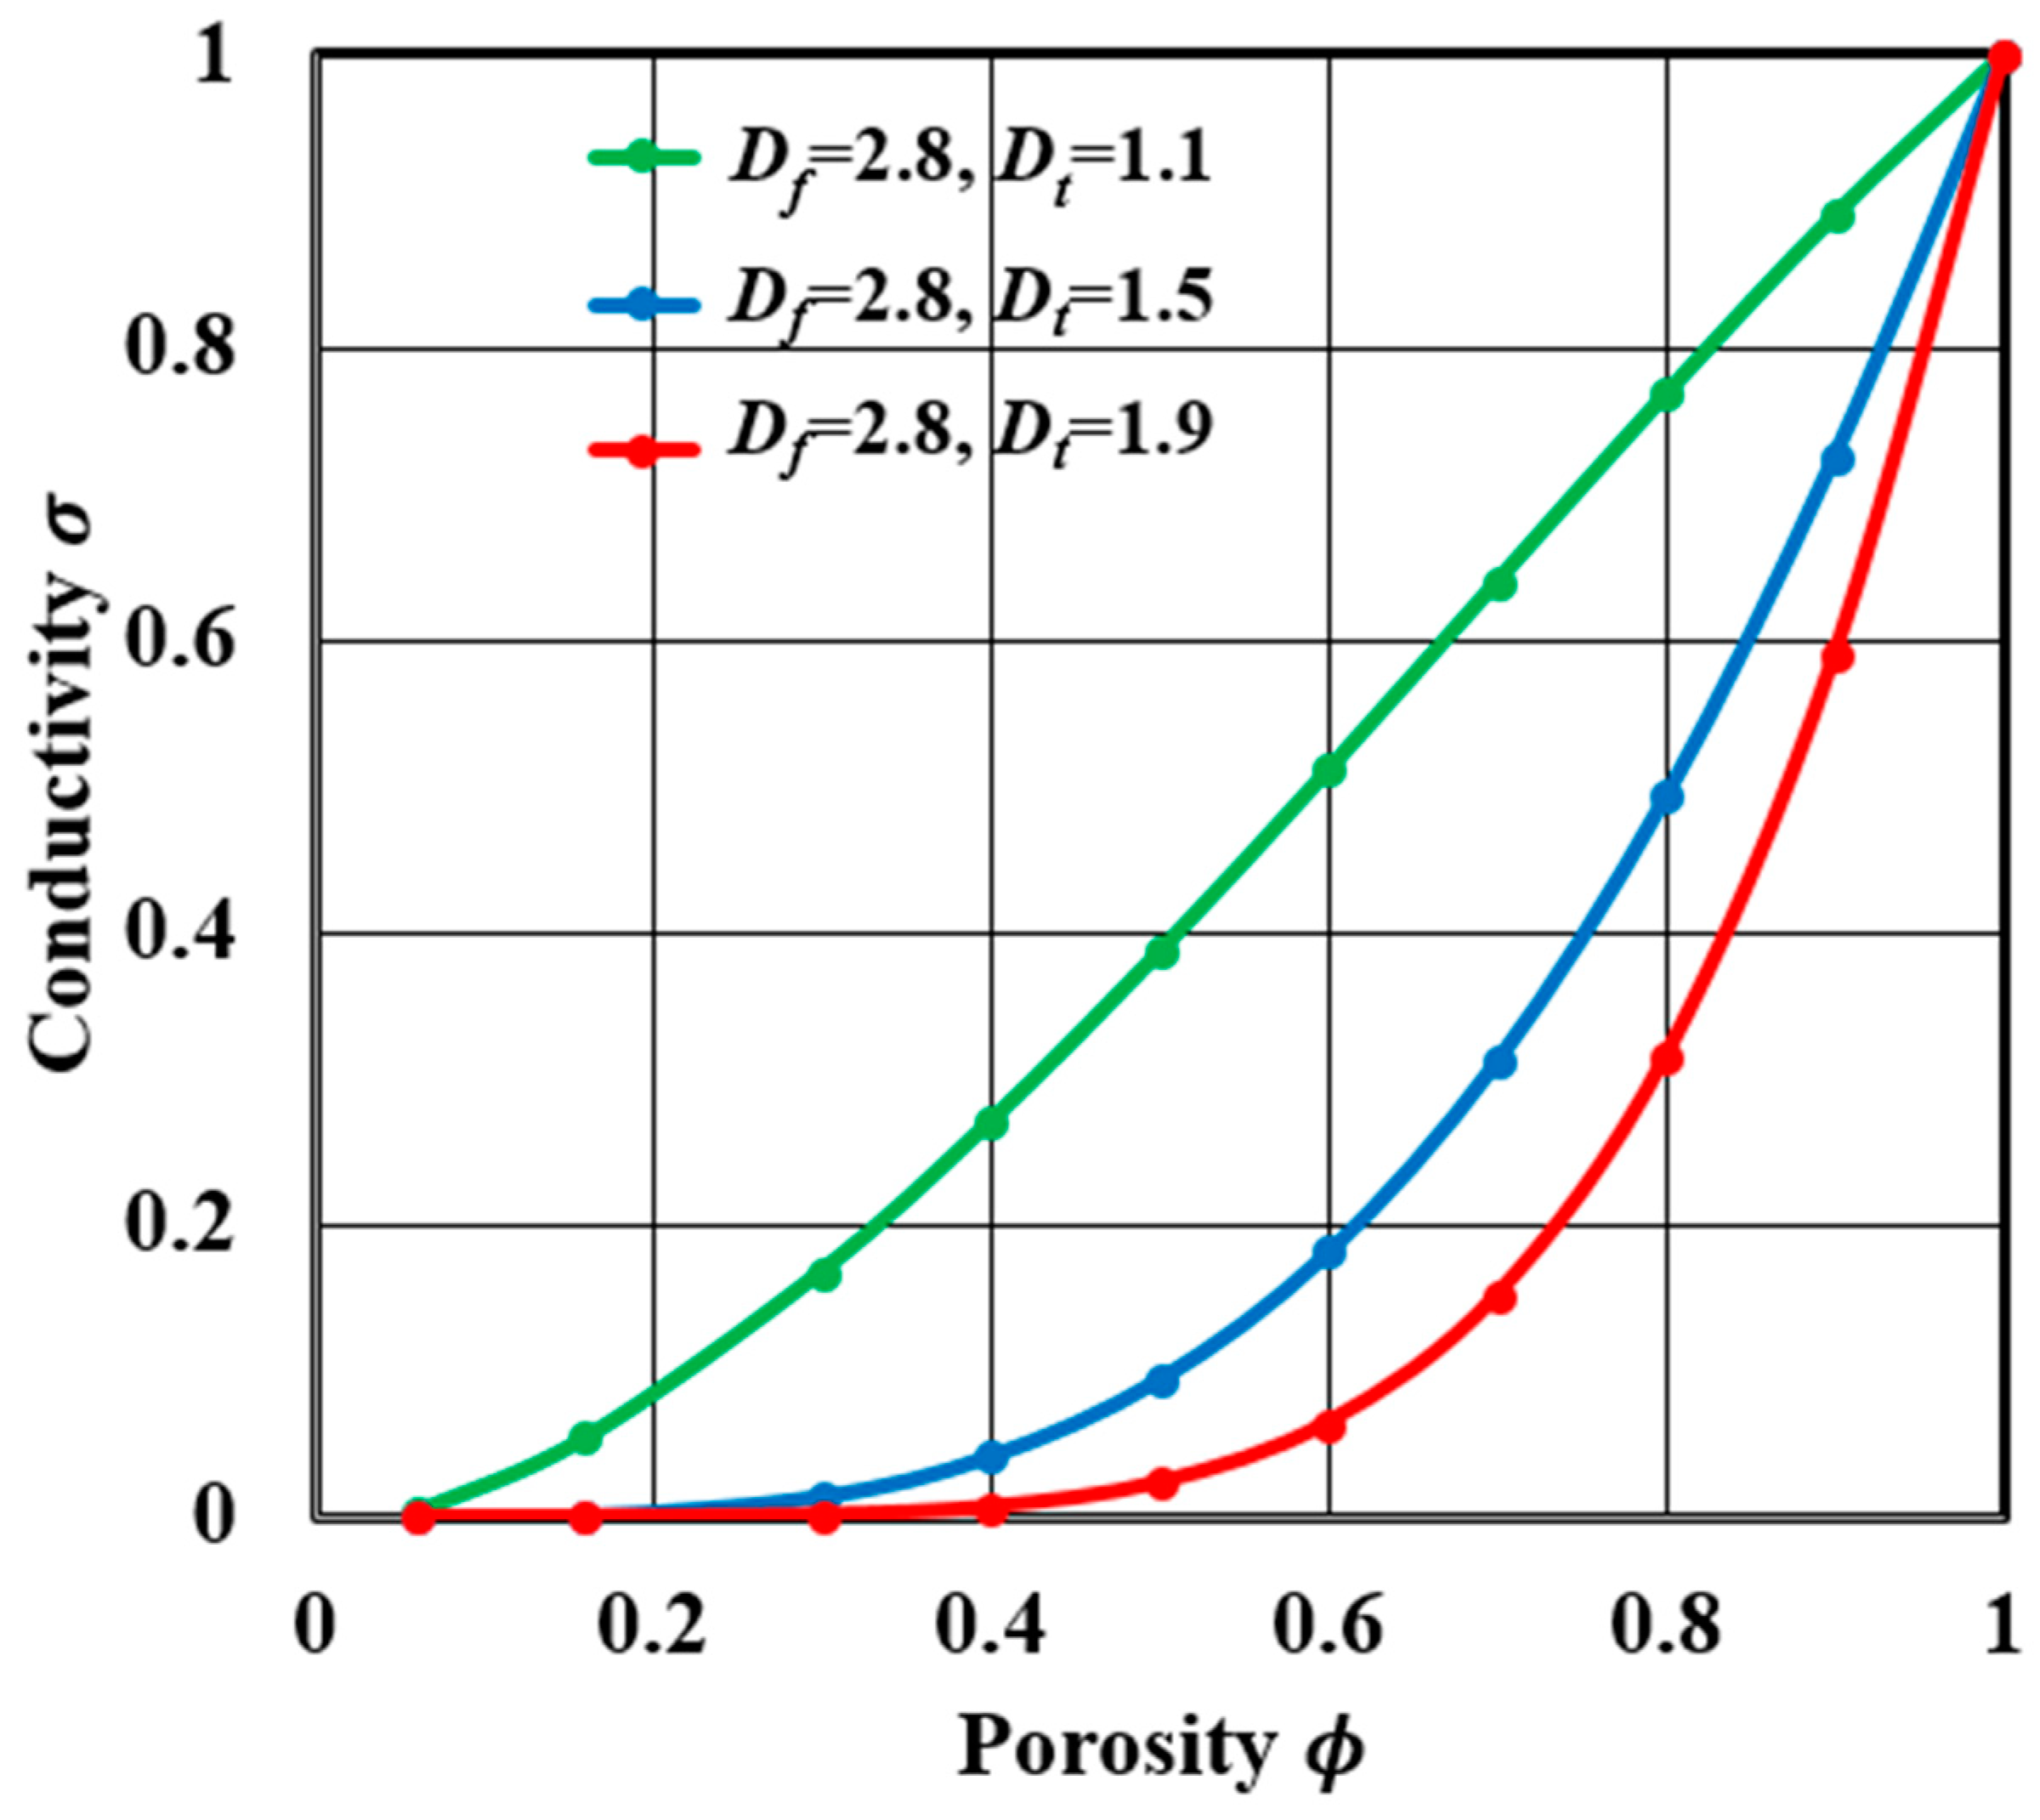
To start with, the pore microstructural parameters Df and Dt remained constant, the conductivity–porosity relationships at different critical porosity are depicted in Figure 1. It shows that the conductivities at the critical porosity decreased to zero, which proved that the electrical current could not flow through the stagnant pore space. In addition, it also demonstrates that the conductivities at high porosity were nearly the same, which means that the critical porosity had little effect on the conductive property at high porosity, while the conductivities at low porosity changed greatly. In short, the critical porosity can be an indicator of the amount of effective and stagnant pores, and as the critical porosity increased, there were more stagnant pores and fewer effective pores, which led to the decrease of the conductive ability. Therefore, ignoring the critical porosity may lead to the inaccuracy of the predicted conductivity. Furthermore, the critical porosity was set to 0.05, and the conductive properties at different microstructural parameters are plotted in Figure 2 and Figure 3. As an indicator of pore microstructure, the high values of Df and Dt represent the strong heterogeneity and complexity of the pore structure. In Figure 2 and Figure 3, as Df and Dt increased and the conductivity decreased, demonstrating that the complex pore structure is an important reason for the high resistivity of water-saturated reservoirs. On the other hand, it was found that when Df and Dt increased, the conductivity tended to zero at higher porosity, meaning that high Df and Dt can lead to increases of the critical porosity and complex structure can increase the stagnant porosity, which indicates that the critical porosity is a function of the pore geometry. In fact, the percolation behaviors have been found in some Archie’s data, and the deviation between Archie’s data and the simulation results could not be explained by the classic Archie’s law. Archie’s data [48] in Figure 4 and Figure 5 illustrate two important phenomena. One phenomenon is that the measured conductivities in Figure 4 decreased to zero at certain porosity greater than zero. Another is that Archie’s data in Figure 5 deviate from the fitting results obtained by the Archie equation and exhibits the non-Archie phenomenon on log–log scale. Apparently, the classic Archie’s law could not explain these phenomena well. By considering the critical porosity, Archie’s data in Figure 4 and Figure 5 could be fitted and explained well using Equation (22), verifying the validity of the conductivity percolation model.
3.2. The Permeability Characteristics
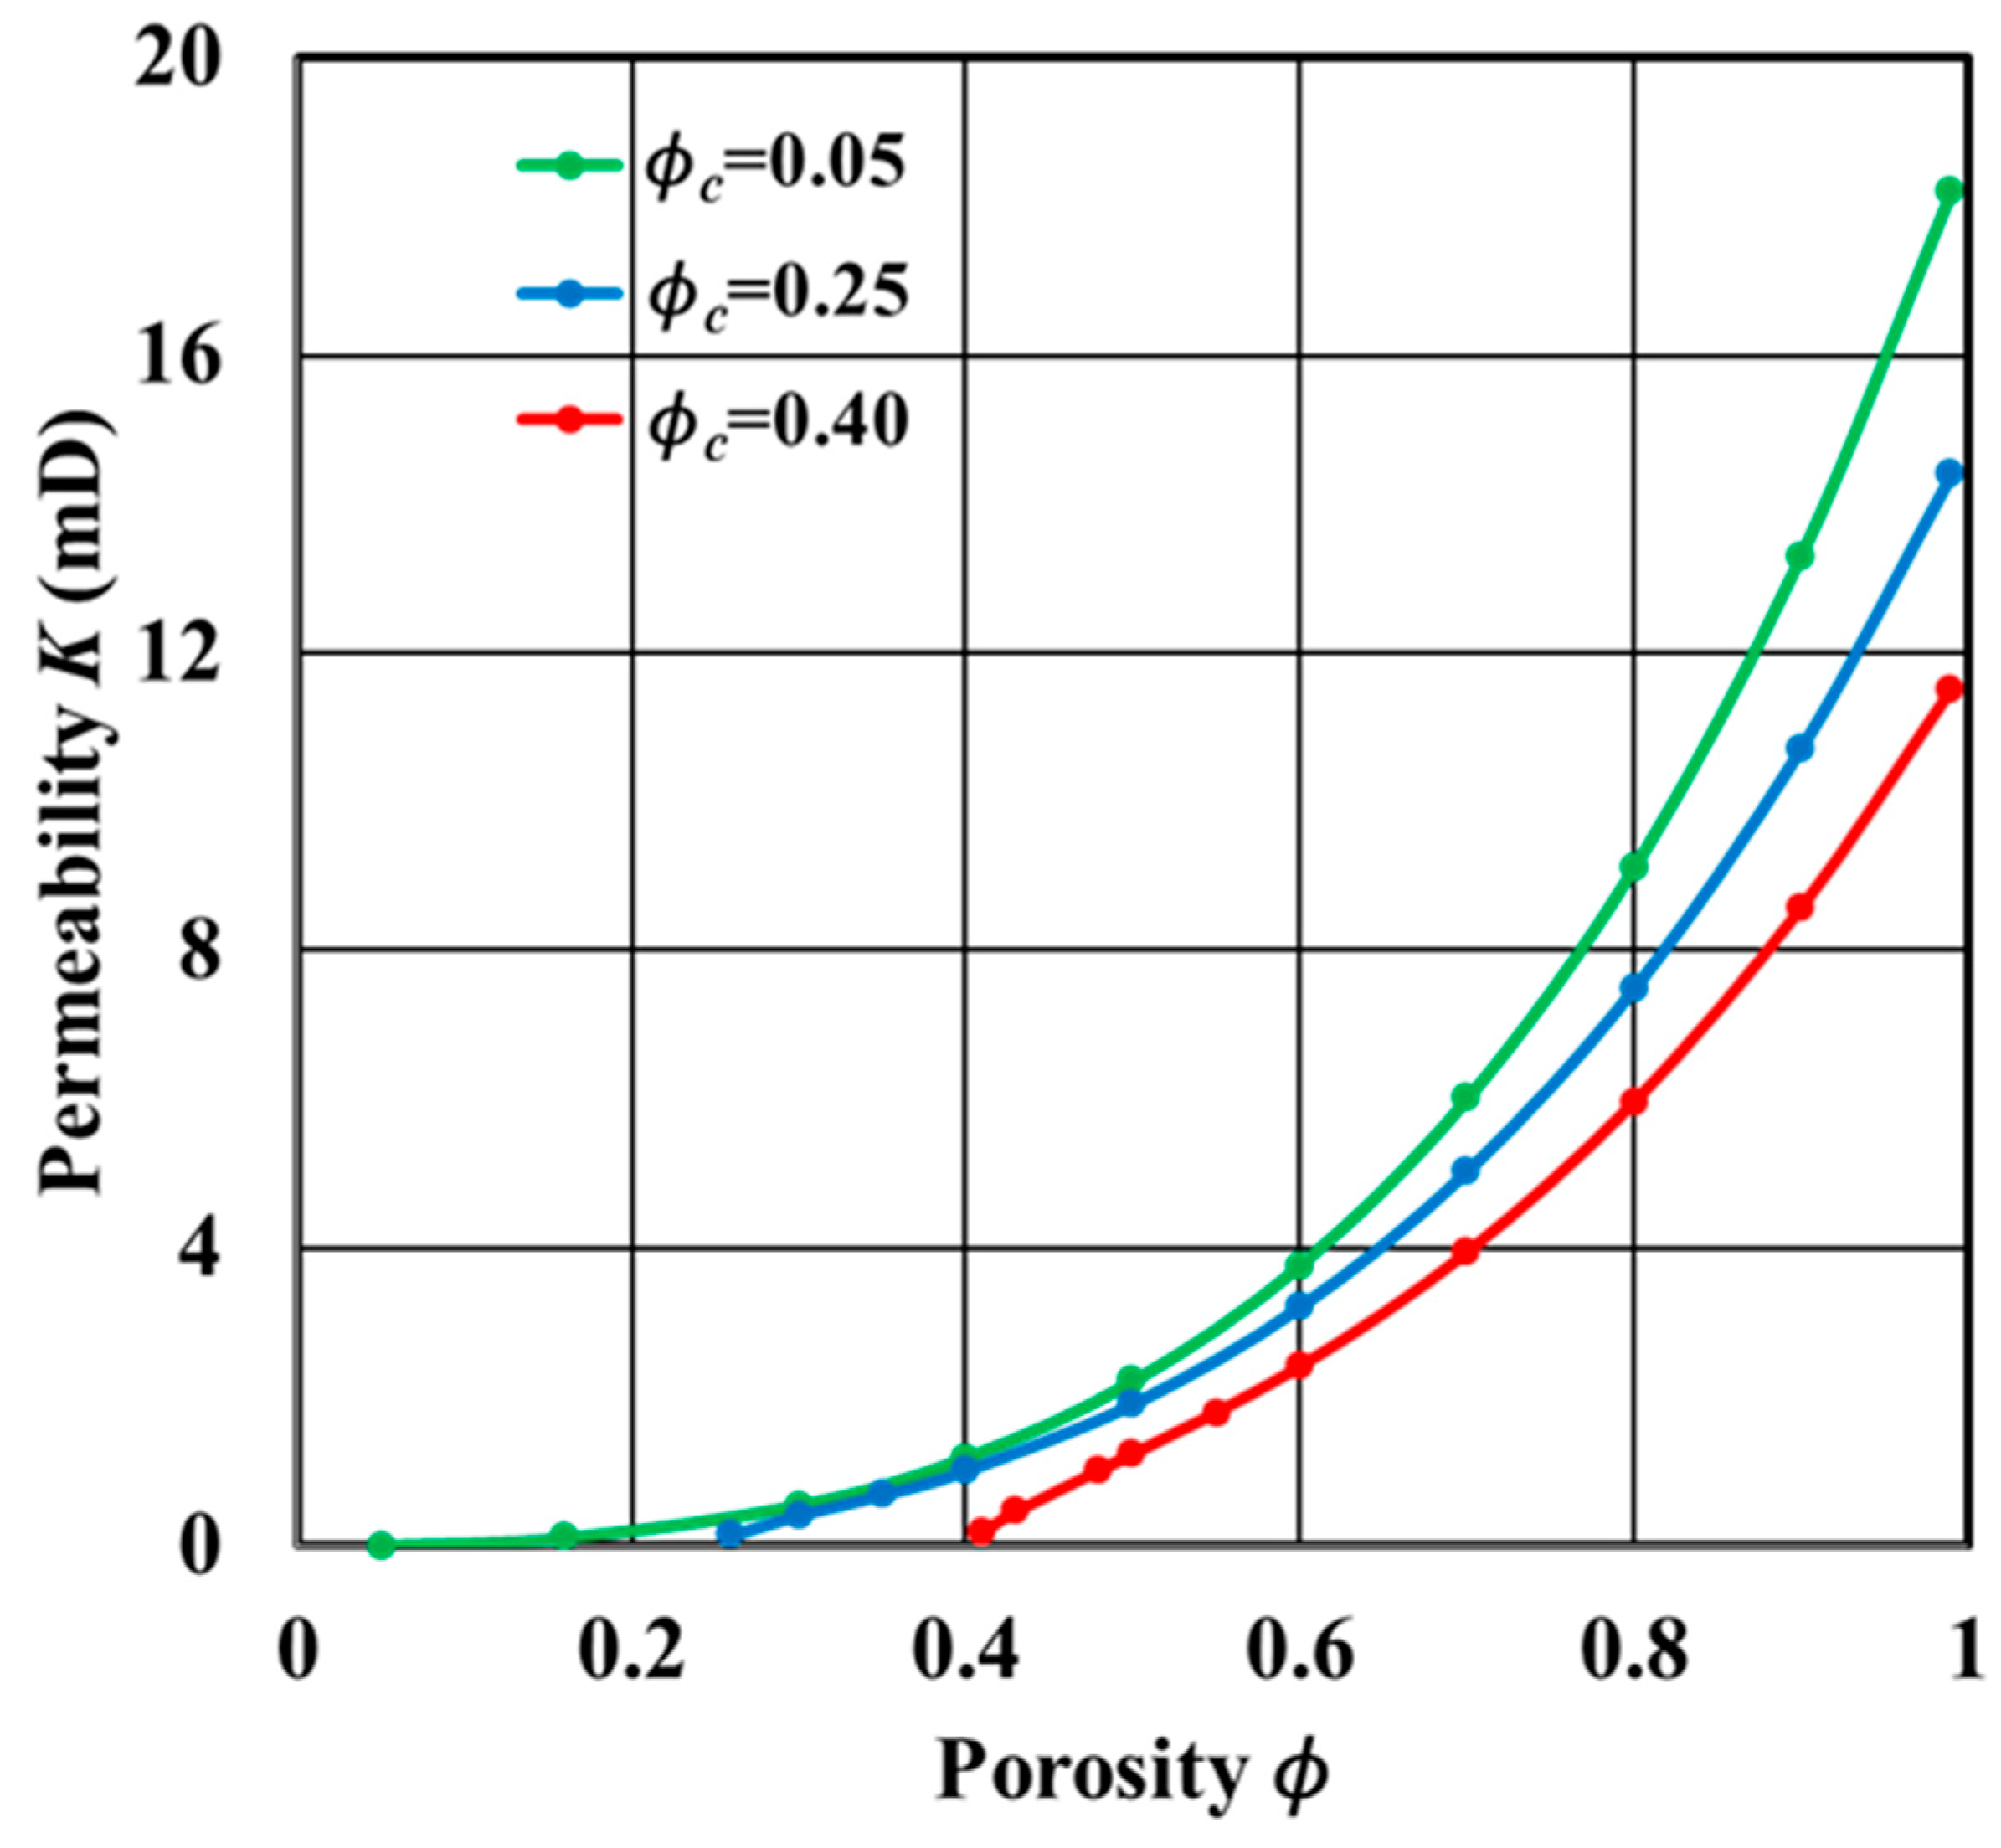
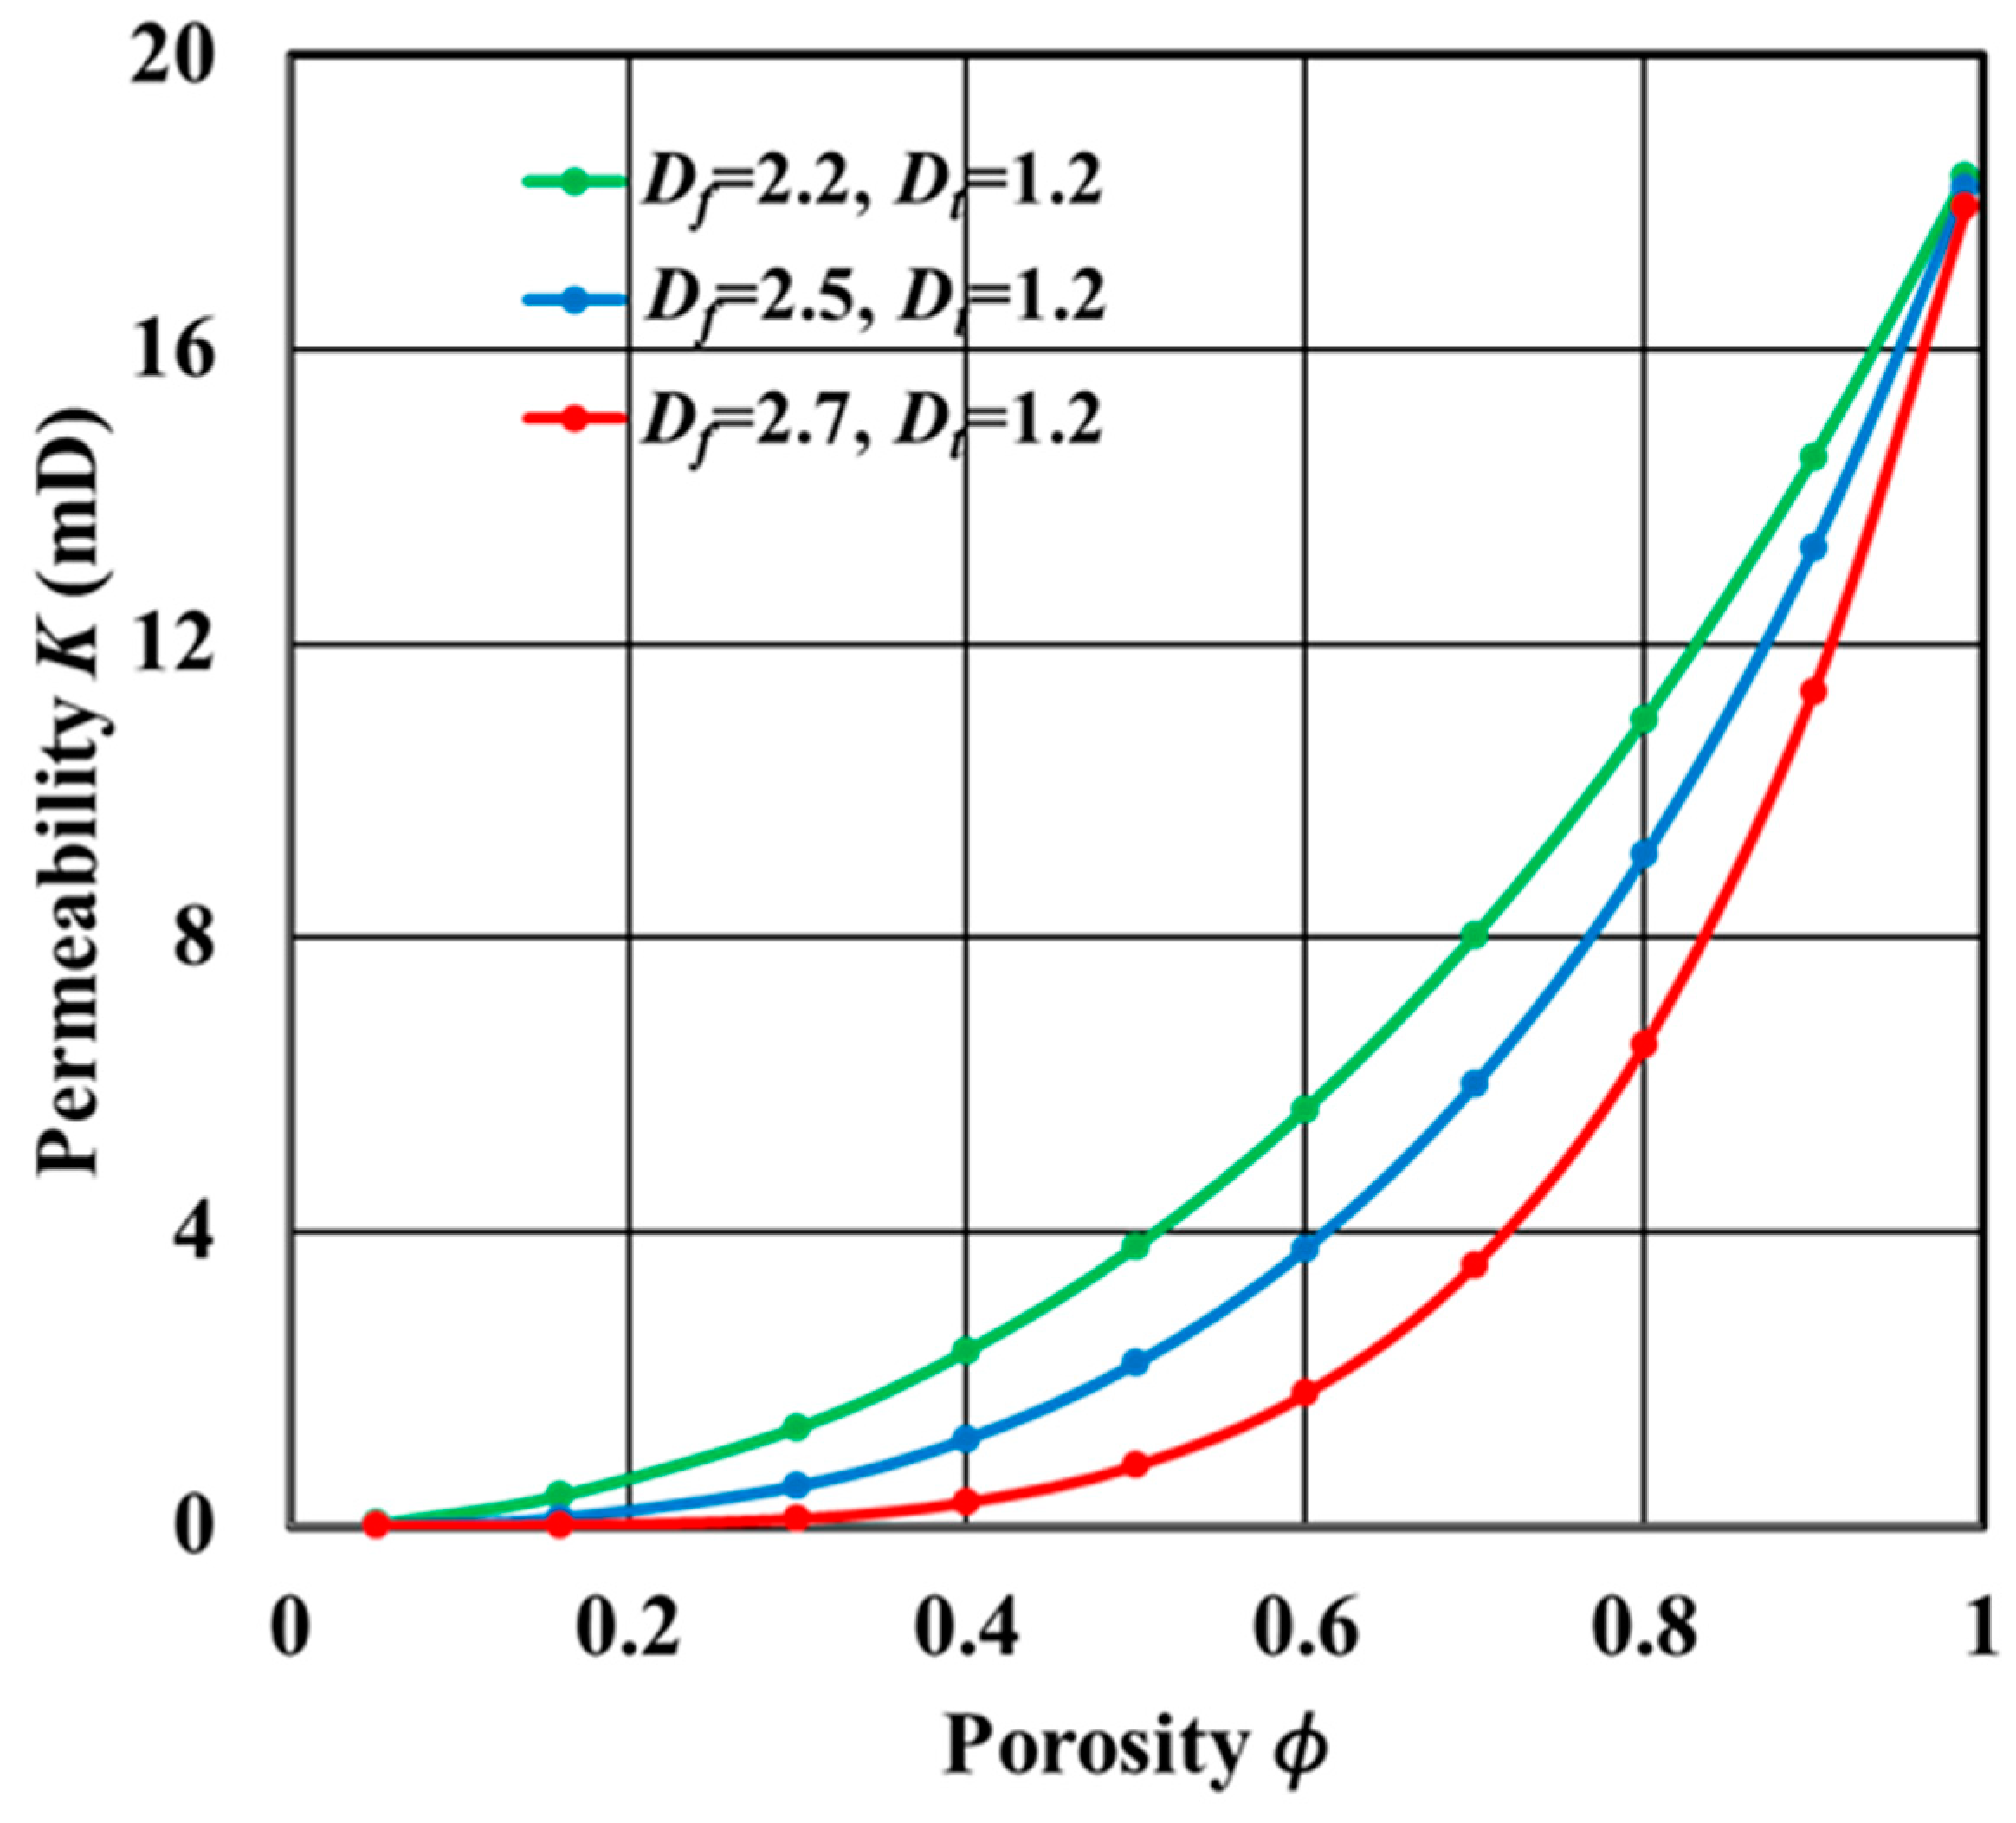
In this section, the percolation model of the permeability (Equation (29)) is applied to calculate the permeability at different critical porosity and microstructural parameters depicted in Figure 6, Figure 7 and Figure 8, and interpret the experimental data displayed in Figure 9 and Figure 10. It was assumed that the maximum capillary diameter of 2 µm and the capillary straight-line length of 200 µm in the present calculation were taken in Figure 6, Figure 7 and Figure 8. In the case of constant parameters Df and Dt, Figure 6 shows that the effective permeability was greater than zero at the porosity above the critical porosity, indicating that the fluid only flowed through the effective pore space rather than all the pore space. Moreover, it shows that the increase of the critical porosity could greatly decrease the permeability, which means that the critical porosity is a crucial factor affecting the seepage ability. Besides, with the change of Df and Dt in Figure 7 and Figure 8, it indicates that the complex pore structure (e.g., high Df or Dt) could result in the decrease of the permeability and the increase of the critical porosity. The increasing critical porosity indicates more stagnant pore space, which is considered as an important reason for the low permeability. Next, the experimental data [49,50] in Figure 9 and Figure 10 were used to test the percolation model of the permeability, rmax and L0 were taken as 190 µm and 100 mm in Figure 9, and as 1.3 mm and 100 mm in Figure 10, respectively. Before calculating the permeability, we first determined the microstructural parameters Df and Dt. Although some methods have been developed to obtain the fractal dimensions [19,51], the precision of the results is still not proven. Alternatively, here we can determine the fractal dimension Df using Equation (12), and Feng et al. [52] indicated that Df can be best fitted by rmax/rmin = 1000 for natural and artificial porous media, and the tortuosity fractal Dt can be estimated via Df using Dt = 2 × (3 − Df) + 1. Then, the permeability can be directly calculated by the analytical expressions (Equation (29)). By the comparison, the calculation results of the permeability obtained by Equation (29) were not only in good agreement with the experimental data, but were also basically identical to the fitting trendlines ( and for Figure 9 and Figure 10) of the experimental data, which verifies the effectiveness of the proposed percolation model. In addition to critical porosity and microstructure, the permeability may be affected by other factors (e.g., the irreducible water or multi-scale pores), and the fitting error can be eliminated to a greater extent by reasonably introducing multiple influencing factors into the model in future study.
In summary, the critical porosity is an important factor for the accurate interpretation of rock-electric and seepage characteristics in complex porous media, and ignoring the effect of critical porosity may cause the overestimation of the conductivity and permeability, which eventually influence the formation evaluation. Moreover, the critical porosity is also closely related to the pore microstructure. A complex pore structure can increase the critical porosity, resulting in more stagnant pores, which is the fundamental reason for the decrease of the conductive and seepage abilities in complex reservoirs.
4. Conclusions
In this study, the analytical expressions to connect the critical porosity with the conductivity and permeability were derived without involving any empirical constants using the fractal geometry theory, which provides the theoretical basis of the percolation mechanisms of the conductivity and permeability. The critical porosity and microstructural parameters (e.g., pore fractal dimension and tortuosity fractal dimension) were considered as major determining factors in the proposed percolation models, which contributes to predicting the conductivity and permeability in complex reservoirs more accurately. The simulation results revealed that increasing the critical porosity could reduce the conductive and the seepage abilities of porous media, and the critical porosity is a crucial factor resulting in non-Archie phenomenon. The results also demonstrated that the complex pore structure could decrease the effective porosity and increase the critical porosity, which is an important reason for low conductivity and permeability in complex media. Due to the incorporation of the critical porosity, the percolation models could be used to better interpret the high-resistivity water layer in complex reservoirs. The validity of the percolation models was confirmed after its application to the available data.
Given that porous media consist of various types of pores, each type of pore should have independent critical porosity and fractal parameters, and multi-fractal analysis may better characterize the complex pore structure and petrophysical properties. Therefore, future research will extend the present work to the multi-fractal case.
Author Contributions
Conceptualization, T.L.; Methodology, T.L. and H.M.; Validation, H.M. and Q.S.; Formal Analysis, H.M.; Investigation, Q.S., F.X.L., and P.C.; Data Curation, Q.S., F.X.L., and P.C.; Writing—Original Draft Preparation, H.M.; Writing—Review & Editing, T.L.; Supervision, T.L.; Funding Acquisition, T.L.
Funding
This research was funded by National 863 Program of China (No. 2006AA06Z214), National Natural Science Foundation of China (No. 41476027) and National Key Technology Program (No. 2017ZX05035003-002).
Conflicts of Interest
The authors declare no conflict of interest.
Nomenclature
| pore diameter | |
| maximum pore diameter | |
| minimum pore diameter | |
| critical pore diameter | |
| number of capillaries whose diameters are greater than or equal to | |
| total number of capillaries | |
| pore fractal dimension | |
| tortuosity fractal dimension | |
| Euclidean dimension | |
| porosity | |
| critical porosity | |
| straight-line length of a capillary | |
| tortuous length of a capillary | |
| fractal tortuosity | |
| effective tortuosity of the electrical connected pores | |
| total cumulative volume of pores | |
| pore volume with pore diameter less than | |
| electrical conductivity of water-saturated media | |
| electrical conductivity of water | |
| formation factor | |
| flow rate of single capillary | |
| fluid viscosity | |
| pressure gradient | |
| cross section of rock | |
| total flow rate of porous media | |
| permeability of porous media |
References
- Tahmasebi, P. Nanoscale and multiresolution models for shale samples. Fuel 2018, 217, 218–225. [Google Scholar] [CrossRef]
- Liu, T.Y.; Tang, T.Z.; Du, H.H.; Zhang, H.N.; Wang, H.T. Study of rock conductive mechanism based on pore structure. Chin. J. Geophys. 2013, 56, 674–684. [Google Scholar]
- Meng, H. Study on the rock-electric and the relative permeability characteristics in porous rocks based on the curved cylinder-sphere model. J. Pet. Sci. Eng. 2018, 166, 891–899. [Google Scholar] [CrossRef]
- Mandelbrot, B.B. The Fractal Geometry of Nature; W.H. Freeman: New York, NY, USA, 1983. [Google Scholar]
- Thompson, A.H. Fractals in rock physics. Annu. Rev. Earth Planet. Sci. 1991, 19, 237–262. [Google Scholar] [CrossRef]
- Sahimi, M. Flow phenomena in rocks: From continuum models to fractals, percolation, cellular automata, and simulated annealing. Rev. Mod. Phys. 1993, 65, 1393–1534. [Google Scholar] [CrossRef]
- Perfect, E.; Kay, B.D. Applications of fractals in soil and tillage research: A review. Soil Till. Res. 1995, 36, 1–20. [Google Scholar] [CrossRef]
- Perrier, E.; Bird, N.; Rieu, M. Generalizing the fractal model of soil structure: The pore-solid fractal approach. Dev. Soil Sci. 2000, 27, 47–74. [Google Scholar]
- Yu, B.; Liu, W. Fractal analysis of permeabilities for porous media. AIChE J. 2004, 50, 46–57. [Google Scholar] [CrossRef] [Green Version]
- Perfect, E.; Pachepsky, Y.; Martin, M.A. Fractal and Multifractal Models Applied to Porous Media. Vadose Zone J. 2011, 10, 110–124. [Google Scholar] [CrossRef]
- Coleman, S.W.; Vassilicos, J.C. Transport Properties of Saturated and Unsaturated Porous Fractal Materials. Phys. Rev. Lett. 2008, 100, 035504. [Google Scholar] [CrossRef]
- Coleman, S.W.; Vassilicos, J.C. Tortuosity of unsaturated porous fractal materials. Phys. Rev. E 2008, 78, 016308. [Google Scholar] [CrossRef] [PubMed]
- Ghanbarian, B.; Daigle, H. Fractal dimension of soil fragment mass-size distribution: A critical analysis. Geoderma 2015, 245–246, 98–103. [Google Scholar] [CrossRef]
- Wu, Y.Q.; Tahmasebi, P.; Lin, C.Y.; Zahid, M.A.; Dong, C.M.; Golab, A.N.; Ren, L.H. A comprehensive study on geometric, topological and fractal characterizations of pore systems in low-permeability reservoirs based on SEM, MICP, NMR, and X-ray CT experiments. Mar. Pet. Geol. 2019, 103, 12–28. [Google Scholar] [CrossRef]
- Dimri, V.P. Fractal Dimensional analysis of soil for flow studies. In Application of Fractals in Earth Sciences; Oxford and IBH publishing Co. Pvt. LTD: New Delhi, India, 2000; pp. 189–193. [Google Scholar]
- Dimri, V.P. Application of Fractals in Earth Sciences; Oxford and IBH publishing Co. Pvt. LTD: New Delhi, India, 2000. [Google Scholar]
- Feranie, S.; Latief, F.D.E. Tortuosity-porosity relationship in two-dimensional fractal model of porous media. Fractals 2013, 21, 1350013. [Google Scholar] [CrossRef]
- Katz, A.J.; Thompson, A.H. Fractal sandstone pores: Implications for conductivity and pore formation. Phys. Rev. Lett. 1985, 54, 1325–1328. [Google Scholar] [CrossRef]
- Krohn, C.E.; Thompson, A.H. Fractal sandstone pores: Automated measurements using scanning-electron-microscope images. Phys. Rev. 1986, 33, 6366–6374. [Google Scholar] [CrossRef]
- Young, I.M.; Crawford, J.W. The fractal structure of soil aggregations: Its measurement and interpretation. J. Soil Sci. 1991, 42, 187–192. [Google Scholar] [CrossRef]
- Yu, B.M.; Li, J. Some fractal characters of porous media. Fractals 2001, 9, 365–372. [Google Scholar] [CrossRef]
- Roy, S.; Tarafdar, S. Archie’s law from a fractal model for porous rocks. Phys. Rev. 1997, 55, 8038–8041. [Google Scholar] [CrossRef]
- Nigmatullin, R.R.; Dissado, L.A.; Soutougin, N.N. A fractal pore model for Archie’s law in sedimentary rocks. J. Phys. 1992, 25, 32. [Google Scholar] [CrossRef]
- Wei, W.; Cai, J.; Hu, X.; Han, Q. An electrical conductivity model for fractal porous media. Geophys. Res. Lett. 2015, 42, 4833–4840. [Google Scholar] [CrossRef] [Green Version]
- Pitchumani, R.; Ramakrishnan, B. A fractal geometry model for evaluating permeabilities of porous preforms used in liquid composite molding. Int. J. Heat Mass Tran. 1999, 42, 2219–2232. [Google Scholar] [CrossRef]
- Xu, P.; Yu, B.M. Developing a new form of permeability and Kozeny-Carman constant for homogeneous porous media by means of fractal geometry. Adv. Water Resour. 2008, 31, 74–81. [Google Scholar] [CrossRef]
- Mavko, G.; Nur, A. Effect of a percolation threshold in the Kozeny–Carman relation. Geophysics 1997, 62, 1480–1482. [Google Scholar] [CrossRef]
- Bentz, D.P. Modelling cement microstructure: Pixels, particles, and property prediction. Mater. Struct. 1999, 32, 187–195. [Google Scholar] [CrossRef]
- Mavko, G.; Mukerji, T.; Dvorkin, J. The Rock Physics Handbook, 2nd ed.; Cambridge University Press: Cambridge, UK, 2009. [Google Scholar]
- Kirkpatrick, S. Percolation and Conduction. Rev. Mod. Phys. 1973, 45, 574–588. [Google Scholar] [CrossRef]
- Wong, P.Z.; Koplik, J.; Tomanic, J.P. Conductivity and permeability of rocks. Phys. Rev. 1984, 30, 6606–6614. [Google Scholar] [CrossRef]
- Thompson, A.H.; Katz, A.J.; Krohn, C.E. The microgeometry and transport properties of sedimentary rock. Adv. Phys. 1987, 36, 625–694. [Google Scholar] [CrossRef]
- Sahimi, M. Applications of Percolation Theory; Taylor and Francis: Abingdon, UK, 1994. [Google Scholar]
- Sahimi, M. Flow and Transport in Porous Media and Fractured Rock: From Classical Methods to Modern Approaches; Wiley-VCH: Weinheim, Germany, 2011. [Google Scholar]
- Stauffer, D.; Aharony, A. Introduction to Percolation Theory, 2nd ed.; Taylor and Francis: Abingdon, UK, 1994. [Google Scholar]
- Hunt, A.G. Percolative transport and fractal porous media. Chaos Solitons Fractals 2004, 19, 309–325. [Google Scholar] [CrossRef]
- Hunt, A.G.; Ewing, R.P.; Ghanbarian, B. Percolation Theory for Flow in Porous Media; Lecture Notes Phys.; Springer: Berlin, Germany, 2014. [Google Scholar]
- Ghanbarian, B.; Hunt, A.G.; Ewing, R.P.; Skinner, T.E. Universal scaling of the formation factor in porous media derived by combining percolation and effective medium theories. Geophys. Res. Lett. 2014, 41, 3884–3890. [Google Scholar] [CrossRef] [Green Version]
- Wang, F.Y.; Lian, P.Q.; Jiao, L.; Liu, Z.C.; Zhao, J.Y.; Gao, J. Fractal analysis of microscale and nanoscale pore structures in carbonates using high-pressure mercury intrusion. Geofluids 2018, 2, 1–15. [Google Scholar] [CrossRef]
- Perfect, E.; Kay, B.D.; Rasiah, V. Multifractal model for soil aggregate fragmentation. Soil Sci. Soc. Am. J. 1993, 57, 896–900. [Google Scholar] [CrossRef]
- Smidt, J.M.; Monro, D.M. Fractal modeling applied to reservoir characterization and flow simulation. Fractals 1998, 6, 401–408. [Google Scholar] [CrossRef]
- Yu, B.; Lee, L.J.; Cao, H. Fractal characters of pore microstructures of textile fabrics. Fractals 2001, 9, 155–163. [Google Scholar] [CrossRef]
- Ojha, S.P.; Misra, S.; Sinha, A.; Dang, S.; Tinni, A.; Sondergeld, C.; Rai, C.A. Relative permeability estimates for Wolfcamp and Eagle Ford shale samples from oil, gas and condensate windows using adsorption-desorption measurements. Fuel 2017, 208, 52–64. [Google Scholar] [CrossRef]
- Yun, M.; Yu, B.; Cai, J. Analysis of seepage characters in fractal porous media. Int. J. Heat Mass Tran. 2009, 52, 3272–3278. [Google Scholar] [CrossRef]
- Wheatcraft, S.W.; Tyler, S.W. An explanation to scale dependent dispersivity in heterogeneous aquifers using concepts of fractal geometry. Water Res. Res. 1988, 24, 566–578. [Google Scholar] [CrossRef]
- Ghanbarian, B.; Hunt, A.G.; Ewing, R.P. Tortuosity in Porous Media: A Critical Review. Soil Sci. Soc. Am. J. 2013, 77, 1461–1477. [Google Scholar] [CrossRef]
- Wyllie, M.R.J.; Rose, W.D. Some theoretical considerations related to the quantitative evaluation of the physical characteristics of reservoir rock from electrical log data. J. Petrol. Technol. 1950, 2, 105–118. [Google Scholar] [CrossRef]
- Archie, G.E. The electrical resistivity log as an aid in determining some reservoir characteristics. Petrol. Trans. AIME 1942, 146, 54–62. [Google Scholar] [CrossRef]
- Bernabe, Y.; Brace, W.F.; Evans, B. Permeability, porosity, and pore geometry of hot-pressed calcite. Mech. Mater. 1982, 1, 173–183. [Google Scholar] [CrossRef]
- Emelyanov, N.N. Analysis of the accuracy in the determination of collector properties of the ninth stratum at Ozek-Suat. In Estimate of the Accuracy of Determining the Parameters of Oil and Gas Deposits; Nedra: Moscow, Russia, 1965; pp. 135–152. [Google Scholar]
- Daigle, H.; Johnson, A.; Thomas, B. Determining fractal dimension from nuclear magnetic resonance data in rocks with internal magnetic field gradients. Geophysics 2014, 79, D425–D431. [Google Scholar] [CrossRef]
- Feng, Y.J.; Yu, B.M.; Zou, M.Q.; Zhang, D.M. A generalized model for the effective thermal conductivity of porous media based on self-similarity. J. Phys. 2004, 37, 3030–3040. [Google Scholar] [CrossRef] [Green Version]
Figure 1.
The conductivity versus porosity at = 1.0, Df = 2.5, Dt = 1.5, and the critical porosity of 0.05, 0.25, and 0.40, respectively.
Figure 1.
The conductivity versus porosity at = 1.0, Df = 2.5, Dt = 1.5, and the critical porosity of 0.05, 0.25, and 0.40, respectively.

Figure 2.
The conductivity versus porosity at different Df at = 1.0, = 0.05.

Figure 3.
The conductivity versus porosity at different Dt at = 1.0, = 0.05.

Figure 4.
The comparison of Archie’s data [48] and the conductivity factor 1/F calculated by Equation (22) at = 0.05. Reproduced from [48], Society of Petroleum Engineers: 1942.

Figure 5.
The comparison of Archie’s data [48] and the formation factor F calculated by Archie’s law and Equation (22) at = 0.05. Reproduced from [48], Society of Petroleum Engineers: 1942.

Figure 6.
The permeability K versus the porosity at Df = 2.5, Dt = 1.2, and the critical porosity of 0.05, 0.25, and 0.40, respectively.
Figure 6.
The permeability K versus the porosity at Df = 2.5, Dt = 1.2, and the critical porosity of 0.05, 0.25, and 0.40, respectively.

Figure 7.
The permeability K versus the porosity at different Df at = 0.05.

Figure 8.
The permeability K versus the porosity at different Dt at = 0.05.

Figure 9.
The comparison of permeability data [49] and the permeability K calculated by Equation (29) at = 0.045. Df and Dt were estimated by Equation (12) and Dt = 2 × (3 − Df) + 1. Reproduced from [49], North-Holland Publishing Company: 1982.


© 2019 by the authors. Licensee MDPI, Basel, Switzerland. This article is an open access article distributed under the terms and conditions of the Creative Commons Attribution (CC BY) license (http://creativecommons.org/licenses/by/4.0/).
Share and Cite
MDPI and ACS Style
Meng, H.; Shi, Q.; Liu, T.; Liu, F.; Chen, P. The Percolation Properties of Electrical Conductivity and Permeability for Fractal Porous Media. Energies 2019, 12, 1085. https://doi.org/10.3390/en12061085
AMA Style
Meng H, Shi Q, Liu T, Liu F, Chen P. The Percolation Properties of Electrical Conductivity and Permeability for Fractal Porous Media. Energies. 2019; 12(6):1085. https://doi.org/10.3390/en12061085
Chicago/Turabian StyleMeng, He, Qiang Shi, Tangyan Liu, FengXin Liu, and Peng Chen. 2019. "The Percolation Properties of Electrical Conductivity and Permeability for Fractal Porous Media" Energies 12, no. 6: 1085. https://doi.org/10.3390/en12061085
Note that from the first issue of 2016, this journal uses article numbers instead of page numbers. See further details here.