Risk Assessment for the Power Grid Dispatching Process Considering the Impact of Cyber Systems


1
Guangxi Key Laboratory of Power System Optimization and Energy Technology, Guangxi University, Nanning 530004, China
2
Department of Electrical and Computer Engineering Computer Science, University of New Haven, West Haven, CT 06516, USA
*
Authors to whom correspondence should be addressed.
Energies 2019, 12(6), 1084; https://doi.org/10.3390/en12061084
Submission received: 2 February 2019
/
Revised: 8 March 2019
/
Accepted: 19 March 2019
/
Published: 21 March 2019
(This article belongs to the Section F: Electrical Engineering)
Abstract
:Power grid dispatching is a high-risk process, and its execution depends on an available cyber system. However, the effects of cyber systems have not caught enough attention in current research on risk assessments in dispatching processes, which may cause optimistic risk results. In order to solve this problem, this paper proposes a risk assessment model that considers the impact of a cyber system on power grid dispatching processes. Firstly, a cyber-physical switchgear state model that integrates the reliability states of both cyber system functions and switchgears is proposed, based on the transition of switchgear states in the dispatching process. Then, the potential effects of each operating step on power grid states are analyzed considering the failure model of cyber-physical system (CPS) components. The risk probabilities and consequences of the power grid states are calculated to quantify the risk index. Finally, the workings and effectiveness of this model are illustrated using the IEEE Reliability Test System-1979.
1. Introduction
With the application of advanced communication, sensing, and control technologies in the smart grid [1,2], the conventional power grid has developed into a complex cyber-physical system (CPS) [3,4] and a low-carbon emissions system [5]. The openness and compatibility of cyber systems introduces inevitable risk factors to the operation of power systems. In recent years, large-scale blackouts took place in succession in many big cities at home and abroad. Several well-known, large-scale blackouts in recent years, such as the Brazil blackout in 2011 and the Ukrainian blackouts in 2015 and 2016, have indicated that the failure of, or attack on, cyber systems was closely related to the power system’s vulnerability [6,7,8,9], which is identified as one of the contributing factors and has attracted worldwide attention.
Although optimization methods and control theories are applied in power systems to improve safety and stability [10,11], risks are still inevitable in the operation of the power grids. A generalized concept of risk is the product of the probability and consequences of the contingency. Commonly, research on risk assessment of power systems expressed much concern about the disturbances that could potentially appear in normal operation processes, and mainly included aspects of the power grid’s operational risks [12,13,14,15,16,17] and substation risks [18,19,20]. The power grid operational risk assessment, which gets more attention from scholars, focuses on the safe operation of power grids, including steady-state [12,13,14] and transient stability [15,16,17] security. Substation risk assessment is concerned with the condition and failure models of electric power equipment in substations and their impacts on substation or transmission systems.
In fact, most dispatching in power systems is executed through the operation of switchgears, including circuit breakers, disconnectors, etc. Hence, in dispatching process, the parameters or topology of the power grid may vary several times in a short period, which will inevitably complicate control of the system and subsequently increase the risk in the power system. However, different from the power grid operational risk and substation risk assessments, the object of a risk assessment for the power grid dispatching process is the dispatching order. Hence, these risk assessment methods cannot be directly applied in dispatching process.
In this context, different models and methods to evaluate the risk in dispatching processes have been proposed [21,22,23,24,25]. Authors in [21] proposed a risk evaluation method based on the generalized section concept, which groups the power components. Research in [22] mainly focused on assessment indices and used an index system including heavy-load, power limit excess in the control section, voltage violation, and loss of load to the risk consequences. In [23], a critical equipment search technique used for contingency searching was developed to enhance computational efficiency. In [24], a real-time probabilistic model was proposed to evaluate the influence of social period, weather, and equipment condition on risks in the dispatching process. Research in [25] established an exponential, comprehensive personnel-factor quantifying model, evaluating from history and the real-time level, and it was based on cognitive reliability and error analysis models in human factor reliability theory.
However, the effects of cyber systems have not caught enough attention in current research. The operation of switchgear components (SCs), such as breakers and disconnectors, and fault isolation (if it occurs) in dispatching process depends on an available cyber system. Therefore, it is of great significance to establish a risk assessment approach for dispatching process in the CPS environment.
Other research on CPS mainly focused on the impacts of a cyber system on a physical system, specifically related to the security of a cyber system against cyber-attacks [26,27,28,29,30], and the reliability of CPS components [31,32,33,34,35,36]; this paper is focused on the latter. In this context, reliability assessment models of smart grids, considering direct and indirect cyber-power interdependencies, were proposed in [31,32,33]. Lei et al. [34] introduced the concept of a cyber-physical interface matrix and constructed a CPS failure model for reliability analysis of the IEC 61850-based substation protection system. A non-sequential Monte Carlo simulation method, considering cyber-induced dependent failures, was also proposed by Lei et al. in order to evaluate the reliability of a composite power system [35]. Liu et al. [36] proposed a risk assessment approach for the cascading failure of CPS that considered hardware, software, and human factors existing in the cyber system.
Motivated by the aforementioned facts, this paper proposes a risk assessment model for power grid dispatching processes that considers the impact of the cyber system, which improves the accuracy of risk assessment results. In this regard, a cyber-physical switchgear state model that integrates the reliability states of both cyber system functions and switchgears is proposed, based on the transition of switchgear states in dispatching processes. According to control and protection functions, the possible state of the power grid is generated based on the post-operation state of switchgear. The risk probabilities and consequences of the power grid states are calculated to quantify the risk index.
The remainder of this paper is organized as follows: Section 2 formulates the transition of grid states in the dispatching process in CPS. Section 3 proposes the risk assessment model and develops a technique to quantify risks of dispatching order. Section 4 analyzes the numerical results from a case study based on the IEEE Reliability Test System-1979. The relevant conclusion is summarized in Section 5.
2. Transition of the Grid State in the Dispatching Process
2.1. Risk Source
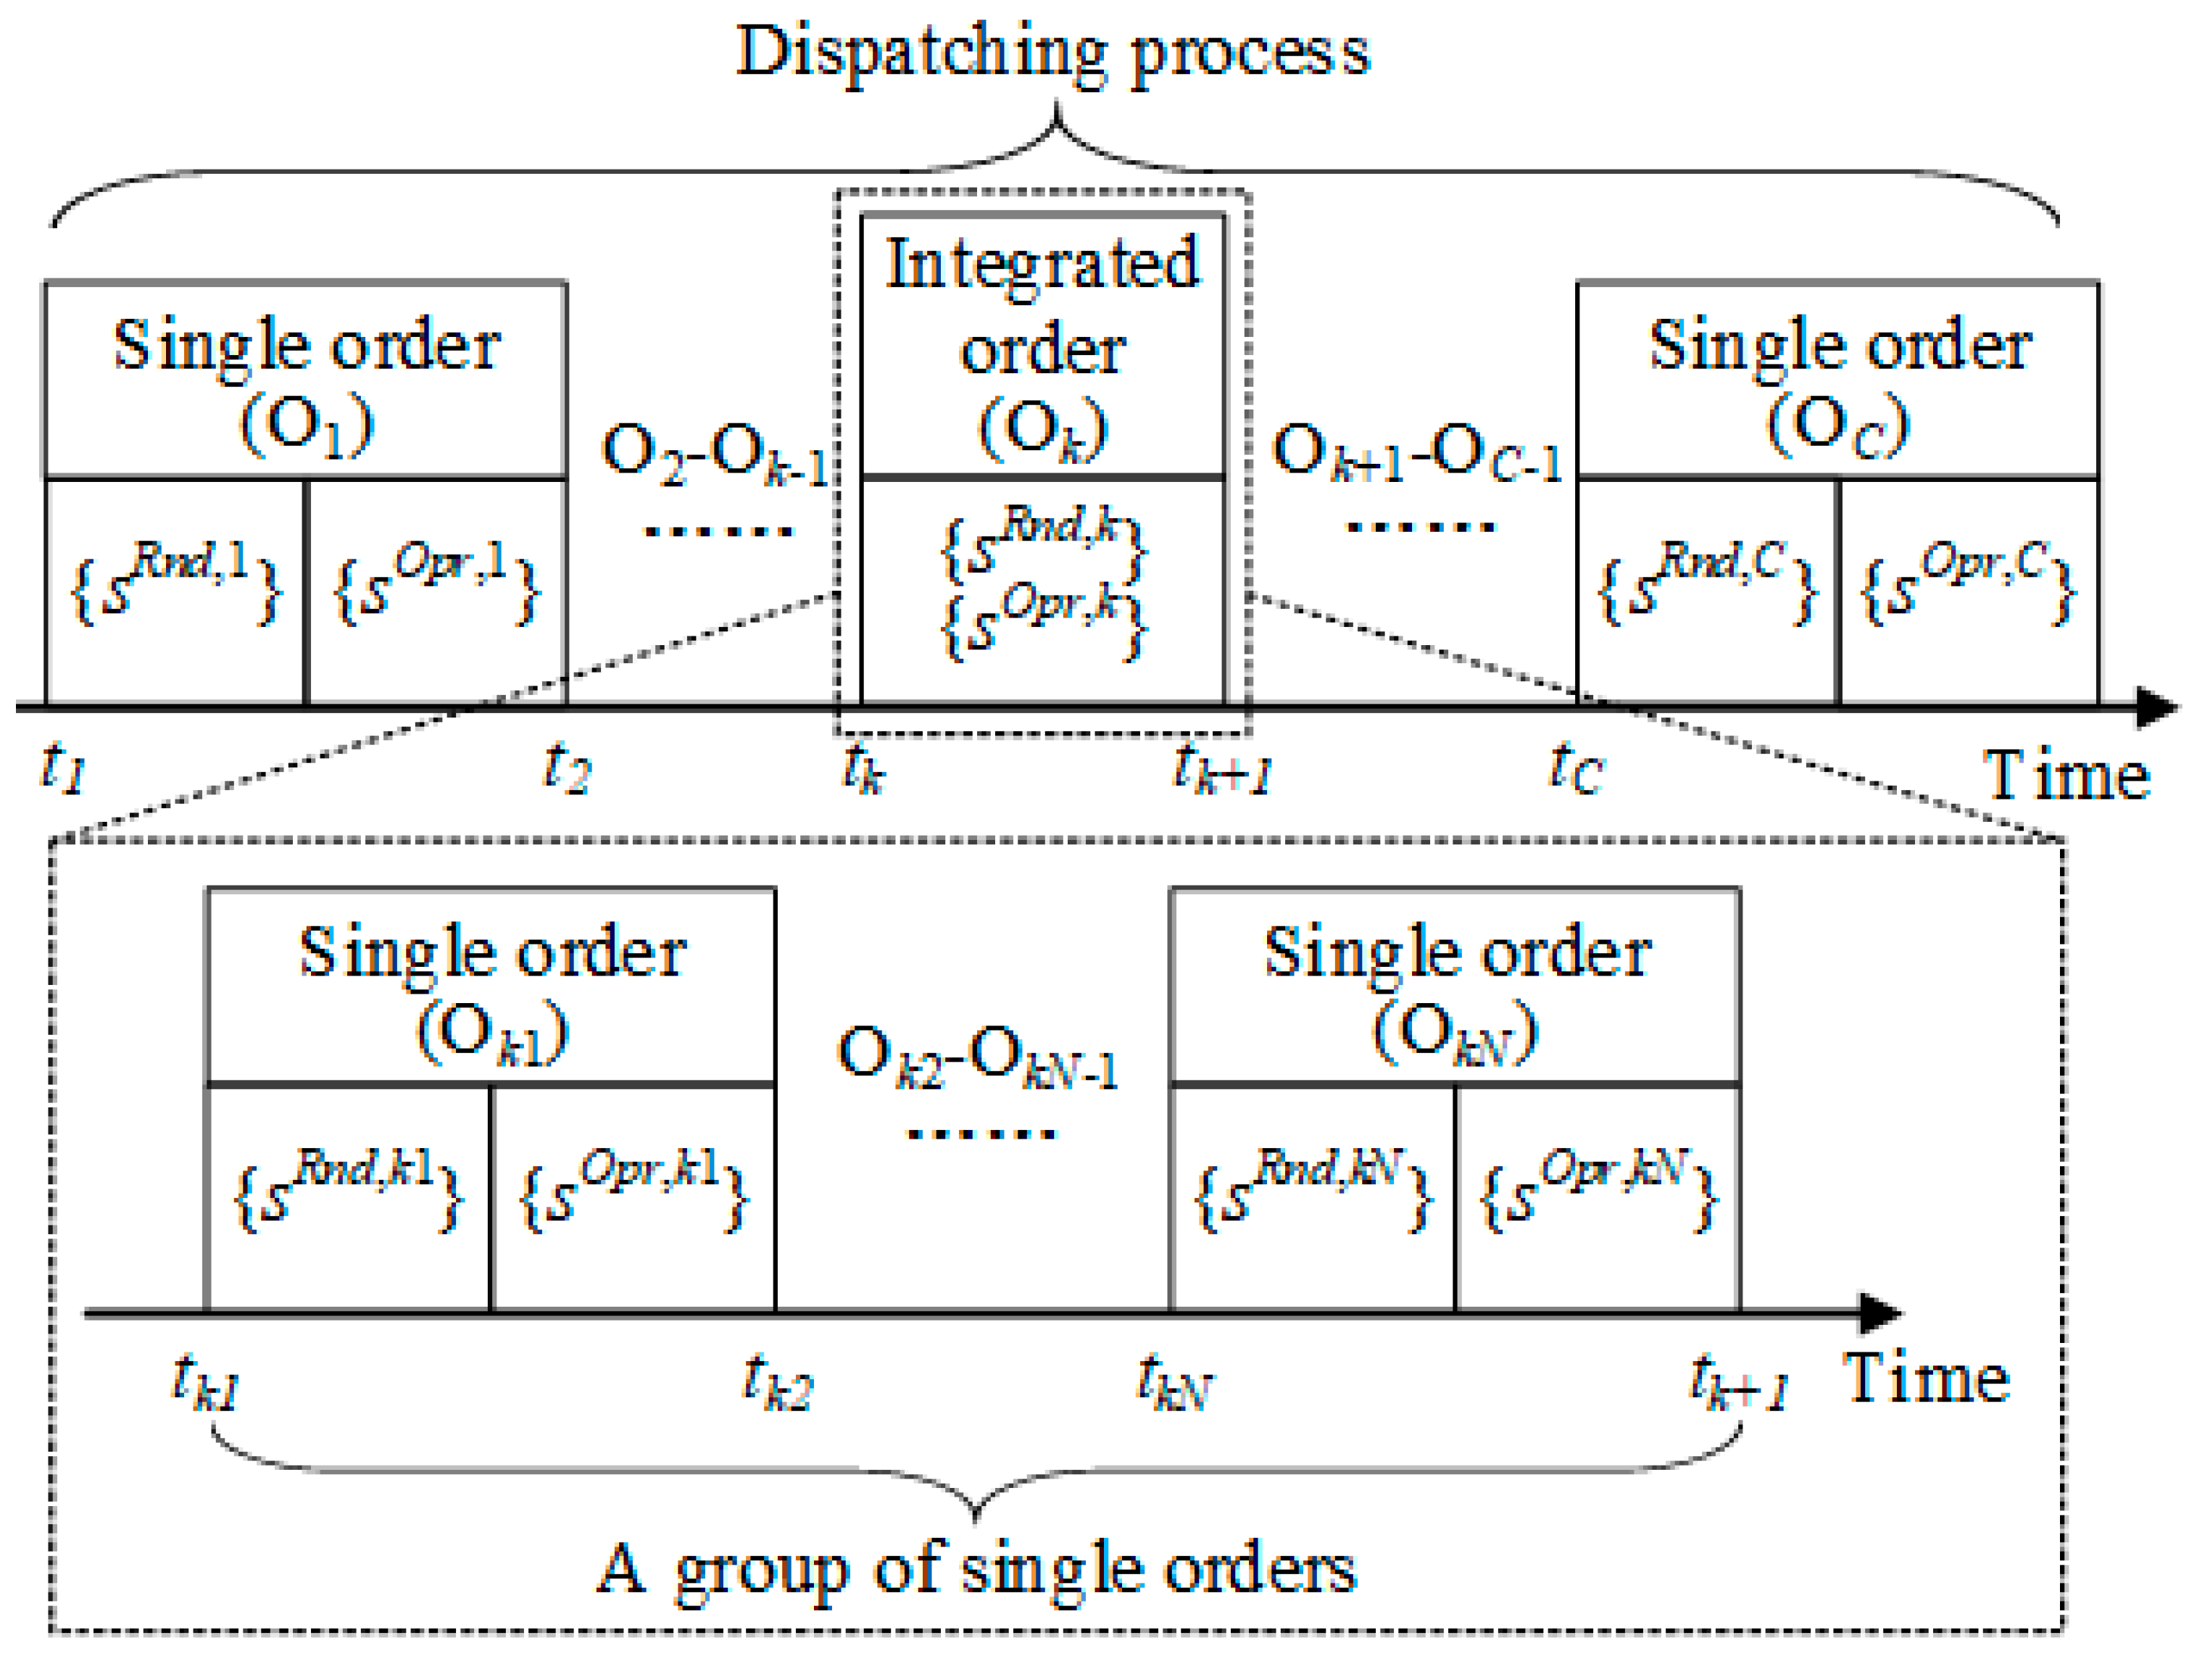
As a key guide in the power grid dispatching process, the dispatching order can be decomposed into a sequential combination of integrated orders and single orders [25]. The integrated orders can also be decomposed into several single orders. Therefore, as shown in Figure 1, the dispatching order consists of a group of single orders.
Every single order may cause a grid-state transition by operating the SCs. In fact, both SCs and some secondary devices (such as relay protection devices and stability control devices) operate in the dispatching process. However, the operation of SCs, which can transition the grid state, is mainly considered.
During the execution time of each single order, the grid transitions into two kinds of states:
- sRnd: Before the SC is operated, a random grounding fault may occur at lines (such as transmission lines and main transformer branches). Then, the protection of fault lines responds and certain breakers are tripped.
- sOpr: After the SC is operated, the grid transitions as a result of the transition of the SC state.
Those states possibly cause risk to the grid, resulting from unexpected fault. Therefore, the dispatching process risk consists of ROpr and RRnd, which are the corresponding risks in sOpr and sRnd, respectively.
2.2. Dispatching Process in a Cyber-Physical System (CPS)
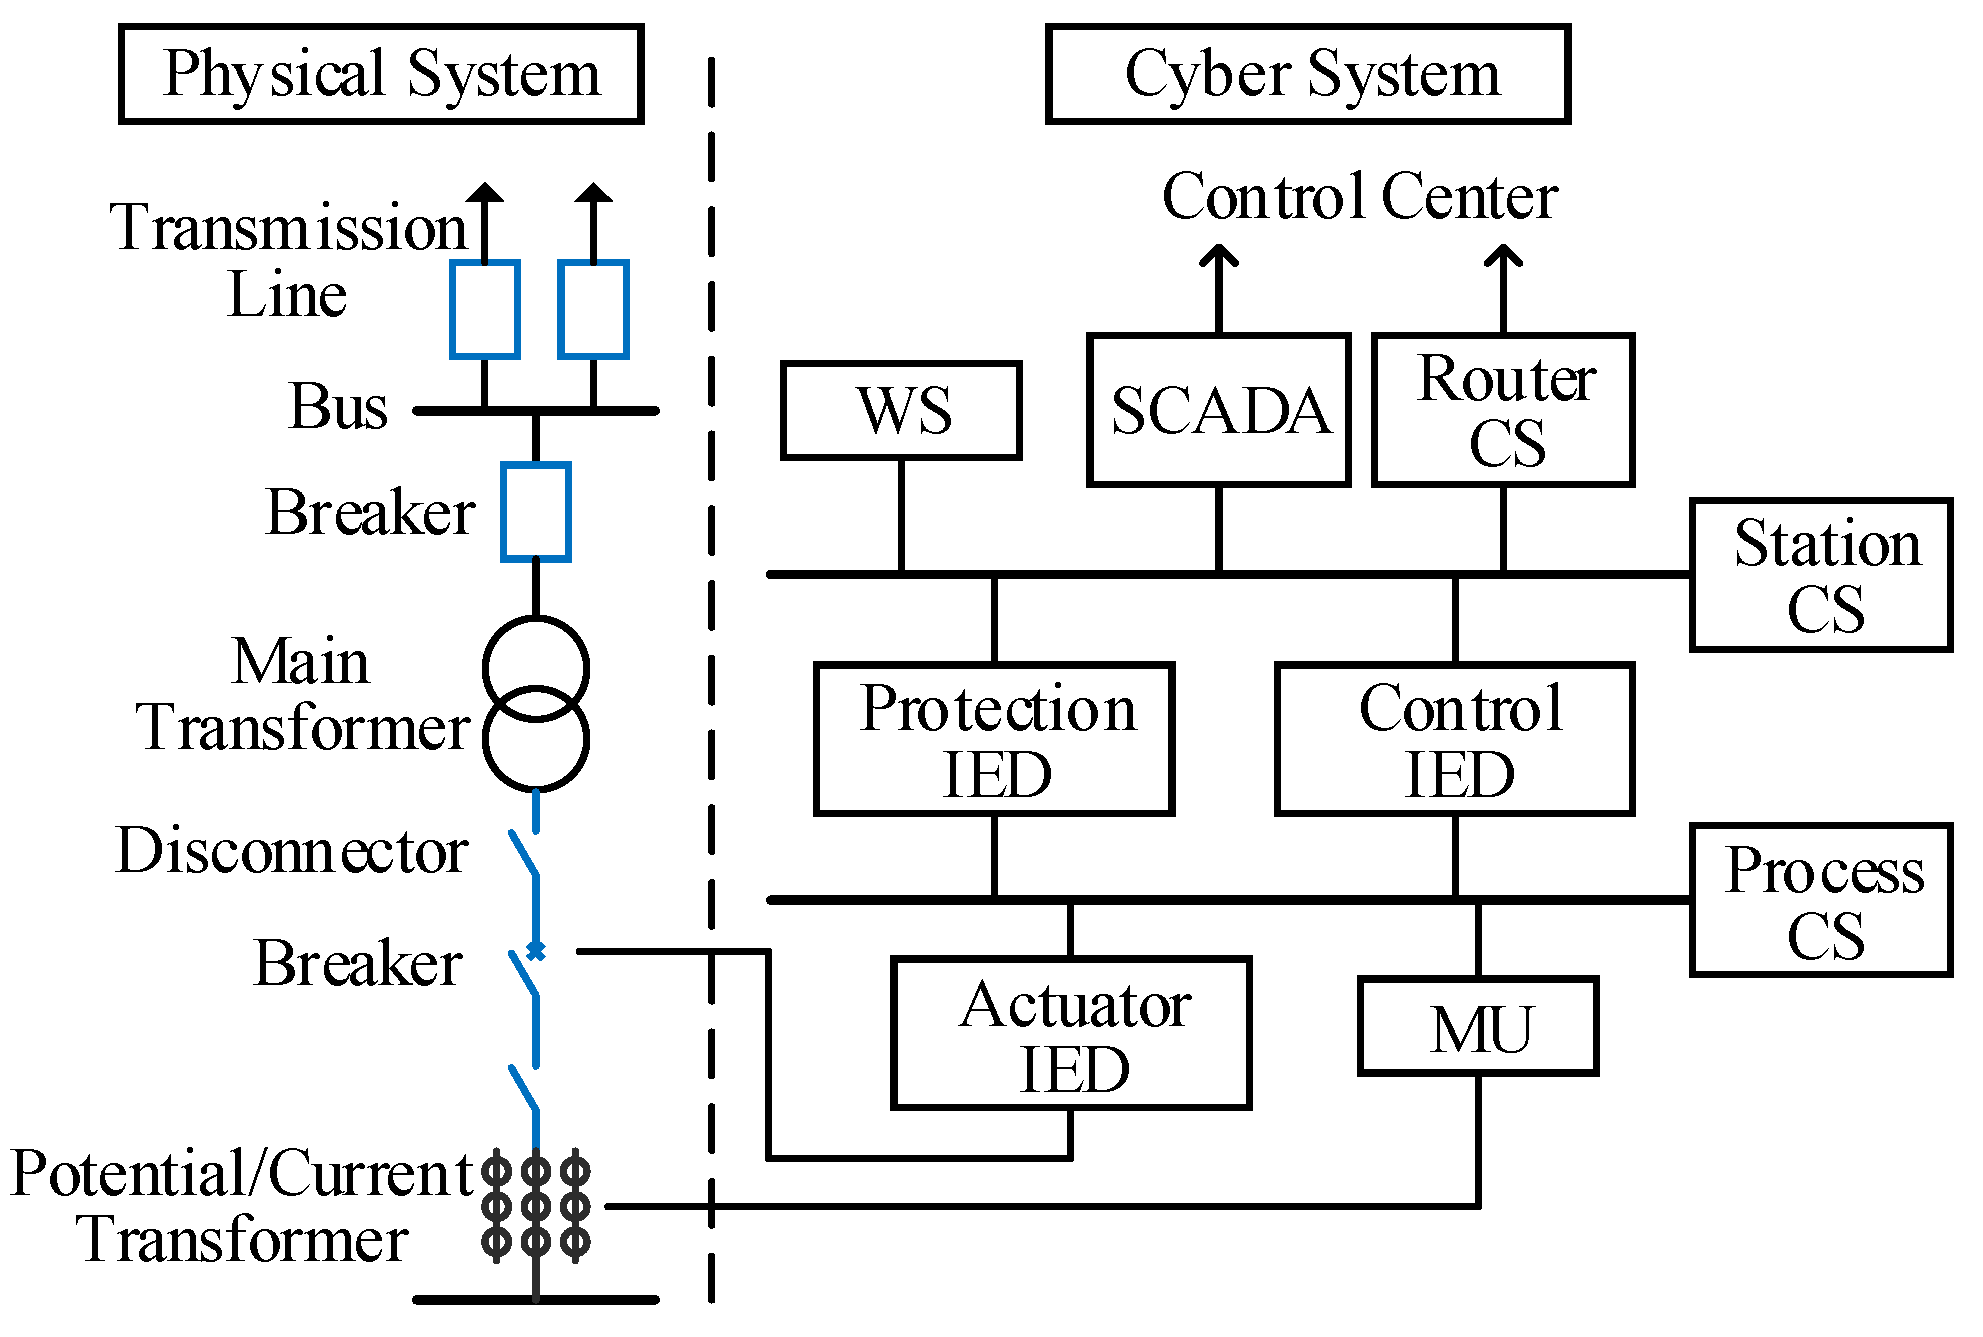
Generally, the dispatching order is executed in the substation. The CPS substation structure [33] is shown in Figure 2. The cyber system mainly consists of intelligent electronic devices (IEDs), merging units (MUs), workstation servers (WSs), communication switches (CSs), and communication lines (CLs). The physical system mainly consists of SCs, buses, and lines. In Figure 2, the shapes of blue represent SCs, which are connected between every bus and line.
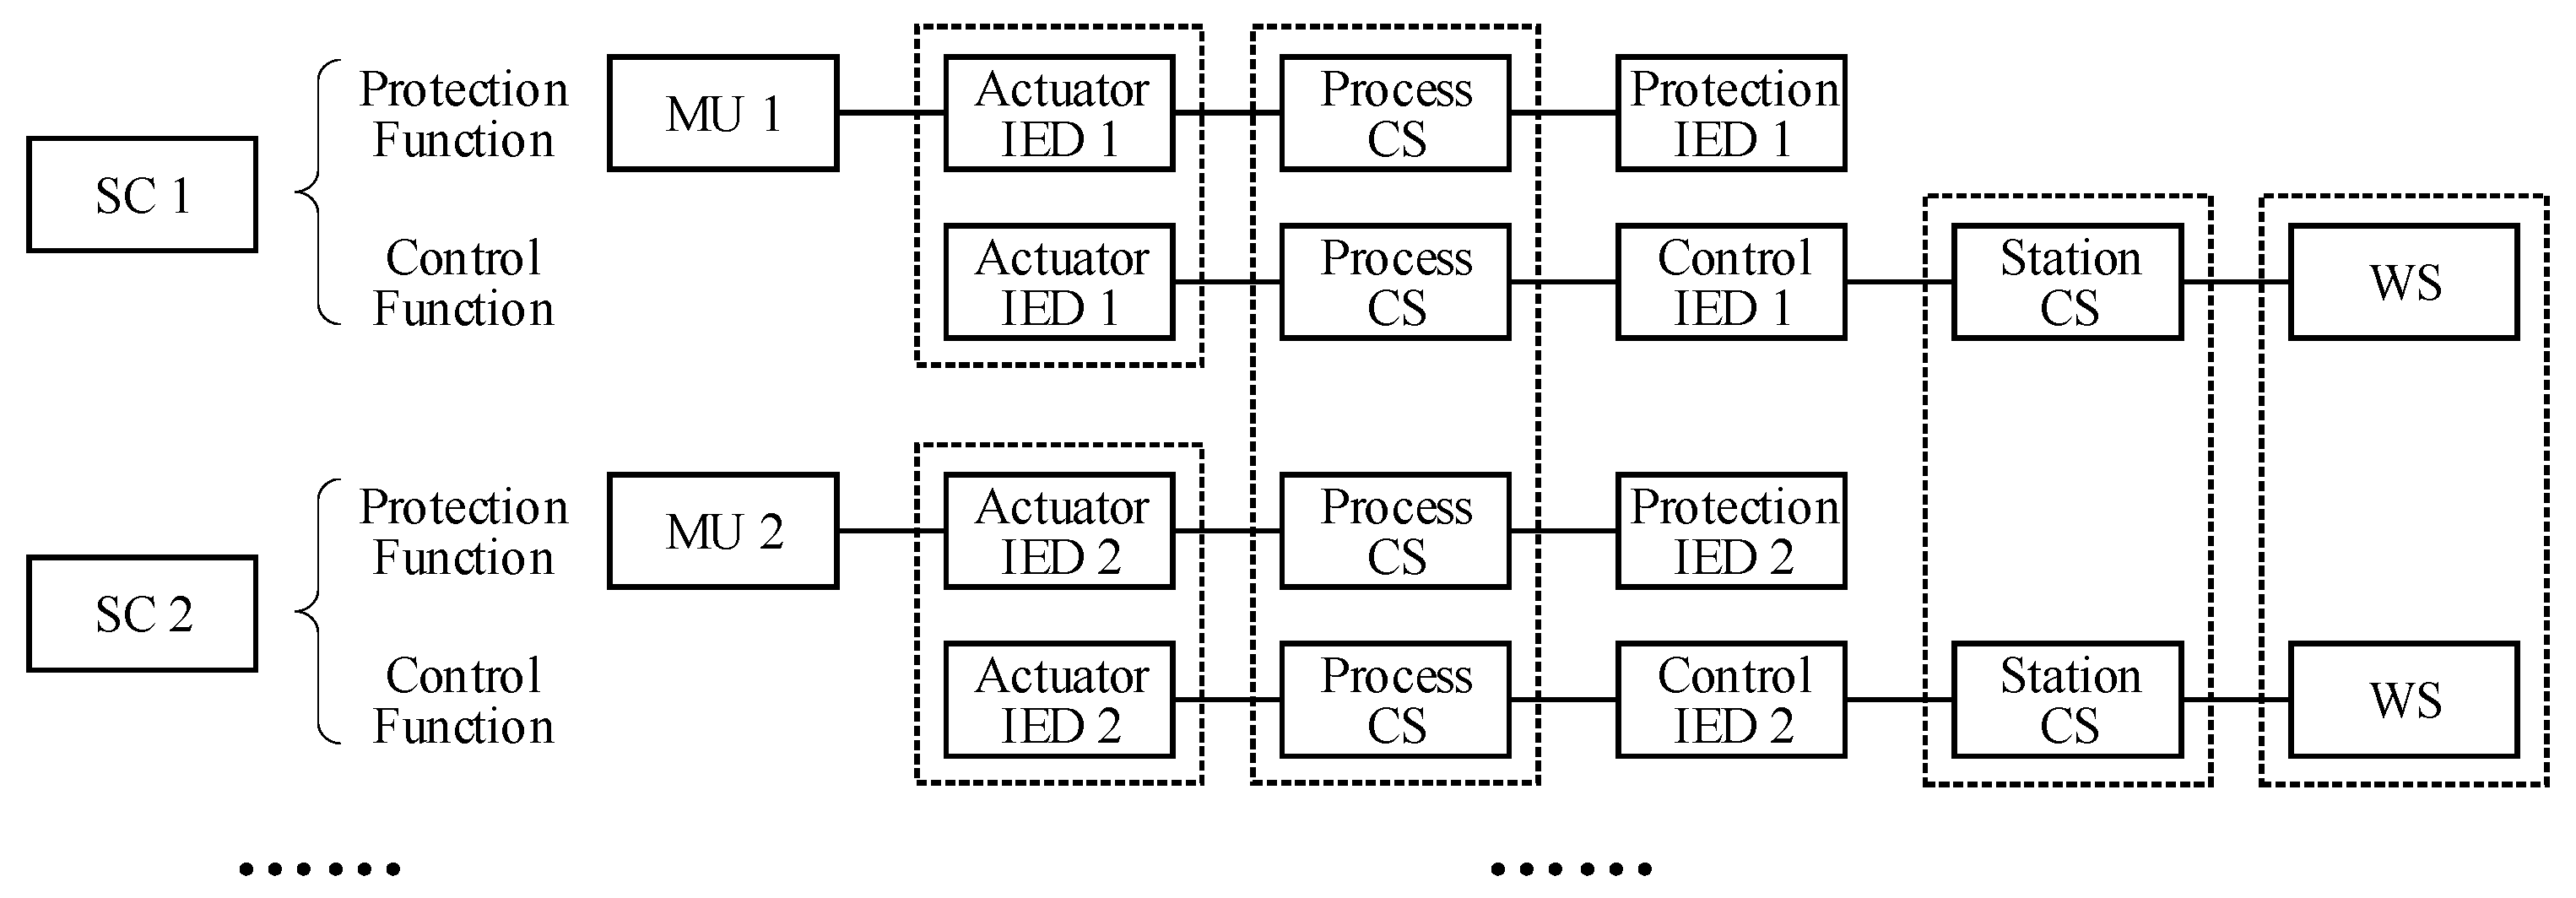
The dispatching order will be executed successfully if all CPS components, including cyber and physical components, are normal. However, the CPS component may fail because of various factors such as life limit, the external environment, and human factors. The failure of the cyber system includes interruptions, error, and communication delay. The error and delay will not affect communication if they are within the allowable range, which can be satisfied in most cases [37,38]. Therefore, communication interruption is the main cyber system failure considered in the dispatching process. As shown in Figure 3 (the components in the same dotted box represent the same component), cyber system functions include control and protection that depend on different components, which are:
- Control function: A control signal issued by the dispatcher is transmitted by WSs, CLs, CSs, and IEDs to operate the SC.
- Protection function: A control signal issued by relay protection devices is transmitted by MUs, CLs, CSs and IEDs, to the SC. First, the electrical measurements collected by MUs are calculated and analyzed in a protection IED. Then, the protection IED issues a signal to operate the SC.
Thus, the availability probabilities of control and protection functions are calculated by Equations (1) and (2).
Equations (1) and (2) are formulated based on the independence between the events that cyber system components are normally in, because every component is different and independent. However, the dependent components of different cyber system functions may include some common components, which means that different cyber system functions are not independent to each other.
2.3. The Transition of sOpr
After the SC is operated, the state of the SC is transited into three possible states as follows [21]:
- Normal: The state of the SC transits as expected.
- Malfunction: The state of the SC is not transited.
- Fault: The state of the SC transits unexpectedly, which causes a grounding fault at the bus connected to this SC.
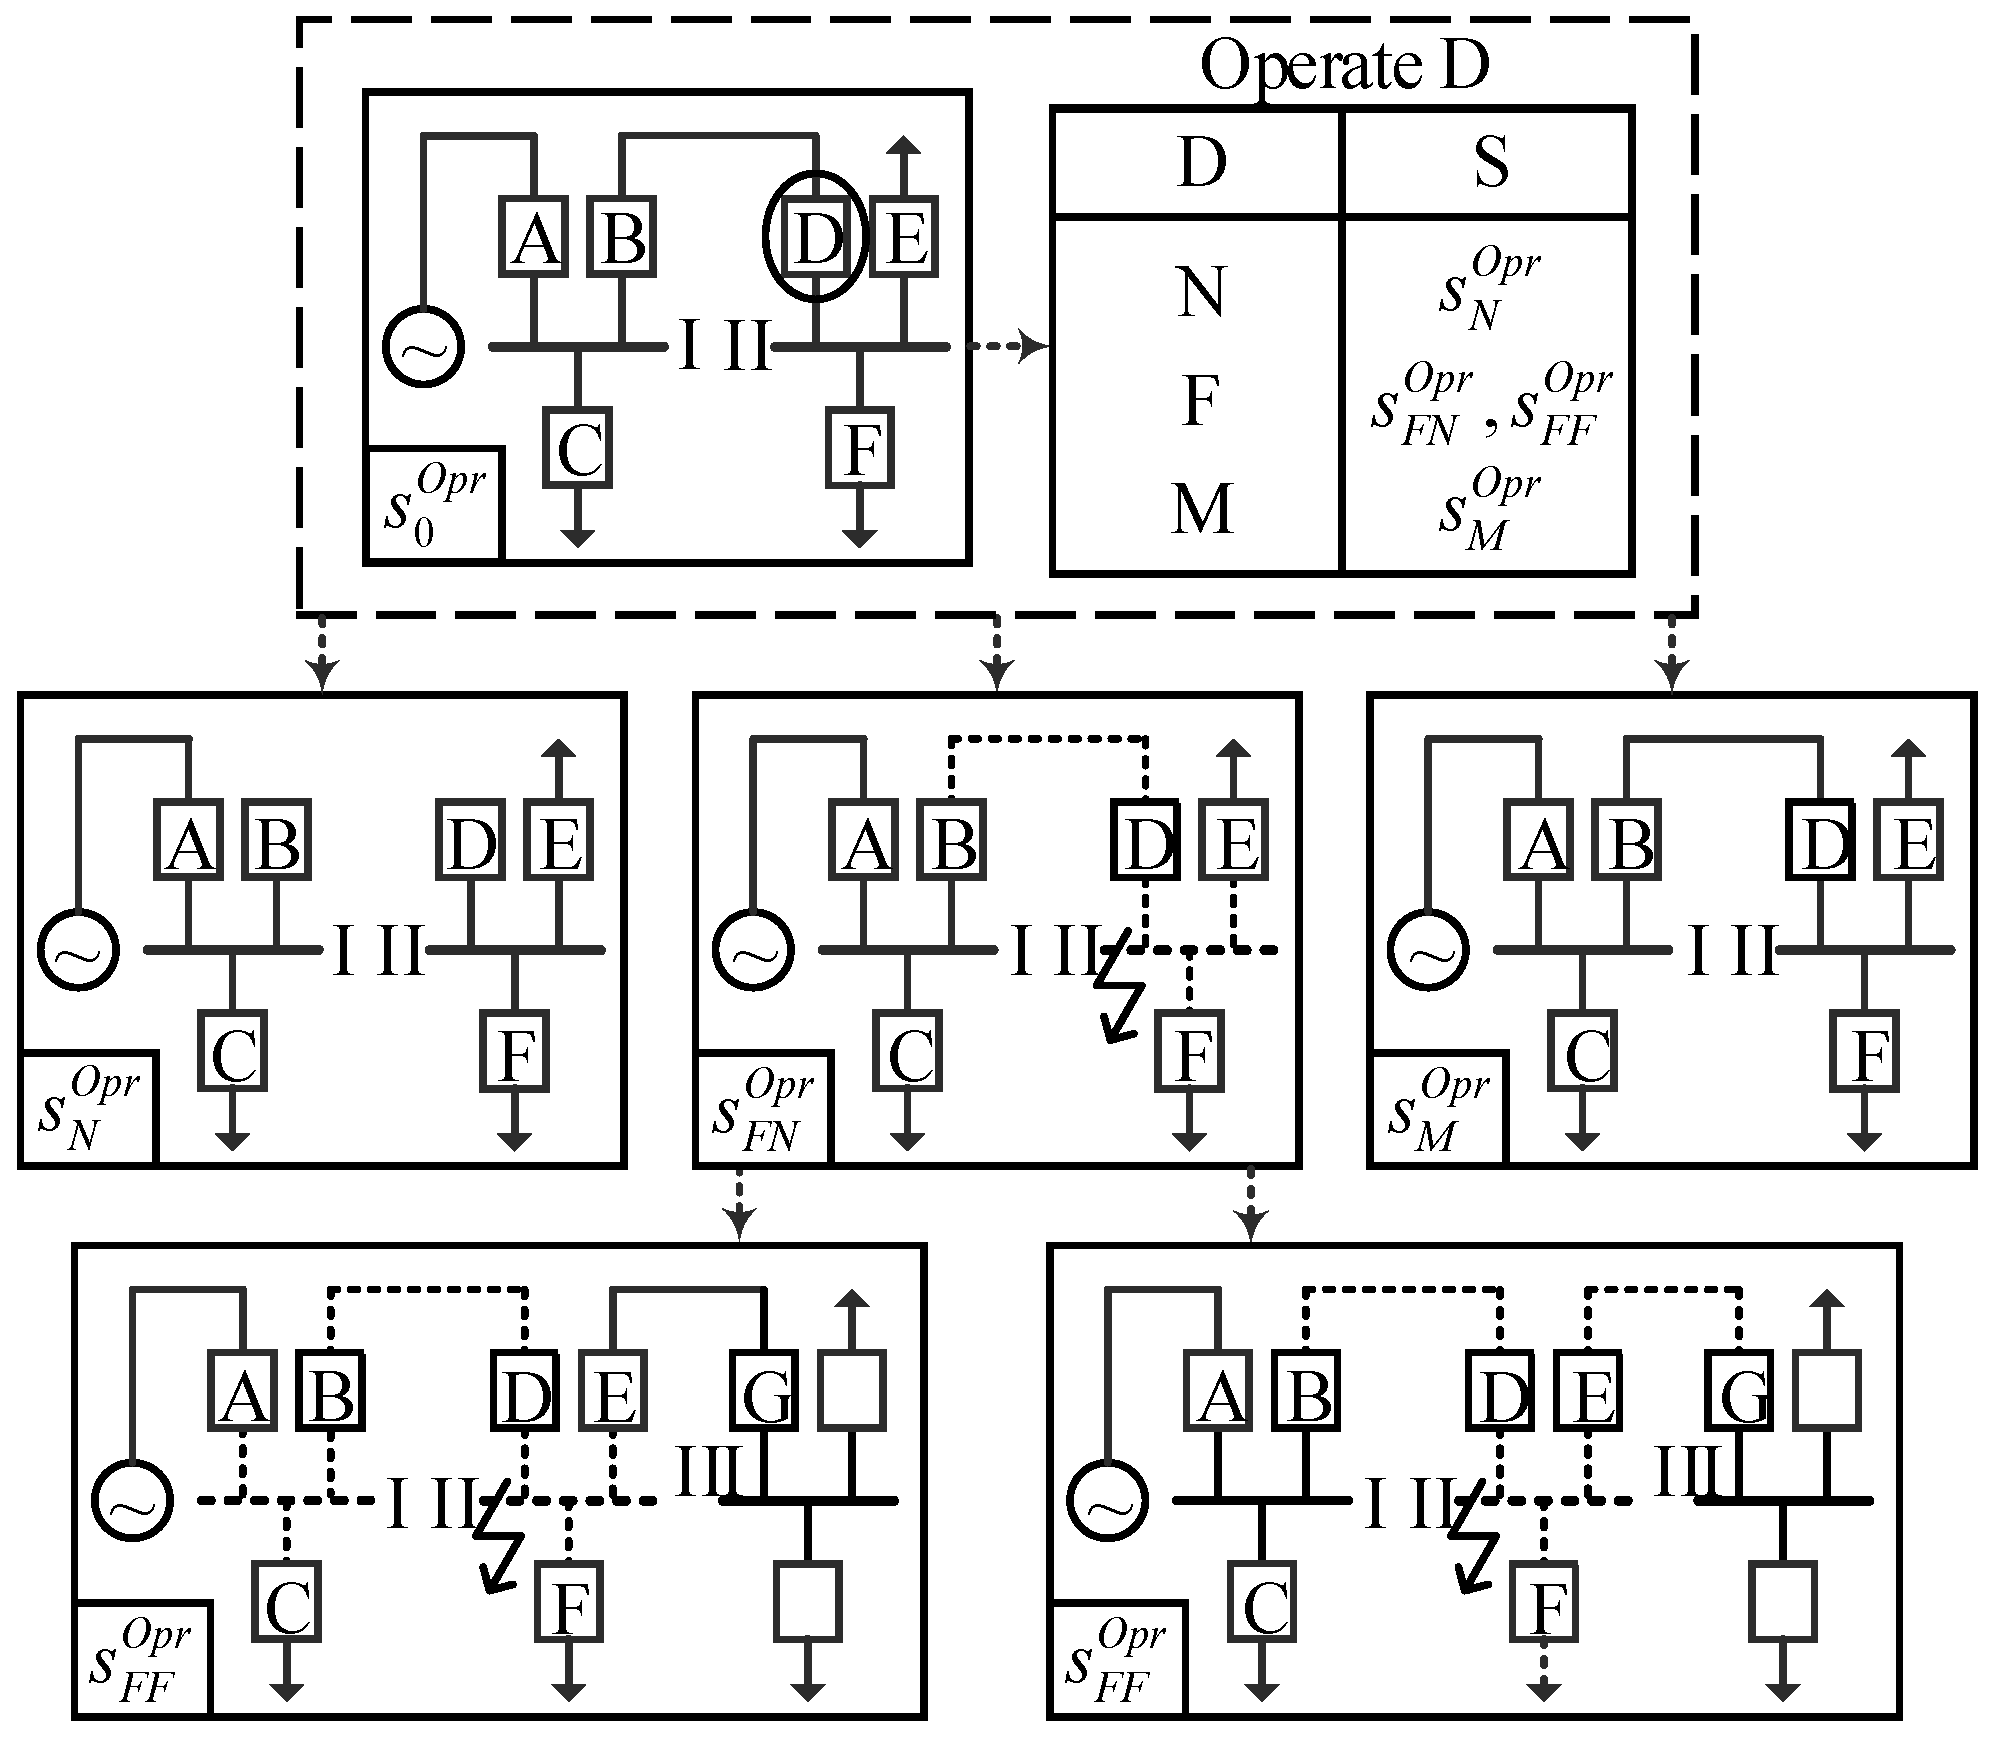
A particular case is shown in Figure 4 to analyze the transition of grid states when breaker D trips. A–G represent breakers. Line I-II will be disconnected to the grid if D is in normal. The grid state will not be transited when D malfunctions or when the control function fails. The protection function needs to be considered further if D is in fault, which causes a grounding fault at bus II.
- Line I-II and bus II will be disconnected from the grid if both the protection functions of line I-II and bus II are normal, which results in the tripping of breakers B, E, and F.
- Line I-II and bus I and II will be disconnected if the protection function of line I-II fails, which results in the tripping of breakers A, C, E, and F.
- Line I-II, II-III, and bus II will be disconnected if the protection function of bus II fails, which results in the tripping of breakers B and G.
2.4. The Transition of sRnd
After a random grounding fault occurs at a certain line, the protection function of this line will respond correctly if it is normal, otherwise the protection function of adjacent buses will respond if that of this line is in failure. The corresponding transitions of grid states can be analyzed as follows:
- A line will be disconnected if its protection function is normal, which results in the tripping of the breakers connected to this line.
- A line and adjacent buses will be disconnected if the protection function of this line fails, which results in the tripping of the breakers connected to these buses.
2.5. The Transitions of Grid states in the Dispatching Process
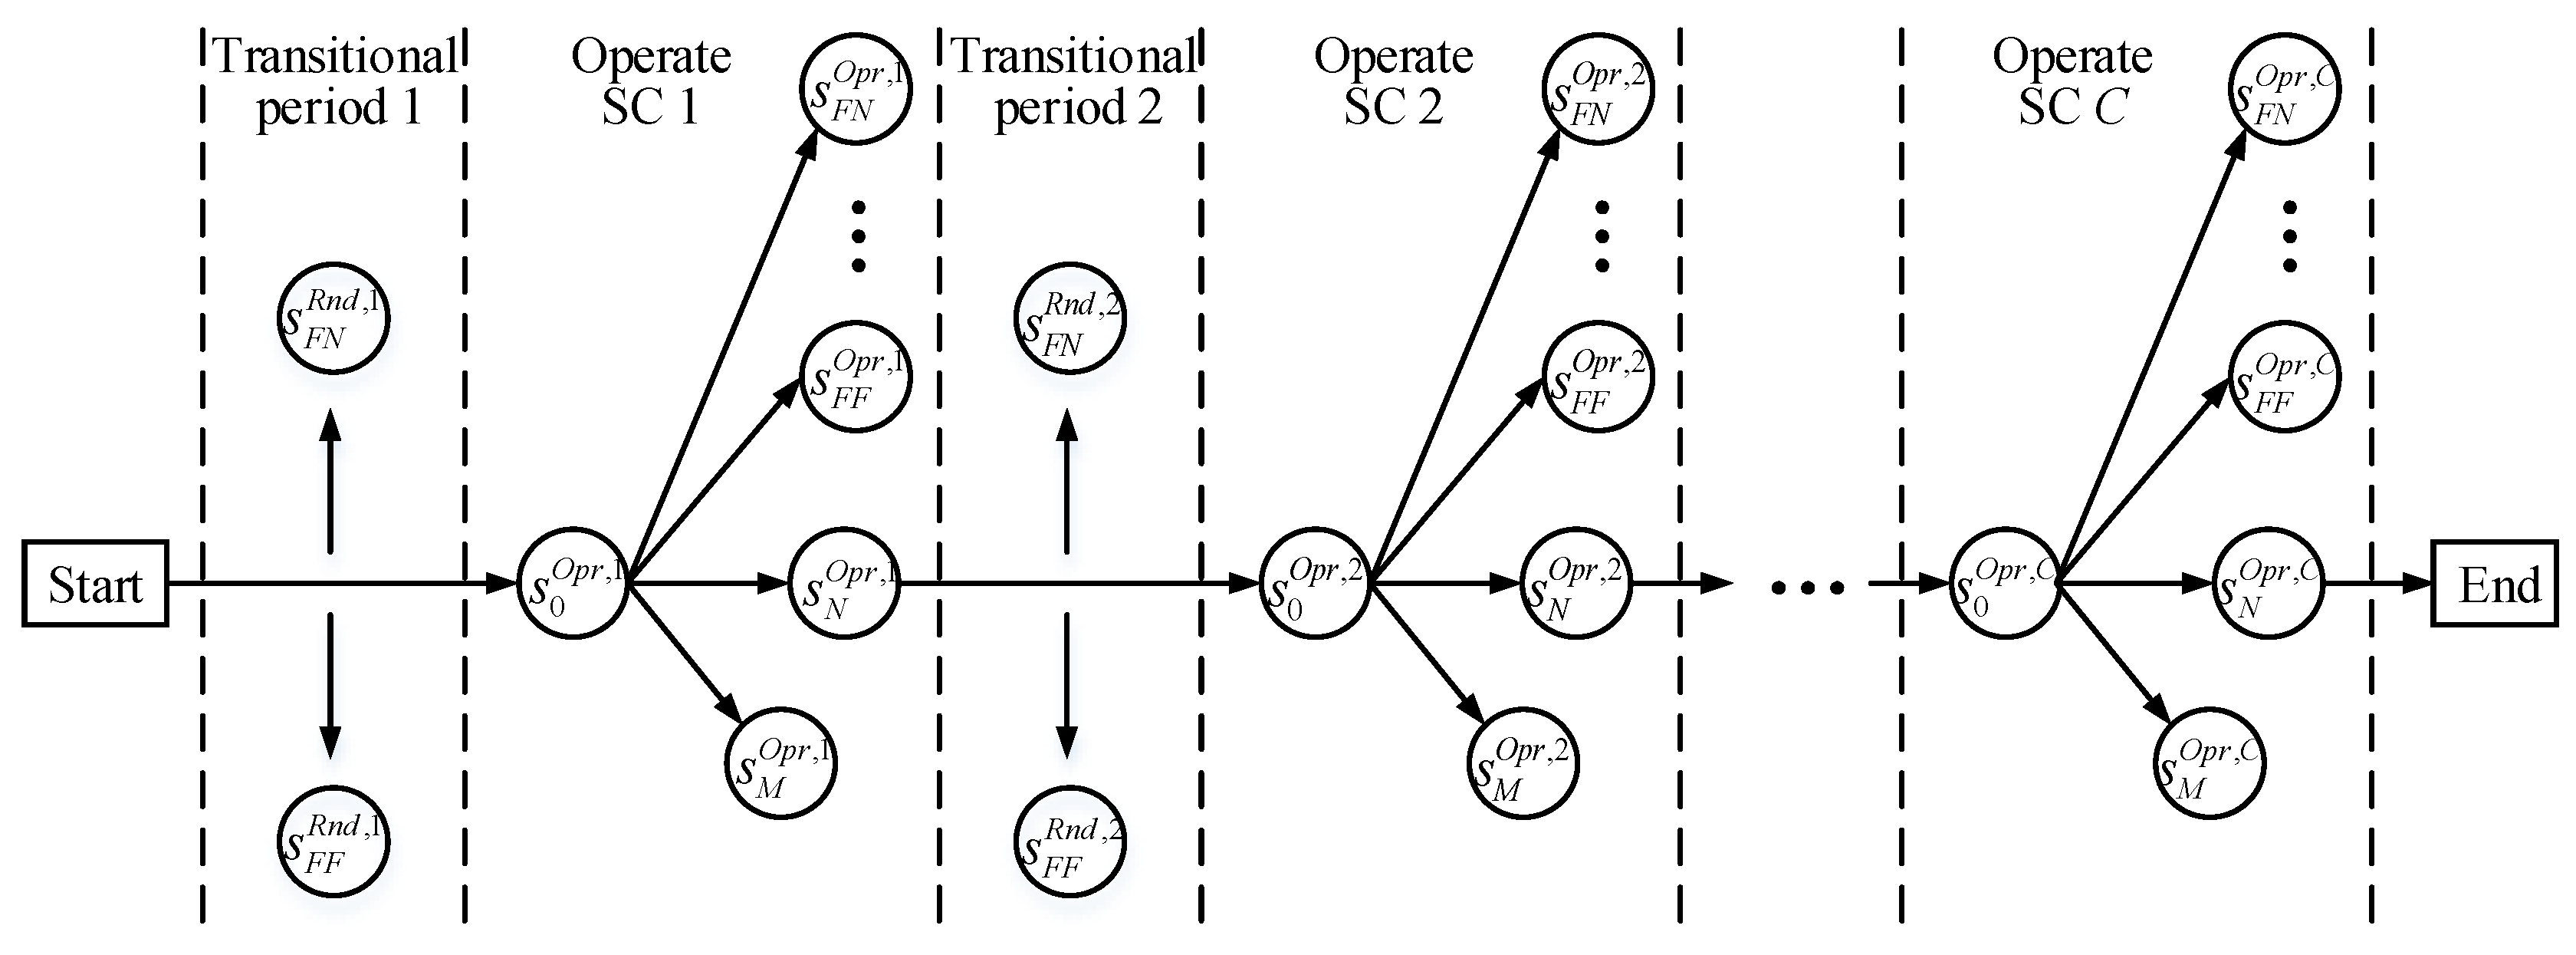
According to Figure 1 and Figure 4, the transitions of grid states when they execute a dispatching order, which has the number of C single orders, are shown in Figure 5. In each single order, s may transition into and in transitional periods before operating the SCs, and transition into , , , and after operating the SCs. The next single order is executed only if s transitions into when operating the current SC.
3. Risk Assessment Model
3.1. Risk Probability
Two reasonable assumptions are made as follows:
Assumption 1: In sRnd, concurrent random grounding faults at different lines are not considered. This assumption meets the N-1 criterion in power systems [14,39].
Assumption 2: In both sRnd and sOpr, concurrent cyber system function failures at different SCs are not considered if they are independent to each other.
3.1.1. The Probability of sOpr
As analyzed in Section 2.3, the grid state will be transited into four kinds of possible states when the SC is operated. The probabilities of these grid states are calculated by Equations (3)–(8).
When calculating and , the events of the operating SC and the events of its control function are independent to each other because of their different dependent components. However, when calculating and , and may not be independent to each other, which depends on whether they have a common dependent component (i.e., Process CS in Figure 3). Here, we introduced an event , which represents under the condition that event has occurred. Note that , and is the event that the common Process CS is normal. Therefore, the probability of is calculated by (7) and depends on the independence between and . For , is independent to each other, then we calculate by (8).
3.1.2. The Probability of sRnd
After a grounding fault occurs at a line, two possible grid states follow. For protecting lines, two breakers are installed at the beginning and end of every line in the grid. Similar to (5)–(8), the independence between and should be considered when calculating the probabilities of and . is calculated by (9)–(11).
where represents the event under the condition that event has occurred.
According to Assumption 2 in 3.1, the independence between and decides whether the concurrent protection function failures at the two breakers at both ends of the line are taken into account.
If and are independent to each other:
Else if:
The single protection function failure at breaker , and the concurrent protection function failures at breaker and , are considered in (13) and (14), respectively.
In general, the failure probabilities of electric power components are affected by many factors including the external conditions and their life [40,41,42], so it is difficult to quantify accurately. To simplify the model, we used the basic reliability parameters of power components to calculate their failure probabilities during the dispatching process in this paper.
3.2. Risk Consequence
The load loss caused by failures of electric power components is an important contents of risk assessment in power systems. In the dispatching process, we considered the load loss as the risk consequence indicators represented by I, which resulted from two parts:
- Load loss at buses, which are disconnected to the grid after the breakers trip, resulting from the protection of fault buses or lines. It is represented by IGrd and calculated by (16).
- Load shedding at buses, resulting from the operation constraints of the power system. It is represented by IShd and calculated by (17)–(29), which are given as the optimal power flow models.
Equation (17) is the objective function. Equations (18)–(21) are AC power flow equations of the grid. Constraints (22) and (23) limit active and reactive power outputs of the generator, respectively. Constraint (24) restricts the voltage magnitude of buses. Constraint (25) and Equations (26)–(27) show that the capacity of lines should be equal to or lower than their maximum capacity. Constraints (28) and (29) guarantee that the active and reactive load shedding is equal to or lower than their active and reactive load, respectively.
3.3. Risk Calculation
The mathematical model in Section 3.2 calculates the load loss in a specific grid state. Therefore, the risk consequence in grid state s can be represented by I(s) as well. Risk is usually quantified by the product of the probability and consequences of the risk event [22]. The risk R of a single order can be calculated by (30)–(32).
3.4. Risk Assessment Process
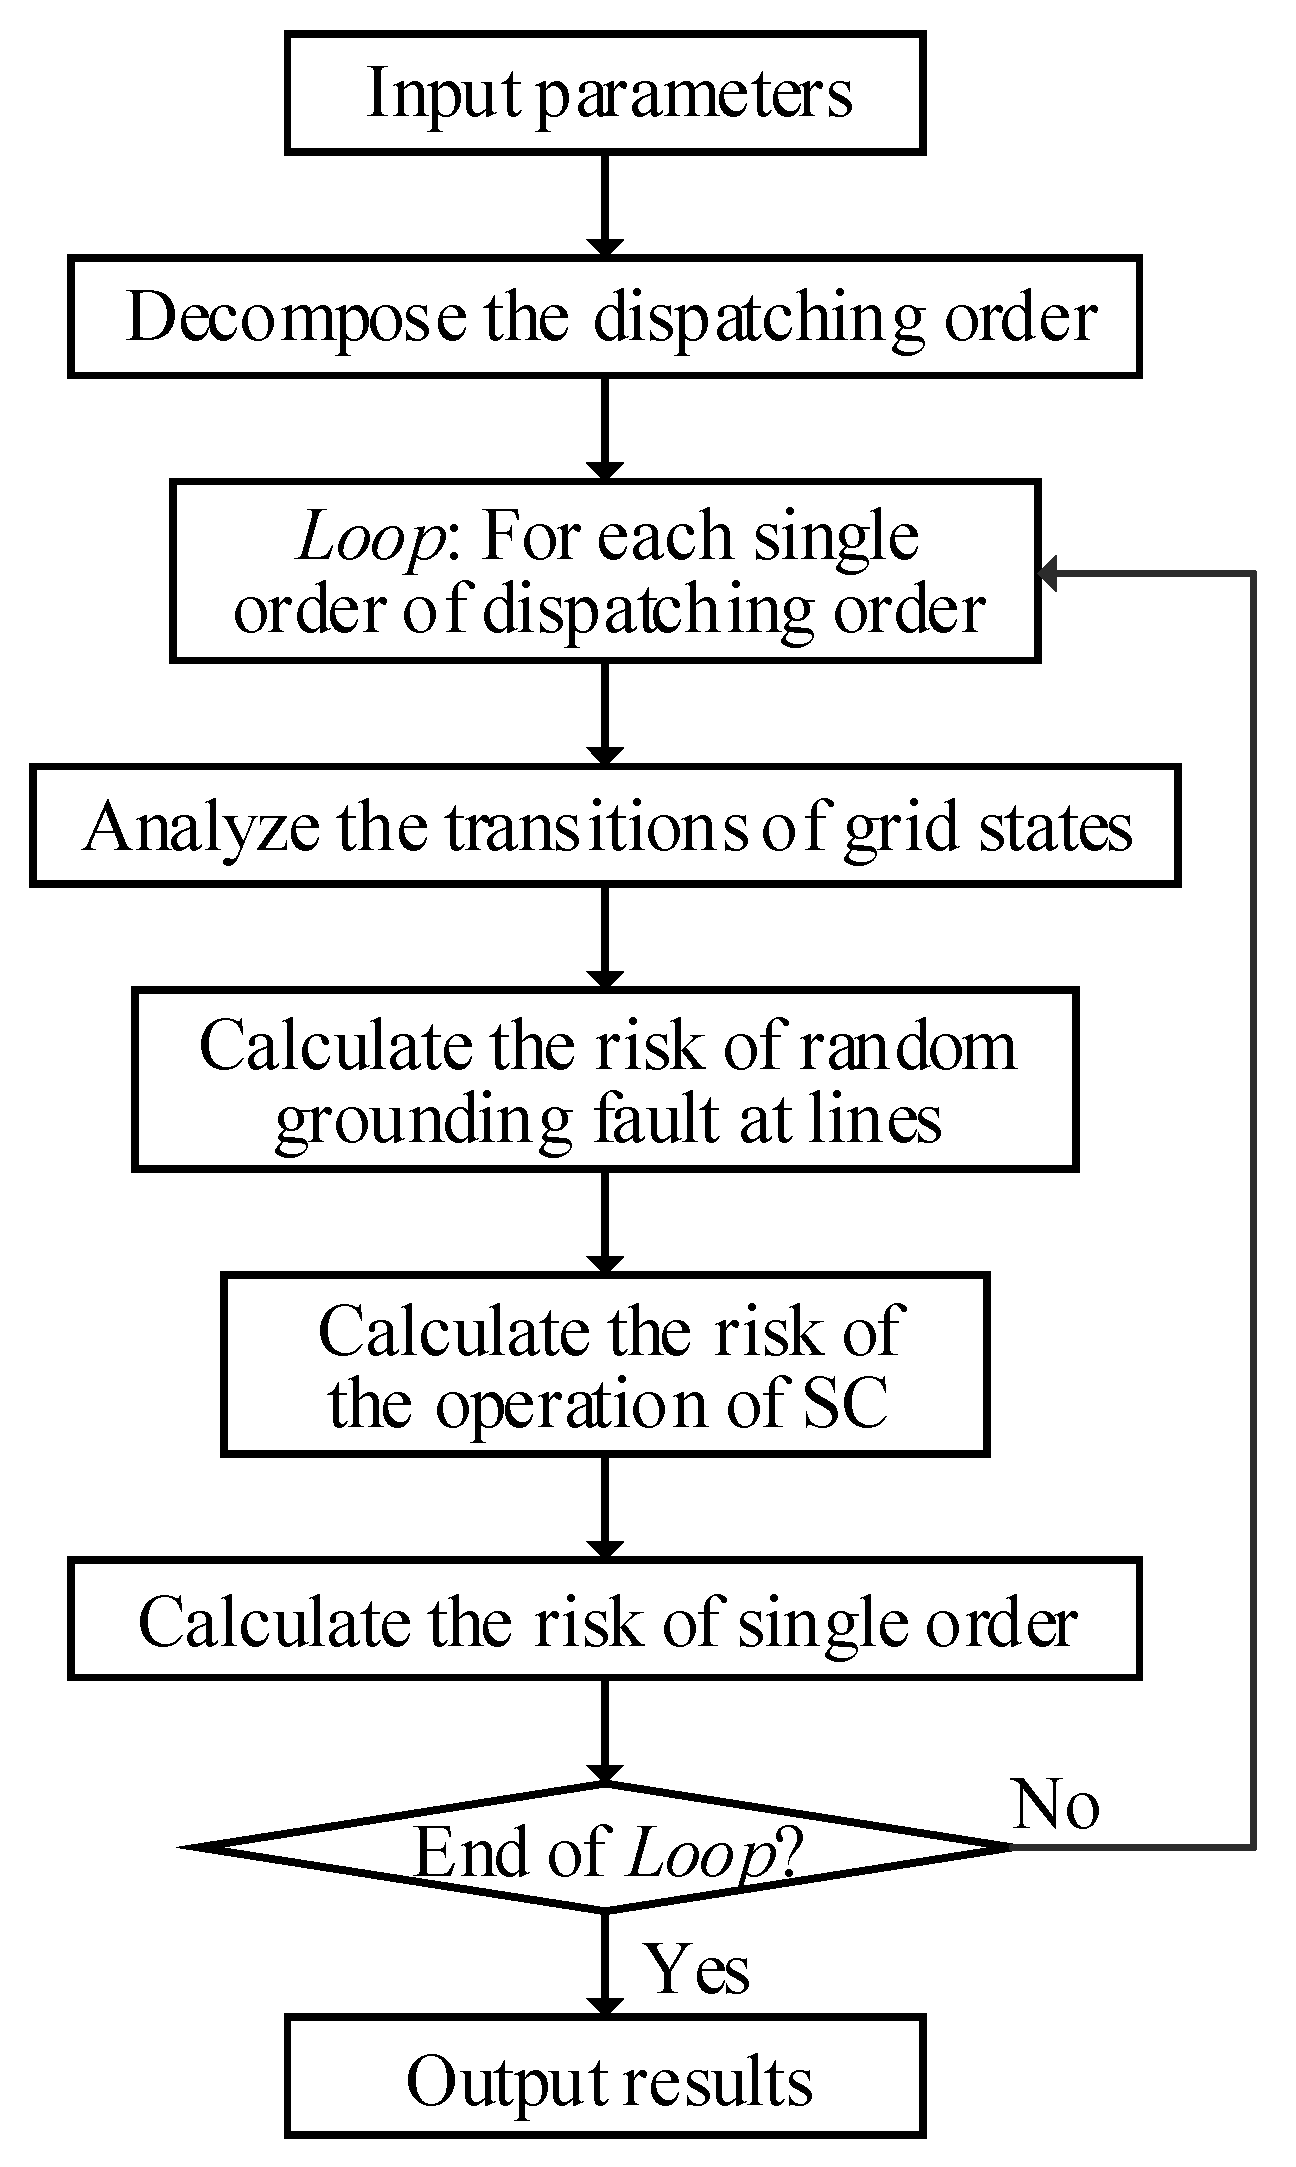
The proposed risk assessment model is designed as a multi-step algorithm, depicted in Figure 6. The main steps are described as follows:
- Input parameters including dispatching order, the reliability of components, and grid parameters, etc.
- Decompose the dispatching order into a group of single orders.
- Analyze the transitions of sOpr and sRnd for each single order.
- Calculate RRnd. First, generate grid states by setting grounding fault at lines and using N-1 criterion. Then, calculate risk probabilities of and by (9)–(14) according to the reliability of components and grid parameters. Finally, calculate risk consequences of such grid states by (15)–(29).
- Calculate ROpr. Calculate the risk probabilities and consequences of , , , and by (3)–(8) and (15)–(29) respectively.
- Calculate the risk R of single orders by (30)–(32).
- If all single orders of the dispatching order are analyzed, the algorithm ends; otherwise, go to Step 3.
4. Numerical Results
4.1. Parameters and Computational Platforms
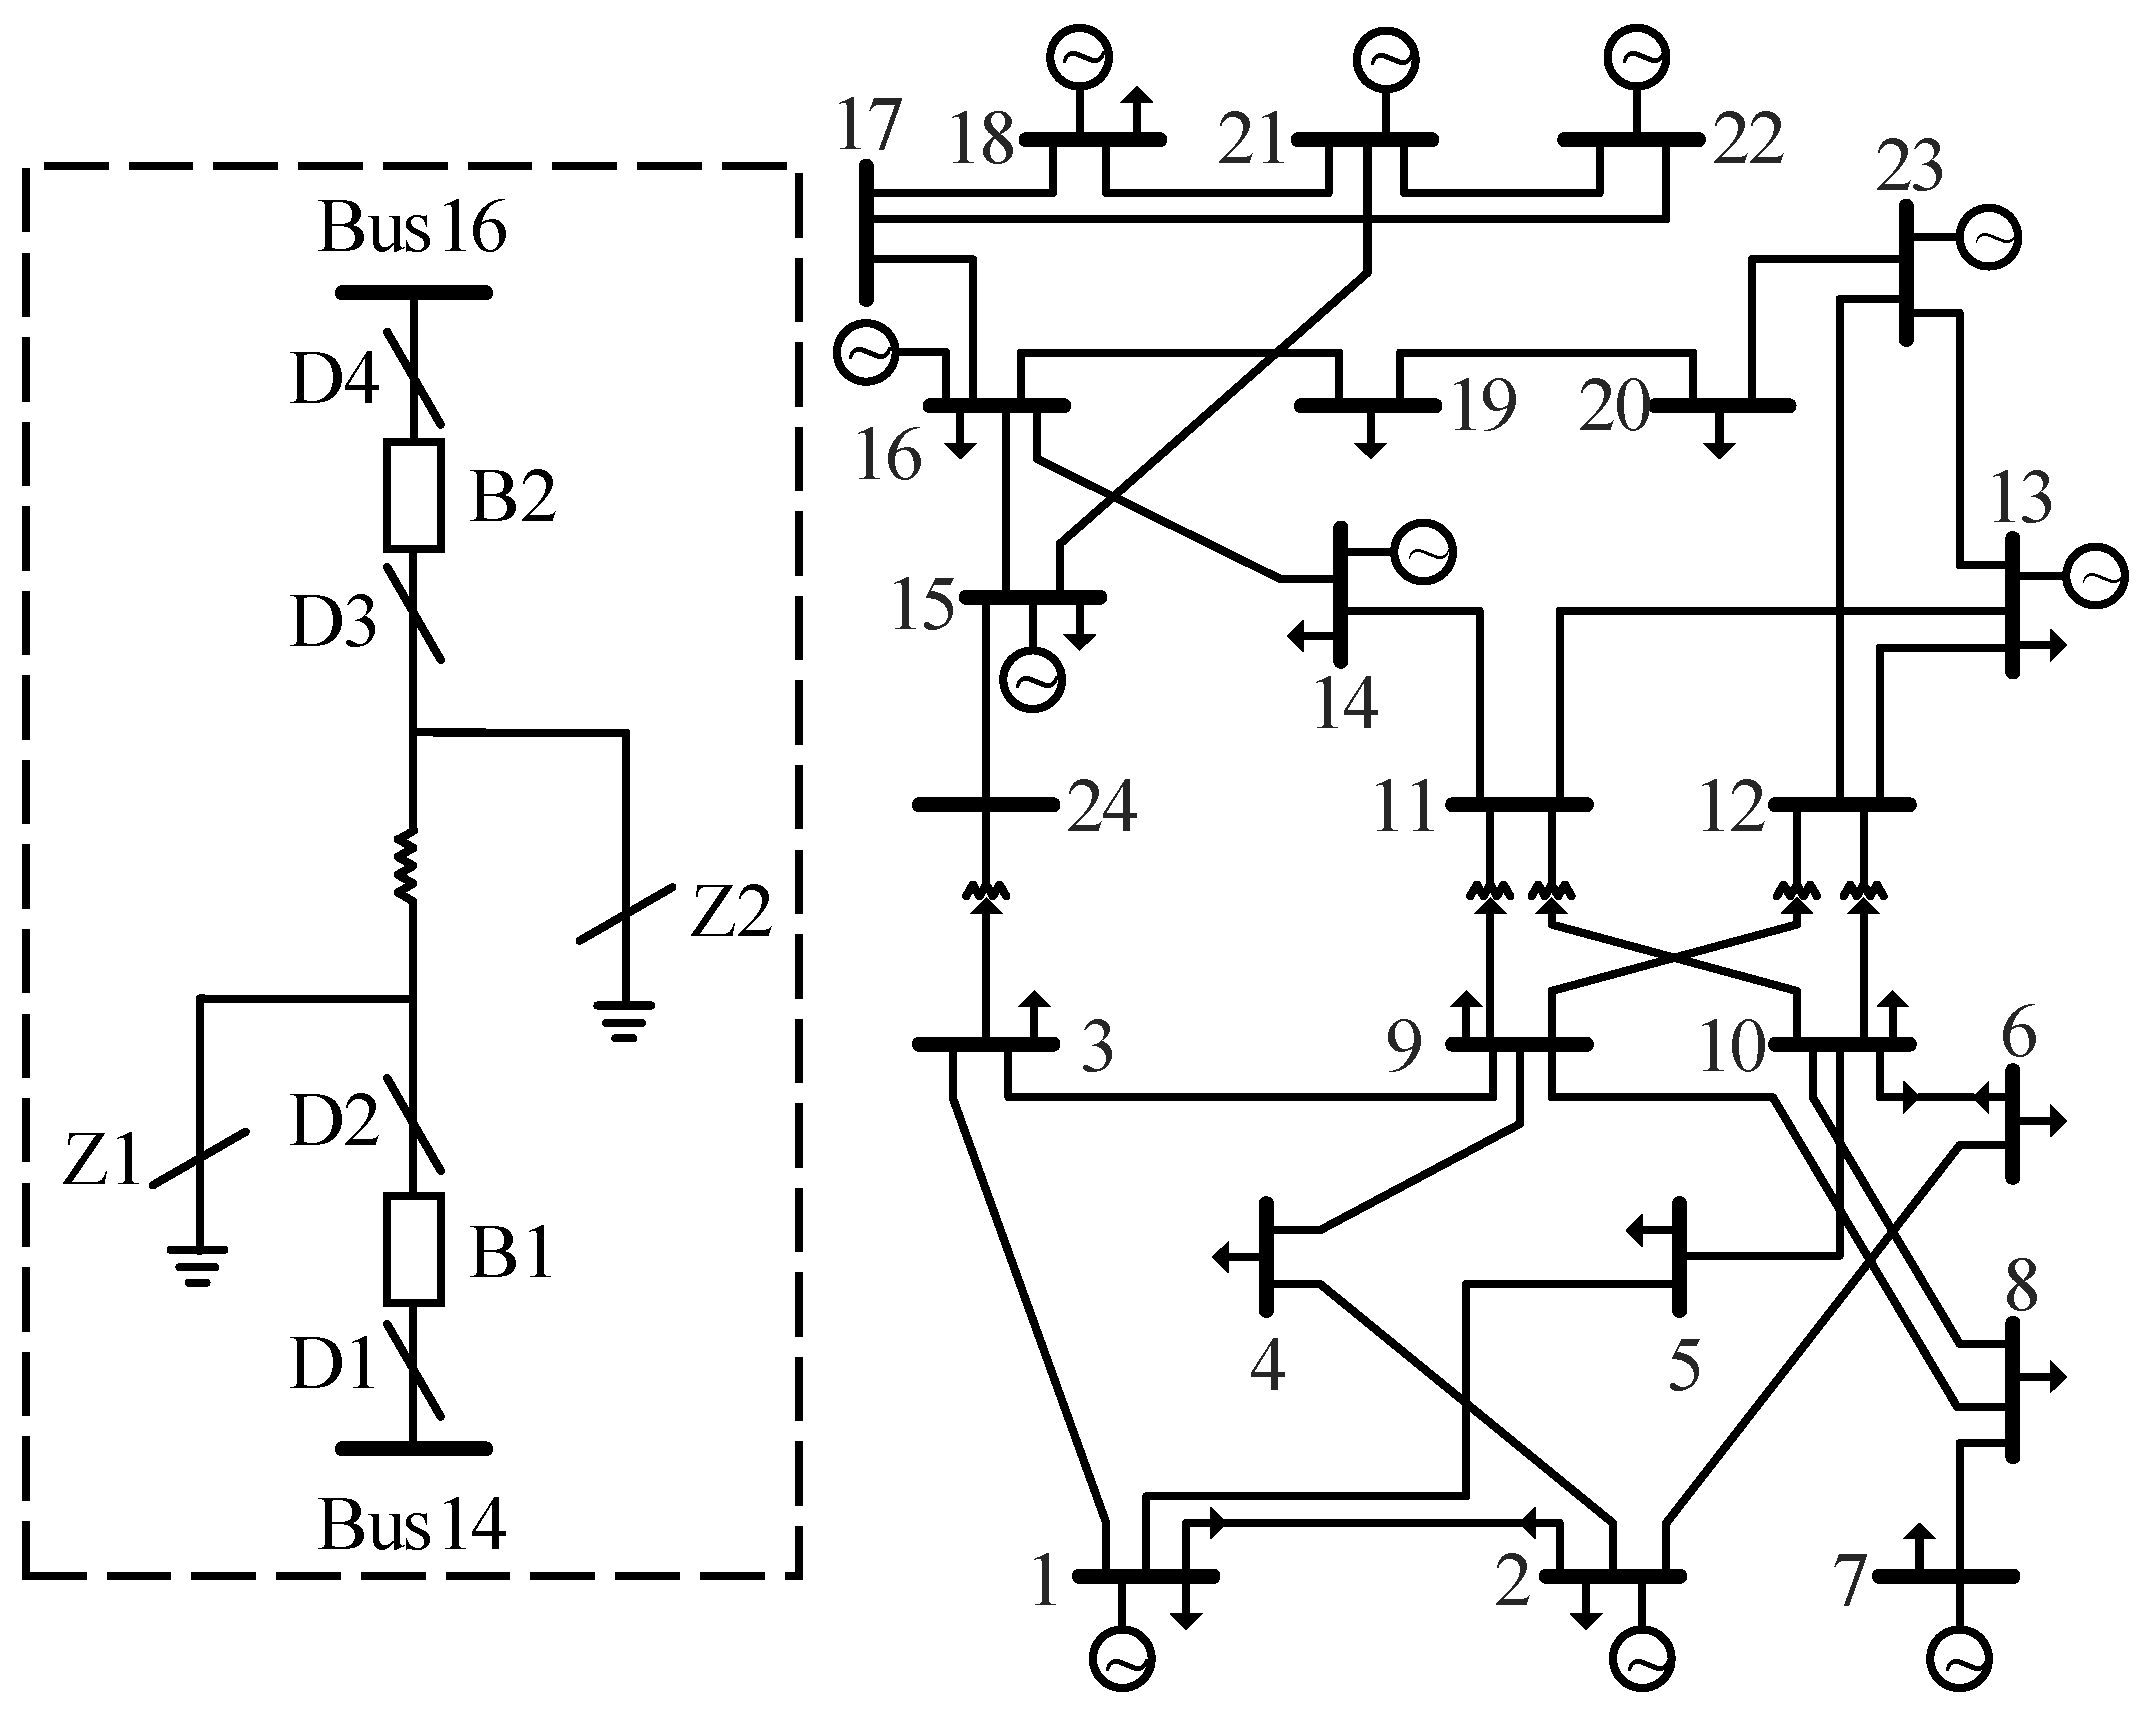
The proposed risk assessment model was executed in the general algebraic modelling system (GAMS) and the MATLAB environment using nonlinear programming (NLP) and interior point optimizer (IPOPT), and it was verified by the IEEE Reliability Test System-1979 [41]. Specifically, the optimal load shedding model in Section 3.2 was solved in GAMS based on the interior point method, and other calculations were executed in MATLAB. The power grid is shown in Figure 7. We assumed that the risk of dispatching order ‘Transition the state of line 14–16 from operation to overhaul’ was assessed by the proposed model. The operation of grounding disconnectors was not considered because it could not transition the grid state, which would not cause risk to grid. The dispatching order is shown in Table 1. The operating time of the SCs was six minutes.
4.2. Simulation Results
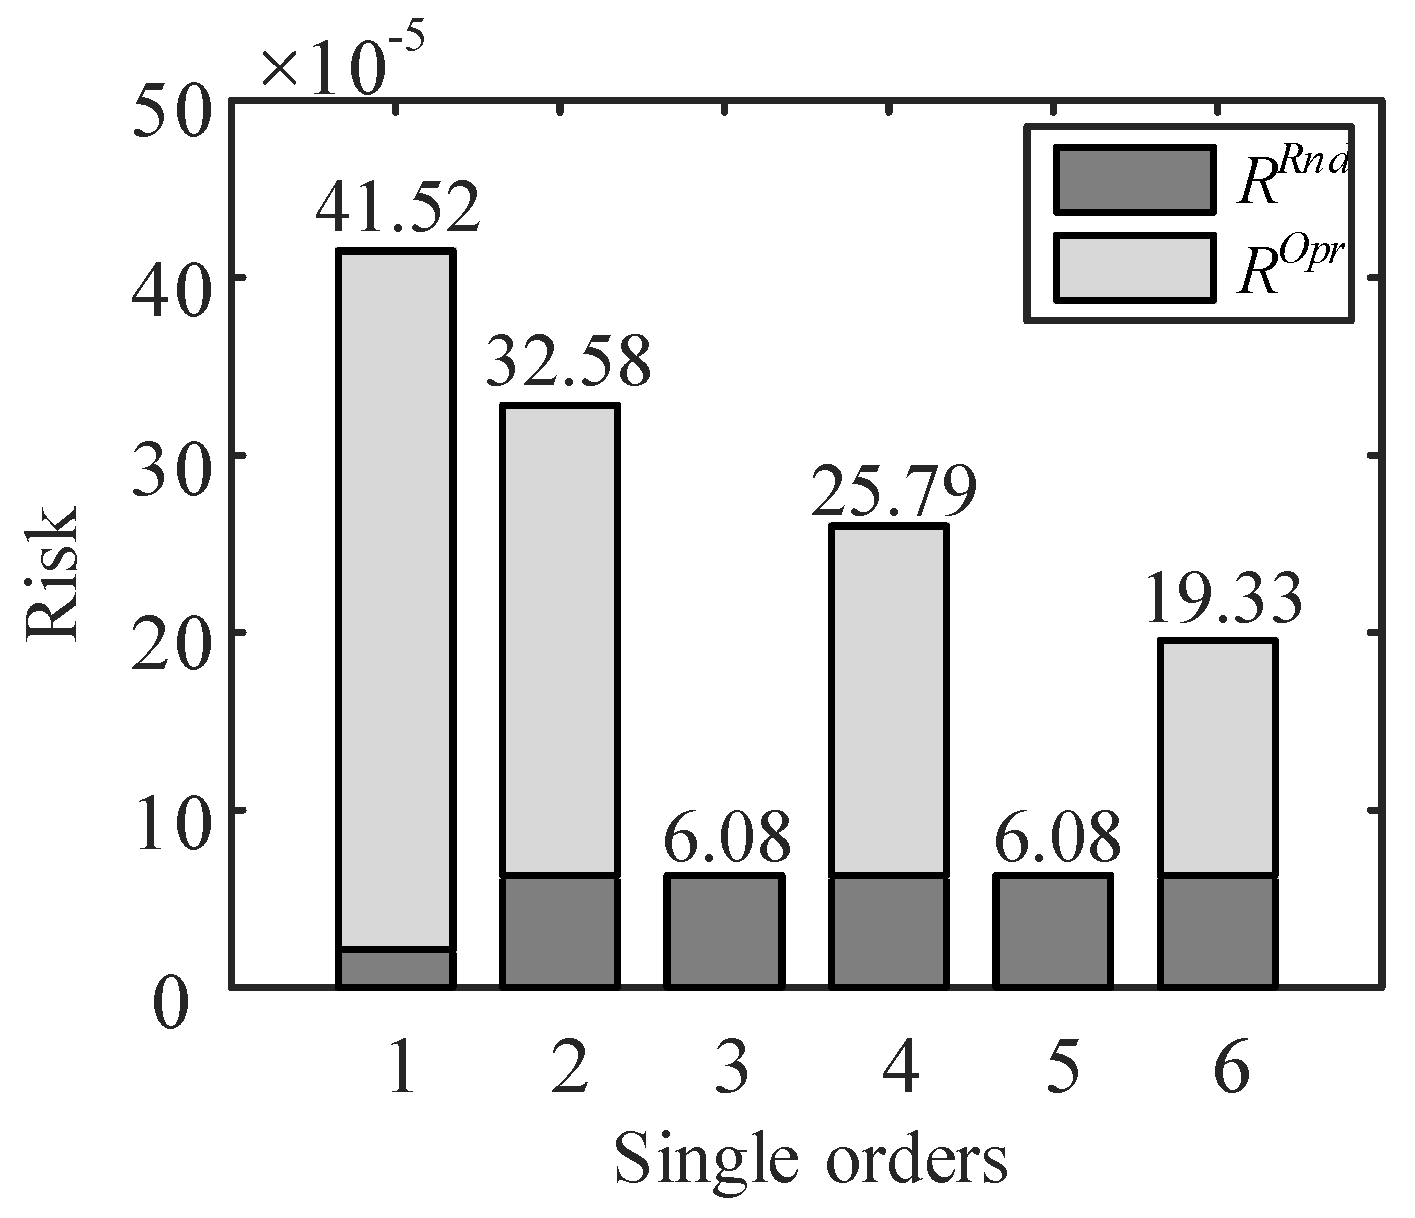
The risk results are shown in Figure 8. ROpr of the single orders 3 and 5 were zero because B1 and B2 were tripped when D2 and D3 were operated, which did not transition the grid state even though D2 and D3 were in fault. There would be grounding faults at bus 14 and bus 16 if the SCs of single order 1,4 and 2,6 were in fault, respectively. However, the grounding fault at bus 14 posed a higher risk because of the larger load loss. RRnd of single order 1 was lower than that of single orders 2–6 because of the disconnection of line 14–16, which caused lower grid reliability. The details of ROpr and RRnd are shown in Table 3.
4.3. Cyber System Impacts on Risk Results
To analyze the impact of the cyber system on risk results, we considered a test system with the two following structures for comparison:
- In CPS, both physical system and cyber system are considered.
- In PS, only physical system is considered.
4.3.1. Risk Value
The risk value and risk probability in CPS were higher than that in PS because cyber components were considered. However, there was little difference between the risk value in CPS and PS because the magnitude of risk probability was quite small. The comparison of dispatching order risk in CPS and PS is shown in Table 4.
4.3.2. Risk Consequence
The risk consequences of ROpr in CPS and PS are compared in Table 5. There would be a grounding fault at bus 14 if B1 or D1 was in fault when it was operated. Then, protection mechanisms of both bus 14 and line 14–16 responded. B2 and all the breakers connected to bus 14 were tripped, which caused line 14–16 and bus 14 to disconnect from the grid. The load loss was ultimately 1.94 (i.e., the load at bus 14).
However, the load loss would be 3.214 (both the load at bus 14 and16 and load shedding) if the failure of the cyber system is considered. After a grounding fault occurred at bus 14, the protection of bus 16 would respond if line 14–16 was in failure. Then, breakers connected to bus 16 were tripped, which caused line 14–16 and bus 14 and16 to ultimately disconnect from the grid.
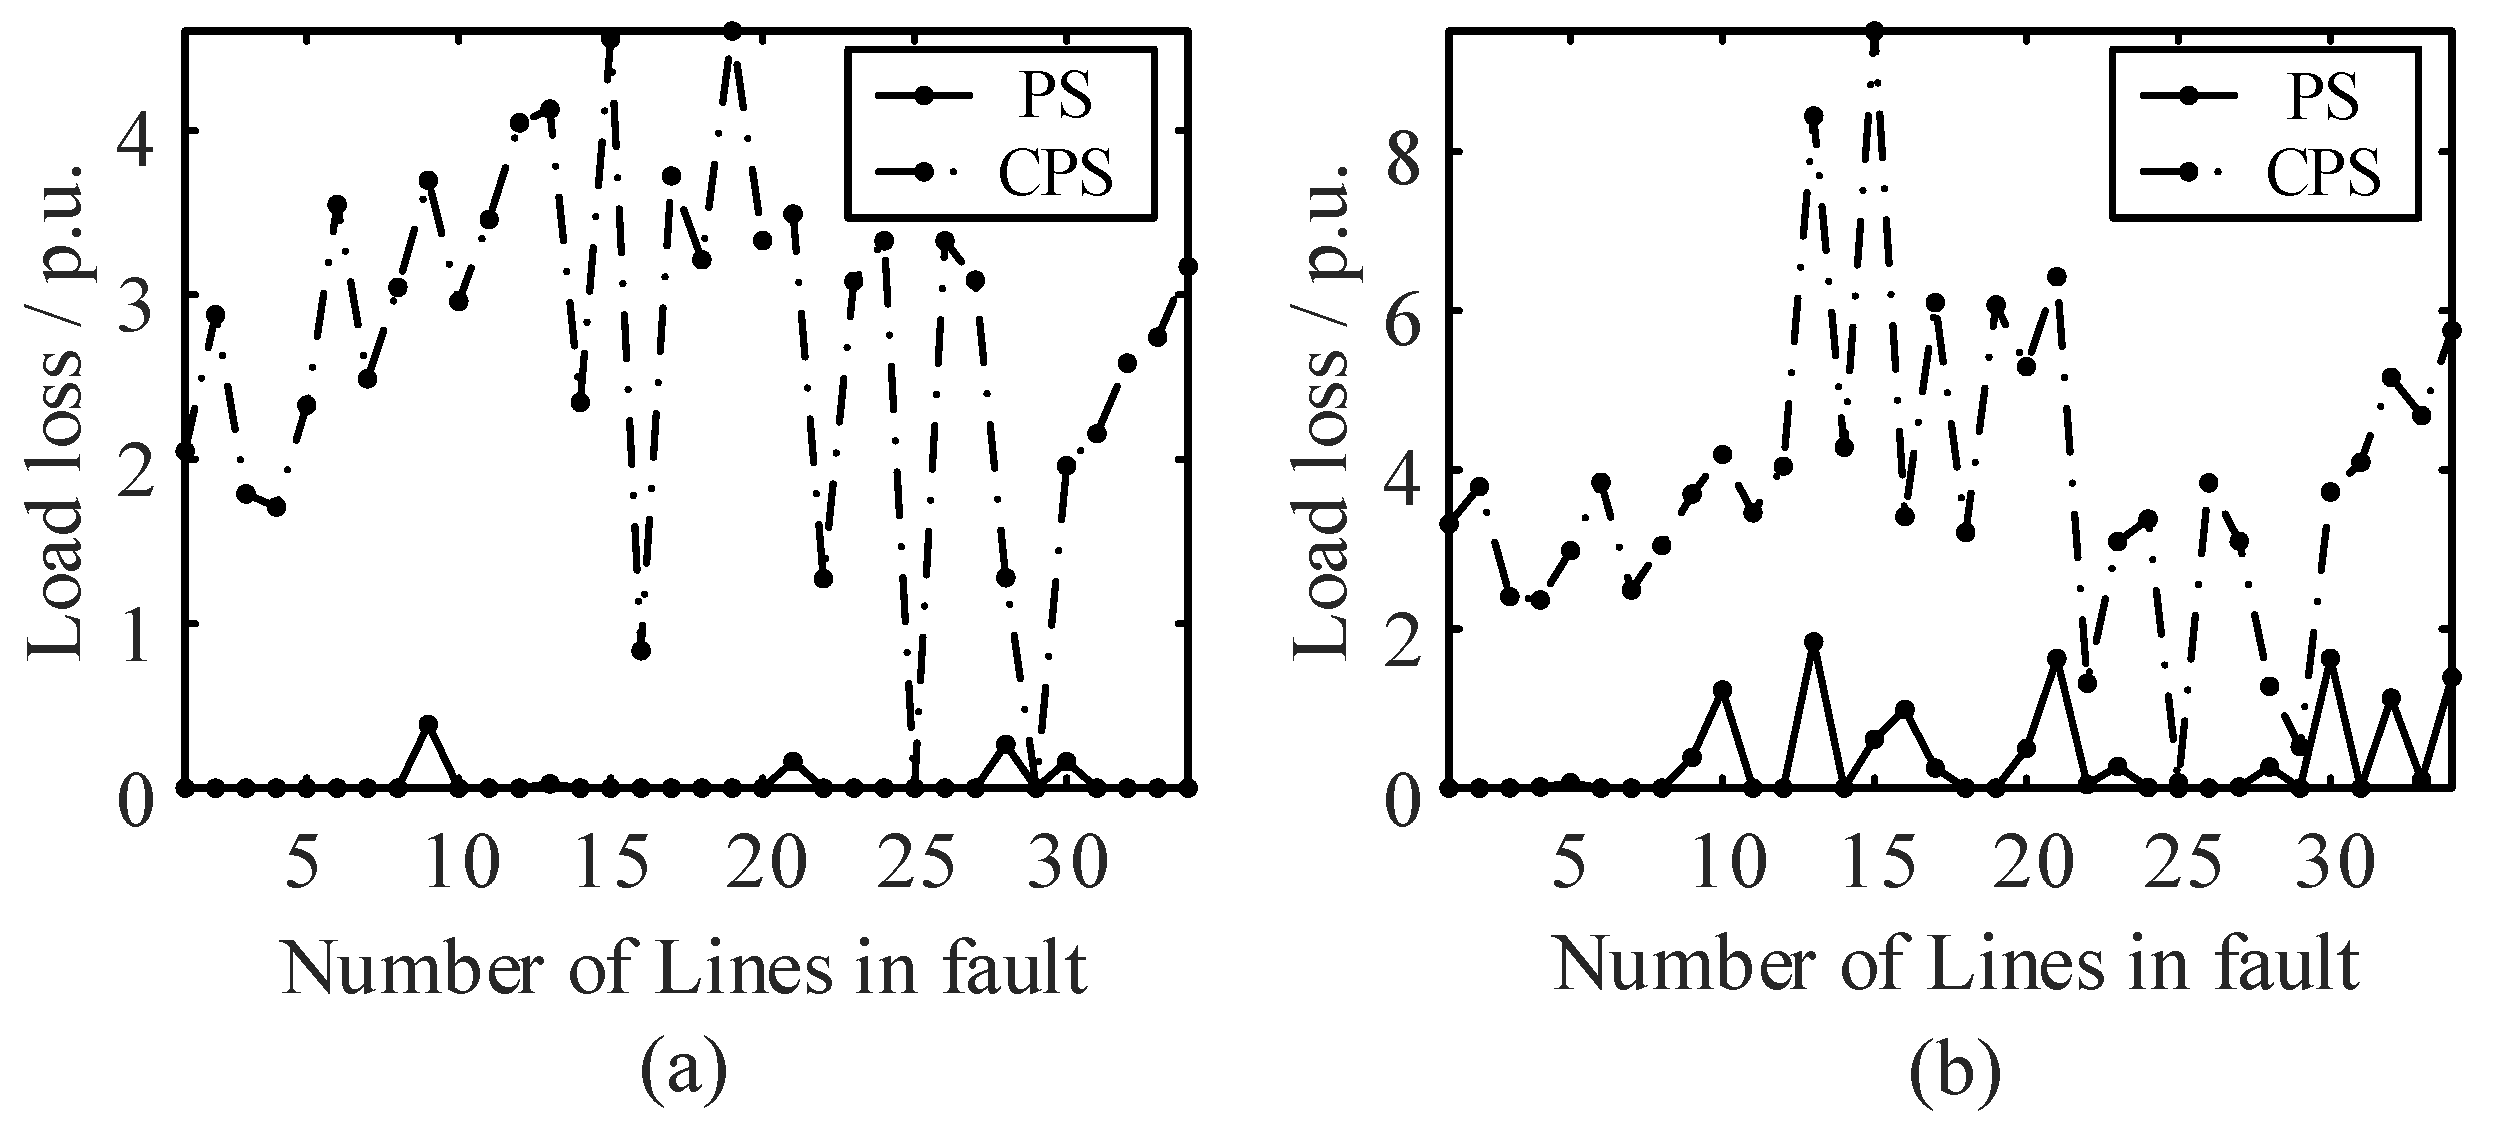
The load loss of RRnd in CPS and PS are compared in Figure 9, and that of single order 1 and 2–6 are shown in (a) and (b), respectively. Grounding faults were isolated successfully because the failure of the cyber system was not considered in PS, which caused little load loss. However, a larger load loss in CPS resulted from the failure of protection functions.
From the figure, the above comparisons show that the risk consequence in CPS was much higher than in PS, which illustrated that the impact of cyber systems could not be ignored. It seemed more practical that both the physical and cyber systems were considered for the risk assessment in the dispatching process.
4.4. Risk Results of Different Dispatching Orders
4.4.1. Dispatching Orders for Different Components
To observe the risk in the dispatching processes for different components, we compared the three following dispatching orders:
- ‘Transit the state of line 14–16 from operation to overhaul’.
- ‘Transit the state of transformer 10–12 from operation to overhaul’.
- ‘Transit the state of line 16–19 from operation to overhaul’.
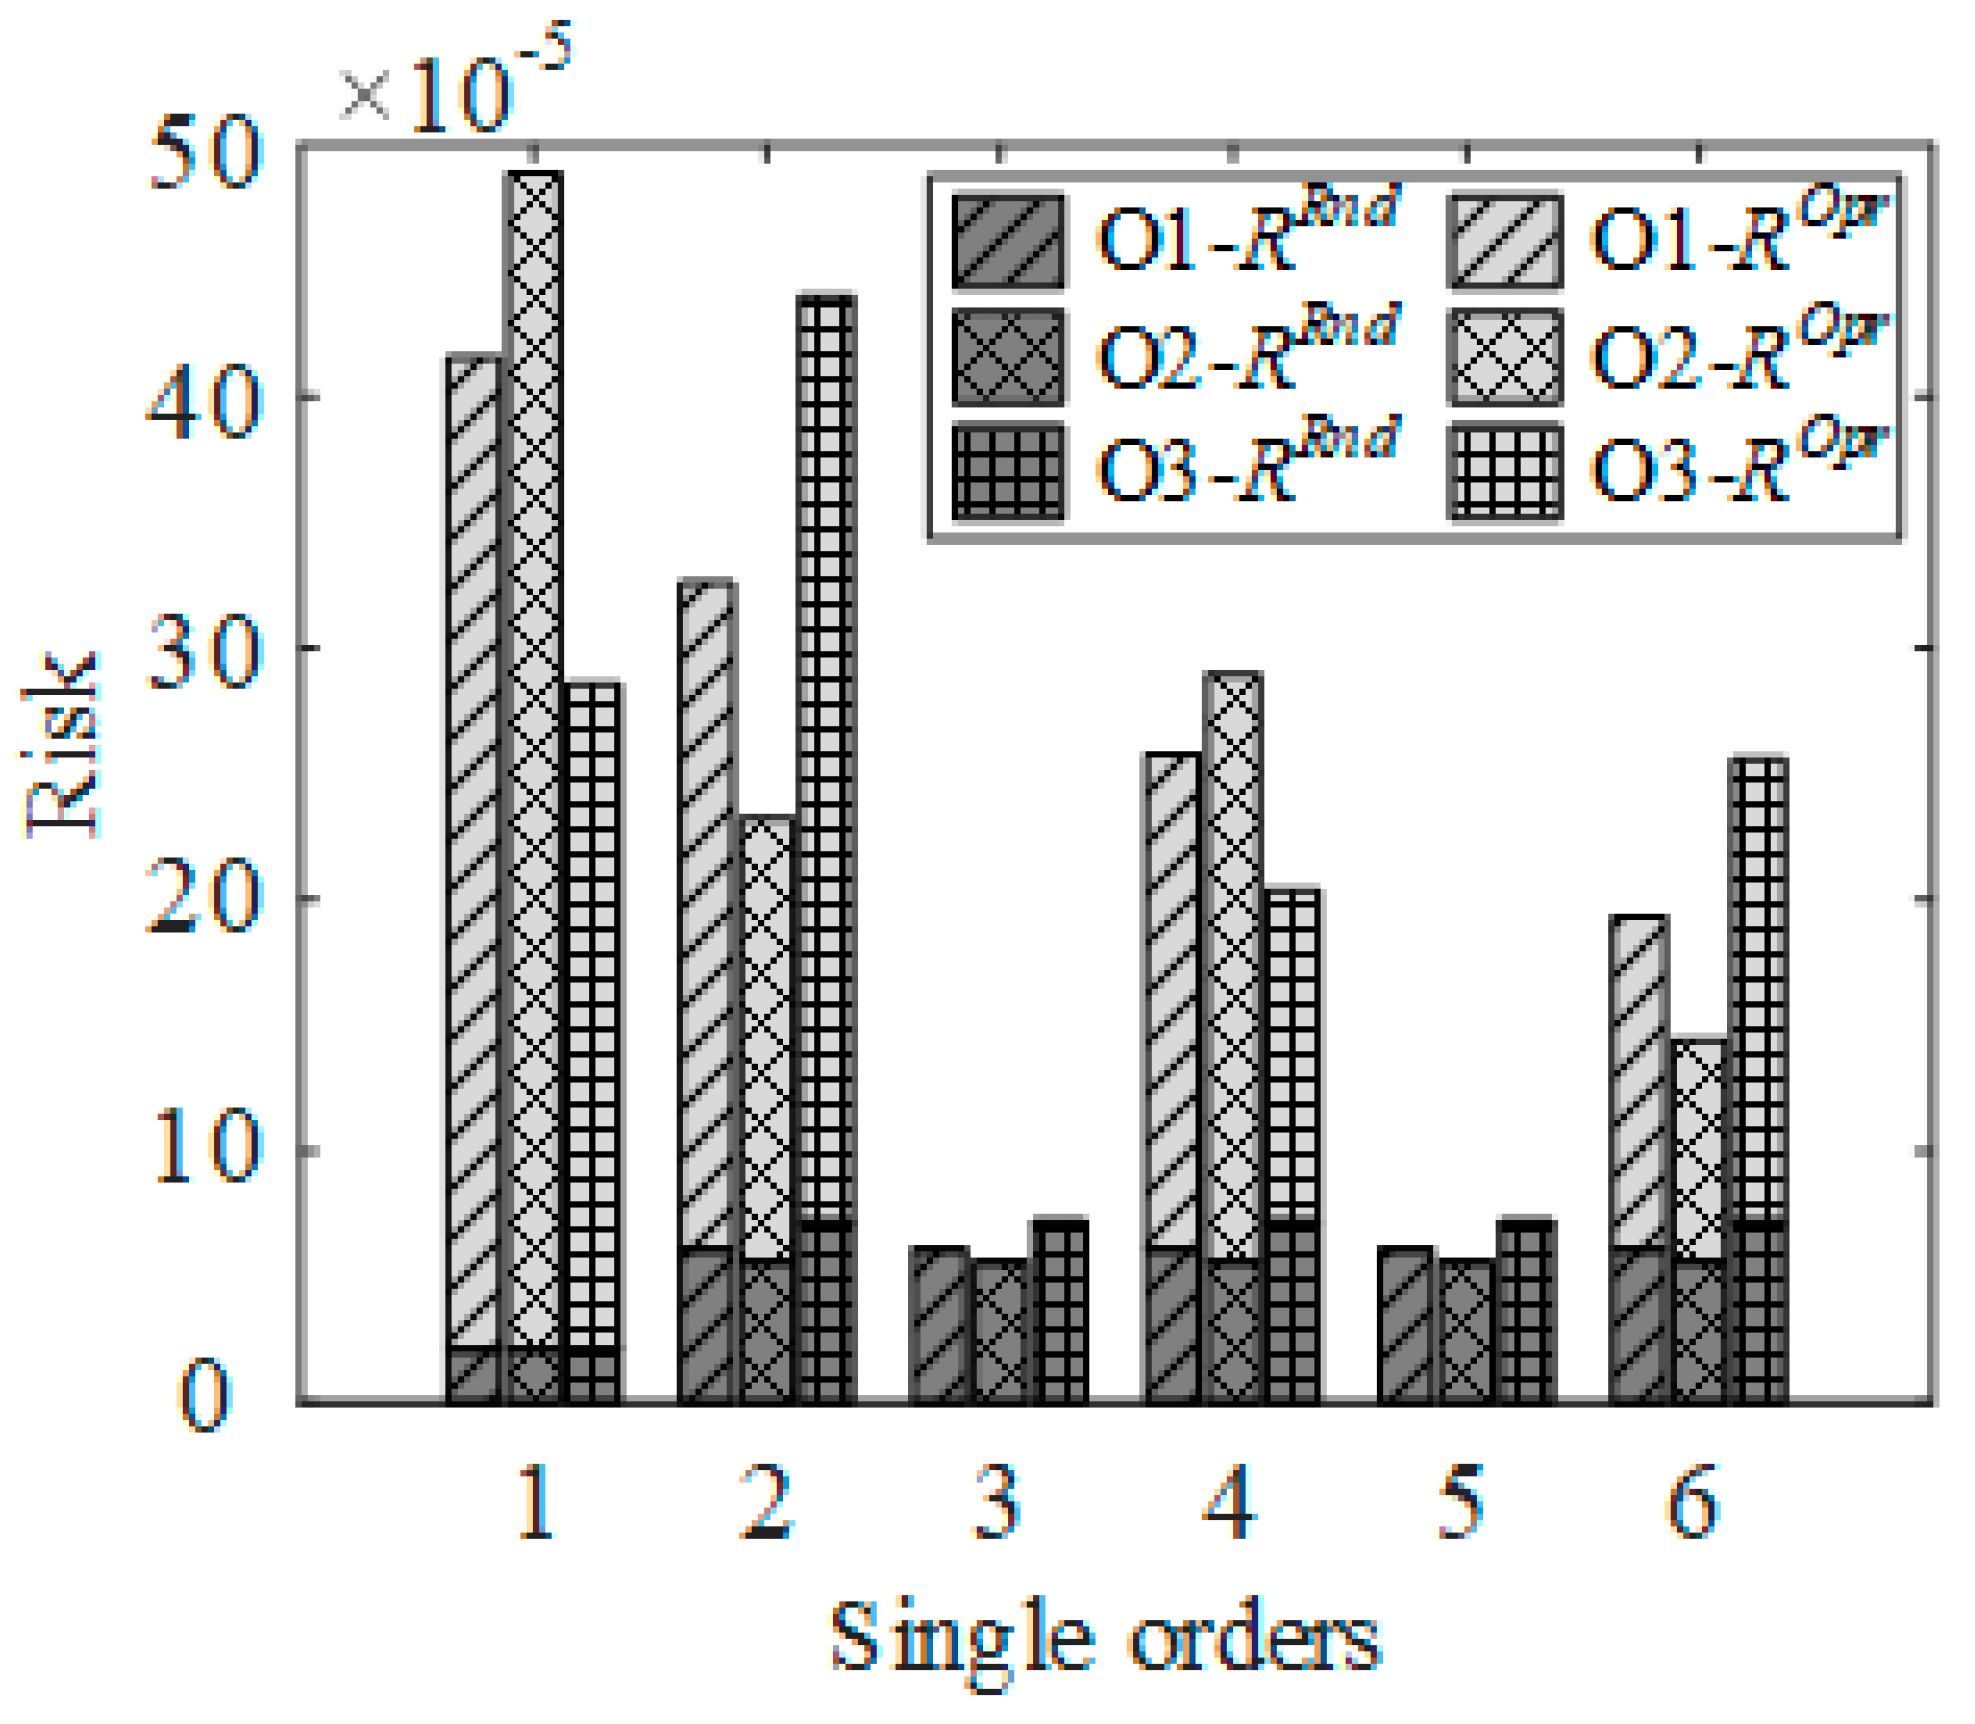
The results are shown in Figure 10. O1, O2, and O3 represent the three dispatching orders, respectively. There were differences in the risk results of different dispatching orders. The risk of single order 1 of O1 and O2, and that of single order 2 of O3 were the highest, respectively. The dispatcher could make reasonable dispatching decisions easily based on the risk results of different dispatching orders and single orders.
4.4.2. Different Types of Dispatching Orders
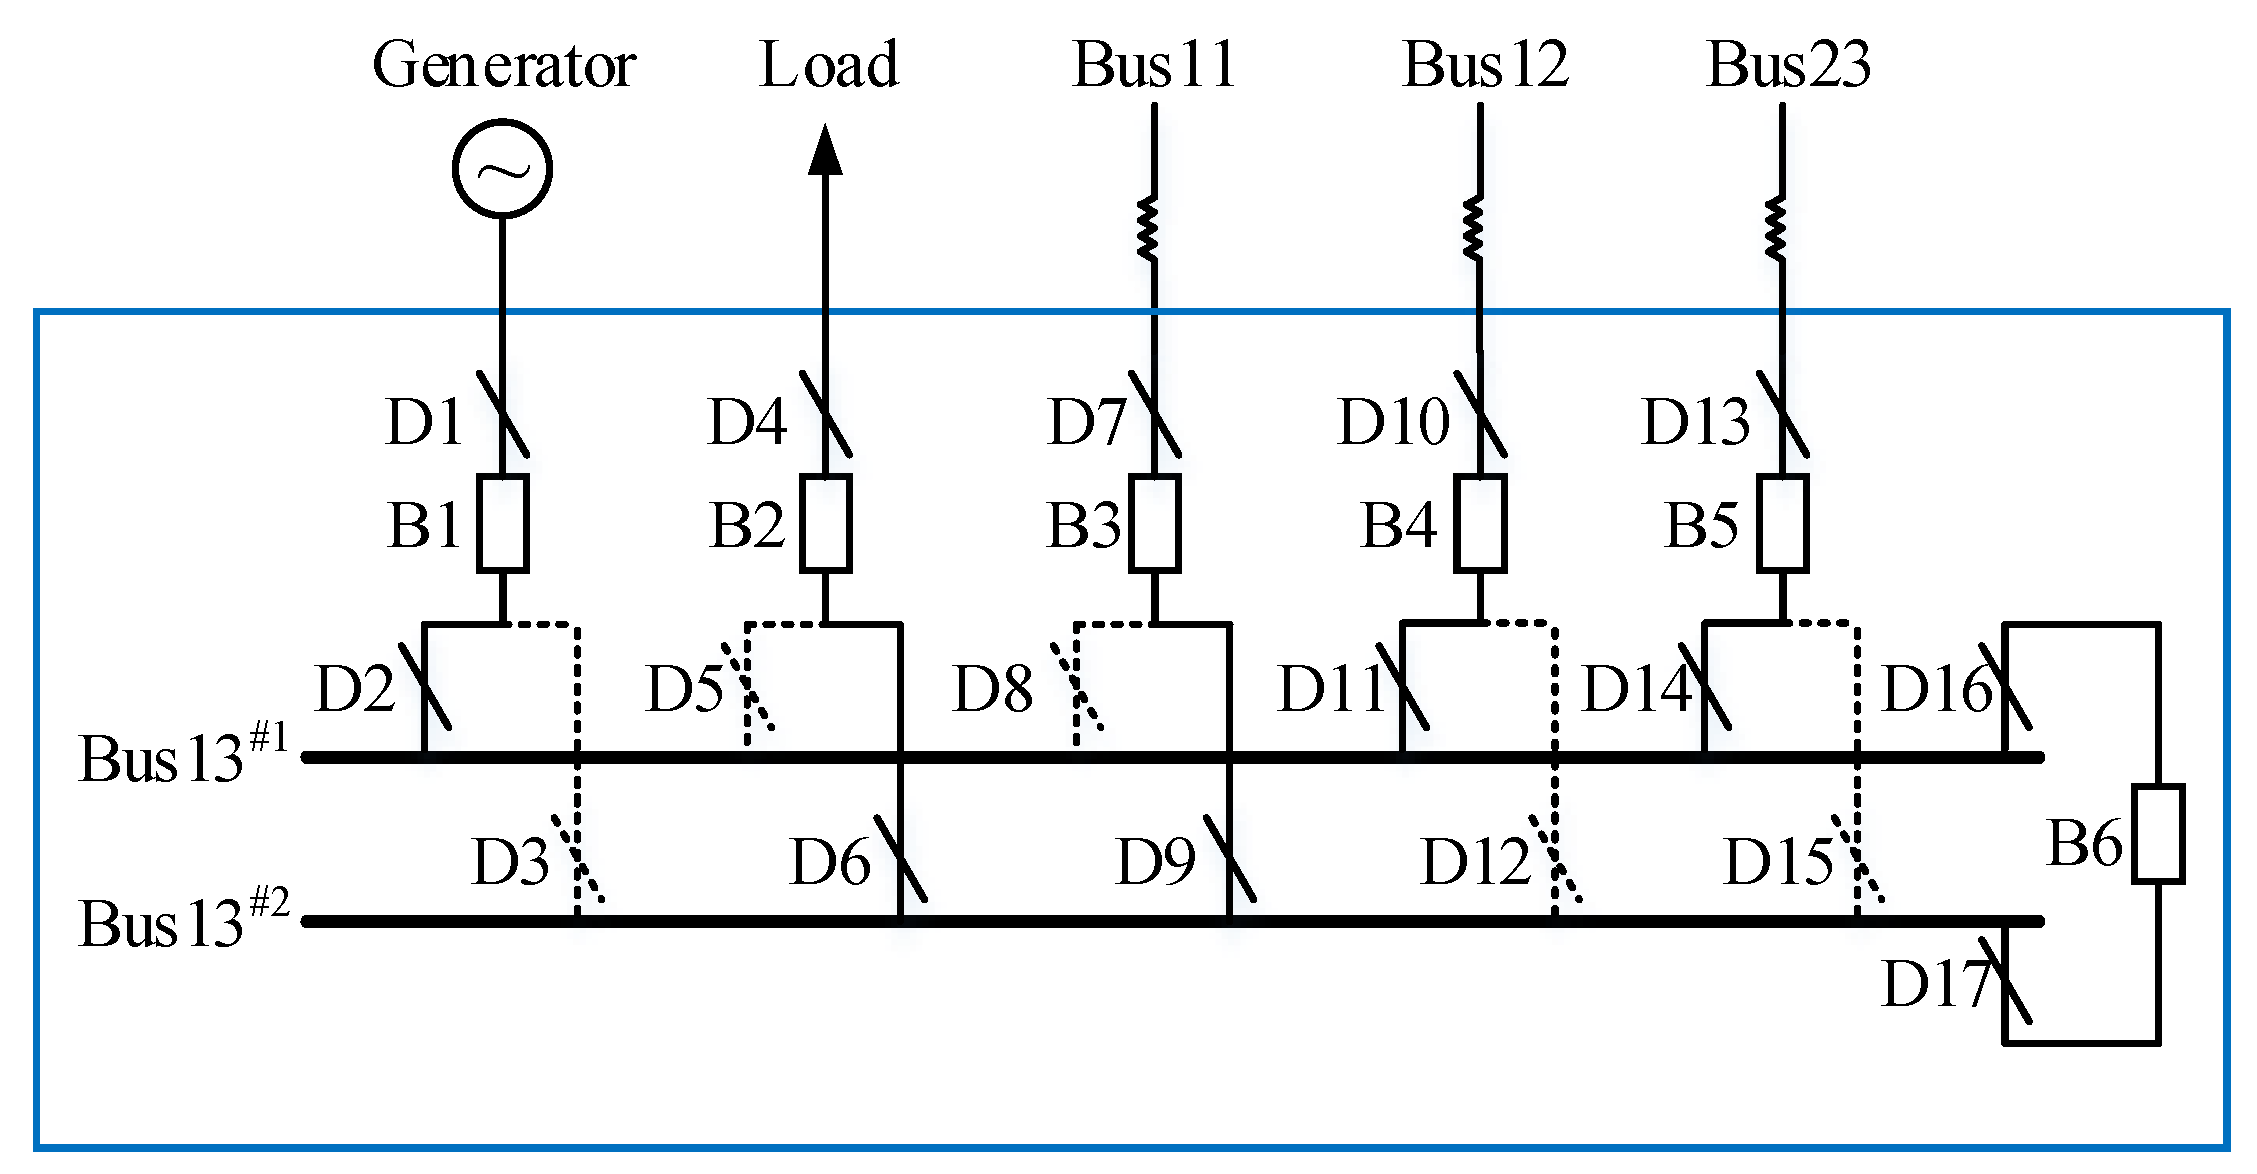
The other common type of dispatching order in the dispatching process is to change the operational bus for lines, which depends on the double-bus scheme in the substation. We assumed that bus 13 was the double-bus scheme, as shown in Figure 11 (the dotted shapes represent outage components), and the risk of dispatching order ‘Change operational bus from bus 13#1 to bus 13#2 for line 12–13′ was assessed. The dispatching order and corresponding operating SCs are shown in Table 6.
The risk of this dispatching order is shown in Table 7. RRnd of the first single order was equal to that of O1, O2, and O3 in Section 4.3.2 because of the similar grid states and operating times. However, RRnd of other single orders were less than that of O1, O2, and O3, which indicated that line 12–13 was not the key line in the grid. In single orders 2 and 5, ROpr was almost equal to zero because the risk probability was very low (only when D10 was in fault and the protection function was at the other breaker at line 12–13). Moreover, there would be loss in the generator if bus 13#1 failed, which caused a large IShd resulting from the power balance constraint. Therefore, ROpr of single orders 1 and 3 were higher than that of single orders 4 and 6.
4.5. Assessment Results of Dispatching Process Risk and Power Grid Operation Risk
A general assessment model for the operation risk in a power grid is to get the product of probabilities (in a period of time) and consequences of all random contingencies, which usually are N-1 scenarios [12,13,14]. Here, we still used the dispatching order in 4.2 to illustrate the difference between the dispatching process risk and the power grid operation risk. The result of power grid operation risk in execution time of dispatching process was 0.0003254, which was almost equal to the summation of RRnd in all single orders. In other words, the risk assessment model for dispatching process in this paper considered both the operation risk of the power grid and the risk of the operating SCs, which revealed both the overall reliability of the grid and potential contingencies when operating the SCs.
5. Conclusions
In this study, a novel model considering the impact of cyber systems is presented for a risk quantitative assessment in the dispatching process. The risk results represent both the probabilities and consequences of contingencies. In this regard, a cyber-physical switchgear state model that integrates the reliability states of both cyber system functions and switchgears is proposed, based on the transition of the switchgear state in the dispatching process. The impact of CPS component failures on the dispatching process is analyzed to get the transitions of power grid states, and to further get the contingencies that are taken into account. The risk probabilities and consequences of the power grid states are calculated to quantify the risk index. The load shedding problem is modeled as an NLP optimization model to calculate the risk consequence, which can be efficiently solved using available software packages. The proposed model is validated on an IEEE RTS79 system. The numerical results can directly expose the high-risk points in the dispatching process for dispatcher, which can direct the dispatcher to make reasonable decisions. Moreover, the risk assessment results in CPS and PS structures are compared, which shows that the risk is higher in CPS because there are more severe contingencies when cyber system failures are taken into account. The generalizability of the model is evaluated by different types of dispatching orders, including buses, transmission lines, and transformers. Finally, the general assessment model for power grid operation risk is discussed with the proposed model, which shows that the proposed model can reflect both the overall reliability of the grid and potential contingencies when operating the SCs in the dispatching process.
In the future, we will study more complex failure models and perturbations of the cyber system, such as cyber-attacks, and analyze their effects on the risk assessment in the dispatching process. In addition, we will study the impact of information perturbations on more production and operation processes in the power system, such as the operation and control of the smart distribution network and the integrated energy microgrid.
Author Contributions
B.C., H.C., and Y.Z. designed the algorithms and performed the writing; J.Z. and Y.Z. were both corresponding authors; E.M. analyzed the data; all authors approved the submitted manuscript.
Funding
The National Natural Science Foundation of China (51767002; 51867003), the Natural Science Foundation of Guangxi (2018JJB160056; 2018JJB160064; 2018JJA160176).
Acknowledgments
The authors acknowledge the National Natural Science Foundation of China (51767002; 51867003) and the Natural Science Foundation of Guangxi (2018JJB160056; 2018JJB160064; 2018JJA160176) for their support.
Conflicts of Interest
The authors declare no conflict of interest.
Nomenclature
Symbols, Abbreviations, and Acronyms
| The breaker at the other end of the same line in which breaker n is at. | |
| The event under the condition that some other events have occurred. | |
| CPS | Cyber-Physical System |
| CL | Communication Line |
| CS | Communication Switch |
| IED | Intelligent Electronic Device |
| MU | Merging Unit |
| PS | Physical System |
| SC | Switchgear Component. |
| WS | Workstation Server. |
| Sets and Indices | |
| Set of buses, index i | |
| Set of buses that disconnect from the grid after the breakers trip, index h | |
| Set of lines, indices (i, j). | |
| Set of breakers, index n | |
| Set of breakers that need to trip when the operating SC is in fault, index a. | |
| Set of breakers that need to trip when line (i, j) is in fault, index b. | |
| Set of grid states when the operating SC is in fault and the protection is in failure, index u | |
| Set of grid states when line (i, j) is in fault and the protection is in failure, index v | |
| Parameters and Constants | |
| Normal probability of WS, CL, CS, IED, and MU, respectively | |
| Normal, malfunction, and fault probability of the operating SC, respectively | |
| Fault probability of line (i, j) | |
| , | Conductance and susceptance for line (i, j), respectively |
| , | Minimum and maximum active power (MW) limit of generation at bus i, respectively |
| , | Minimum and maximum reactive power (MVar) limit of generation at bus i, respectively |
| , | Minimum and maximum voltage magnitude (p.u.) at bus i, respectively. |
| Maximum capacity (MVA) limit for line (i, j) | |
| , | Active and reactive power of load at bus i, respectively. |
| Variables | |
| , | Voltage magnitude and angle at bus i, respectively |
| , | Active and reactive power of generation at bus i, respectively |
| , | Active and reactive power of load shedding at bus i, respectively |
| , | Active and reactive power flow for line (i, j), respectively |
| Risk value of a single order in the dispatching process | |
| Risk value of the operation of the SC | |
| Risk value of random grounding fault occurrence at lines | |
| Probability of grid states or events. | |
| Risk consequence of grid states | |
| Risk consequence of load loss from disconnecting the bus | |
| Risk consequence of load shedding from operation constraints of the power system. | |
| Events and Grid states | |
| Event that control function at the operating SC is available | |
| Event that the protection function at the nth breaker is available | |
| Grid state | |
| Grid state after SC is operated in the dispatching process | |
| Grid state before SC is operated in the dispatching process | |
| Grid state if SC is operated normally | |
| Grid state if SC does not respond | |
| Grid state if SC is in fault and the protection function is normal | |
| Grid state if SC is in fault and the protection function fails | |
| Grid state after a random grounding fault occurs at line, before the SC is operated | |
| Grid state when the protection of line (i, j) is in normal after line (i, j) is in fault | |
| Grid state when the protection of line (i, j) is in failure after line (i, j) is in fault | |
References
- Amin, S.M.; Wollenberg, B.F. Toward a smart grid: Power delivery for the 21st century. IEEE Power Energy Mag. 2005, 3, 34–41. [Google Scholar] [CrossRef]
- Zhang, P.; Li, F.; Bhatt, N. Next-Generation Monitoring, Analysis, and Control for the Future Smart Control Center. IEEE Trans. Smart Grid 2010, 1, 186–192. [Google Scholar] [CrossRef]
- Xin, S.; Guo, Q.; Sun, H.; Zhang, B.; Wang, J.; Chen, C. Cyber-Physical Modeling and Cyber-Contingency Assessment of Hierarchical Control Systems. IEEE Trans. Smart Grid 2015, 6, 2375–2385. [Google Scholar] [CrossRef]
- Cai, Y.; Chen, Y.; Li, Y.; Cao, Y.; Zeng, X. Reliability Analysis of Cyber–Physical Systems: Case of the Substation Based on the IEC 61850 Standard in China. Energies 2018, 11, 2589. [Google Scholar] [CrossRef]
- Li, J.S.; Zhou, H.W.; Meng, J.; Yang, Q.; Chen, B.; Zhang, Y.Y. Carbon emissions and their drivers for a typical urban economy from multiple perspectives: A case analysis for Beijing city. Appl. Energy 2018, 226, 1076–1086. [Google Scholar] [CrossRef]
- Andersson, G.; Donalek, P.; Farmer, R.; Hatziargyriou, N.; Kamwa, I.; Kundur, P.; Martins, N.; Paserba, J.; Pourbeik, P.; Sanchez-Gasca, J.; et al. Causes of the 2003 major grid blackouts in North America and Europe, and recommended means to improve system dynamic performance. IEEE Trans. Power Syst. 2005, 20, 1922–1928. [Google Scholar] [CrossRef]
- Lin, W.; Tang, Y.; Sun, H.; Guo, Q.; Zhao, H.; Zeng, B. Blackout in Brazil Power Grid on February 4, 2011 and Inspirations for Stable Operation of Power Grid. Autom. Electr. Power Syst. 2011, 35, 1–5. [Google Scholar]
- Lai, L.-L.; Zhang, H.-T.; Mishra, S.; Ramasubramanian, D.; Lai, C.-S.; Xu, F.-Y. Lessons learned from July 2012 Indian blackout. In Proceedings of the 9th IET International Conference on Advances in Power System Control, Operation and Management (APSCOM 2012), Hong Kong, China, 18–21 November 2012; pp. 1–6. [Google Scholar]
- Liang, G.; Weller, S.-R.; Zhao, J.; Luo, F.; Dong, Z.-Y. The 2015 Ukraine blackout: Implications for false data injection attacks. IEEE Trans. Power Syst. 2017, 32, 3317–3318. [Google Scholar] [CrossRef]
- Lin, W.-M.; Yang, C.-Y.; Tu, C.-S.; Tsai, M.-T. An Optimal Scheduling Dispatch of a Microgrid under Risk Assessment. Energies 2018, 11, 1423. [Google Scholar] [CrossRef]
- Lyu, Z.; Wei, Q.; Zhang, Y.; Zhao, J.; Manla, E. Adaptive Virtual Impedance Droop Control Based on Consensus Control of Reactive Current. Energies 2018, 11, 1801. [Google Scholar] [CrossRef]
- Zhang, Z.; Yang, H.; Yin, X.; Han, J.; Wang, Y.; Chen, G. A Load-Shedding Model Based on Sensitivity Analysis in on-Line Power System Operation Risk Assessment. Energies 2018, 11, 727. [Google Scholar] [CrossRef]
- Negnevitsky, M.; Nguyen, D.H.; Piekutowski, M. Risk Assessment for Power System Operation Planning With High Wind Power Penetration. IEEE Trans. Power Syst. 2015, 30, 1359–1368. [Google Scholar] [CrossRef]
- Wang, Q.; McCalley, J.-D. Risk and “N-1” Criteria Coordination for Real-Time Operations. IEEE Trans. Power Syst. 2013, 28, 3505–3506. [Google Scholar] [CrossRef]
- Chen, S.; Onwuachumba, A.; Musavi, M.; Lerley, P. A Quantification Index for Power Systems Transient Stability. Energies 2017, 10, 984. [Google Scholar] [CrossRef]
- Huang, D.; Chen, Q.; Ma, S.; Zhang, Y.; Chen, S. Wide-Area Measurement—Based Model-Free Approach for Online Power System Transient Stability Assessment. Energies 2018, 11, 958. [Google Scholar] [CrossRef]
- Ren, C.; Xu, Y.; Zhang, Y. Post-disturbance transient stability assessment of power systems towards optimal accuracy-speed tradeoff. Prot. Control Mod. Power Syst. 2018, 3, 194–203. [Google Scholar] [CrossRef]
- Žarković, M.; Stojković, Z. Artificial intelligence based thermographic approach for high voltage substations risk assessment. IET Gener. Transm. Distrib. 2015, 9, 1935–1945. [Google Scholar] [CrossRef]
- Hamoud, G.; Toneguzzo, J.; Yung, C.; Wong, A. Methodology for Assessing Safety Risk From Failure of Transmission Station Equipment. IEEE Trans. Power Deliv. 2007, 22, 1972–1978. [Google Scholar] [CrossRef]
- Li, W.; Lu, J. Risk Evaluation of Combinative Transmission Network and Substation Configurations and its Application in Substation Planning. IEEE Trans. Power Syst. 2005, 20, 1144–1150. [Google Scholar] [CrossRef]
- Liu, J.; Chao, Z.; Zhong, H.; Hu, S.; Jia, H. The Risk Assessment Method for the Dispatching Operation Based on Generalized Sections. Trans. China Electrotech. Soc. 2016, 3, 155–163. [Google Scholar]
- Luo, W.; Xie, M.; Liu, M.; Liu, J.; Hu, S. Modeling and application of power grid dispatching operation risk consequences. In Proceedings of the 2016 China International Conference on Electricity Distribution (CICED), Xi’an, China, 10–13 August 2016; pp. 1–6. [Google Scholar]
- Lu, D.; Hou, K.; Zeng, Y.; Wei, W.; Guo, L. A risk assessment approach for dispatching operations based on critical equipment search. In Proceedings of the 2015 IEEE Power & Energy Society General Meeting, Denver, CO, USA, 26–30 July 2015; pp. 1–5. [Google Scholar]
- Liu, J.; Hu, S.; Chen, D.; Li, B. A dispatching operation risk assessment method based on real-time probabilistic model. In Proceedings of the 2013 IEEE International Conference of IEEE Region 10 (TENCON 2013), Xi’an, China, 22–25 October 2013; pp. 1–4. [Google Scholar]
- Xie, M.; Yin, Y.; Lu, E.; Hu, S. Study on Human Factor Risk Quantification and Evaluation Model in Power Grid Dispatching Risk Assessment. In Proceedings of the 2016 China International Conference on Electricity Distribution (CICED), Xi’an, China, 10–13 August 2016; pp. 1–5. [Google Scholar]
- Ashok, A.; Govindarasu, M.; Wang, J. Cyber-Physical Attack-Resilient Wide-Area Monitoring, Protection, and Control for the Power Grid. Proc. IEEE 2017, 105, 1389–1407. [Google Scholar] [CrossRef]
- Liu, X.; Shahidehpour, M.; Li, Z.; Liu, X.; Cao, Y.; Li, Z. Power System Risk Assessment in Cyber Attacks Considering the Role of Protection Systems. IEEE Trans. Smart Grid 2017, 8, 572–580. [Google Scholar] [CrossRef]
- Vellaithurai, C.; Srivastava, A.; Zonouz, S.; BerthierM, R. CPINDEX: Cyber-Physical Vulnerability Assessment for Power-Grid Infrastructures. IEEE Trans. Smart Grid 2015, 6, 566–575. [Google Scholar] [CrossRef]
- Gao, H.; Dai, Z.; Peng, Y.; Lu, H. Cyber Security Risk Assessment of Communication Network of Substation Based on Improved Grey Clustering. In Proceedings of the 2014 Tenth International Conference on Intelligent Information Hiding and Multimedia Signal Processing, Kitakyushu, Japan, 27–29 August 2014; pp. 524–527. [Google Scholar]
- Taylor, C.; Oman, P.; Krings, A. Assessing Power Substation Network Security and Survivability: A Work in Progress Report. In Proceedings of the International Conference on Security and Management, SAM’03, Las Vegas, NV, USA, 23–26 June 2003; pp. 1–7. [Google Scholar]
- Falahati, B.; Fu, Y. A study on interdependencies of cyber-power networks in smart grid applications. In Proceedings of the 2012 IEEE PES Innovative Smart Grid Technologies (ISGT), Washington, DC, USA, 16–20 January 2012; pp. 1–8. [Google Scholar]
- Falahati, B.; Fu, Y.; Wu, L. Reliability assessment of smart grid considering direct cyber-power interdependencies. IEEE Trans. Smart Grid 2012, 3, 1515–1524. [Google Scholar] [CrossRef]
- Falahati, B.; Fu, Y. Reliability assessment of smart grids considering indirect cyber-power interdependencies. IEEE Trans. Smart Grid 2014, 5, 1677–1685. [Google Scholar] [CrossRef]
- Lei, H.; Singh, C.; Sprintson, A. Reliability Modeling and Analysis of IEC 61850 Based Substation Protection Systems. IEEE Trans. Smart Grid 2014, 5, 2194–2202. [Google Scholar] [CrossRef]
- Lei, H.; Singh, C. Non-Sequential Monte Carlo Simulation for Cyber-Induced Dependent Failures in Composite Power System Reliability Evaluation. IEEE Trans. Power Syst. 2017, 32, 1064–1072. [Google Scholar]
- Liu, Y.; Lu, D.; Deng, L.; Bai, T.; Hou, K.; Zeng, Y. Risk assessment for the cascading failure of electric cyber-physical system considering multiple information factors. IET Cyber-Phys. Syst. Theory Appl. 2017, 2, 155–160. [Google Scholar] [CrossRef]
- Li, M. Risk Analysis of Differential Protection Caused by the Communication Delay and Error; Nanjing University of Posts and Telecommunications: Nanjing, China, 2015. [Google Scholar]
- Zhao, D.; Sun, Y. A preliminarily analysis of characteristics of code error and time delay of protective relaying signals transmitted by SDH optical fiber communication system. Power Syst. Technol. 2002, 26, 66–70. [Google Scholar]
- Huang, J.; Ge, S.; Han, J.; Li, H.; Zhou, X.; Liu, H.; Wang, B.; Chen, Z. A diagnostic method for distribution networks based on power supply safety standards. Prot. Control Mod. Power Syst. 2016, 1, 63–70. [Google Scholar] [CrossRef]
- Liu, J.; Zheng, H.; Zhang, Y.; Li, X.; Fang, J.; Liu, Y.; Liao, C.; Li, Y.; Zhao, J. Dissolved Gases Forecasting Based on Wavelet Least Squares Support Vector Regression and Imperialist Competition Algorithm for Assessing Incipient Faults of Transformer Polymer Insulation. Polymers 2019, 11, 85. [Google Scholar] [CrossRef]
- Zhang, Y.; Zheng, H.; Liu, J. An Anomaly Identification Model for Wind Turbine State Parameters. J. Clean. Prod. 2018, 195, 1214–1227. [Google Scholar] [CrossRef]
- Liu, J.; Fan, X.; Zheng, H.; Zhang, Y.; Zhang, C.; Lai, B.; Wang, J.; Ren, G.; Zhang, E. Aging condition assessment of transformer oil-immersed cellulosic insulation based upon the average activation energy method. Cellulose 2019. [Google Scholar] [CrossRef]
- Subcommittee, P.-M. IEEE Reliability Test System. IEEE Trans. Power Appar. Syst. 1979, 98, 2047–2054. [Google Scholar] [CrossRef]
Figure 1.
Analysis of the dispatching process based on a group of single orders.

Figure 2.
Cyber-Physical System (CPS) structure in a substation.

Figure 3.
The dependent components of cyber system functions at switchgear components (SCs) in the same substation.
Figure 3.
The dependent components of cyber system functions at switchgear components (SCs) in the same substation.

Figure 4.
The transition of grid state after breaker D is operated.

Figure 5.
The transitions of grid states in the dispatching process.

Figure 6.
Risk assessment process.

Figure 7.
The IEEE Reliability Test System-1979.

Figure 8.
Risk assessment results.

Figure 9.
Comparison of risk consequences of random grounding fault in a CPS and a PS: (a) line 14–16 is connected; and (b) line 14–16 is disconnected.
Figure 9.
Comparison of risk consequences of random grounding fault in a CPS and a PS: (a) line 14–16 is connected; and (b) line 14–16 is disconnected.

Figure 10.
Comparison of risk results of different dispatching orders.

Figure 11.
Double-bus scheme for bus 13.


Table 1.
Dispatching order.
| Single Order | Operation | Switchgear Component | Operating Time |
|---|---|---|---|
| 1 | tripping | B1 | 6 min |
| 2 | tripping | B2 | 6 min |
| 3 | tripping | D2 | 6 min |
| 4 | tripping | D1 | 6 min |
| 5 | tripping | D3 | 6 min |
| 6 | tripping | D4 | 6 min |
Table 2.
Reliability parameter and failure probability of some CPS components.
| Cyber Component | MTTF/Year | /Year | Failure Probability |
|---|---|---|---|
| WS | 14.27 | 0.07 | 0.011612 |
| CS | 50 | 0.02 | 0.003328 |
| IED | 19.18 | 0.052 | 0.008653 |
| MU | 19.18 | 0.052 | 0.008653 |
| CL | 1341.32 | 0.000746 | 0.000124 |
| Switchgear Component | Normal | Malfunction | Fault |
| Breaker | 0.99 | 0.0098 | 0.0002 |
| Disconnector | 0.99 | 0.0099 | 0.0001 |
Table 3.
Risk of dispatching order.
| Single Order | ||||||
|---|---|---|---|---|---|---|
| 1 | 0 | 0 | 37.62 | 1.789 | 1.003 | 1.113 |
| 2 | 0 | 0 | 24.71 | 1.789 | 4.53 | 1.555 |
| 3 | 0 | 0 | 0 | 0 | 4.53 | 1.555 |
| 4 | 0 | 0 | 18.81 | 0.894 | 4.53 | 1.555 |
| 5 | 0 | 0 | 0 | 0 | 4.53 | 1.555 |
| 6 | 0 | 0 | 12.355 | 0.894 | 4.53 | 1.555 |
Table 4.
Comparison of dispatching order risk in a CPS and a physical system (PS).
| Single Order | ||||||
|---|---|---|---|---|---|---|
| CPS | PS | CPS | PS | CPS | PS | |
| 1 | 39.408 | 38.8 | 2.116 | 1.411 | 41.524 | 40.211 |
| 2 | 26.498 | 25.484 | 6.084 | 5.234 | 32.582 | 30.718 |
| 3 | 0 | 0 | 6.084 | 5.234 | 6.084 | 5.234 |
| 4 | 19.704 | 19.4 | 6.084 | 5.234 | 25.788 | 24.634 |
| 5 | 0 | 0 | 6.084 | 5.234 | 6.084 | 5.234 |
| 6 | 13.249 | 12.742 | 6.084 | 5.234 | 19.333 | 17.976 |
Table 5.
Comparison of risk consequences in the operation of SCs in a CPS and a PS.
| Single Order | ||||||
|---|---|---|---|---|---|---|
| CPS | PS | CPS | PS | CPS | PS | |
| 1 | 2.94 | 1.94 | 0.274 | 0 | 3.214 | 1.94 |
| 2 | 2.94 | 1 | 0.274 | 0.274 | 3.214 | 1.274 |
| 3 | 0 | 0 | 0 | 0 | 0 | 0 |
| 4 | 2.94 | 1.94 | 0.274 | 0 | 3.214 | 1.94 |
| 5 | 0 | 0 | 0 | 0 | 0 | 0 |
| 6 | 2.94 | 1 | 0.274 | 0.274 | 3.214 | 1.274 |
Table 6.
The dispatching order ‘Change operational bus from bus 13#1 to bus 13#2 for line 12–13′.
| Single Order | Operation | Switchgear Component | Operating Time |
|---|---|---|---|
| 1 | tripping | B4 | 6 min |
| 2 | tripping | D10 | 6 min |
| 3 | tripping | D11 | 6 min |
| 4 | closing | D12 | 6 min |
| 5 | closing | D10 | 6 min |
| 6 | closing | B4 | 6 min |
Table 7.
Risk of the dispatching order.
| Single Order | |||
|---|---|---|---|
| 1 | 70.301 | 2.116 | 72.47 |
| 2 | 0.254 | 3.230 | 3.484 |
| 3 | 35.998 | 3.230 | 39.228 |
| 4 | 11.390 | 3.230 | 14.620 |
| 5 | 0.254 | 3.230 | 3.484 |
| 6 | 22.580 | 3.230 | 25.810 |
© 2019 by the authors. Licensee MDPI, Basel, Switzerland. This article is an open access article distributed under the terms and conditions of the Creative Commons Attribution (CC BY) license (http://creativecommons.org/licenses/by/4.0/).
Share and Cite
MDPI and ACS Style
Chen, B.; Chen, H.; Zhang, Y.; Zhao, J.; Manla, E. Risk Assessment for the Power Grid Dispatching Process Considering the Impact of Cyber Systems. Energies 2019, 12, 1084. https://doi.org/10.3390/en12061084
AMA Style
Chen B, Chen H, Zhang Y, Zhao J, Manla E. Risk Assessment for the Power Grid Dispatching Process Considering the Impact of Cyber Systems. Energies. 2019; 12(6):1084. https://doi.org/10.3390/en12061084
Chicago/Turabian StyleChen, Biyun, Haoying Chen, Yiyi Zhang, Junhui Zhao, and Emad Manla. 2019. "Risk Assessment for the Power Grid Dispatching Process Considering the Impact of Cyber Systems" Energies 12, no. 6: 1084. https://doi.org/10.3390/en12061084
Note that from the first issue of 2016, this journal uses article numbers instead of page numbers. See further details here.