A New Method of Selecting the Airlift Pump Optimum Efficiency at Low Submergence Ratios with the Use of Image Analysis


1
Faculty of Mechanical Engineering, Opole University of Technology, ul. Mikołajczyka 5, 45-271 Opole, Poland
2
Kelvion Sp. z o.o.., ul. Kobaltowa 2, 45-641 Opole, Poland
*
Author to whom correspondence should be addressed.
Energies 2019, 12(4), 735; https://doi.org/10.3390/en12040735
Submission received: 2 January 2019
/
Revised: 7 February 2019
/
Accepted: 19 February 2019
/
Published: 22 February 2019
(This article belongs to the Special Issue Selected Papers from SDEWES 2018 Conferences on Sustainable Development of Energy, Water and Environment Systems)
Abstract
:This paper presents experimental studies on the optimization of two-phase fluid flow in an airlift pump. Airlift pumps, also known as mammoth pumps, are devices applied for vertical transport of liquids with the use of gas. Their operating principle involves the existence of a density gradient. This paper reports the results of experimental studies into the hydrodynamic effects of the airlift pump. The studies involved optical imaging of two-phase gas-liquid flow in a riser pipe. The visualization was performed with high-speed visualization techniques. The studies used a transparent model of airlift pump with a rectangular cross-section of the riser. The assessment of the airlift pump operation is based on the image grey-level analysis to provide the identification of two-phase flow regimes. The scope of the study also involved the determination of void fraction and pressure drops. The tests were carried out in a channel with dimensions 35 × 20 × 2045 mm with the gas flux range 0.2–15.0 m3/h. For the assessment of the two-phase flow pattern Probability Density Function (PDF) was applied. On the basis of the obtained results, a new method for selecting the optimum operating regime of airlift pump was derived. This method provides the finding of stability and efficiency of liquid transport. It can also be applied to determine the correlation between the total lifting efficiency and the required gas flux for proper operation of the airlift pump.
1. Introduction
An airlift pump in comparison to other equipment used for liquid transportation doesn’t have moving parts. This represents an advantage in applications where there is a need for reliability, simplicity and compact design. The literature reports a variety of applications in which airlift pumps find uses as an optimum solution. A very extensive and detailed review of the literature in the field of airlift pumps is presented in [1], where the authors discuss the theory of operations, numerical and experimental methods possible to apply in the airlift pumping research. They also indicate the most common areas of application of airlift pumps. In many works, the authors indicate the possibility of changing the geometry of airlift pumps. In the work [2] the authors suggested different crossectional shapes of risers. Work [3] shows that the performance increment can be obtained by grouping airlift pumps into batteries. Other studies found that the system of gas distribution and the liquid reception is also affecting the operating characteristics of an airlift pump. In [4] a comparison of airstones and open-ended tubes was investigated. In [5] steady and pulsating injection modes with the use of four air distributor geometry namely radial, axial, dual and swirl were analysed. The authors in [6] propose the application of four types of the nozzle (point, star, ring, double-ring) for artificial upwelling systems. Different angles of the gas distributor installation were investigated in [7].
Any analysis concerned with the exploitation of an airlift pump requires knowledge regarding the hydrodynamics of two-phase gas-liquid flow. One of the main problems with two-phase flows is the identification of flow structures and flow parameters. Flow patterns are formed by the contact between the gas and liquid or solid phases. Three-phase flow is discussed, among others in [8,9]. The classification of flow regimes of airlift pumps is similar to the classifications for gas-liquid flow in vertical channels [10]. There are solutions for pumps with an inclined riser for which the classification is the same as in work [11]. Sometimes in the airlift pump, the following regimes are distinguished: bubble, slug, churn, wispy-annular, annular and transition patterns in the boundary region [12]. In paper [13] additional structure development in the riser pipe was presented. The flow patterns determine the heat, mass and momentum transfer [14]. Specific patterns also affect the value of the pressure drop [15]. The pressure drop is particularly important, especially when pumping liquids with higher viscosities [16].
The transient structures are difficult to describe but are very interesting from the process optimization point of view. These types of transient structures are unstable. This results in the flow disturbance and the efficiency of the liquid transport decreases. It is best to examine them using imaging and numerical modelling techniques because they are non-invasive methods. We can find many papers that prove high efficiency of image analysis methods. In the work [17] two- and three-phase flow identification in pipe bends were presented. In [18] two-phase flow pattern was recognized in the minichannel. Computer image analysis has also been successfully used for the investigation of gas-solid systems [19,20]. Another visual research method often used during the hydrodynamic investigation is Particle Image Velocimetry (PIV). This method allows determination of vector velocity fields and evaluation of flow vorticity [21] and also can be applied in the air-lift pump research [22].
Two-phase gas-liquid flows are considerably affected by the device’s geometry and by the flow parameters. Research in this area is presented in [23], where the authors analyse the effects of tube diameter and submergence ratio on bubble flow patterns. The efficiency of the pump also changes with the change of temperature as demonstrated in the work [24]. The pumping performance and the effectiveness of an airlift pump have been investigated with the use of optical methods [25]. A slight difference in the flow parameters of both phases can cause significant changes in the flow regime [26]. Therefore, flow maps are used to help identify the structure and improve the efficiency of the airlift pump. Maps for two-phase flow in vertical channels are commonly known and used [27]. In contrast, for aeration pumps, maps of this type were developed by [12], and the correlation of flow structures and the efficiency of liquid transport was made [28,29]. Hydrodynamics of two-phase flows is concerned with the identification of the flow patterns and parameters experimentally and numerically [30,31]. In addition, they determine the overall efficiency of an airlift pump for the two-phase system [32], and three-phase systems [9].
The issues concerning the submergence ratio analysis in correlation to liquid phase velocity, efficiency and void fraction in the airlift pump are widely discussed problems [33]. The studies in [34] contain remarks indicating that airlift pumps operating at low submergence ratios are particularly vulnerable to the existence of such phenomena. In order to minimize the unfavorable influence of low submergence ratio, various design changes are applied. Figure 1 shows the schemes of submergence ratio (ε = Hs/H) in the airlift pump, which is an essential feature in the analysis of the energy efficiency and is commonly used as the ratio of the submergence depth of the pump (Hs) to its total height (H).
It seems to be difficult to establish an economically optimum condition for operational performance of the airlift pump since the theoretical model to predict the flow characteristics in full detail is still not complete [12]. The established dependence between various design parameters and two-phase flow regimes focuses on the optimization of the operating performance. The proposed method guarantees the finding of the efficiency optimization and stability of liquid transport throughout the operation of an airlift pump.
2. Measurement Setup
The conducted experiments involved the airlift pump with rectangular channel shown in Figure 2.
The measurement channel with the internal dimensions of 35 × 20 × 2045 mm was made of polymethyl methacrylate (PMMA). The riser pipe was equipped with an inlet with a gas distributor in form of the mixing chamber. The mixing chamber is equipped with the strainer. The gas distribution system enabled three gas phase distribution modes:
- (1)
- feeding the gas phase through the perforated nozzle (eight holes with the diameter of 2 mm with a symmetrical distribution on two walls in the channel);
- (2)
- feeding the gas phase through the slot nozzle (two slots with the dimensions of 2 × 20 mm);
- (3)
- feeding the gas phase through the ceramic porous element (two porous bodies with the 45% porosity, particle size 300–500 µm and dimensions of 30 × 20 mm).
The selection of the total length of segments forming the riser of the airlift pump meant that the analyzed pump had a low submergence ratio (submergence ratio of ε = 0.5 see Figure 1b). The airlift pump applied liquid feed through an inlet that was submerged 1 m below the surface. After a lifting height of 1 m was achieved, the liquid was reversed in an overflow vessel to the liquid tank. In this way, the system applied a closed liquid circulation. The gas phase circulated in the open loop and was reversed into the atmosphere. The setup was also equipped with the metering of: gas phase flow rate using a rotameter, liquid phase flow rate using the weight method, pressure drop in airlift pump using a differential manometer, pressure of the gas phase at the inlet to the airlift pump using pressure transducer, gas void fraction using the trap method.
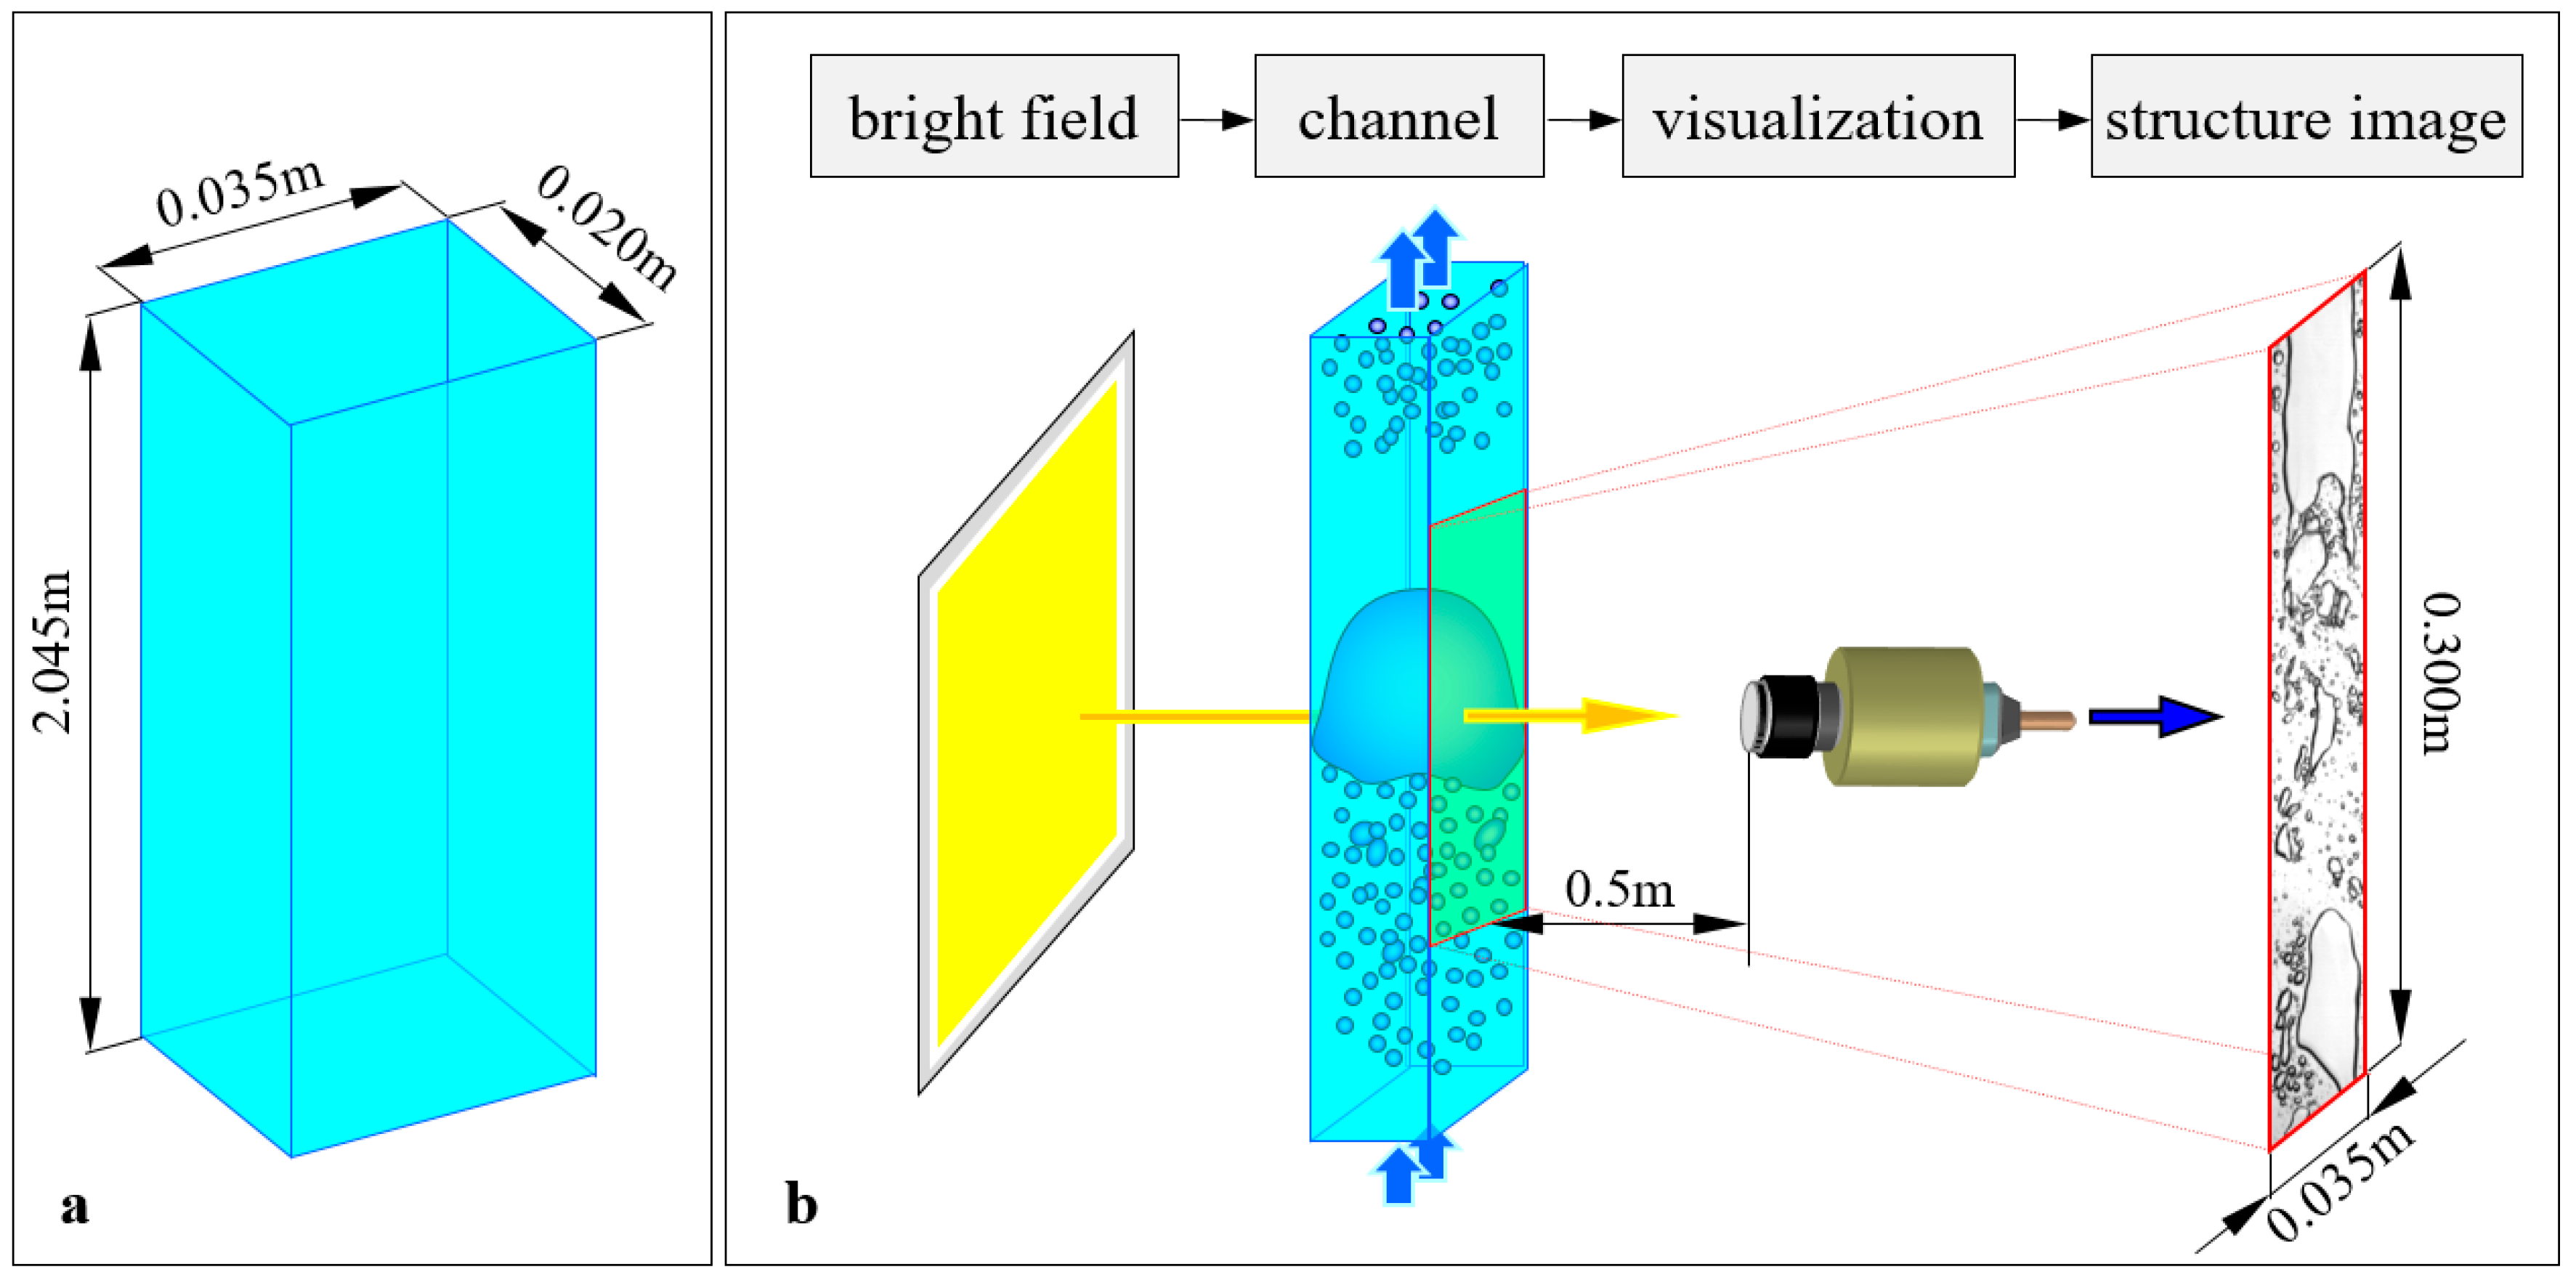
The optical path of the setup was formed by a HCC1000 series CMOS fast imaging camera (Vosskühler, Osnabrück, Germany) installed in the parallel plane of the measurement channel and a bright field as shown in Figure 3.
The illumination of the measurement section was realized by using a light source of four 1000 W halogen reflectors. The halogens were connected to a four-channel Lite-Puter AX-415 controller (Lite Puter Enterprise Co., Ltd, Taipei, Taiwan). As a result, smooth and independent control of the operating parameters was provided. The registration of images applied photo captures with the resolution of 1024 × 256 pixels and two frequencies: 260 Hz for slow flow phenomena (i.e., for gas flow rates up to 4 m3/h) and 465 Hz for fast occurring phenomena (i.e., for gas flow rates above 4 m3/h). Table 1 provides details of the meters used in the research.
3. Methods
The proposed approach to the assessment of the influence of the two-phase flow regime on airlift pumping system performance applies digital image analysis of the phenomena in the riser pipe of the apparatus. The data derived from the imaging was used as the basic source of information for the further dynamic image analysis. The experiments involved three pump configurations which differed the type of gas distributor. The research data was a series of flow images recorded during variable flow rates of gas in the range from 0.2 to 15.0 m3/h. Figure 4 presents the organizational diagram of the performed experiments.
Throughout the tests, characteristic fluctuations of the image’s grey level were recorded for each registered image that is relative to the regime of the airlift pump. This occurred as a result of the spatial distribution of the gas and liquid phases. The captured relations between the grey level recorded by the imaging system and the registered flow regime led to the assessment of two-phase flow patterns. The above was achieved by application of the probability density function (PDF).
Figure 5 contains the reference PDF spectra corresponding to the variations in grey level depending on the flow regimes that were formed during the two-phase flow. Those are typical spectra for the generally accepted flow regime nomenclature, described in the literature [35,36]. Bubble and froth flows have a single maximum, with a note that the spectrum for froth flow is wider or its image is fuzzy. For the case of slug flow, the recorded images contain noticeable separated peaks corresponding to the liquid and gas phases. A similar spectrum is observed for the case of slug flow, yet in this case, the peaks are less clearly separated.
Because the flow in the two-phase flow depends on the flow resistance, the analysis of the pressure drop was connected with the two-phase regime on the stability and efficiency of the liquid transport. The knowledge of the gas void fraction RG (also denoted in the literature as α) is necessary to calculate the pressure drop during two-phase flow for the energy efficiency assessment. The most commonly used method of determining the volume fraction α is the Zuber-Findlay method [37]. This is one of the drift flux methods, which allows the determination of the volume fraction (α = WGO/WG) as the ratio of the apparent gas phase velocity to the actual gas phase velocity. A detailed discussion of this method has been included in the paper [38]. In the reported study, a derivative of the Zuber-Findlay method was applied for calculations of the gas void fraction, that is particularly recommended to use for airlift pumps by Reinemann et al. [39]. The void fraction of the gas was determined on the basis of the following equations:
The value of the pressure drop was derived using the Lockhart-Martinelli method, as it is recommended for use in gas-liquid flows [40]. In this method, pressure drop ΔP2F resulting from a flow of two-phase mixtures includes two components—hydrostatic pressure and friction pressure:
In Equation (5), the pressure drops resulting from the hydrostatic pressure-induced changes are described by the following dependence:
where:
The friction pressure component was derived under the assumption that each of the phases flows separately through the entire cross-section of the channel riser:
where ΦG and ΦL are the equation multipliers, which were determined on the basis of the Lockhart–Martinelli parameter defined from the Equation (10) [40]:
In this manner, the calculation of the pressure drops involved the determination of the Lockhart-Martinelli parameter (X) and registration of the value of the multiplier Φ dedicated to the particular type of flow (laminar or turbulent) according to the chart shown in Figure 6. To carry out these calculations, it is necessary to know the additional Reynolds numbers for both phases.
As a result, the specific pressure gradient was derived and related to the length of the riser pipe in the airlift pump H (see Figure 2) on the basis of the following relation:
For :
For :
The model of assessing the operation of the airlift pump involved an assumption regarding the possibility of relating pressure drops, liquid transport efficiency and the type of two-phase flow regime. The optimization criterion that fulfills this assumption is based on the determination of the greatest difference between the energy flux needed to overcome the pressure drop and the useful energy flux of the liquid phase that is lifted to the lifting height HL (see Figure 1).
The energy flux that results the gas phase flow is expressed by the relation:
The energy flux resulting from the liquid phase flux is defined as follows:
To achieve a correlation between the energy flux at the input to the system (resulting from gas phase flow) and the energy flux at the output of the system (resulting from liquid phase flow), the standardization of these parameters was performed in relation to their maximum values. Finally, the optimization criterion was defined as:
The idea of the developed optimum regime selection for the studied airlift pump is illustrated in Figure 7. The idea of selecting a gas flux that guarantees optimal energy efficiency is not a new method in general, whereas in the case of optimization of the airlift pump has not been described so far in the literature. Therefore, it is considered a valuable method for optimizing this type of equipment.
With the purpose of verifying the proposed method of optimizing the airlift pump, the analysis of the efficiency of the apparatus was conducted with regard to the flow rates of the phases at the inlet. The calculations used the dependence derived by Reinemann et al. [39] (Equation (17)) which depends on the basis of dimensionless volumetric gas flow:
where the value of C0 coefficient depends on the type of the flow (laminar or turbulent) and has a value of 1.2 and 2.0, respectively.
From the point of view of optimizing the energy consumption, the most important need is to get as much water as possible with the smallest possible gas flux. For the performance analysis, due to the fact that the liquid flux was measured by the weight method, an uncertainty calculation was made for it as for functional dependencies. As it turns out that the biggest uncertainty obtained does not exceed 1%.
4. Results and Discussion
The initial point in the present study involved the identification of two-phase gas-liquid flow patterns. The use of an optical method provided the visualization of phase concentrations. Table 2 contains examples of visualizations with the fluctuations of the image’s grey level.
In Table 2 one can see how different distributors behave for a specific flow structure. It was demonstrated that different two-phase flow regimes can occur under identical flow conditions, yet, under the condition that other types of gas distribution systems are used. Similar results are reported in other papers [26,41,42]. This fact confirms the considerable effect of the gas phase distributor on two-phase flow regimes. For the case of airlift pumps, where the driving momentum is generated by the gas phase, the adequate selection of the gas distributor geometry plays a fundamental role. Thus, airlift pump can be considered as a device whose operation is determined by the role of the air distribution system. Which directly results from the research carried out.
Probability density functions (PDF) were calculated for the image’s grey levels of each of the flow regimes with the purpose of identifying the flow patterns according to [35,36] and resulted in the courses shown in Figure 8.
The subsequent step involved a comparison between the resulting function spectra shown in Figure 5 with the reference (see Figure 3). The comparative analysis offers a conclusion regarding considerable discrepancies resulting from the singularities of two-phase flow through an airlift pump.
The occurrence of large volumes of small bubbles, whose presence is specific both to the froth flow and to the plug and slug regimes contributes to the deformations of the PDF spectrum. The approach that offered the possibility to identify heterogeneous two-phase flow regimes applied an analysis involving the visual verification of the registered grey. The results are shown in Figure 9. The black line represents the course of the fluctuations of the grey level in the model plug flow. Such fluctuations could provide high reliability of the application of the method using the assessment of the probability function spectrum.
In accordance with the methods applied in this study, the void fraction was derived on the basis of Equation (1). The results of the calculations of gas phase void fraction were compared with the values measured by the trapping method and the results can be found in Figure 10. For all measurement series, 67% of the measurement points are found within the range of the relative error of 25%, which is an admissible result. This is a common error for 2P flows. The greatest level of the conformity between the results, i.e., 80% was established for the case of the porous distributor. In comparison, the values of 58% and 55% were established for the perforated and slotted distributors, respectively. Due to the dependence of the void fraction and two-phase mixture density, a similar level of conformity between the calculations and measurements was obtained for pressure drops as well (see Figure 10). The results of the void fractions offer a conclusion regarding the application of the adequate computational model for the conditions of the flow in the analyzed airlift pump (see Table 3).
In the present study, the pressure drop was one of the elements applied in the assessment of the energy flux delivered to the examined airlift pump. The determination of pressure drops applied the Lockhart–Martinelli method [40]. Such an approach offers satisfactory results with regard to two-phase gas-liquid mixture flow. An additional advantage of the applied method is a wide range of flow patterns. This plays a fundamental role in airlift pumps, where flow turbulence and disturbances appear. Figure 10 contains also the results of measured and calculated values of the pressure drops. The greatest discrepancies between the calculations and measurements are found within the initial operating of the airlift pump. This is caused by the low liquid flow rate at the outlet of the riser pipe. The characteristics of the liquid transport in an airlift pump involves liquid circulation in the riser pump until the designed transport velocity of the liquid is obtained. Within this initial measurement range, the smallest error was recorded for the slotted distributor, whereas the greatest for the porous one. As we mentioned, this correlates well with the results of measurement regarding the void fraction. We can also remark here that the slotted distributor generates the smallest local pressure drop and creates the conditions of the liquid transport development very late in the process. In contrast, the porous distributor operating for low parameters of the liquid phase provides the greatest transport efficiency.
The internal circulation of the liquid phase in the riser was minimized as a consequence of using a porous distributor. The perforated distributor was characterized by intermediate characteristics in comparison to the two other designs discussed above. The presented discrepancies cease to exist when the effective liquid lifting starts. Except for the initial operating range of the airlift pump, where hydrodynamic singularities are observed associated with the special characteristics of two-phase flow, the conformity of the measured and calculated values of the pressure drop is fully acceptable (See Figure 10). This remark is relevant in the context of the simplicity and the general characteristics of the Lockhart–Martinelli calculation method. The presented method fulfills the condition that makes it applicable to the calculations aimed at optimization of the airlift pumps.
The identification of an adequate operating regime of an airlift pump represents the key parameter which determines the exploitation cost of the apparatus. In the conducted study, the operating cost goal was achieved by the using energy fluxes of the phase mixture to determine the energy efficiency of the vertical liquid transport. It was observed that as a result of applying a common coordinate system to visualize the coefficients of the energy parameter, it is possible to determine a region in which the goal of liquid transport maximization can be accompanied by energy minimization.
The objective of the presented method was to identify the point that offers a compromise between the maximization of liquid lifting and minimization of energy input. This objective was realized as a result of testing the variability of the function representing the difference between the normalized energy fluxes of the two phases. The point in which a maximum difference occurred was assigned with the energy flux of the gas phase corresponding to it so as to guarantee the optimum operating regime of the airlift pump.
The selection of optimum gas phase flow rates is presented in Figure 8. The optimum operating range of the perforated and slotted distributors is found in the range of the plug flow regime. For the porous distributor, this range shifts in the direction of the greater flow rates and are located in the slug flow regime. However, the slug regime is optimum due to the greater normalized flow rate of the transported liquid phase (ΔE = 0.1) despite the greater amount of energy needed to pump the liquid. The effect was reflected in the increased stability of the liquid transport over time. For the perforated and slotted distributors, plug flow was characterized by intensive pulsations and existence of plugs in the flow accompanied by considerable cyclic changes in the efficiency of the liquid transport. The fluctuations in the charts representing liquid flow rates were smoother. This fact is also reflected in the analysis of the fluctuations of the grey level of the two slug and churn patterns described in Table 2.
The results of the finding of an optimum operating regime selection of the airlift pump are presented in Figure 11. This graph shows flow characteristics with the optimum energy points’ localization. The overall performance of the airlift pump was determined on the basis of Equation (17) and the optimum efficiency from Equation (16). In Figure 12, the optimum efficiency (marked with ●) is located between the points representing maximum efficiency (marked with ■) and maximum pump capacity (marked with ▲).
The efficiency analysis depends on the gas flow rate and the distributor type. The maximum efficiency of the aeration pump is not identical to the evenness of liquid transport. Most often, at the highest efficiency, the liquid flow is pulsating. And that is why we propose using the optimum efficiency, which in this case is better than the maximum performance.
The construction of a gas distributor should ensure the maximum amount of bubbles in the widest range of the gas stream, resulting in the largest liquid transport. Despite the fact that in our case the porous distributor was characterized by the highest pressure drop, it generated the largest liquid transport for the largest range of gas flux. In addition, the point corresponding to the best performance of the apparatus does not correspond to the highest efficiency of liquid transport. For gas distributors characterized by an increased pressure drop (such as porous distributors), the optimum operating regime shifts towards the maximum efficiency. For this reason, this type of distributor can be considered as optimum for airlift pumps operating at low submergence ratios.
5. Conclusions
The study was concerned with the description of hydrodynamics and energy efficiency of airlift pumps. The analysis of the operation of the existing apparatus the assessment of the operating parameters of the pump with the use of an optimization algorithm was applied.
The following methods were used to develop the method of analysis: analysis of the grey level of the image, trap method for measuring gas volume, measurement of pressure drop by means of a differential manometer, measurement of liquid phase strips by gravimetric method. In addition, calculation methods such as the Lockhart-Martinelli method and the drift-flux method were used. The energy flow fed into the system with the potential energy stream at the given height was correlated. The experiments led to the following conclusions:
Fluctuations of the grey level of the registered images corresponding to the two-phase mixture flow in the riser of an airlift pump are reflected in the variable pump performance and continuity of the liquid transport. The determination of the normalized fluxes of the liquid flow demonstrates the important role of the system of the gas phase distribution. The type of gas distributor needs to be accounted at the design stage, in particular in the apparatus operating under low submergence ratios.
The proposed method for the selection of the airlift pump operating parameters offers the determination of optimum energy efficiency (see ● in Figure 12) at low submergence ratios.
The operating regime of the apparatus within the discussed flow parameters offers the best compromise between the liquid lifting efficiency and exploitation cost of the system (i.e., the cost of generating the air feeding the system).
Author Contributions
Data curation, M.M.; Investigation, G.L.; Methodology, G.L.; Resources, D.Z.; Software, D.Z.; Supervision, S.A.; Visualization, M.M.; Writing—Original Draft, G.L. and D.Z.; Writing—Review & Editing, M.M. and S.A.
Funding
This research received no external funding.
Conflicts of Interest
The authors declare no conflict of interest.
Nomenclature
| λ | coefficient of resistance dependent on the Reynolds number (Re) and the relative roughness of the pipe, - |
| ε | submergence ratio, - |
| η | airlift pump overall efficiency, - |
| ηs | compressor efficiency, - |
| ρL | liquid density, kg/m3 |
| ρ2P | two phase mixture density, kg/m3 |
| ρG | gas density, kg/m3 |
| σ | liquid phase surface tension, N/m |
| C0 | liquid slug velocity profile coefficient (C0 = 1.2 for high Re, C0 = 2.0 for low Re) |
| D | riser pipe diameter, m |
| energy flux resulting from the liquid phase, W | |
| energy flux resulting from the gas phase, W | |
| normalized energy flux (liquid phase), - | |
| normalized energy flux (gas phase), - | |
| g | gravitational acceleration, m/s |
| ΦG | Lockhart-Martinelli equation multiplier for gas phase, - |
| ФGtt | L-M multiplier for the gas phase, where the liquid phase is turbulent and the gas phase is also turbulent, - |
| ФGtv | L-M multiplier for the gas phase where the liquid phase is turbulent but the gas phase is laminar (viscous), - |
| ФGvt | L-M multiplier for the gas phase where the liquid phase is laminar (viscous) but the gas phase is turbulent, - |
| ФGvv | L-M multiplier for the gas phase where the liquid phase is laminar (viscous) and the gas phase also laminar (viscous), - |
| ΦL | L-M multiplier for liquid phase, - |
| ФLtt | L-M multiplier for the liquid phase where the liquid phase is turbulent and the gas phase is also turbulent, - |
| ФLtv | L-M multiplier for the liquid phase where the liquid phase is turbulent but the gas phase is laminar (viscous), - |
| ФLvt | L-M multiplier for the liquid phase where the liquid phase is laminar (viscous) but the gas phase flowing alone in the channel is turbulent, - |
| ФLvv | L-M multiplier for the liquid phase where the liquid phase is laminar (viscous) and the gas phase is also laminar (viscous), - |
| H | total lift, m |
| Hl | pump lift height, m |
| Ho | overall height of the pump, m |
| Hs | immersion depth, m |
| i | respective phase (i.e., gas or liquid) as subscript |
| RG | Void friction, - |
| ∆P | total pressure drop related to gas flux considering two-phase flow, |
| ΔP2F,H | pressure drop caused by a change in hydrostatic energy, |
| ΔP2F,T | pressure drop caused by friction, |
| QG | volume of gas, m3/h |
| Q’L | dimensionless liquid flow coefficient, - |
| QL | volume of liquid, m3/h |
| Q’L | dimensionless gas flow coefficient, - |
| W’Ts | dimensionless coefficient of plug movement in stationary liquid, - |
| WG | gas velocity, m/s |
| WGO | superficial velocity of gas phase, m/s |
| WLO | superficial velocity of liquid phase, m/s |
References
- Hanafizadeh, P.; Ghorbani, B. Review study on airlift pumping systems. Multiph. Sci. Technol. 2012, 24, 323–362. [Google Scholar] [CrossRef]
- Kumar, E.A.; Kumar, K.R.V.; Ramayya, A.V. Augmentation of airlift pump performance with tapered upriser pipe. An experimental study. J. Mech. Eng. Div. 2003, 84, 114–119. [Google Scholar]
- Yoo, K.H.; Masser, M.P.; Hawcroft, B.A. An in-pond raceway system incorporating removal of fish waste. Aquac. Eng. 1994, 14, 175–187. [Google Scholar] [CrossRef]
- Loyless, J.C.; Malone, R.C. Evaluation of air-lift pump capabilities for water delivery, aeration, and degasification for application to recirculating aquaculture systems. Aquac. Eng. 1988, 18, 117–133. [Google Scholar] [CrossRef]
- Ahmed, W.H.; Aman, A.M.; Badr, H.M.; Al-Qutub, A.M. Air injection methods: The key to better performance of airlift pump. Exp. Therm. Fluids Sci. 2016, 70, 354–365. [Google Scholar] [CrossRef]
- Qiang, Y.; Fan, W.; Xiao, C.; Pan, Y.; Chen, Y. Effects of operating parameters and injection method on the performance of an artificial upwelling by using airlift pump. Appl. Ocean Res. 2018, 78, 212–222. [Google Scholar] [CrossRef]
- Deendarlianto; Supraba, I.; Majid, A.I.; Pradecta, M.R.; Indarto; Widyaparaga, A. Experimental investigation on the flow behavior during the solid particles lifting in a micro-bubble generator type airlift pump system. Case Stud. Therm. Eng. 2019, 13, 100386. [Google Scholar] [CrossRef]
- Kassab, S.Z.; Kandil, H.A.; Warda, H.A.; Ahmed, W.H. Experimental and analytical investigations of airlift pumps operating in three-phase flow. Chem. Eng. J. 2007, 131, 273–281. [Google Scholar] [CrossRef]
- Fujimoto, H.; Nagadani, T.; Takuda, H. Performance characteristics of a gas-liquid-solid airlift pump. Int. J. Multiph. Flow 2005, 31, 1116–1133. [Google Scholar] [CrossRef]
- Masiukiewicz, M.; Anweiler, S. Two-phase flow phenomena assessment in minichannels for compact heat exchangers using image analysis methods. Energy Convers. Manag. 2015, 104, 44–54. [Google Scholar] [CrossRef]
- Qi, D.; Zou, H.; Ding, Y.; Luo, W.; Yang, J. Engineering Simulation Tests on Multiphase Flow in Middle-and High-Yield Slanted Well Bores. Energies 2018, 11, 2591. [Google Scholar] [CrossRef]
- Samaras, V.C.; Margaris, D.P. Two-phase flow regime maps for air-lift pump vertical upward gas-liquid flow. Int. J. Multiph. Flow 2005, 31, 757–766. [Google Scholar] [CrossRef]
- Apazidis, N. Influence of buble expansion and relative velocity on the performance and stability of an airlift pump. Int. J. Multiph. Flow 1985, 11, 459–475. [Google Scholar] [CrossRef]
- Wasilewski, M. Analysis of the effects of temperature and the share of solid and gas phases on the process of separation in a cyclone suspension preheater. Sep. Purif. Technol. 2016, 168, 114–123. [Google Scholar] [CrossRef]
- Pietrzak, M.; Placzek, M.; Witczak, S. Comparison of pressure drop correlations for two-phase flow in small diameter channels. Przem. Chem. 2017, 96, 592–597. [Google Scholar]
- Ganat, T.A.; Hrairi, M. Gas–Liquid Two-Phase Upward Flow through a Vertical Pipe: Influence of Pressure Drop on the Measurement of Fluid Flow Rate. Energies 2018, 11, 2937. [Google Scholar] [CrossRef]
- Pietrzak, M.; Witczak, S. Flow patterns and void fractions of phases during gas–liquid two-phase and gas–liquid–liquid three-phase flow in U-bends. Int. J. Heat Fluid Flow 2013, 44, 700–710. [Google Scholar] [CrossRef]
- Sikora, M. Flow structures during refrigerants condensation. J. Mech. Energy Eng. 2017, 1, 101–106. [Google Scholar]
- Anweiler, S. Development of videogrammetry as a tool for gas-particle fluidization research. J. Environ. Manag. 2017, 203, 942–949. [Google Scholar] [CrossRef]
- Anweiler, S.; Ulbrich, R. Flow pattern for different fluidization apparatuses. Inzynieria Chemiczna i Procesowa 2004, 25, 577–582. [Google Scholar]
- Ligus, G.; Wasilewski, M. Impact of stirrer rotational speed on liquid circulation in a rectangular vessel—A study applying DPIV. E3S Web Conf. 2018, 44, 00096. [Google Scholar] [CrossRef]
- Wang, Z.; Kang, Y.; Wang, X.; Wu, S.; Li, X. Investigation of the hydrodynamics of slug flow in airlift pumps. Chin. J. Chem. Eng. 2018, 26, 2391–2402. [Google Scholar] [CrossRef]
- Kim, S.H.; Sohn, C.H.; Hwang, J.Y. Effect of tube diameter and submergence ratio on bubble pattern and performance of airlift pump. Int. J. Multiph. Flow 2014, 58, 195–204. [Google Scholar] [CrossRef]
- Oueslati, A.; Megriche, A. The effect of liquid temperature on the performance of an airlift pump. Enrgy Procedia 2017, 119, 693–701. [Google Scholar] [CrossRef]
- Abed, K.A. Operational criteria of performance of airlift pump. J. Inst. Eng. 2003, 84, 92–94. [Google Scholar]
- Deckwer, W.D. Bubble Column Reactors; John Wiley and Sons: New York, NY, USA, 1991. [Google Scholar]
- Mishima, K.; Hibiki, T. Some characteristics of air-water two-phase flow in small diameter vertical tubes. Int. J. Multiph. Flow 1996, 22, 703–712. [Google Scholar] [CrossRef]
- Kassab, S.; Kandil, H.A.; Warda, H.A.; Ahmed, W.H. Air-lift pump characteristics under two-phase flow conditions. Int. J. Heat Fluid Flow 2009, 30, 88–98. [Google Scholar] [CrossRef]
- Hanafizadeh, P.; Ghanbarzadeh, S.; Saidi, M.H. Visual technique for detection of gas-liquid two-phase flow regime in the airlift pump. J. Pet. Sci. Eng. 2011, 75, 327–335. [Google Scholar] [CrossRef]
- Borsuk, G.; Pochwala, S.; Wydrych, J. Numerical methods in processes of design and operation in pneumatic conveying systems. In Engineering Mechanics Book Series: Engineering Mechanics; Zolotarev, I., Radolf, V., Eds.; Institute of Thermomechanics, Academy of Sciences of the Czech Republic: Prague, Czech Republic, 2016; pp. 83–86. [Google Scholar]
- Wasilewski, M.; Duda, J. Multicriteria optimisation of first-stage cyclones in the clinker burning system by means of numerical modelling and experimental research. Powder Technol. 2016, 289, 143–158. [Google Scholar] [CrossRef]
- De Cachard, F.; Delhaje, J.M. A slug-churn flow model for small-diameter airlift pumps. Int. J. Multiph. Flow 1996, 22, 627–649. [Google Scholar] [CrossRef]
- Tighzert, H.; Brahimi, M.; Kechround, N.; Benabbas, F. Effect of submergence ratio on the liquid phase velocity, efficiency and void fraction in air-lift pump. J. Pet. Sci. Eng. 2013, 110, 155–161. [Google Scholar] [CrossRef]
- Tramba, A.; Topalidou, A.; Kastrinakis, E.G.; Nychas, S.G. Visual study of an airlift pump operating at low submergance ration. Can. J. Chem. Eng. 1995, 73, 755–764. [Google Scholar] [CrossRef]
- Lubbesmeyer, D.; Leoni, B. Fluid-velocity measurements and flow pattern identification by noise-analysis of light-beam signals. Int. J. Multiph. Flow 1983, 9, 665–679. [Google Scholar] [CrossRef]
- Lubbesmeyer, D. Possibilities of flow-pattern identification by noise techniques. Prog. Nucl. Energy 1982, 9, 13–21. [Google Scholar] [CrossRef]
- Zuber, N.; Findlay, J.A. Average volumetric concentration in two-phase flow systems. J. Heat Transf. 1965, 87, 453–468. [Google Scholar] [CrossRef]
- Masiukiewicz, M.; Anweiler, S. Two-phase flow structure assessment based on dynamic image analysis. Flow Meas. Instrum. 2019, 65, 195–202. [Google Scholar] [CrossRef]
- Reinemann, D.J.; Parlange, J.Y.; Timmons, M.B. Theory of small-diameter airlift pump. Int. J. Multiph. Flow 1990, 16, 113–122. [Google Scholar] [CrossRef]
- Lockhart, R.W.; Martinelli, R.C. Proposed Correlation of data for isothermal two-phase flow. Chem. Eng. Prog. 1949, 45, 39–48. [Google Scholar]
- Masiukiewicz, M.; Zając, D.; Ulbrich, R. Image analysis applied to pattern recognition of two-phase flow in two-dimensional bed. Inzynieria Chemiczna i Procesowa 2001, 22, 917–922. [Google Scholar]
- Ulbrich, R.; Krótkiewicz, M.; Szmolke, N.; Anweiler, S.; Masiukiewicz, M.; Zajac, D. Recognition of two-phase flow patterns with the use of dynamic image analysis. Proc. Inst. Mech. Eng. Part E J. Process Mech. Eng. 2002, 216, 227–233. [Google Scholar] [CrossRef]
Figure 1.
The scheme of submergence ratio (ε) in the airlift pumping systems. (a) high submergence ratio ε > 0.5; (b) medium submergence ratio ε = 0.5; (c) low submergence ratio ε < 0.5.
Figure 1.
The scheme of submergence ratio (ε) in the airlift pumping systems. (a) high submergence ratio ε > 0.5; (b) medium submergence ratio ε = 0.5; (c) low submergence ratio ε < 0.5.

Figure 2.
Measurement setup—airlift pumping system.
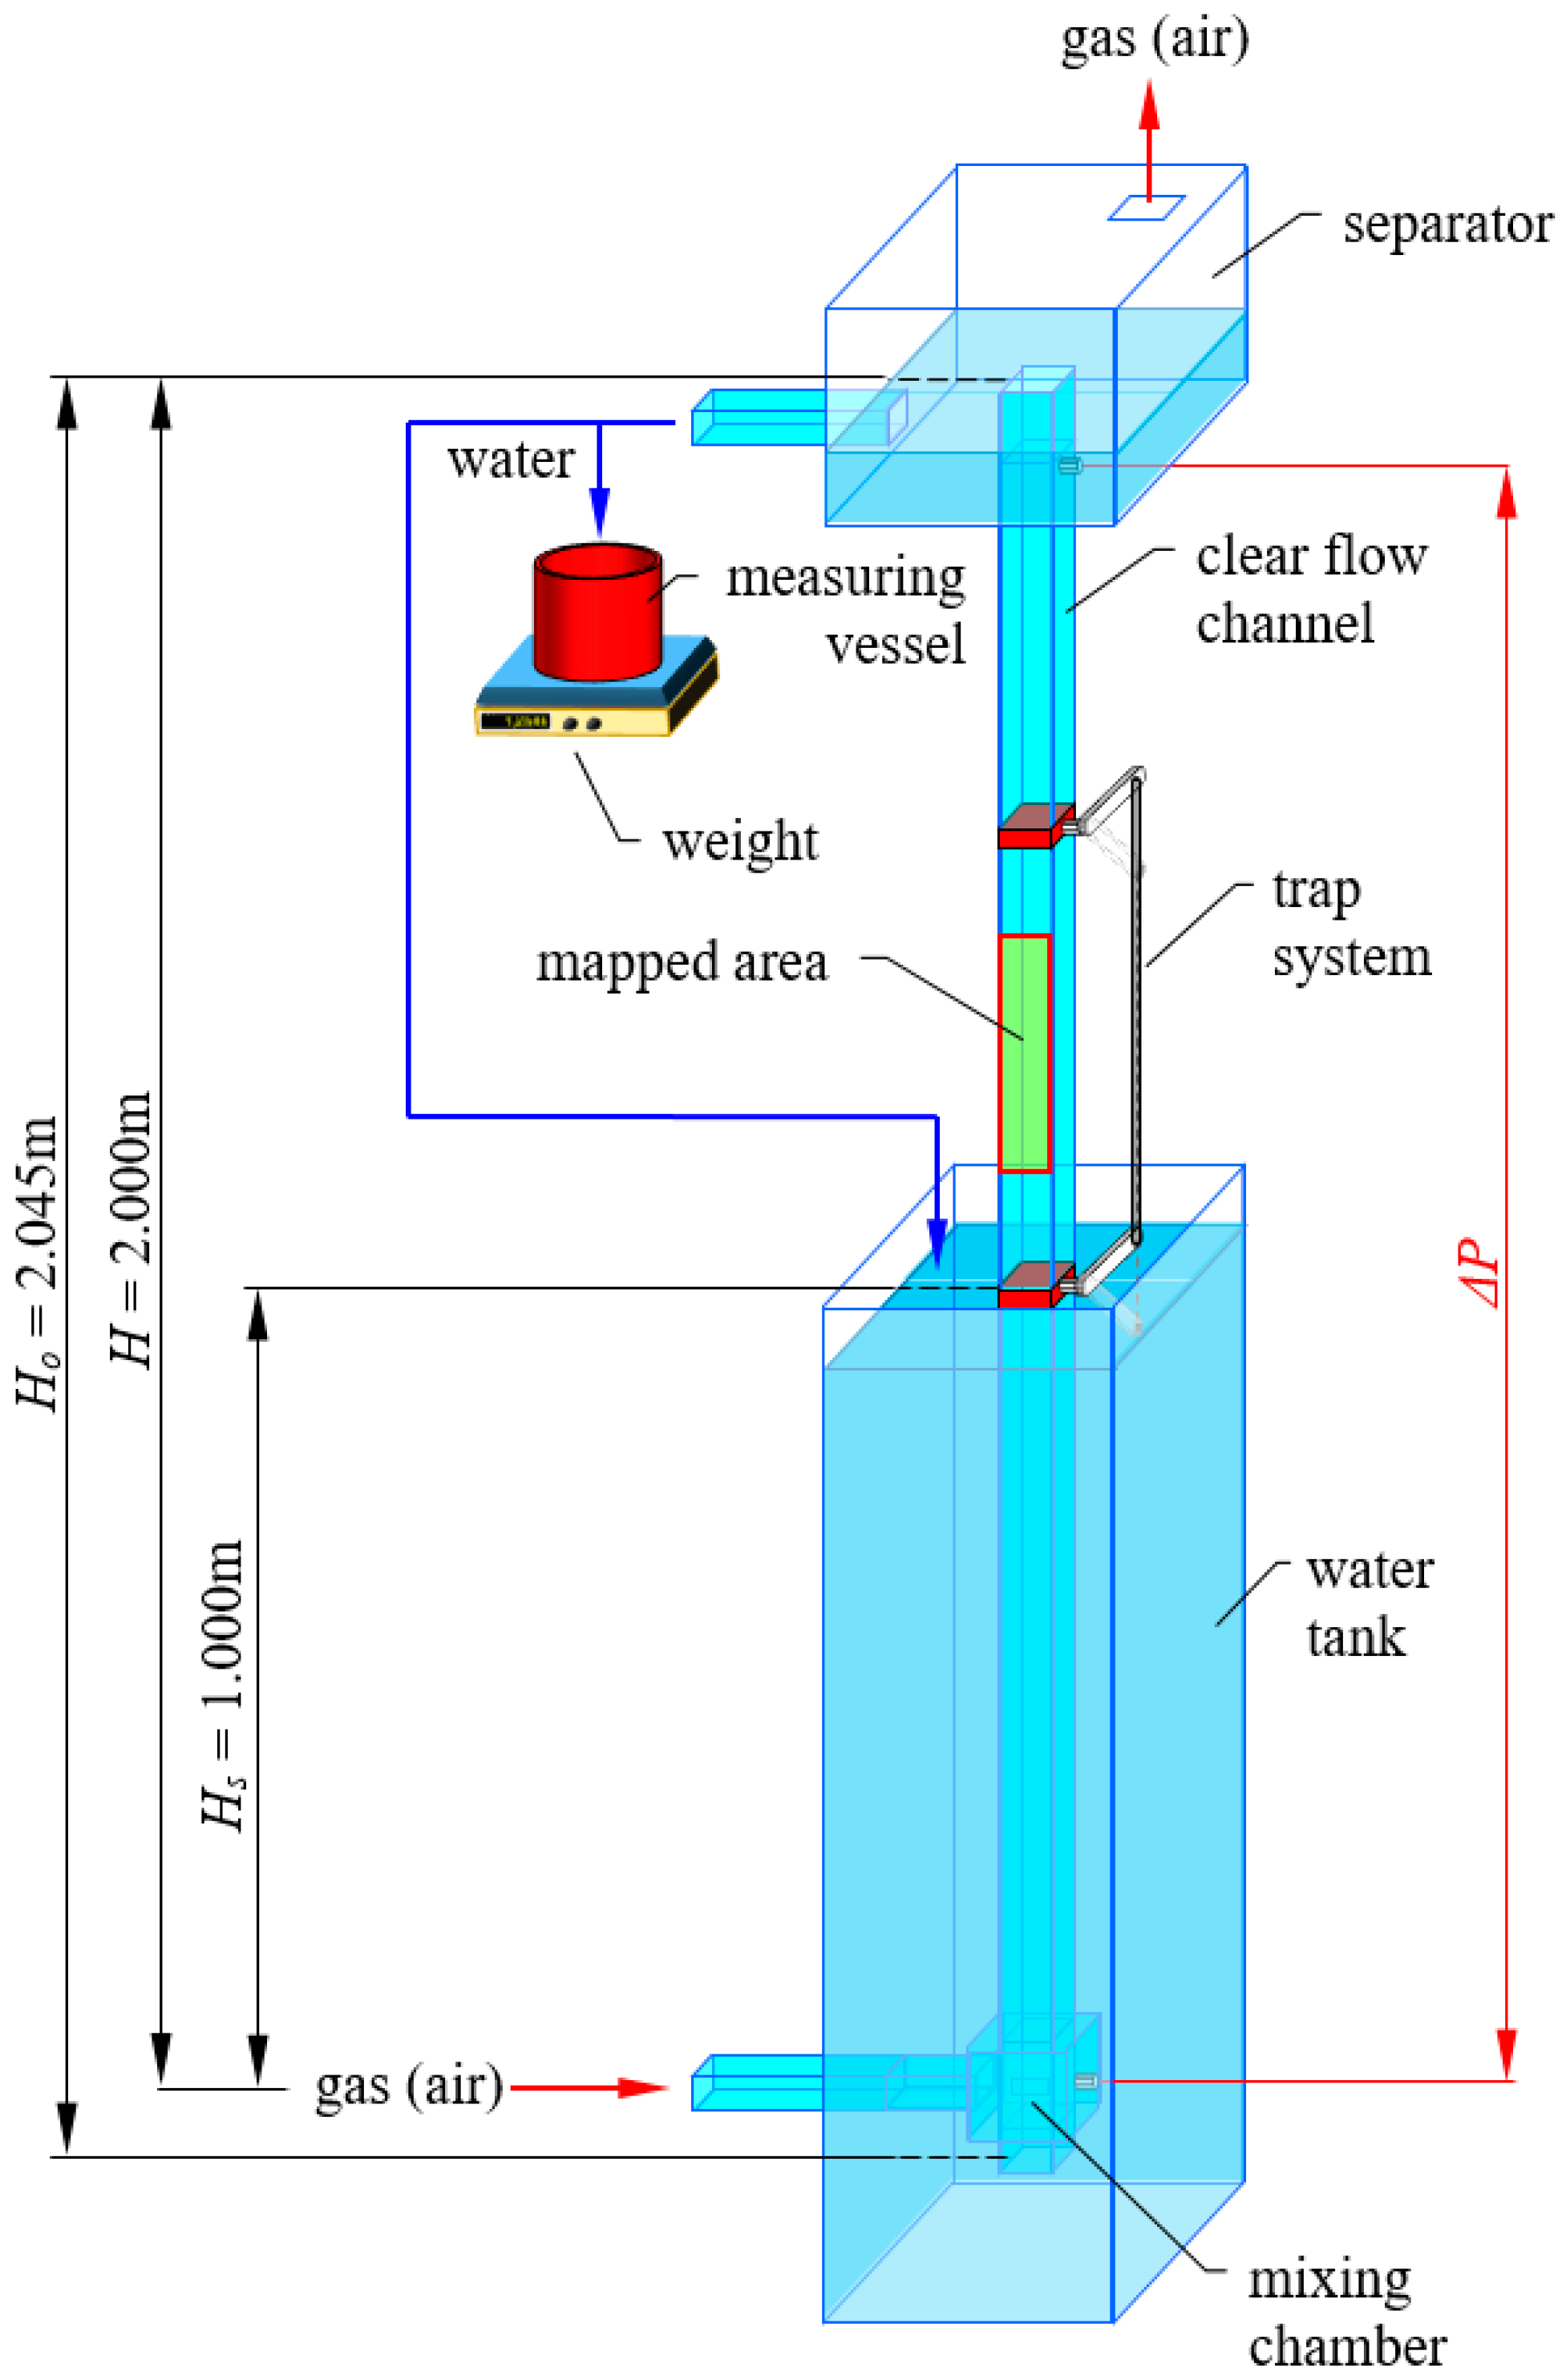
Figure 3.
Measurement setup—visualization technique. (a) the flow channel dimensions; (b) the optical path.
Figure 3.
Measurement setup—visualization technique. (a) the flow channel dimensions; (b) the optical path.

Figure 4.
Methods used for selecting the airlift pump optimum efficiency at low submergence ratios.

Figure 5.
Reference spectra of the probability density function for two-phase flows [35]: (a) bubble flow, (b) churn flow, (c) slug flow, and (d) wispy-annular flow.
Figure 5.
Reference spectra of the probability density function for two-phase flows [35]: (a) bubble flow, (b) churn flow, (c) slug flow, and (d) wispy-annular flow.

Figure 6.
Chart for Lockhart-Martinelli corrections [40].
Figure 6.
Chart for Lockhart-Martinelli corrections [40].

Figure 7.
The idea of an optimization method for an airlift pump operation.

Figure 8.
Probability density function spectrum for different flow regimes through an airlift pump: (a) bubbly flow; (b) slug flow; (c) churn flow; (d) wispy-annular flow.
Figure 8.
Probability density function spectrum for different flow regimes through an airlift pump: (a) bubbly flow; (b) slug flow; (c) churn flow; (d) wispy-annular flow.

Figure 9.
Influence of heterogeneous flow pattern on grey level fluctuations.

Figure 10.
Comparison between the (a) measured with the calculated void fraction in accordance with the Reinemann drift-flux model and (b) comparison of measured and calculated pressure drop.
Figure 10.
Comparison between the (a) measured with the calculated void fraction in accordance with the Reinemann drift-flux model and (b) comparison of measured and calculated pressure drop.

Figure 11.
Optimum flow parameters for an airlift pump for Hl = 1.0 m and different gas distributors: (a) perforated distributor; (b) slotted distributor; (c) porous distributor.
Figure 11.
Optimum flow parameters for an airlift pump for Hl = 1.0 m and different gas distributors: (a) perforated distributor; (b) slotted distributor; (c) porous distributor.

Figure 12.
Findings of the proposed method for selecting an optimum operating regime of the airlift pump.
Figure 12.
Findings of the proposed method for selecting an optimum operating regime of the airlift pump.


Table 1.
Details of the meters used in the research.
| Measurement Device | Description |
|---|---|
| Rotameter ROS-10 | Measuring range: 0.11–1.1 m3/h Standard accuracy class 2.5 according to PN-85/M-42371 Absolute error: 0.0275 |
| Rotameter ROS-16 | Measurement range: 0.5–5.0 m3/h Standard accuracy class 2.5 according to PN-85/M-42371 Absolute error: 0.125 |
| Rotameter RDN-25 | Measurement range: 3.0–30.0 m3/h Standard accuracy class 2.5 according to PN-85/M-42371 Absolute error: 0.75 |
| Scale Radwag WPT5 | Measuring range: 0.5–3000 g Accuracy: 0.5 g |
| PELTRON PXWD 0.2 Differential pressure transducer | Measuring range: 0–20 kPa Standard accuracy class 0.25 according to PN-85/M-42371 Absolute error: 50 Pa |
| Timer | Accuracy: 0.01 s |
Table 2.
Flow pattern and grey level fluctuation in an airlift pump.
| Porous Gas Distributor | Perforated Gas Distributor | Slot Gas Distributor | |
|---|---|---|---|
| Bubble flow |  |  |  |
| Slug flow |  |  |  |
| Churn flow |  |  |  |
| Wispy-annular flow |  |  |  |
Table 3.
Impact of gas distributor for an airlift pump operating.
| Type of Gas Distributor | Impact on Two-Phase Flow Mixture | Impact on Pressure Drop | Impact on Void Friction |
|---|---|---|---|
| Porous | The high intensity of the heterogeneous flow High stability of liquid transport A small number of local circulations and vortices in the liquid phase | High values of pressure drops Greatest validity of a Lockhart-Martinelli model Exceeding the error limit in the small and medium gas flux range | Greatest validity of a Reinemann model Exceeding the error limit in the small and medium gas flux range |
| Perforated | Medium intensity of the heterogeneous flow Medium stability of liquid transport A small number of local circulations and vortices in the liquid phase for bubble structures, significant for other structures | Medium values of pressure drops Medium validity of a Lockhart-Martinelli model Exceeding the error limit in the small and medium gas flux range | Medium validity of a Reinemann model Exceeding the error limit in the small and medium gas flux range |
| Slot | Low intensity of the heterogeneous flow Low stability of liquid transport A significant number of local circulations and vortices in the liquid phase | Low values of pressure drops Medium validity of a Lockhart-Martinelli model Exceeding the error limit in the small and medium gas flux range | Medium validity of a Reinemann model Exceeding the error limit in the high gas flux range |
© 2019 by the authors. Licensee MDPI, Basel, Switzerland. This article is an open access article distributed under the terms and conditions of the Creative Commons Attribution (CC BY) license (http://creativecommons.org/licenses/by/4.0/).
Share and Cite
MDPI and ACS Style
Ligus, G.; Zając, D.; Masiukiewicz, M.; Anweiler, S. A New Method of Selecting the Airlift Pump Optimum Efficiency at Low Submergence Ratios with the Use of Image Analysis. Energies 2019, 12, 735. https://doi.org/10.3390/en12040735
AMA Style
Ligus G, Zając D, Masiukiewicz M, Anweiler S. A New Method of Selecting the Airlift Pump Optimum Efficiency at Low Submergence Ratios with the Use of Image Analysis. Energies. 2019; 12(4):735. https://doi.org/10.3390/en12040735
Chicago/Turabian StyleLigus, Grzegorz, Daniel Zając, Maciej Masiukiewicz, and Stanisław Anweiler. 2019. "A New Method of Selecting the Airlift Pump Optimum Efficiency at Low Submergence Ratios with the Use of Image Analysis" Energies 12, no. 4: 735. https://doi.org/10.3390/en12040735
Note that from the first issue of 2016, this journal uses article numbers instead of page numbers. See further details here.