Temperature Disturbance Management in a Heat Exchanger Network for Maximum Energy Recovery Considering Economic Analysis


 ,
,
Abstract
:
1. Introduction
2. Methodology
2.1. Step 1: Stream Data Extraction with Disturbances
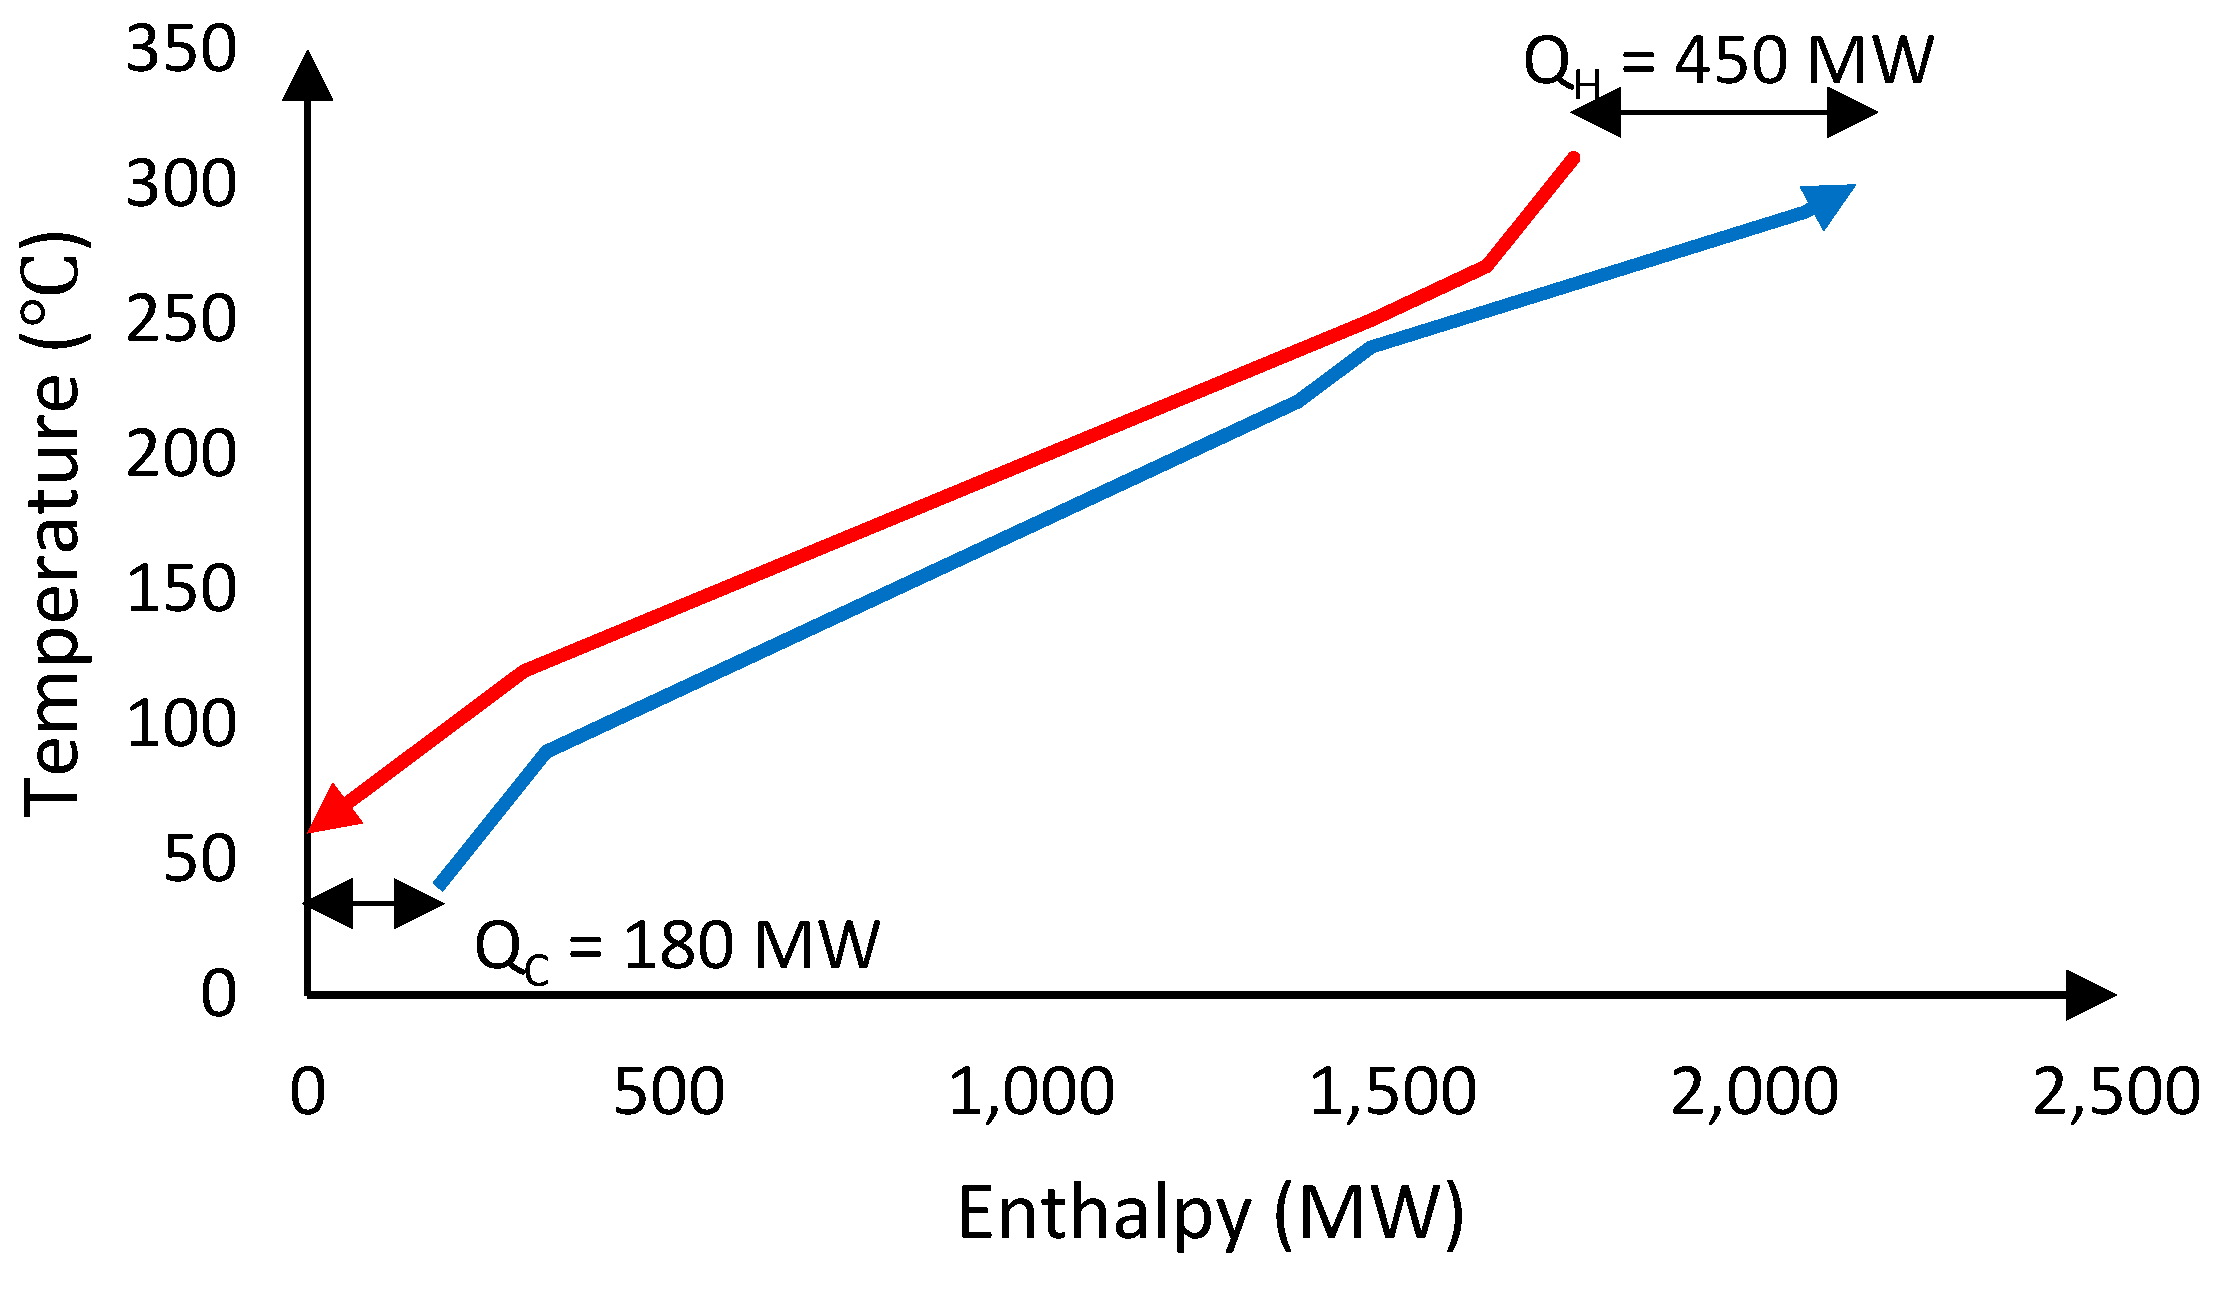
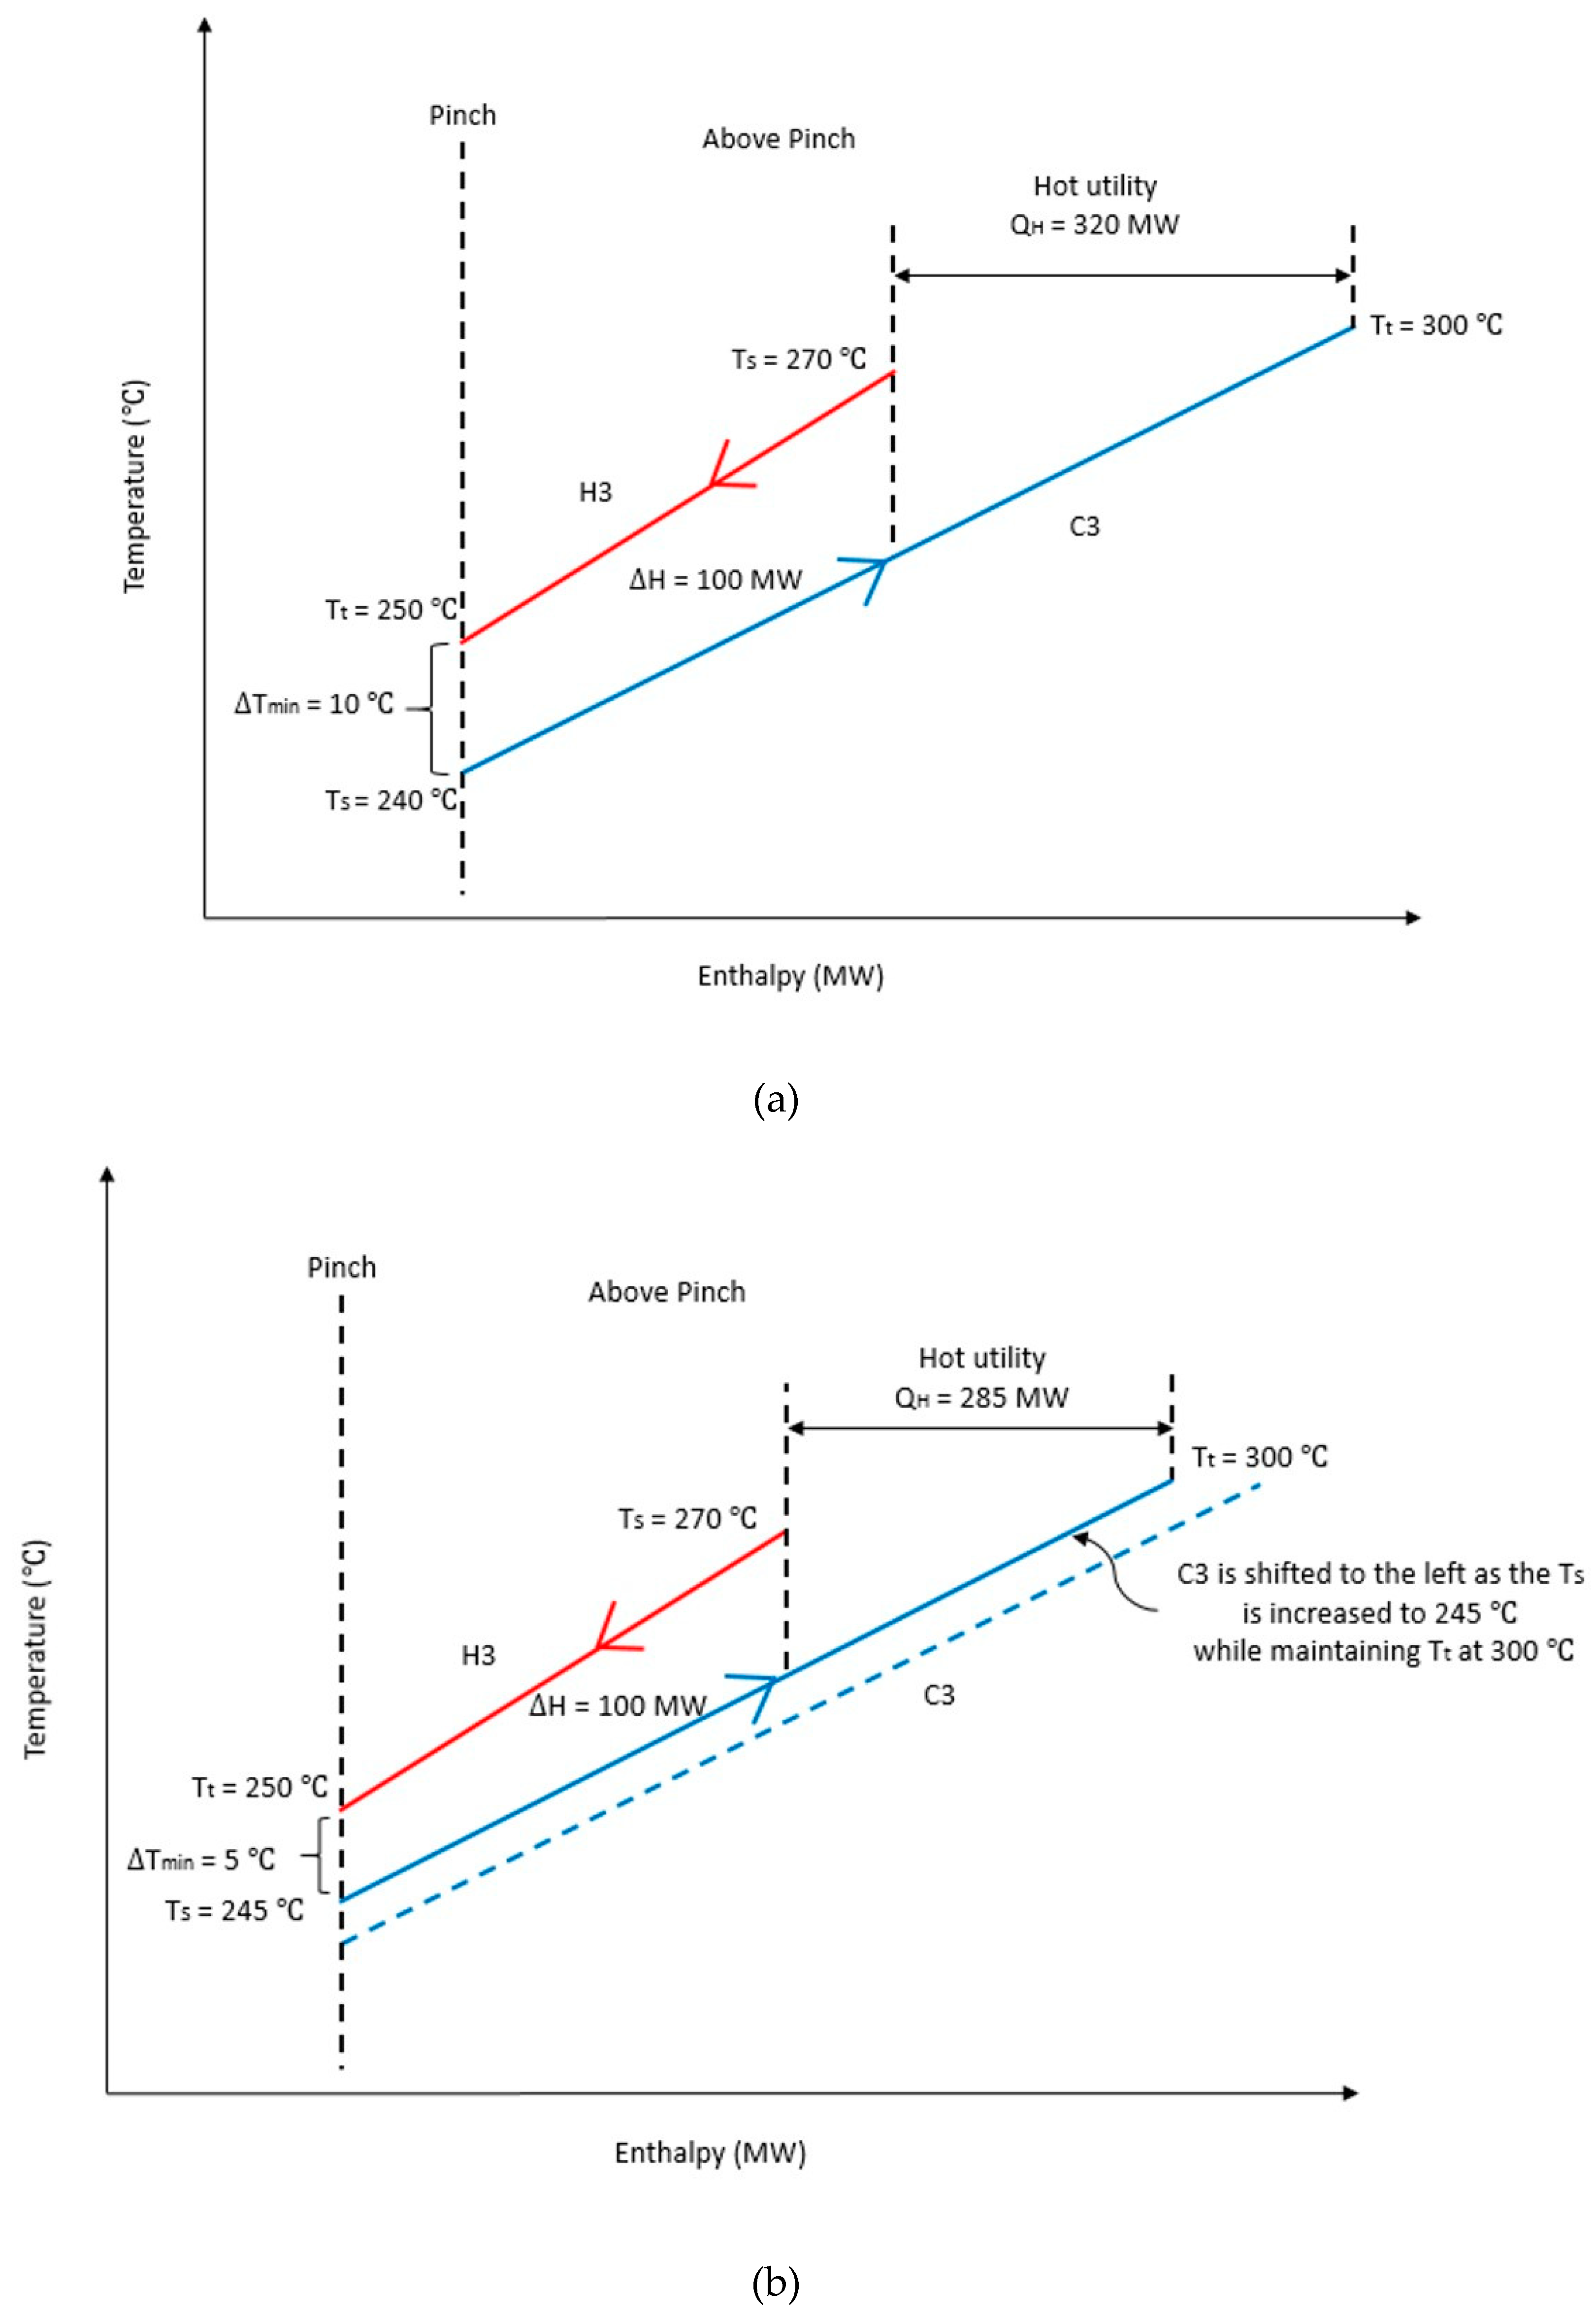
2.2. Step 2: Perform Maximum Energy Recovery Targeting for the Nominal Case
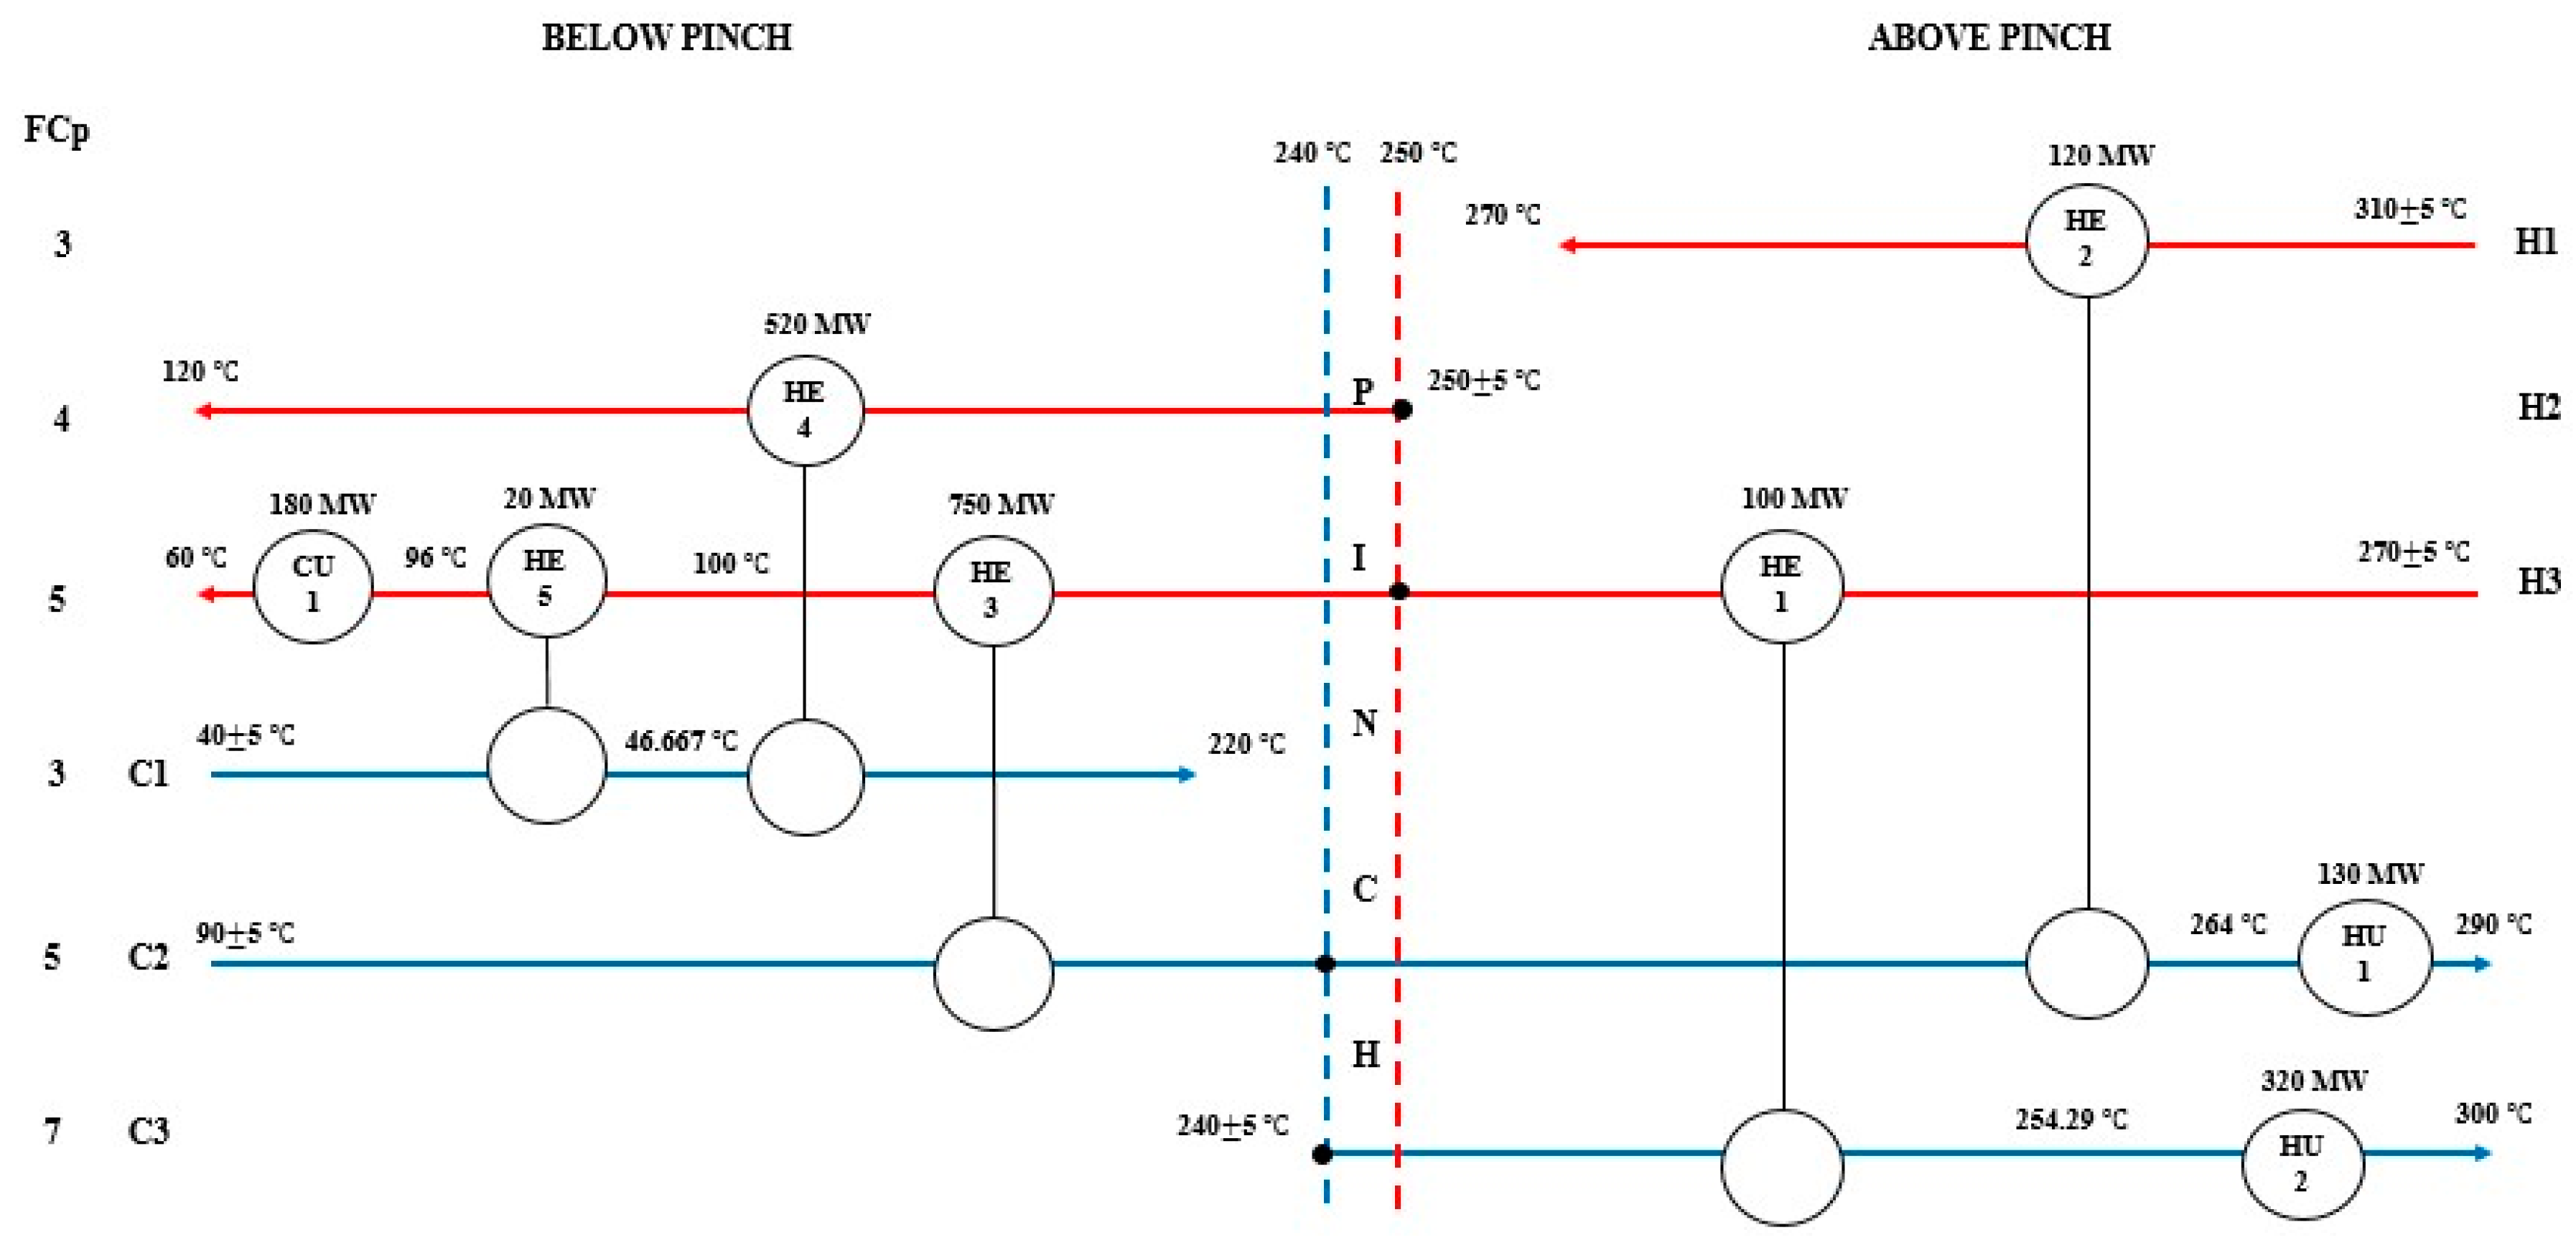
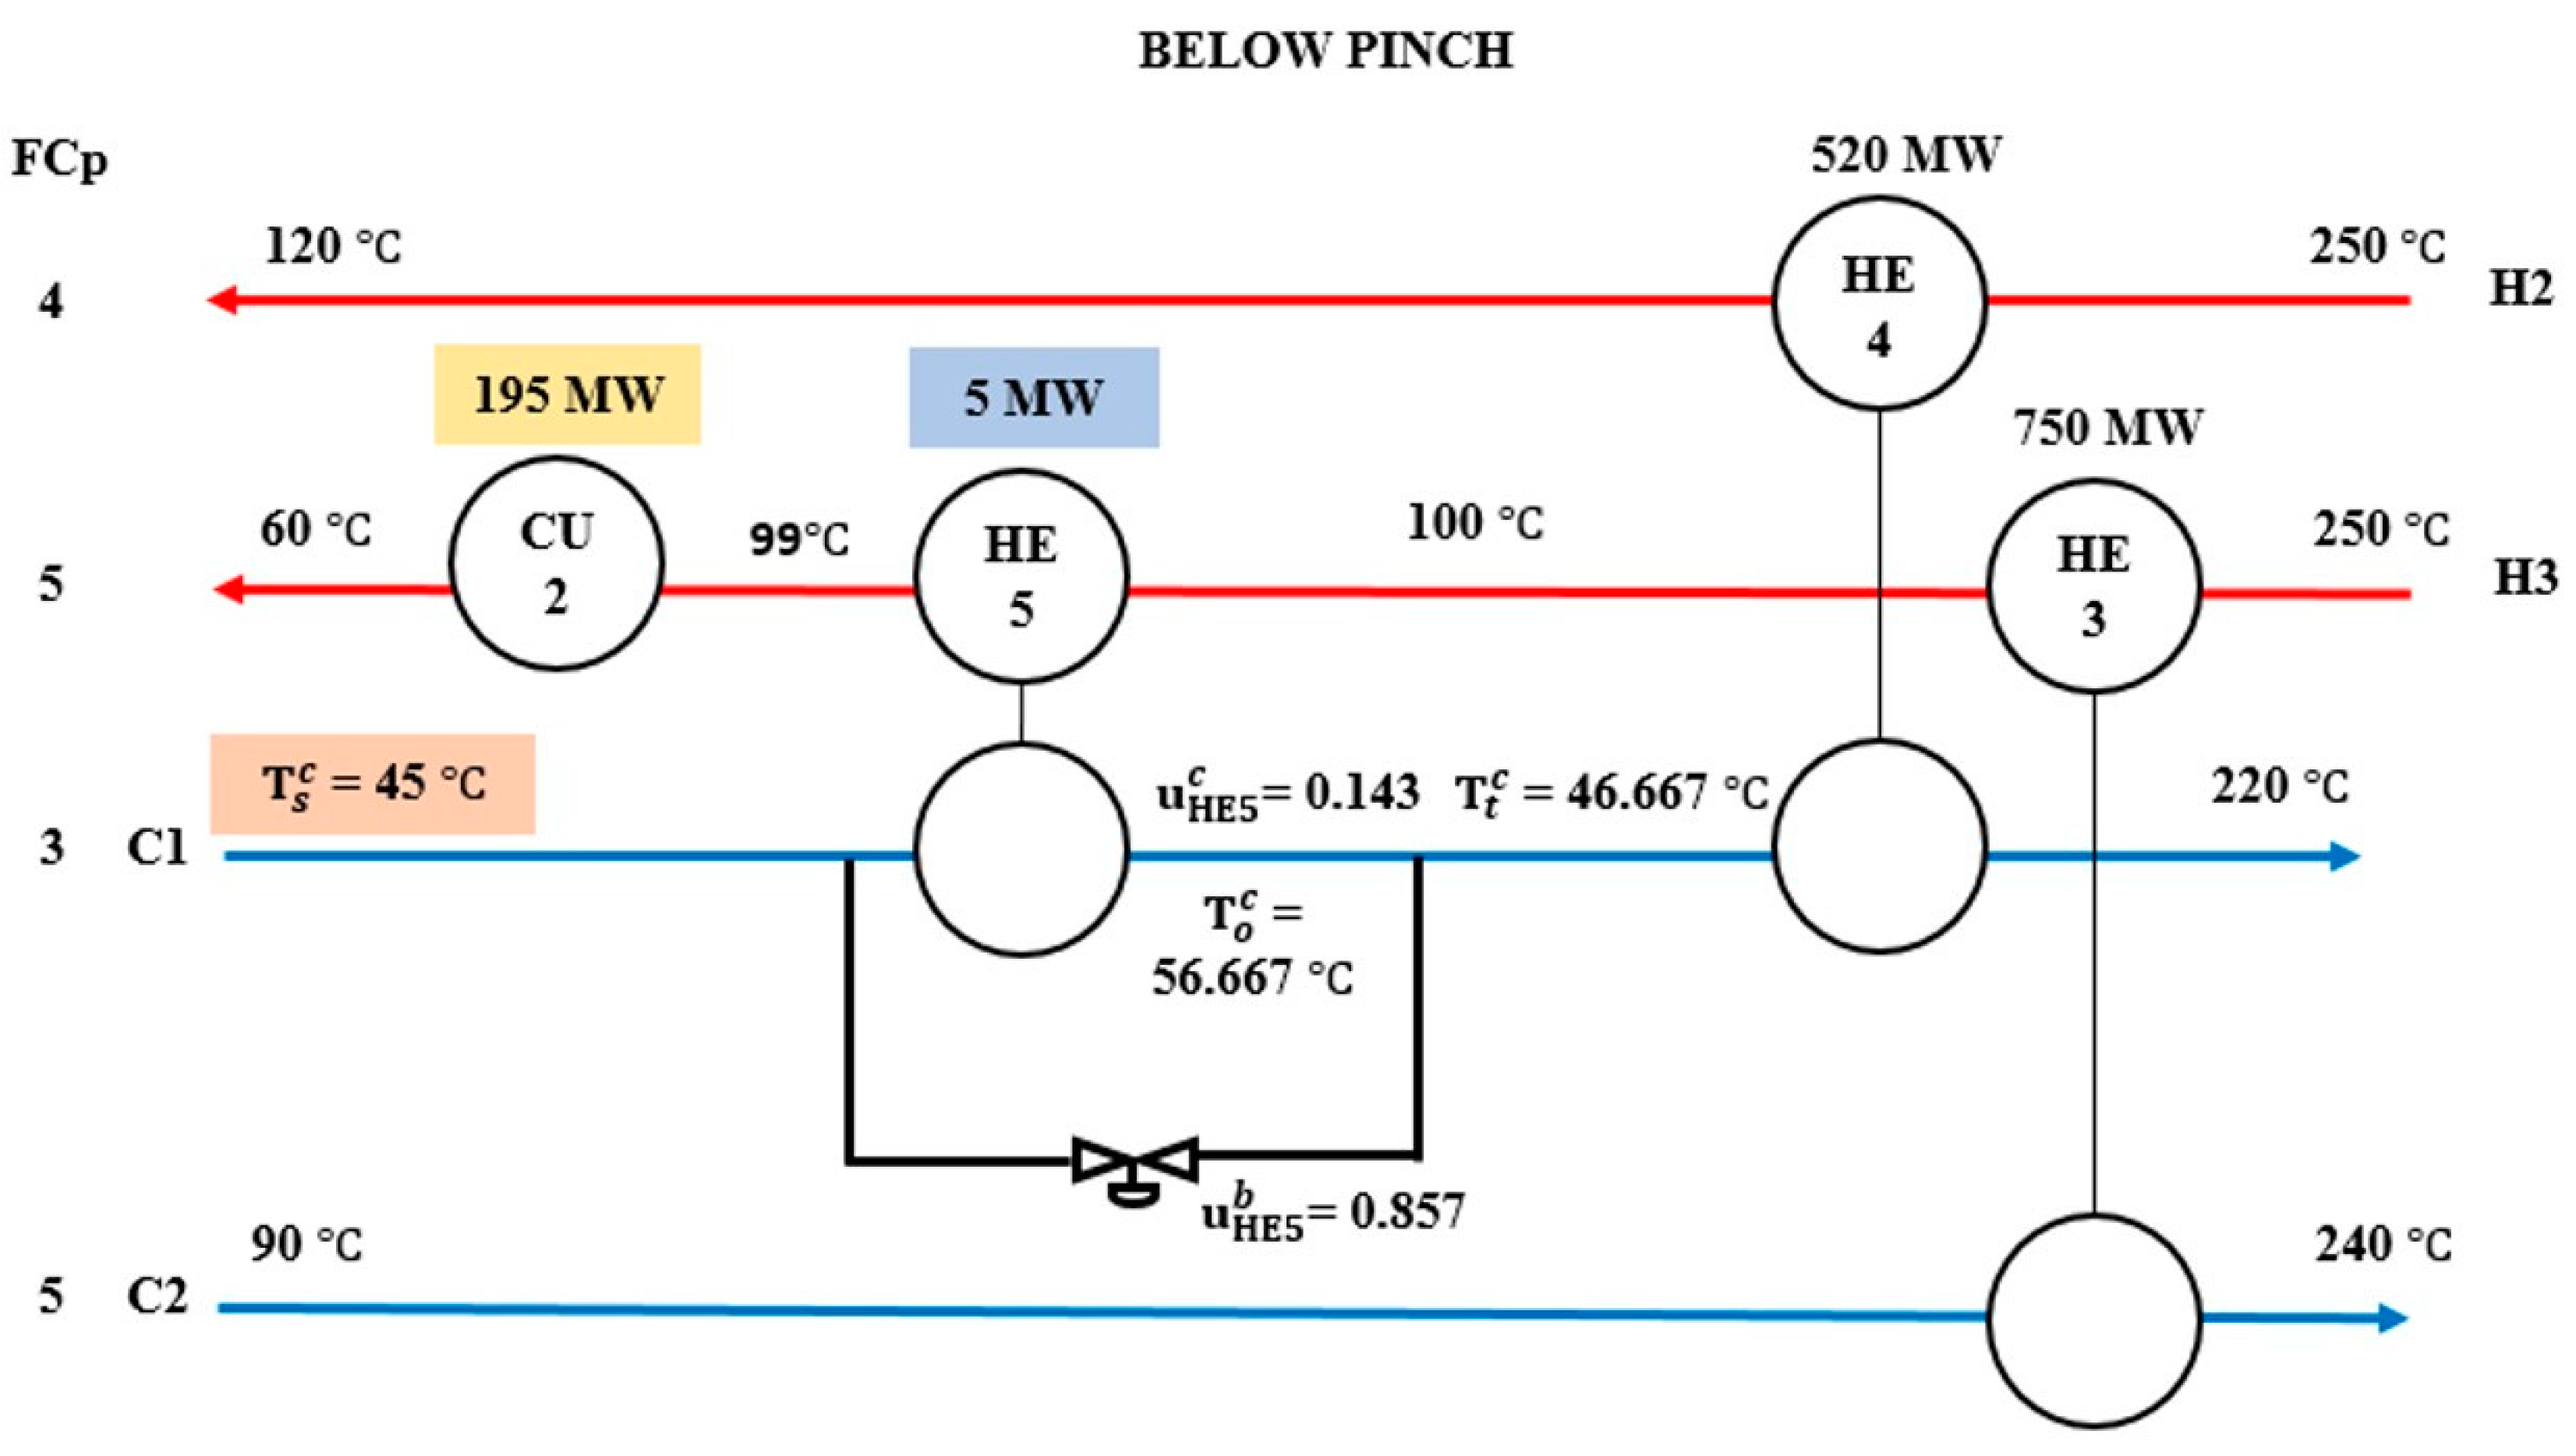
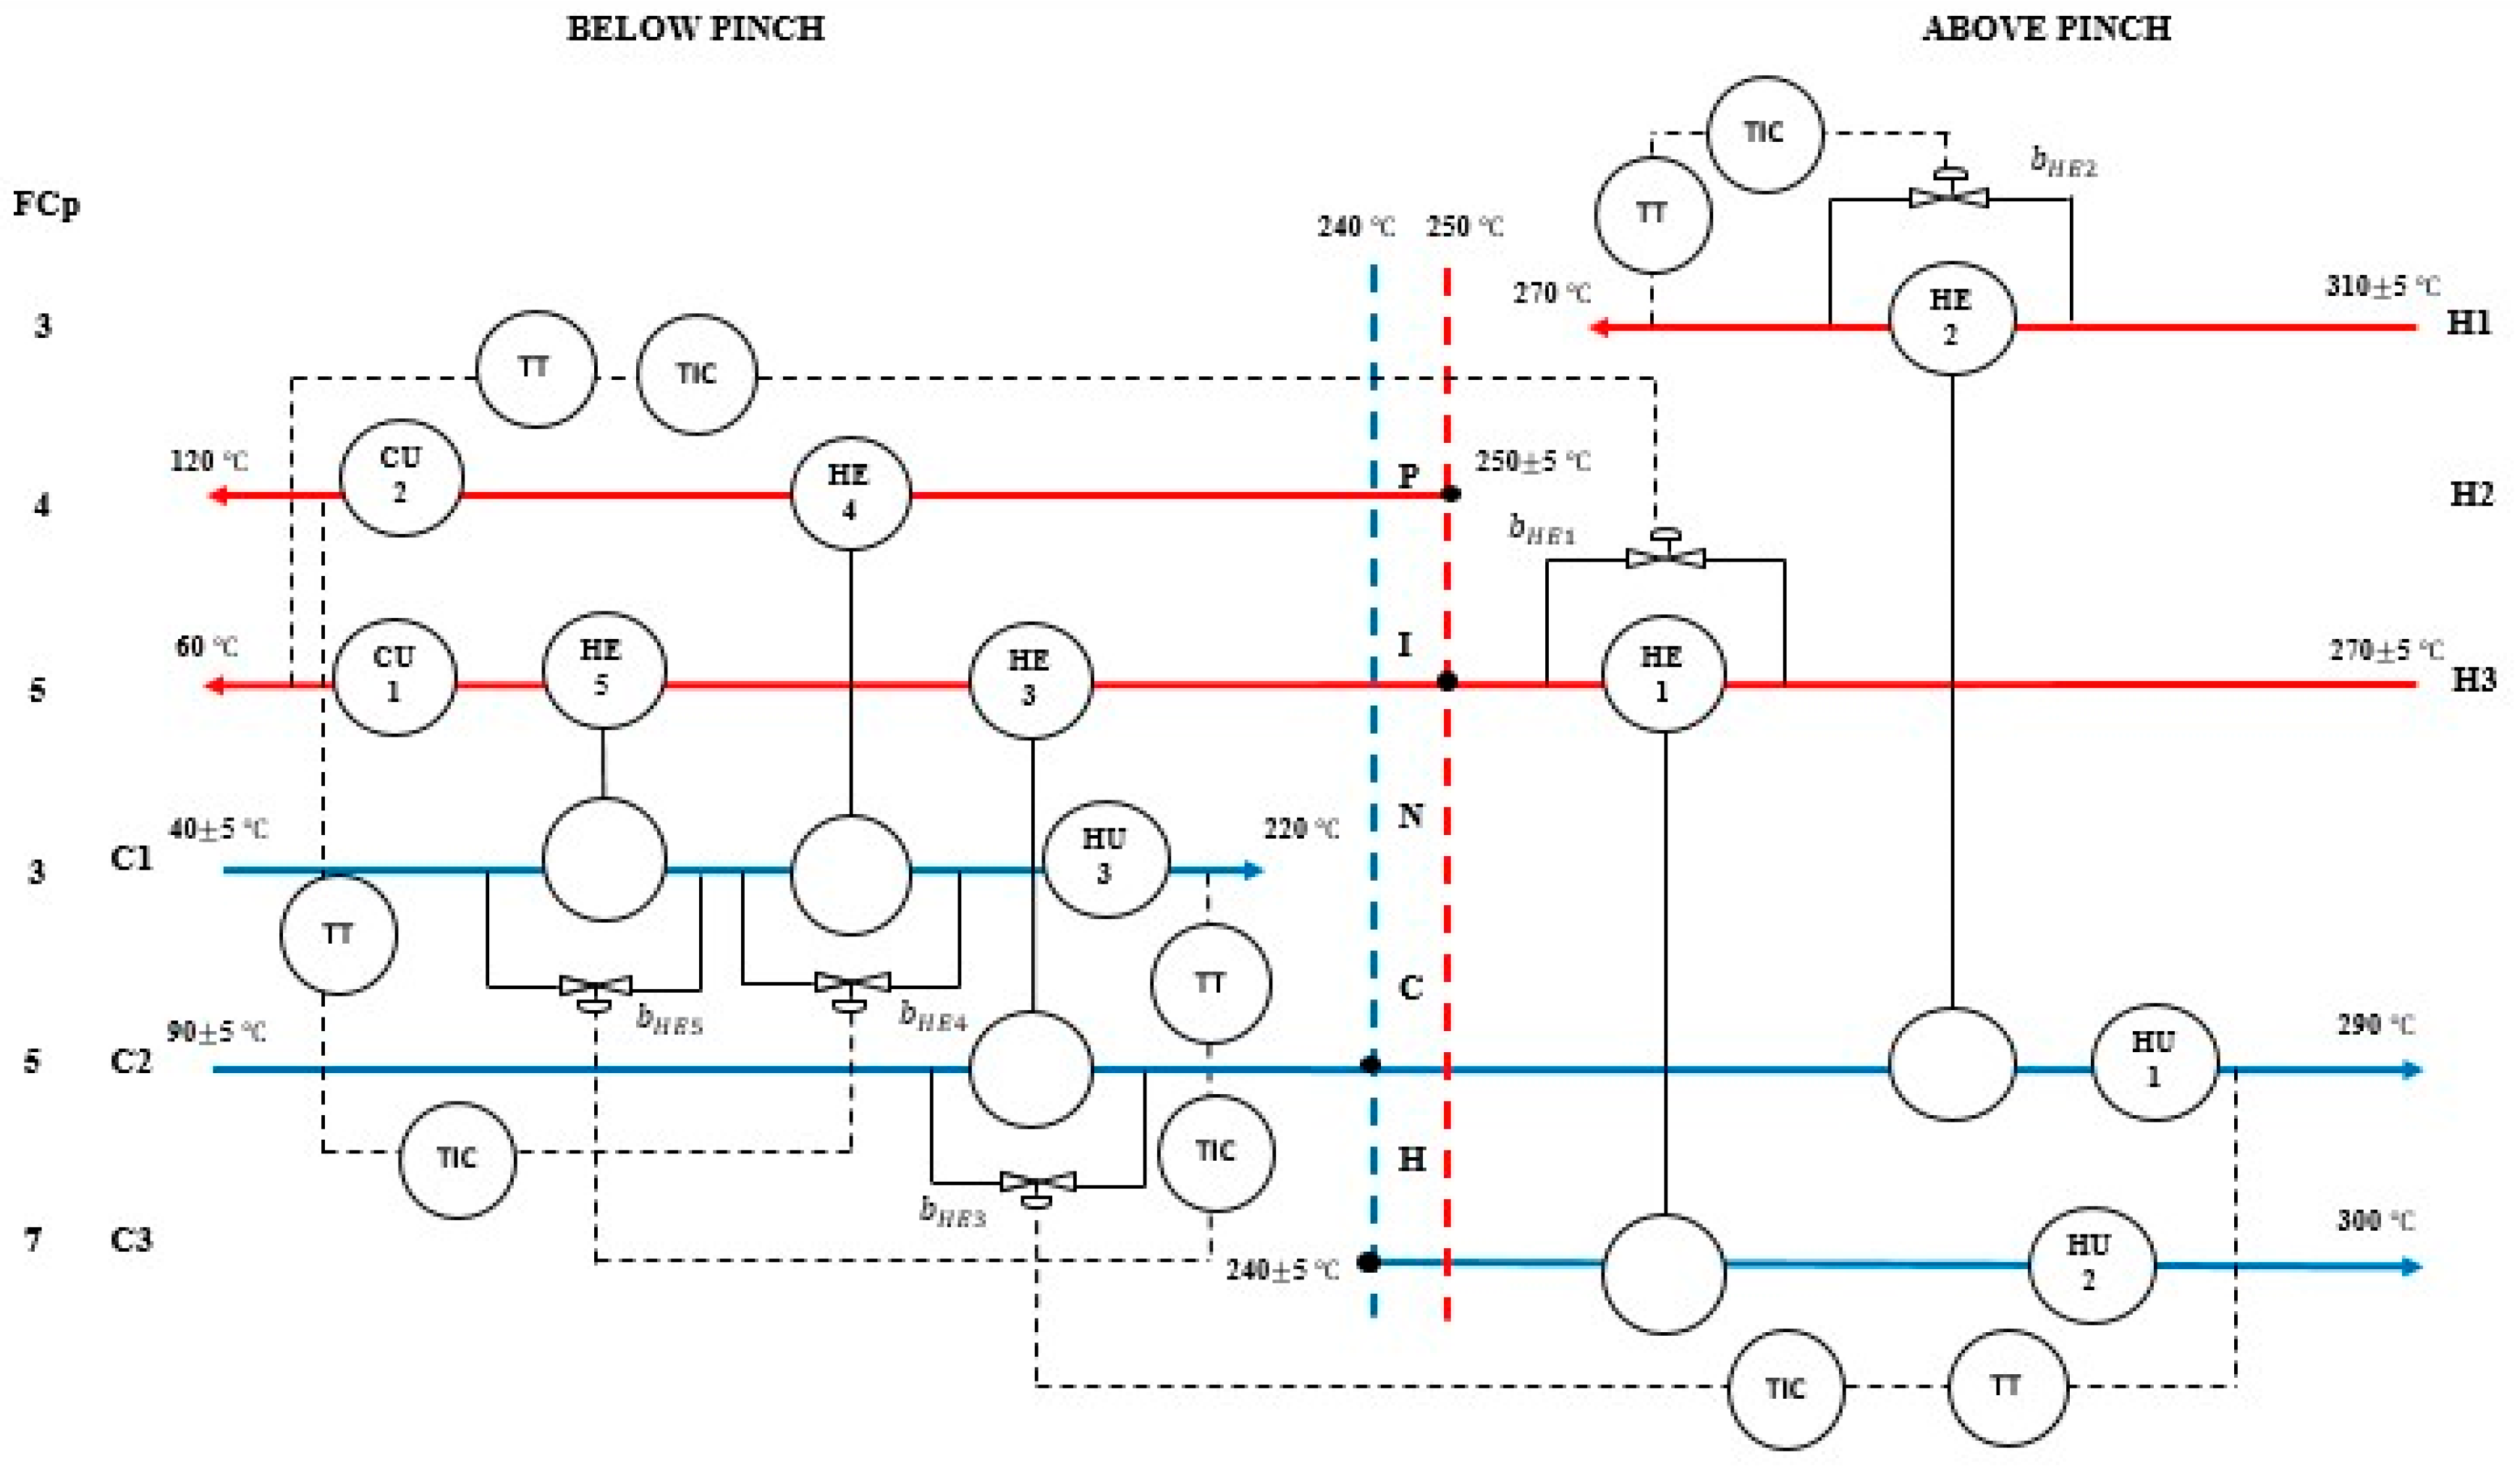
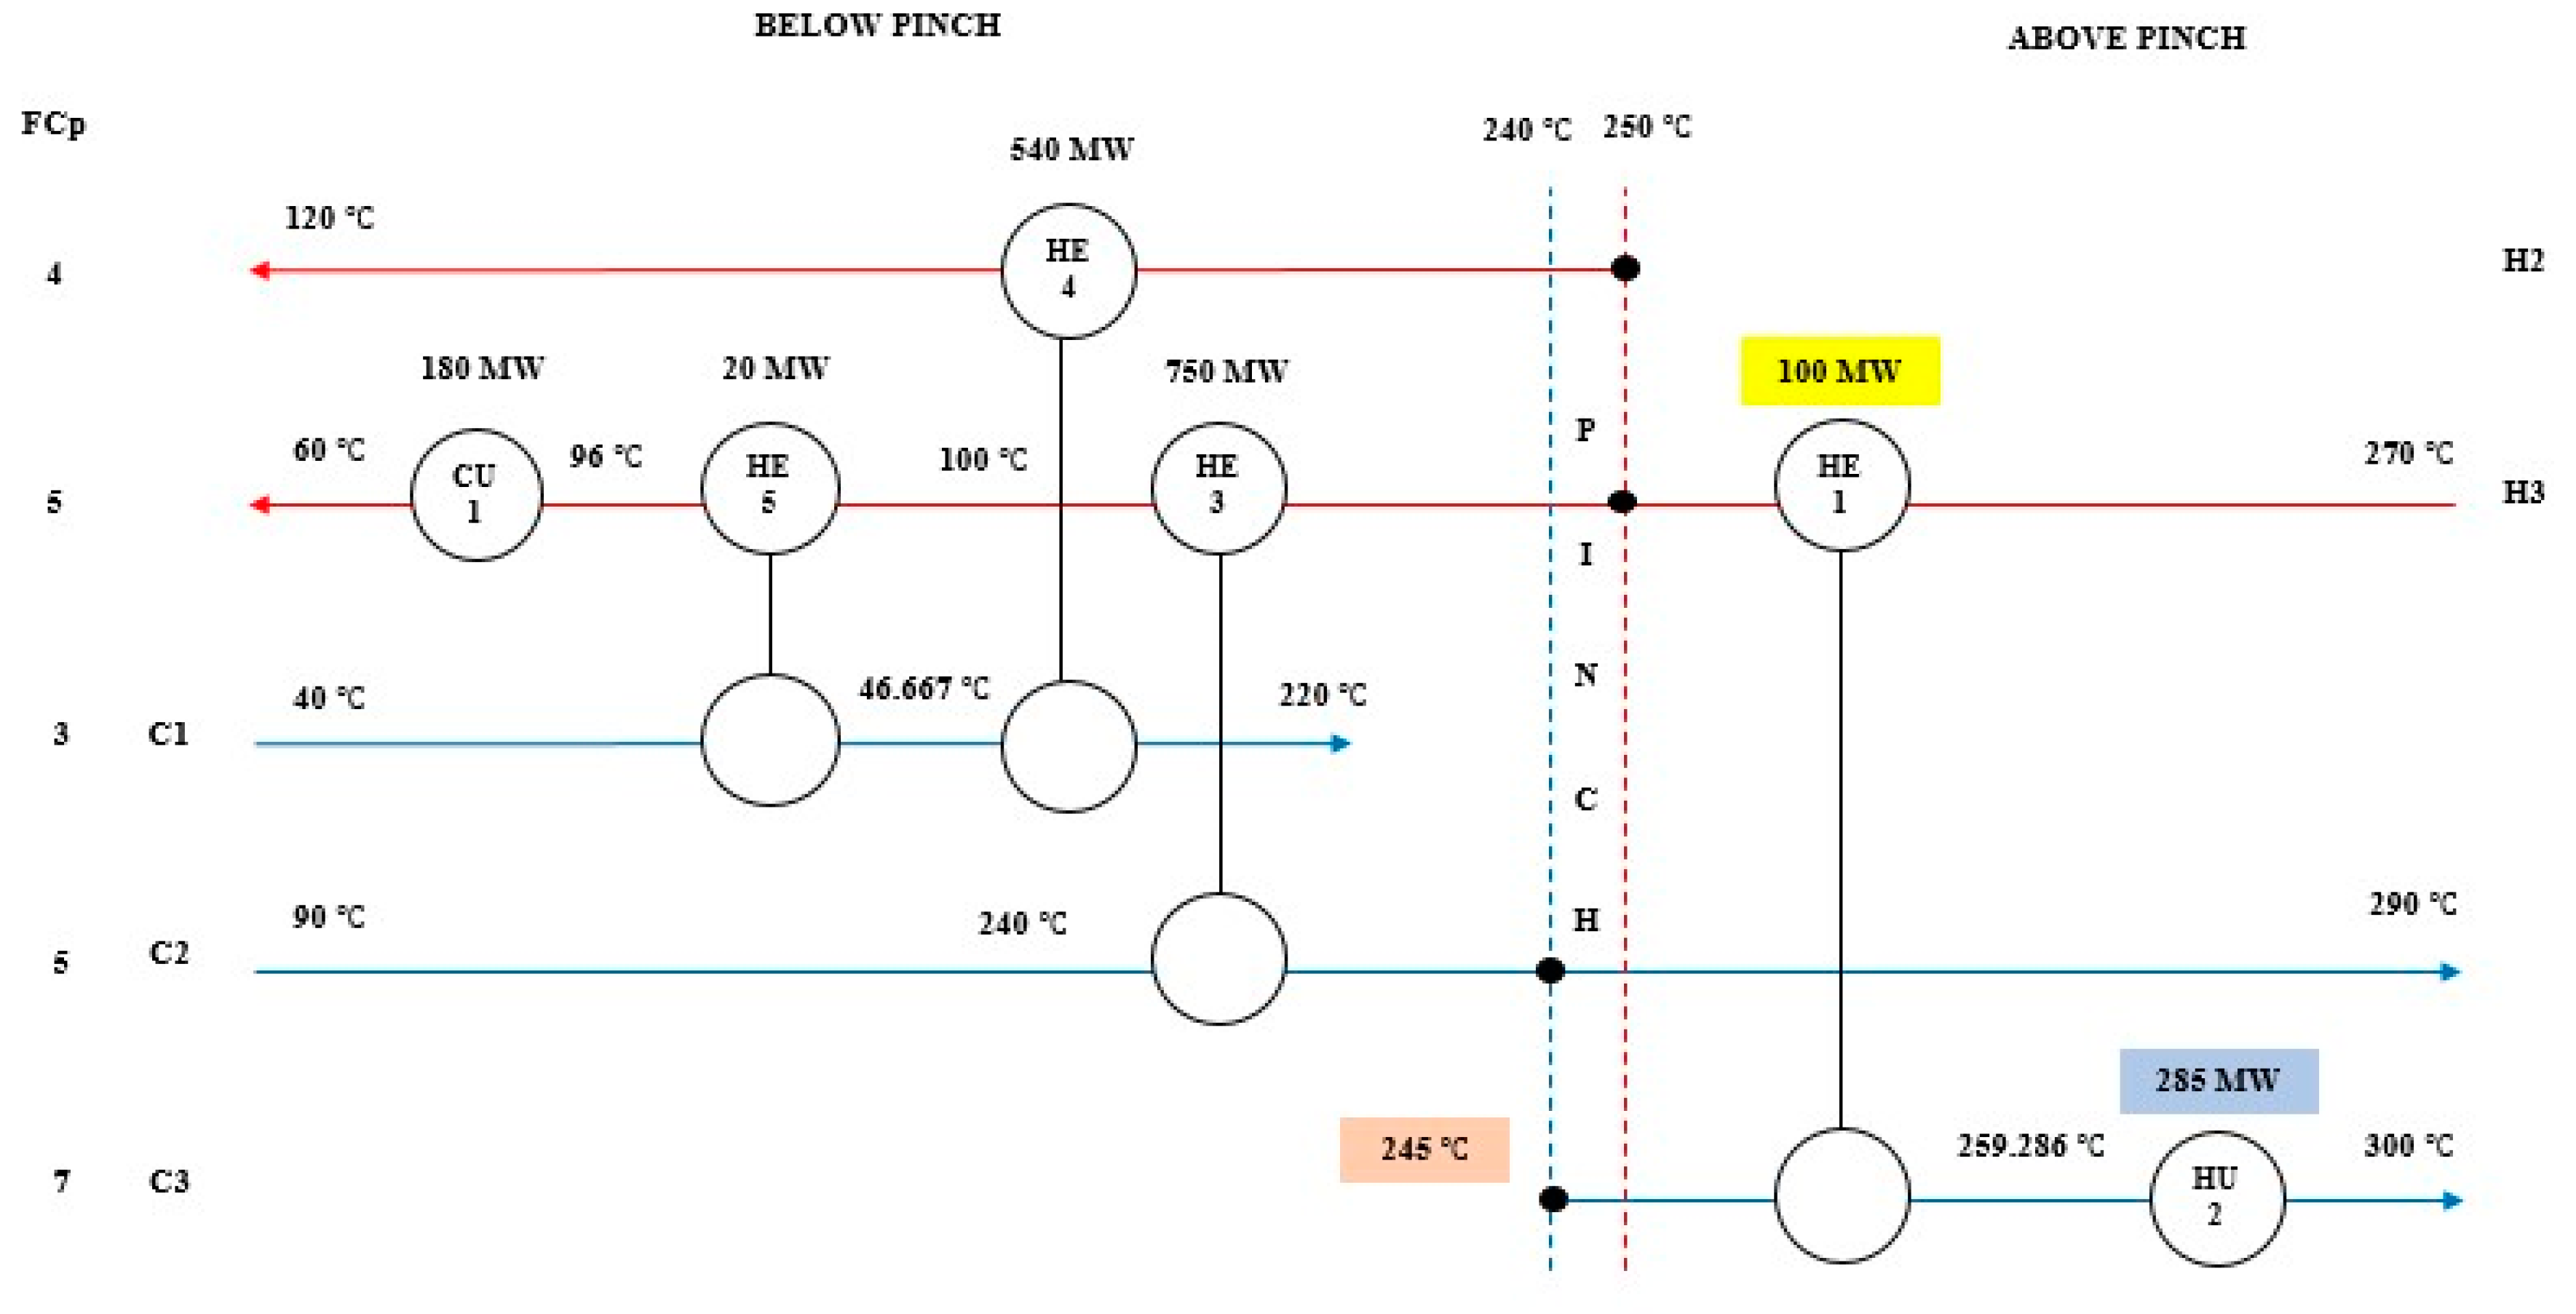
2.3. Step 3: Construct the Grid Diagram (GD)
2.4. Step 4: Manage Fluctuating Ts (Ts Disturbances) in HEN to Achieve MER
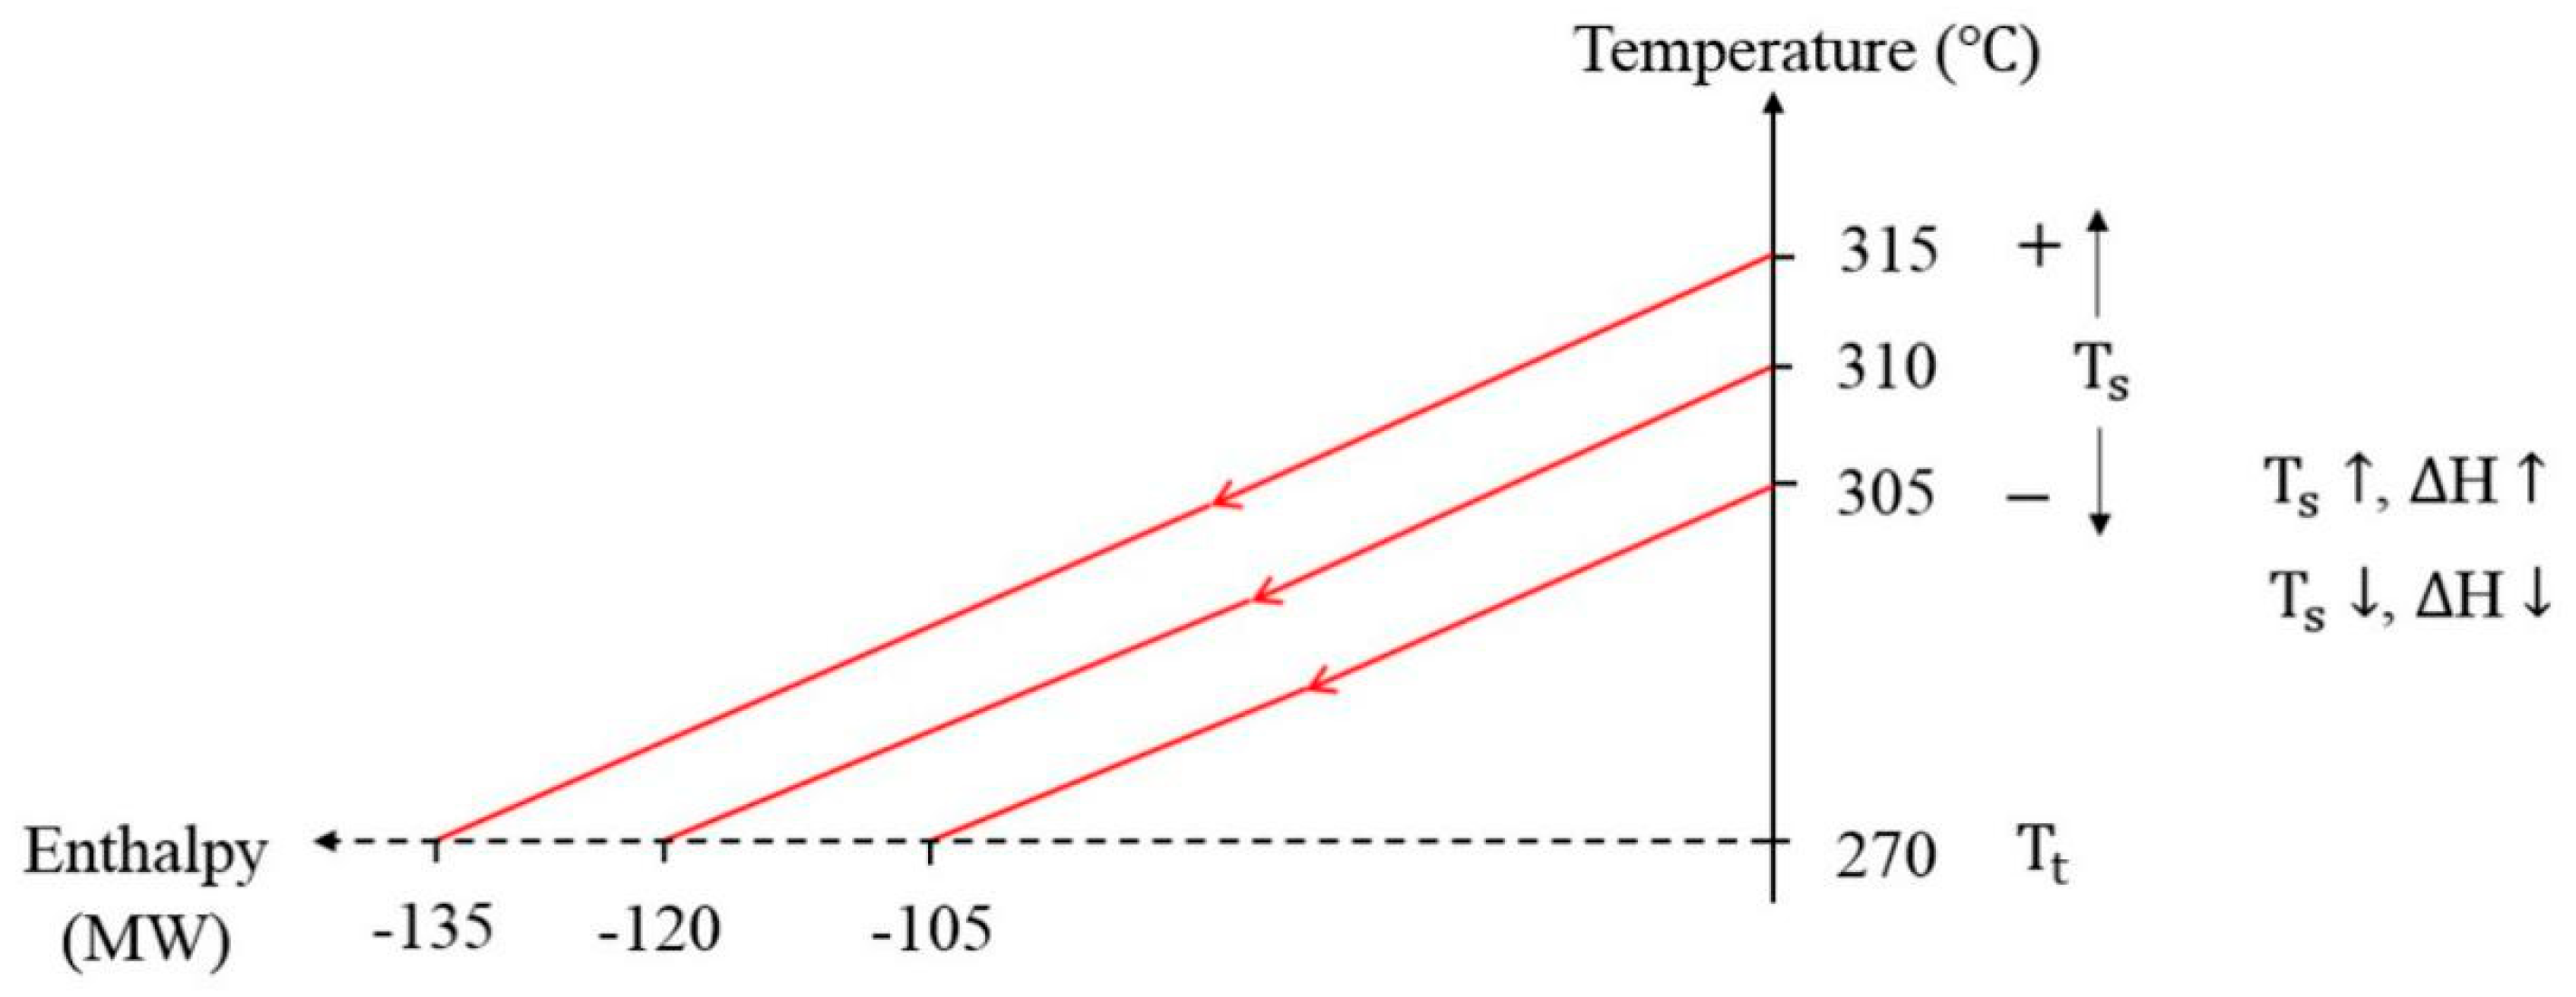
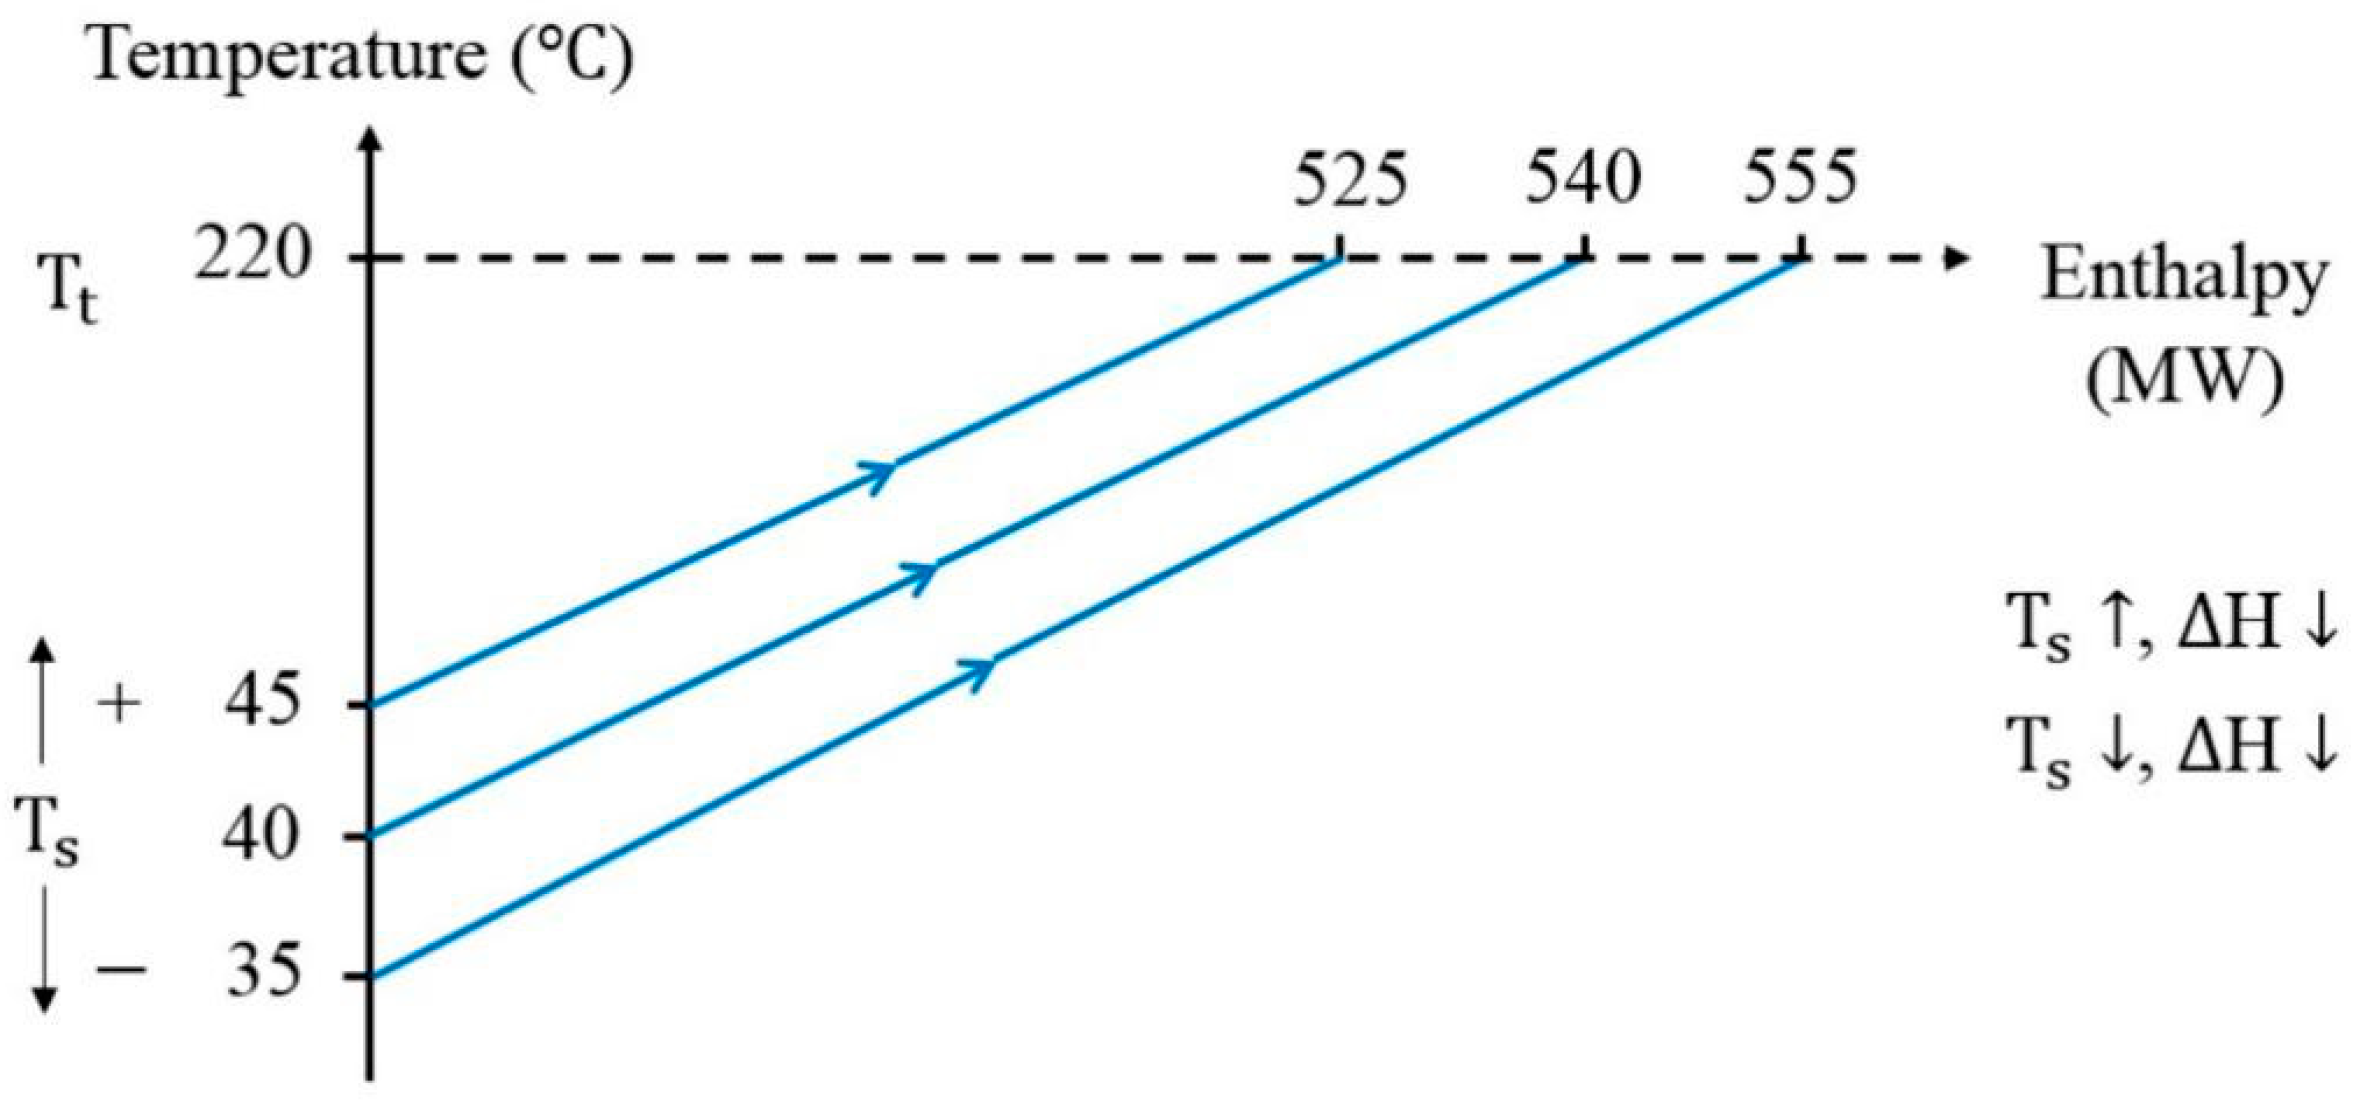
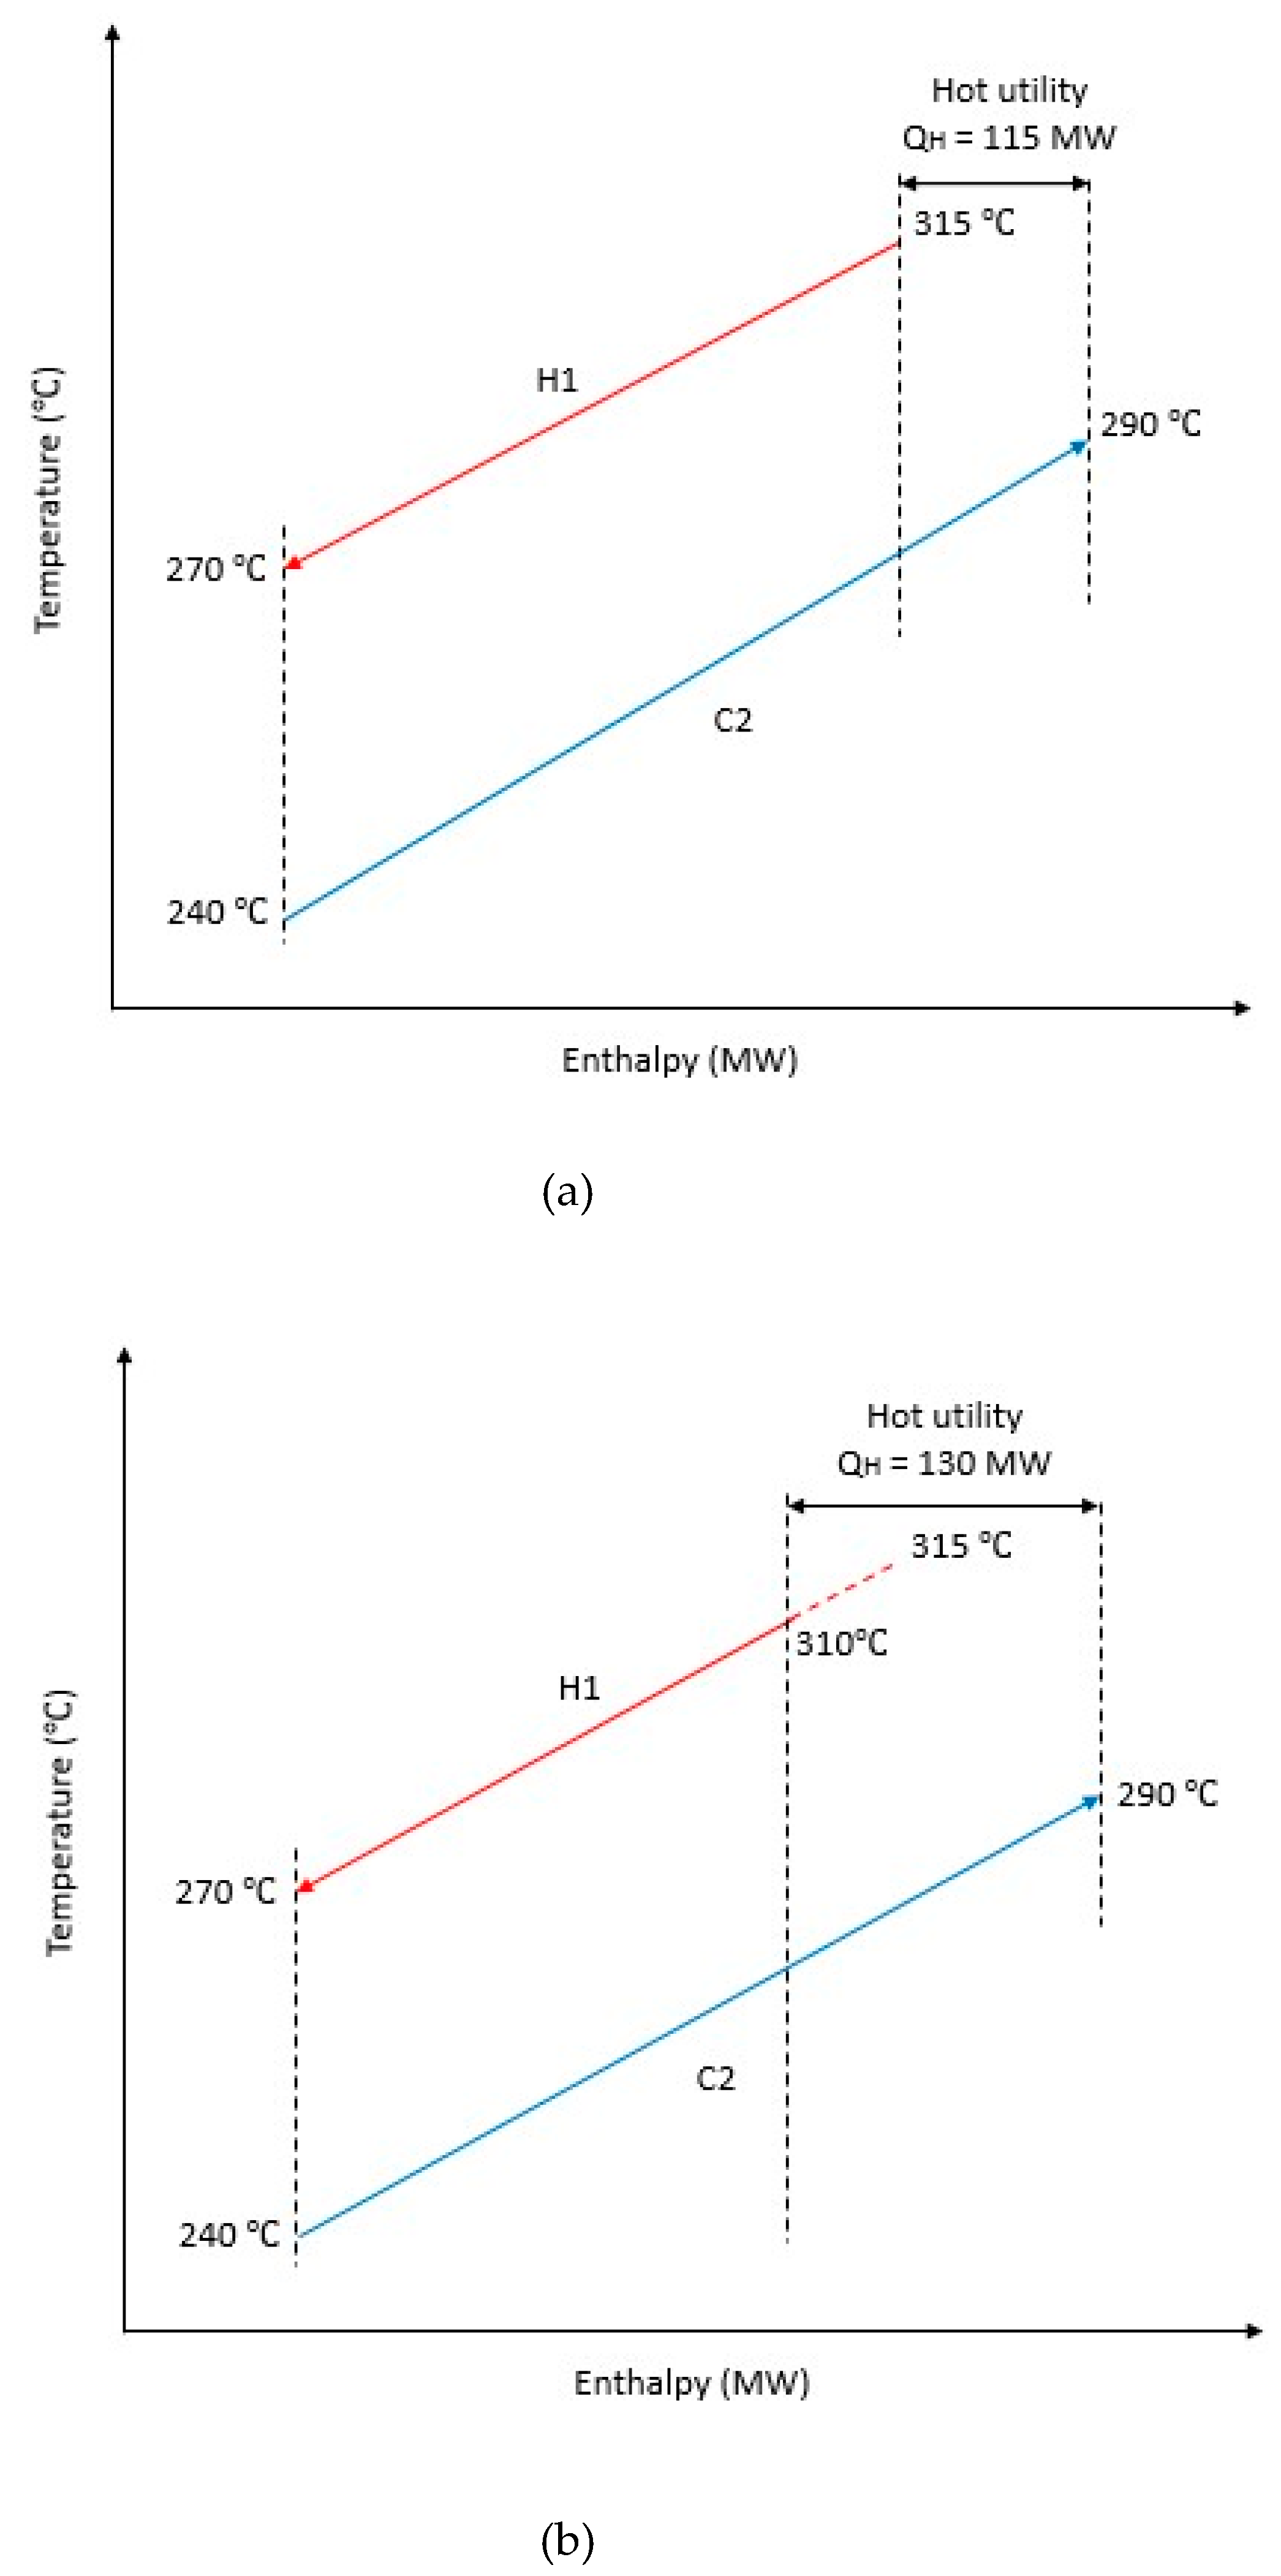
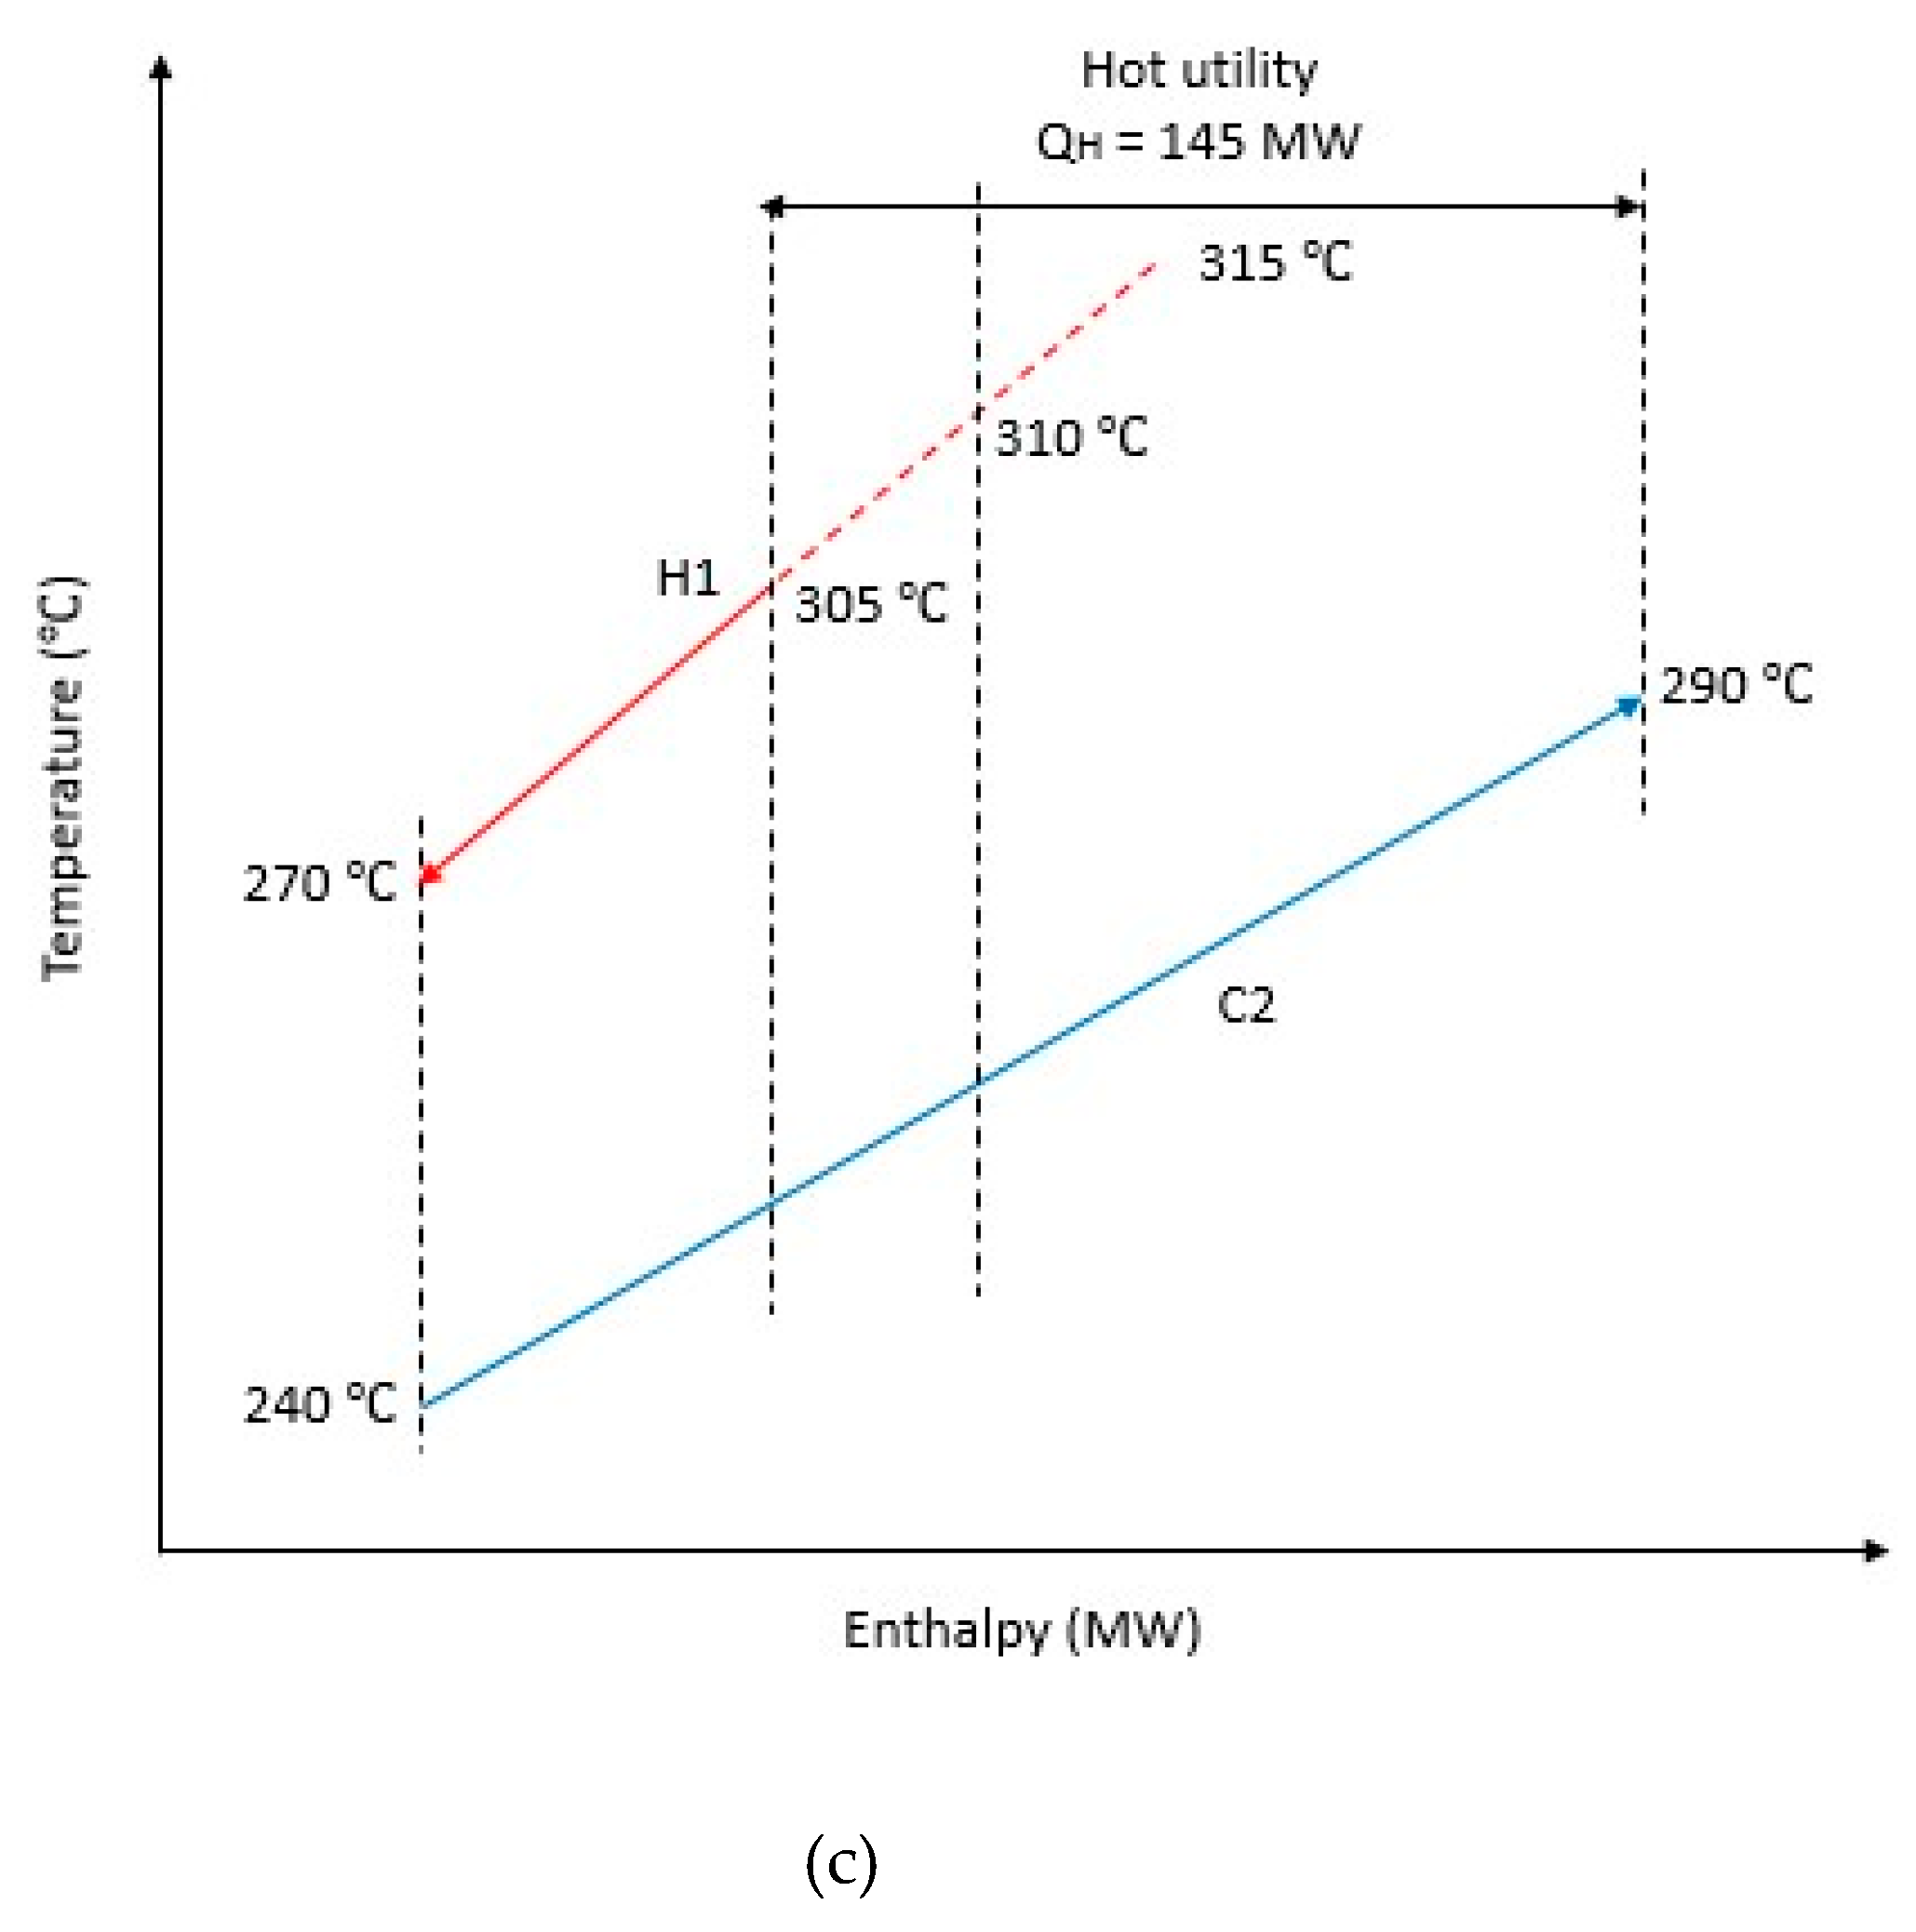
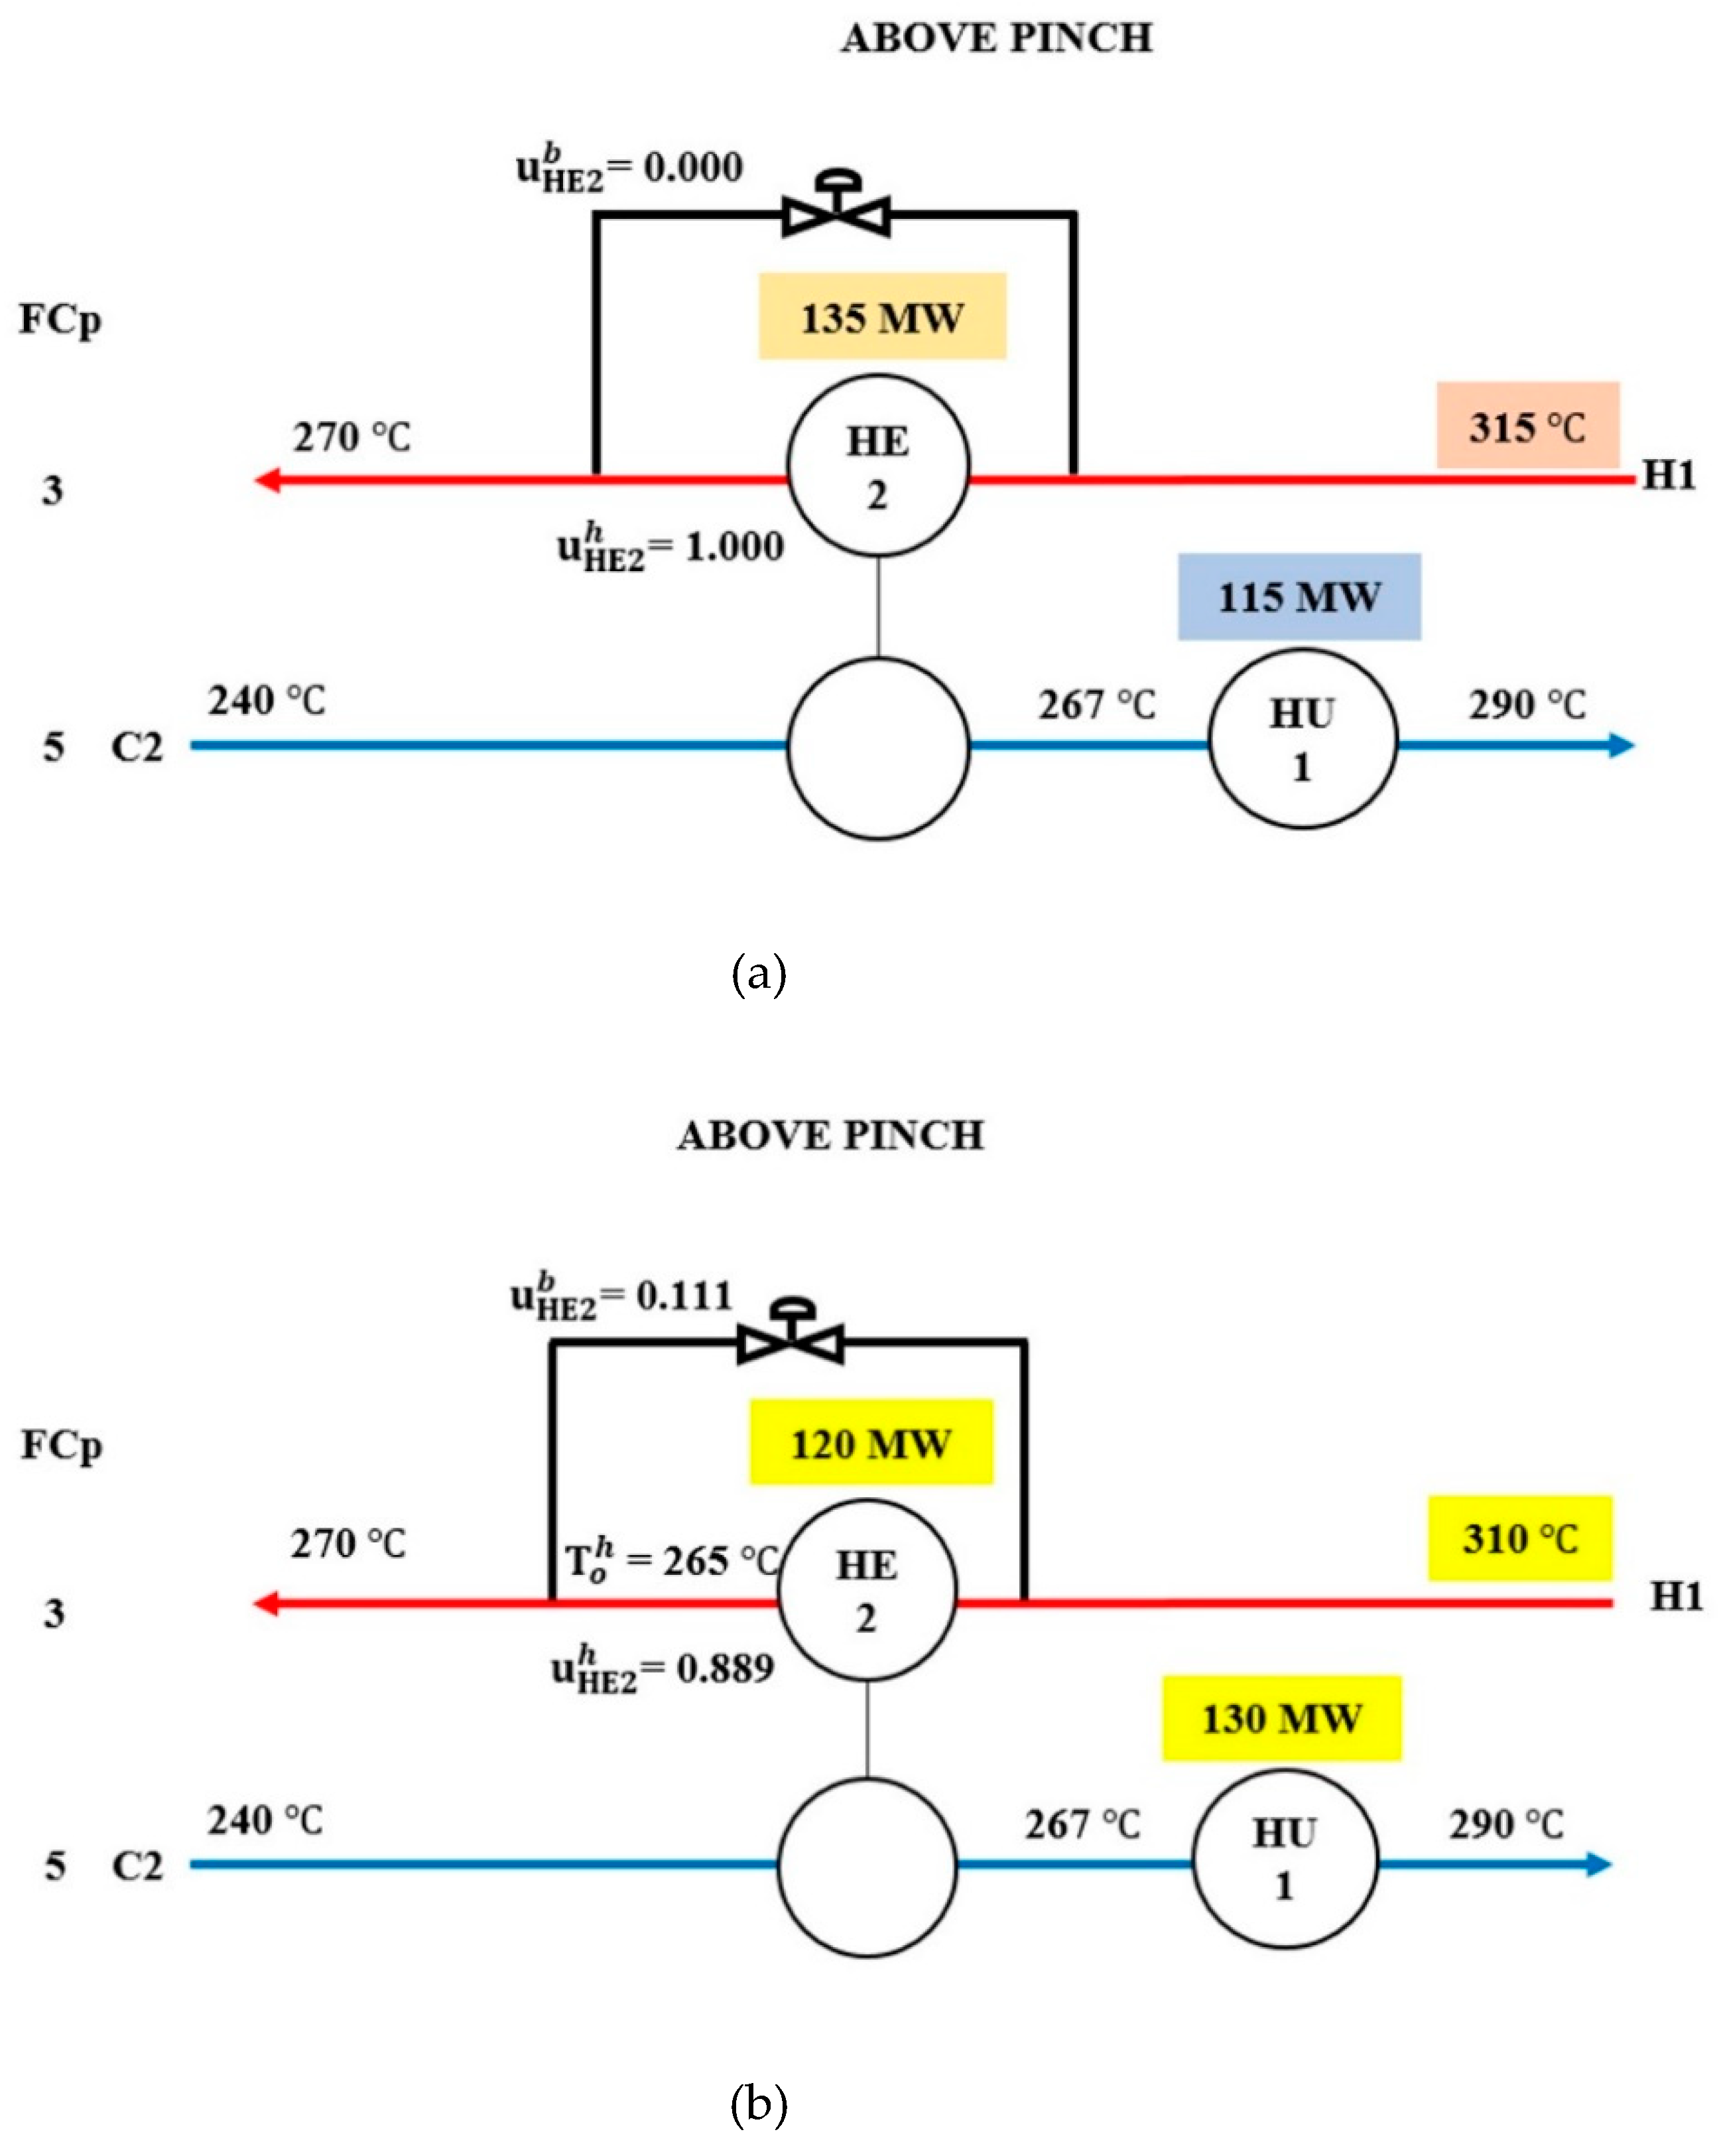
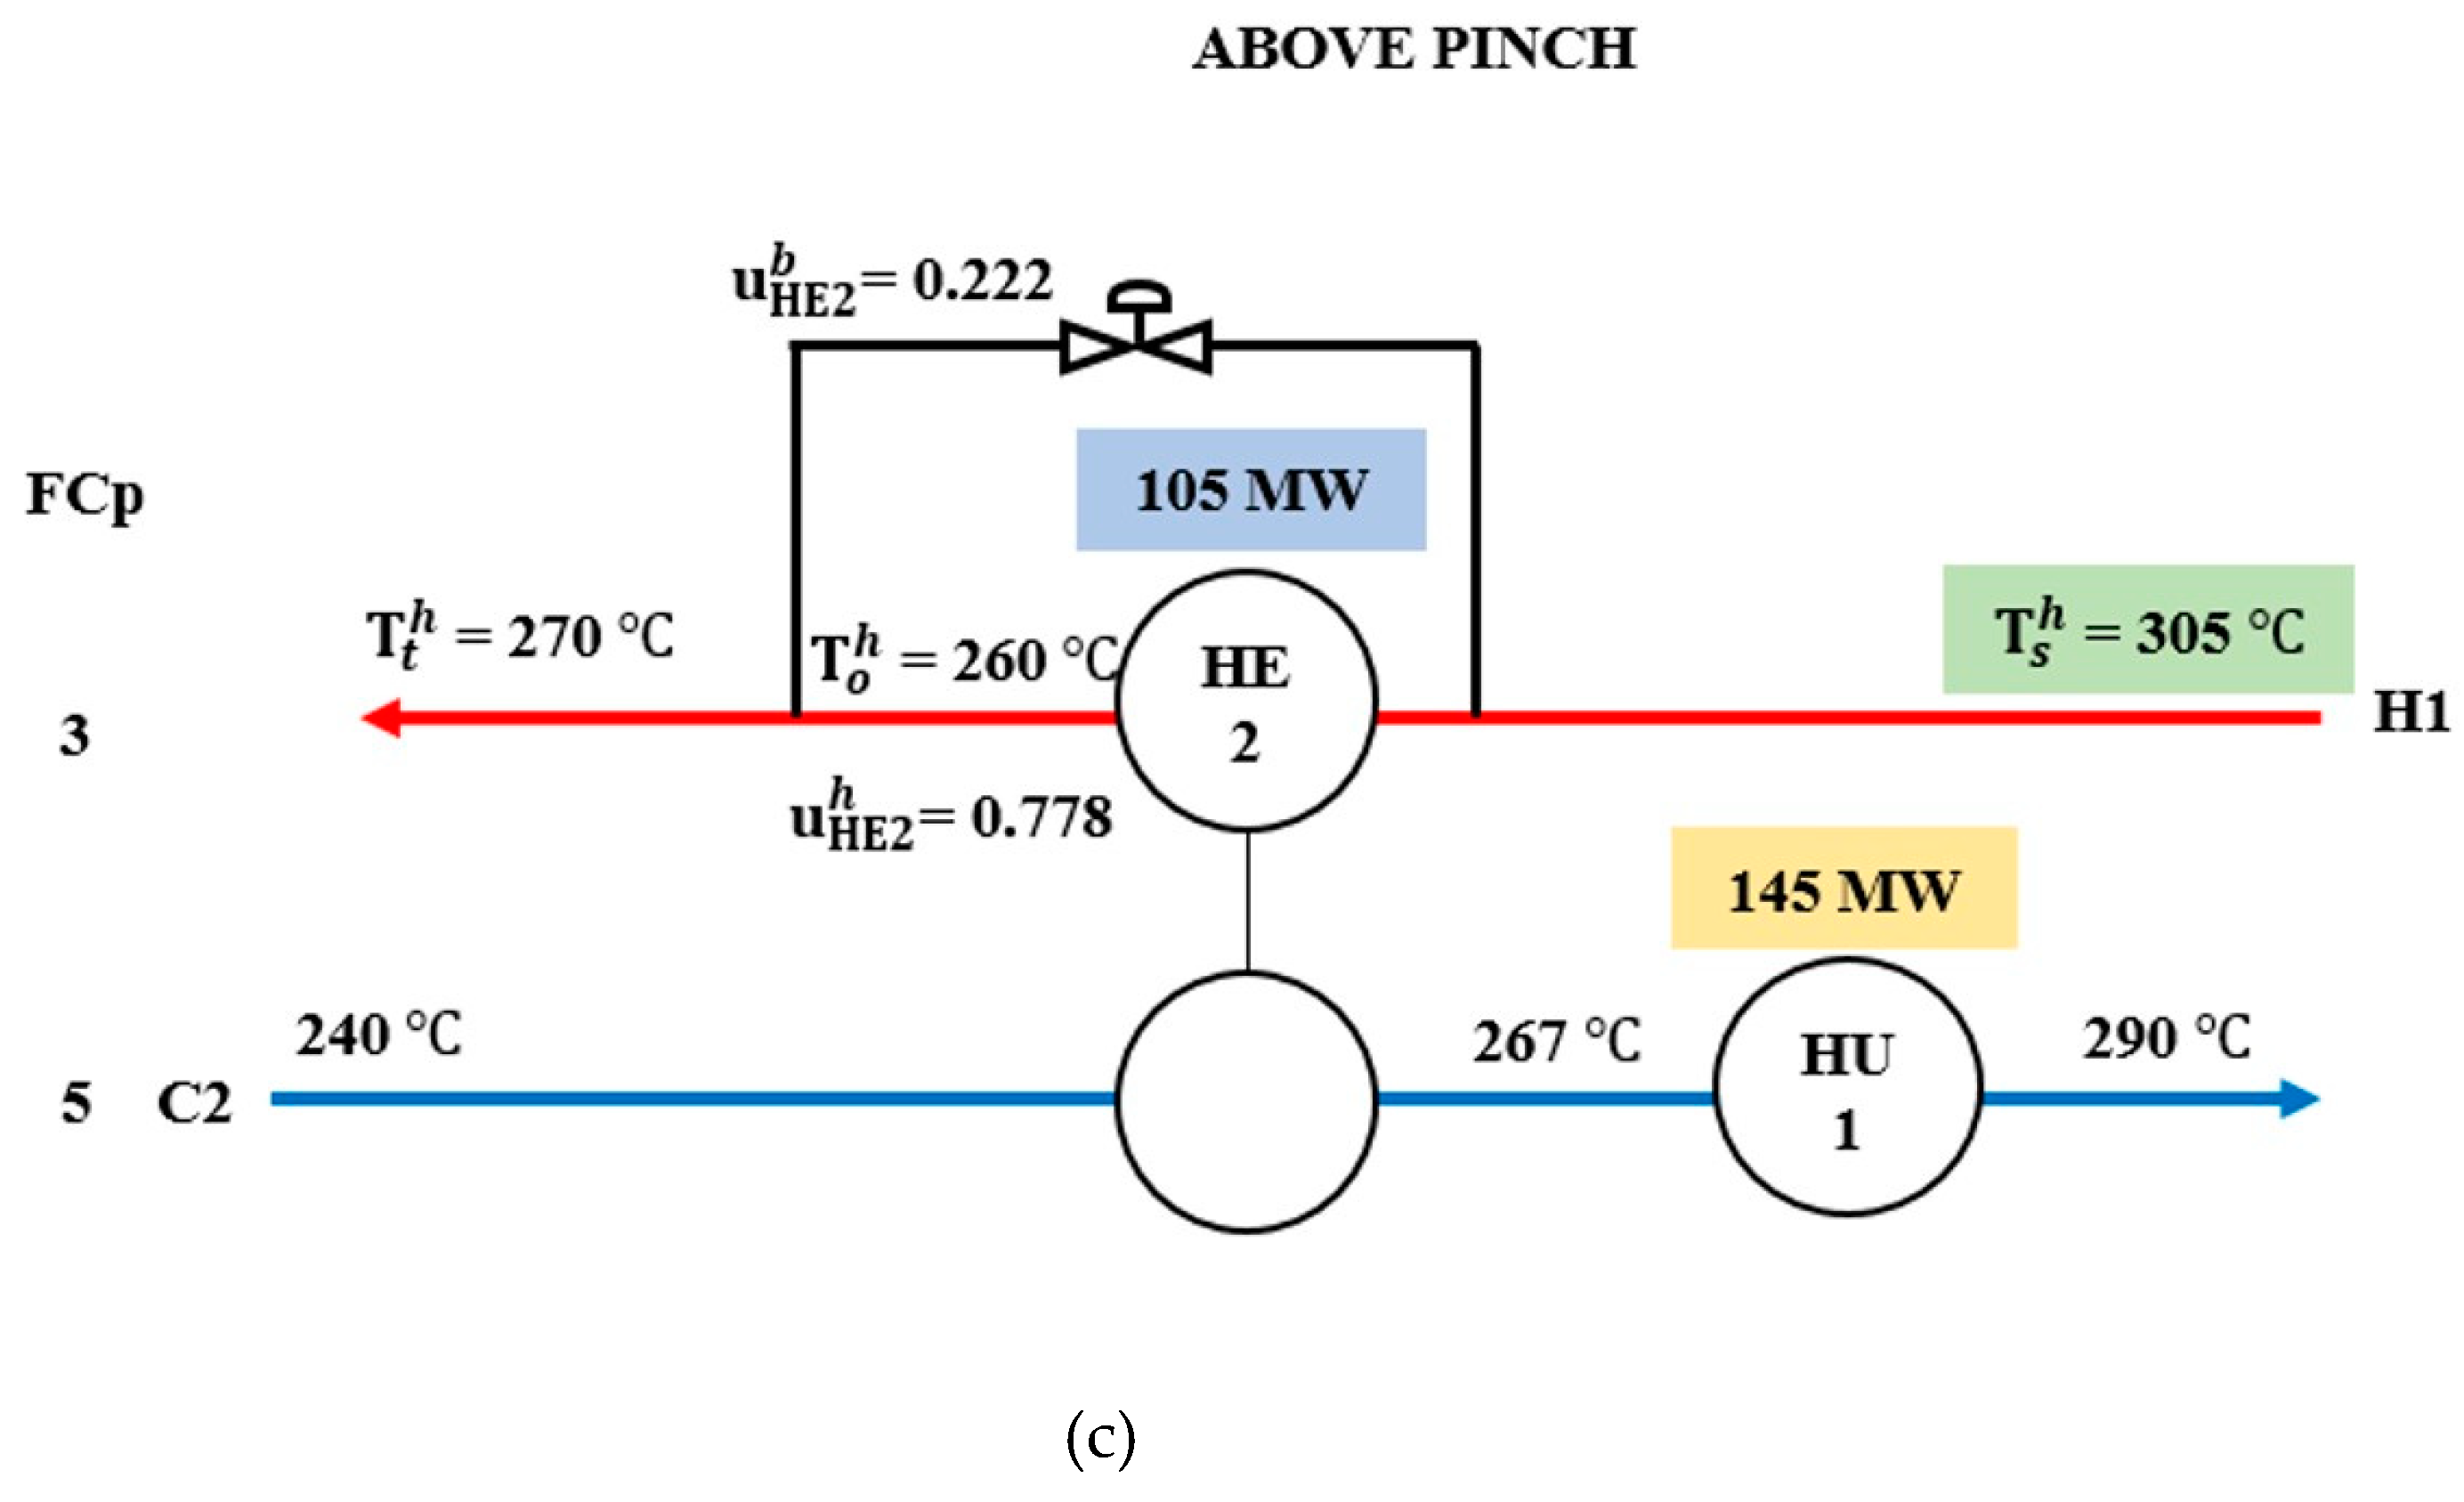
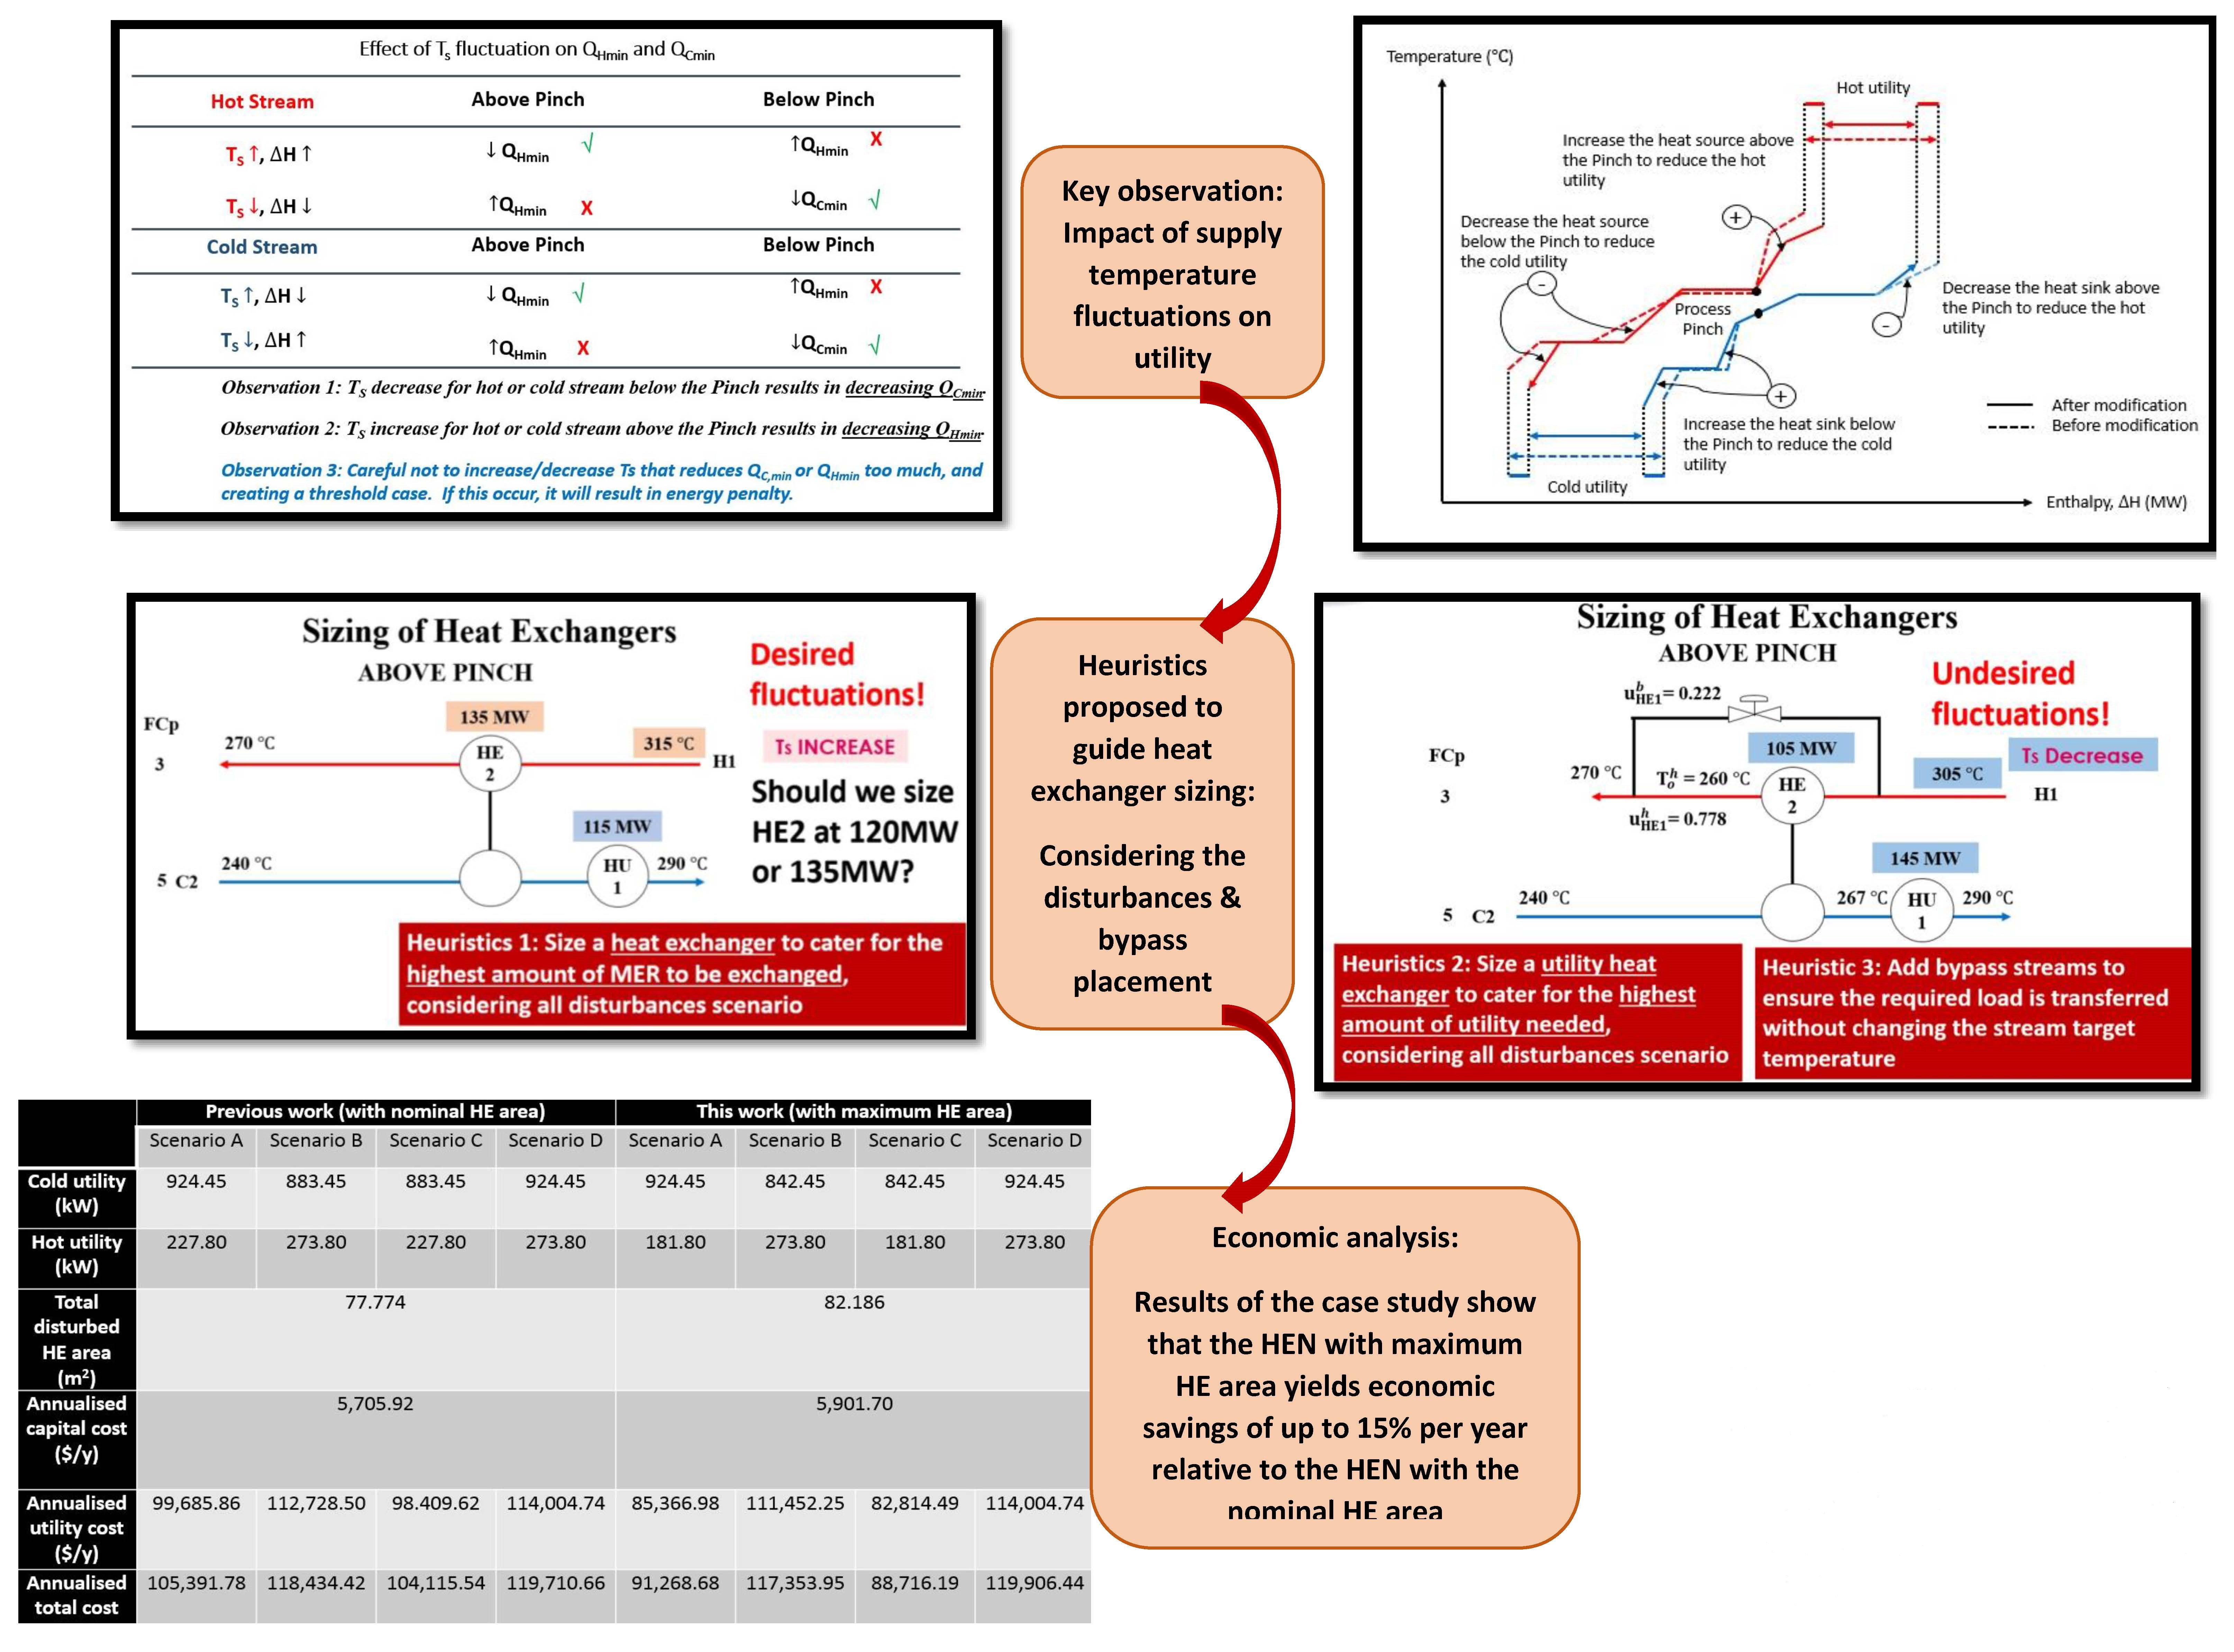
2.4.1. Effect of Increasing or Decreasing TS on Hot and Cold Streams
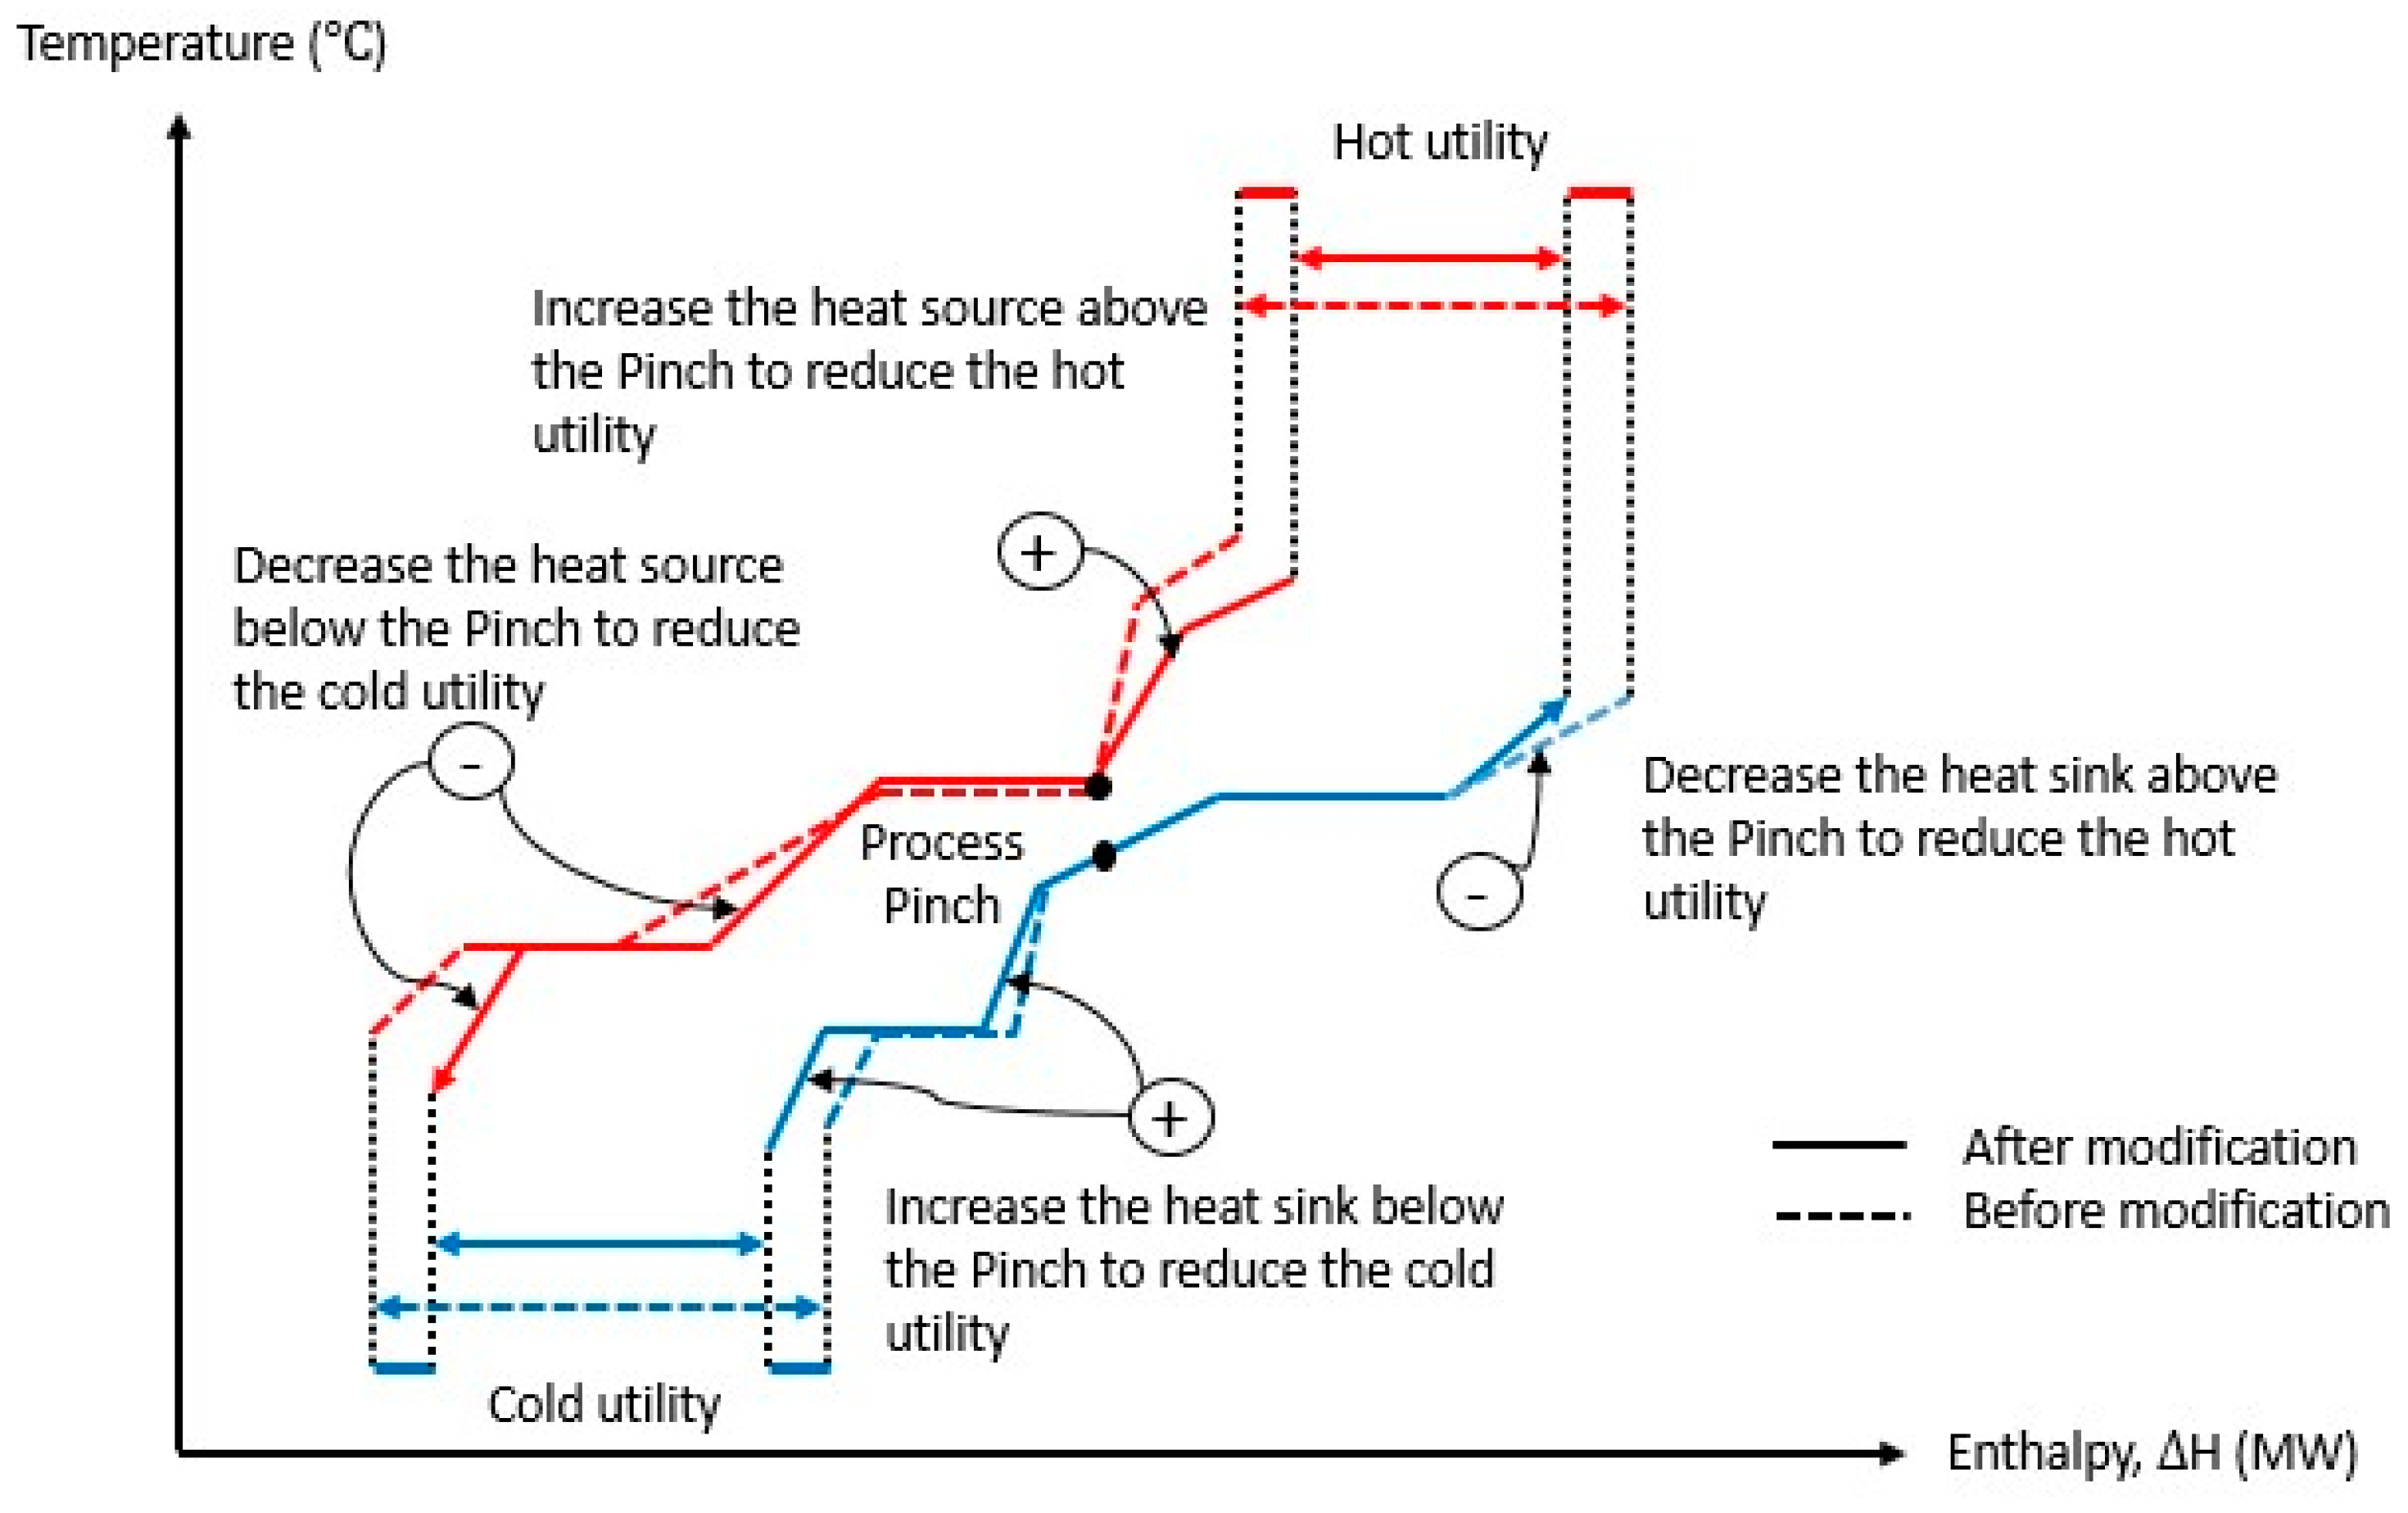
2.4.2. The Plus-Minus Principle Concept
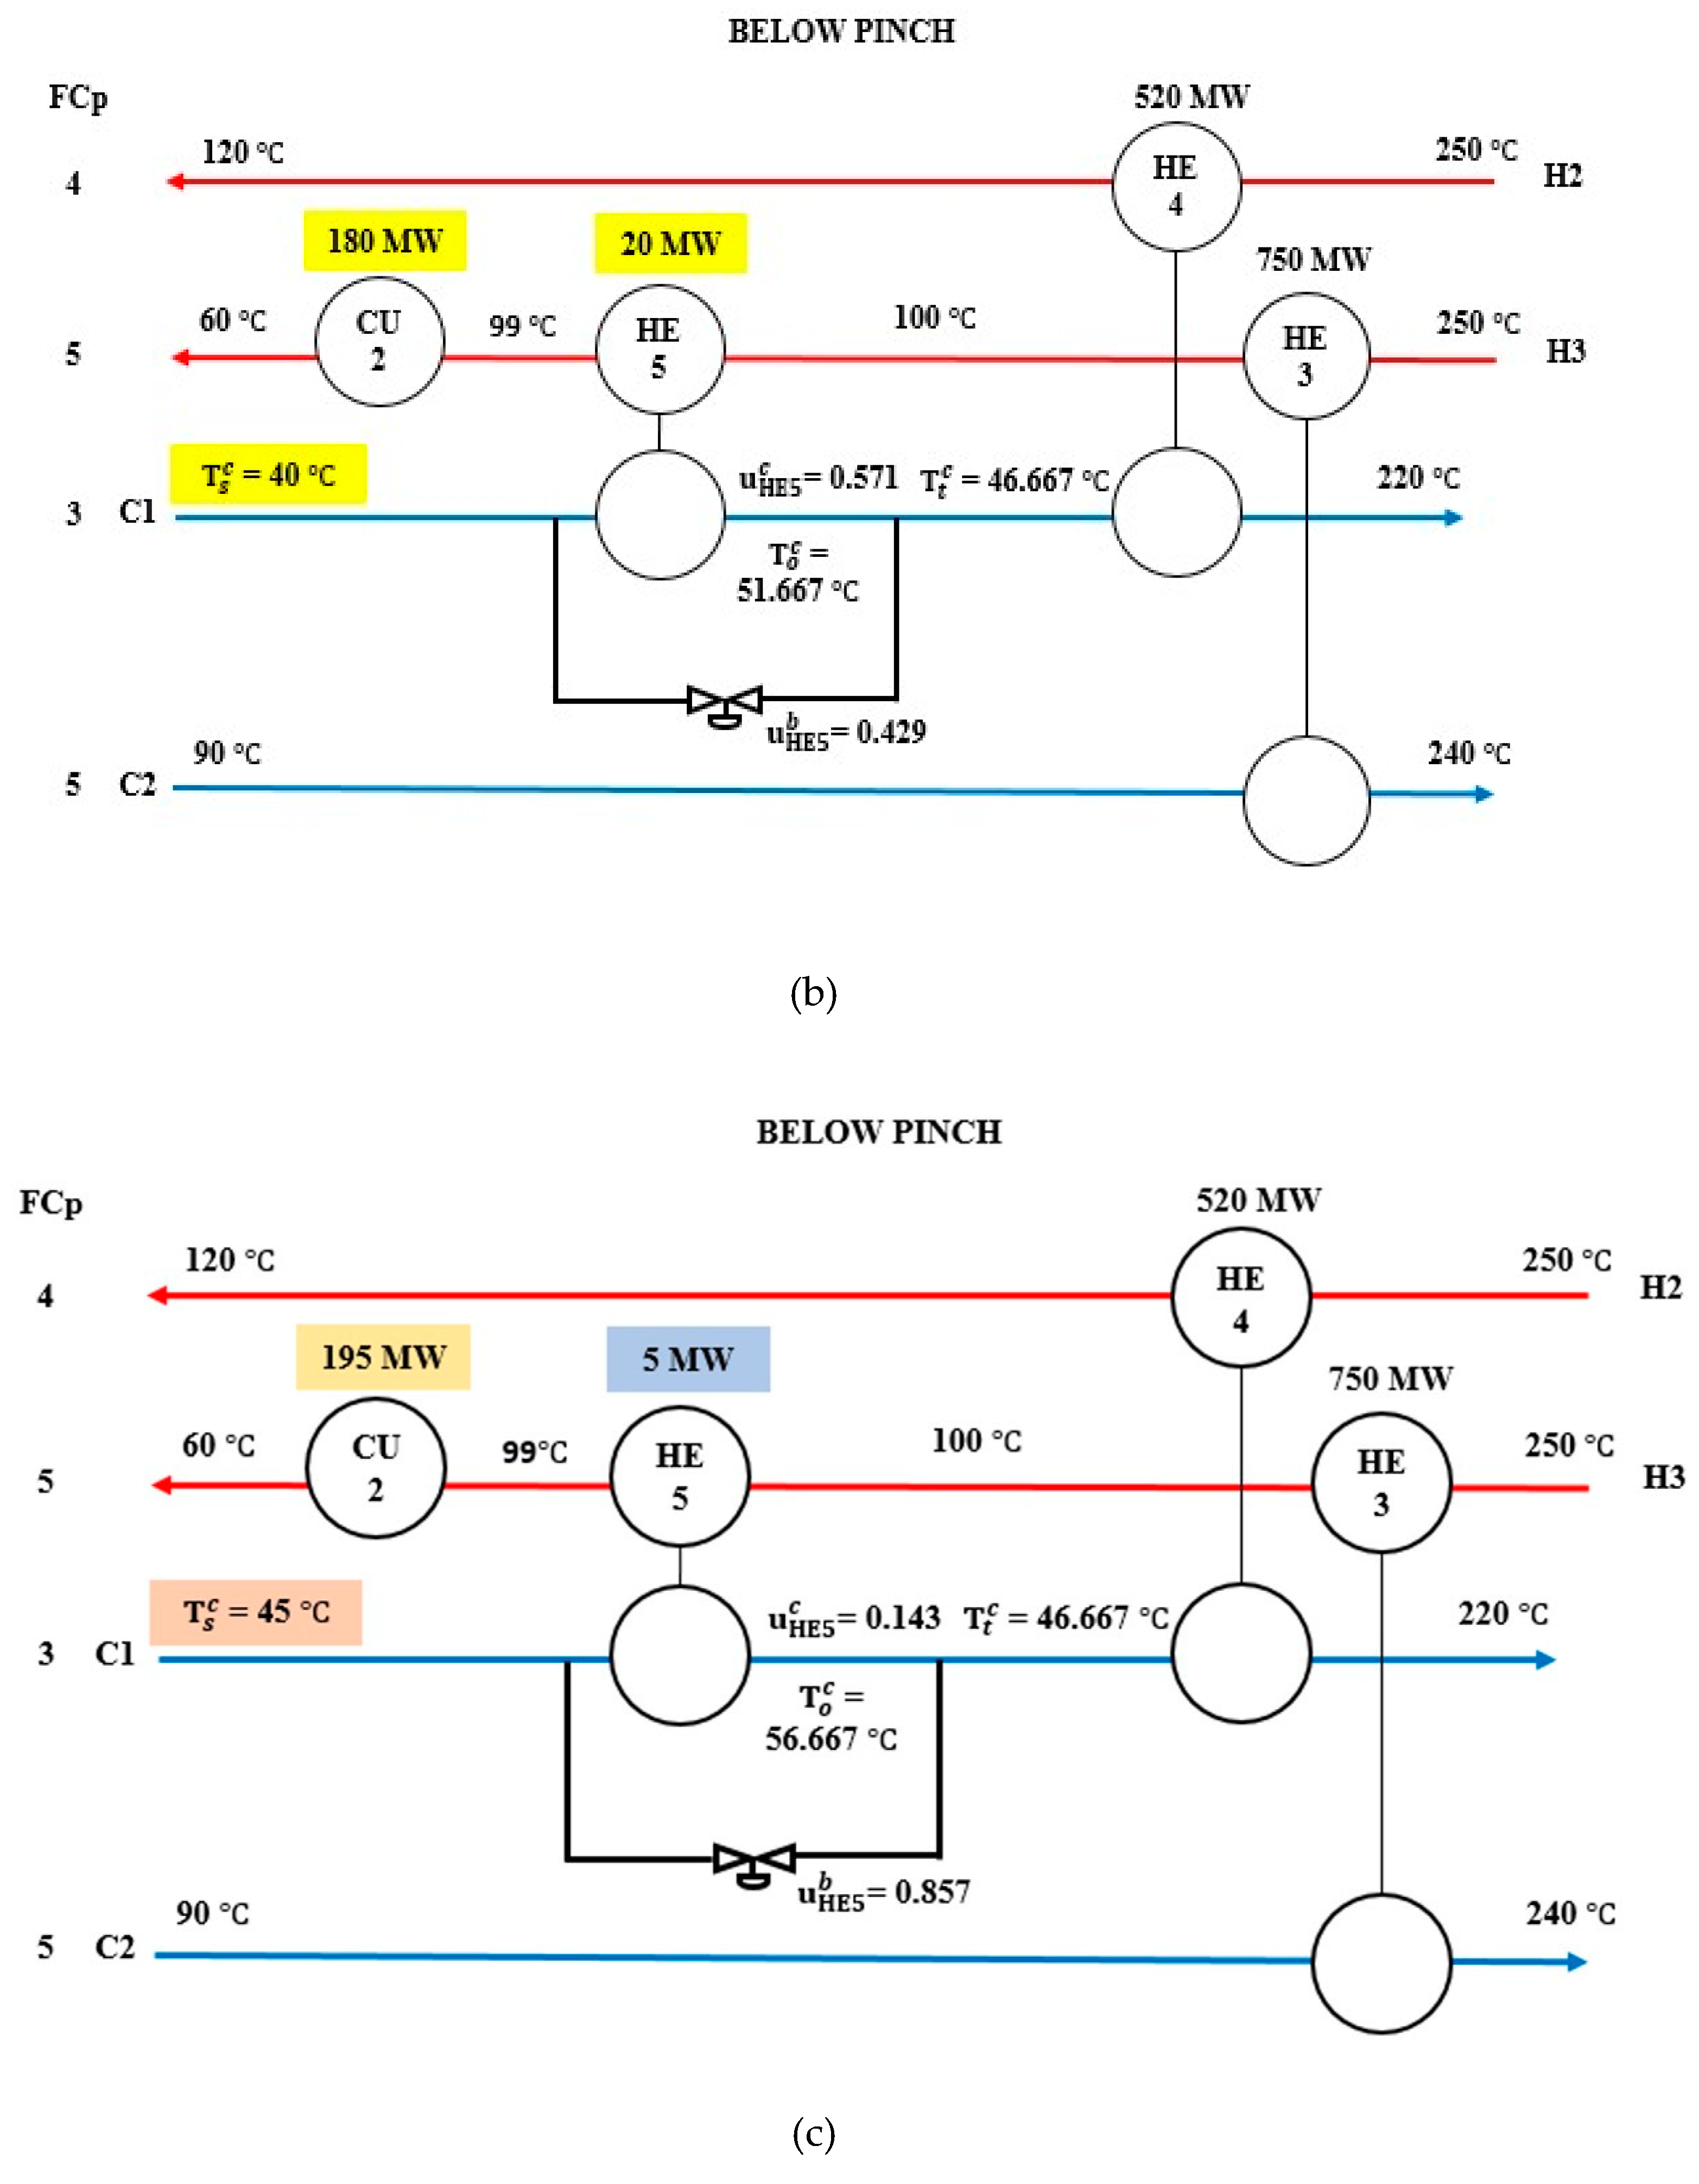
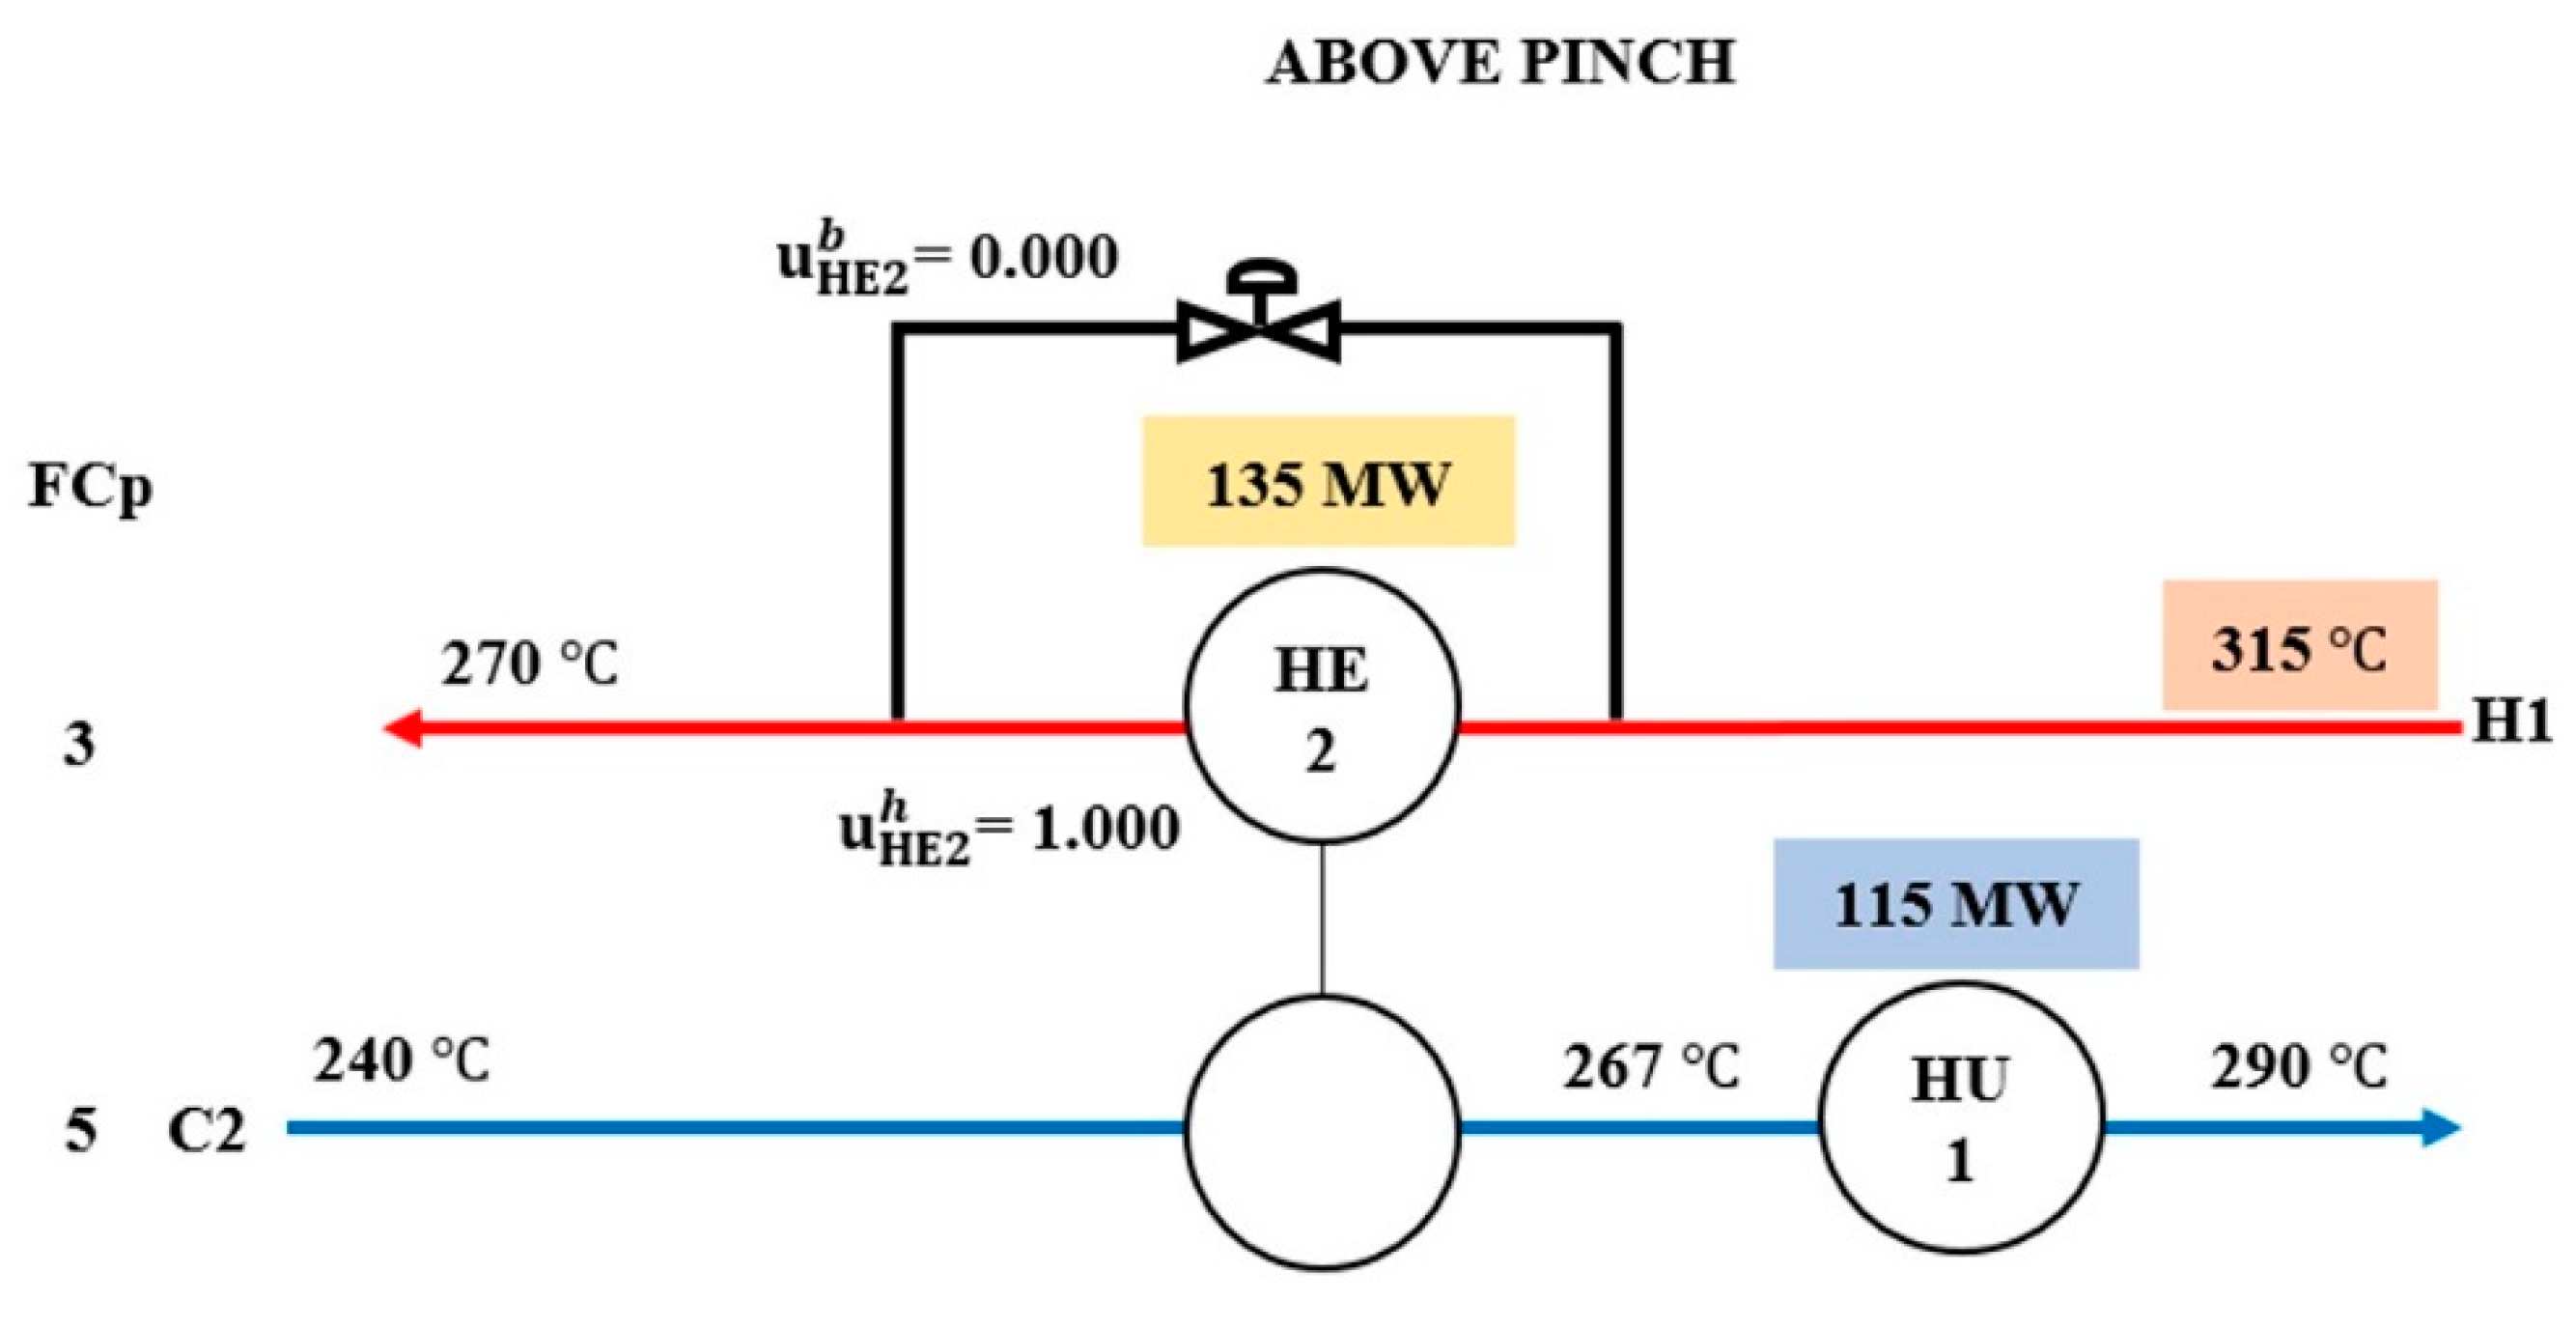
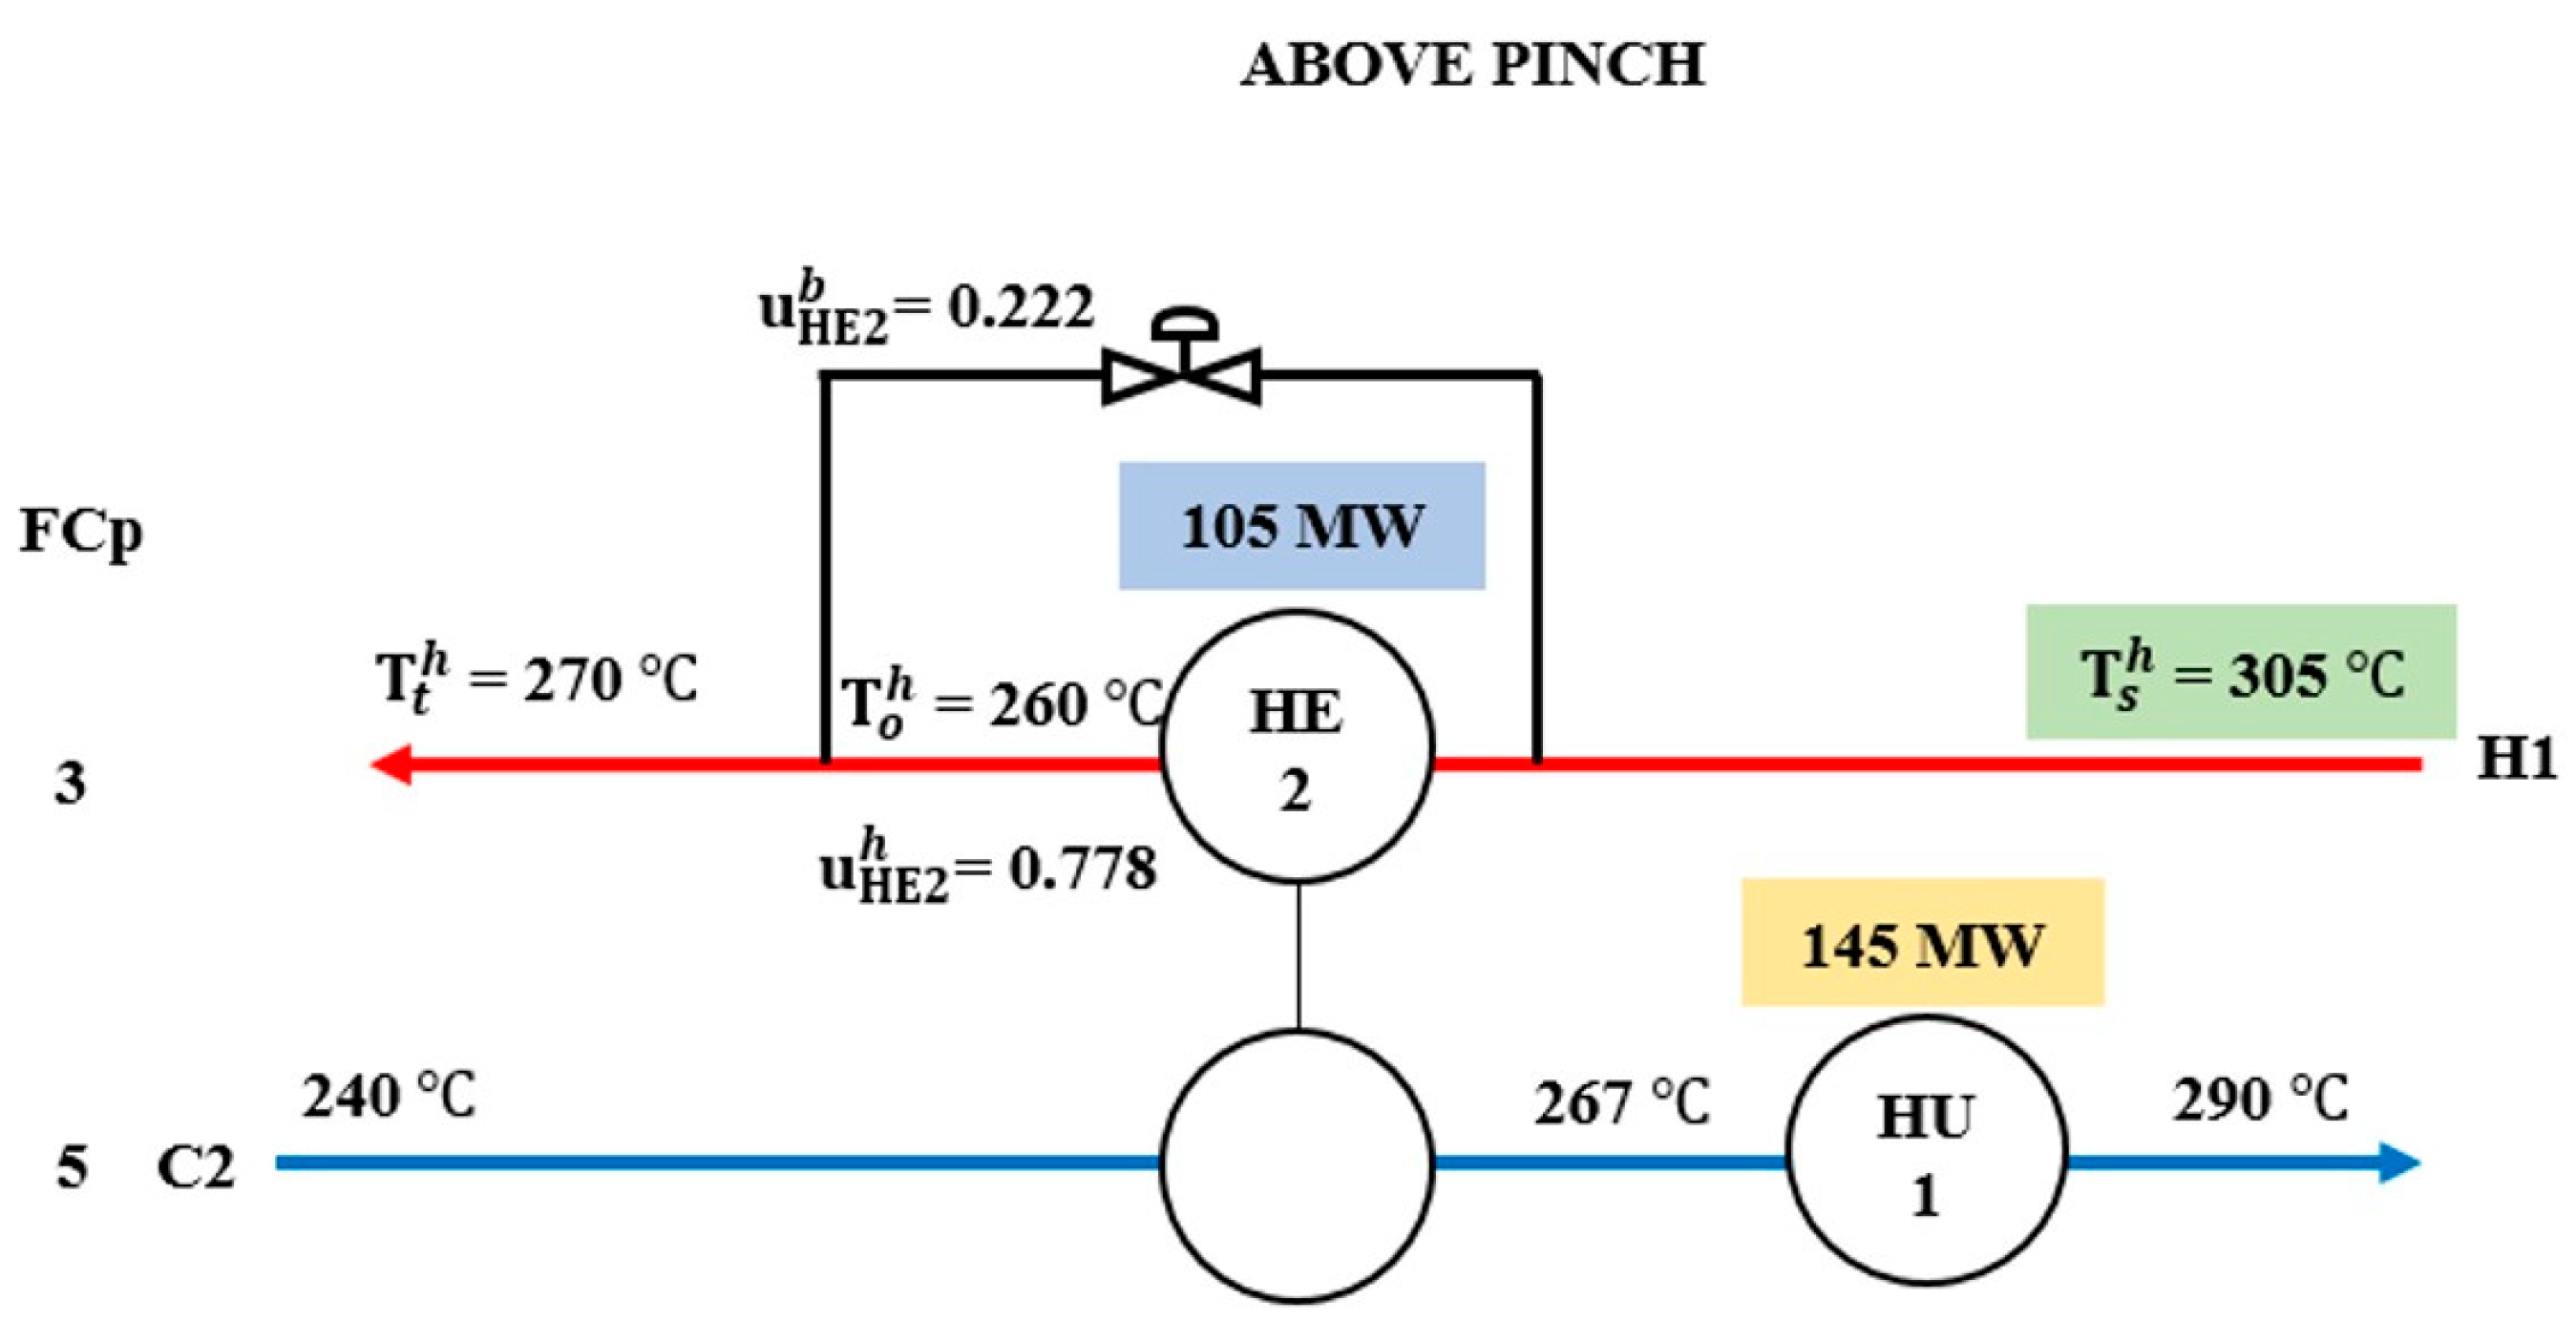
2.4.3. Control Mechanism Decision by Using the Plus-Minus Principle
- A bypass should be placed at the disturbed stream if the TS value increases or decreases on either above or below the pinch and if T 0.
- A bypass should be placed on the other side of the disturbed stream if the TS value is touching the pinch point, and if T = 0 or the enthalpy is less than the enthalpy of another side of the disturbed stream.
- Size a heat exchanger to cater to the highest amount of energy to be exchanged, considering all disturbances scenario.
- Size a utility heat exchanger to cater to the highest amount of utility needed, considering all disturbances scenario.
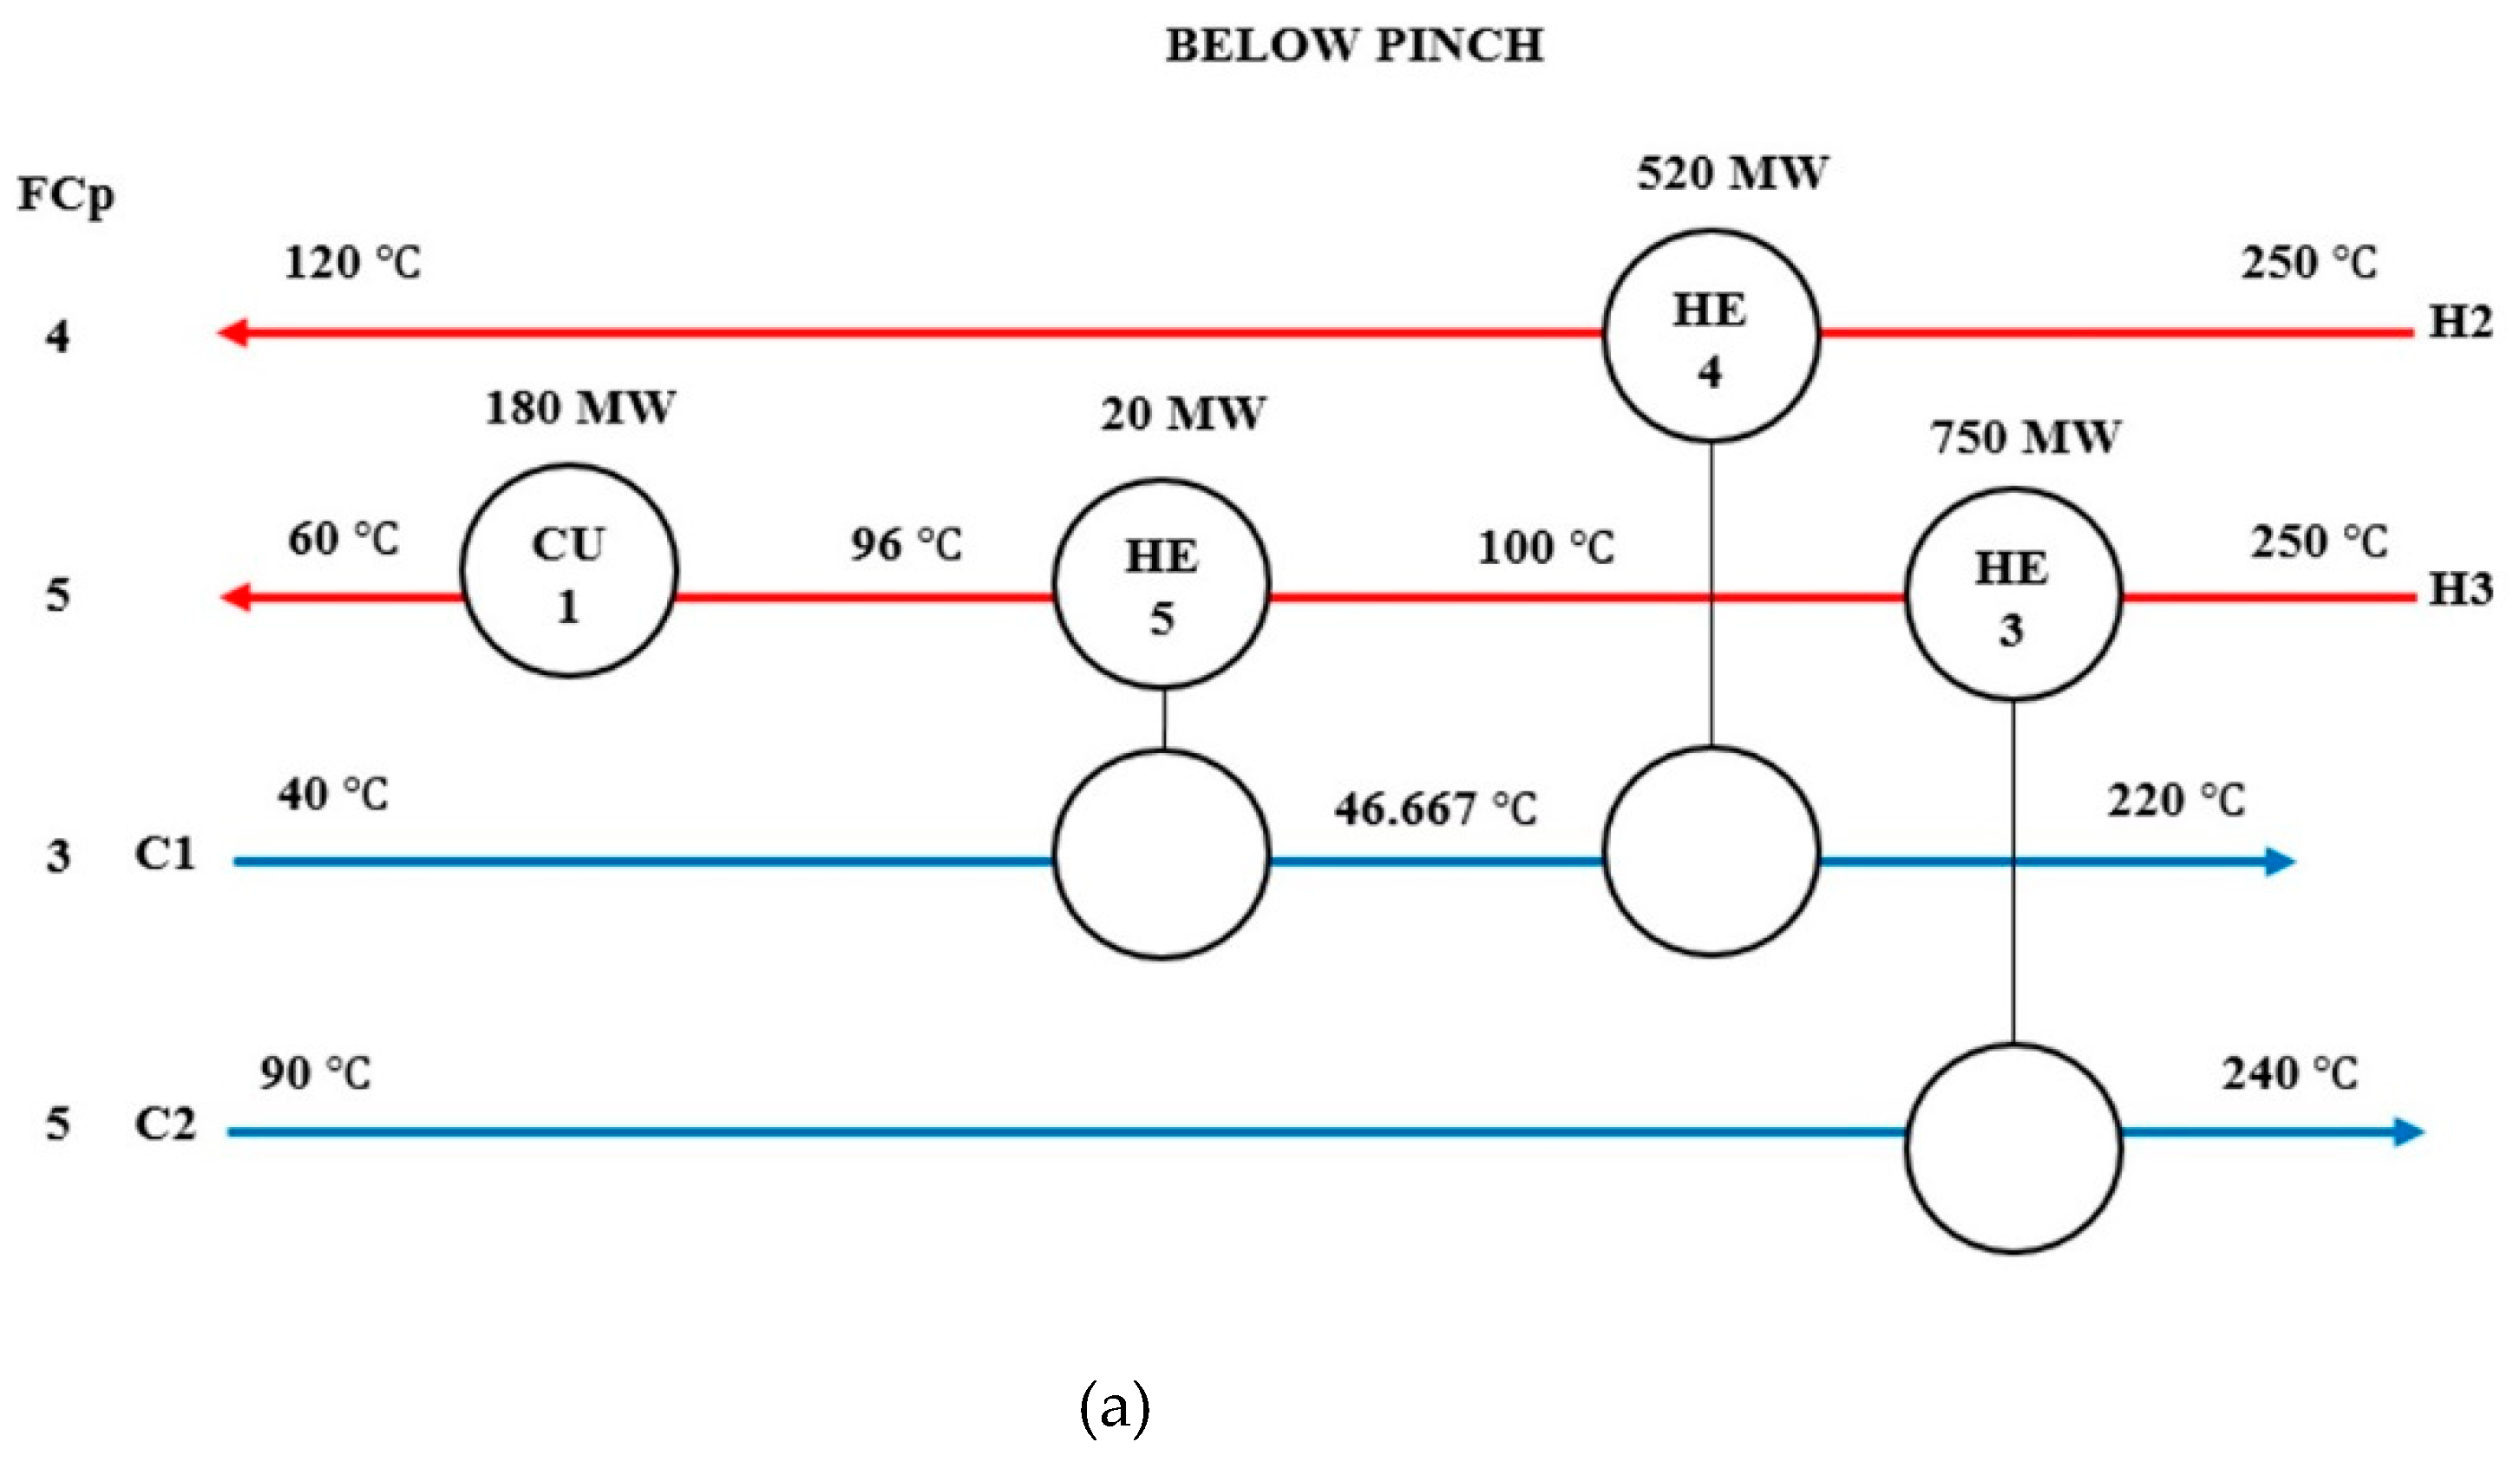
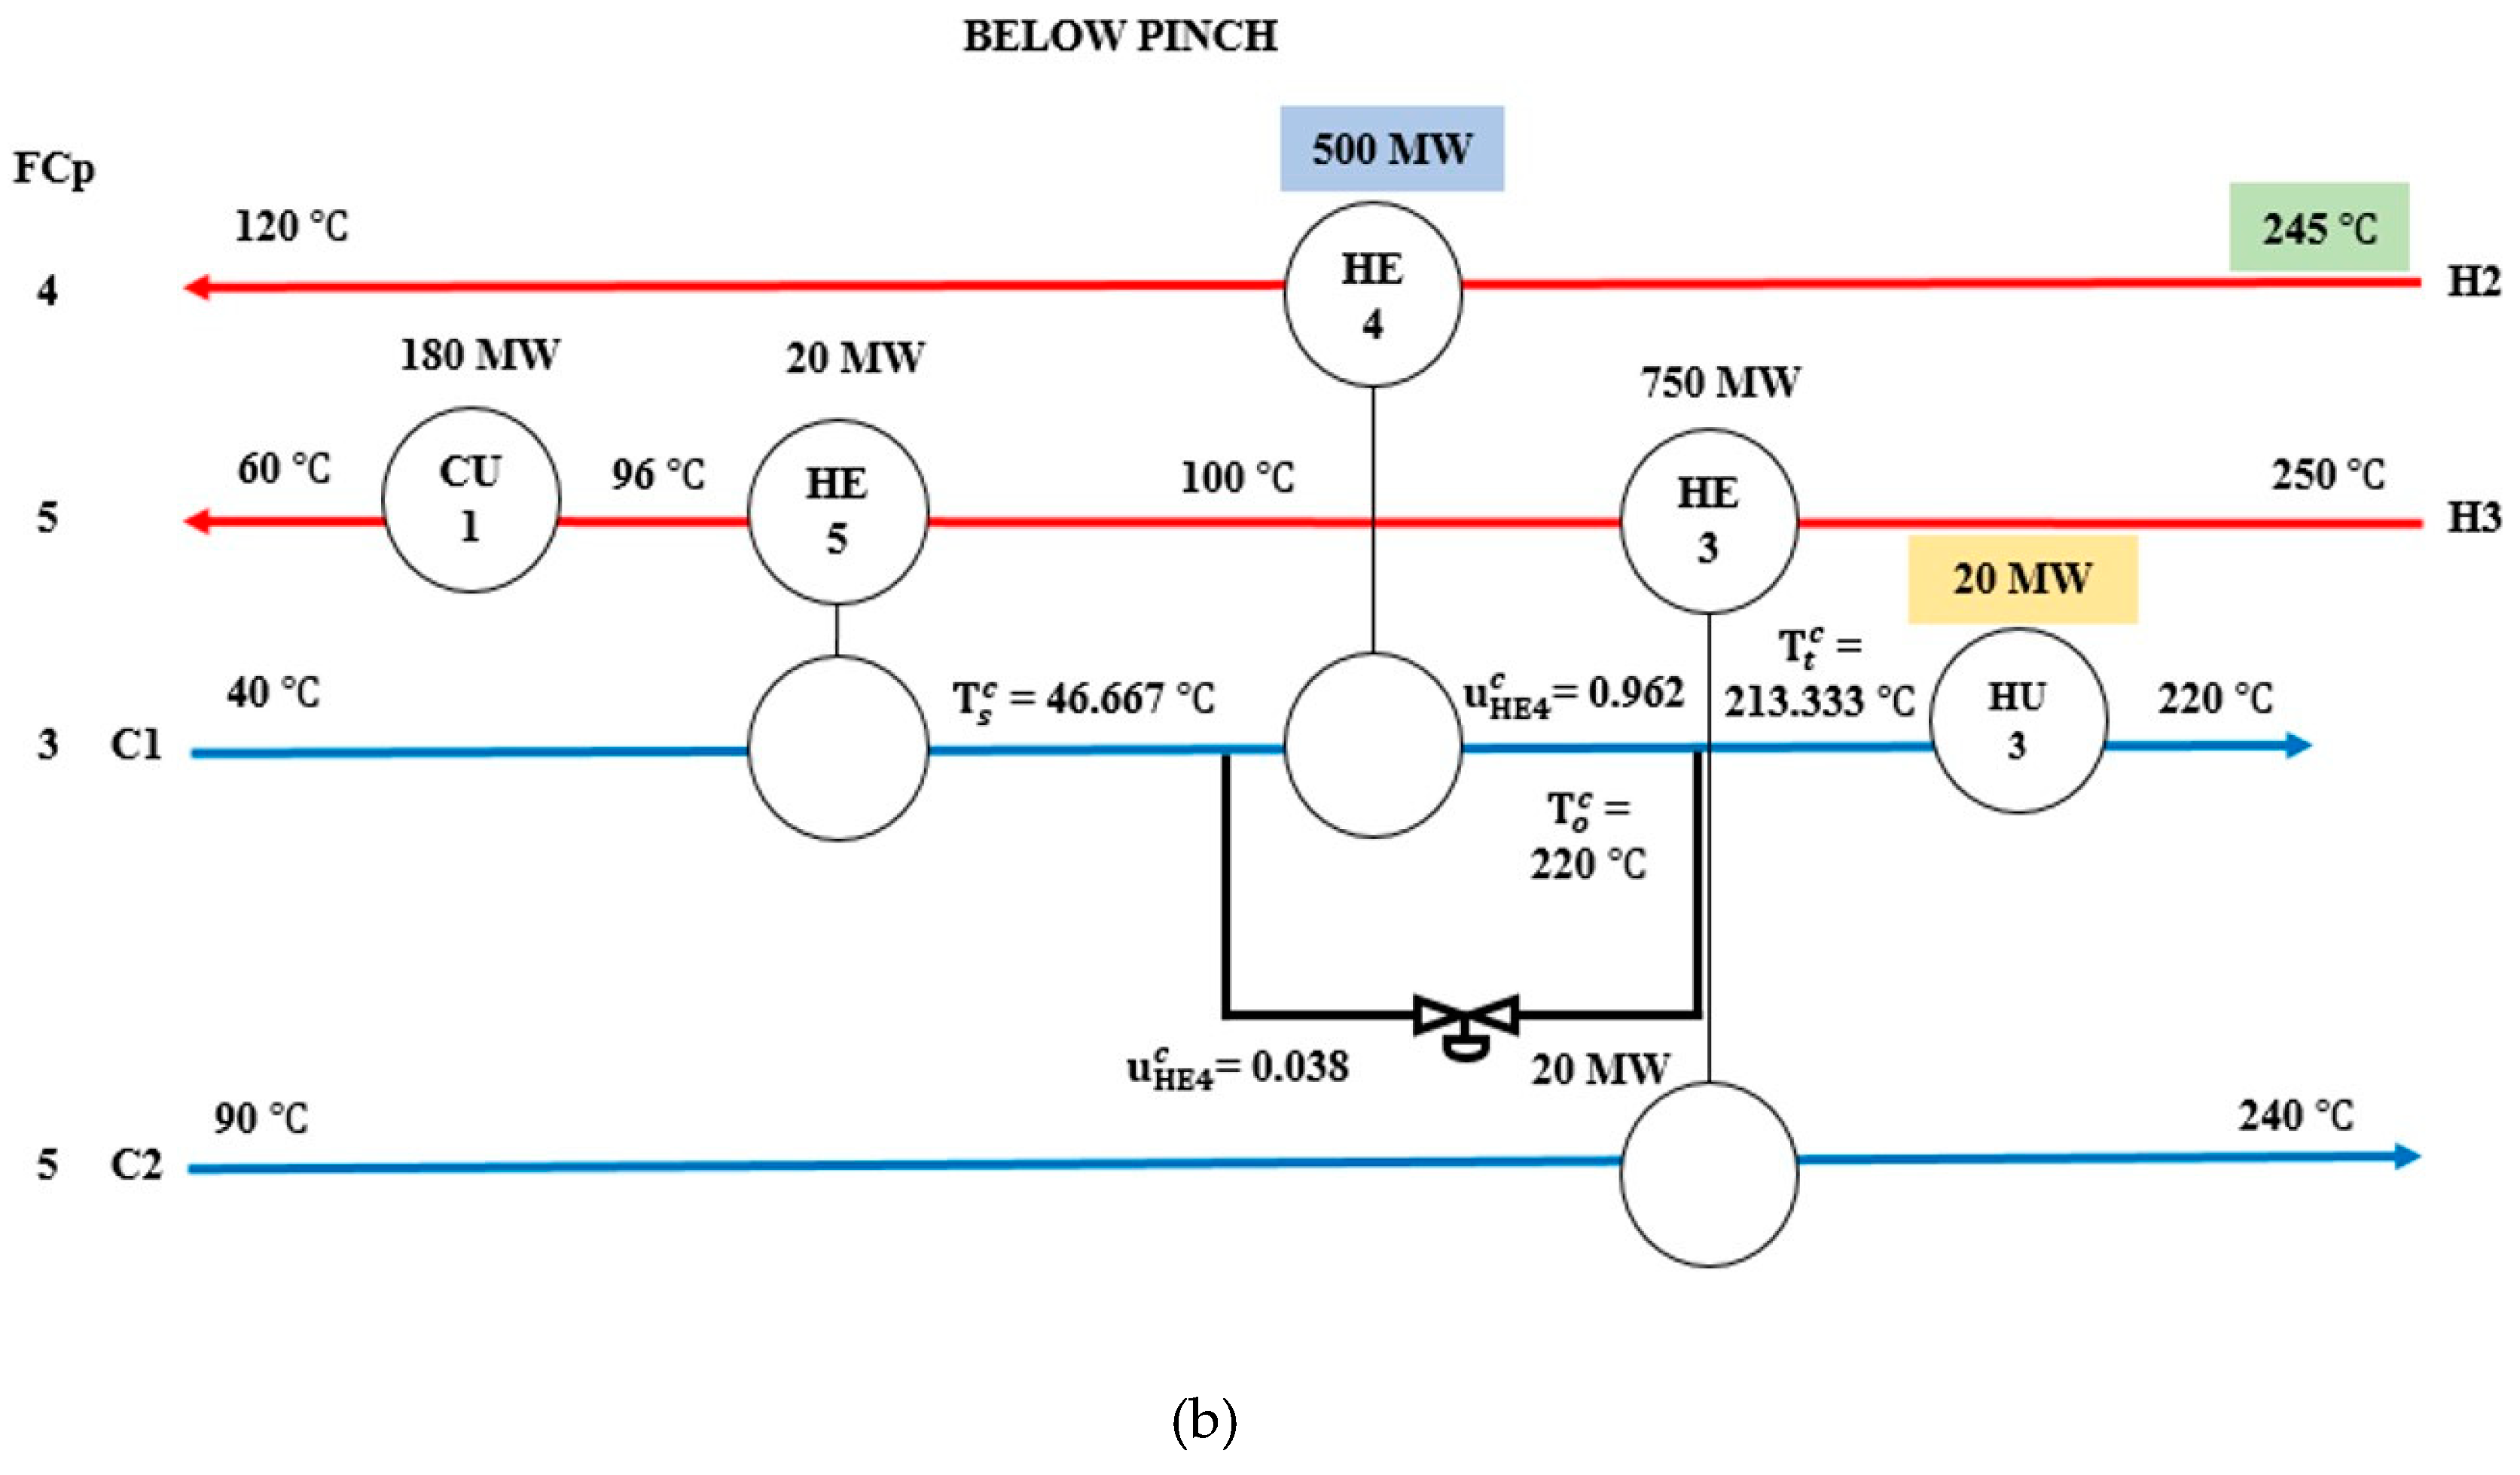
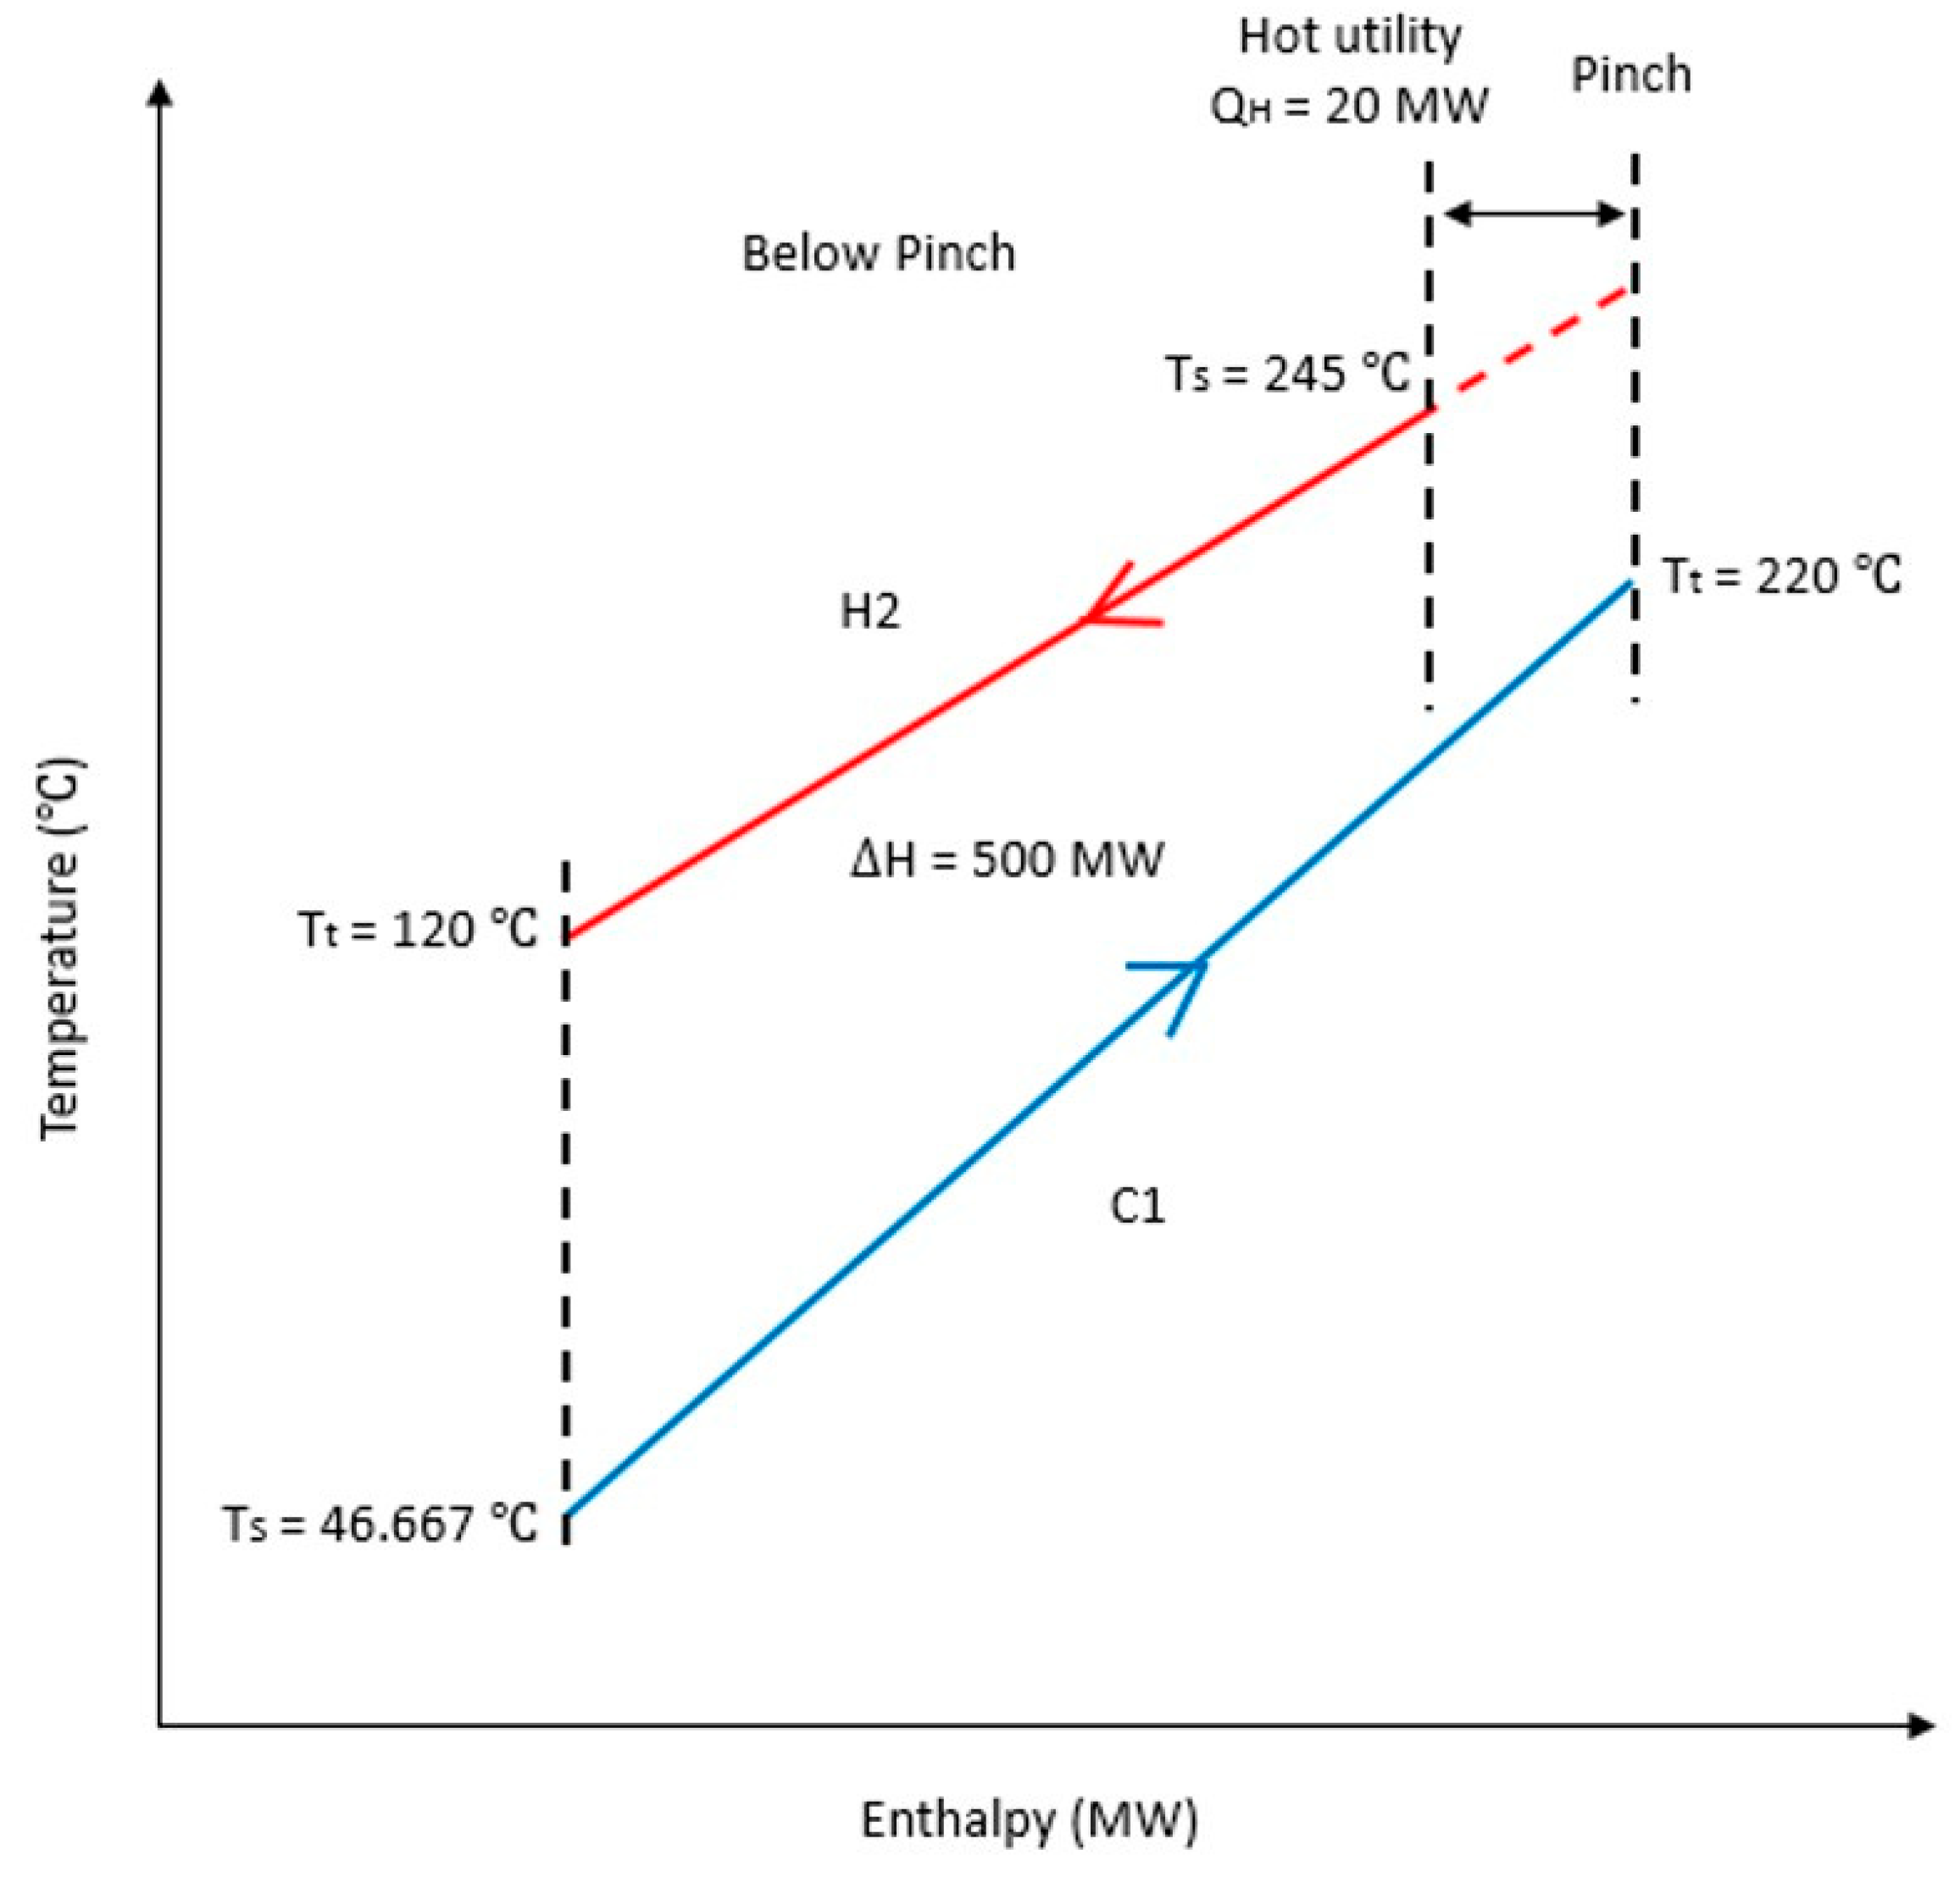
3. Final Sizing and Bypass Design for MER HEN with Disturbance on TS
4. Case Studies
Case Study 1
5. Case Study 2
6. Conclusions
- The approach is able to handle the most critical uncertainty of operating conditions with the maximum heat exchanger areas while minimising the utility usage.
- The nominal configuration of HEN based on pinch analysis is maintained and controlled by the bypass.
- The effect of uncertain operating conditions on the heat exchange and utility consumption can be easily visualised through the plus-minus principle.
- The proposed new heuristics based on the plus-minus principle of pinch analysis can be applied for all problems.
Author Contributions
Acknowledgments
Conflicts of Interest
Nomenclature
| Heat capacity flowrate, kW/ or MW/ | |
| Minimum cold utility, kW or MW | |
| Minimum hot utility, kW or MW | |
| Outlet hot temperature, | |
| Outlet cold temperature, | |
| Pinch temperature, | |
| Supply temperature, | |
| Supply hot temperature, | |
| Supply cold temperature, | |
| Target temperature, | |
| Target hot temperature, | |
| Target cold temperature, | |
| Hot stream fraction | |
| Bypass fraction | |
| Cold stream fraction | |
| Enthalpy, kW or MW |
References
- Klemeš, J.J.; Kravanja, Z. Forty Years of Heat Integration: Pinch Analysis (PA) and Mathematical Programming (MP). Curr. Opin. Chem. Eng. 2013, 2, 461–474. [Google Scholar] [CrossRef]
- Klemeš, J.J.; Varbanov, P.S.; Walmsley, T.G.; Jia, X. New Directions in the Implementation of Pinch Methodology (PM). Renew. Sustain. Energy Rev. 2018, 98, 439–468. [Google Scholar] [CrossRef]
- Isafiade, A.J.; Short, M. Synthesis of Mass Exchange Networks for Single and Multiple Periods of Operations Considering Detailed Cost Functions and Column Performance. Process Saf. Environ. Prot. 2016, 103, 391–404. [Google Scholar] [CrossRef]
- Sa, A.; Thollander, P.; Rafiee, M. Industrial Energy Management Systems and Energy-Related Decision-Making. Energies 2018, 11, 2784. [Google Scholar] [CrossRef]
- Thollander, P.; Palm, J. Industrial Energy Management Decision Making for Improved Energy Efficiency—Strategic System Perspectives and Situated Action in Combination. Energies 2015, 8, 5694–5703. [Google Scholar] [CrossRef]
- Marselle, D.F.; Morari, M.; Rudd, D.F. Design of Resilient Processing Plants—II Design and Control of Energy Management Systems. Chem. Eng. Sci. 1982, 37, 259–270. [Google Scholar] [CrossRef]
- Hafizan, A.M.; Alwi, S.R.W.; Manan, Z.A.; Klemeš, J.J.; Hamid, M.K.A. Temperature Disturbance Management in Heat Exchanger Network for Maximum Energy Recovery. In Proceedings of the 13th SDWES Conference, Palermo, Italy, 30 September–4 October 2018. SDEWES2018-0484. [Google Scholar]
- Linnhoff, B.; Kotjabasakis, E. Downstream Paths for Operable Process Design. Chem. Eng. Prog. 1986, 82, 23–28. [Google Scholar]
- Escobar, M.; Trierweiler, J.O.; Grossmann, I.E. Simultaneous Synthesis of Heat Exchanger Networks with Operability Considerations: Flexibility and Controllability. Comput. Chem. Eng. 2013, 55, 158–180. [Google Scholar] [CrossRef]
- Hafizan, A.M.; Alwi, S.R.W.; Manan, Z.A.; Klemeš, J.J. Optimal Heat Exchanger Network Synthesis with Operability and Safety Considerations. Clean Technol. Environ. Policy 2016, 18, 2381–2400. [Google Scholar] [CrossRef]
- Čuček, L.; Kravanja, Z. A Procedure for the Retrofitting of Large-Scale Heat Exchanger Networks for Fixed and Flexible Designs. Chem. Eng. Trans. 2015, 45, 109–114. [Google Scholar]
- Isafiade, A.J.; Short, M. Simultaneous Synthesis of Flexible Heat Exchanger Networks for Unequal Multi-Period Operations. Process Saf. Environ. Prot. 2016, 103, 377–390. [Google Scholar] [CrossRef]
- Miranda, C.B.; Costa, C.B.; Caballero, J.A.; Ravagnani, M.A. Optimal Synthesis of Multiperiod Heat Exchanger Networks: A Sequential Approach. Appl. Therm. Eng. 2017, 115, 1187–1202. [Google Scholar] [CrossRef]
- Kang, L.; Liu, Y. A Three-Step Method to Improve the Flexibility of Multiperiod Heat Exchanger Networks. Process Integr. Optim. Sustain. 2018, 2, 169–181. [Google Scholar] [CrossRef]
- Narraway, L.T.; Perkins, J.D. Selection of Process Control Structure Based on Linear Dynamic Economics. Ind. Eng. Chem. Res. 1993, 32, 2681–2692. [Google Scholar] [CrossRef]
- Walsh, S.; Perkins, J. Application of Integrated Process and Control System Design to Waste Water Neutralisation. Comput. Chem. Eng. 1994, 18, S183–S187. [Google Scholar] [CrossRef]
- Bakar, S.H.A.; Hamid, M.K.A.; Alwi, S.R.W.; Manan, Z.A. Flexible and Operable Heat Exchanger Networks. Chem. Eng. 2013, 32, 1297–1302. [Google Scholar]
- Kong, L.; Avadiappan, V.; Huang, K.; Maravelias, C.T. Simultaneous Chemical Process Synthesis and Heat Integration with Unclassified Hot/Cold Process Streams. Comput. Chem. Eng. 2017, 101, 210–225. [Google Scholar] [CrossRef]
- Quirante, N.; Grossmann, I.E.; Caballero, J.A. Disjunctive Model for the Simultaneous Optimization and Heat Integration with Unclassified Streams and Area Estimation. Comput. Chem. Eng. 2018, 108, 217–231. [Google Scholar] [CrossRef]
- Onishi, V.C.; Quirante, N.; Ravagnani, M.A.; Caballero, J.A. Optimal Synthesis of Work and Heat Exchangers Networks Considering Unclassified Process Streams at Sub and Above-Ambient Conditions. Appl. Energy 2018, 224, 567–581. [Google Scholar] [CrossRef]
- Quirante, N.; Caballero, J.A.; Grossmann, I.E. A Novel Disjunctive Model for the Simultaneous Optimization and Heat Integration. Comput. Chem. Eng. 2017, 96, 149–168. [Google Scholar] [CrossRef]
- Linnhoff, B.; Vredeveld, R. Pinch Technology has Come of Age. Chem. Eng. Prog. 2017, 80, 33–40. [Google Scholar]
- Chew, K.H.; Klemeš, J.J.; Alwi, S.R.W.; Manan, Z.A. Process Modifications to Maximise Energy Savings in Total Site Heat Integration. Appl. Therm. Eng. 2015, 78, 731–739. [Google Scholar] [CrossRef]
- Song, R.; Tang, Q.; Wang, Y.; Feng, X.; El-Halwagi, M.M. The Implementation of Inter-Plant Heat Integration Among Multiple Plants. Part I: A Novel Screening Algorithm. Energy 2017, 140, 1018–1029. [Google Scholar] [CrossRef]
- Linnhoff, B.; Flower, J.R. Synthesis of Heat Exchanger Networks: I. Systematic Generation of Energy Optimal Networks. AIChE J. 1978, 24, 633–642. [Google Scholar] [CrossRef]
- Alwi, S.R.W.; Manan, Z.A. STEP—A New Graphical Tool for Simultaneous Targeting and Design of A Heat Exchanger Network. Chem. Eng. J. 2010, 162, 106–121. [Google Scholar] [CrossRef]
- Linnhoff, B.; Hindmarsh, E. The Pinch Design Method for Heat Exchanger Networks. Chem. Eng. Sci. 1983, 38, 745–763. [Google Scholar] [CrossRef]
- Rathjens, M.; Bohnenstädt, T.; Fieg, G.; Engel, O. Synthesis of Heat Exchanger Networks Taking into Account Cost and Dynamic Considerations. Procedia Eng. 2016, 157, 341–348. [Google Scholar] [CrossRef]
- Kijevčanin, M.L.; Đorđević, B.; Ocić, O.; Crnomarković, M.; Marić, M.; Šerbanović, S.P. Energy and Economy Savings in the Process of Methanol Synthesis Using Pinch Technology. J. Serbian Chem. Soc. 2004, 69, 827–837. [Google Scholar] [CrossRef]
- Na, J.; Jung, J.; Park, C.; Han, C. Simultaneous Synthesis of a Heat Exchanger Network with Multiple Utilities Using Utility Substages. Comput. Chem. Eng. 2015, 79, 70–79. [Google Scholar] [CrossRef]
- Sun, K.N.; Alwi, S.R.W.; Manan, Z.A. Heat Exchanger Network Cost Optimization Considering Multiple Utilities and Different Types of Heat Exchangers. Comput. Chem. Eng. 2013, 49, 194–204. [Google Scholar] [CrossRef]


| Stream | Heat Capacity Flowrate, | Enthalpy, ΔH (MW) | ||
|---|---|---|---|---|
| Hot 1 (H1) | 310 5 | 270 | 3 | −120 |
| Hot 2 (H2) | 235 5 | 120 | 4 | −460 |
| Hot 3 (H3) | 270 5 | 60 | 5 | −1050 |
| Cold 1 (C1) | 40 5 | 220 | 3 | 540 |
| Cold 2 (C2) | 90 5 | 290 | 5 | 1000 |
| Cold 3 (C3) | 240 5 | 300 | 7 | 420 |
| TS, hot | Effect on QC | Effect on QH | TS, cold | Effect on QC | Effect on QH | |
|---|---|---|---|---|---|---|
| Below Pinch | Decrease but HE T still Tmin or T Tmin (Observation 1) | Decrease | None unless the reduction of the hot enthalpy is more than the available cold stream for MER (Observation 2) | Decrease (Observation 1) | Decrease | None |
| Decrease but HE T = 0 (Observation 2) | Decrease | Increase | - | - | - | |
| Increase (Observation 3) | Increase | None | Increase (Observation 3) | Increase | None | |
| Above Pinch | Increase (Observation 5) | None | Decrease | Increase but HE T still Tmin or T Tmin (Observation 5) | None unless the reduction of the cold enthalpy is more than the available hot stream for MER (Observation 6) | Decrease |
| - | - | - | Increase but HE T = 0 (Observation 6) | Increase | Decrease | |
| Decrease (Observation 7) | None | Increase | Decrease (Observation 7) | None | Increase |
| Stream | Stream Position | HE Affected | HE Max. Size (MW) | HE Duty during Disturbance (MW) | Bypass Name | Bypass Fraction (1) | Bypass Location | HU or CU Affected | The Maximum Size of HU or CU | The Duty of HU or CU during a Disturbance | |||
|---|---|---|---|---|---|---|---|---|---|---|---|---|---|
| HU (MW) | CU (MW) | HU (MW) | CU (MW) | ||||||||||
| H1 | Above Pinch | +5 | HE2 | 135 | 135 | bHE2 | 0.000 | Stream H1 | HU1 | 145 | - | 115 | - |
| Nominal | - | 120 | 0.111 | - | 130 | - | |||||||
| −5 | HE2 | 105 | 0.222 | HU1 | 145 | - | |||||||
| H2 | Below Pinch | +5 | HE4 | 520 | 520 | bHE4 | 0.000 | Stream C1 | CU1 | 20 | 20 | 0 | 20 |
| Nominal | - | 520 | 0.000 | - | 0 | 0 | |||||||
| −5 | HE4 | 500 | 0.038 | HU3 | 20 | 0 | |||||||
| H3 | Across Pinch | +5 | HE1 | 125 | 125 | bHE1 | 0.000 | Stream H3 | HU2 | 320 | 180 | 295 | 180 |
| Nominal | - | 125 | 0.000 | HU2 & CU2 | 295 | 155 | |||||||
| −5 | HE1 | 100 | 0.200 | CU2 | 320 | 155 | |||||||
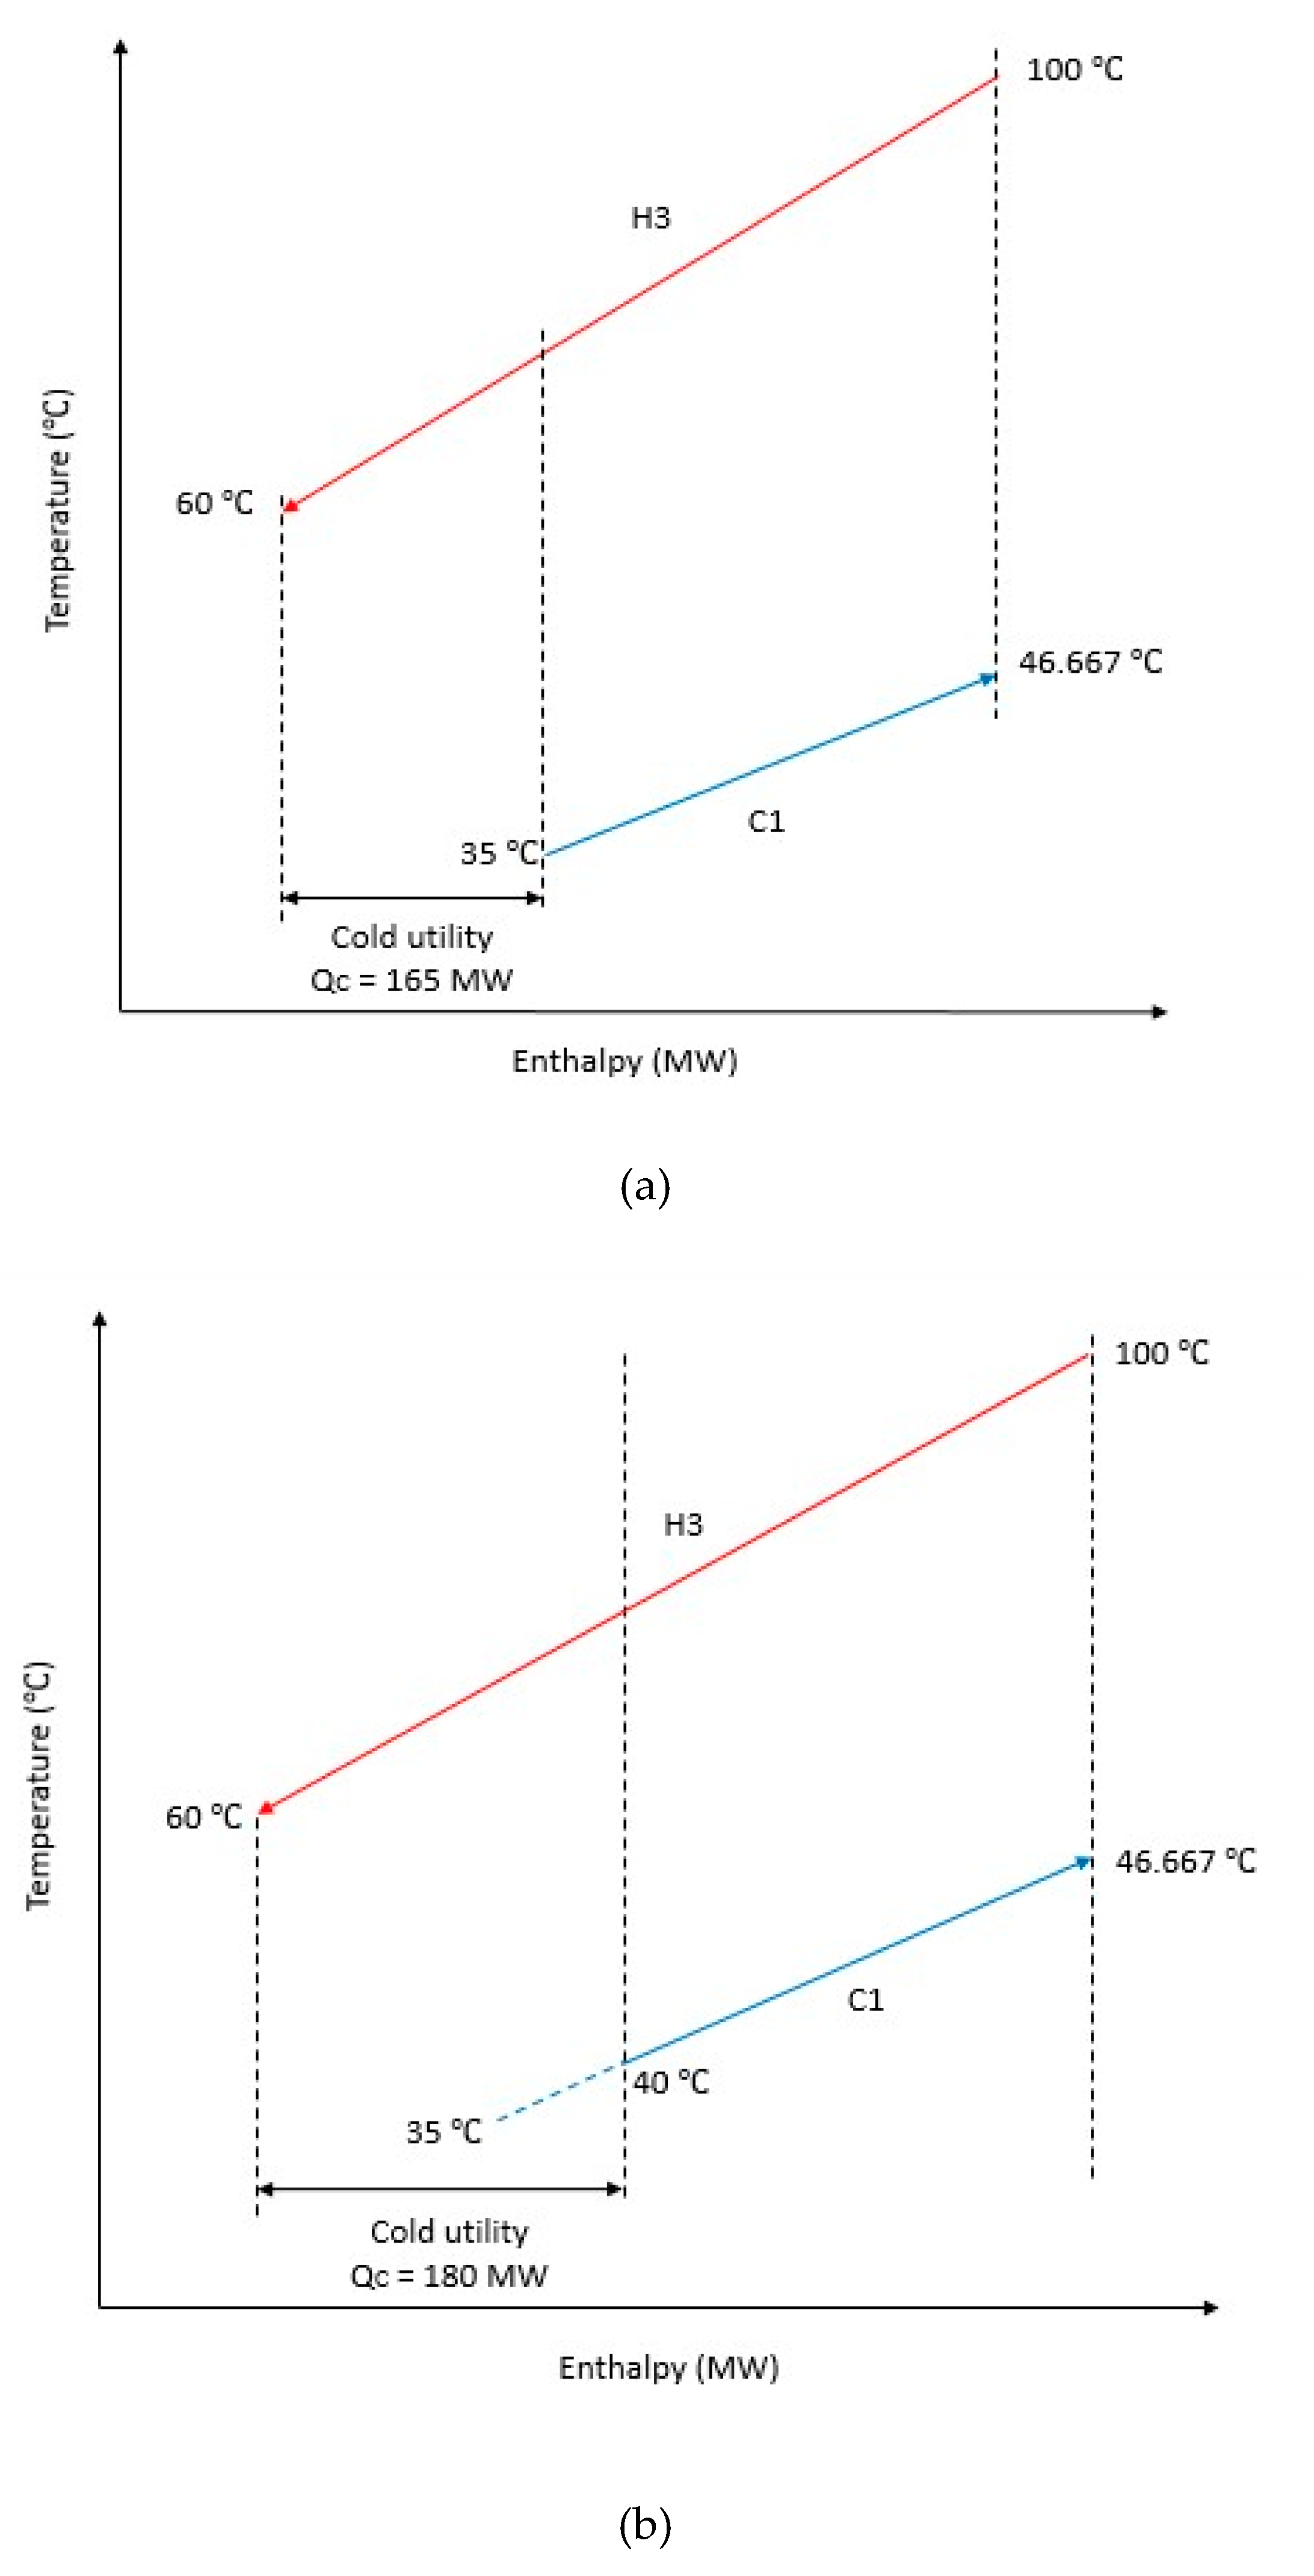
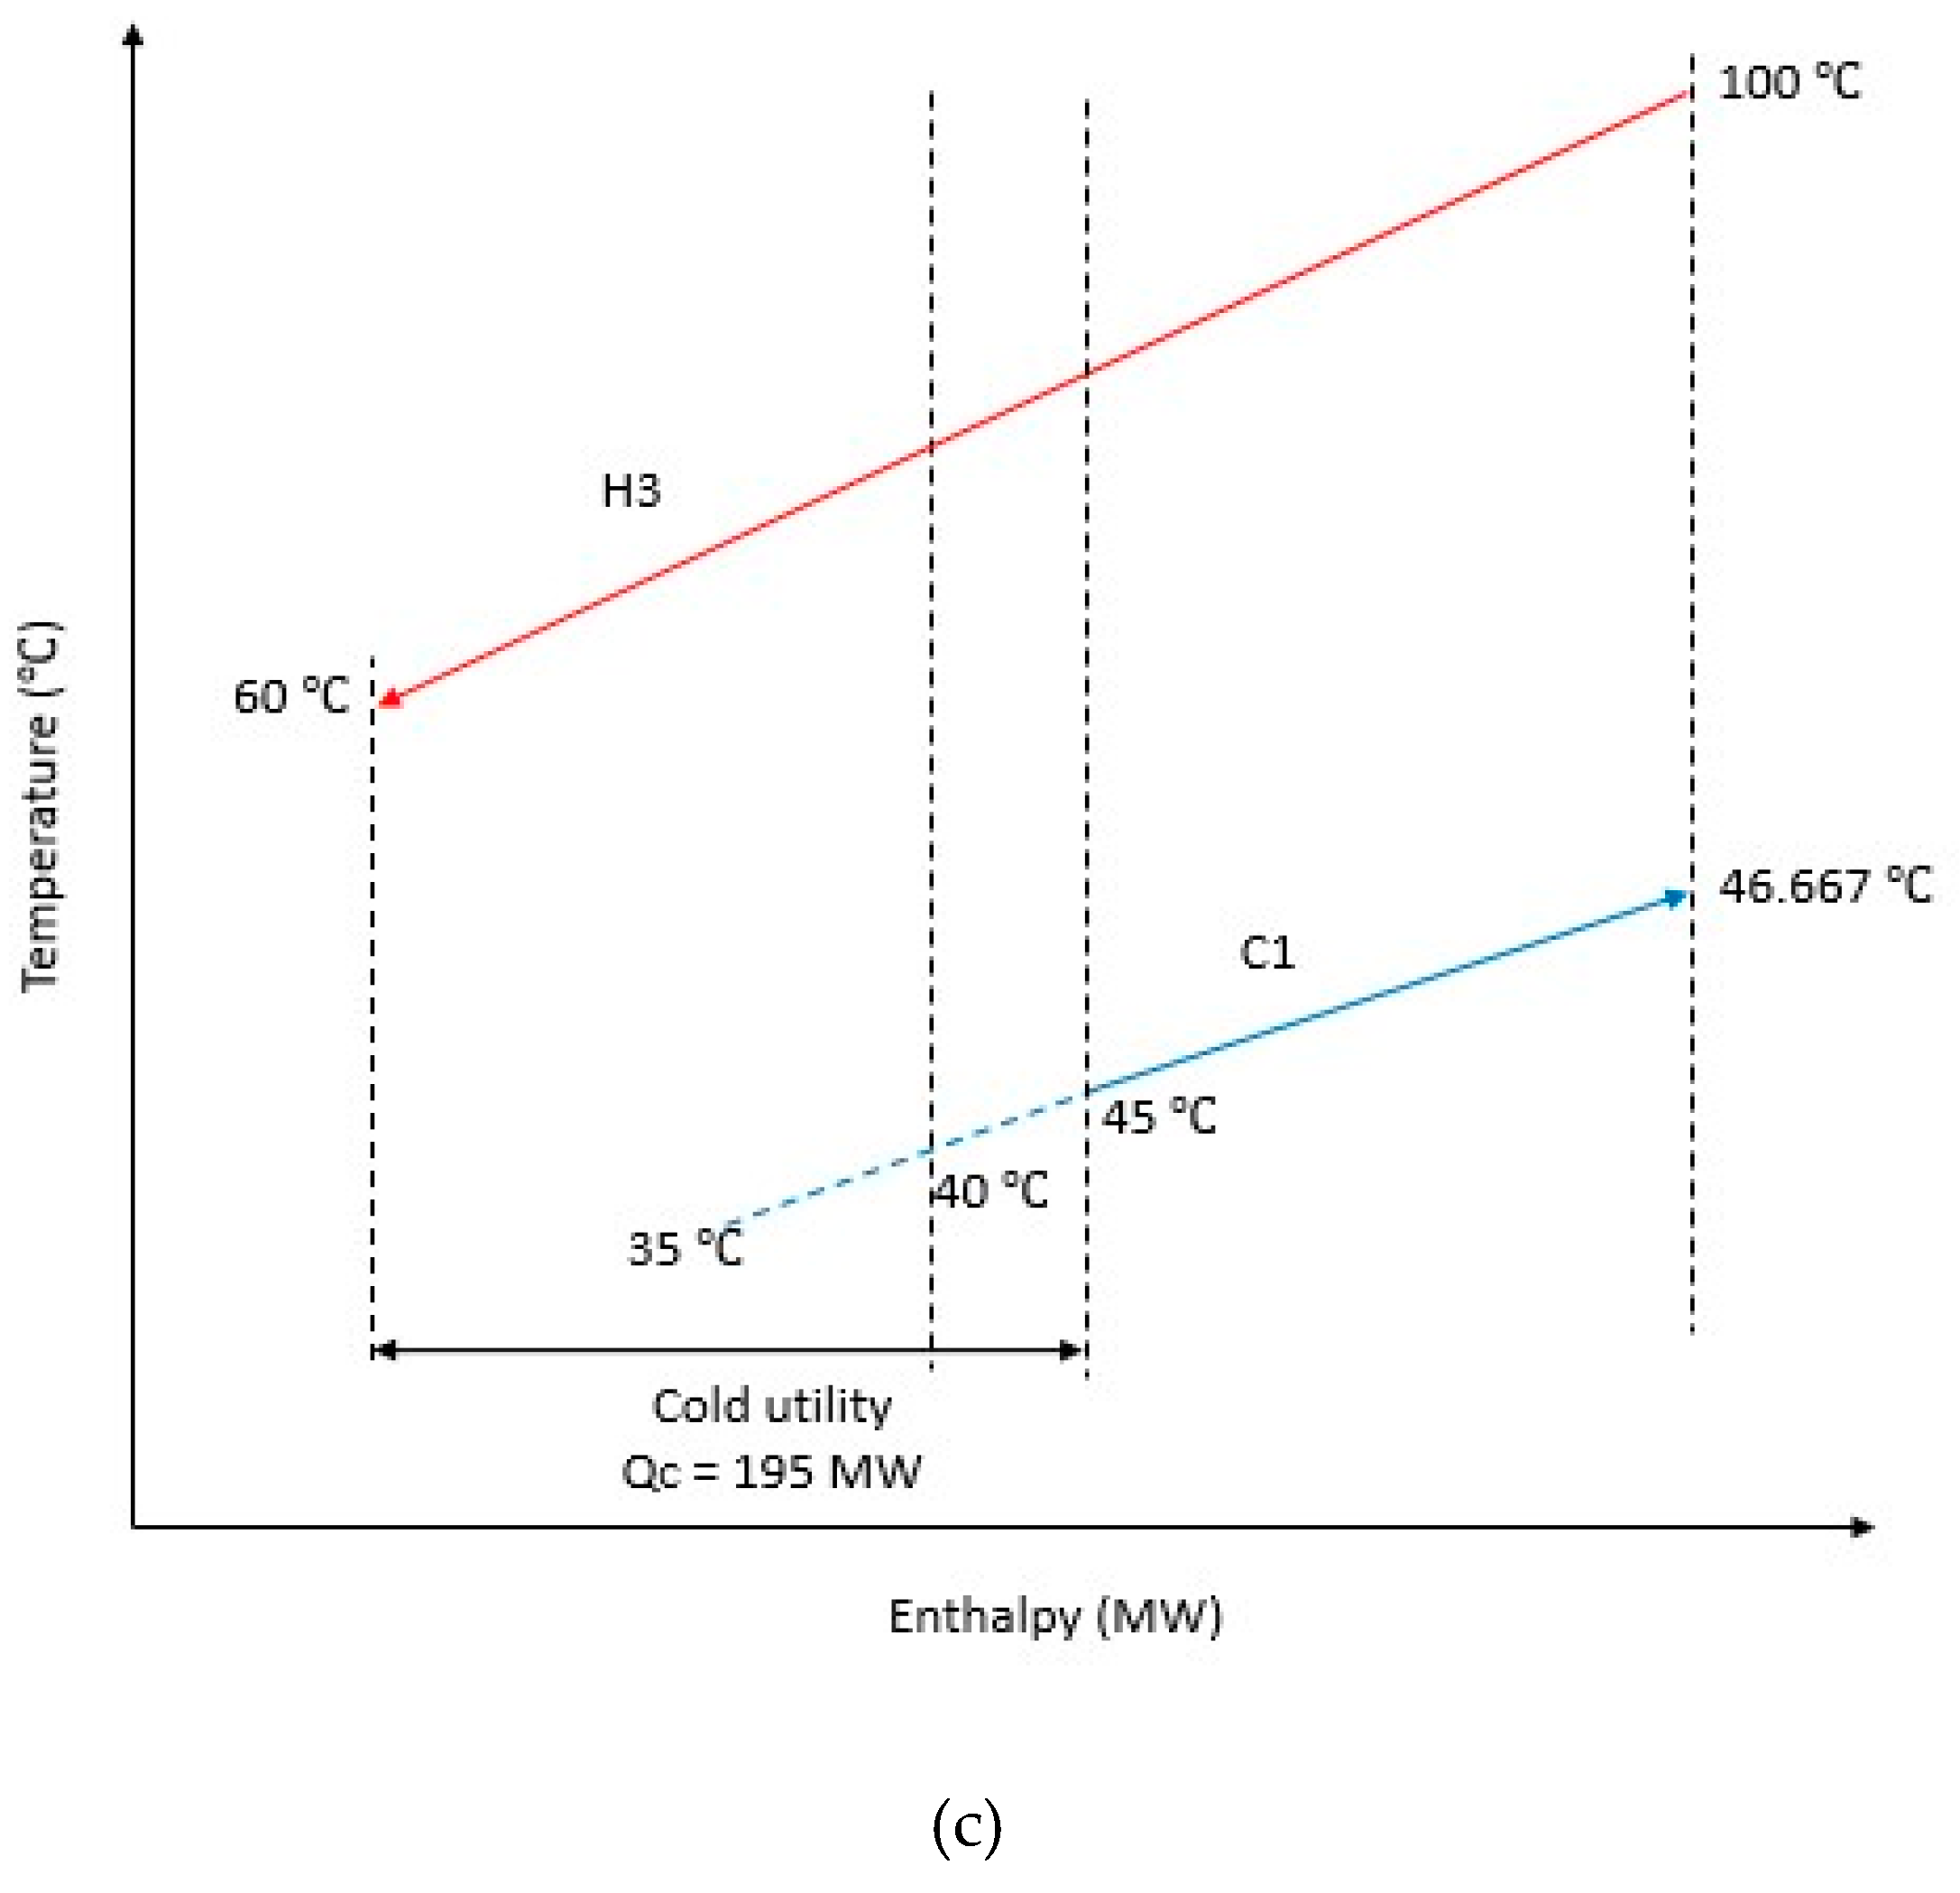
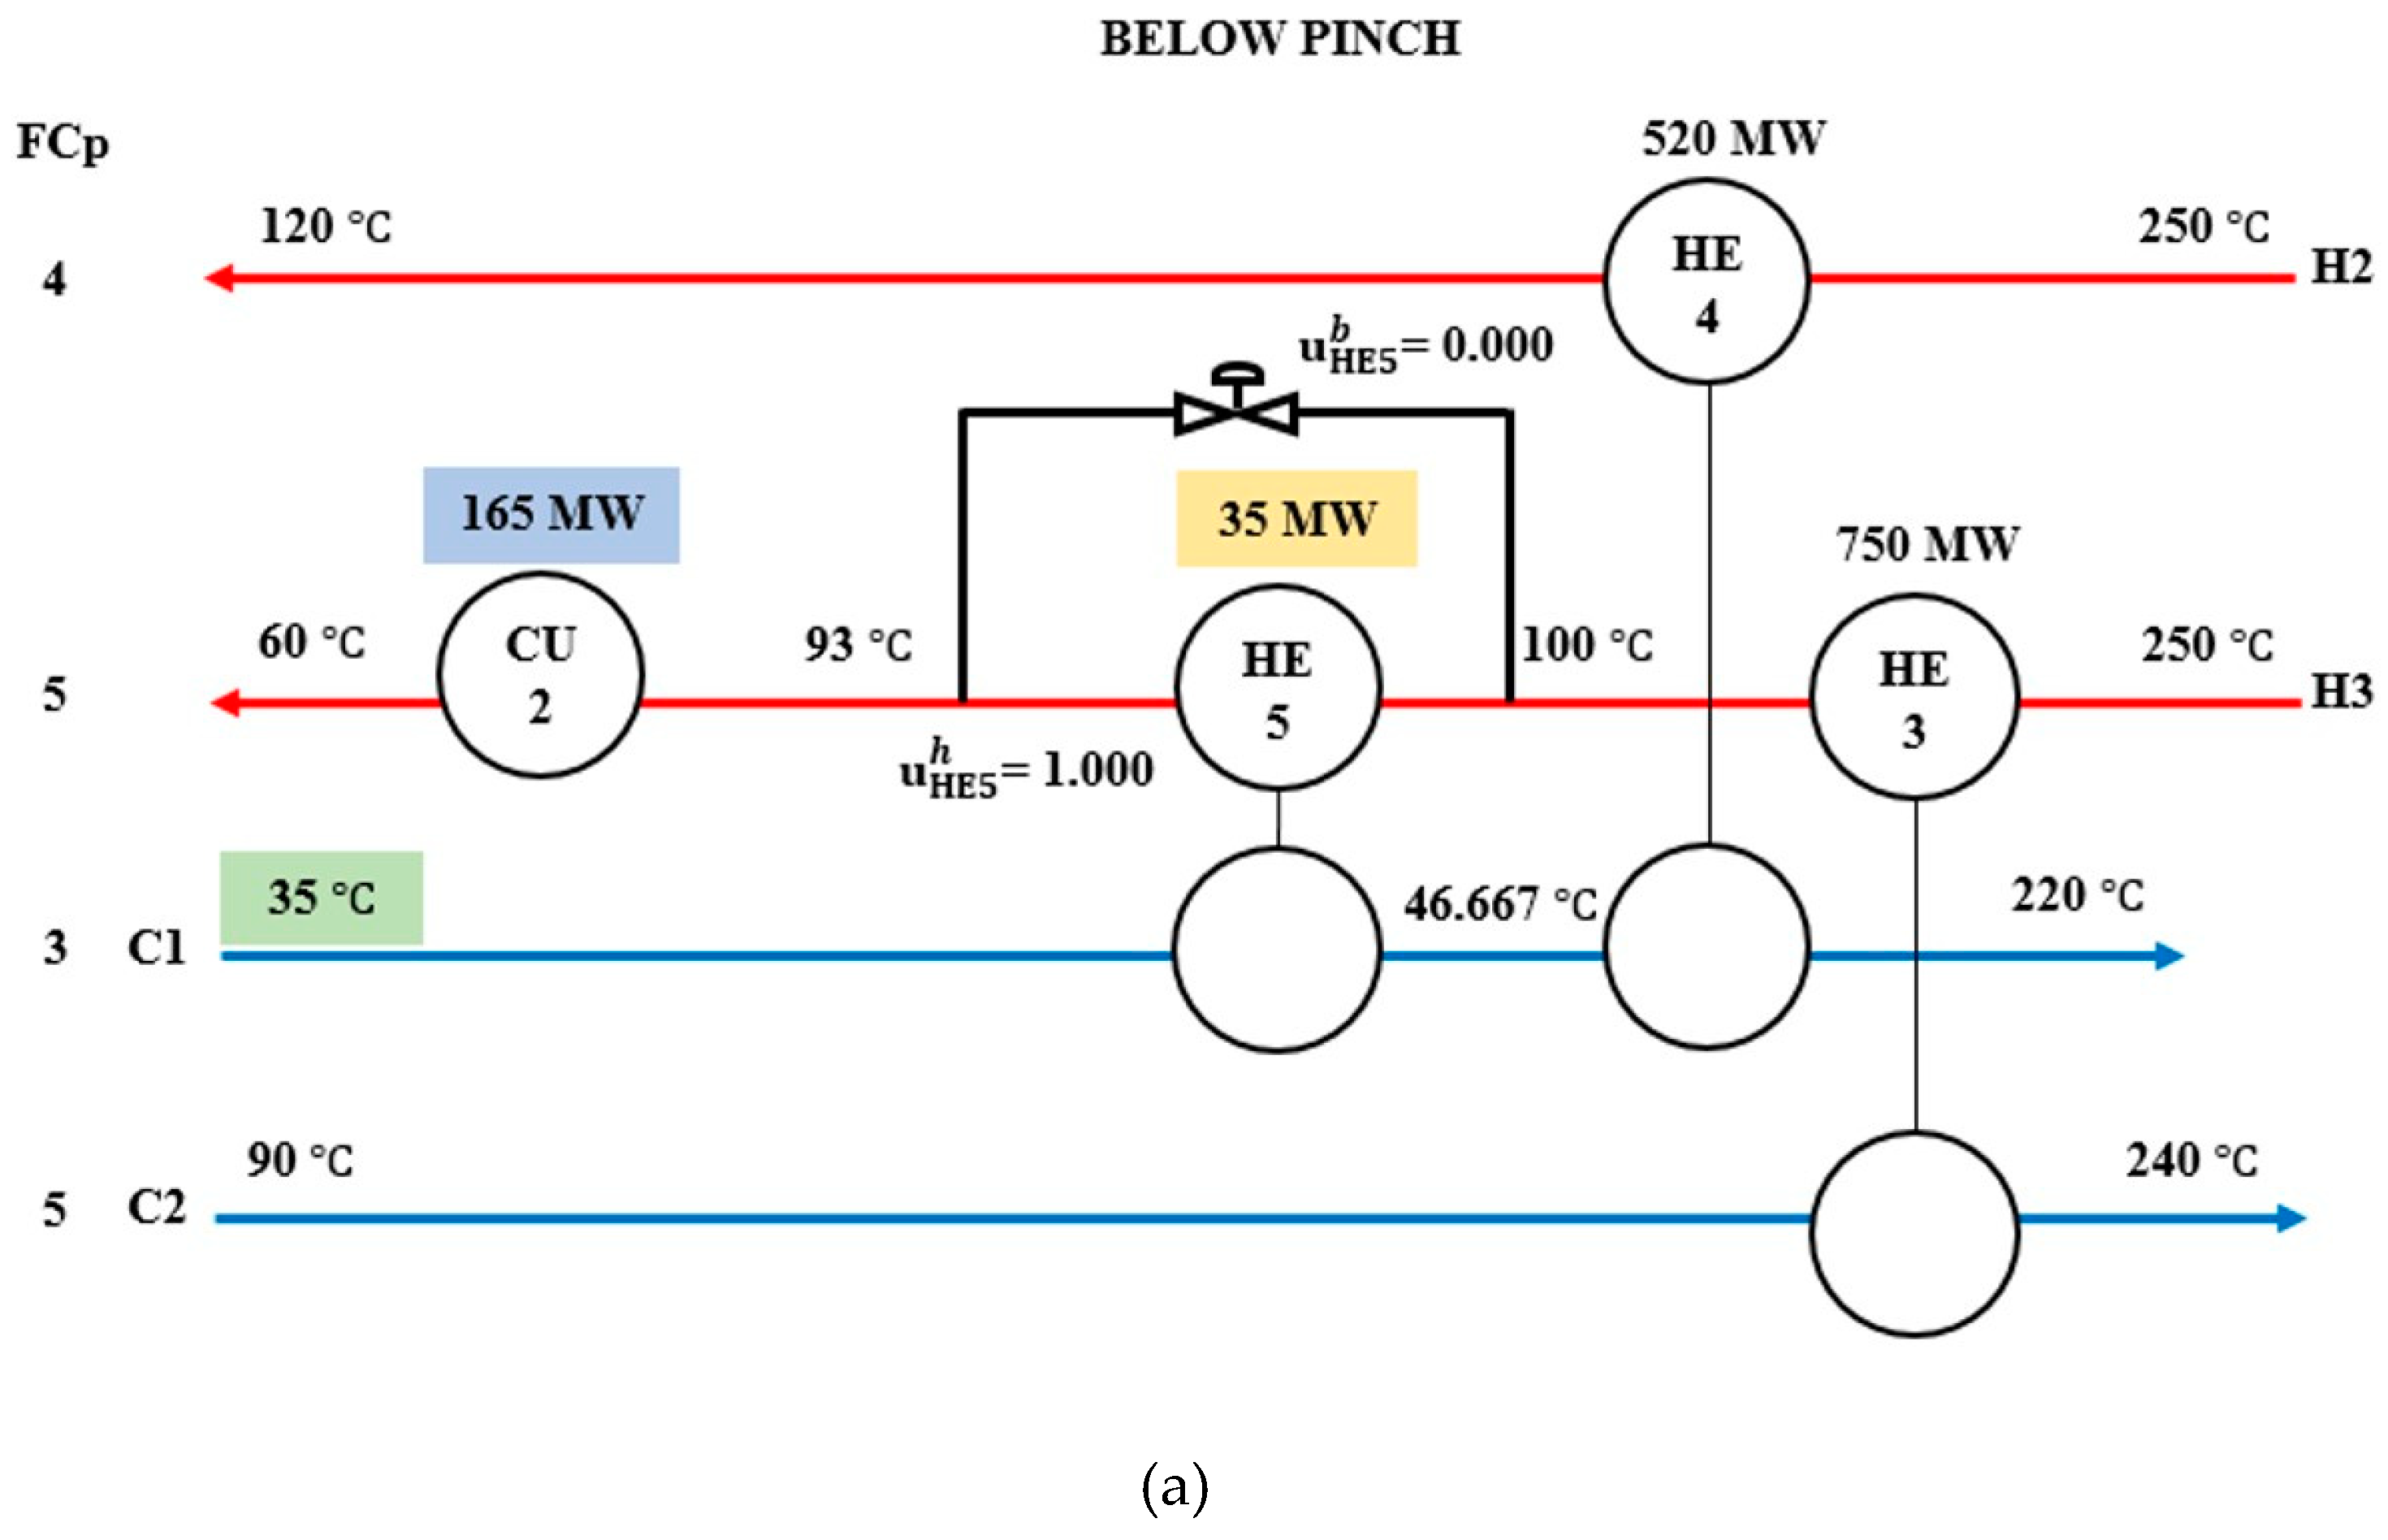
| C1 | Below Pinch | +5 | HE5 | 35 | 5 | bHE5 | 0.857 | Stream C1 | CU2 | - | 195 | - | 195 |
| Nominal | - | 20 | 0.429 | - | - | 180 | |||||||
| −5 | HE5 | 35 | 0.000 | CU2 | - | 165 | |||||||
| C2 | Across Pinch | +5 | HE3 | 775 | 750 | bHE3 | 0.032 | Stream C2 | HU1 | 130 | 180 | 105 | 180 |
| Nominal | - | 775 | 0.000 | HU1 & CU2 | 105 | 155 | |||||||
| −5 | HE3 | 775 | 0.000 | CU2 | 130 | 155 | |||||||
| C3 | Above Pinch | +5 | HE1 | 100 | 100 | - | - | - | HU2 | 355 | - | 285 | - |
| Nominal | - | 100 | - | - | 320 | - | |||||||
| −5 | HE1 | 100 | - | HU2 | 355 | - | |||||||
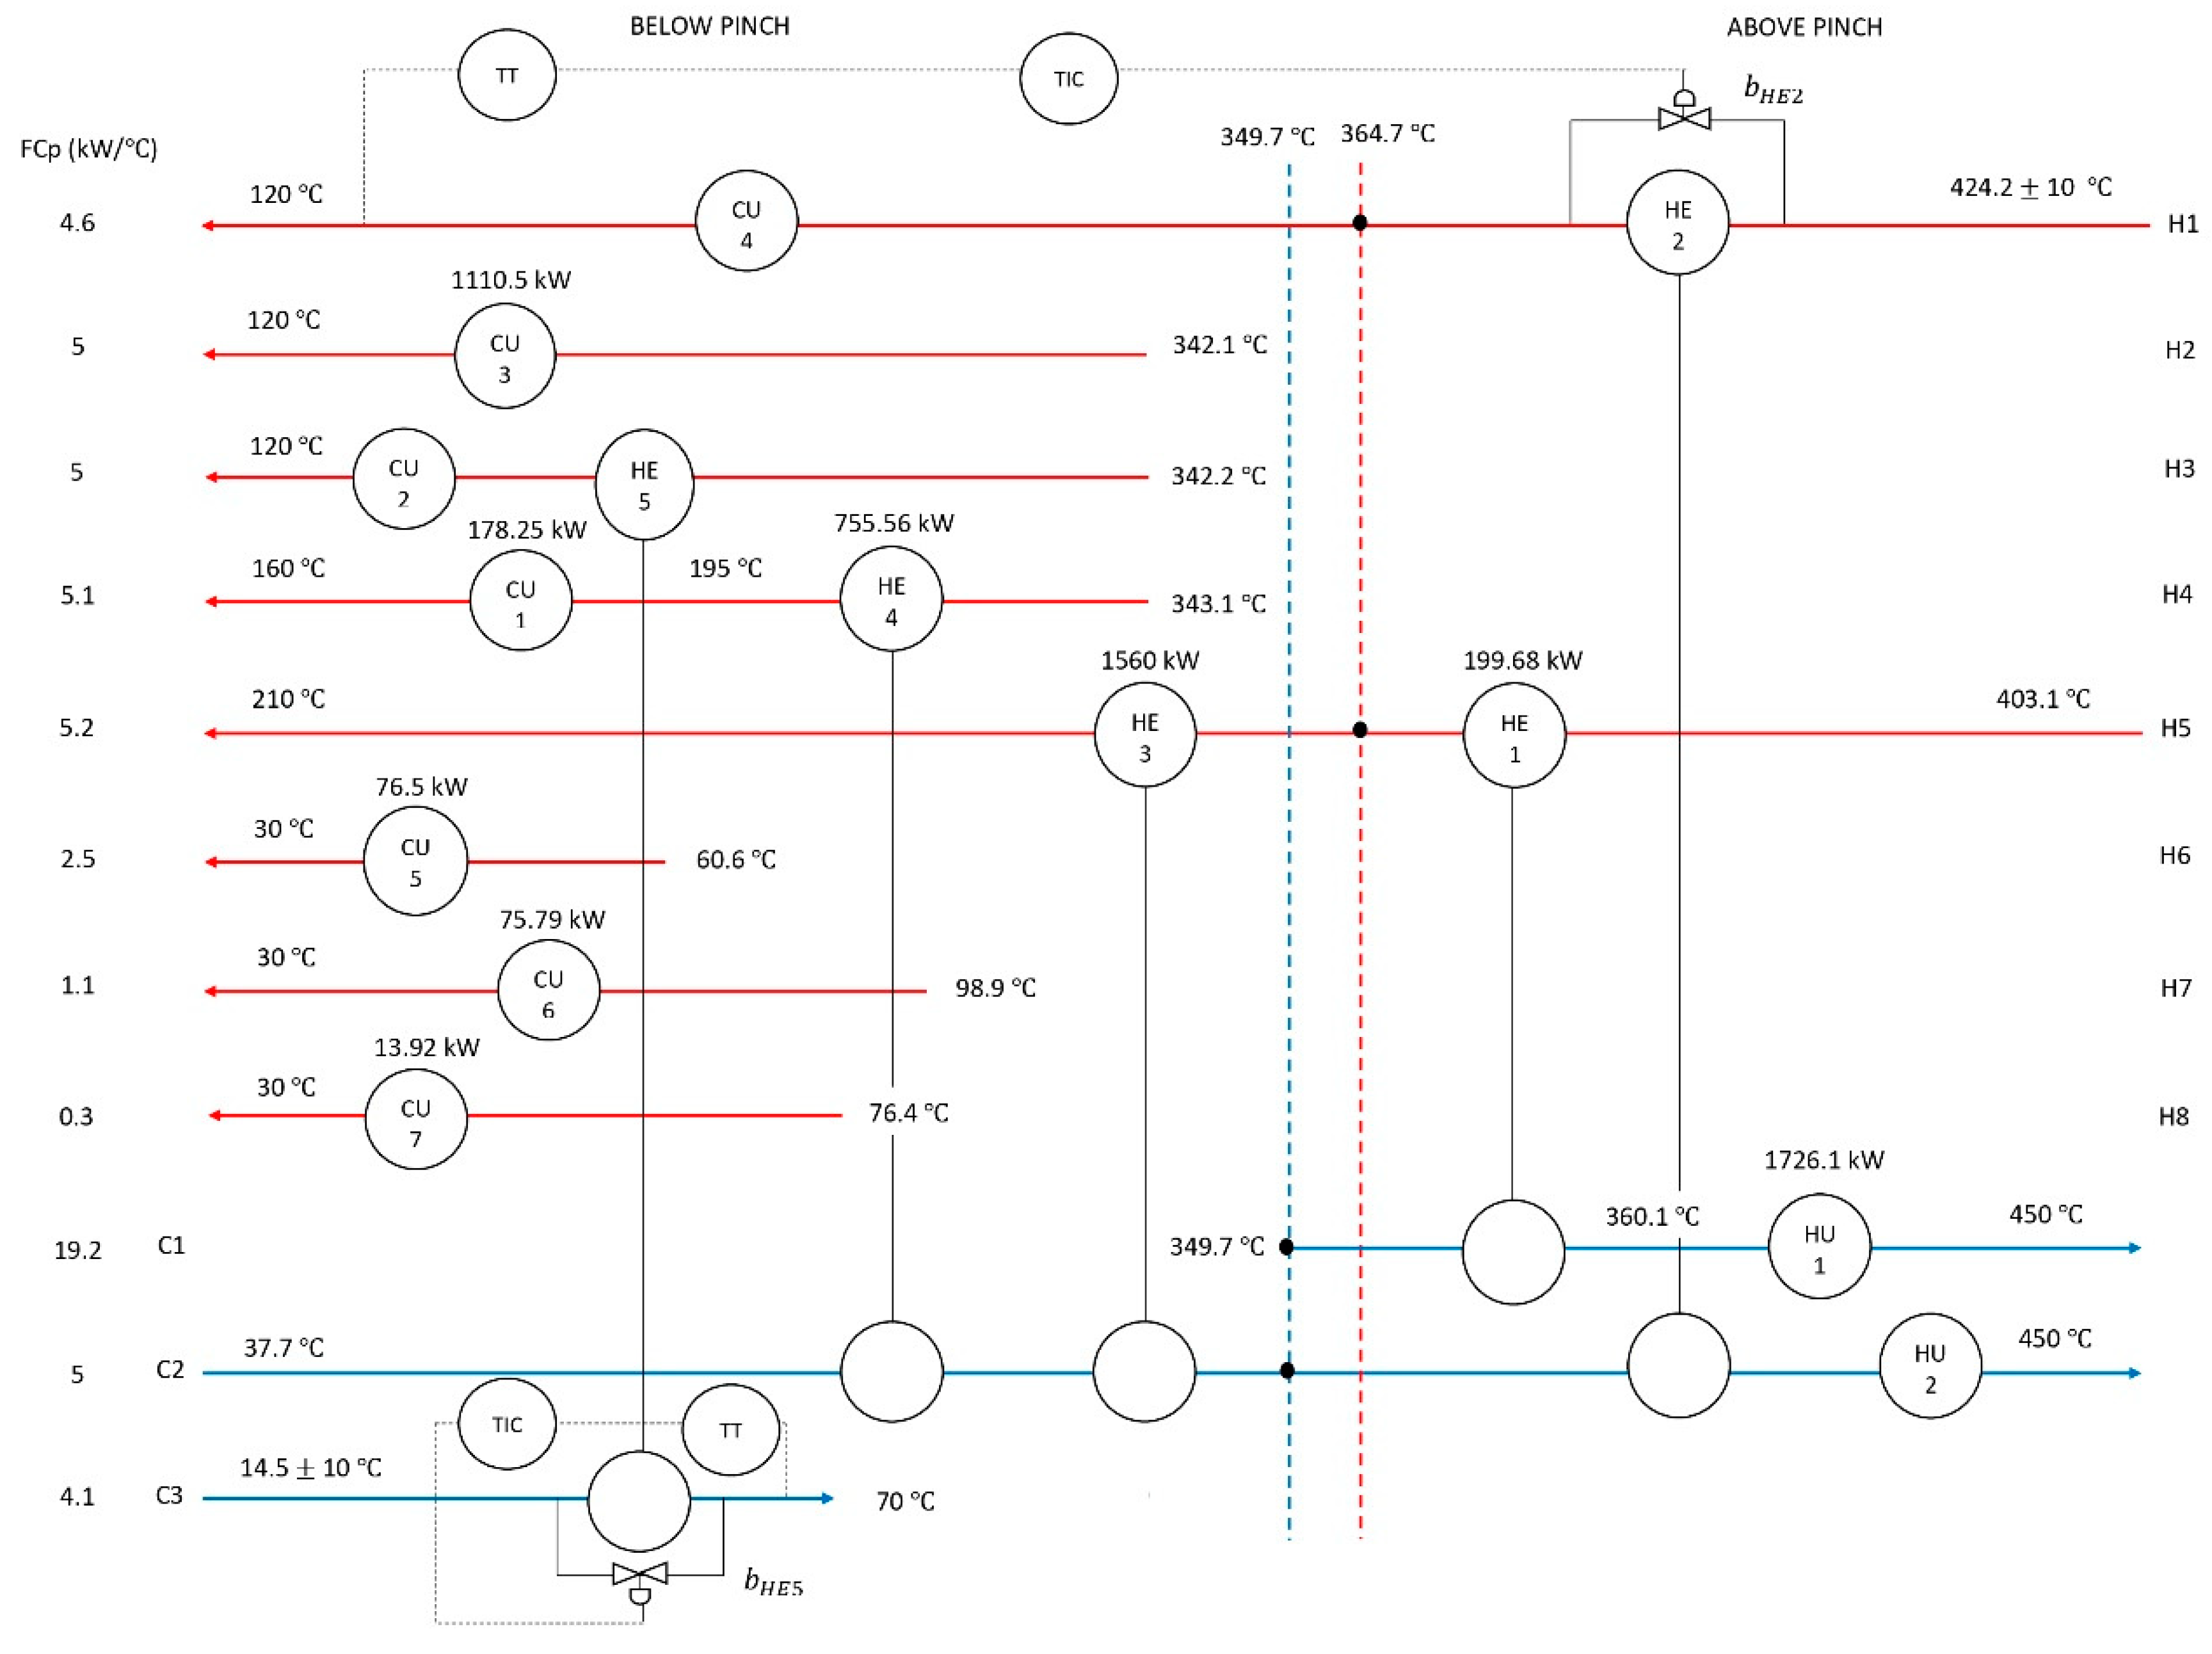
| Stream | Supply Temperature, | Target Temperature, | Heat Capacity Flowrate, | Enthalpy, ΔH (kW) |
|---|---|---|---|---|
| Hot 1 (H1) | 424.2 10 | 120 | 4.6 | −1399.32 |
| Hot 2 (H2) | 342.1 | 120 | 5 | −1110.50 |
| Hot 3 (H3) | 342.2 | 120 | 5 | −1111.00 |
| Hot 4 (H4) | 343.1 | 160 | 5.1 | −933.81 |
| Hot 5 (H5) | 403.1 | 210 | 5.2 | −1004.12 |
| Hot 6 (H6) | 60.6 | 30 | 2.5 | −76.50 |
| Hot 7 (H7) | 98.9 | 30 | 1.1 | −75.79 |
| Hot 8 (H8) | 76.4 | 30 | 0.3 | −13.92 |
| Cold 1 (C1) | 349.7 | 450 | 19.2 | 1925.76 |
| Cold 2 (C2) | 37.7 | 450 | 5 | 2061.50 |
| Cold 3 (C3) | 14.5 10 | 70 | 4.1 | 227.55 |
| Scenario | ||
|---|---|---|
| A | 434.2 | 24.5 |
| B | 414.2 | 4.5 |
| C | 434.2 | 4.5 |
| D | 414.2 | 24.5 |
| Stream | Stream Position | Disturbance at TS | HE Affected | HE Max. Size (kW) | HE Duty during Disturbance (kW) | Bypass Name | Bypass Fraction | Bypass Location | HU or CU Affected | The Maximum Size of HU or CU | The Duty of HU or CU during a Disturbance | ||
|---|---|---|---|---|---|---|---|---|---|---|---|---|---|
| HU (kW) | CU (kW) | HU (kW) | CU (kW) | ||||||||||
| H1 | Across Pinch | +10 | HE2 | 273.70 | 273.70 | bHE2 | 0.000 | Stream H1 | HU2 | 273.80 | - | 227.80 | - |
| Nominal | - | 273.70 | 0.000 | - | 227.80 | - | |||||||
| −10 | HE2 | 227.70 | 0.168 | HU2 | 273.80 | - | |||||||
| C3 | Below Pinch | +10 | HE5 | 227.55 | 186.60 | bHE5 | 0.000 | Stream C3 | CU2 | - | 924.45 | - | 924.45 |
| Nominal | - | 227.55 | 0.000 | - | - | 883.45 | |||||||
| −10 | HE5 | 227.55 | 0.153 | CU2 | - | 883.45 | |||||||
| Stream | Stream Position | Disturbance at TS | HE Affected | HE Max. Size (kW) | HE Duty during Disturbance (kW) | Bypass Name | Bypass Fraction (1) | Bypass Location | HU or CU Affected | The Maximum Size of HU or CU | The Duty of HU or CU during a Disturbance | ||
|---|---|---|---|---|---|---|---|---|---|---|---|---|---|
| HU (kW) | CU (kW) | HU (kW) | CU (kW) | ||||||||||
| H1 | Across Pinch | +10 | HE2 | 319.70 | 319.70 | bHE2 | 0.000 | Stream H1 | HU2 | 273.80 | - | 181.80 | - |
| Nominal | - | 273.70 | 0.252 | - | 227.80 | - | |||||||
| −10 | HE2 | 227.70 | 0.288 | HU2 | 273.80 | - | |||||||
| C3 | Below Pinch | +10 | HE5 | 268.60 | 186.60 | bHE5 | 0.305 | Stream C3 | CU2 | - | 924.45 | - | 924.45 |
| Nominal | - | 227.55 | 0.265 | - | - | 883.45 | |||||||
| −10 | HE5 | 268.60 | 0.000 | CU2 | - | 842.45 | |||||||
| Utilities | Rate (USD/kW·y) | ||
|---|---|---|---|
| Hot oil | 350 | 320 | 311.280 |
| High pressure steam (HPS) | 255 | 254 | 249.024 |
| Tempered water (TW) | 70 | 80 | 31.128 |
| Cooling water (CW) | 25 | 30 | 41.504 |
| Previous Work (with Nominal HE Area) | This Work (with Maximum HE Area) | |||||||
|---|---|---|---|---|---|---|---|---|
| Scenario A | Scenario B | Scenario C | Scenario D | Scenario A | Scenario B | Scenario C | Scenario D | |
| Cold utility (kW) | 924.45 | 883.45 | 883.45 | 924.45 | 924.45 | 842.45 | 842.45 | 924.45 |
| Hot utility (kW) | 227.80 | 273.80 | 227.80 | 273.80 | 181.80 | 273.80 | 181.80 | 273.80 |
| Total disturbed HE area (m2) | 77.774 | 82.186 | ||||||
| Annualised capital cost ($/y) | 5705.92 | 5901.70 | ||||||
| Annualised utility cost ($/y) | 99,685.86 | 112,728.50 | 98.409.62 | 114,004.74 | 85,366.98 | 111,452.25 | 82,814.49 | 114,004.74 |
| Annualised total cost ($/y) | 105,391.78 | 118,434.42 | 104,115.54 | 119,710.66 | 91,268.68 | 117,353.95 | 88,716.19 | 119,906.44 |
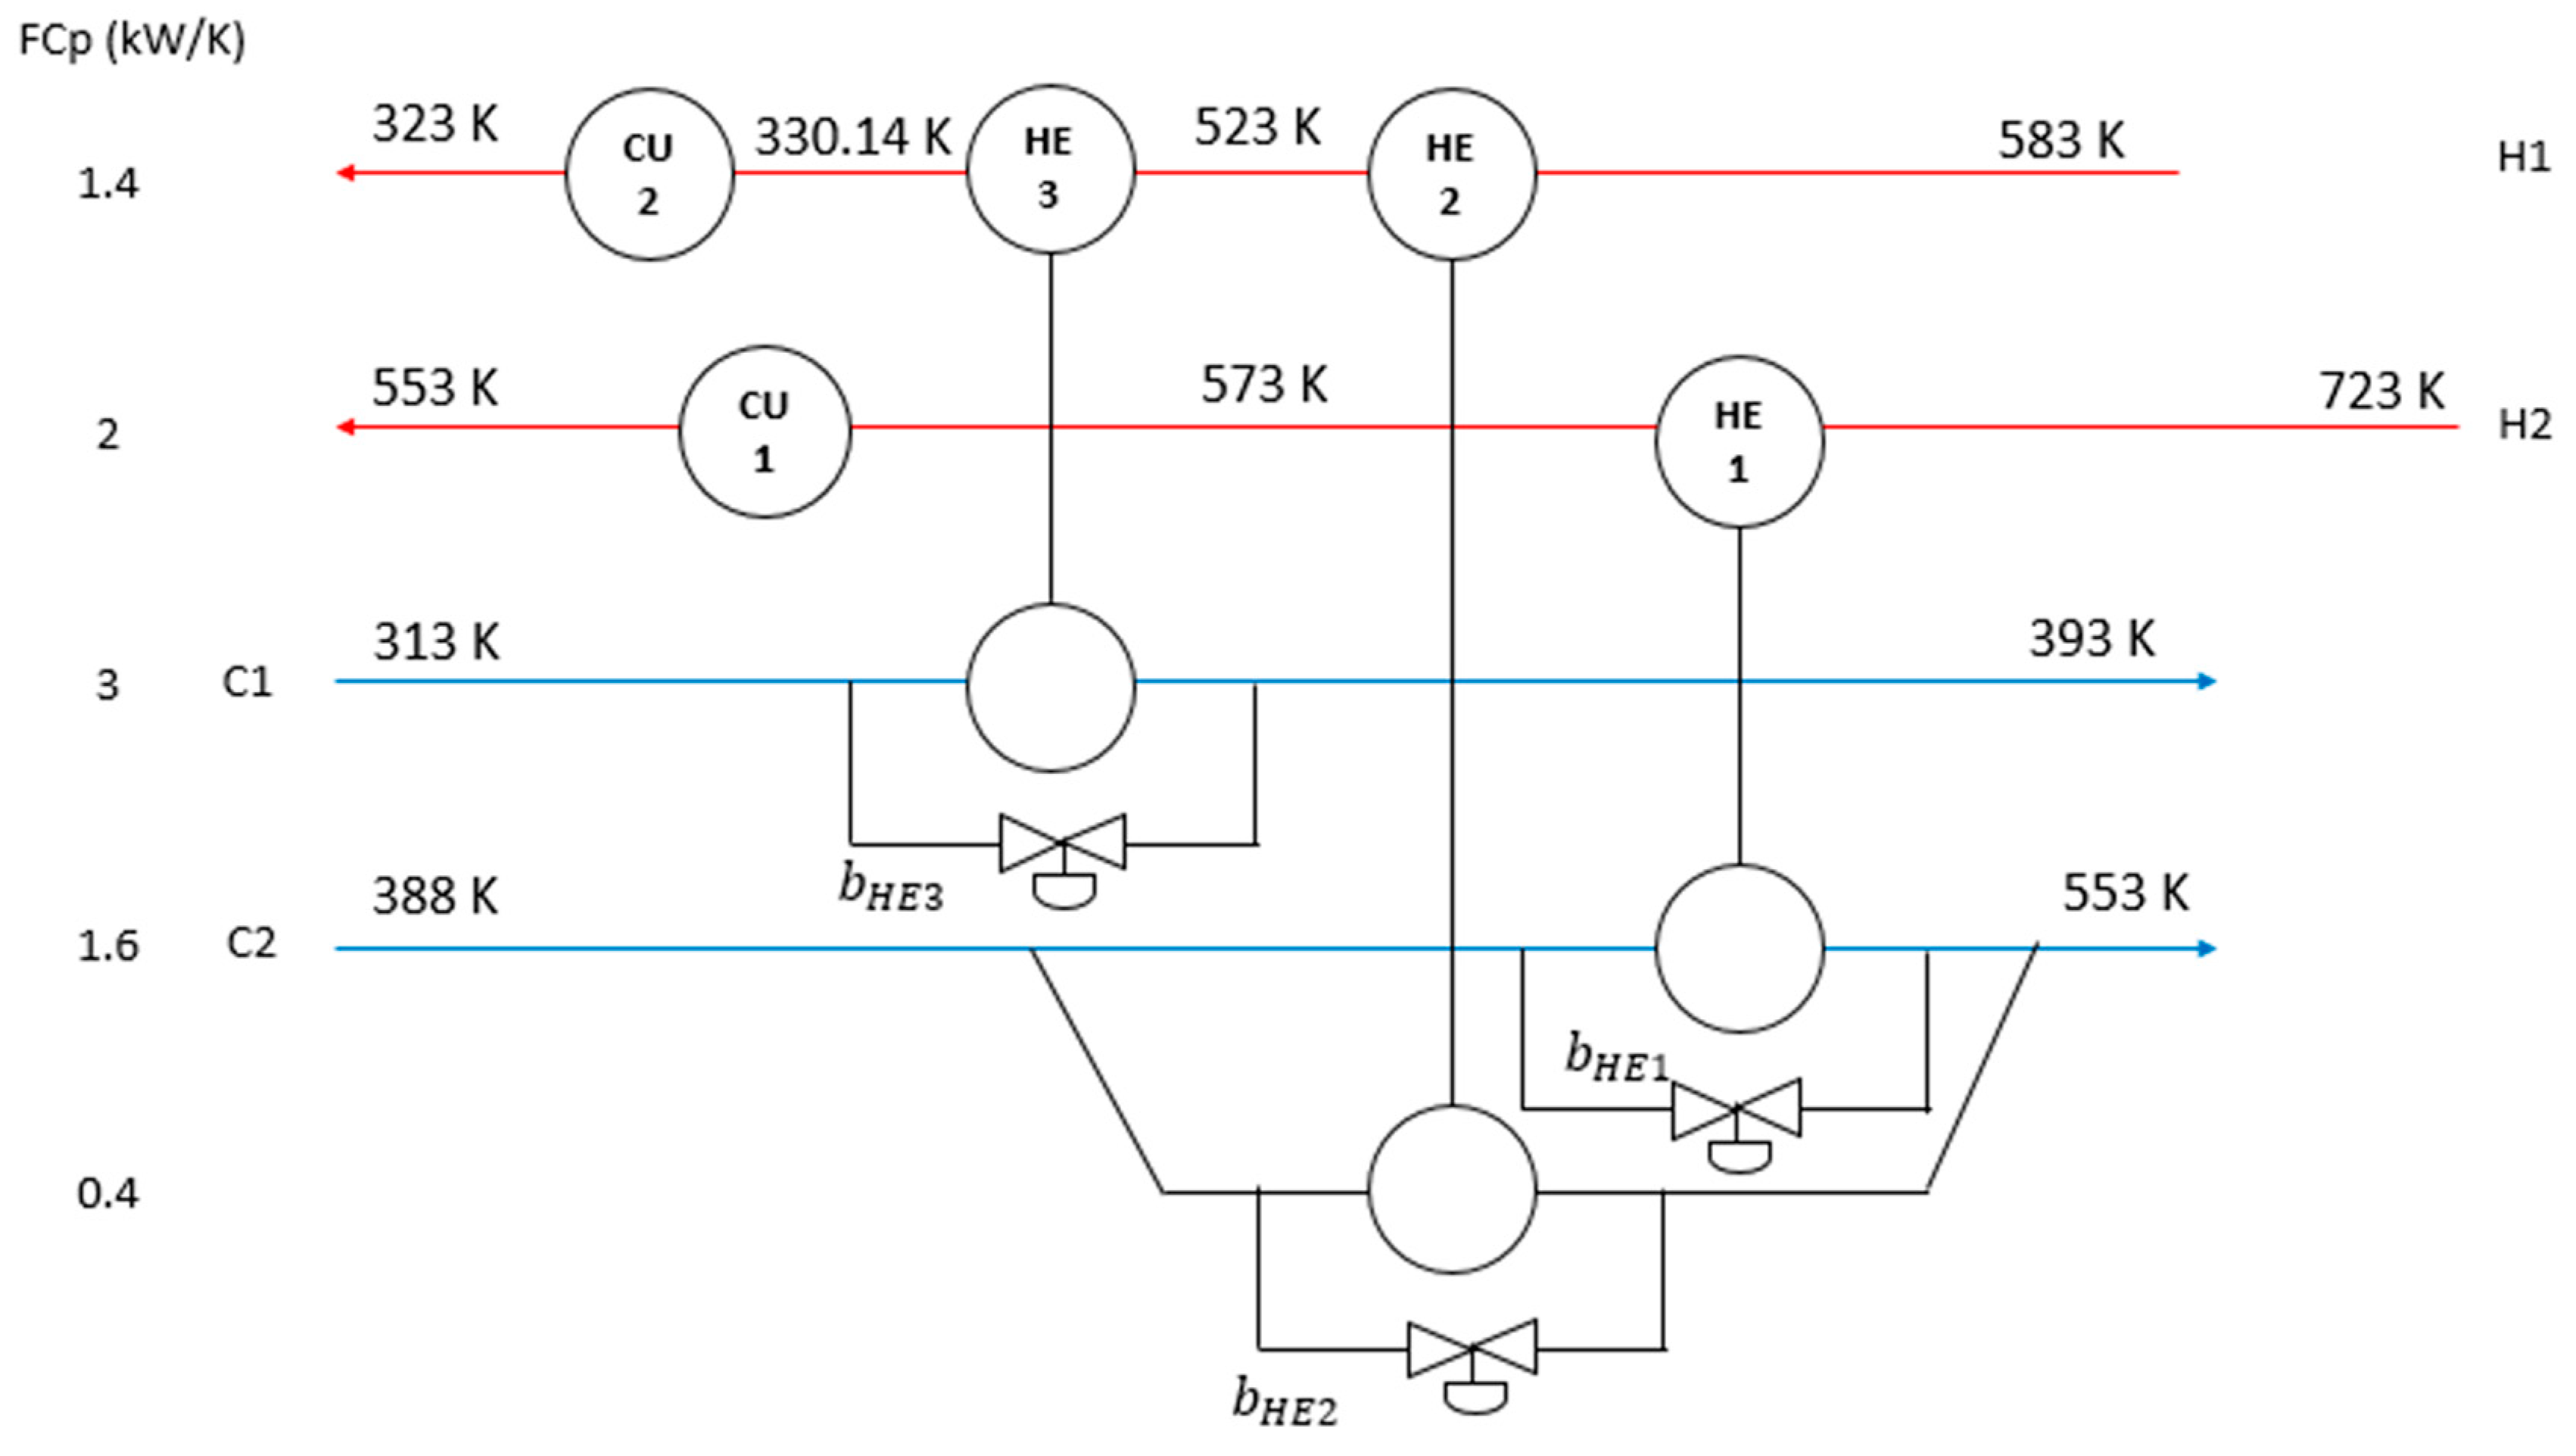
| Stream | Supply Temperature, TS (K) | Target Temperature, Tt (K) | Heat Capacity Flowrate, FCP (kW/K) | h (kW·m2/K) |
|---|---|---|---|---|
| Hot 1 (H1) | 583 10 | 323 | 1.4 | 0.16 |
| Hot 2 (H2) | 723 10 | 553 | 2.0 | 0.16 |
| Cold 1 (C1) | 313 10 | 393 | 3.0 | 0.16 |
| Cold 2 (C2) | 388 10 | 553 | 2.0 | 0.16 |
| CU | 303 | 323 | 0.16 | |
| HU | 573 | 573 | 0.16 |
| Iteration | TS, H1 (K) | TS, H2 (K) | TS, C1 (K) | TS, C2 (K) |
|---|---|---|---|---|
| 1 | 583 | 723 | 313 | 388 |
| 2 | 573 | 713 | 303 | 378 |
| Method | Escobar et al. [9] | This Work | ||
|---|---|---|---|---|
| Iteration | 1 | 2 | 1 | 2 |
| Annualised utility cost ($/y) | 8117.00 | 5573.00 | 8117.00 | 3028.80 |
| Total affected area (m2) | 81.417 | 103.631 | 113.9538 | 113.9538 |
| Annualised capital cost ($/y) | 17,115.70 | 21,633.30 | 22,958.13 | 22,958.13 |
| Total annualised cost ($/y) | 25,232.70 | 27,206.30 | 31,075.13 | 25,986.93 |
© 2019 by the authors. Licensee MDPI, Basel, Switzerland. This article is an open access article distributed under the terms and conditions of the Creative Commons Attribution (CC BY) license (http://creativecommons.org/licenses/by/4.0/).
Share and Cite
Hafizan, A.M.; Klemeš, J.J.; Wan Alwi, S.R.; Abdul Manan, Z.; Abd Hamid, M.K. Temperature Disturbance Management in a Heat Exchanger Network for Maximum Energy Recovery Considering Economic Analysis. Energies 2019, 12, 594. https://doi.org/10.3390/en12040594
Hafizan AM, Klemeš JJ, Wan Alwi SR, Abdul Manan Z, Abd Hamid MK. Temperature Disturbance Management in a Heat Exchanger Network for Maximum Energy Recovery Considering Economic Analysis. Energies. 2019; 12(4):594. https://doi.org/10.3390/en12040594
Chicago/Turabian StyleHafizan, Ainur Munirah, Jiří Jaromír Klemeš, Sharifah Rafidah Wan Alwi, Zainuddin Abdul Manan, and Mohd Kamaruddin Abd Hamid. 2019. "Temperature Disturbance Management in a Heat Exchanger Network for Maximum Energy Recovery Considering Economic Analysis" Energies 12, no. 4: 594. https://doi.org/10.3390/en12040594