A Case Study of an Optimized Intermittent Ventilation Strategy Based on CFD Modeling and the Concept of FCT


Institute of Remote Sensing and Geographic Information System, Peking University, Beijing 100871, China
*
Author to whom correspondence should be addressed.
Energies 2019, 12(4), 721; https://doi.org/10.3390/en12040721
Submission received: 15 January 2019
/
Revised: 3 February 2019
/
Accepted: 4 February 2019
/
Published: 22 February 2019
(This article belongs to the Special Issue Mathematical Modeling of Fluid Flow and Heat Transfer in Petroleum Industries and Geothermal Applications)
Abstract
:With the increasing operation costs and implementation of carbon tax in the underground coal mining systems, a cost-effective ventilation system with well methane removal efficiency becomes highly required. Since the intermittent ventilation provides a novel approach in energy saving, there still exists some scientific issues. This paper adopts the design concept of frequency conversion technology (FCT) to the ventilation pattern design for the first time, and an optimized intermittent ventilation strategy is proposed. Specifically, a real excavation laneway of a coal mine in China is established as the physical model, and computational fluid dynamic (CFD) approaches are utilized to investigate the spatiotemporal characteristics of airflow behavior and methane distribution. Plus, the period of intermittency and appropriate air velocity are scientifically defined based on the conception of FCT by conducting the parametric studies. Therefore, an optimized case is brought out with well methane removal efficiency and remarkable energy reduction of 39.2% in a ventilation period. Furthermore, the simulation result is verified to be reliable by comparing with field measurements. The result demonstrates that a balance of significant energy saving and the methane removal requirement based on the concept of FTC is possible, which could in turn provide good operational support for FTC.
1. Introduction
In the underground coal mining operation environment, methane gas is one of the most hazardous emitted gases for it is highly explosive under certain conditions inside a laneway of the coal mine, which also contributes to global warming [1,2,3]. Numerous reported methane-related incidents and accidents with fatalities show that appropriate methane gas control and the related progressing in mine safety still remains a longstanding challenge and an emerging issue [4,5]. To avoid the methane accumulation in the mining face area, and therefore eliminate potential incidents and accidents, a good ventilation system is mandatory and highly desirable. In accordance with coal mining regulations in many countries, methane concentrations should be maintained below 3%v/v in US, 2.5% in Spain, 2% in France, and even lower in other countries: 1.25% in UK, and 1% in Germany and China [6,7].
Generally, large ventilation system is installed in underground coal mines to supply fresh air and to dilute the methane gas below the maximum allowable level. However, it is showed that, nowadays, most ventilation systems generally supply excess fresh air to remove methane gas and ensure a safe working environment as required by local codes, and the specific energy consumption value differs from different site conditions. For example, Jeswiet stated that at least 25% of electric energy consumption in mining is costed by ventilation purposes, Mielli and Bongiovanni indicated that approximately 15%–40% of the operating costs can be attributed to mine ventilation systems, and up to 60% of the total mining operation costs are connected with mine ventilation as revealed by Reddy [8,9,10,11]. With the increase of energy and operation costs and implementation of a carbon tax, a cost-effective ventilation and methane control strategy is strongly required for the mining industry, which means that the ventilation system should be designed to meet the regulatory limits and ensure a safe and productive working environment whilst keeping energy usage and operating costs to a minimum. As such, safety and cost are the two main competing requirements that have to be balanced, for which the careful ventilation design is mandatory and a concept of ventilation-on-demand has received considerable attention [12,13,14,15].
In this sense, a cost-effective ventilation and methane removal strategy is expected to be a thorough solution to save operating costs as well as maintain the safety standards for underground coal mining systems. A fundamental challenge to effectively design the ventilation strategy is to understand the physical mechanism of methane gas distribution as well as its coupling with ventilation airflow. Numerous simulation experiments based on the principles of computational fluid dynamics (CFD) have been widely applied to evaluate and investigate the airflow behavior, methane dispersion regularity, and control strategies in underground coal mines, which allows innovation at very low costs. Heerden and Sullivan (1993) [16] were among the first researchers by utilizing the CFD modeling to investigate airflow behavior, methane emission, and dust dispersion in the underground coal mine, while validation of the model against field measured data was not conducted till 1997 by Uchino and Inoue [17]. Nakayama et al. (1999) conducted similar studies by utilizing CFD software, LASAR95/98, and pointed out that transversely in and along the corner space and the area underneath the ventilation duct are the locations where higher methane gas generally exists [18]. Since in the case of extraction of flammable minerals, the forced ventilation system is address to be more effective and safe compared with exhaust only ventilation system by several studies [19,20,21], numerous methane removal strategies have been studied based on the forced ventilation system. For example, Wala et al. numerically simulated methane dispersion in room and pillar mines and verified the CFD model with the experimental data, and later extended their experiment by combining the scrubber operation on the face ventilation [22]. Besides, Torano et al. (2011) compared various turbulence models to evaluate methane distribution, and later added dust to their model on the basis of the validation with experimental data [23]. Szlązak N. and Zhong M. studied the optimization of air flow and concerned the methane hazard in earlier research [24,25]. However, these studies still remain very limited due to the neglect of dynamic regularity of methane distribution during ventilation design process, which renders the principle and technology of methane removal a key scientific issue.
Recently, Sasmito and Kurnia et al. (2013, 2017) carried out a series of simulations of different ventilation scenarios by applying auxiliary equipment to improve ventilation as well as the control of methane gas whilst keeping low energy usage consumption [26,27,28,29]. And Pach et al. presented some latest research of optimization of forced air distribution by comparing positive and negative regulations, and also showed the airflow optimization due to methane hazards and low-cost ventilation [30,31]. Among these studies, it suggests that the additional ventilation equipment may cause the complexity and severe energy usage to the system, such as the combination of air curtains together with a physical brattice, and brattice ventilation with no additional power source may even limit the flexibility and movement of miners and mining fleets. One of the most significant research results is the novel intermittent ventilation strategy, which is implemented by alternating the airflow velocity between a predetermined high and low value [32]. However, this method is just being proposed, some scientific issues have to be carefully solved. And there mainly exists two major issues, as presented by Guang Xu [33]: one is the control of alternating flow is challenging; another is that this study assumes the methane concentration is still below the limit value during the period of low flow, which shows that the increase of flow velocity is probably not necessary since keeping the low flow rate would save more power costs. Where the first issue of implementation is feasible with the application of frequency conversion technology (FCT) in many underground coal mines [34,35], and the second issue is primarily due to the predetermined intermittency for high and low flow rate, which ignored the dynamic regularity of methane accumulation in an intermittency of low flow rate. Besides, although the CFD modeling provides practical results in present studies, validation is needed by comparison with field measured data.
Based on the above issues, this study applies the design concept of FCT for the first time to investigate an optimized intermittent ventilation strategy with the goal of reducing energy costs whilst maintaining the methane concentration at a low level. Firstly, a geometric laneway model is established and discretized with different mesh generations, and the appropriate mesh size is chosen by testing and comparing each other in terms of elapsed time and computational efficiency. Secondly, computational fluid dynamic (CFD) models are applied to study the spatiotemporal characteristics of airflow behavior and methane distribution inside a laneway of coal mine, and intermittent ventilation patterns with different speed functions are tested and compared with respect to the potential energy saving and main impact factors. Finally, in accordance with the design concept of FCT, the key time point is defined by analyzing the dynamic regularity of methane concentration, thus the optimal intermittent ventilation pattern is scientifically determined, which provides excellent performance in balancing both methane control efficiency and energy costs reduction. Furthermore, the simulation results are validated with field measured data in Sijiazhuang coal mine. It is noted that the simpler design of this intermittent ventilation pattern can be suitable and practical in underground mine applications, and can provide decision supports for FCT when utilized in local fan of ventilation system.
2. Model Development
2.1. Geometric Model and Research Background
In this study, a fully mechanized excavation laneway of 1-5205 (identification) in Sijiazhuang coal mine is selected as the physical laneway prototype, which is located in China, Shanxi province. The main reason for choosing this laneway is the accessibility of continuously and precisely monitored mine data. The latitude and longitude extensions of this coal mine range from 101,962.58 to 106,993.34 m and from 72,077.19 to 66,008.85 m, respectively. Figure 1 shows the geometric model of the laneway, which is established to perform the case study. The excavation laneway is 32 m long with rectangular cross-section of 4.4 m wide and 4 m high, and the ventilation duct with a diameter of 0.8 m is hung at 3 m height from the laneway floor and 0.7 m from the laneway wall on the access road. The distance from its outlet to the driving face is 11 m.
The safety and operation regulations in Shijiazhuang coal mine shows that the mine has a primary structure coal, and adopts the comprehensive mechanized driving method in the construction of the laneway. Besides, what we care about is the airflow quantity, which is calculated based on the basic requirement of the evaluated methane gas or carbon dioxide emission quantity, the number of miners in the laneway, the actual wind suction of local fan, and the maximum and minimum air velocity during the process of laneway excavation. The safety and operation regulations indicate that the required airflow quantity in the excavation laneway of 1-5205 is 7.53 m3/s (0.428 m/s), so the velocity of airflow in ventilation duct is 15 m/s, the evaluated volume flow rate of methane gas around the driving face is approximately 0.031 m3/s, and the maximum number of miners allowed in the 1-5205 laneway is 9. In this study, a representative longitudinal section is chosen to investigate the spatiotemporal distribution of airflow behavior and methane distributions in the numerical simulation. As can be seen in Figure 1, where section A is specified in the outtake side of the laneway with 0.8 m away from the nearest wall of the laneway, which is also the region where miners typically walk.
2.2. Mathematical Formulation
The essential regularity of methane dispersion and its coupling with the air flow is a key issue for the methane gas removal problem, which belongs to viscous Newtonian fluid, and is governed by the Navier-Stokes (N-S) equations. During the process of coal mining, a large amount of methane gas generates from the driving face and disperses with impact of airflow from the ventilation duct, which is defined as species transport motion. We assume that the airflow and gases are the continuous medium gas, and heat and mass transfer are ignored during the process of dispersing.
2.2.1. Governing Conservation Equations
In the laneway flow, methane is released and dispersed with ventilation airflow from the specified sources in the driving face, and turbulent mass, momentum, energy, and species transport occur [7,32]. The conservation equations of which need to be considered can be expressed as:
where is the fluid density, is the fluid velocity, and is the pressure; is the viscous stress tensor, is the specific heat of the fluid, is the gravity acceleration, is the effective fluid thermal conductivity, and is the temperature. , are the mass fraction and the effective diffusivity of species i (O2, CH4 and N2), respectively, is the turbulent viscosity, is the turbulent Schmidt number, and is the turbulent Prandtl number.
2.2.2. Constitutive Relations
The viscous stress tensor for fluid can be described as [7,32]:
where is the dynamic viscosity, is the identity or second order unit tensor, and is the turbulent kinetic energy.
It is noted that in the mining laneway, the interaction between the species follows the incompressible ideal gas law, which is captured in the mixture density, thus a ternary species mixture consisting of methane gas, oxygen, and water vapour is solved, and the ideal gas law is described as:
where R is the universal gas constant, M denotes the mixture molecular weight, which is given by:
and are the mass fraction and the molar mass of species i (O2, CH4 and N2), respectively, where the mass fraction of nitrogen is calculated as:
The molar fractions are related to the mass fraction, calculated by:
The fluid mixture viscosity is given as:
where are the mole fraction of species i and j, and is defined as:
In consideration of the practical purpose, the unit of methane concentration commonly used in the regulation/law is presented in %v/v, which is defined as:
In addition, the fan power is calculated as:
where stands for the pressure difference from the inlet, is the volumetric flow rate of the fan. It is noted that depending on the actual fan efficiency, the fan power would be different.
2.2.3. Turbulence Model
The turbulence model is the key foundation of the species transport motion in representing flow behaviour, because it can directly affect the simulation accuracy for dynamic characteristics of methane dispersion. Thus, it is of great importance to select the appropriate turbulence model. As for the most widely used models, such as K-epsilon, K-omega, RSM and Spalart-Allmaras. The comparison experiment demonstrated by Kurnia et al. and our previous work shows that the K-epsilon model gives a reasonably good prediction [7], so K-epsilon model is selected in the current study. In short, the model considers a two-equation model and solves for turbulent kinetic energy, k, and its rate of dissipation, , which is coupled with turbulent viscosity [26,27]. The equations are given as:
where , , represents the generation of turbulence kinetic energy due to the mean velocity gradients. and are the turbulent Prandtl numbers for k and respectively. The turbulent viscosity is computed by combining k and as follows:
where , , , and are constants, the values are 1.44, 1.92, 0.09, 1, and 1.3, respectively.
2.2.4. Boundary Conditions
The boundary conditions of the model are summarized as follows:
- (i)
- Walls: standard wall function is defined;
- (ii)
- Inlet: the inlet of ventilation duct is prescribed as the velocity-inlet, the basic 15 m/s and various time varying air velocity are specified according to different ventilation patterns;
- (iii)
- Driving face: methane gas is released evenly at a volume flow rate of 0.031 m3/s;
- (iv)
- Outlet: the outlet of the laneway is set to the pressure-outlet boundary condition with standard atmospheric pressure (101.325 kPa), and with the average temperature in the Sijiazhuang coal mine of 300 K.
3. Numerical Methodology
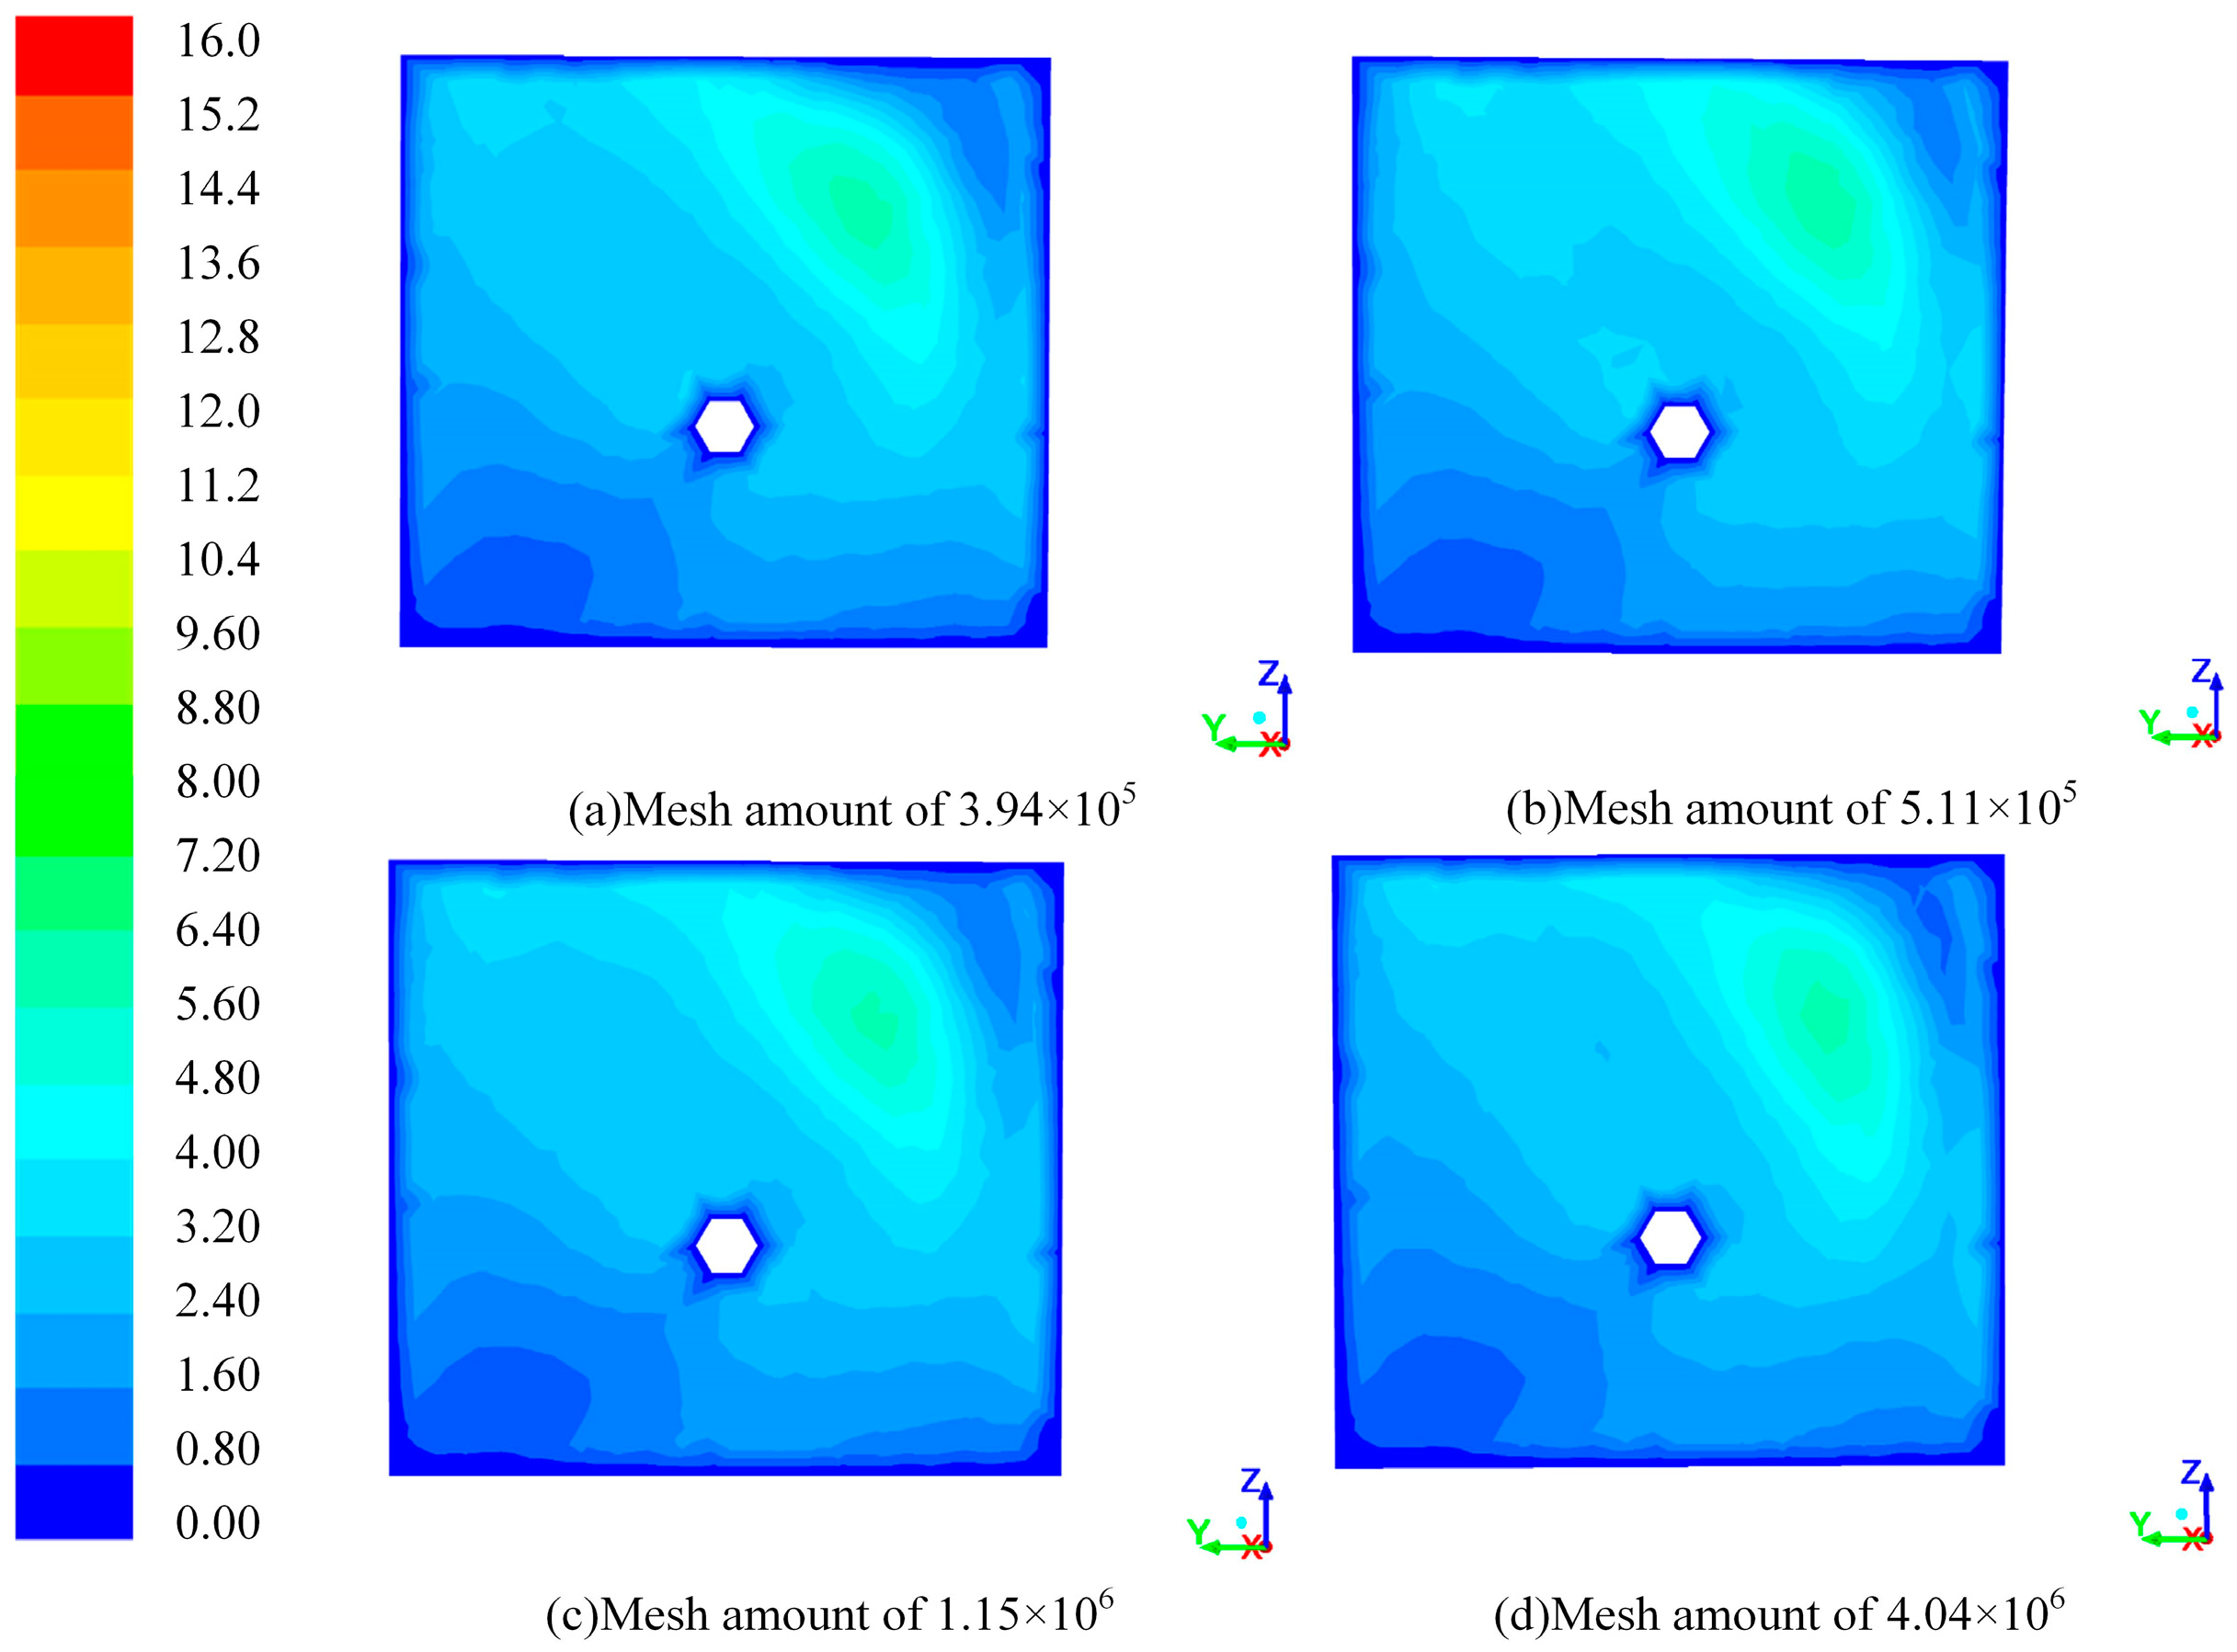
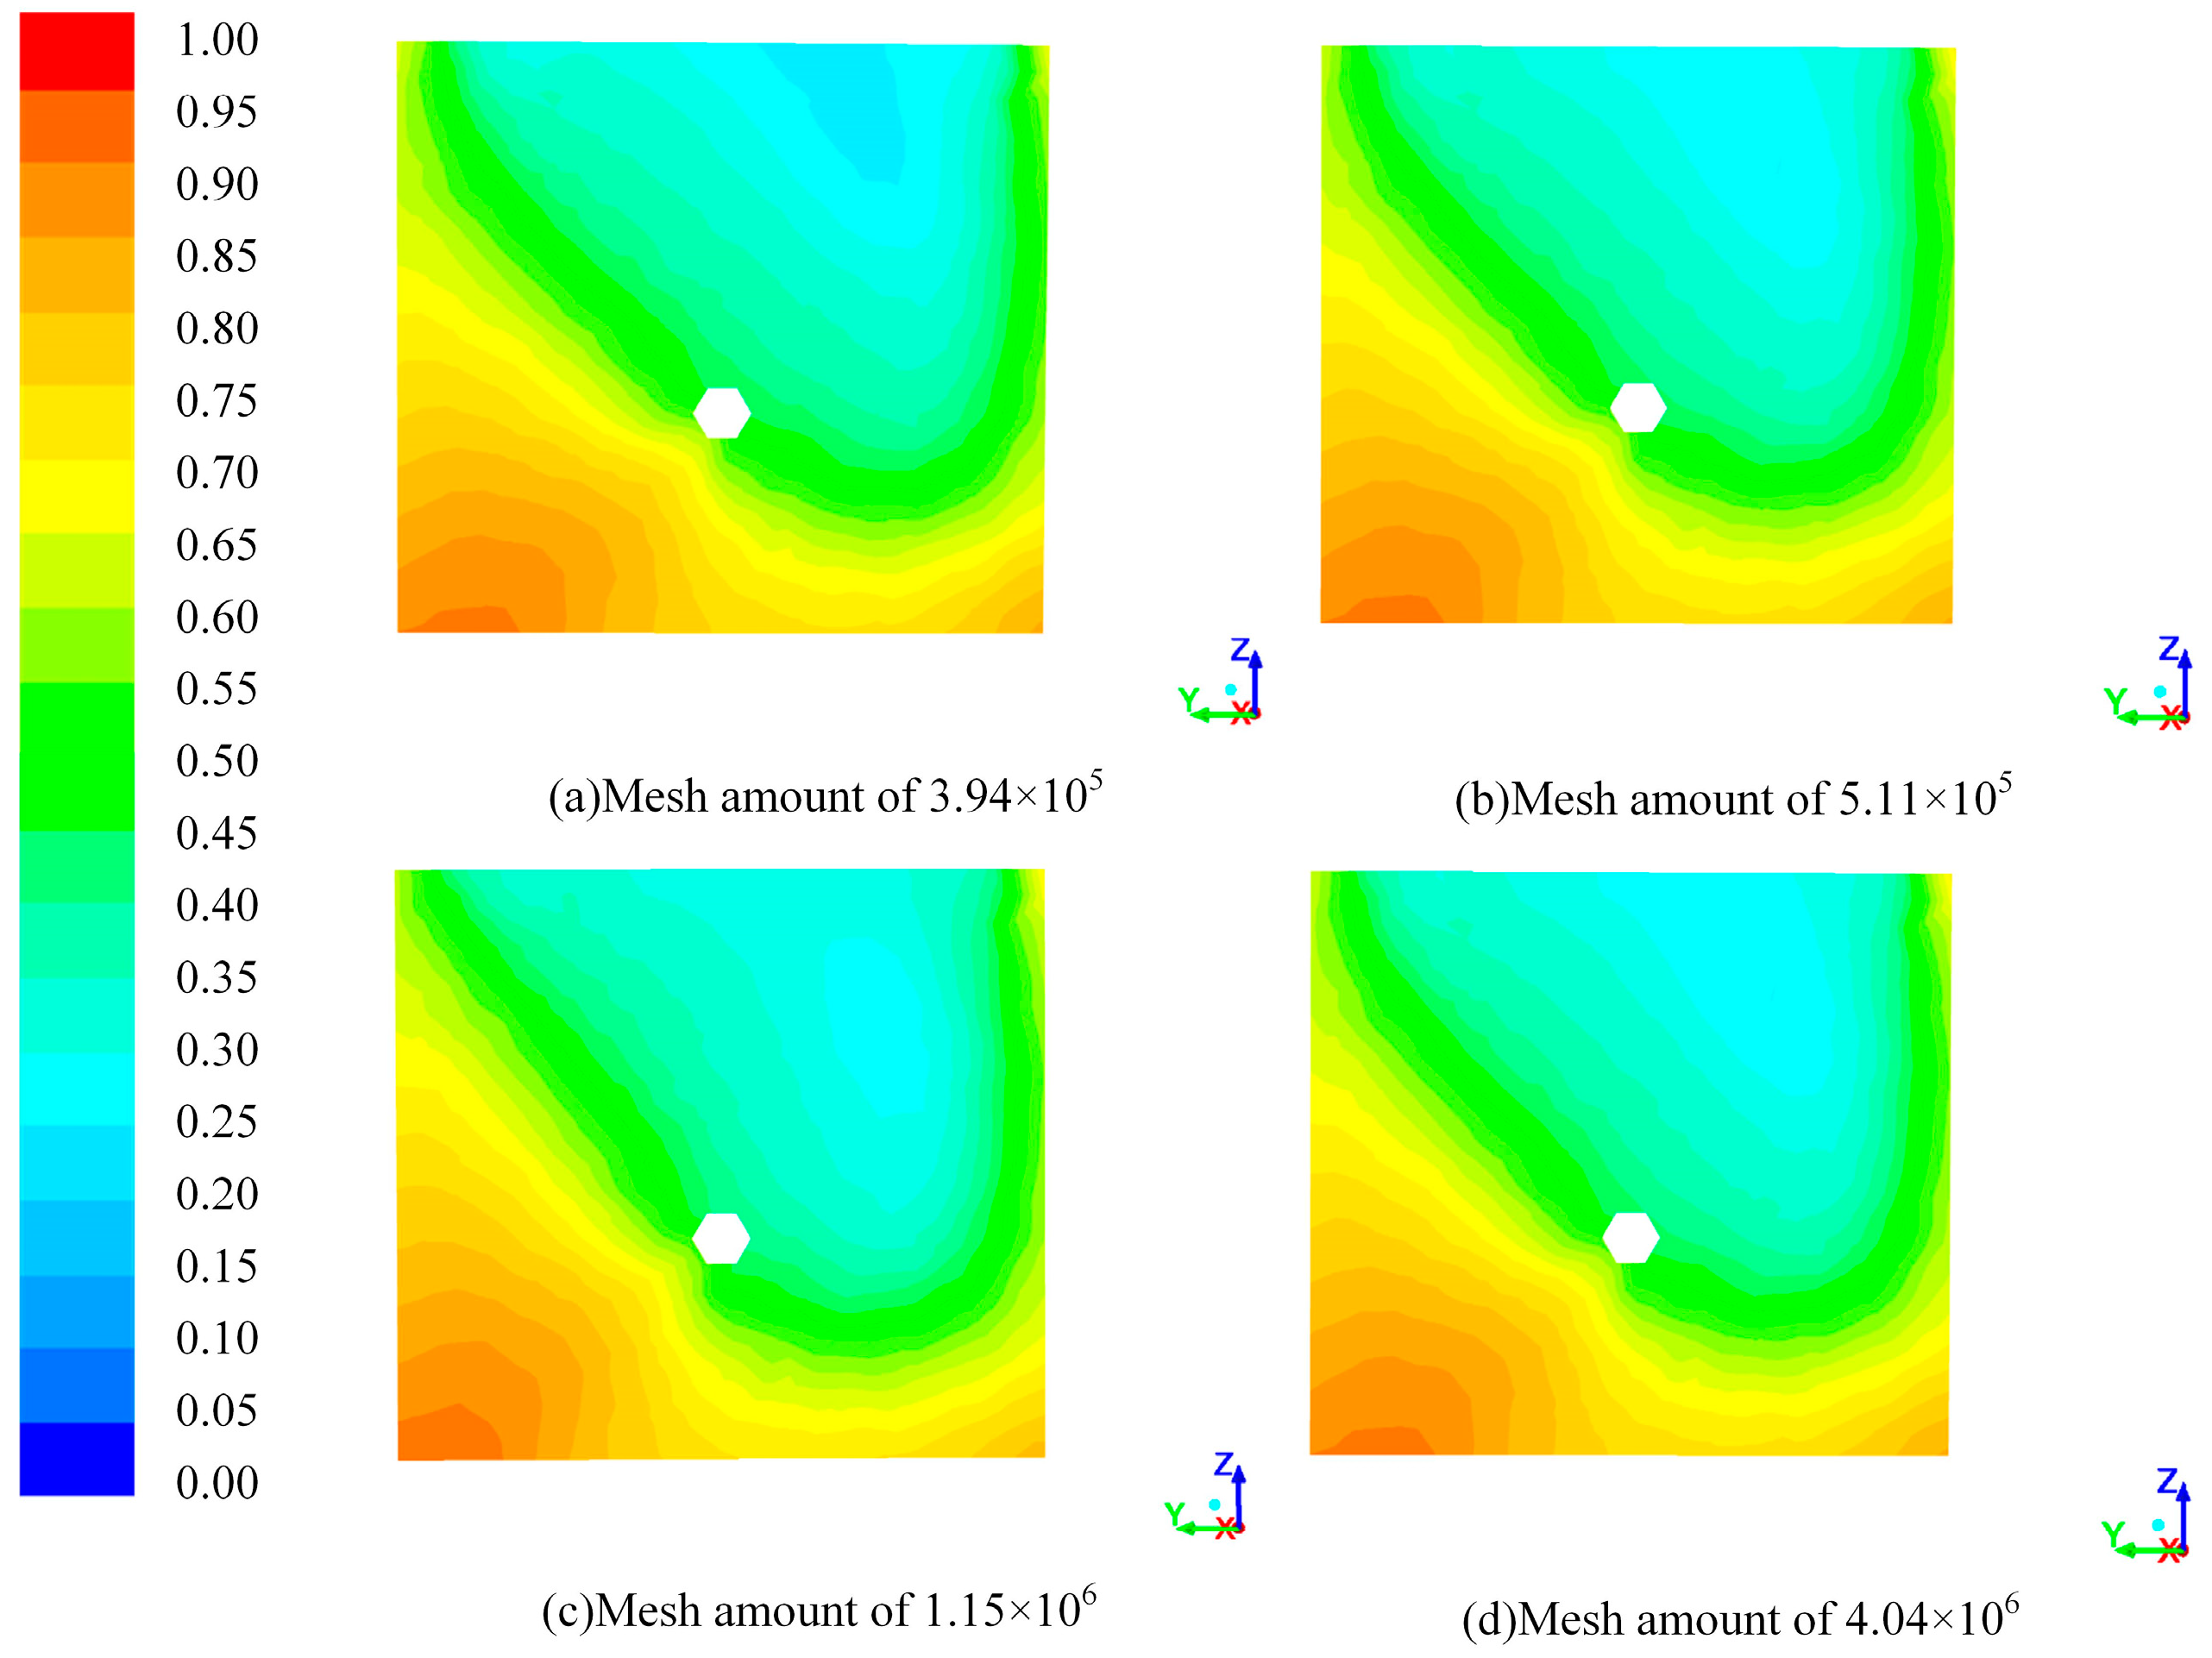
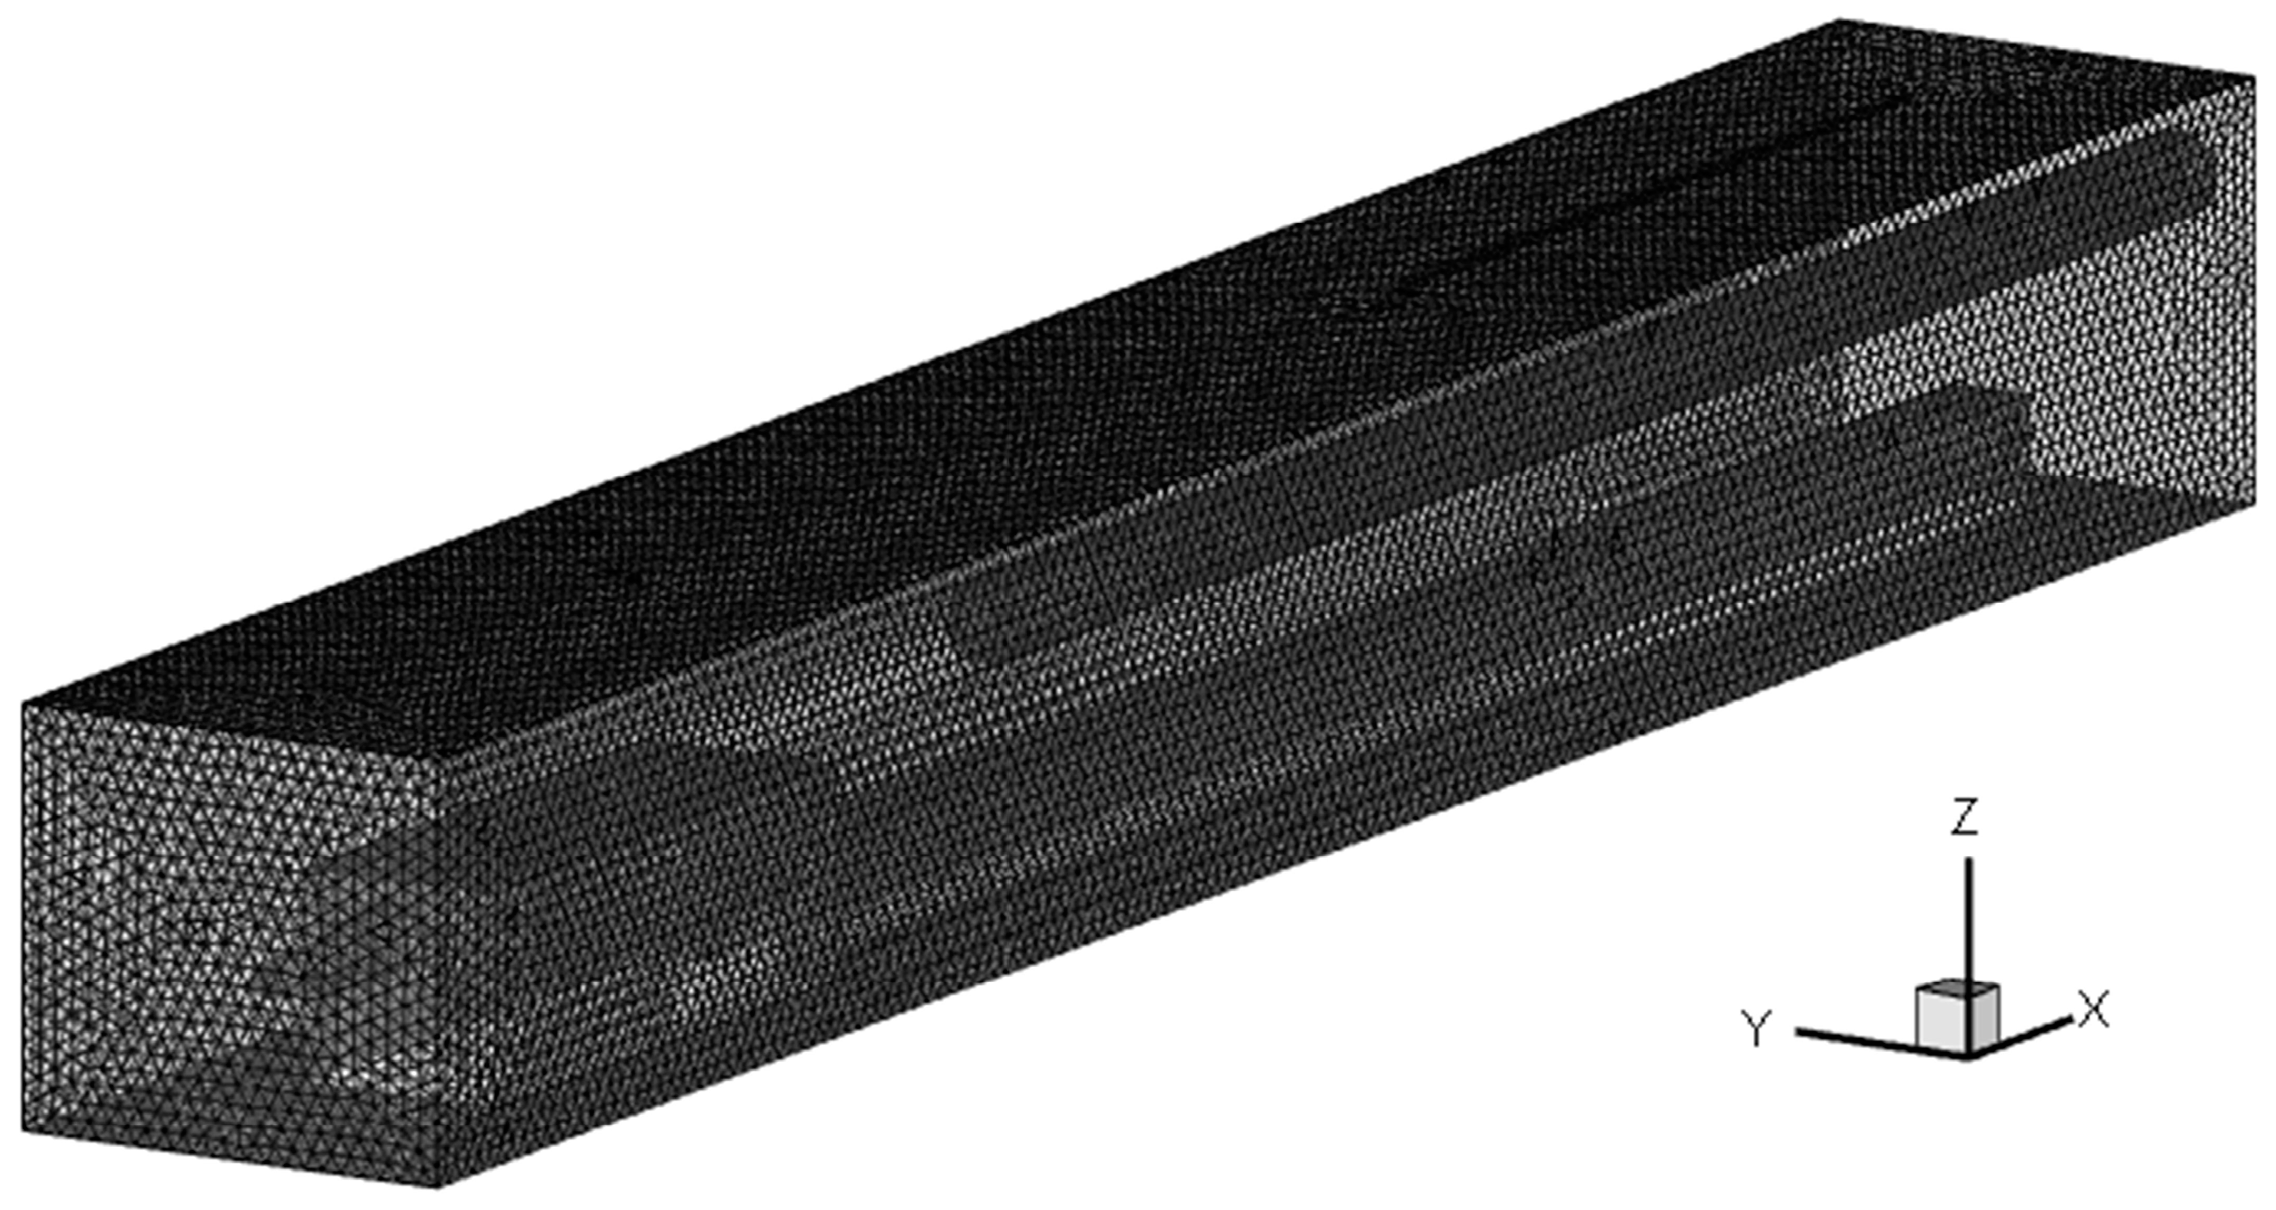
The three-dimensional computational domain of the laneway was established, meshed and labelled with boundary conditions using the pre-processor Gambit 2.3.16. In order to ensure a mesh independent solution, four different amount of mesh 3.94 × 10⁵, 5.11 × 10⁵, 1.15 × 10⁶ and 4.04 × 10⁶ were tested and compared in terms of airflow velocity and methane concentration, and detailed comparisons were presented in Figure 2 and Figure 3. The results indicated that mesh amount of 1.15 million elements was sufficient for the numerical simulation purposes: a fine structure near the ventilation duct and coarser mesh in other areas to reduce the computational cost, see Table 1 for detailed information. It shows that the mesh amount of 1.15 × 10⁶ gives about 4.2% deviation compared with 4.04 × 10⁶, while it requires significantly shorter mesh generation time and less RAM of about 4.8 GB; whereas, the mesh amount of 3.94 × 10⁵ and 5.11 × 10⁵ gives up to 14.6% and 10.4% deviation compared to the number of 4.04 × 10⁶, although they consume shorter time to generate mesh. Thus, the mesh amount of 1.15 million elements was chosen to study the following research. The meshed laneway is shown in Figure 4.
The established model was numerically investigated utilising a Computational Fluid Dynamics platform (FLUENT Inc., New York, NY, USA) [36]. All terms of the equations were solved with the semi-implicit pressure-linked equation (SIMPLE) algorithm, second-order upwind scheme. The turbulence model and boundary conditions were solved using finite volume solver. On average, each simulation required 3600 iterations with convergence tolerance of 1 × 10⁻⁶ for all variables, and other detailed parameters are presented in Table 2. It takes around 11–15 h on computers with four core processors and 8 GB RAM.
4. Results and Discussion
4.1. Intermittent Ventilation Strategies and Parametric Studies
Here, the spatiotemporal characteristics of air flow behavior and methane distribution with different configurations of ventilation strategies are investigated, and parametric studies are conducted and discussed to compare the effects of various factors.
It is showed that to supply sufficient fresh air for coal miners and to keep methane gas concentrations below the threshold value, most underground coal mines usually drive excessive amounts of airflow to various locations [23], and large main fans are utilized to provide airflow from the surface and smaller branches with auxiliary ventilation system are further distributed to ventilate airflow. The majority of coal mining operators employed this kind of ventilation system with fans working continuously during coal mining operation, which requires massive amounts of electricity to power the fan. Similarly, Sijiazhuang coal mine adopts the typical ventilation system. In order to save energy whilst ensuring the methane removal efficiency, here, we introduce the design and implementation concept of FTC [34,35]: methane control is the main purpose in normal period of ventilation, when the methane concentration is beyond the specified value close to the alarm value of the methane sensor (0.7%v/v in this study), the velocity should be increased to reduce the concentration; when the methane concentration is under the specified value (0.4%v/v in this study), the velocity should be decreased to ensure methane gas to be recovered for operation of ventilation air methane energy extraction. It is noted that in China, the maximum allowable value of methane concentration is 1%v/v in general, and according to the safety and operation regulations in Sijiazhuang coal mine, the specified alarm value is 0.8%v/v. The upper limit of methane sensor is usually set as 0.7%v/v in actual site applications and there leaves a 0.1% interval between the alarm value, and the lower limit is usually set as 0.4%v/v. The ventilation system using FTC is composed of frequency conversion controller, methane sensor, automatic air distribution device, ventilation machine, silencer etc. The special-use switch of the frequency conversion controller has a programmable logic controller called PLC system, which can analyze and determine whether the methane concentration exceeds the upper limit or below the lower limit of the set methane concentration, and then decide to automatically adjust the rotate speed of motor to change the output power of the local fan as well as the airflow velocity. Thus, we have to scientifically define the appropriate air velocity value and the intermittency period of step changes for velocity. Based on the essential requirements of ventilation velocity, we proposed six possible intermittent ventilation patterns and employ parametric studies to define the key parameters.
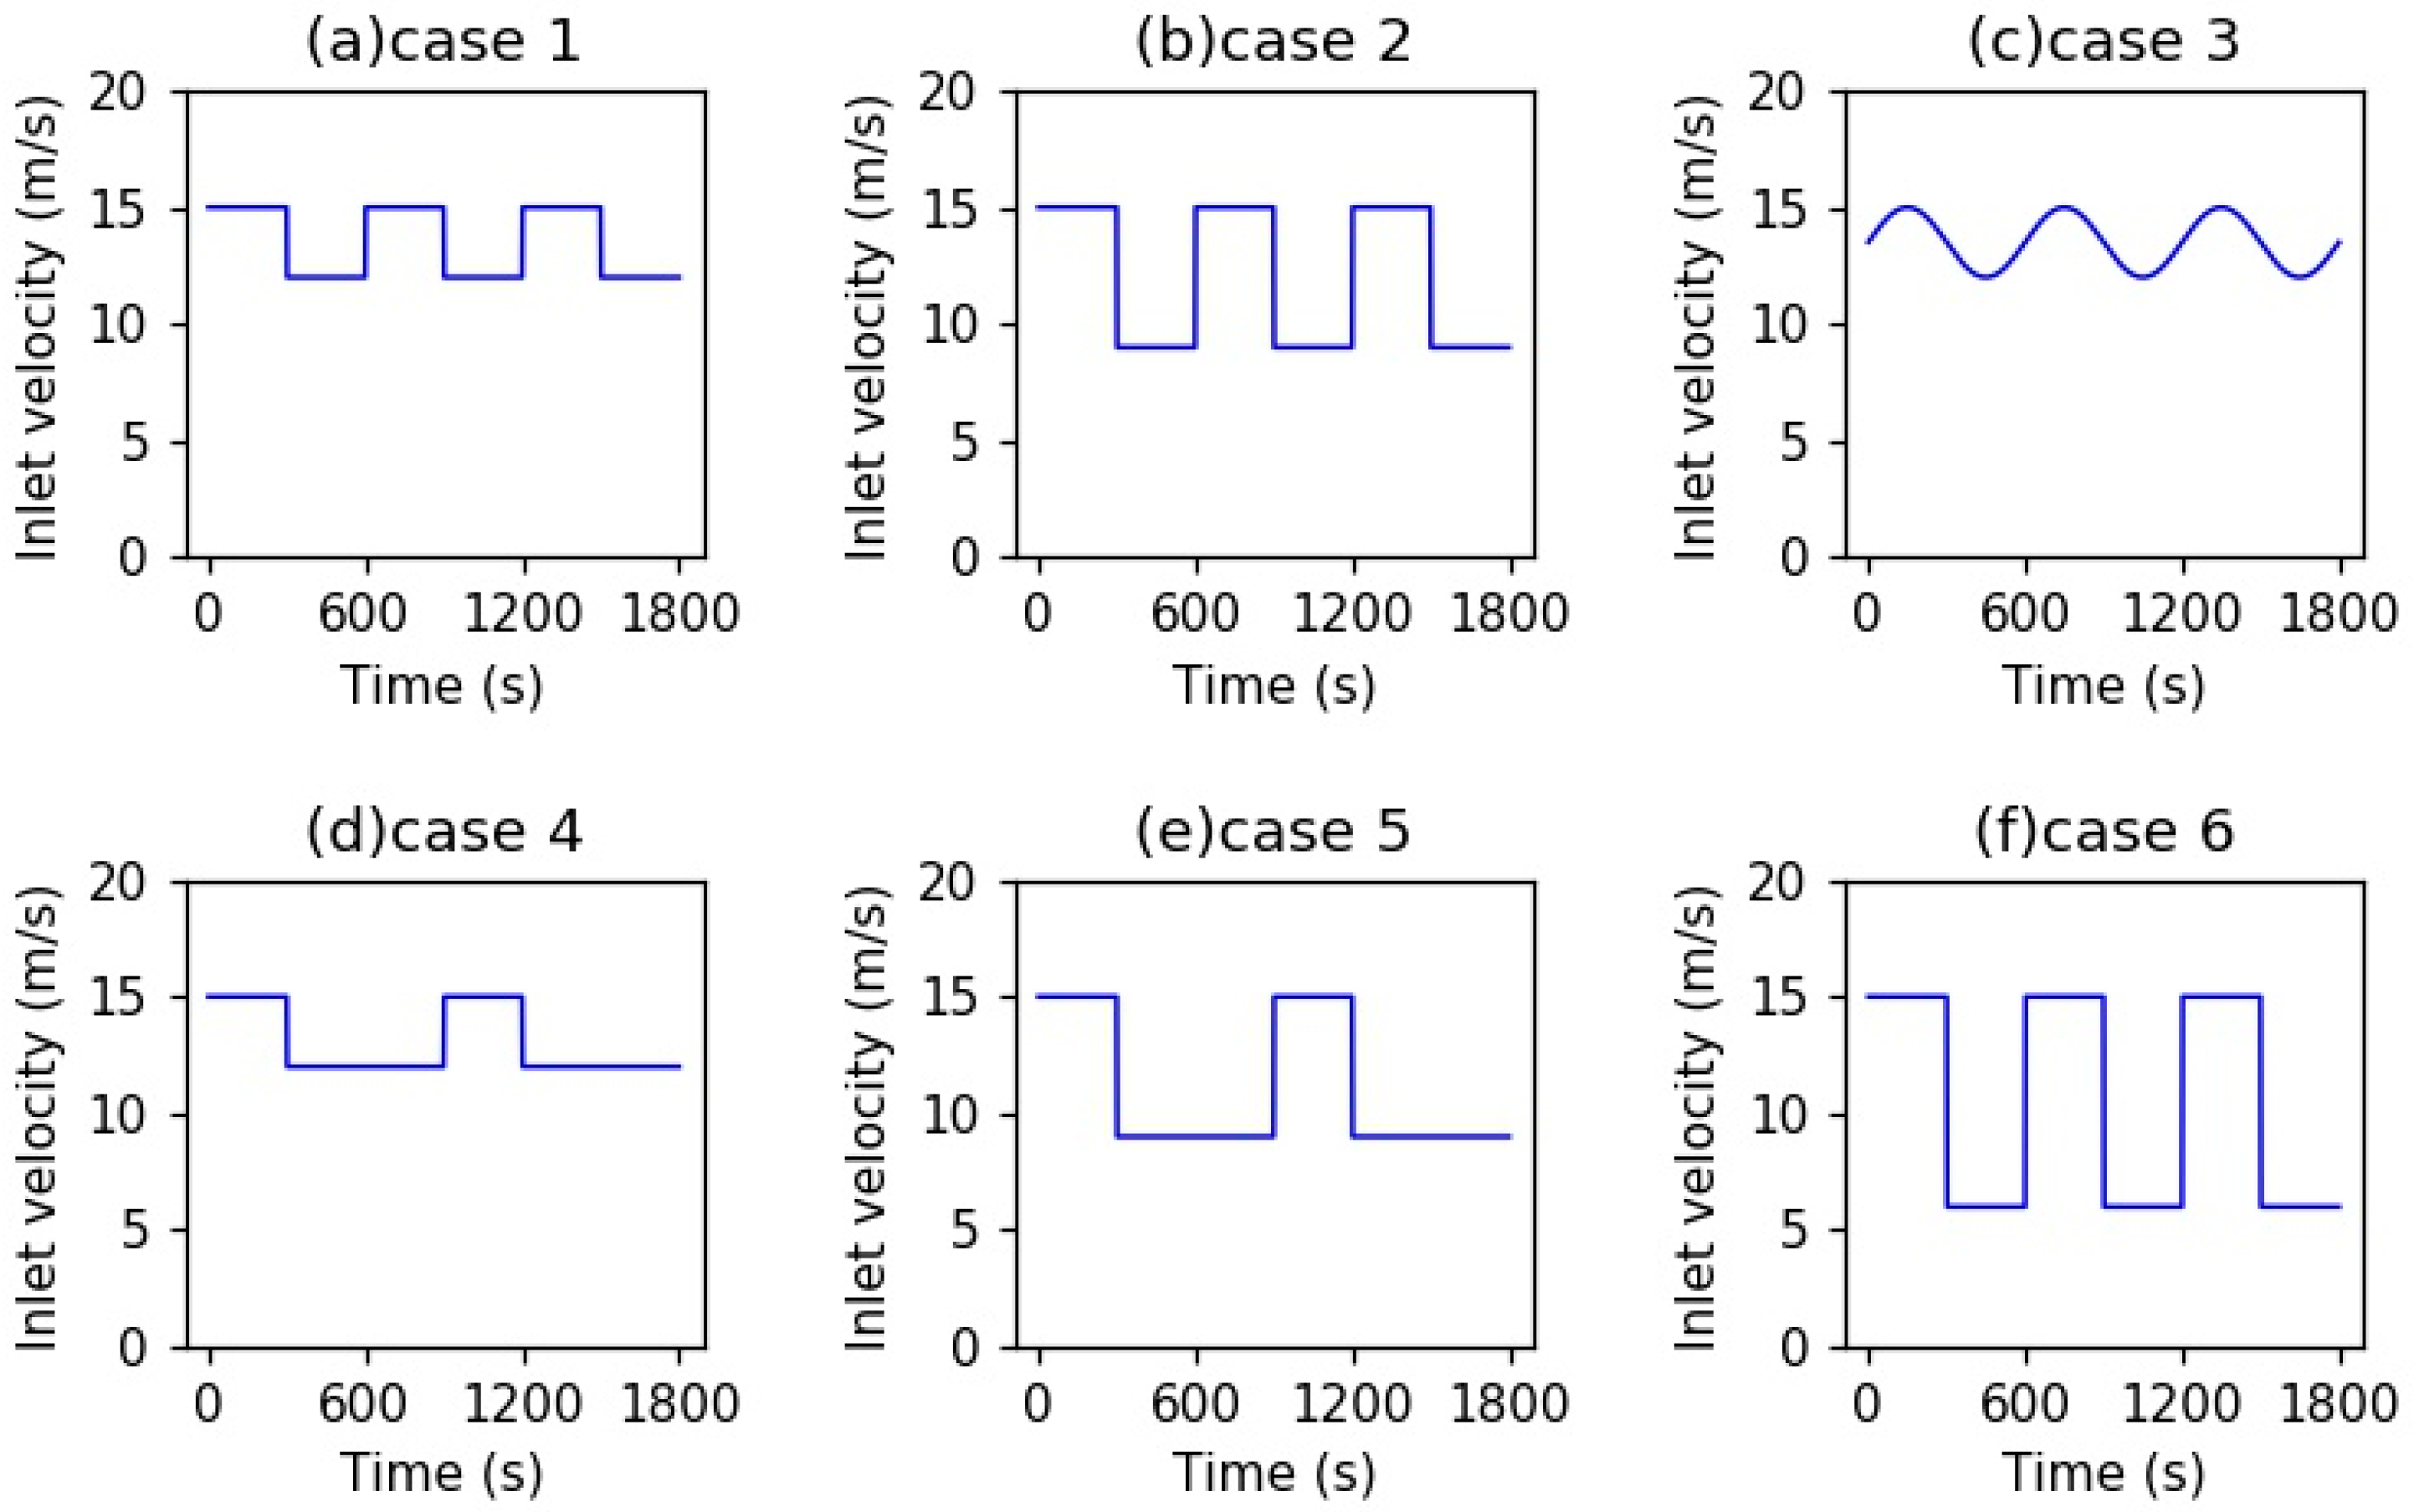
Here, the performance of various ventilation patterns is investigated and compared with the typical steady flow pattern (15 m/s, defined as case 0) in terms of the potential energy saving and methane removal efficiency, and we mainly focus on the dynamic changes of methane concentration about the time it requires to be stable when the velocity is changed over time. Specifically, the inlet velocity for ventilation duct are defined with different dynamic patterns, which are presented in Figure 5: (case 1) 300 s high velocity (15 m/s) and 300 s low velocity (12 m/s); (case 2) 300 s high velocity (15 m/s) and 300 s low velocity (9 m/s); (case 3) sinusoidal flow, the velocity changing curve is defined as the sine law with period of 600 s, the peak and valley values are 15 m/s and 12 m/s respectively; (case 4) 300 s high velocity (15 m/s) and 600 s low velocity (12 m/s); (case 5) 300 s high velocity (15 m/s) and 600 s low velocity (9 m/s), and (case 6) 300 s high velocity (15 m/s) and 300 s low velocity (6 m/s). It should be noted that the intermittent flow control can be implemented by using FCT, which can be done by installing a frequency converter for the local fan in the circuit without affecting main ventilation fans and other apparatus in the ventilation system.
Therefore, the typical steady flow with six dynamic ventilation patterns were simulated utilizing the computational fluid dynamic platforms. Firstly, a line in section A with a height of 3 m was selected to observe the methane concentration for various ventilation patterns along the excavation laneway at different time points, and the variation trend of methane concentration among the seven ventilation patterns was presented in Figure 6 with time 300 s, 600 s, 900 s, 1200 s. Several features here are apparent: methane gas is generated at the driving face and then pushed into the whole laneway, which is reflected by high methane concentration on the first few meters and the lower trend with the increasing laneway length. On average, methane concentration keeps under the maximum allowable value of 1%v/v as well as the alarm value of 0.8%v/v in the areas where miners work, which is typically farther than 5 m away from the driving face. Specifically, it can be found that at 300 s, the methane concentration under all the cases maintained at a low level. At 600 s, the methane concentrations for case 1–6 all increased due to the changing low velocity in this period with the computed average value of 0.51%v/v, 0.65%v/v, 0.45%v/v, 0.51%v/v, 0.69%v/v, 0.90%v/v, increased up to 32.26%, 67.07%, 17.01%, 31.52%, 78.45%, 130.76%, respectively, compared with base case 0 of 0.39%v/v. The same figure at 900 s for six dynamic cases are 0.45%v/v, 0.60%v/v, 0.48%v/v, 0.55%v/v, 0.68%v/v, 0.60%v/v, which increased up to 8.31%, 44.00%, 16.81%, 32.80%, 64.29% and 45.52%, respectively, compared with typical steady flow with an average methane concentration of 0.41%. Besides, the methane concentrations at 1200s for case 0–6 are 0.42%v/v, 0.57%v/v, 0.61%v/v, 0.56%v/v, 0.51%v/v, 0.66%v/v, 0.89%v/v, and the dynamic patterns increased 36.09%, 44.00%, 34.62%, 20.32% 57.66%, and 110.61%, respectively. It can be concluded that case 5 performs worst due to the long period of low velocity and followed by case 2 with the same low velocity of different period.
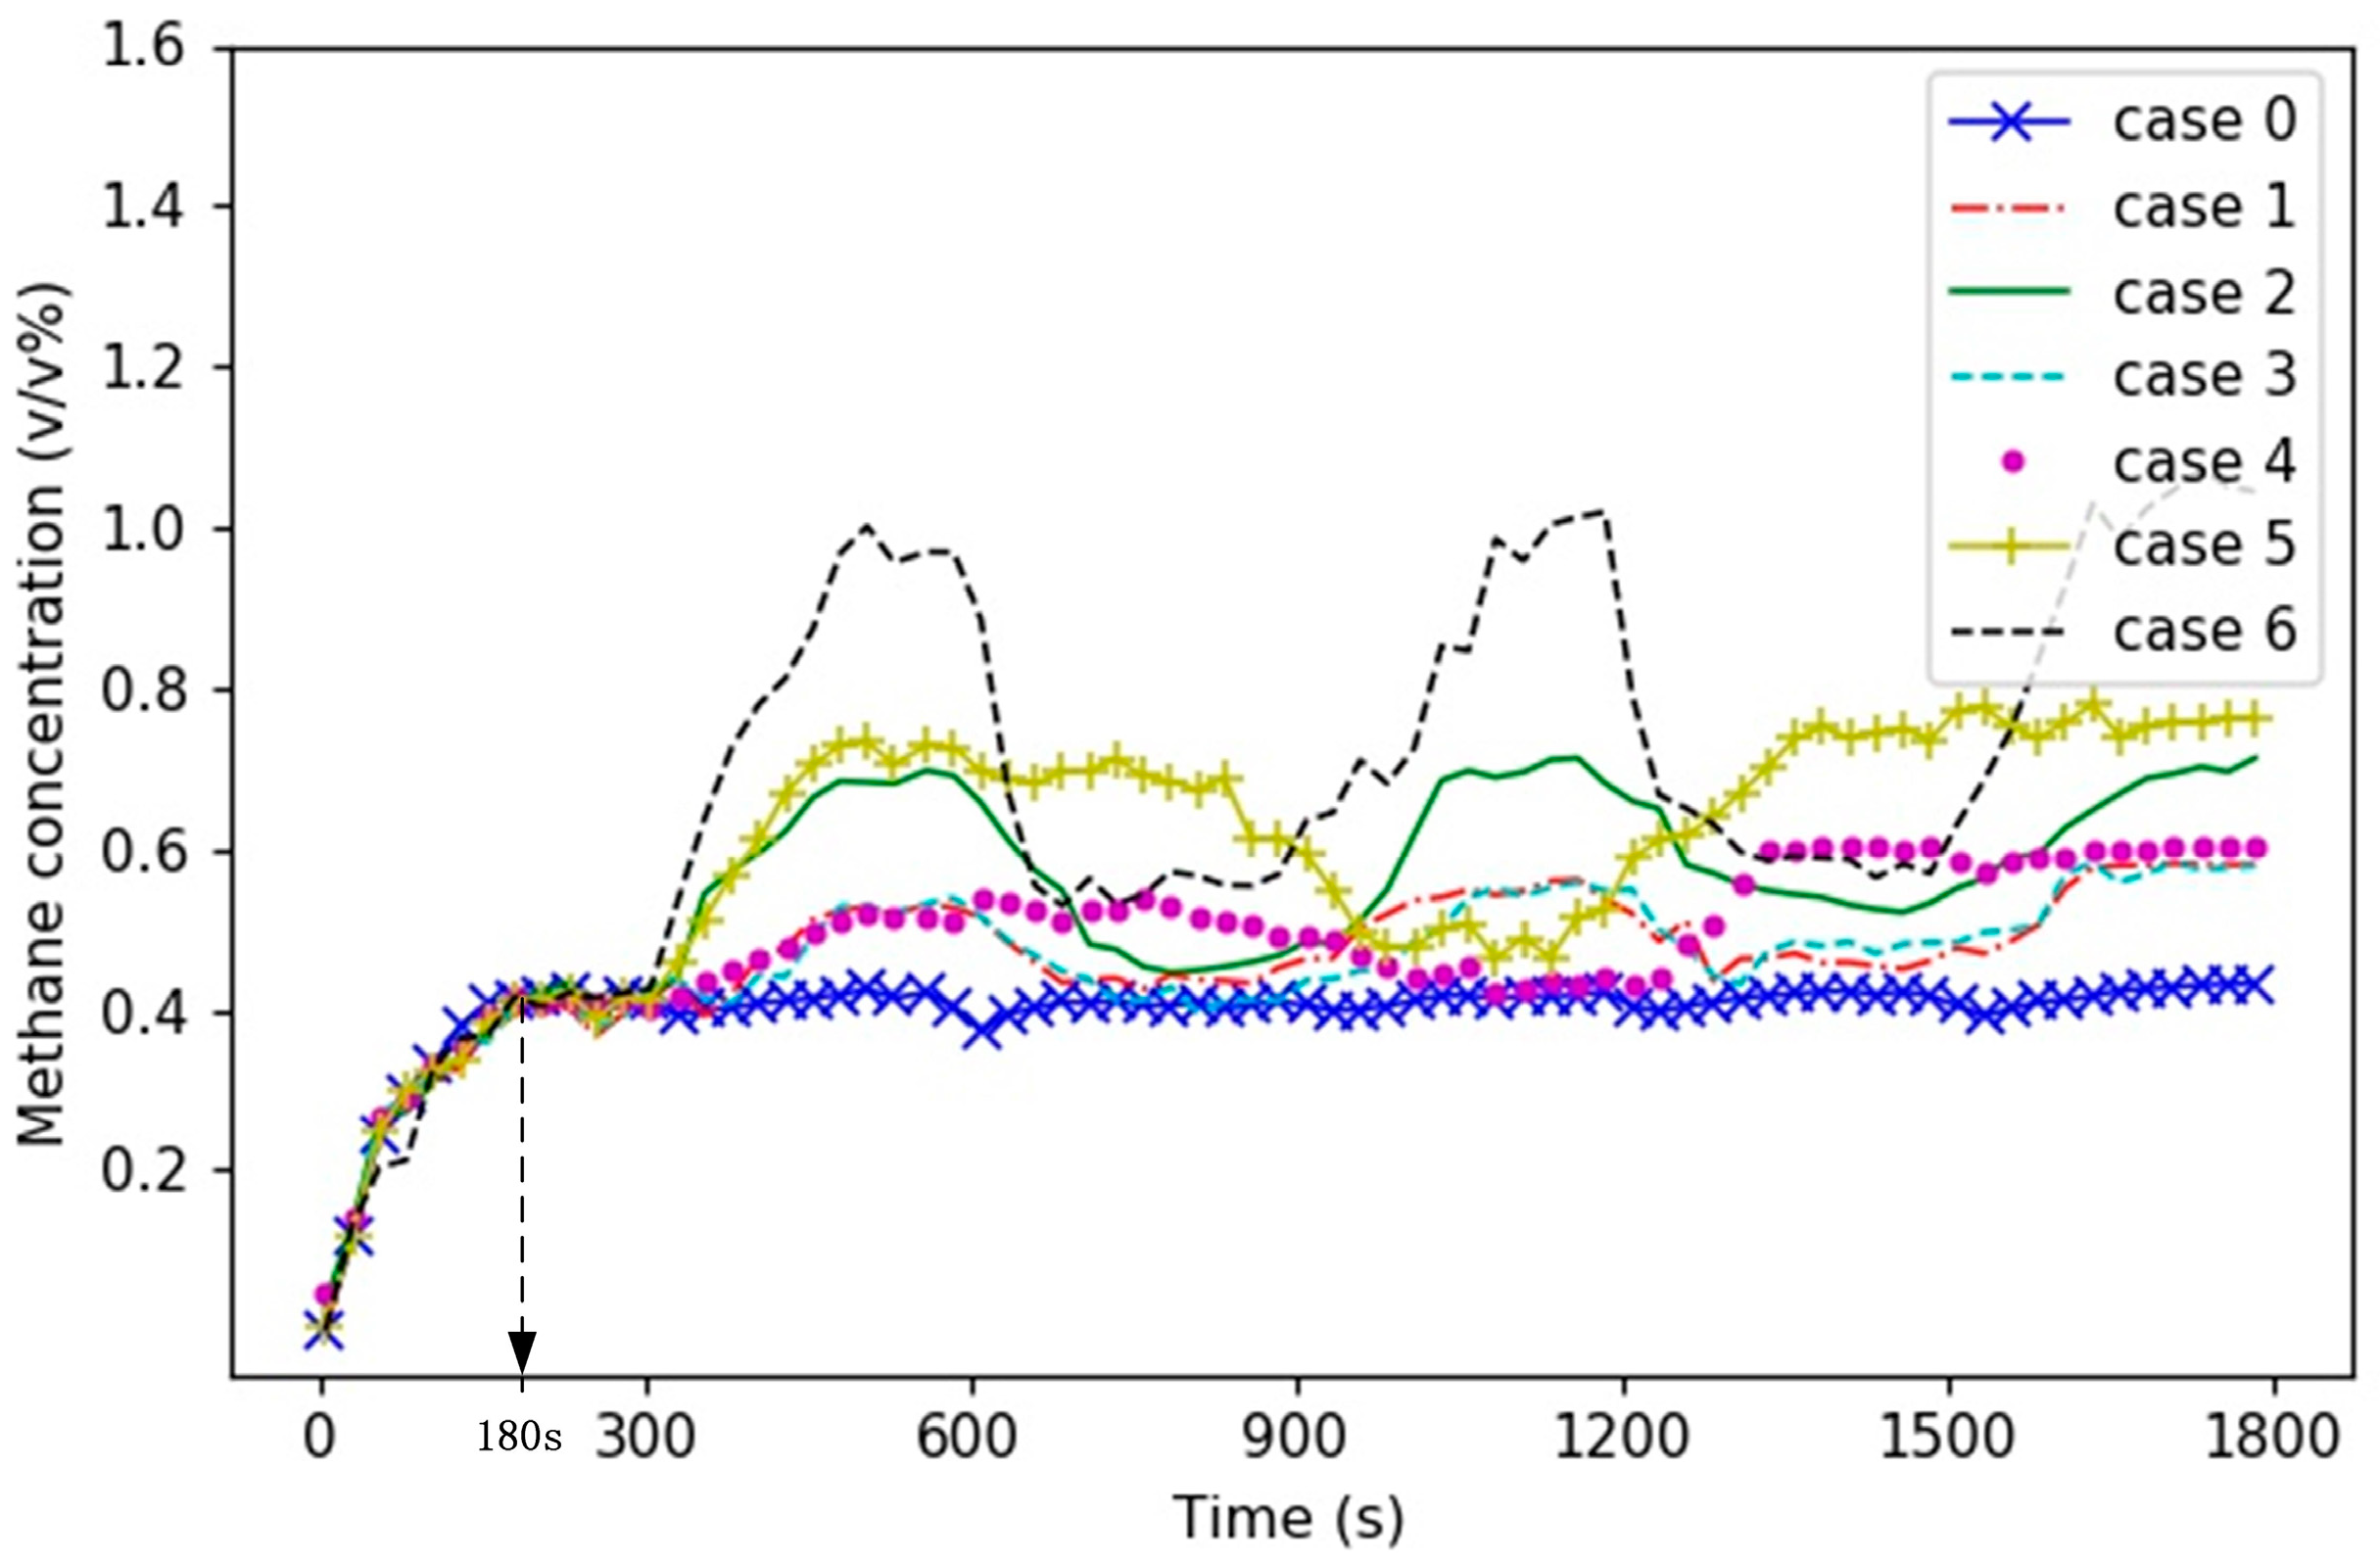
Furthermore, we look into the dynamic regularity of methane concentration at the selected point, which is located on section A with 3 m high and 10 m away from the driving face, as presented in Figure 7. It demonstrated that intermittency based on frequency conversion of inlet velocity leads to dynamic behaviour of methane concentration as relatively high methane concentration develops when low velocity is applied, and all the cases can control the methane concentration below the alarm value of 0.8%v/v except for case 6 due to the low velocity. Specifically, by comparing the different velocities of 6 m/s, 9 m/s, 12 m/s, and 15 m/s, it shows that the steady flow of base case 0 with 15 m/s maintains methane concentration around 0.4–0.45%v/v; case 1, case 3 and case 4 with the low velocity of 12 m/s increase the methane concentration up to about 0.5%v/v; case 2 and case 5 with intermittency low velocity of 9 m/s leads the methane concentration rise to 0.65%v/v to 0.7%v/v; while case 6 with lower velocity of 6 m/s increases the methane concentration to the critical explosive level of 1%v/v, which cannot satisfy the requirement of ventilation. Thus, we conclude that 9 m/s is the minimum inlet velocity in this case study to ensure the methane concentration below the alarm value. Besides, one of our research goals is to scientifically define the frequency conversion period of inlet velocity in order to save energy whilst keeping the methane concentration below the maximum allowable value. By comparing of case 2 and case 5, the results suggest that the intermittency duration plays an important role as the short period of the low velocity leads to a short-term and lesser accumulation of methane concentration, while the long period of the low velocity induces a long-term and more accumulation of methane concentration, which will also lead to slightly increase of methane concentration in the next ventilation period. In addition, an important finding is that the methane concentration takes about 3 min to be steady with the step changes of velocity.
Although the intermittent ventilation patterns based on frequency conversion of velocity cannot apparently improve methane removal efficiency compared with normal steady flow, it offers potential in energy saving and still guarantees that the average methane concentration under the limited level with velocity over 9 m/s, which confirms that continuously ventilated high-speed velocity typically used in Sijiazhuang coal mine is really not that necessary, and proper velocity decrease based on the dynamic characteristics of methane concentration can reduce energy consumption. The significant amount of energy saving and other parameters on average are presented in Table 3, which are calculated based on Bernoulli equation within 1800 s. It indicates that case 5 performs best in energy saving while it is dangerous since the methane concentration close to alarm value with long period of low ventilation velocity; followed by case 6, but the methane concentration is beyond the alarm value in this case as we analyzed previously; cases 1, 2, 3, 4 can effectively save energy usage whilst maintain the methane concentration under the limited value, among which case 2 offers balanced performance with energy saving up to 39.20% and controls methane concentration at safe level. The result shows that the potential energy saving based on the intermittent ventilation patterns is essentially significant for economic benefits.
4.2. The Spatiotemporal Characteristics of the Airflow and Methane Distribution
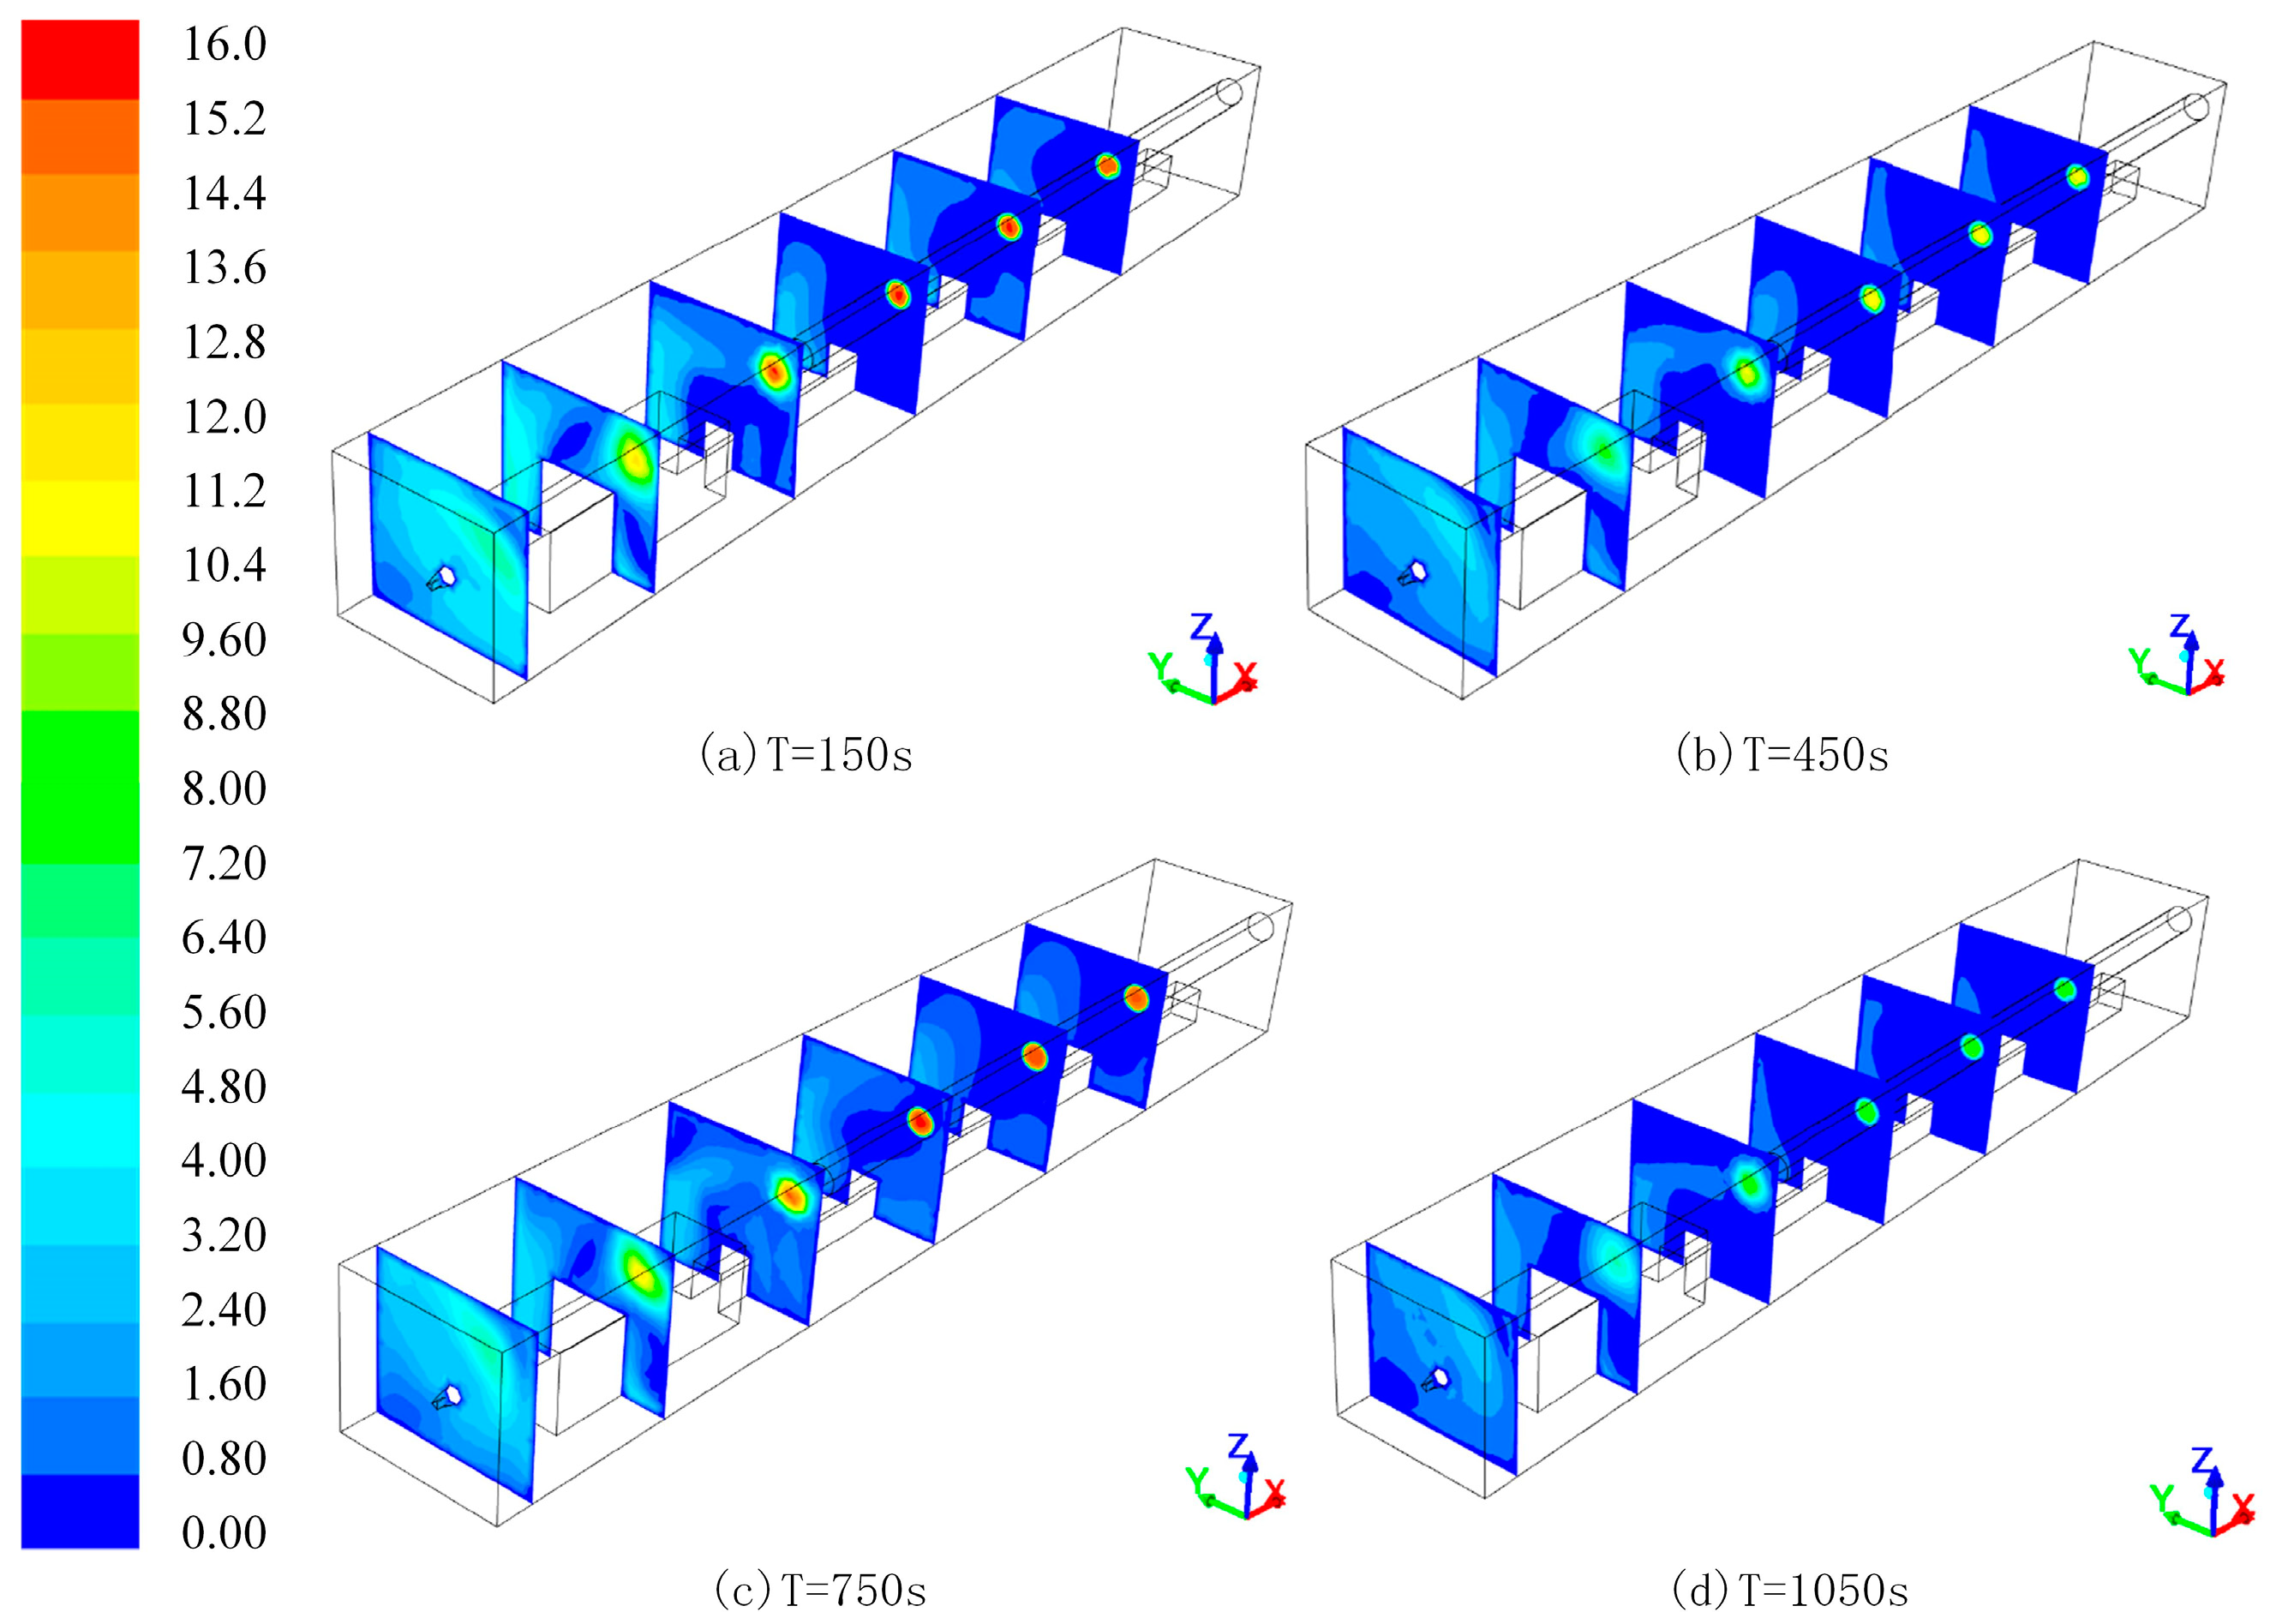
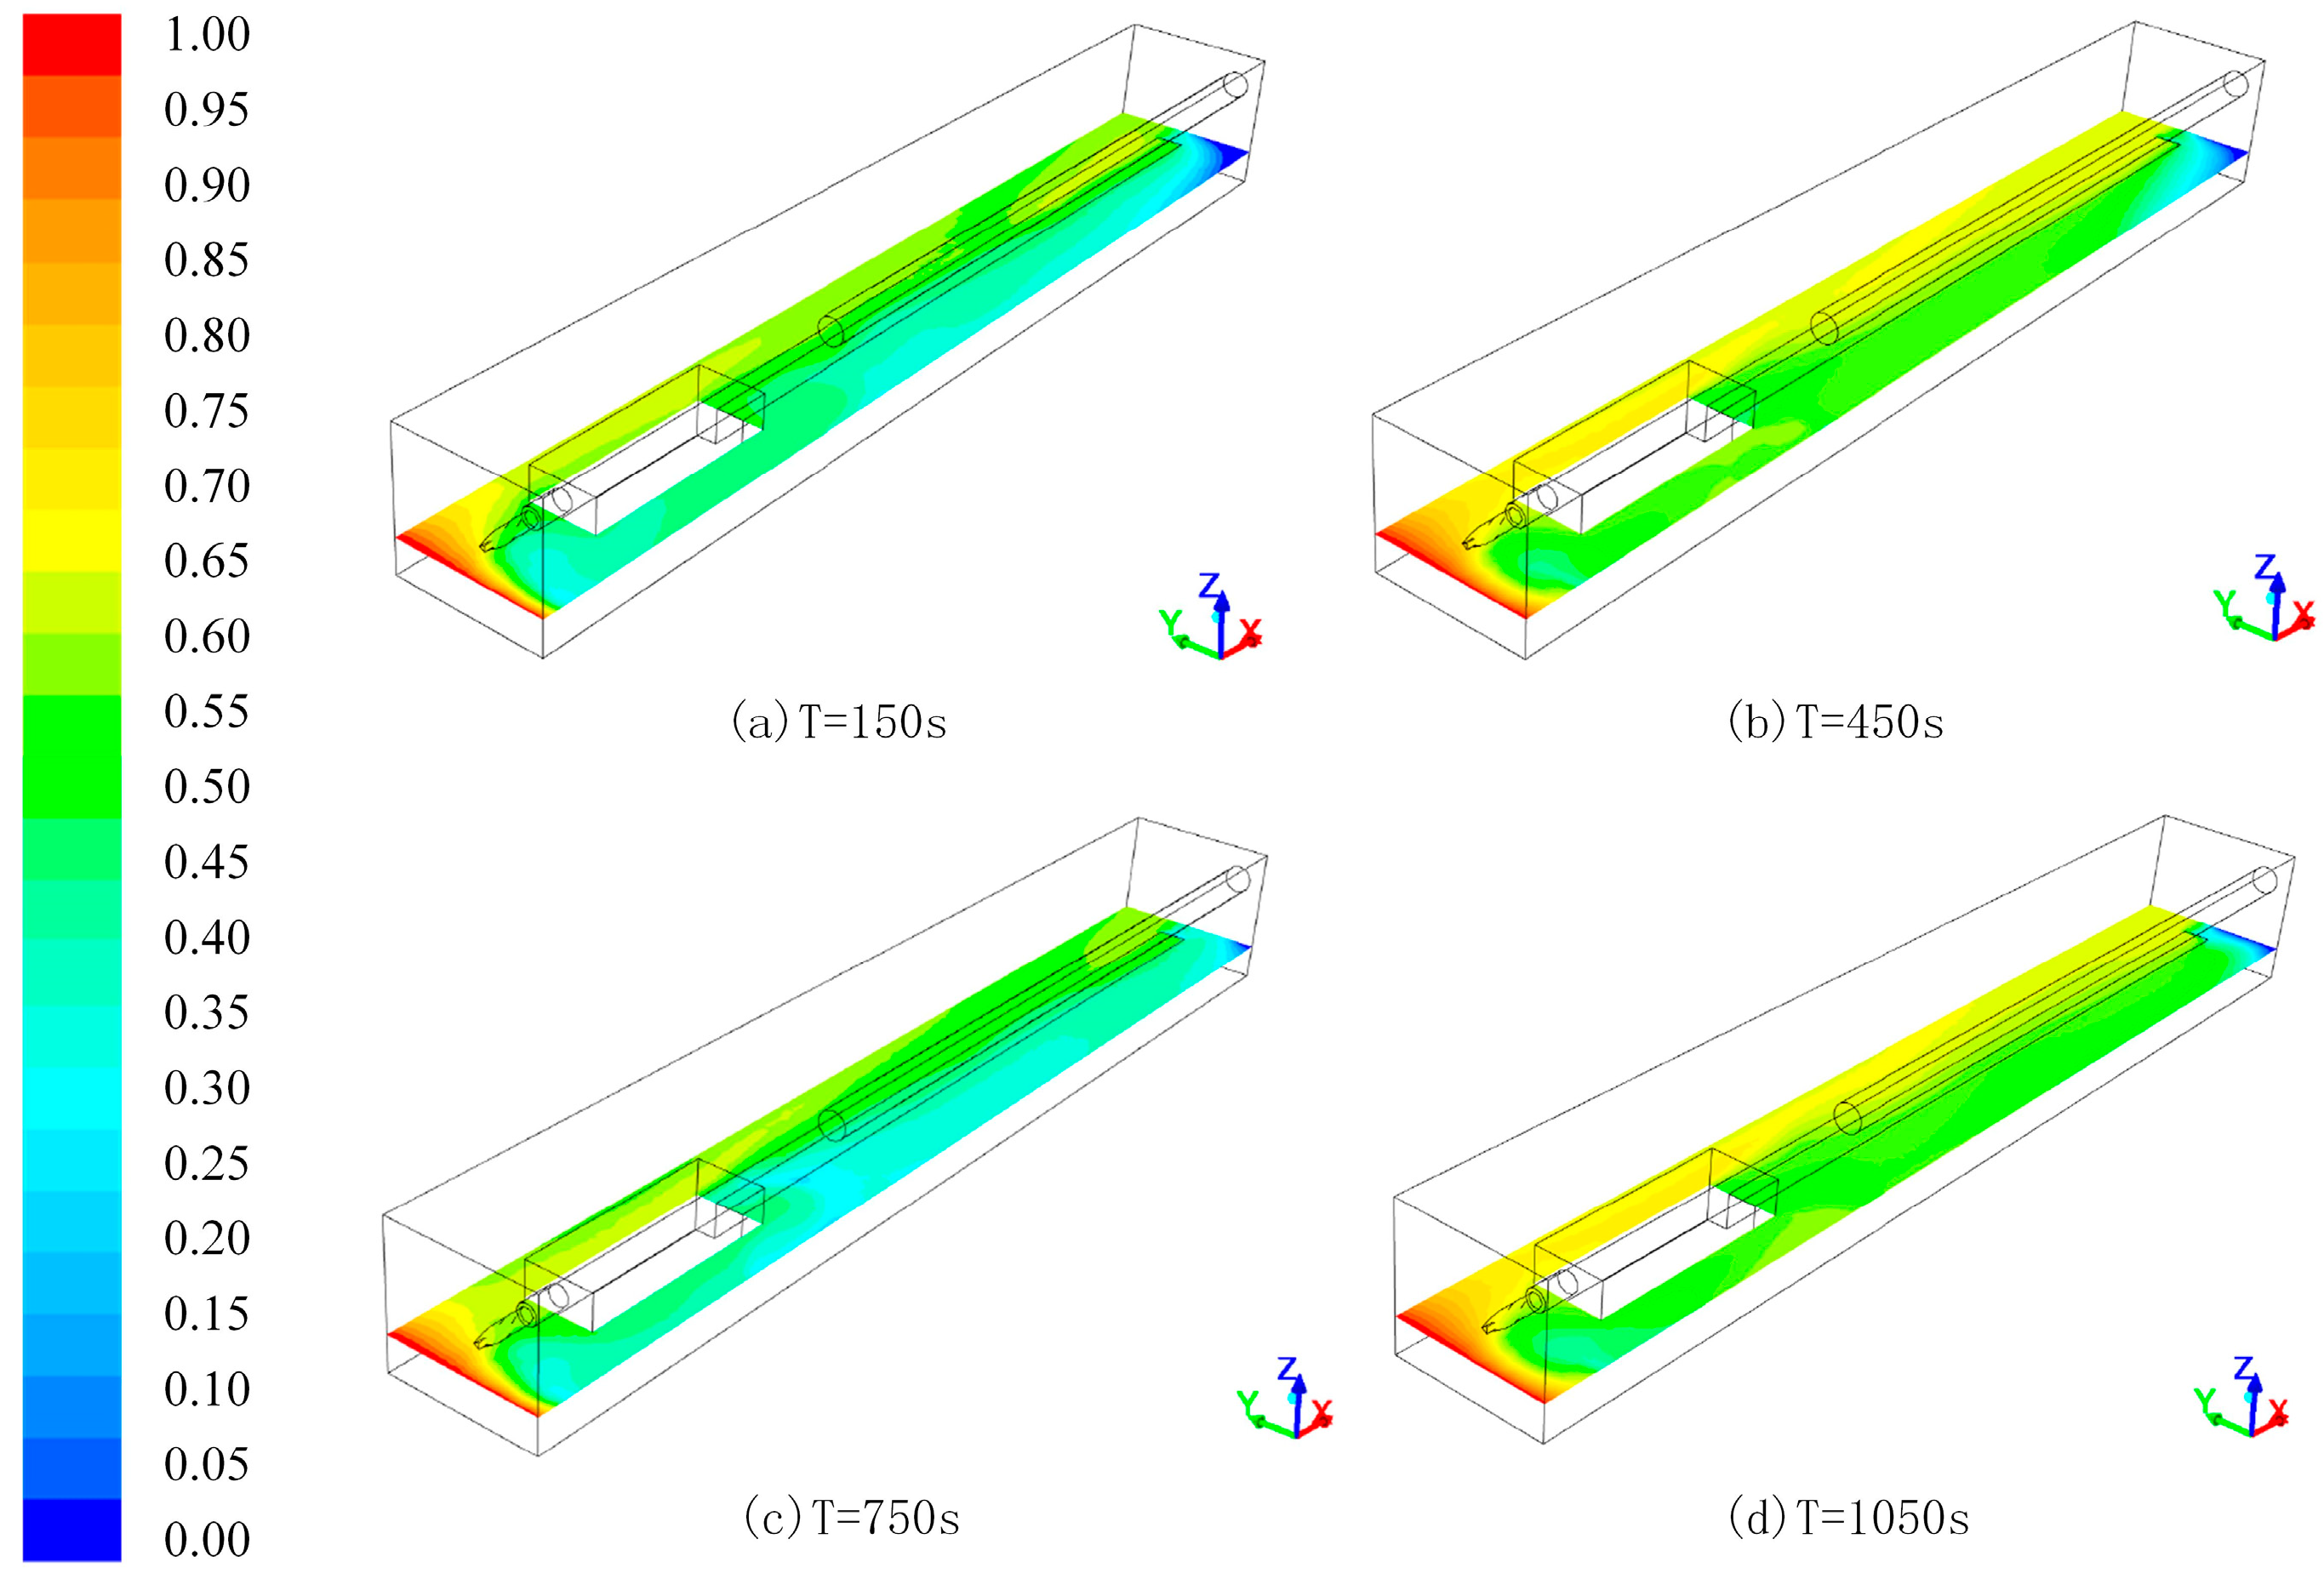
The ventilation airflow is the main factor which directly influence the methane dispersion and distribution, here case 2 is chosen to investigate the spatiotemporal characteristics of airflow behaviour and the methane distribution. Figure 8 presents the predicted velocity profiles at different cross-sections for four time points, and Figure 9 shows the methane distribution at 1 m high from the laneway floor with the same time points. It is clear that the pressing air discharges from the ventilation duct, flows through the driving face to the outtake side of laneway with gradually decreased velocity; with the impact of the pressing air, large amount of methane gas disperses and is driven to the outtake side of laneway with decreasing concentration. The result also suggests that the frequency conversion of inlet velocity changes the overall behaviour of velocity and methane concentration inside the whole laneway: with high inlet velocity of 15 m/s (Figure 8a,c), methane gas is dispersed and forced to leave the laneway with a relatively low concentration (Figure 9a,c); conversely, with the action of a low inlet velocity of 9 m/s, the airflow velocity throughout the whole laneway reduces significantly (Figure 8b,d), with that the methane concentration rises from about 0.45%v/v to around 0.7%v/v (Figure 9b,d) and then reduces back to low concentration as the high velocity is periodically applied.
4.3. The Optimal Intermittent Ventilation Pattern and Data Validation
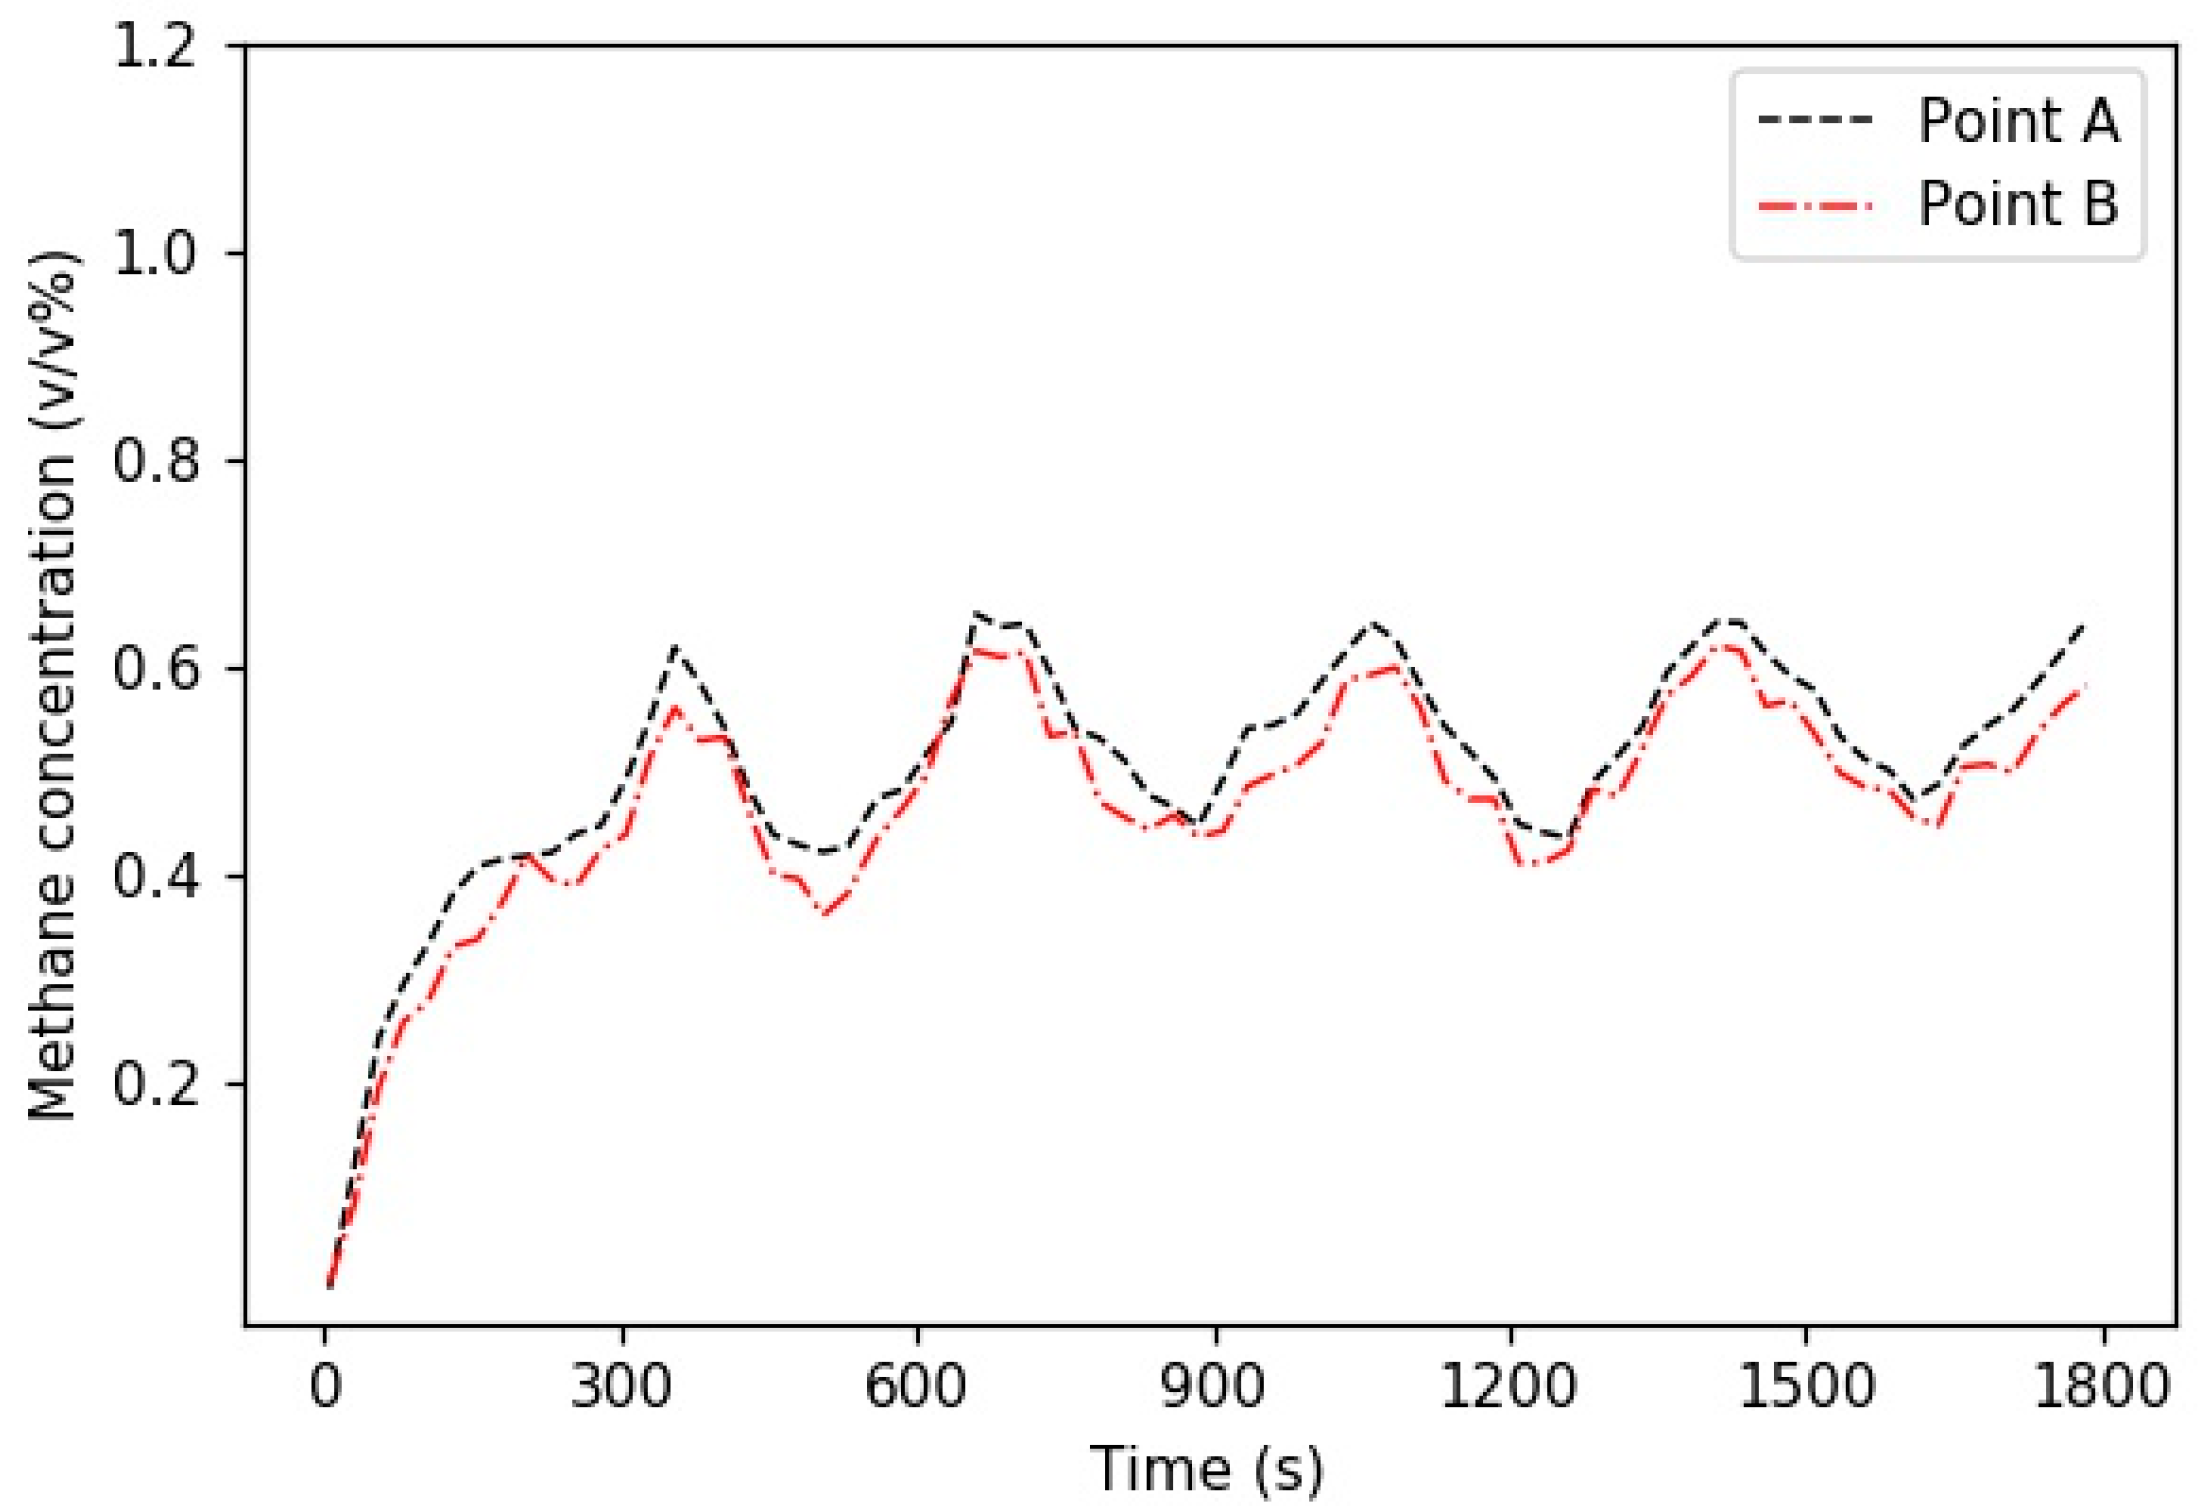
Based on the previous parametric studies and the spatiotemporal characteristics of airflow behavior and methane distribution, we have concluded that the intermittent ventilation patterns are potential in energy saving. And an important finding is that the inlet velocity value and its period of step changes plays an important role in the changing regularity of methane concentration, where the inlet velocity of 9 m/s is determined as the minimum value and it takes about 3 min for the methane concentration to be steady at one period of velocity step changes. Therefore, we investigated case 7 in this section, which is defined as 180 s high velocity (15 m/s) and 180 s low velocity (9 m/s), as shown in Figure 10. Two points A and B in section A with 3 m high and 10 m and 20 m respectively away from the driving face are monitored, as can be seen in Figure 11. The methane concentration is changed with this idea: since the methane concentration maintains at a stable level after about 180 s, which illustrates that the methane removal efficiency with continuously high speed velocity is not significant anymore, so the inlet velocity is decreased slightly to save energy consumption; as the methane concentration increases to around 0.7%v/v in a period of low airflow velocity, the inlet velocity is increased to control methane concentration to a low level. It is noteworthy that numerical result can provide operation supports for FTC with the consistent fundamental design conception. Besides, it is necessary to compare the methane concentration of all these cases. As point A is also chosen as the observation point in Figure 7, the average methane concentration is calculated at this point for case 0–7, which is 0.45%v/v, 0.49%v/v, 0.59%v/v, 0.50%v/v, 0.53%v/v, 0.63%v/v, 0.74%v/v, 0.52%v/v respectively. Furthermore, as can be seen, case 7 saves energy consumption saving of up to 39.20% as presented in Table 4, from which we concluded that case 7 performs best as it saves energy usage whilst maintaining methane concentration at the relatively low level.
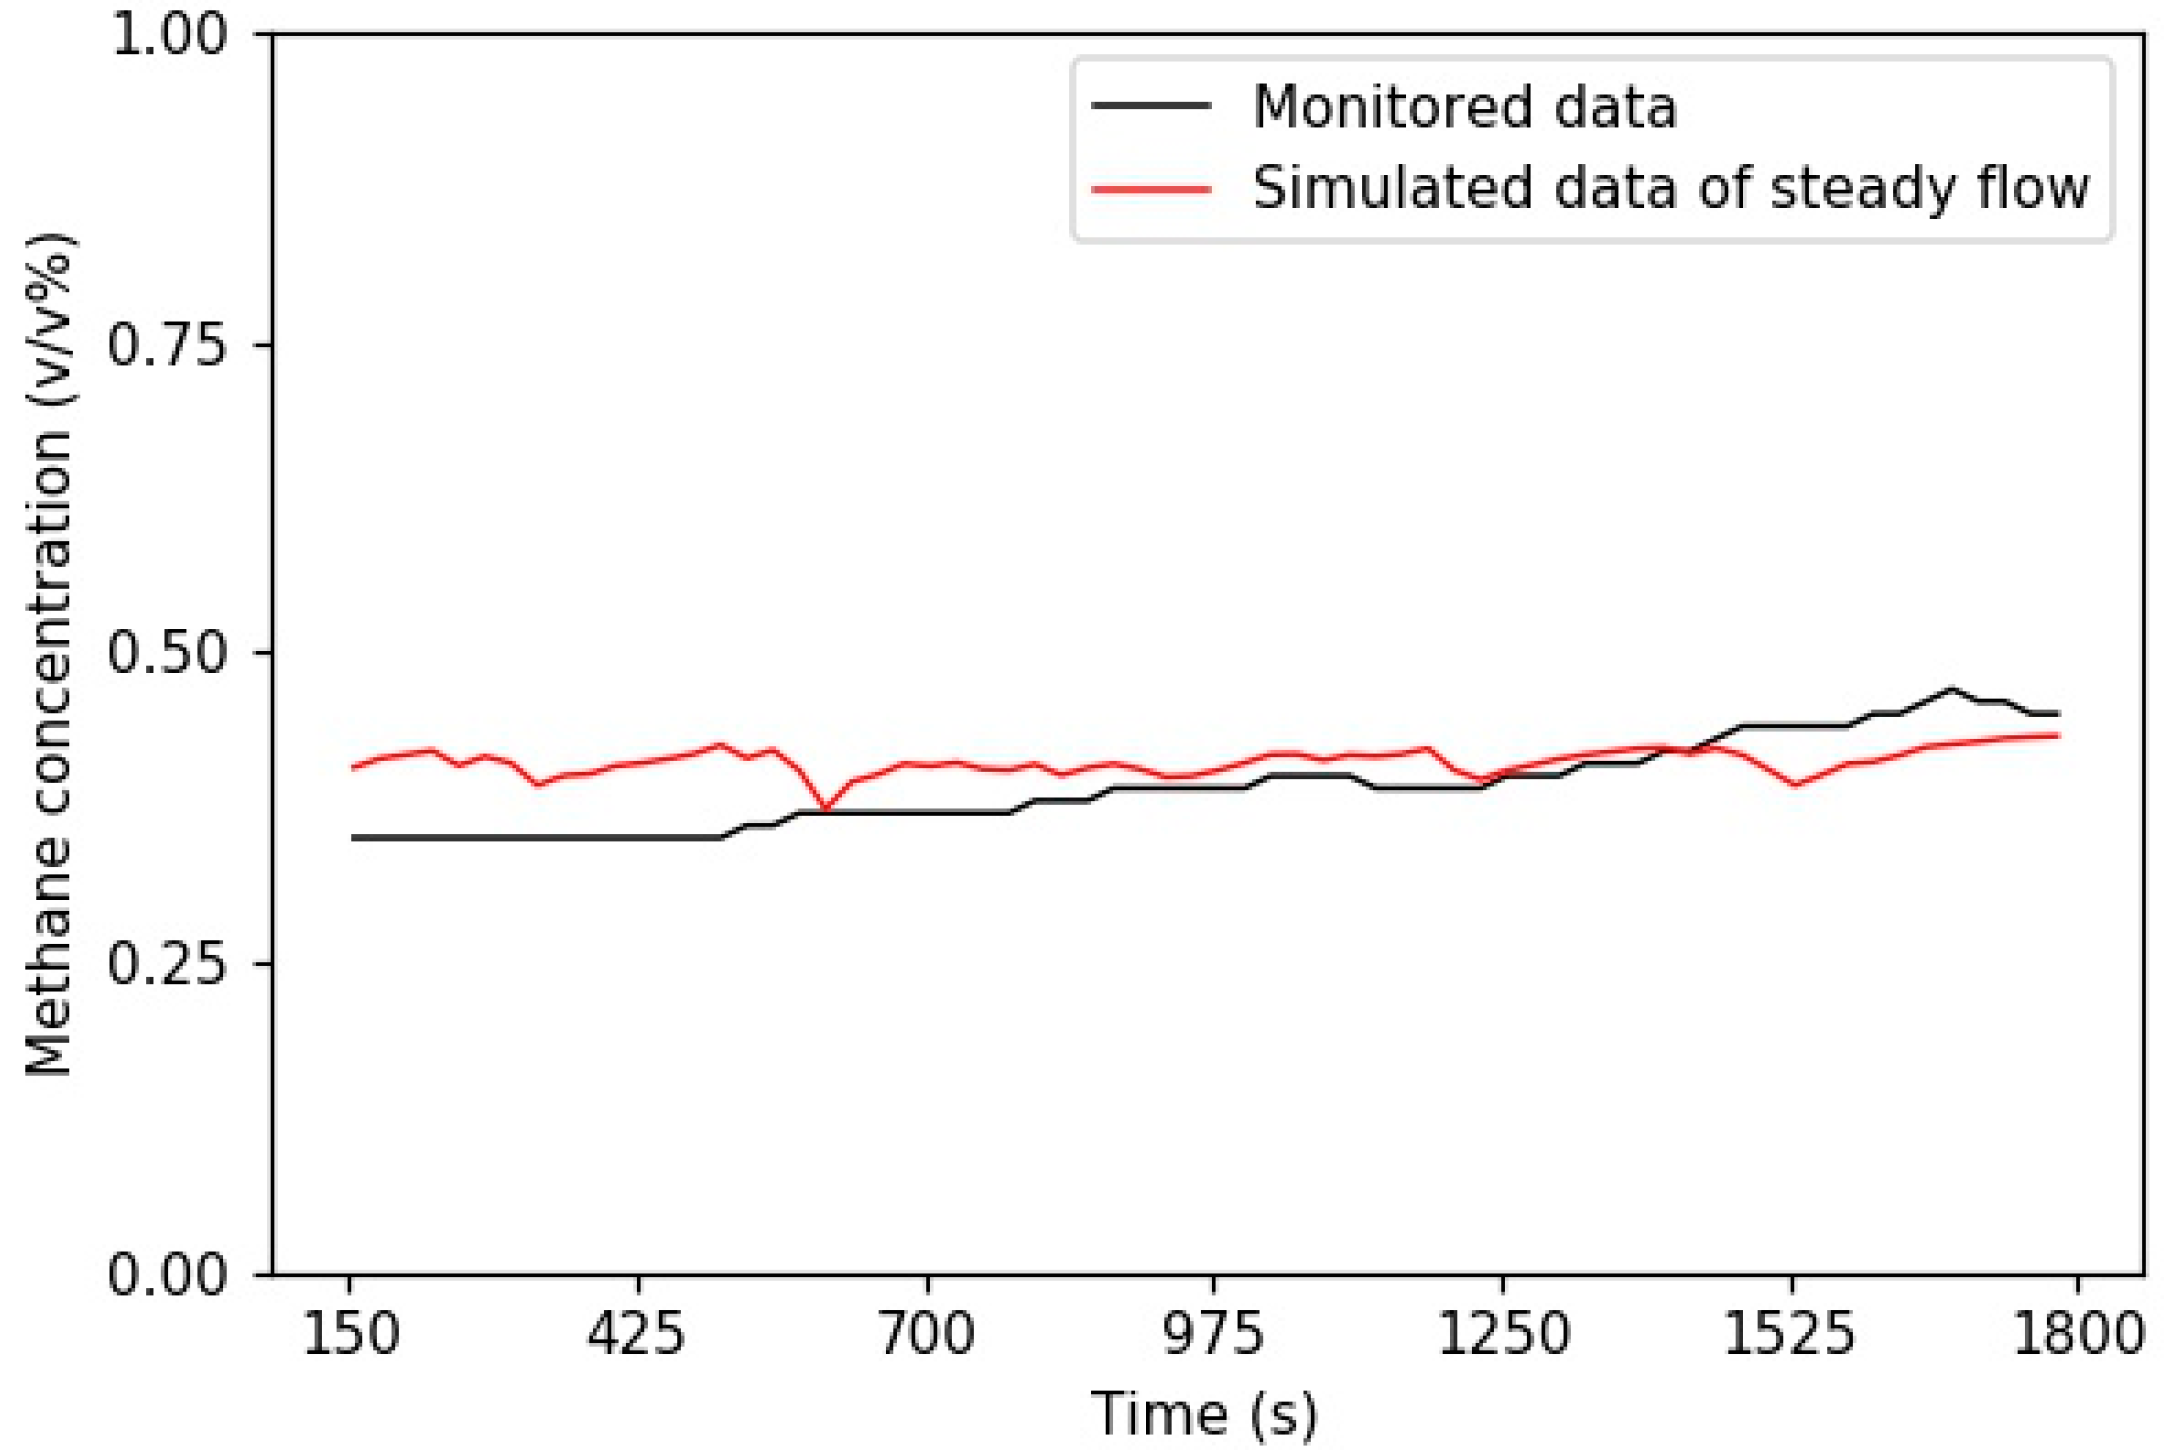
Before accepting the research results as decision supports for practical application, the ventilation pattern of base case 0 must be verified and validated with monitored data in Sijiazhuang coal mine. In this experiment, the methane sensor of type KJ9701A was used in 1-5205 excavation laneway, which is 3.7 m high from the laneway floor, 5 m away from the driving face and 0.4 m away from the laneway wall. Specifications of the methane sensor with type KJ9701A is shown in Table 5, and data comparison among field monitored data and simulated data of base case 0 is illustrated in Figure 12. The validation result indicates that the two sets of data agrees well with each other and exhibits a stable low level of methane concentration, which is within the alarm value of 0.8%v/v, indicating that the methane quality has remained the standard. Thus, the numerical results can be used to guide field measurements and operation to a certain degree.
5. Conclusions
In this study, based on the conception of FTC, an optimized intermittent ventilation and methane removal strategy is proposed and evaluated with the goal of saving energy usage whilst keeping methane level below the alarm value inside a laneway of coal mine. An important finding is that by conducting parametric studies from the perspective of time, factors, such as the inlet velocity value and the period of step changes, can be scientifically defined to obtain a balanced result between energy savings and methane removal efficiency.
Specifically, by investigating the spatiotemporal characteristics of methane concentration based on the parametric studies, the minimum inlet velocity value is determined as 9 m/s and the period of intermittency is defined as 180 s in this specific underground mine size, which can be utilized to FTC design and applied to optimize the intermittent ventilation pattern. Therefore, the cost-effective ventilation and methane removal strategy which performs best is defined as case 7, providing remarkable energy reduction of 39.2% compared with steady flow and controls methane concentrations at the lower level compared with case 2.
In conclusion, this study provides a possibility to design an optimized intermittent ventilation pattern with the same conception of FTC based on the spatiotemporal characteristics of airflow behavior and methane distribution; however, the physical model in this study remains quite simple. Maybe more complex ventilation approach with a brattice installation or air curtain based on parametric studies are required to investigate in the future.
Author Contributions
During this study, H.L. performed the numerical simulation and wrote the paper, S.M. and M.L. contributed the analysis tools and materials.
Funding
This work is financially supported by Mega-projects of Science Research for the 13th Five-year Plan: [Grant Number 2017YFC0804303].
Acknowledgments
The authors would like to acknowledge the commercial Fluent (ANSYS) software and appreciate the anonymous reviewers who contributed to the quality of this article by providing helpful suggestions.
Conflicts of Interest
No potential conflict of interest was reported by the authors.
References
- Baris, K. Assessing ventilation air methane (VAM) mitigation and utilization opportunities: A case study at Kozlu Mine, Turkey. Energy Sustain. 2013, 17, 13–23. [Google Scholar] [CrossRef]
- Karakurt, I.; Aydin, G.; Aydiner, K. Mine ventilation air methane as a sustainable energy source. Renew. Sustain. Energy Rev. 2011, 15, 1042–1049. [Google Scholar] [CrossRef]
- Somers, J.; Burklin, C. A 2102 update on the world VAM oxidizer technology market. In Proceedings of the 14th U.S./North American Mine Ventilation Symposium, Salt Lake City, UT, USA, 17–20 June 2012; pp. 259–263. [Google Scholar]
- Torano, J.; Torno, S.; Menendez, M.; Gent, M.; Velasco, J. Models of methane behaviour in auxiliary ventilation of underground coal mining. Int. J. Coal Geol. 2009, 80, 35–43. [Google Scholar] [CrossRef]
- Zheng, Y.; Tien, J.C. DPM dispersion study using CFD for underground metal/nonmetal mines. In Proceedings of the 12th North American Mine Ventilation Symposium, University of Nevada, Reno, NV, USA, 9–11 June 2008; pp. 281–286. [Google Scholar]
- Noack, K. Control of gas emissions in underground coal mines. Intern. J. Coal Geol. 1998, 35, 57–82. [Google Scholar] [CrossRef]
- Sasmito, A.P.; Birgersson, E.; Ly, H.; Mujumdar, A.S. Some approaches to improve ventilation system in underground coal mines environment-A computational fluid dynamic study. Tunn. Undergr. Space Technol. 2013, 34, 82–95. [Google Scholar] [CrossRef]
- Reddy, A.C. Development of a Coal Reserve GIS Model and Estimation of the Recoverability and Extraction Costs. Master’s Thesis, West Virginia University, Morgantown, WV, USA, 2009. [Google Scholar]
- Jeswiet, J.; Szekeres, A. Energy Consumption in Mining Comminution. Proced. CIRP 2016, 48, 140–145. [Google Scholar] [CrossRef] [Green Version]
- Jeswiet, J.; Archibald, J.; Thorley, U.; De Souza, E. Energy Use in Premanufacture (Mining). Proced. CIRP 2015, 29, 816–821. [Google Scholar] [CrossRef]
- Mielli, F.; Bongiovanni, M. Production energy optimization in mining. In Proceedings of the World Mining Congress, Montreal, QC, Canada, 11–15 August 2013. [Google Scholar]
- Tuck, M.A.; Finch, C.; Holden, J. Ventilation on demand: A preliminary study for Ballarat Goldfields NL. In Proceedings of the 11th North American Mine Ventilation Symposium, University Park, PA, USA, 5–7 June 2006; pp. 11–14. [Google Scholar]
- Hu, S.; Wang, Z. Temporal and Spatial Distribution of Respirable Dust After Blasting of Coal Roadway Driving Faces: A Case Study. Minerals 2015, 5, 679–692. [Google Scholar] [CrossRef] [Green Version]
- Allen, C.; Keen, B. Ventilation on demand (VOD) project—Vale Inco Ltd., Coleman Mine. In Proceedings of the 12th North American Mine Ventilation Symposium, Reno, NV, USA, 9–11 June 2008; pp. 45–49. [Google Scholar]
- Liu, H.; Wu, X.; Mao, S. A Time Varying Ventilation and Dust Control Strategy Based on the Temporospatial Characteristics of Dust Dispersion. Minerals 2017, 7, 59. [Google Scholar] [CrossRef]
- Heerden, J.; Sullivan, P. The application of CFD for evaluation of dust suppression and auxiliary ventilation systems used with continuous miners. In Proceedings of the 6th US Mine Ventilation Symposium, Littleton, CO, USA, 21–23 June 1993; pp. 293–297. [Google Scholar]
- Uchino, K.; Inoue, M. Auxiliary ventilation at a heading of a face by a fan. In Proceedings of the 6th International Mine Ventilation Congress, Pittsburgh, PA, USA, 17–22 May 1997; pp. 493–496. [Google Scholar]
- Nakayama, S.; Kim, Y.K.; Jo, Y.D. Simulation of methane gas distribution by computational fluid dynamics. In Mining and Science Technology; Xie, H.P., Golosinski, T.S., Eds.; Balkema Publisher: Brookfield, WI, USA, 1999; pp. 259–262. [Google Scholar]
- Niu, W.; Jiang, Z.G.; Tian, D.M. Numerical simulation of the factors influencing dust in drilling tunnels: It’s application. Min. Sci. Technol. 2011, 21, 11–15. [Google Scholar]
- Parra, M.T.; Villafruela, J.M.; Castro, F.; Mendez, C. Numerical and experimental analysis of different ventilation systems in deep mines. Build. Environ. 2006, 41, 87–93. [Google Scholar] [CrossRef]
- De Souza, E. Application of ventilation management programs for improved mine Safety. Intern. J. Min. Sci. Technol. 2017, 27, 647–650. [Google Scholar] [CrossRef]
- Wala, A.M.; Vytla, S.; Taylor, C.D.; Huang, G. Mine face ventilation: A comparison of CFD results against benchmark experiments for the CFD code validation. Min. Eng. 2007, 59, 1–7. [Google Scholar]
- Torano, J.; Torno, S.; Mendez, M.; Gent, M. Auxiliary ventilation in mining roadways driven with road headers: Validated CFD modeling of dust behavior. Tunn. Undergr. Space Technol. 2011, 26, 201–210. [Google Scholar] [CrossRef]
- Szlązak, N.; Obracaj, D.; Borowski, M.; Swolkień, J.; Korzec, M. Monitoring and controlling methane hazard in excavation in hard coal mines. AGH J. Min. Geoeng. 2013, 37, 105–116. [Google Scholar] [CrossRef]
- Zhong, M.; Xing, W.; Weicheng, F.; Peide, L.; Baozhi, C. Airflow optimizing control research based on genetic algorithm during mine fire period. J. Fire Sci. 2003, 21, 131–153. [Google Scholar] [CrossRef]
- Kurnia, J.C.; Sasmito, A.P.; Mujumdar, A.S. CFD simulation of methane dispersion and innovative methane management in underground mining faces. Appl. Math Model 2014, 38, 3467–3484. [Google Scholar] [CrossRef]
- Kurnia, J.C.; Sasmito, A.P.; Mujumdar, A.S. Prediction and innovative control strategies for oxygen and hazardous gases from diesel emission in underground mines. Sci. Total Environ. 2014, 481, 317–334. [Google Scholar] [CrossRef]
- Kurnia, J.C.; Sasmito, A.P.; Hassani, F.P. Introduction and evaluation of a novel hybrid brattice for improved dust control in underground mining faces: A computational study. Int. J. Min. Sci. Technol. 2015, 24, 537–543. [Google Scholar] [CrossRef]
- Kurnia, J.C.; Peng, X.; Sasmito, A.P. A novel concept of enhanced gas recovery strategy from ventilation air methane in underground coal mines—A computational investigation. J. Nat. Gas Sci. Eng. 2016, 35, 661–672. [Google Scholar] [CrossRef]
- Pach, G. Optimization of Forced Air Flow by the Comparison of Positive and Negative Regulations in Mine Ventilation Network. Arch. Min. Sci. 2018, 63, 853–870. [Google Scholar]
- Pach, G.; Sułkowski, J.; Różański, Z.; Wrona, P. Costs Reduction of Main Fans Operation According to Safety Ventilation in Mines—A Case Study. Arch. Min. Sci. 2018, 63, 43–60. [Google Scholar]
- Kurnia, J.C.; Sasmito, A.P.; Mujumdar, A.S. Simulation of a novel intermittent ventilation system for underground mines. Tunn. Undergr. Space Technol. 2014, 42, 206–215. [Google Scholar] [CrossRef]
- Xu, G.; Kray, D.; Luxbacher, S.R.; Xu, J.L.; Ding, X.H. Computational fluid dynamics applied to mining engineering: A review. Intern. J. Min. Reclam. Environ. 2017, 31, 251–275. [Google Scholar] [CrossRef]
- Wu, J.H. Research on Mine ventilator frequency conversion energy saving technology ventilator. Opencast Min. Technol. 2010, 4, 68–72. [Google Scholar]
- Yang, Z.; Yu, Z.Z. Research on frequency conversion technology of metro station’s ventilation and air-conditioning system. Appl. Therm. Eng. 2017, 69, 123–129. [Google Scholar] [CrossRef]
- Fluent 6.3 documentations. Available online: https://www.ansys.com/ (accessed on 31 January 2019).
Figure 1.
Schematic views of the laneway model.
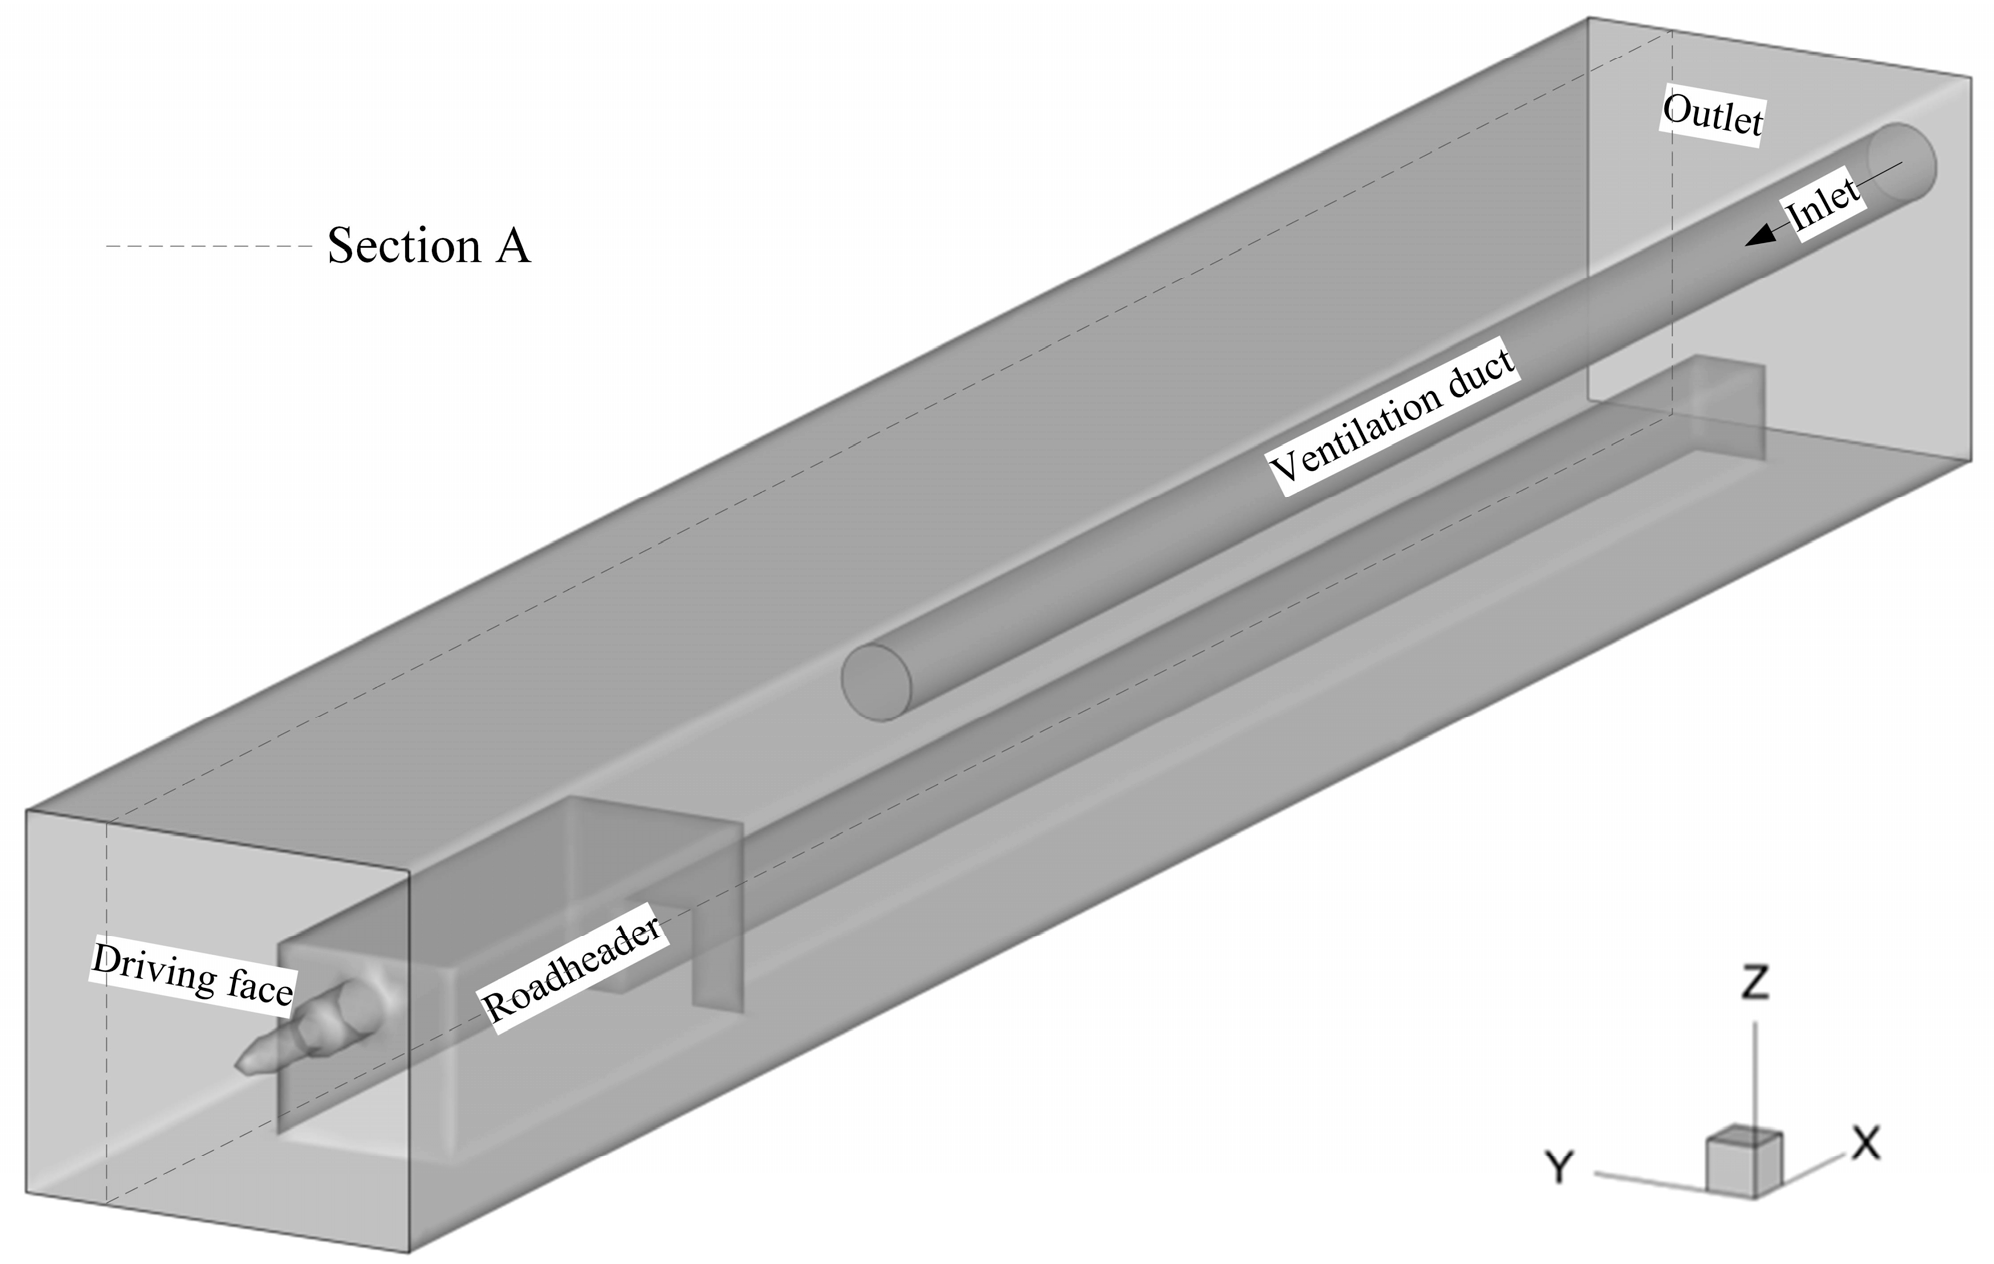
Figure 2.
Velocity field of the airflow (m/s) under different mesh generation.

Figure 3.
Methane concentration (%v/v) under different mesh generation.

Figure 4.
Mesh generation.

Figure 5.
Six different ventilation patterns.

Figure 6.
Average methane concentration along the selected line.
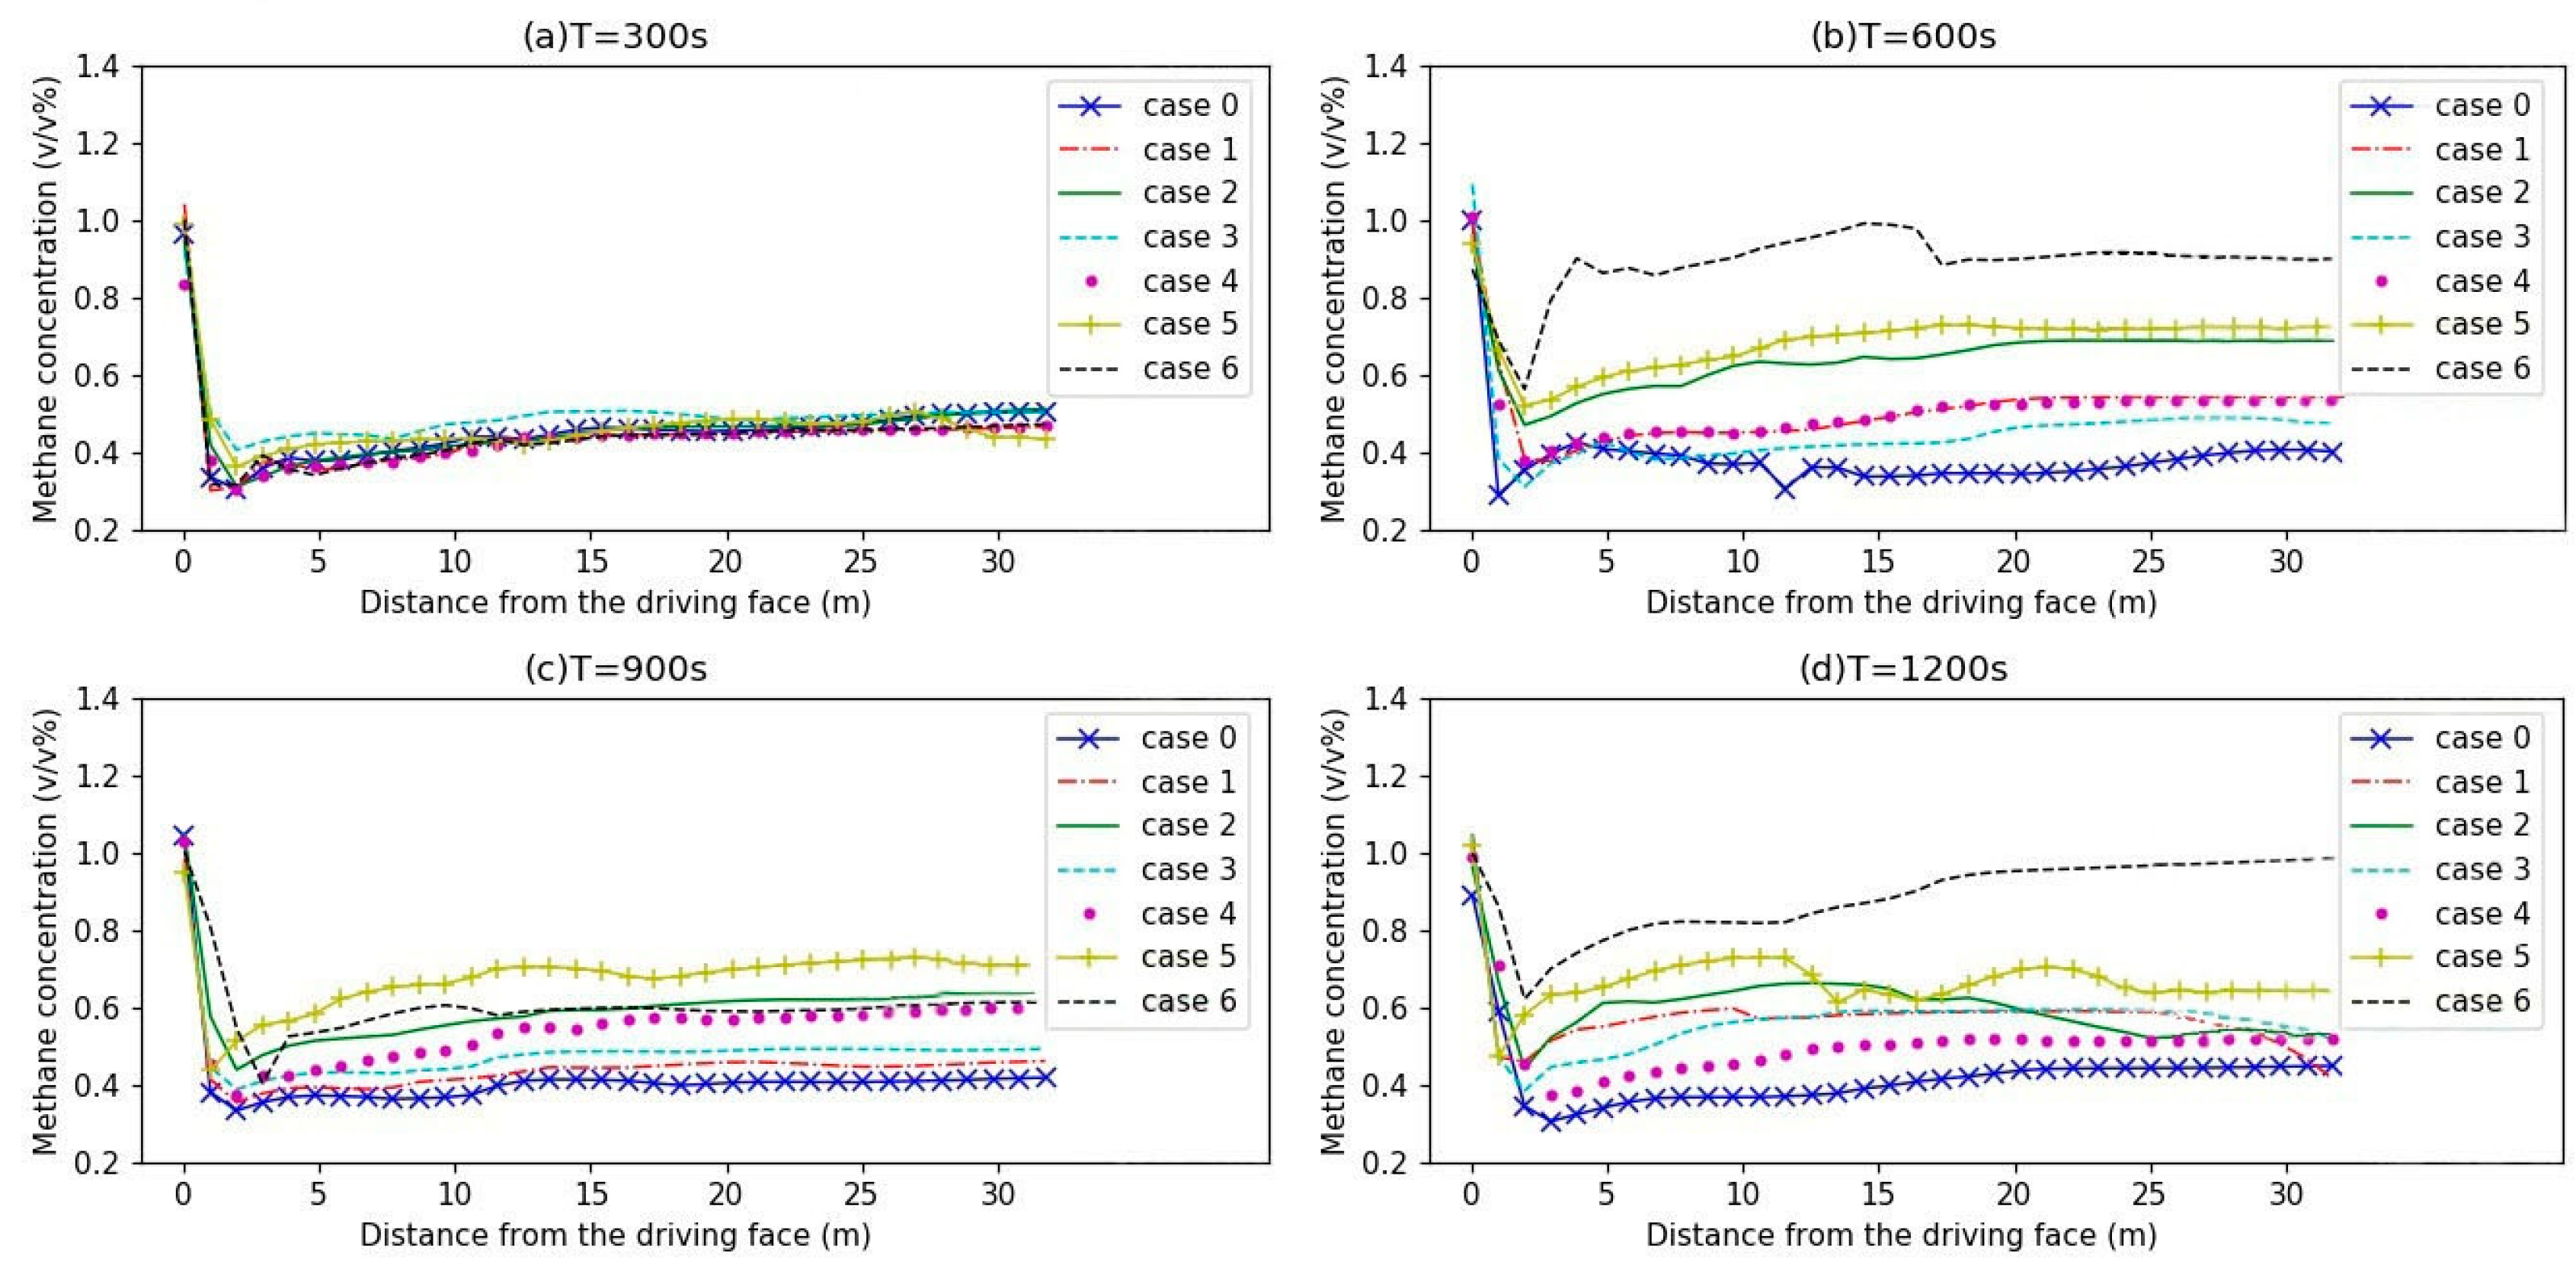
Figure 7.
Average methane concentration in a selected point at different times.

Figure 8.
Airflow velocity (m/s) profiles at different cross sections (with a distance of 1 m, 5 m, 10 m, 15 m, 20 m to the driving face).
Figure 8.
Airflow velocity (m/s) profiles at different cross sections (with a distance of 1 m, 5 m, 10 m, 15 m, 20 m to the driving face).

Figure 9.
Methane distribution (%v/v) at height of 1 m above the laneway floor.

Figure 10.
Optimized velocity pattern for the ventilation and methane removal strategy.
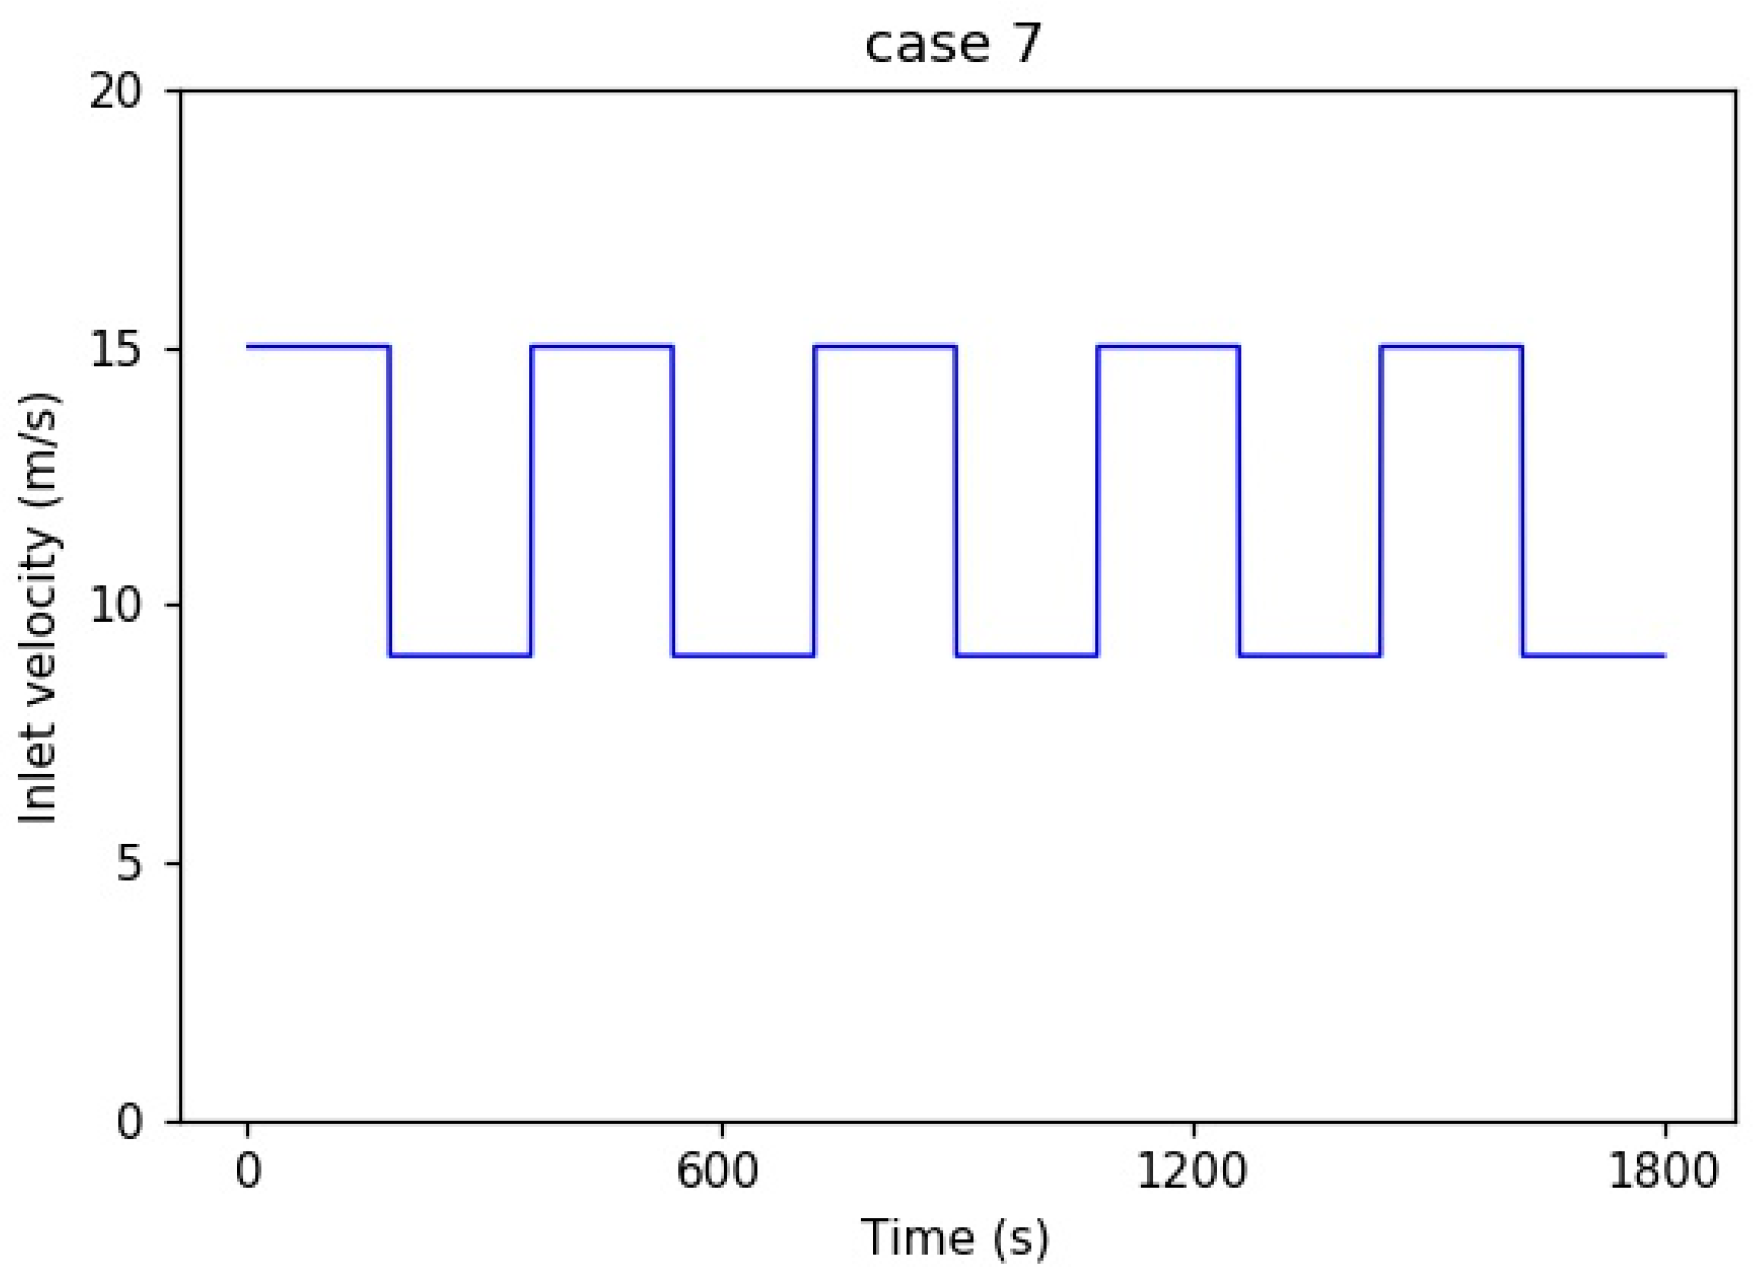
Figure 11.
Methane concentration changed over time at two specified points.

Figure 12.
Comparison of the simulated data with field monitored data.


Table 1.
Details for the mesh generation of computational domains.
| Mesh Amount | Interval of Laneway (m) | Interval of Windpipes (m) | Elapsed Time (s) | RAM Required (GB) | Deviation |
|---|---|---|---|---|---|
| 3.94 × 10⁵ | 0.2 | 0.2 | 11 | 3.4 | 14.6% |
| 5.11 × 10⁵ | 0.2 | 0.1 | 18 | 3.9 | 10.4% |
| 1.15 × 10⁶ | 0.15 | 0.1 | 35 | 4.8 | 4.2% |
| 4.04 × 10⁶ | 0.1 | 0.05 | 114 | 7.1 | - |
Table 2.
Parameters for the turbulence models.
| Parameters | Setting |
|---|---|
| Air density (kg/m3) | 1.225 |
| Turbulent viscosity (m2/s) | 1.7894 × 10⁻⁵ |
| Turbulent kinetic energy | 1.3 |
| The relative intensity of turbulence | 5.1 |
| Volume flow rate of methane gas (m3/s) | 0.031 |
| Convergence criteria | 1 × 10⁻⁶ |
| Initialization method | Hybrid Initialization |
| Number of time steps for transient simulation | 1800 |
| Time step size (s) | 1 |
| Max iterations/time step | 15 |
Table 3.
Energy saving for various ventilation patterns in 1800 s.
| Cases | Average Pressure Difference (Pa) | Average Volumetric Flow Rate (m3/s) | Average Fan Power (Watt) | Energy Saving (%) |
|---|---|---|---|---|
| Case 0 | 137.81 | 7.54 | 1038.56 | 0 |
| Case 1 | 113.01 | 6.78 | 785.15 | 24.40 |
| Case 2 | 93.71 | 6.03 | 631.44 | 39.20 |
| Case 3 | 113.01 | 6.78 | 785.15 | 24.40 |
| Case 4 | 104.74 | 6.53 | 700.68 | 32.53 |
| Case 5 | 79.01 | 5.53 | 495.74 | 52.27 |
| Case 6 | 79.93 | 5.28 | 552.51 | 46.80 |
Table 4.
Energy saving for case 7 in 1800 s.
| Average Pressure Difference (Pa) | Average Volumetric Flow Rate (m3/s) | Average Fan Power (Watt) | Energy Saving (%) |
|---|---|---|---|
| 93.71 | 6.03 | 631.44 | 39.20 |
Table 5.
Specifications of the methane sensor (type KJ9701A).
| Specifications | Range |
|---|---|
| Measurement range | 0–4%v/v CH4 |
| Relative error | 0–1% CH4 ≤ ±0.1% CH4 1–3% CH4 ≤ 10% CH4 3–4% CH4 ≤ ±0.3% CH4 |
| Working voltage | 9VDC–24VDC |
© 2019 by the authors. Licensee MDPI, Basel, Switzerland. This article is an open access article distributed under the terms and conditions of the Creative Commons Attribution (CC BY) license (http://creativecommons.org/licenses/by/4.0/).
Share and Cite
MDPI and ACS Style
Liu, H.; Mao, S.; Li, M. A Case Study of an Optimized Intermittent Ventilation Strategy Based on CFD Modeling and the Concept of FCT. Energies 2019, 12, 721. https://doi.org/10.3390/en12040721
AMA Style
Liu H, Mao S, Li M. A Case Study of an Optimized Intermittent Ventilation Strategy Based on CFD Modeling and the Concept of FCT. Energies. 2019; 12(4):721. https://doi.org/10.3390/en12040721
Chicago/Turabian StyleLiu, Hui, Shanjun Mao, and Mei Li. 2019. "A Case Study of an Optimized Intermittent Ventilation Strategy Based on CFD Modeling and the Concept of FCT" Energies 12, no. 4: 721. https://doi.org/10.3390/en12040721
Note that from the first issue of 2016, this journal uses article numbers instead of page numbers. See further details here.