Sources of China’s Fossil Energy-Use Change


1
School of Earth Sciences and Resources, China University of Geosciences, Beijing. 29 Xueyuan Road, Haidian District, Beijing 100083, China
2
Graduate School of Economics, Kyushu University, 744 Motooka, Nishi-ku, Fukuoka 819-0395, Japan
3
Research Center for Strategy of Global Mineral Resources, Chinese Academy of Geological Sciences, 26 Baiwanzhuang Street, Xicheng District, Beijing 100037, China
4
Faculty of Economics, Kyushu University, 744 Motooka, Nishi-ku, Fukuoka 819-0395, Japan
5
National Institute for Environmental Studies of Japan, 16-2 Onokawa, Tsukuba, Ibaraki 305-0053, Japan
*
Author to whom correspondence should be addressed.
Energies 2019, 12(4), 699; https://doi.org/10.3390/en12040699
Submission received: 16 January 2019
/
Revised: 15 February 2019
/
Accepted: 16 February 2019
/
Published: 21 February 2019
(This article belongs to the Special Issue Advances in Low Carbon Technologies and Transition)
Abstract
:Technology improvement related to energy conservation and energy mix low-carbonization is a critical approach for tackling global warming in China. Therefore, we attempt to identify the technology factors of China’s energy consumption change between 2007 and 2012, when China’s economy started slowing. This study proposes a new refined structural decomposition analysis (SDA) based on a hybrid multi-regional input–output (MRIO) model. The technology factors are expressed through the energy input level effect, energy composition effect, and non-energy input effect. We find that the energy level effect was the primary driver for energy reduction, saving 1205 million tonnes of standard coal equivalent (Mtce) of energy, while 520 Mtce was offset by energy composition and non-energy input effects. The sector analysis shows that the energy input level, energy composition, and non-energy input effects of electricity, the chemical industry, and metallurgy are noteworthy. In addition, the sector contribution to energy-use change, by province, related to the three effects, is also studied. From these results, we propose policy suggestions for further energy saving, in order to achieve China’s energy target through technology improvements by the higher priority contributors identified.
1. Introduction
Fossil energy consumption is one of the main reasons for global warming [1,2]. As a major greenhouse gas (GHG) emitter, China aims to keep energy consumption within six billion tonnes of standard coal equivalent by 2030 for GHG abatement. Meanwhile, natural gas and non-fossil energy are targeted to have a 35% share of China’s energy pie [3]. However, it has been announced that the commitment to the Paris Agreement of each country is not enough to achieve the 1.5 degree Celsius goal [4], which undoubtedly poses additional challenges to national climate policy. Therefore, it is important to quantify the driving factors related to energy saving and energy mix low-carbonization in order to shed light on the achievement of the pursuit of a higher GHG reduction. Also, the realization of national goals requires the joint efforts of all of the provinces. Given the provincial disparities, the provincial contributions to the energy saving and energy mix change are also worth estimating, for a policy tailored to each province.
Structural decomposition analysis (SDA) is usually used to evaluate the driving factors behind energy consumption or environment load change. An advantage of SDA is that a wide variety of the driving factors can be identified considering the economic linkages between sectors. However, the empirical studies are restricted by the availability of the monetary input–output tables of nations [5]. The energy consumption changes or environment load changes are often decomposed into three factors, namely: efficiency, the Leontief inverse effect, and the final demand effect. The final demand effect is further decomposed into commodity shares of final demand, destination share, per-capita total final demand, and population [6].
For the SDA studies focusing on energy change, Weber (2009) [7] used SDA to decompose energy growth between 1997 and 2002 in the United States, and found that rising populations and household consumption were the two drivers of energy demand growth, while being offset by the considerable structural change within the economy. A study of Italy from 1999 to 2006 showed that the final demand for goods and services was the main factor increasing energy consumption, but energy consumption was offset by the energy intensity and production structure [8]. In the case of Japan, the total energy demand dramatically increased, mainly as a result of the growth in the non-energy final demand from 1985 to 1990 [9]. In Brazil, from 1970 to 1996, the primary accelerator of energy use was population growth, and after 1980, the increasing demand for energy-intensive products also drove the energy demand increase [10].
Since China experienced an alarming average annual growth rate of energy consumption of 13% from 2002 to 2007 [11], many researchers have focused on an energy SDA analysis. Xie (2014) [12] examined the driving factors of China’s energy use from 1992 to 2010. The study proved that after 2002, when China joined the WTO (World Trade Organization), 38% of its energy growth came from the increasing exports, 36% from the increasing fixed capital formation, while the contribution of household demand growth was only 15%. This was quite different from the household consumption-driven energy growth in developed countries such as the United States or Italy. However, between 2007 and 2010, the energy change induced by exports decreased because of the financial crisis. Fixed capital formation acted as the main reason for energy growth, accounting for 75% of energy growth, because of the “package plan” proposed by the Chinese government. The results of Mi et al. (2018) [13] agreed with those of Xie (2014) [12].
Moreover, Zhang and Lahr (2014), and Zhang et al. (2016) [14,15] quantified the energy change related to the regional demand in China. Meanwhile, efficiency played a critical role in offsetting energy consumption. However, from 2002 to 2007, the efficiency of construction, abnormally increasing the total energy use, resulted in a weakened energy saving effect of efficiency [12,13,14].
From the above-mentioned literature, we found that the decomposition of the final demand factor has already been well discussed, while the decomposition of technology factors was seldom deeply studied. The present research is intended to fill this gap. A novelty of this study is the development of a new refined decomposition framework to identify the technology role of each sector of each province in the change of energy-use in China.
Specifically, we propose an energy SDA based on a “hybrid” multiregional input–output (MRIO) table, expressed in both monetary and physical units. To the best of our knowledge, this is the first attempt to apply a hybrid MRIO approach to the provincial primary energy consumptions of China. It is well known that a hybrid input–output approach is superior to a monetary input–output approach, because energy sectors are frequently characterized by different pricing for different sectors, whereas the analysis based on monetary input–output tables assumes uniform pricing across all sectors [16,17,18]. However, the SDA described in previous studies is fit for the monetary approach, but not the hybrid approach [16]. Our new SDA framework applies to both hybrid and monetary cases.
In doing the hybrid analysis, we focus on the primary fossil energy (i.e., coal, oil, and natural gas) consumed in China. Hydropower, nuclear power, renewable energy, and others are not considered, because the proportion of non-fossil energy consumption in China was less than 10% during our study period [19]. The proposed energy SDA method is applied to the Chinese hybrid MRIO tables of 2007 and 2012, and the important driving forces of China’s energy growth are identified at a sector and province level. Finally, we identify important stakeholder sectors and provinces that are important for energy saving in China, and suggest that they should be environmentally monitored. Policy makers should commit to making important stakeholder sectors and provinces the highest priority.
2. Methodology
2.1. Primary Fossil Energy Consumed in China
The structure of the MRIO model can be expressed as , where = ( is the vector of outputs of N sectors of R provinces, and () is the vector of the total final demand for sector of province , including rural household consumption, urban household consumption, government consumption, fixed capital formation, and exports. Furthermore, () = () is the input coefficient matrix, where denotes the intermediate deliveries from sector of province to sector of province .
In the mixed-units approach (i.e., hybrid approach), if is an energy sector, , , and are measured in energy units (tonnes of coal equivalent in this study). As in the previous studies [12,16,17], the solution of the hybrid MRIO model is , where is the Leontief inverse matrix. It should be noted that the hybrid MRIO database of China describes both domestically produced energy and imported energy. The domestically produced primary fossil energy consumption in China triggered by the final demand can be estimated as follows:
where represents the fossil energy consumptions provided by energy sector of province r, triggered by the domestic final demand of China and its exports (when ). It should be noted that is a diagonal matrix with diagonal elements of 0 and 1. When is a fossil energy sector (coal mining, crude oil, and natural gas) of province r, , and otherwise, .
The physical energy import triggered by the domestic final demand of China and its exports can also be estimated as follows:
where represents the imported energy (k) consumed in China, and is the energy import coefficient matrix expressing the physical amount of energy (k) imported to produce one unit of output of sector j of province s (see the Supporting Information).
The fossil energy (k) consumed in China triggered by total final demand can be expressed as follows:
2.2. Structural Decomposition Analysis (SDA)
As the primary fossil energy consumptions formulated in Equation (3) include both domestically produced and imported energy, the SDA technique can be performed, focusing on either of these two sources. From Equation (1), the change in the consumption of domestically produced energy in China between 2007 and 2012 can be calculated by the following:
The driving factors can be found as the final demand effect () and the Leontief inverse effect (), respectively. The final demand effect refers to the energy-use change induced by the shifts of the final demand while holding the Leontief inverse constant. The Leontief inverse effect represents the energy-use change generated from the Leontief inverse shift, with a given final demand. We take the average of all of the possible decompositions in order to qualify each effect. Dietzenbacher and Los (1998), and Hoekstra and Van Den Bergh (2002) provide the theoretical details in their studies [20,21].
where represents the change of a factor.
We further decompose the Leontief inverse effect () into trade effect () and technology effect (). Moreover, the technology effect is identified along three dimensions, as the energy-use change associated with shifts in the non-energy input, energy composition, and energy input level. Trade effect refers to the energy change induced by the shifts of the input factors’ sourcing locations. Technology effect refers to the combined effect of the non-energy input, energy composition, and energy input level effects. Firstly, the non-energy input effect () is the energy-use change generated from the change in non-energy inputs in production, when holding the other factors constant. Secondly, energy composition effect () refers to the energy-use change induced by the energy mix shifts in the production process. Thirdly, the energy input level effect () is the energy-use change brought about by the sum of all kinds of energy consumption variation per unit of output (i.e., energy efficiency).
Furthermore, we have the following matrix decomposition of the Leontief inverse matrix [22].
In this study, we re-defined the input coefficient matrices of 2007 and 2012, as follows:
Here, is the inter-provincial trade coefficient matrix of China, showing the proportion supplied from province r of the total intermediate delivery from sector , required for producing one unit of sector of province , and it can be defined as follows:
where is the inter-provincial trade coefficient submatrix for the goods and services flowing from province r to s. B in the right-hand sides of Equations (8) and (9) is the technical coefficient matrix of the Chinese provinces, and it can be written as follows:
where is the technical coefficient submatrix of a specific province (s), showing the total intermediate delivery from sector required for producing one unit of sector of province . It should be noted that ○ denotes the Hadamard product.
We further propose decomposing the technical coefficient submatrix of a specific province (s), , as follows:
where is the technical coefficient submatrix for the non-energy sectors, is the energy composition matrix showing the energy mix information of each sector, and is the diagonal matrix with the overall energy input level (energy intensity in this study) of each sector. is the total number of energy sectors.
Using the refined decomposition factors of Equations (10), (11), and (12), the input coefficient matrices of 2007 and 2012 can be formulated, respectively, as follows:
Accordingly, in Equation (6) can be further decomposed into the changes in the structural factors of , as follows:
We can finally quantify the Leontief inverse effect-driven energy-use change as the following four factors.
Similarly, we decomposed the changes in the imported energy of China between 2007 and 2012 (see Supporting Information).
3. Data Sources
This study uses the monetary MRIO tables of China from 2007 and 2012 [23,24], and the energy-use data of the individual sectors by province [25], as well as the energy export, import, and inventory change of each province [26,27]. The “monetary” MRIO tables of 2007 and 2012 are of 30 sectors [23,24], while the energy-use data of the individual sectors by province is of 45 industrial sectors and 2 residential sectors [25]. For consistency, this study consolidates the industrial sectors in the different databases [23,24,25] into the same 31 sectors, with 8 energy sectors and 23 non-energy sectors. The energy types in the energy-use data are classified into eight groups corresponding to the eight energy sectors (see Table S1 and Table S2 in the Supporting Information for sector classification and energy grouping). Based on the data above, we compile “hybrid” MRIO tables of the years 2007 and 2012, whose energy inputs are described in physical terms (tonnes of coal equivalent in this study), and non-energy inputs are described in monetary terms (Chinese yuan in this study). A detailed description of constructing the hybrid MRIO tables for China can also be found in the Supporting Information.
4. Results and Discussion
4.1. Nationwide SDA of China
We estimated the total primary fossil energy consumptions in China by using Equation (3). The total primary fossil energy consumed in China increased by 61%, from 2682 million tonnes of standard coal equivalent (Mtce) in 2007, to 4319 Mtce in 2012. In particular, coal consumption made up the most substantial fraction, growing from 2162 Mtce to 3399 Mtce (Figure 1). It is important to determine what the sources were of the remarkable increase in the fossil energy consumptions during the recent five years, between 2007 and 2012.
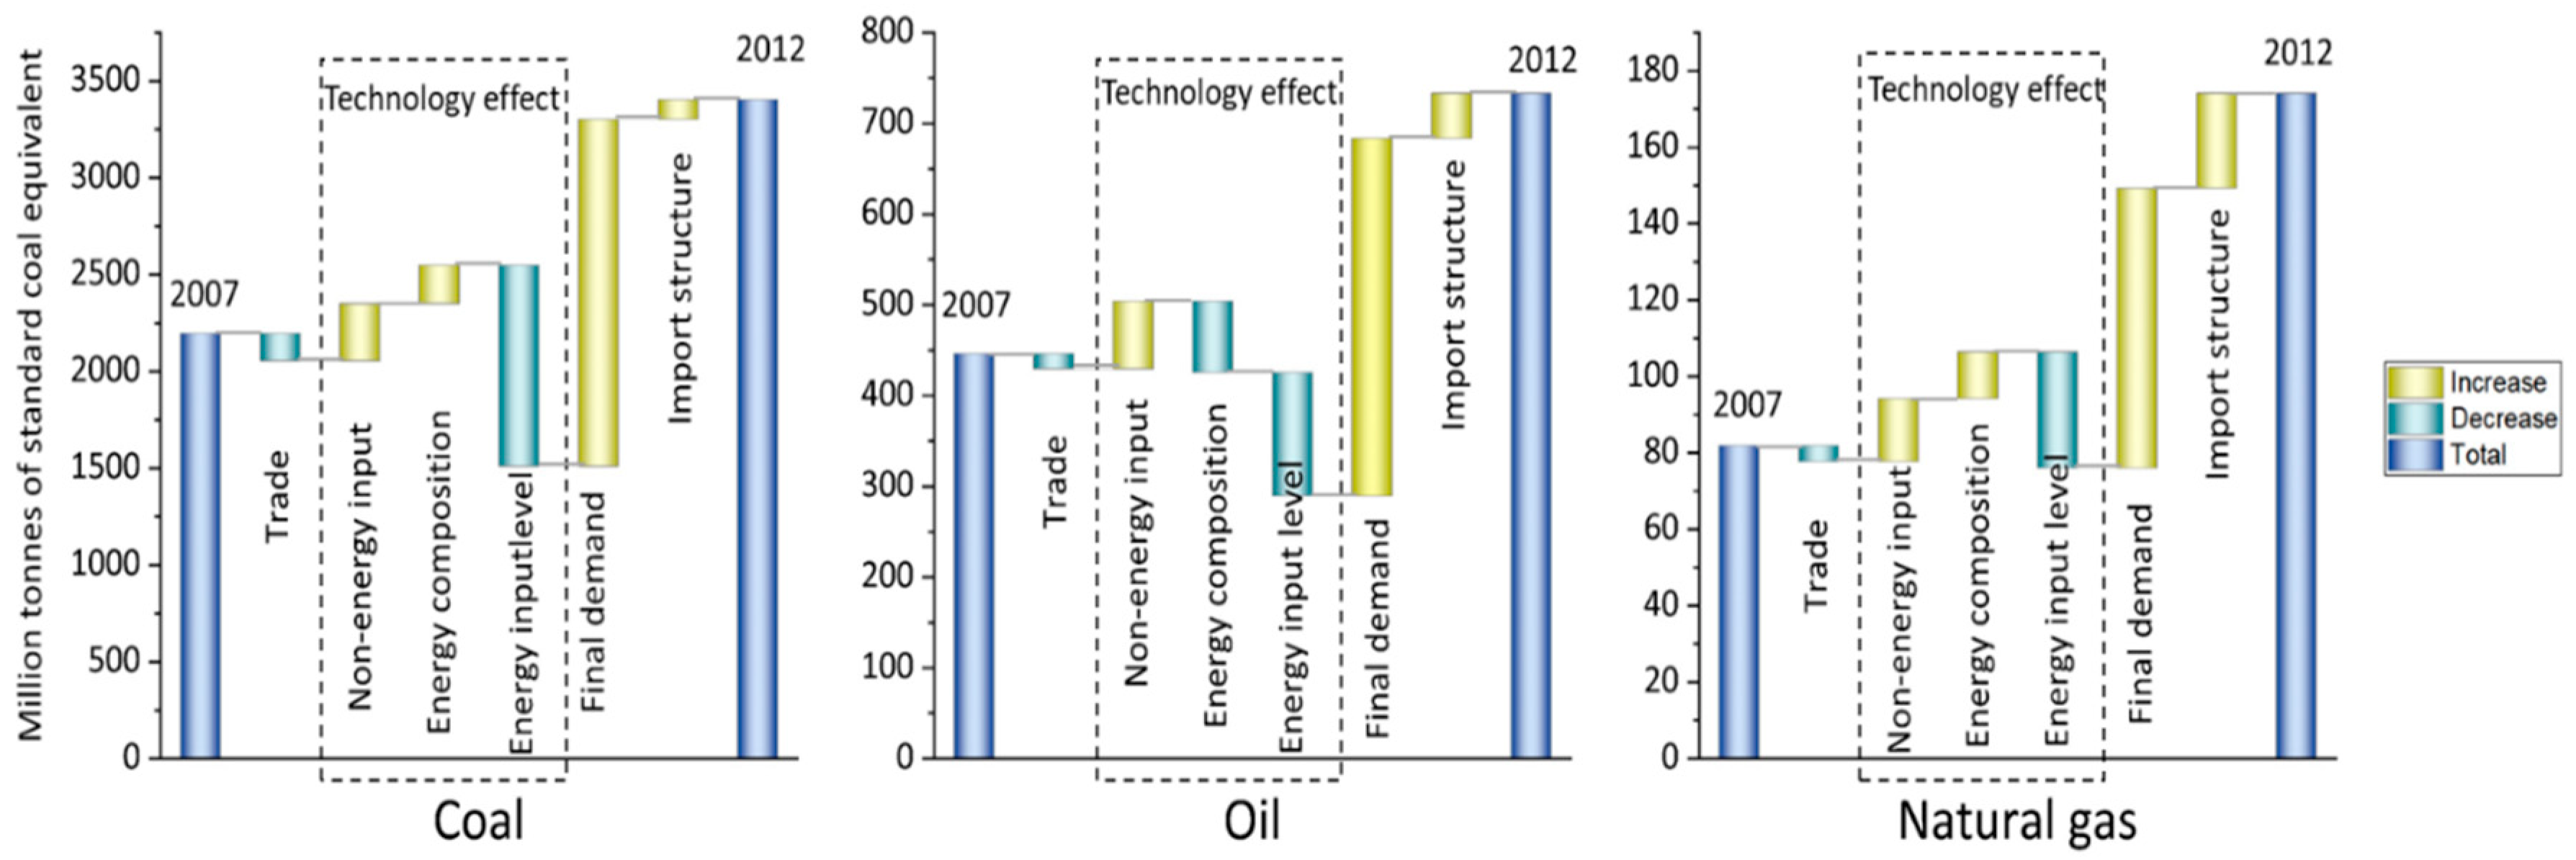
From the SDA results, we found that final demand shifts were the dominating sources that pushed each energy-use upward, by 2259 Mtce in total (84% of the energy consumption in 2007) (Figure 2). It is also important to identify the role of technology changes in primary energy use. Looking at the technology effect, which is a combined effect of the energy input level, energy composition, and non-energy input effects in Figure 2, technological changes have contributed to decreasing fossil energy use by 684 Mtce in total. Thus, expanding consumptions lead to economic growth and fossil energy growth in China, while the Chinese government can expect that technological changes can help to partially offset fossil energy growth.
Using the SDA technique developed in this study, we can further decompose the technology effect into the following three effects: energy input level, energy composition, and non-energy input effects. Looking at these three effects in detail, using Figure 2, between 2007 and 2012, the energy input level effect was the main driver offsetting the increase of all fossil energy types, helping to reduce the energy consumption by 1205 Mtce (45% of the energy consumption in 2007). On the other hand, the energy composition effect was a driver of increasing the consumptions of coal and natural gas by 198 and 12 Mtce, respectively, while reducing oil consumption by 79 Mtce, leading to a 131 Mtce energy growth overall (Figure 2). The non-energy input effect was a driver of increasing the fossil energy consumption by 389 Mtce (15% of energy consumption in 2007) (Figure 2). Thus, the energy saving effect through technological changes was weakened by both energy composition and non-energy input effects; therefore, the Chinese government should put effort into maximizing the technology-induced energy saving effect through an improvement in energy mix and non-energy input.
4.2. Decomposition of Technology Effects by Province and Sector
4.2.1. Energy Input Level Effect
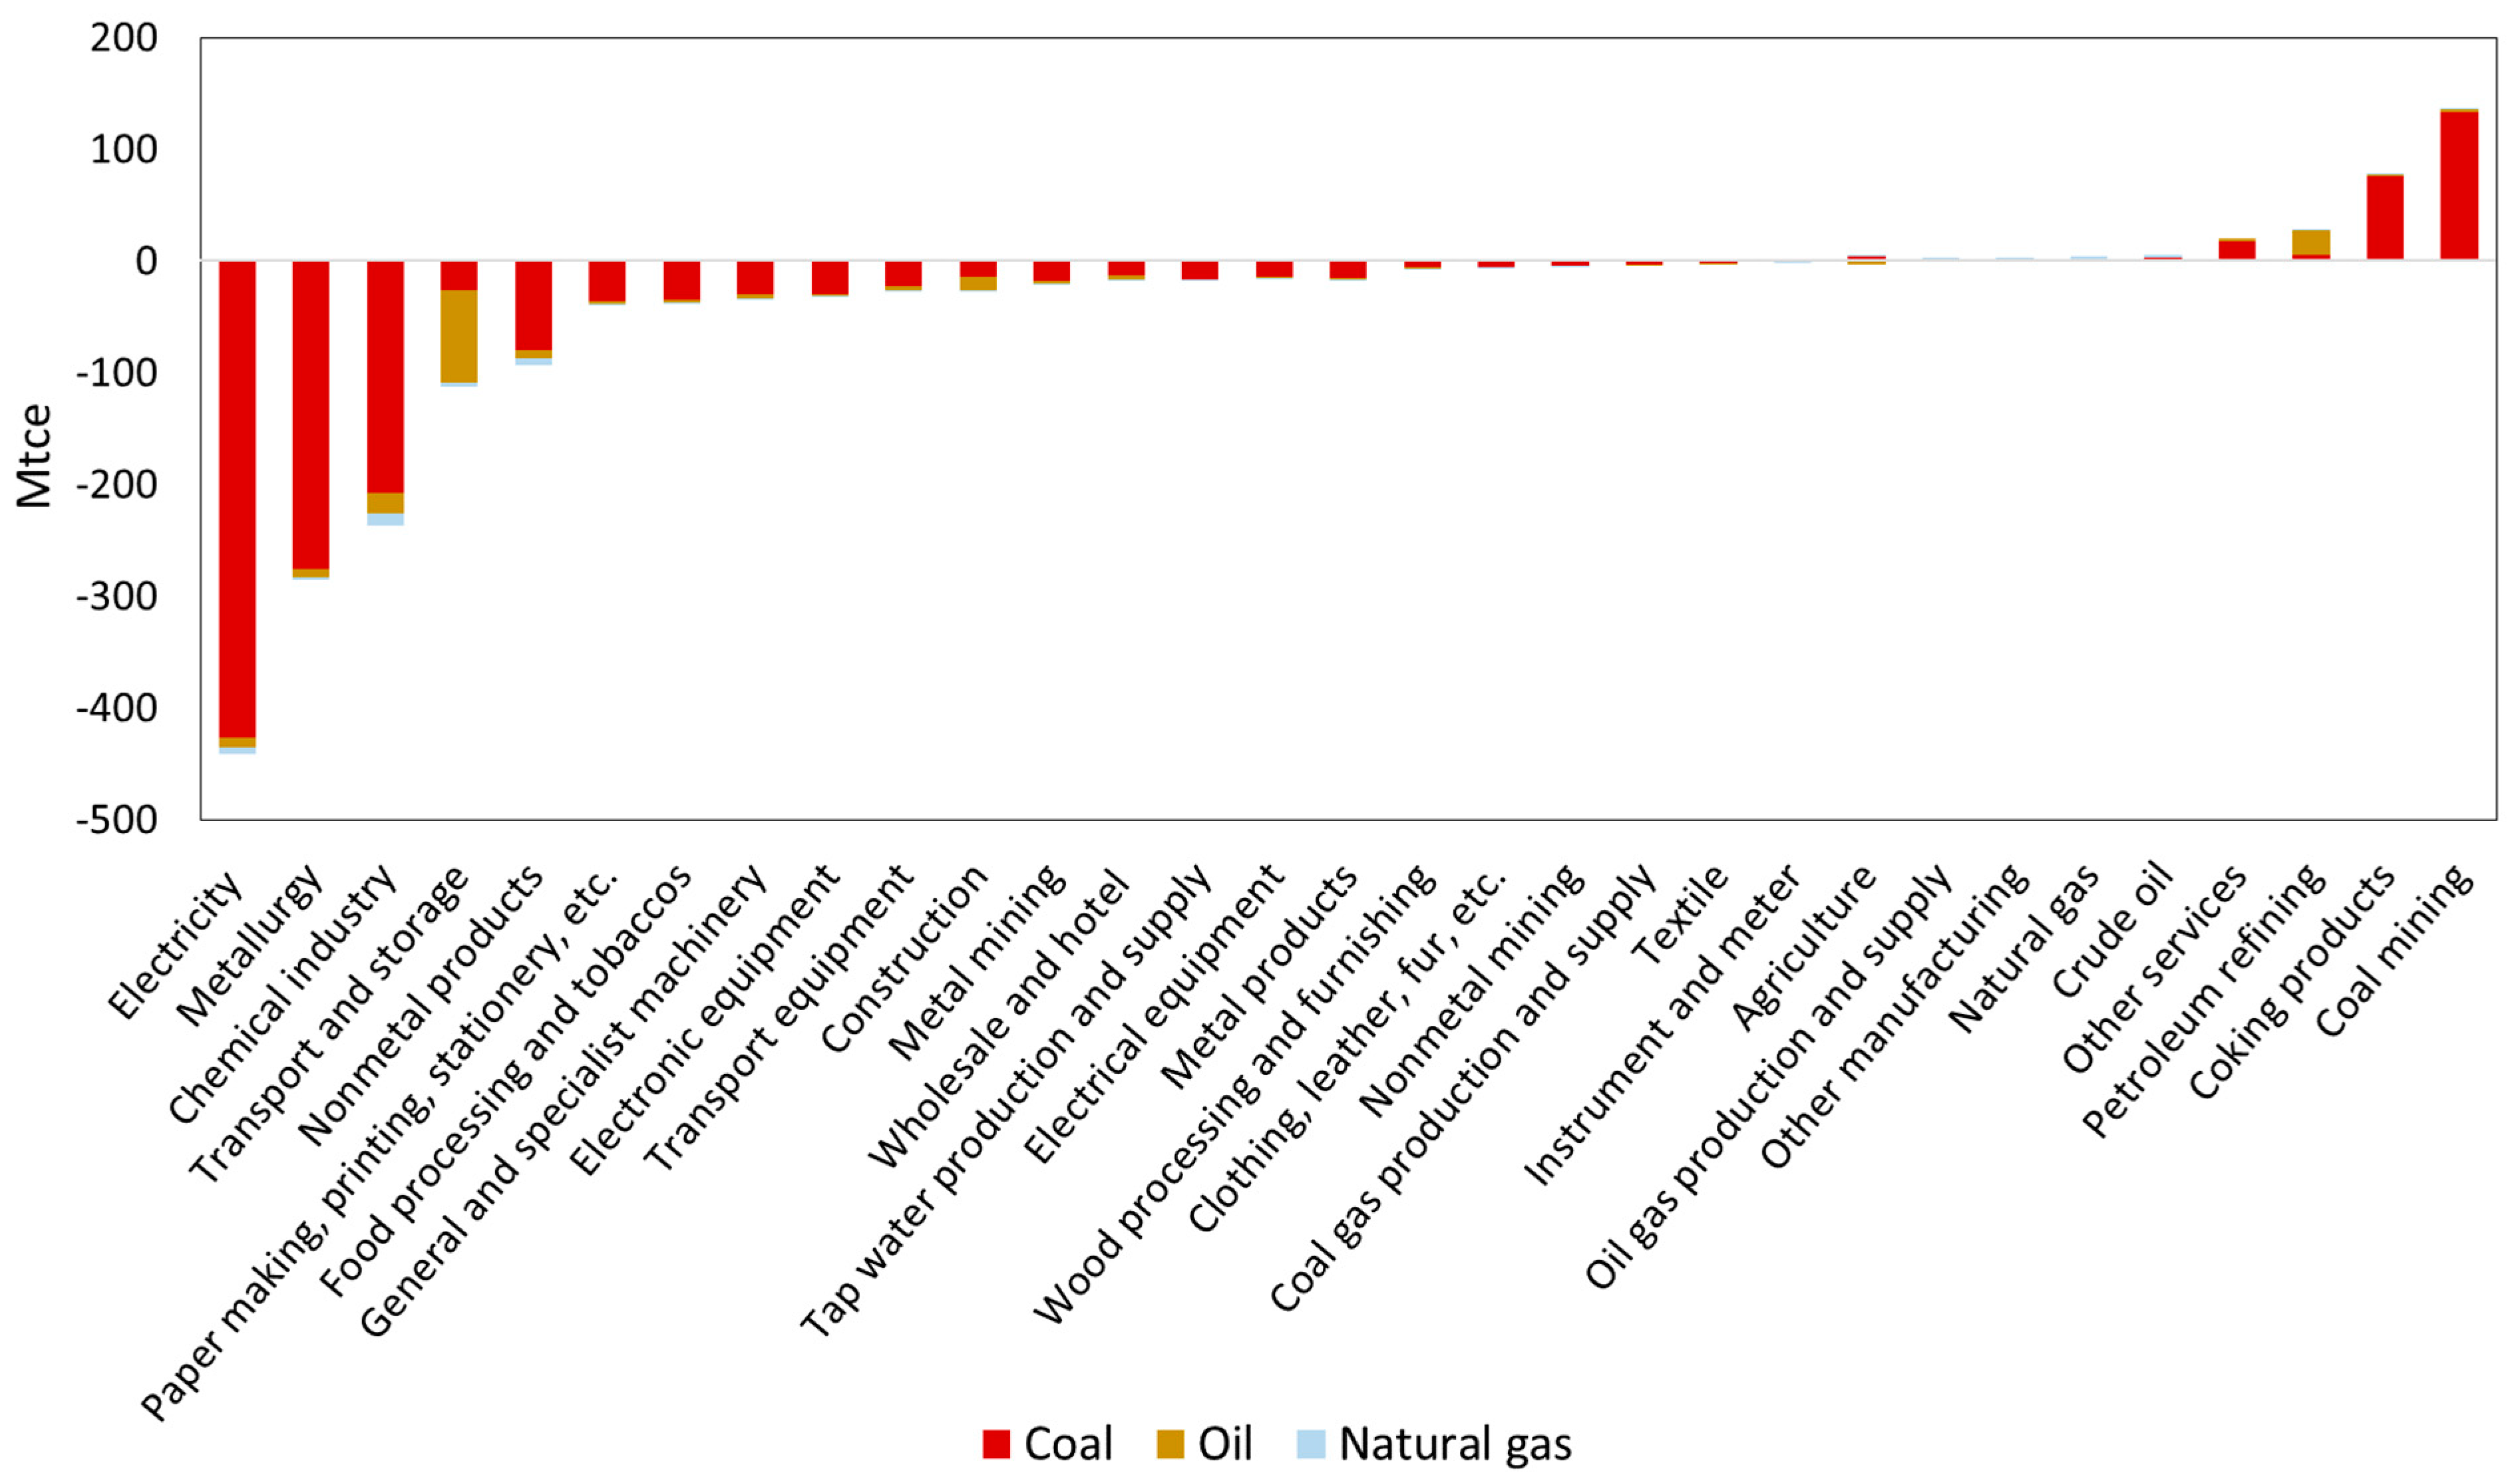
We computed the aggregated energy input level effect of each sector by summing the energy input level effect of each sector over 30 provinces. Figure 3 shows that the aggregated energy input level effects of 22 sectors in China contributed to a coal reduction of 1281 Mtce, and the top three sectors were electricity and hot water production and supply (Electricity), metallurgy, and the chemical industry, contributing 71% of that 1281 Mtce coal reduction. The reason lies in the dramatic improvements in the energy efficiencies of these sectors [31,32].
Unfortunately, the other nine sectors had a total rise in coal consumption of 243 Mtce, due to the energy input level effect (Figure 3). Growth in the sectors of coal mining and coking products stand out the most (Figure 3). With the reduction of easy-to-mine and high-quality coal resources, the increasing difficulty in coal mining and the enlarging need of coal refinement promoted unit energy consumption in coal mining [33,34]. As coal and electricity were the main energy types consumed in coal mining, according to matrix C in Equation (13), the unit energy consumption change majorly affected the coal consumption. The installation of environmental protection equipment and the instigation of long-term low-load operation in coking products led to an increase of the unit of energy consumption in this sector [35,36]. For example, wastewater facilities were installed for environment protection, and the unit energy consumption of coking products rose [36]. For the coking facilities, a lower processing amount (a lower load rate) results in a higher allocated unit energy consumption [36]. Coal was the main material for coking. Therefore, the increased unit energy consumption mainly led to coal growth.
Concerning oil consumption, the energy input level effects of 24 sectors acted as drivers to reduce oil by 166 Mtce, with the top sector being transport and storage, which had a reduction of 83 Mtce (Figure 3). The energy input level effect of petroleum refining causing oil use to grow by 23 Mtce cannot be ignored, as this amount was significantly higher than those of the next highest sectors (Figure 3). The increasing share of high-sulfur crude oil and low-load operation owing to excess capacity, induced a unit energy consumption growth in petroleum refining [37,38]. High-sulfur crude oil not only increased the processing difficulty of refineries, but also expanded the scale of environmental protection facilities, such as desulfurization [39]. As a result, the unit energy consumption of refineries increased, which led to oil growth, because oil was the main raw material of refineries. In addition, the energy input level effect on natural gas use change was quite small (Figure 3).
Subsequently, we ranked the disaggregated energy input level effects of 31 sectors of 30 provinces; the top ten and the bottom ten are listed in Figure 4. The coking products of Shanxi had the most energy growth among the 930 contributors (31 sectors × 30 provinces), at 58 Mtce (Figure 4). From the bottom ten, we were surprised to find that the energy input level effect of electricity was positive at 47 and 20 Mtce in Inner Mongolia and Shanxi, respectively, even though the local governments announced an update of equipment at the power stations during the study period [40]. The problems of these sectors lie in the fact that the low-load operation of power generation units, as well as the poor equipment management levels in Inner Mongolia and Shanxi, resulted in the ineffectiveness of the power generating units with large capacities and a high parameter [41,42,43]. The other contributors of the bottom ten were mainly related to coking products, coal mining, and petroleum refining, as expected (Figure 4).
Accordingly, further energy efficiency improvement in electricity, the chemical industry, metallurgy, coal mining, coking products, transport and storage, and petroleum refining would dramatically reduce energy use. However, the fact is that, by 2017, when these sectors encountered excess capacity, some of the technologies of sectors such as electricity, the chemical industry, metallurgy, and coking products were already close to or at the advanced level in the world [31,32]. That being the case, what counts is not replacing the equipment frequently, but promoting an energy saving approach under a low-load operation, and phasing out inferior production capacities. As for other sectors, such as coal mining and petroleum refining, both the lag in technology and the over-capacity should be addressed.
4.2.2. Energy Composition Effect
A positive energy composition effect means increasing fossil energy consumptions through energy mix changes. It should be noted that even if the energy input level effect of the specific sector is negative as a result of the decreasing energy intensity as defined by the diagonal element of the matrix E, the fossil energy consumptions of China may increase as a result of the energy composition change of the sector. Specifically, the energy composition effects of electricity and the chemical industry distinctly stimulated the energy growth (Figure 5), although the most significant energy saving was due to the energy input level effects of the two sectors (Figure 3).
As for electricity, the energy composition effect caused fossil energy growth by 60 Mtce. Therein, the coal consumption increased by 76 Mtce, while the oil and natural gas went down by 16 and 0.5 Mtce (Figure 5). As for the chemical industry, the energy composition effect was positive at 30 Mtce. The coal consumption grew by 34 Mtce, with oil consumption and natural gas decreasing by 3 and 1 Mtce, respectively (Figure 5). The matrix ∆C in Equation (17) gives us the source of the energy composition effect of a specific sector of a specific province. First of all, the increased coal and electricity proportion in the energy input promoted coal growth. Secondly, fuel oil saving at coal plants made the proportion of oil consumption for electricity, which was already the smallest, even smaller [44,45]. Policy factors [46] and the price disadvantage of oil impeded the use of oil as a material in the chemical industry [47]. Thirdly, an increasing natural gas price and tight natural gas supply hindered the application of natural gas for both electricity and the chemical industry [48,49]. In addition, the Natural Gas Utilization Policy set selective restrictions on natural gas use for electricity and the chemical industry [47,50]. The factors described above influenced the energy structure for electricity and the chemical industry.
Figure 6 shows the top ten and the bottom ten sectors regarding the disaggregated energy composition effects of 31 sectors of 30 provinces. We found that the energy composition effect of metallurgy, which ranked second among the top ten for energy saving related to the energy input level effect, also had a clear impact on energy use, although the aggregated energy composition effect was negligible at −0.5 Mtce (Figure 5). Here, the energy composition effects of metallurgy of Liaoning, Jiangxi, Shanxi, and Hunan, ranked in the bottom ten for energy saving, triggering a fossil energy growth of 44 Mtce in total, due to the increased proportion of coking products’ input to metallurgy in these provinces (Figure 6). However, the energy composition effects of five of the provinces ranking in the top ten helped to reduce fossil energy by 37 Mtce (Figure 6), because the secondary energy (coke oven gas, converter gas, etc.) recovery improvement substantially reduced the coal proportion in the metallurgy of these provinces [51]. In addition, the other growth in the bottom ten was related to electricity, the chemical industry, and coking products, as expected (Figure 6).
We found that, compared with the other sectors, the energy composition effects of electricity, the chemical industry, and metallurgy noticeably impacted the fossil energy-use change, especially coal use change. The large coal fraction in the change was because the energy composition change was mainly impacted by a coal-related technology change and a growing electricity share. If electricity generation remains dominated by coal, the wide application of electricity in end-use will trigger more coal consumption, like the coal growth from the chemical industry related to the energy composition effect. Thus, the energy input mix low-carbonization of electricity fundamentally plays an important and beneficial role in the changes in China’s primary energy structure. In addition, the significant natural gas growth from the energy composition effect that we expected did not appear in the individual sectors of the individual provinces, as a result of a natural gas supply shortage and price increases. Thus, ensuring the natural gas supply and reasonable prices are key to the development of natural gas.
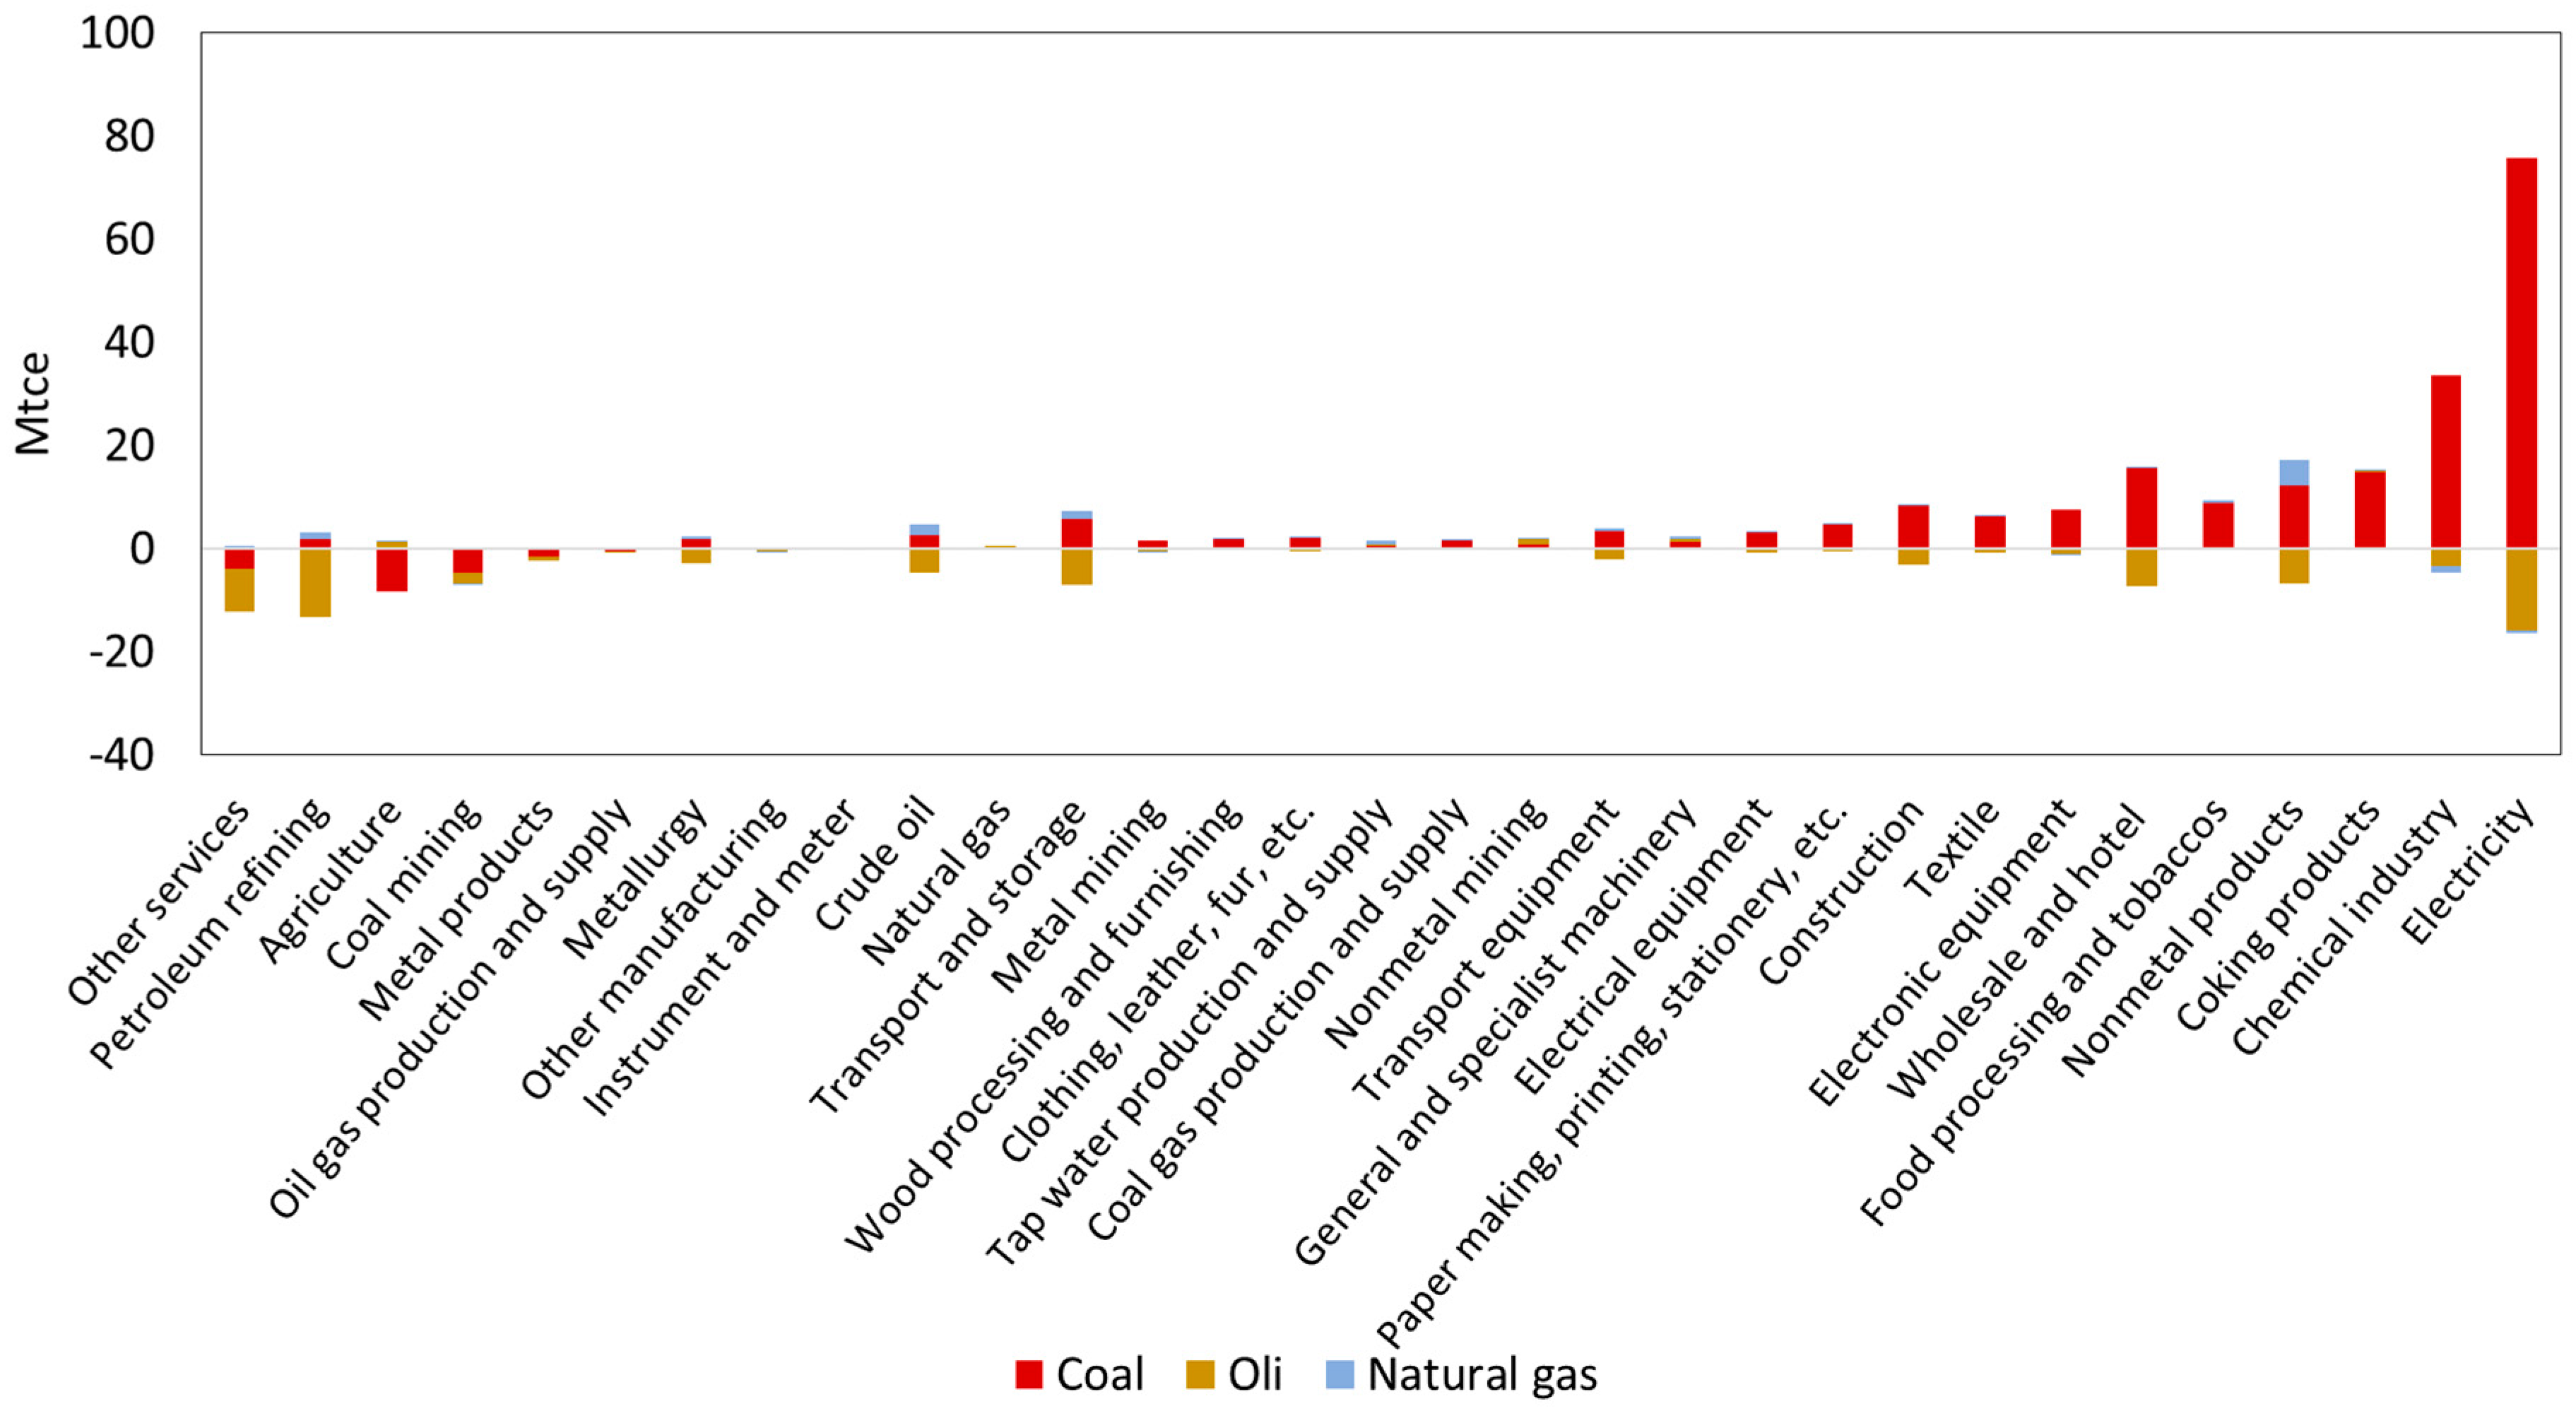
4.2.3. Non-Energy Input Effect
Figure 7 shows that the aggregated non-energy input effect of 24 sectors contributed to fossil energy growth. Note that the non-energy input effects of electricity, metallurgy, and the chemical industry weakened their energy savings related to the energy input level effect. The non-energy input effects of the chemical industry and metallurgy generated noticeable fossil energy growth at 65 and 34 Mtce, respectively, although that of electricity was insignificant at 7 Mtce (Figure 7). Thus, the −441 Mtce energy input level effect of electricity was offset by 68 Mtce, as a result of the energy growth from the energy composition effect and the non-energy input effect, resulting in a −373 Mtce of a combined effect from the three factors (i.e., the technology effect). Similarly, the −286 Mtce energy input level effect of metallurgy was offset by 34 Mtce, leading to a −252 Mtce technology effect. The −237 Mtce energy input level effect of the chemical industry was offset by 94 Mtce, generating a −143 Mtce technology effect overall.
In addition to the above, the non-energy input effect of construction triggered the most significant energy growth, leading the fossil energy to increase by 123 Mtce (Figure 7). The other consequential sectors that contributed to energy growth were coal mining and electronic equipment (Figure 7). From in Equation (16), we found that the energy growth induced by the non-energy input effect of construction and metallurgy mainly came from the increased metallurgy products’ input. Similarly, the growing chemical industry products input and electronic equipment input were mainly responsible for the energy growth of the chemical industry and the electronic equipment related to the non-energy input effect, respectively. Particularly, the principal input factor that was responsible for the fossil energy growth from the non-energy input effect of coal mining varied province by province, but mainly included growth in the chemical industry products, metallurgy products, electrical equipment, and general and specialist machinery input in the sector of coal mining.
Figure 8 shows the most influential disaggregated contributors to energy-use related to the non-energy input effect. The energy growth generated from the non-energy input effect of coal mining in Shanxi was the highest, mainly owning to the growing metallurgy products input (Figure 8). The other contributors in the bottom ten were related to construction, metallurgy, the chemical industry, and electronic equipment, not surprisingly (Figure 8).
We consider that reducing the non-energy input should be taken seriously. Metallurgy products’ utilization in construction, metallurgy, and coal mining; chemical industry products’ utilization in the chemical industry; and electronic equipment products’ utilization in electronic equipment should be given priority attention in order to save energy indirectly.
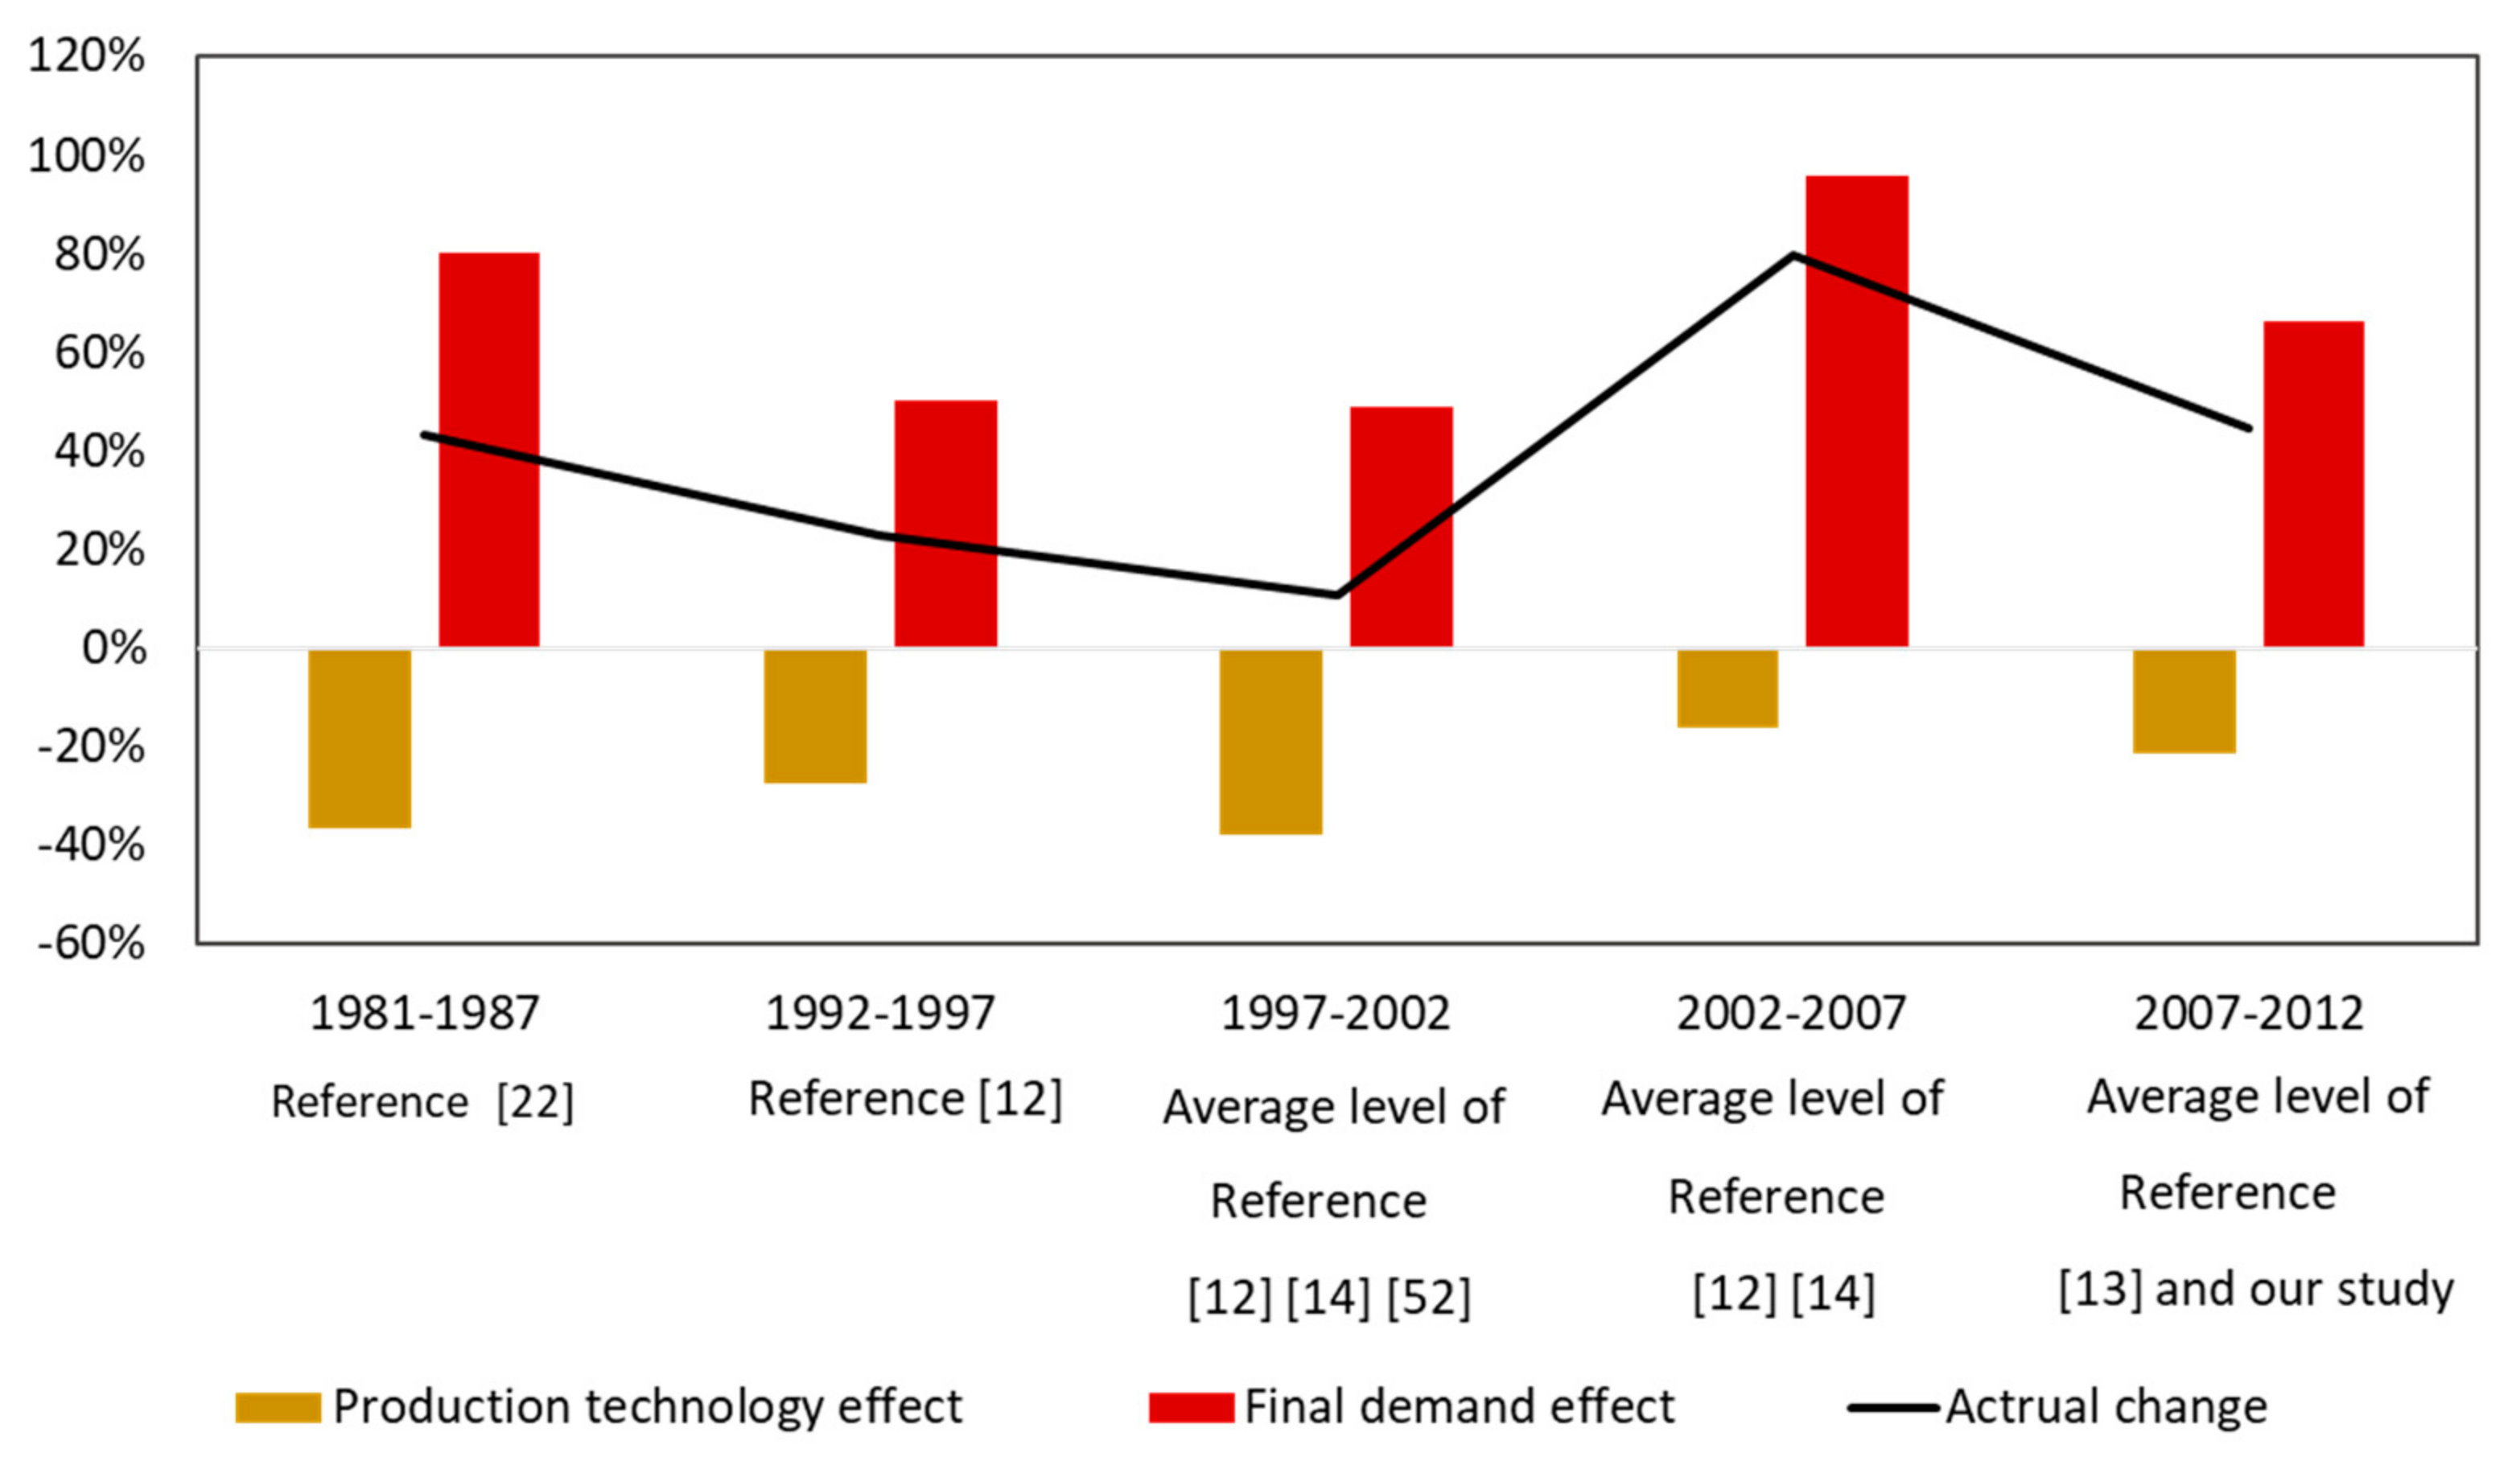
4.3. Analysis Combining the Present and Previous Studies
We collected five seminal peer-reviewed articles [12,13,14,22,52] relevant to our research, and classified the driving forces behind China’s energy-use change into a production technology effect, and a final demand effect. We computed the “average” decomposition effects of different studies in the same period, and Figure 9 shows the percentage contribution of each driving factor to China’s energy-use change during the specific five-year period. Importantly, we found that the energy saving effect of the production technology was weaker between 2002 and 2012 than between 1981 and 2002. If the production technology effect becomes smaller over time, then the climate mitigation goal of China will probably not be achieved because of the expanding final demand of goods and services in China (see the larger final demand effects in Figure 9).
5. Conclusions and Policy Implication
The main conclusions are summarized as follows:
Between 2007 and 2012, technology changes affected fossil energy consumption in China in three aspects. The energy input level effect was the most influential factor offsetting the primary fossil energy growth, by 1205 Mtce, in China. Unfortunately, although the energy composition effect saved 79 Mtce of oil, it promoted coal and natural gas growth by 198 and 12 Mtce, respectively, ultimately resulting in an energy growth of 131 Mtce. The non-energy input effect indirectly caused the fossil energy consumption to increase by 389 Mtce.
The role of the energy input level effect was in opposition to the energy composition and non-energy input effects in most sectors. The energy input level effects of electricity, metallurgy, and the chemical industry stood out the most at −936 Mtce in total, but the noteworthy energy composition effects and non-energy input effects of the three sectors weakened the energy input level effect, triggering a fossil energy growth of 194 Mtce.
The other main sources of energy growth were as follows. For the energy input level effect, coal mining, coking products, and petroleum refining were the primary source sectors promoting energy growth, by 243 Mtce overall. For the non-energy input effect, construction, coal mining, and electronic equipment generated energy growths of 198 Mtce overall.
We suggest that the energy growth of the important stakeholder sectors identified in this study should be given a higher priority of attention by policy makers.
Given the tougher climate challenges facing all countries, we propose the following policy, based on our analysis, for further energy conservation in China. The energy inputs of the contributors listed in Table 1 should be the main monitoring points for energy saving. Annual reports for the main monitoring points should be compiled by the relevant governments. We also suggest that this contributors list be updated every five years for dynamic monitoring of the major sources of energy growth related to technology change. Therefore, the focus of technology improvement for further fossil energy saving should always be clear.
Supplementary Materials
The following are available online at https://www.mdpi.com/1996-1073/12/4/699/s1, Table S1: Results of industrial sectors classification, Table S2: Energy grouping, Table S3: Price deflaters for sectors, Table S4: Abbreviation of each province, method S1: Decomposition of the changes in the imported energy of China during 2007 to 2012, method S2: Constructing hybrid MRIO tables of China.
Author Contributions
S.K. and Y.H. designed the research and developed the method. Y.H. and F.N. analyzed the data. Y.H. wrote the manuscript with inputs from all authors.
Funding
This research was funded by the Grant-in-Aid for Grant-in-Aid for Scientific Research (A) [16H01797].
Acknowledgments
We are grateful to the two anonymous referees for their helpful comments and suggestions. We also sincerely appreciate the support from the China Scholarship Council. All errors are our own.
Conflicts of Interest
The authors declare no conflict of interest.
References
- Sher, F.; Pans, M.A.; Sun, C.; Snape, C.; Liu, H. Oxy-fuel combustion study of biomass fuels in a 20 kWth fluidized bed combustor. Fuel 2018, 215, 778–786. [Google Scholar] [CrossRef]
- Sher, F.; Pans, M.A.; Afilaka, D.T.; Sun, C.; Liu, H. Experimental investigation of woody and non-woody biomass combustion in a bubbling fluidised bed combustor focusing on gaseous emissions and temperature profiles. Energy 2017, 141, 2069–2080. [Google Scholar] [CrossRef]
- NDRC (China National Development and Reform Commission). Revolutionary Strategy for Energy Production and Consumption (2016–2030); NDRC: Beijing, China, 2016.
- IPCC (Intergovernmental Panel on Climate Change). Global Warming of 1.5 °C; IPCC: Geneva, Switzerland, 2018. [Google Scholar]
- Su, B.; Ang, B.W. Structural decomposition analysis applied to energy and emissions: Some methodological developments. Energy Econ. 2012, 34, 177–188. [Google Scholar] [CrossRef]
- Lenzen, M. Structural analyses of energy use and carbon emissions—An overview. Econ. Syst. Res. 2016, 28, 119–132. [Google Scholar] [CrossRef]
- Weber, C.L. Measuring structural change and energy use: Decomposition of the US economy from 1997 to 2002. Energy Policy 2009, 101, 115–126. [Google Scholar] [CrossRef]
- Cellura, M.; Longo, S.; Mistretta, M. Application of the Structural Decomposition Analysis to assess the indirect energy consumption and air emission changes related to Italian households consumption. Renew. Sustain. Energy Rev. 2012, 16, 1135–1145. [Google Scholar] [CrossRef]
- Kagawa, S.; Inamura, H. A structural decomposition of energy consumption based on a hybrid rectangular input-output framework: Japan’s case. Econ. Syst. Res. 2001, 13, 339–364. [Google Scholar] [CrossRef]
- Wachsmann, U.; Wood, R.; Lenzen, M.; Schaeffer, R. Structural decomposition of energy use in Brazil from 1970 to 1996. Appl. Energy 2009, 86, 578–587. [Google Scholar] [CrossRef]
- BP. Statistical Review of World Energy; BP: London, UK, 2018. [Google Scholar]
- Xie, S.C. The driving forces of China’s energy use from 1992 to 2010: An empirical study of input-output and structural decomposition analysis. Energy Policy 2014, 73, 401–415. [Google Scholar] [CrossRef]
- Mi, Z.; Li, Z.; Meng, J.; Shan, Y.; Zheng, H.; Ou, J.; Guan, D.; Wei, Y. China’s Energy Consumption in the New Normal. Earth’s Future 2018, 6, 1007–1016. [Google Scholar] [CrossRef]
- Zhang, H.; Lahr, M.L. China’s energy consumption change from 1987 to 2007: A multi-regional structural decomposition analysis. Energy Policy 2014, 67, 682–693. [Google Scholar] [CrossRef]
- Zhang, B.; Qiao, H.; Chen, Z.M.; Chen, B. Growth in embodied energy transfers via China’s domestic trade: Evidence from multi-regional input–output analysis. Appl. Energy 2016, 184, 1093–1105. [Google Scholar] [CrossRef]
- Dietzenbacher, E.; Stage, J. Mixing oil and water? Using hybrid input-output tables in a structural decomposition analysis. Econ. Syst. Res. 2006, 18, 85–95. [Google Scholar] [CrossRef]
- Miller, R.E.; Blair, P.D. Input-Output Analysis: Foundations and Extensions, 2nd ed.; Cambridge University Press: Cambridge, UK, 2009; ISBN 9780511626982. [Google Scholar]
- Weinzettel, J.; Steen-Olsen, K.; Hertwich, E.G.; Borucke, M.; Galli, A. Ecological footprint of nations: Comparison of process analysis, and standard and hybrid multiregional input-output analysis. Ecol. Econ. 2014, 101, 115–126. [Google Scholar] [CrossRef]
- NBS (China National Bureau of Statistics). Total Consumption of Energy and Its Composition. Available online: http://www.stats.gov.cn/tjsj/ndsj/2018/indexeh.htm (accessed on 23 December 2018).
- Hoekstra, R.; Van Den Bergh, J.C.J.M. Structural decomposition analysis of physical flows in the economy. Environ. Resour. Econ. 2002, 23, 357–378. [Google Scholar] [CrossRef]
- Dietzenbacher, E.; Los, B. Structural Decomposition Techniques: Sense and Sensitivity. Econ. Syst. Res. 1998, 10, 307–324. [Google Scholar] [CrossRef]
- Lin, X.; Polenske, K.R. Input-Output Anatomy of China’s Energy Use Changes in the 1980s. Econ. Syst. Res. 1995, 7, 67–84. [Google Scholar] [CrossRef]
- Mi, Z.; Meng, J.; Guan, D.; Shan, Y.; Song, M.; Wei, Y.-M.; Liu, Z.; Hubacek, K. Chinese CO2 emission flows have reversed since the global financial crisis. Nat. Commun. 2017, 8, 1712. [Google Scholar] [CrossRef]
- Liu, W.; Chen, J.; Tang, Z.; Liu, H.; Han, D.; Li, F. Theories and Practice of Constructing China’s Interregional Input-Output Tables between 30 Provinces in 2007; China Statistics Press: Beijing, China, 2012.
- CEADs (China Emission Accounts and Datasets). Provincial Energy Inventory. Available online: http://www.ceads.net/data/energy-inventory/ (accessed on 19 February 2019).
- NBS (China National Bureau of Statistics). Regional energy balance sheet. In China Energy Statistics Yearbook; China Statistics Press: Beijing, China, 2013. [Google Scholar]
- NBS (China National Bureau of Statistics). Regional energy balance sheet of. In China Energy Statistics Yearbook; China Statistics Press: Beijing, China, 2008. [Google Scholar]
- Dietzenbacher, E.; Hoen, A.R. Deflation of input-output tables from the user’s point of view: A heuristic approach. Rev. Income Wealth 1998, 44, 111–122. [Google Scholar] [CrossRef]
- NBS (China National Bureau of Statistics). Price Index. Available online: http://www.stats.gov.cn/tjsj/ndsj/2013/indexch.htm (accessed on 19 February 2019).
- NBS (China National Bureau of Statistics). Price Index. Available online: http://www.stats.gov.cn/tjsj/ndsj/2010/indexch.htm (accessed on 19 February 2019).
- CEC (China Electricity Council). China Coal Power Clean Development Report; CEC: Beijing, China, 2017. [Google Scholar]
- RITE (The Research Institute of Innovative Technology for the Earth). Estimation of Energy Consumption per unit in 2015 (Steel Department-Converter Steel); RITE: Kyoto, Japan, 2015. [Google Scholar]
- Gu, Y.; Yu, W.; Ma, X. Comparative study on current situation of coal preparation and policy at home and abroad. Coal Prep. Technol. 2012, 4, 110–116. [Google Scholar]
- Guan, X. Study on Reinforcement Design for Open-Pit Slope under the Underground Mining. Master’s Thesis, Qingdao Technological University, Qingdao, China, 2010. [Google Scholar]
- Wu, D.; Zhang, T.; Zhao, Z. Private Enterprises in Shanxi Coking Explore Energy Conversation Issues. Sci. Technol. Ind. 2010, 10, 67–71. [Google Scholar]
- Wang, M.; Deng, S.; Jiang, Y.; Xiong, C.; Song, H. 12th 5 year Energy Saving Study of Coke Industry in Shanxi Province. Shanxi Energy Conserv. 2010, 5, 57–60. [Google Scholar]
- Wang, M. Discussions on Energy Saving Measures for Continuous Catalytic Reforming Unit at Low Load. Qilu Petrochem. Technol. 2009, 37, 1–3. [Google Scholar]
- NPCPI (China National Petroleum and Chemical Planning Institute). Current Situation and Development Suggestion of Refining Industry in China; NPCPI: Beijing, China, 2013. [Google Scholar]
- Zhuang, J.; Hou, K.; Yan, C.; Li, Z. Energy Consumption and Analysis on Energy Saving Measures at SINOPEC’s Large Refineries. China Pet. Process. Petrochem. Technol. 2007, 3, 1–8. [Google Scholar]
- The People’s Government of Shanxi. The 12th Five-Year Plan of Shanxi Electric Power Industry Development; The People’s Government of Shanxi: Taiyuan, China, 2012.
- Ma, Y. Analysis on development of thermal power industry in Inner Mongolia Autonomous Region. Dev. Environ. 2017, 10, 14. [Google Scholar]
- Liu, G.; Jiang, X.; Li, Z. Investigation on Affects of Generation Load on Coal Consumption Rate in Fossil Power Plant. Power Syst. Eng. 2008, 24, 47–49. [Google Scholar]
- Shi, X.; Wang, X.; Pang, L. A survey of coal-fired power generation in Shanxi. Shanxi Electr. Power 2015, 6, 51–54. [Google Scholar]
- World Bank. Electricity Production from Oil Sources. Available online: https://data.worldbank.org.cn/indicator/EG.ELC.PETR.ZS?locations=CN (accessed on 15 November 2018).
- NEA (China National Energy Administration). Development Status of Key Technologies for Energy Conservation in China’s Power Industry. Available online: http://www.nea.gov.cn/2012-01/12/c_131355690_2.htm (accessed on 15 November 2018).
- NDRC (China National Development and Reform Commission). China’s Energy 11th 5-Year Plan; NDRC: Beijing, China, 2007.
- EIA (U.S. Energy Information Administration). Spot Prices. Available online: https://www.eia.gov/dnav/pet/pet_pri_spt_s1_d.htm (accessed on 15 November 2018).
- Ren, H. Future Development Situation Analysis of Natural Gas Power Industry. East China Electr. Power 2014, 42, 1457–1459. [Google Scholar]
- Wang, S.; Ran, W.; Chen, F. Discuss on the energy-saving measures of low-load operation of natural gas purification device. Pet. Nat. Gas Chem. Ind. 2013, 42, 447–456. [Google Scholar]
- NDRC (China National Development and Reform Commission). Natural Gas Utilization Policy; NDRC: Beijing, China, 2007.
- MPI (China Metallurgical Industry Planning and Research Institute). Review of 11th five year and prospect 12th five year development of circular economy in China’s iron and steel industry. Metall. Econ. Manag. 2012, 2, 8–12. [Google Scholar]
- Liang, J.; Zheng, W.; Cai, J. The decomposition of Energy consumption growth in China based on input-output model. J. Nat. Resour. 2007, 22, 853–864. [Google Scholar]
Figure 1.
Total primary fossil energy consumed in China in 2007 and 2012.
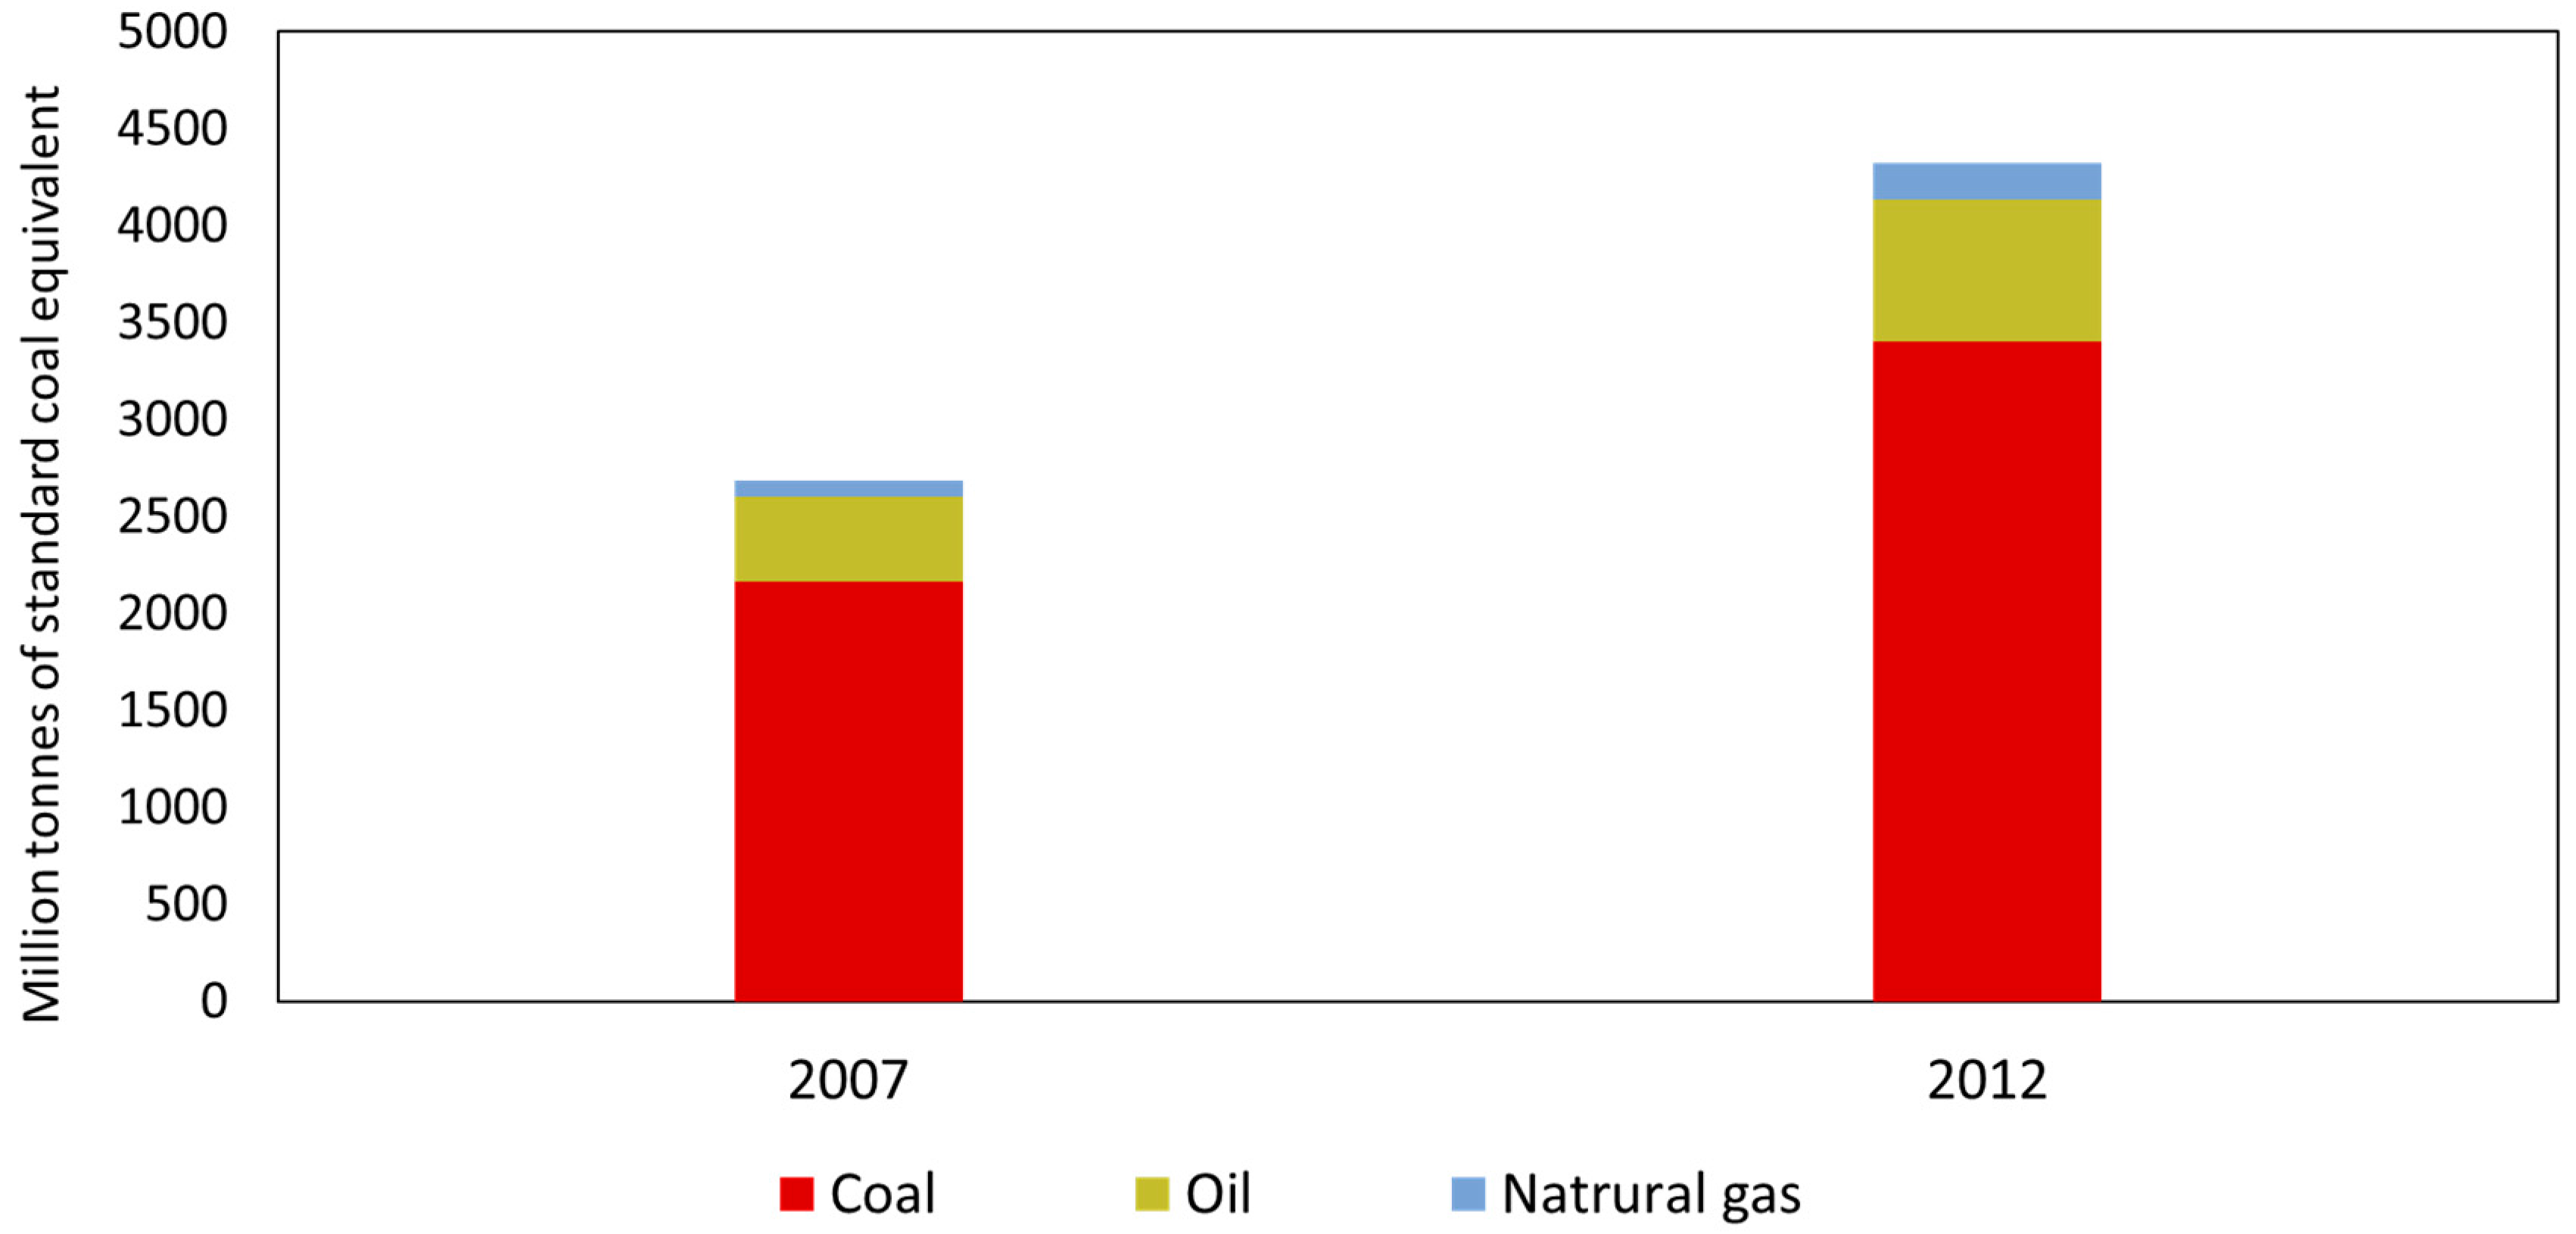
Figure 2.
Nationwide structural decomposition analysis (SDA) for each fossil-energy type in China.

Figure 3.
Energy input level effect by sector.

Figure 4.
Top ten and bottom ten contributors for energy saving related to energy input level effect. SD: Shandong; JL: Jilin; IM: Inner Mongolia; HB: Hebei; LN: Liaoning; HN: Henan; GD: Guangdong; ZJ: Zhejiang; JX: Jiangxi; SX: Shanxi; SH: Shanghai; XJ: Xinjiang.
Figure 4.
Top ten and bottom ten contributors for energy saving related to energy input level effect. SD: Shandong; JL: Jilin; IM: Inner Mongolia; HB: Hebei; LN: Liaoning; HN: Henan; GD: Guangdong; ZJ: Zhejiang; JX: Jiangxi; SX: Shanxi; SH: Shanghai; XJ: Xinjiang.

Figure 5.
Energy composition effect by sector.

Figure 6.
Top ten and bottom ten contributors for energy saving related to the energy composition effect. SC: Sichuan; HUB: Hubei; GZ: Guizhou; SX: Shanxi; HB: Hebei; JL: Jilin; ZJ: Zhejiang; XJ: Xinjiang; SD: Shandong; HUN: Hunan; JS: Jiangsu; HLJ: Heilongjiang; LN: Liaoning; JX: Jiangxi.
Figure 6.
Top ten and bottom ten contributors for energy saving related to the energy composition effect. SC: Sichuan; HUB: Hubei; GZ: Guizhou; SX: Shanxi; HB: Hebei; JL: Jilin; ZJ: Zhejiang; XJ: Xinjiang; SD: Shandong; HUN: Hunan; JS: Jiangsu; HLJ: Heilongjiang; LN: Liaoning; JX: Jiangxi.
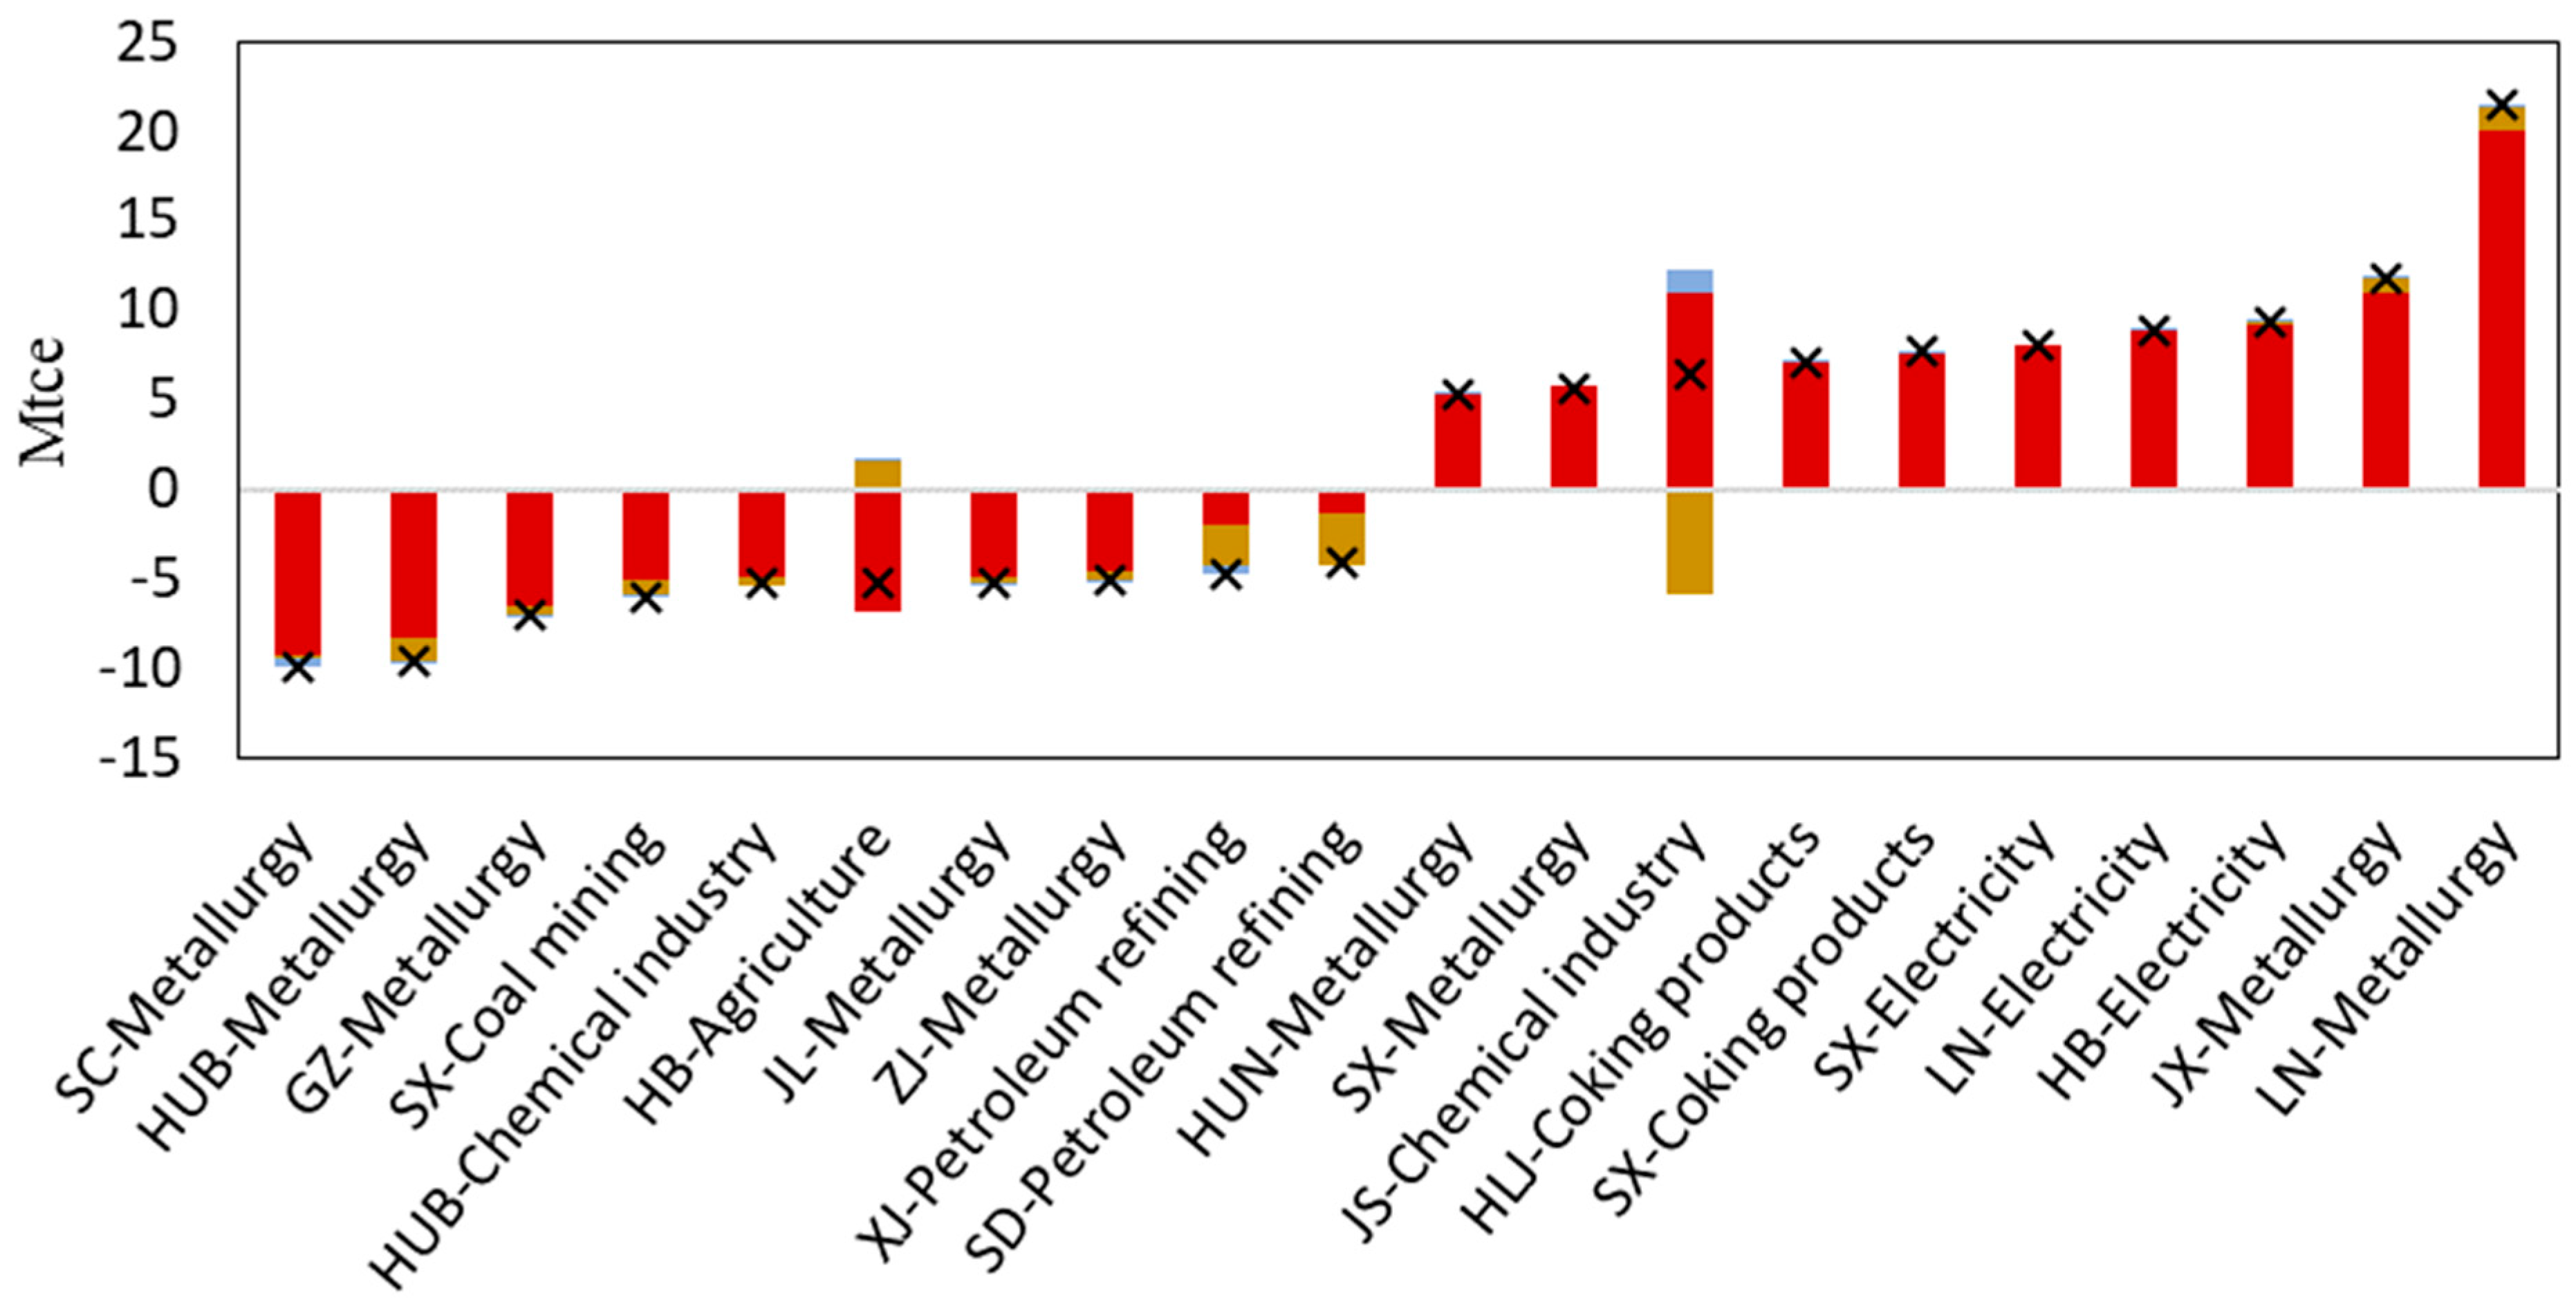
Figure 7.
Non-energy input effect of each sector.
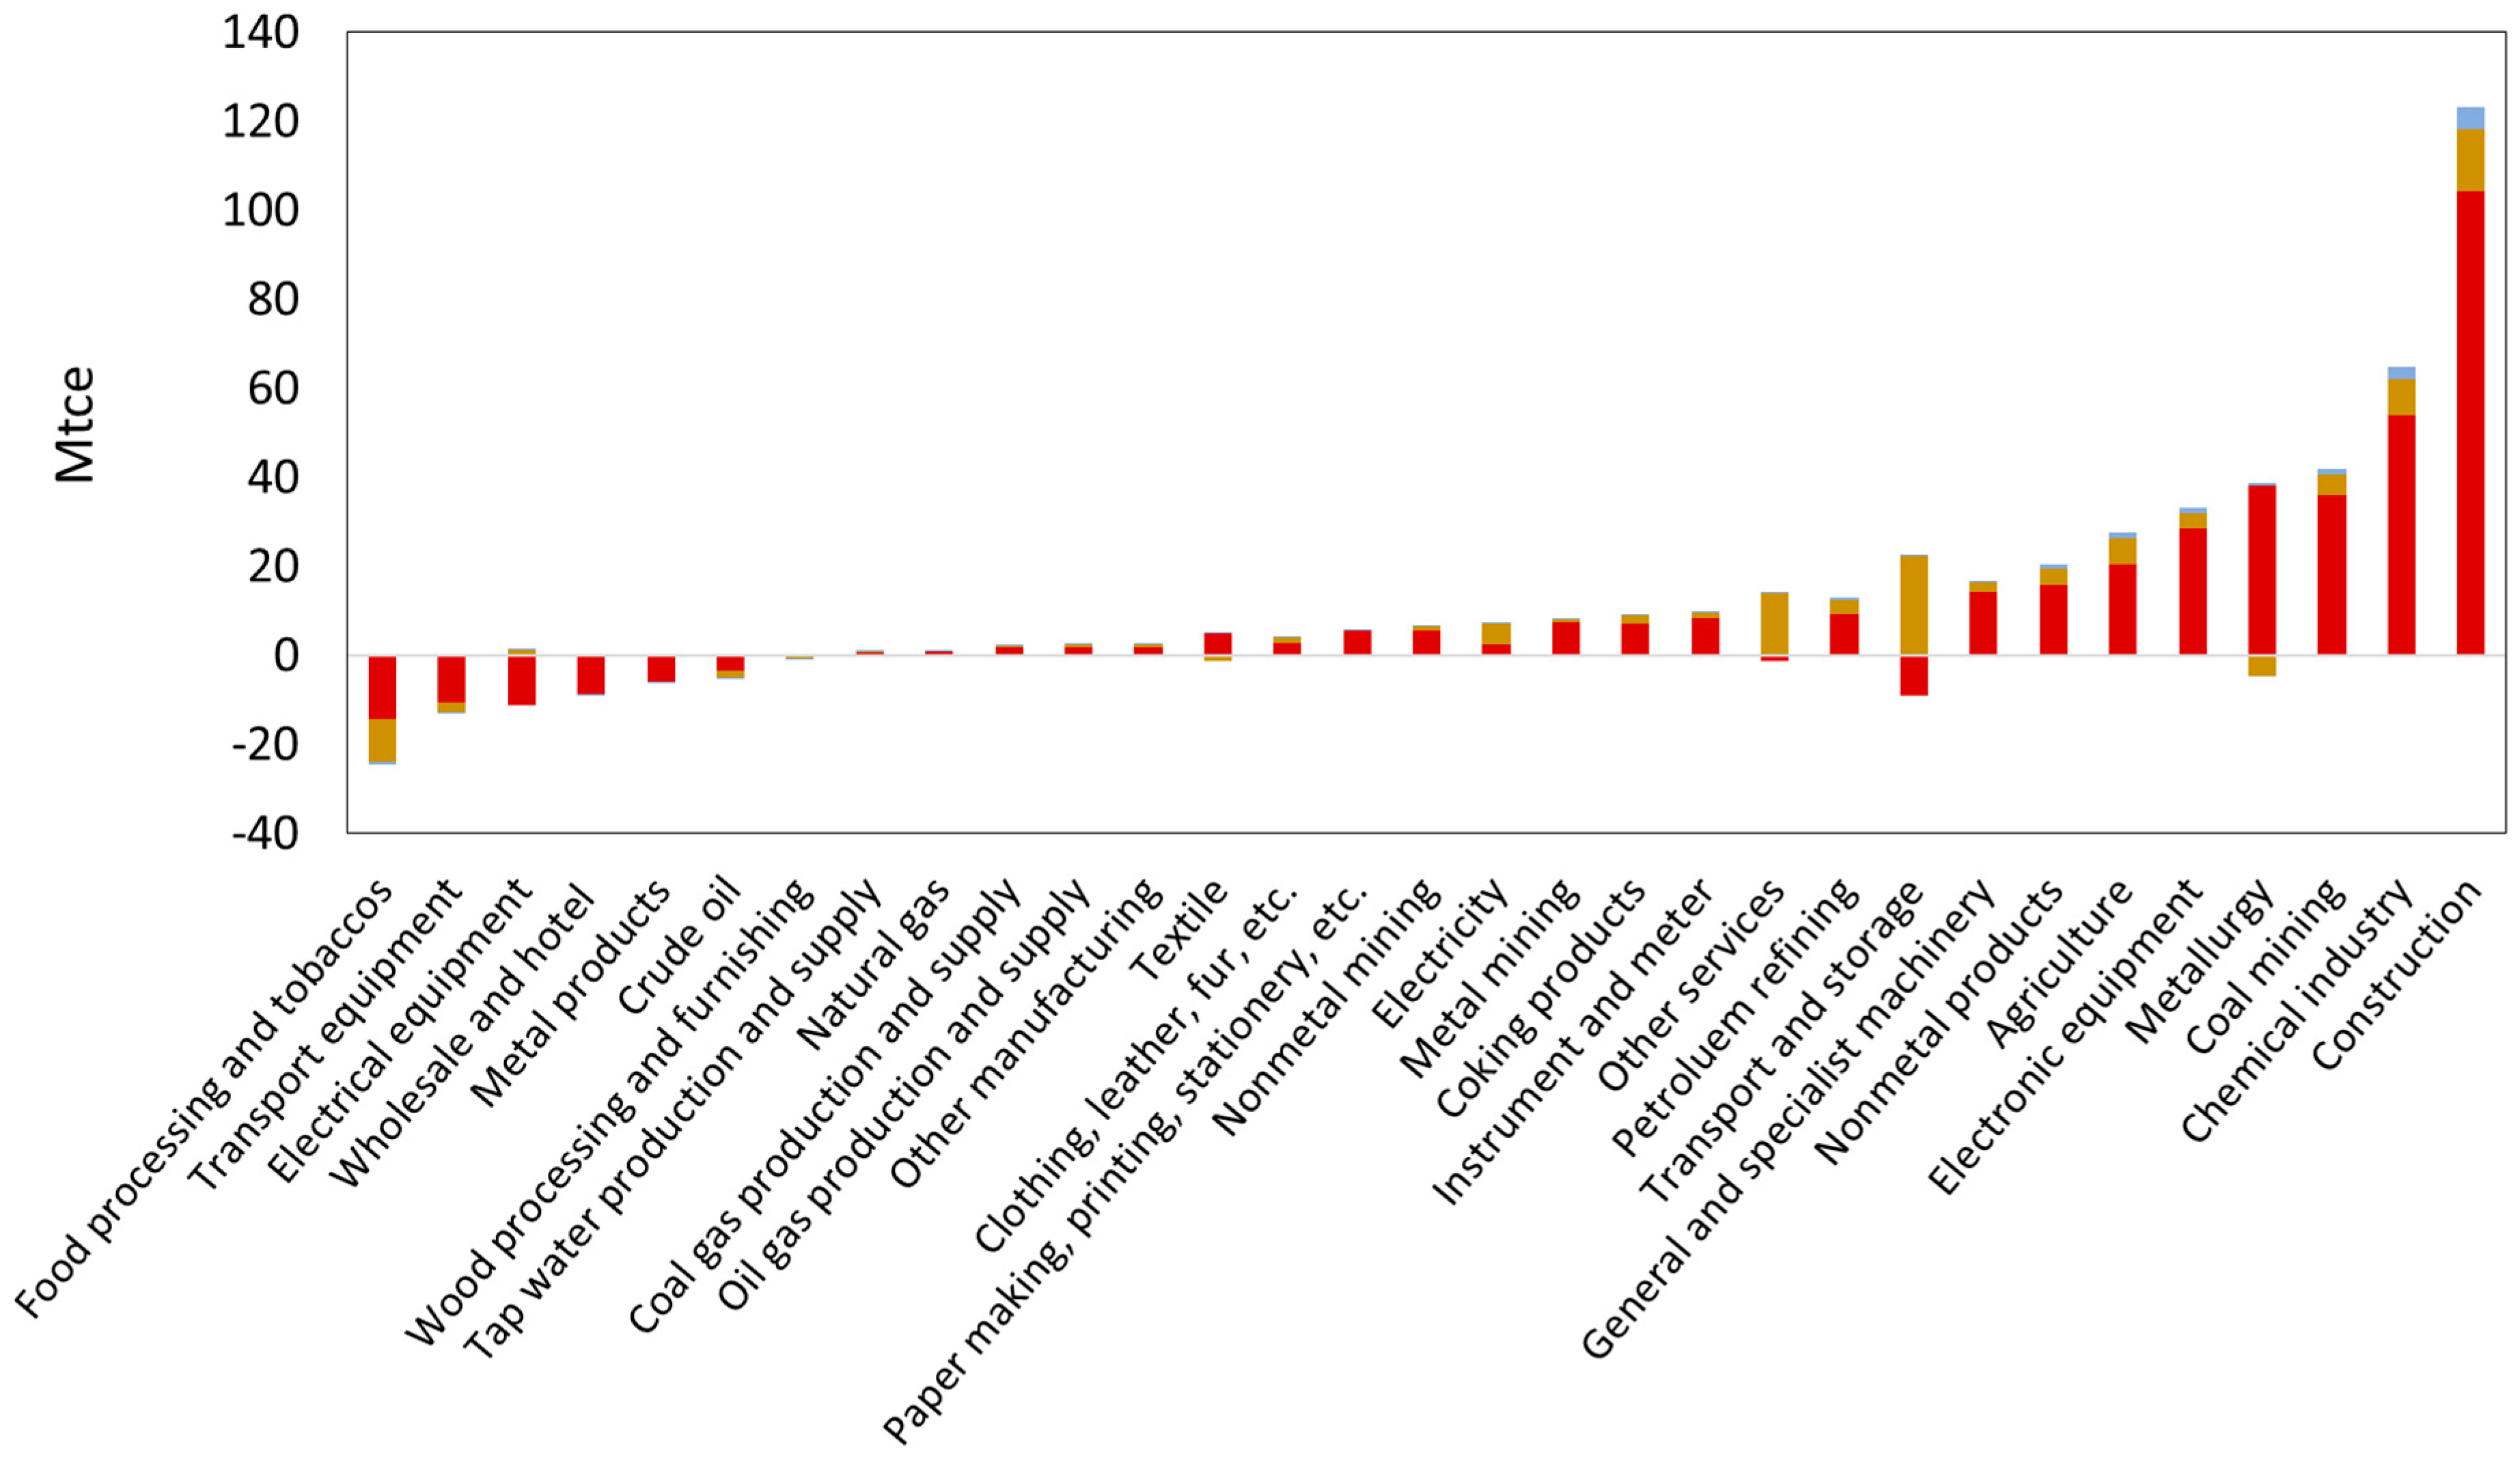
Figure 8.
Top ten and bottom ten contributors for energy saving related to non-energy input effect. JL: Jilin; GD: Guangdong; SX: Shanxi; ZJ: Zhejiang; IM: Inner Mongolia; SD: Shandong; HB: Hebei; LN: Liaoning; CQ: Chongqing; JX: Jiangxi; JS: Jiangsu.
Figure 8.
Top ten and bottom ten contributors for energy saving related to non-energy input effect. JL: Jilin; GD: Guangdong; SX: Shanxi; ZJ: Zhejiang; IM: Inner Mongolia; SD: Shandong; HB: Hebei; LN: Liaoning; CQ: Chongqing; JX: Jiangxi; JS: Jiangsu.

Figure 9.
Energy consumption change from 1981 to 2012.


Table 1.
Main energy growth sources by sector and by province related to technology effects.
| Factor | Source sector | Source province |
|---|---|---|
| Energy level effect | Coking products | Shanxi and Shanghai |
| Coal mining | Shandong and Henan | |
| Petroleum refining | Xinjiang, Shandong and Guangdong | |
| Electricity | Inner Mongolia and Shanxi | |
| Non-metal products | Inner Mongolia | |
| Energy composition effect | Electricity | Hebei, Liaoning, and Shanxi |
| Chemical industry | Jiangsu | |
| Metallurgy | Liaoning, Jiangxi, Hunan, and Shanxi | |
| Coking products | Shanxi, Heilongjiang | |
| Non-energy input effect | Construction | Jiangsu, Hebei, Shanxi, and Chongqing |
| Metallurgy | Jiangsu, Shandong, and Jiangxi | |
| Coal mining | Shanxi | |
| Chemical industry | Shandong | |
| Electronic equipment | Jiangsu |
© 2019 by the authors. Licensee MDPI, Basel, Switzerland. This article is an open access article distributed under the terms and conditions of the Creative Commons Attribution (CC BY) license (http://creativecommons.org/licenses/by/4.0/).
Share and Cite
MDPI and ACS Style
Han, Y.; Kagawa, S.; Nagashima, F.; Nansai, K. Sources of China’s Fossil Energy-Use Change. Energies 2019, 12, 699. https://doi.org/10.3390/en12040699
AMA Style
Han Y, Kagawa S, Nagashima F, Nansai K. Sources of China’s Fossil Energy-Use Change. Energies. 2019; 12(4):699. https://doi.org/10.3390/en12040699
Chicago/Turabian StyleHan, Yawen, Shigemi Kagawa, Fumiya Nagashima, and Keisuke Nansai. 2019. "Sources of China’s Fossil Energy-Use Change" Energies 12, no. 4: 699. https://doi.org/10.3390/en12040699
Note that from the first issue of 2016, this journal uses article numbers instead of page numbers. See further details here.