Effect of Surface Wettability on Immiscible Displacement in a Microfluidic Porous Media


1
Department of Mechanical Engineering, Pontificia Universidade Catolica do Rio de Janeiro, Rio de Janeiro, RJ 22451-900, Brazil
2
Engineering Faculty, Universidad Autónoma de Querétaro, Santiago de Querétaro, Querétaro 76010, Mexico
*
Author to whom correspondence should be addressed.
†
Present address: Instituto Mexicano de Tecnología del Agua, Jiutepec, Morelos 62550, Mexico.
Energies 2019, 12(4), 664; https://doi.org/10.3390/en12040664
Submission received: 9 January 2019
/
Revised: 7 February 2019
/
Accepted: 13 February 2019
/
Published: 19 February 2019
(This article belongs to the Special Issue Enhanced Oil Recovery 2019)
Abstract
:Wettability has a dramatic impact on fluid displacement in porous media. The pore level physics of one liquid being displaced by another is a strong function of the wetting characteristics of the channel walls. However, the quantification of the effect is still not clear. Conflicting data have shown that in some oil displacement experiments in rocks, the volume of trapped oil falls as the porous media becomes less water-wet, while in some microfluidic experiments the volume of residual oil is higher in oil-wet media. The reasons for this discrepancy are not fully understood. In this study, we analyzed oil displacement by water injection in two microfluidic porous media with different wettability characteristics that had capillaries with constrictions. The resulting oil ganglia size distribution at the end of water injection was quantified by image processing. The results show that in the oil-wet porous media, the displacement front was more uniform and the final volume of remaining oil was smaller, with a much smaller number of large oil ganglia and a larger number of small oil ganglia, when compared to the water-wet media.
1. Introduction
Wettability plays a major role in many natural and industrial processes, such as oil recovery, CO2 sequestration, mineral processing, soil mechanics, coating, printing and many others. In the particular case of immiscible liquid displacement in porous media, the wall wettability has a dramatic impact on the efficiency of the displacement process [1,2,3,4].
The effect of wettability on immiscible displacement in porous media is a direct consequence of the complex pore-level physics. The sequence of pore invasion is a direct function of the viscosity ratio between the displaced and invading phases, the ratio of viscous to capillary forces and the wettability of the walls. Moreover, the mechanisms by which one phase displaces the other in a single pore channel, varies as a function of the local flow conditions and wall wettability [5,6,7,8]. The displacement may occur in a piston-like regime, at which one phase is fully pushed by the other, or the displaced liquid may leave a thin film at the wall. The later occurs when the pore space walls are preferentially wetted by the displaced liquid. If the capillary forces are strong enough, the thin film attached to the wall may form a liquid collar and break the displacing phase, in what is called a snap-off [8]. To increase the complexity of oil displacement by water injection in a reservoir, the wettability characteristics are usually not uniform throughout a reservoir rock. Despite the large volume of experimental data, conflicting evidence still exists on the effect of wettability on the efficiency of liquid displacement in porous media.
Experiments on oil displacement by water injection in sandstones with different wettability characteristics at capillary dominated conditions (low capillary number) reported by Jadhunandan and Morrow [3], show that the maximum volume of displaced oil occurred at nearly neutral wettability conditions. Core flooding experiments only reveal macroscopic behaviour and do not show fluid distribution and wetting state at the pore scale. Iglauer et al. [4] reported oil displacement experiments in oil-wet and water-wet sandstones using small cores of approximately 5 mm diameter and used m-CT to evaluate the residual oil saturation. They also found that the residual oil saturation in the oil-wet core was much lower than the value in an analogous water-wet system.
Network modelling is a useful tool and has been extensively used to understand the impact of rock structure, wettability characteristics and pore scale physics on macroscopic multiphase flow behaviour. Kovscek et al. [9] proposed a network model to study wettability alteration in areas of the pore space in direct contact with the oil phase. The model has been used to study the effect of wettability on relative permeability curves and oil recovery [10,11]. McDougall and Sorbie [12] used a network model to determine the effect of wettability on the relative permeability curves and oil recovery efficiency. They show that oil displacement was maximum in a network where approximately half of the pore space was oil-wet. Zhao et al. [13] presented a comprehensive analysis on the effect of wettability on waterflooding oil recovery using pore-scale modelling in networks constructed based on micro-CT images of different rock types. Their results showed that in uniformly wet porous media, water relative permeability falls and oil recovery increases as the system becomes less water-wet. At first glance, this behaviour seems to be counter intuitive. Water-wet walls help the invasion of small pores. Therefore, at a given water saturation, water permeability should be higher in oil-wet porous media, since water preferentially occupies the larger pores. The network model showed that the lower water permeability occurred because the water phase was poorly connected through the pore space. In the same way, a higher oil relative permeability was associated with improved connectivity of the oil phase in hydrophobic media. The capillary network models presented by McDougall and Sorbie [14] and later by Zhao et al. [13] agree qualitatively with the sandstone displacement experiments reported by Jadhunandan and Morrow [3].
Macroscopic multiphase flow phenomena can only be fully understood through a fundamental comprehension of the complex multiphase flow at the microscopic scale. Recent improvements on the fabrication techniques of microfluidic devices have led to a growth on the use of flow visualization at the pore scale to gain specific information on oil and water occupation of the pore space and trapped oil ganglia [15,16]. Most experiments on immiscible displacement in microfluidic devices used as a simple model of a porous media show the opposite behaviour observed by Jadhunandan and Morrow [3] and Iglauer et al. [4], and as predicted by Zhao et al. [13]. The volume of the displaced phase is higher when the invading fluid wets the porous medium. Wu et al. [17] constructed a microfluidic random network of straight channels to study the effect of wettability and homogeneity of the porous space. They reported that oil displacement was higher in the hydrophilic devices. Lee et al. [18] presented a new method to fabricate micromodels of porous media with heterogeneous wetting properties. They showed the effect of the wettability parameters on the formation of trapped oil ganglia. The volume of the displaced phase is larger when the displacing liquid wets the walls of the device. Trojer et al. [19] have shown that increasing the wettability of the medium to the invading phase leads to a more compact and consequently effective displacement pattern. Zhao et al. [20] used a microfluidic cell to study the displacement pattern for a wide range of wettability conditions. They also found that increasing the wall affinity to the invading phase leads to an increasingly more uniform displacement front. They present experimental evidence that show that this phenomenon can be explained by a cooperative pore filling phenomenon, in which two adjacent invading menisci overlap and merge into a single new meniscus [21]. The range of capillary number explored in these analyses was from 10−3 to 102; much higher than the capillary numbers in sandstone experiments. Moreover, most of the microfluidic devices used as a simple porous media model are 2-D, at which the channels have a constant depth. New etching processes have been developed to produce 2.5-D micromodels with varying depth [22,23]. The results show that channels with varying depth can better represent multi-phase flow in porous media with a physically realistic snap-off and trapping of oil ganglia.
The reasons for the discrepancy between the sandstone and microfluidic devices experiments are not clear. The goal of this study is to address this issue. The effect of wettability on the oil displacement by water injection is studied here by using hydrophobic and hydrophilic microfluidic model pore network. The experiments were performed at capillary numbers close to those used in the sandstone experiments of Jadhunandan and Morrow [3] and network model of Zhao et al. [13], e.g., 10−7 < Ca < 10−5, which are much lower than the range used in the microfluidic experiments reported in packed glass beads. Moreover, the porous space is a network of capillaries with constrictions with varying channel depth. The geometry may have a dramatic effect on the invasion dynamics, since it does not promote the cooperative pore filling phenomenon observed by Zhao et al. [13] in microfluidic flow cells patterned with vertical cylindrical posts.
2. Materials and Methods
The oil displacement experiments were performed on a microfluidic model pore network, produced by Dolomite Microfluidics. The model pore network has an area of mm2, as shown in Figure 1a. The network is formed by unit squares of mm2. Each square comprises of a network of almost circular channels (diameter of 110 mm) arranged in a regular network with a lattice constant equal to 250 mm, as shown in Figure 1b. Three different types of channels are randomly distributed in each unit square, ensuring the heterogeneity of the micromodel: straight (Type I), with constrictions of 83 mm (Type II) and 67 mm (Type III). The etching process used by Dolomite Microfluidics is the standard photoresist-UV-HF sequence with a thermally bond glass cover with a surface roughness of about 5nm [24]. The channels are almost axisymmetric, as sketched in Figure 1c, making the model pore network used in this analysis a 2.5-D micromodel, which has been shown to better represent multi-phase flow in porous media [22,23]. The pore volume was determined by the mass difference of the fully saturated and empty device; it is approximately 38 mL. The permeability of the model pore network was estimated to be approximately 80 D. Two glass microfluidic model pore network that have the same geometry but different surface treatment, hereafter simply called hydrophilic (WW) and hydrophobic (OW) micromodels, were used in the experiments.
The fluid injection system consisted of a syringe pump (Harvard Apparatus) used for injecting the different fluids (oil and water). All experiments were performed using gastight glass syringes (Hamilton). The termination in Teflon with Luer-Lock coupling provides easy connection with the 1/32” internal diameter tubing. A three-way solidor valve was used to simplify the procedure of exchanging the injection liquid.
The oil phase used was a silicone oil (Drakeol 7, Agecom) with viscosity mo = 17.8 × 10⁻³ Pa.s (at 25 °C). The water phase was deionized water coloured with food-grade red dye. The viscosity of the water phase was mw = 0.9 × 10⁻³ Pa.s (at 25 °C). The viscosity ratio between the phases was M = mw/mo ~ 0.05. The interfacial tension between the phases was s = 33.8 mN/m. An apparent contact angle of the water phase (with red dye) with the curved wall of the channels filled with oil was measured for both microfluidic model pore network, in static condition in the long exit straight channel of the micromodel. The values were θ = 29° and θ = 149° for the WW and OW micromodels, respectively, as shown in Figure 2.
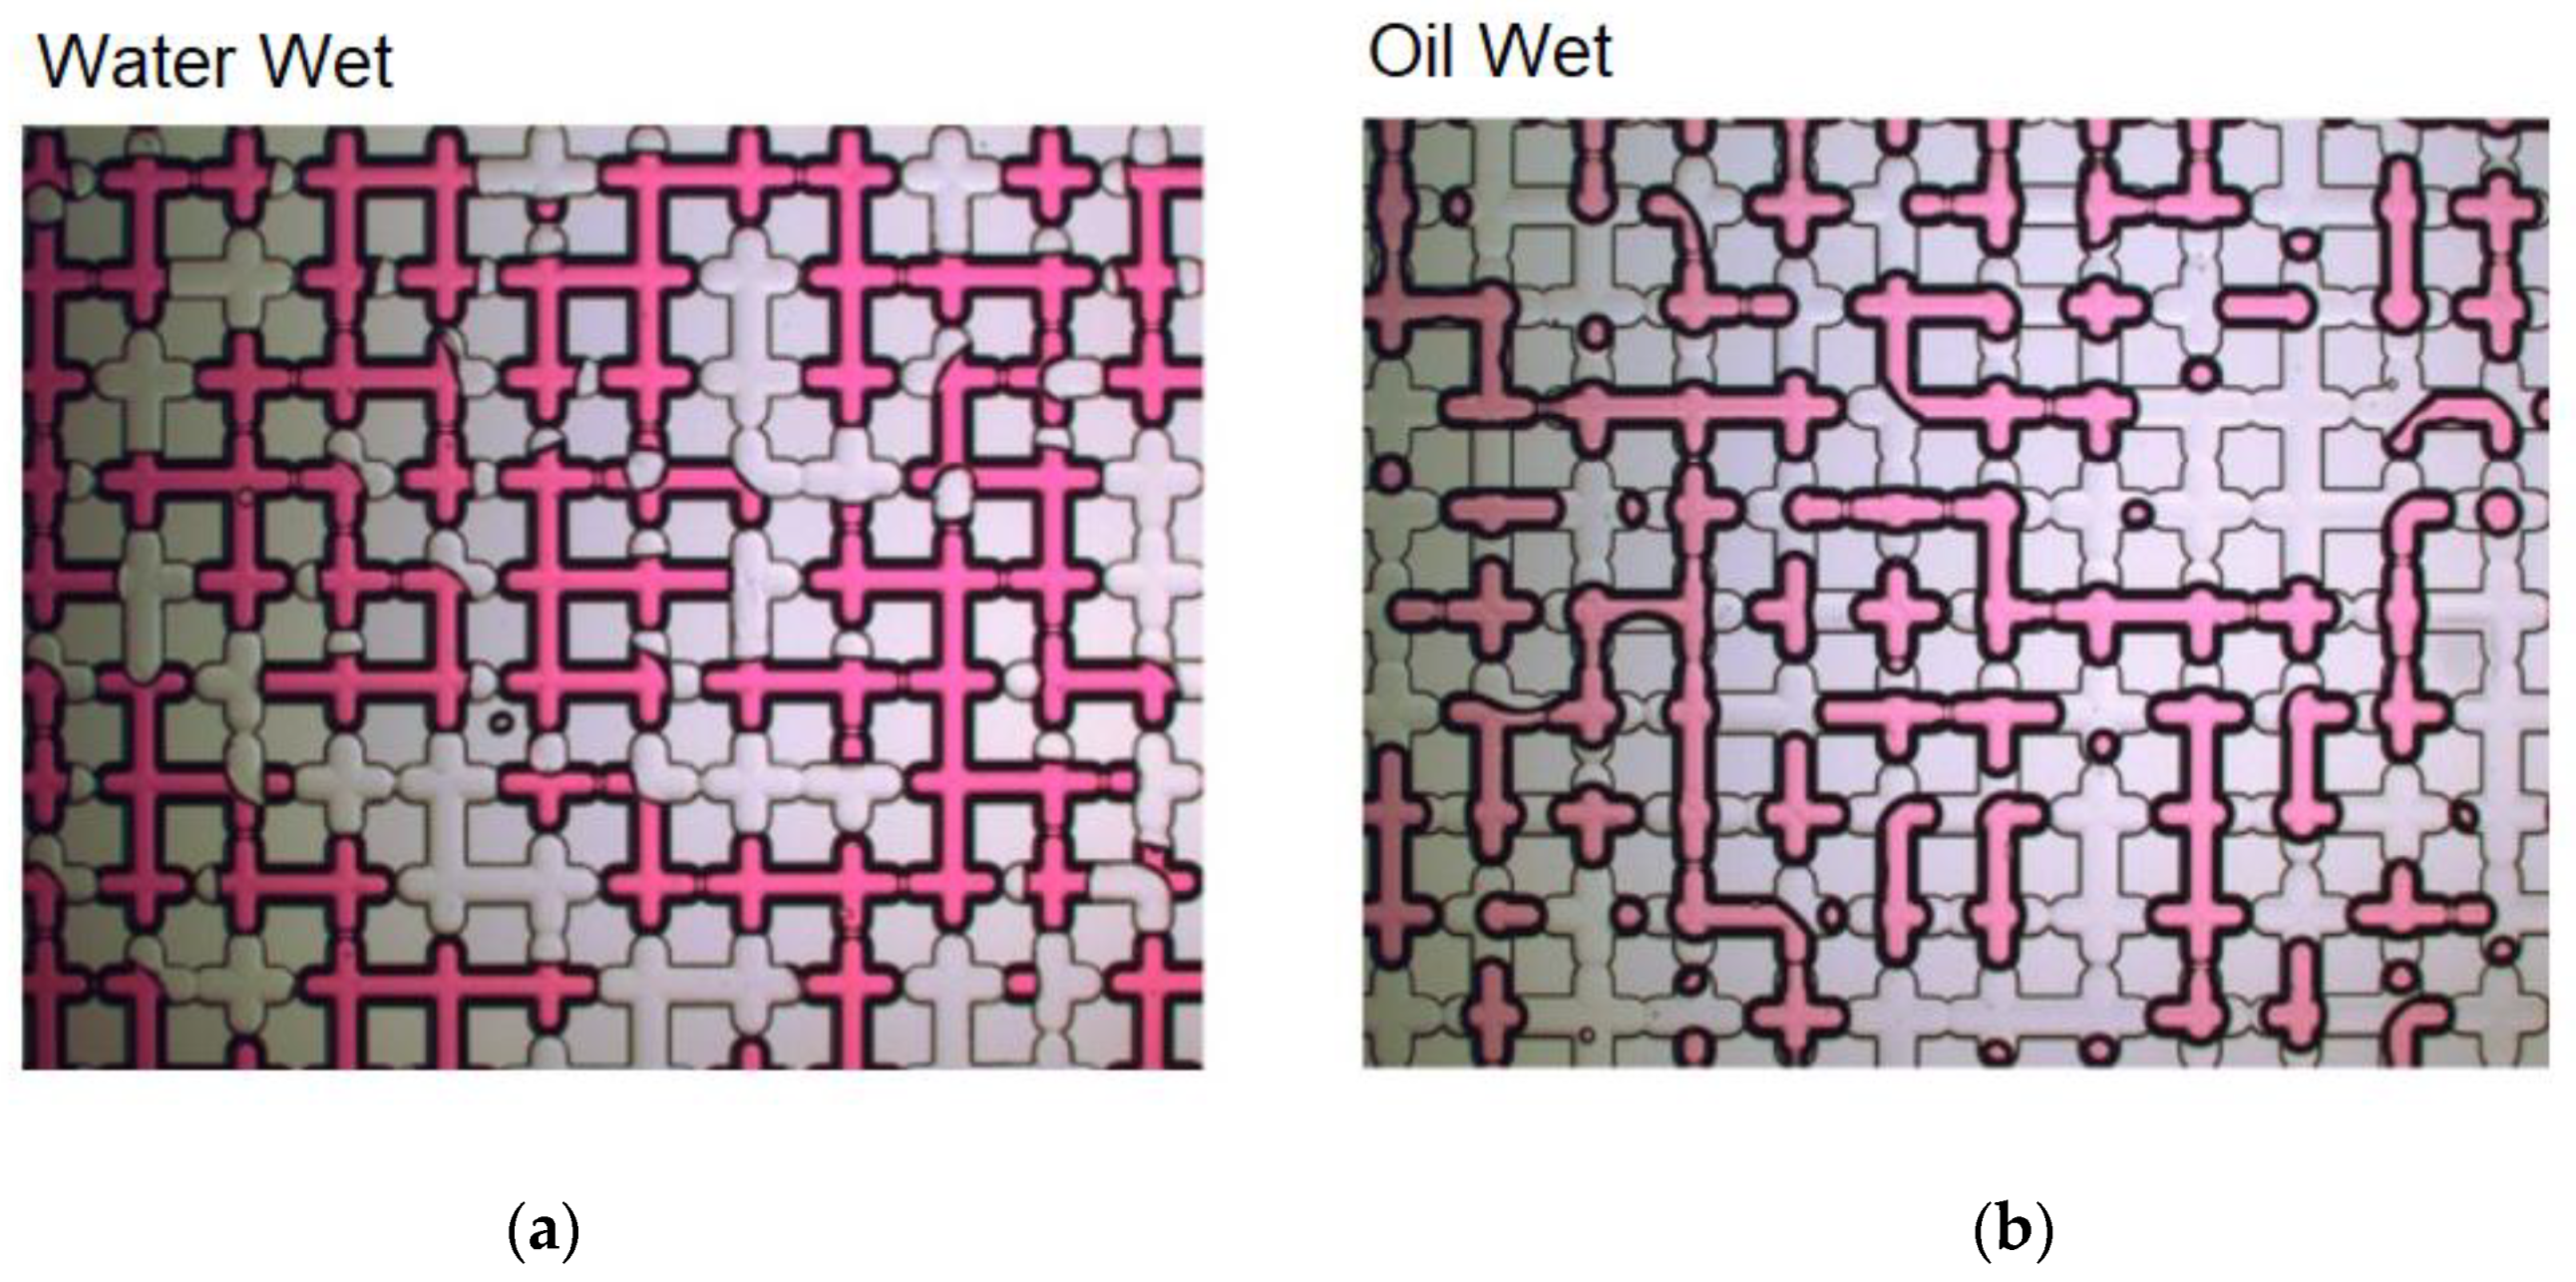
In all experiments, the model pore network was initially saturated with the oil phase. For both hydrophobic and hydrophilic devices, the water injection flow rate varied from Q = 0.0325 to 4.16 mL/h, such that the capillary number, defined as Ca = mw V/s, varied from 3.5 × 10⁻⁷ to 5 × 10⁻⁵, with V = Q/A being the Darcy velocity based on the cross section area of the microfluidic pore network; A = 10 × 0.1 mm2. Water phase injection continued until oil production ceased and the oil saturation in the microfluidic pore network reached steady state (Supplementary Video 1. presents a macroscopic view of the water invasion process). Experiments were run with the microfluidic cell mounted on top of an inverted microscope (Axiovert 40Mat, Zeiss) for visualization of the distribution of the phase throughout the network. A PixeLINK camera (PL-A662) was used to capture high-resolution videos and images of phase distribution. The oil configuration in the porous space after each experiment was obtained by assembling 4 × 27 images of small 3 × 3 mm2 squares that span the entire device. Each image was obtained with a 2.5× magnification objective lens. Figure 3 shows examples of such images for both the hydrophilic and hydrophobic micromodels. The occupation of the network by the water phase (red) and the formation of oil ganglia is easily observed.
The good optical contrast between both phases enabled the use of a simple Image-J macro that consisted of a color threshold filter to generate black and white images at which the oil phase (black pixels) is completely differentiated, as shown in Figure 4. These images were used to determine the remaining oil saturation and morphology (number and size distribution) of the trapped oil ganglia at the end of each water phase injection for both WW and OW micromodels.
3. Results
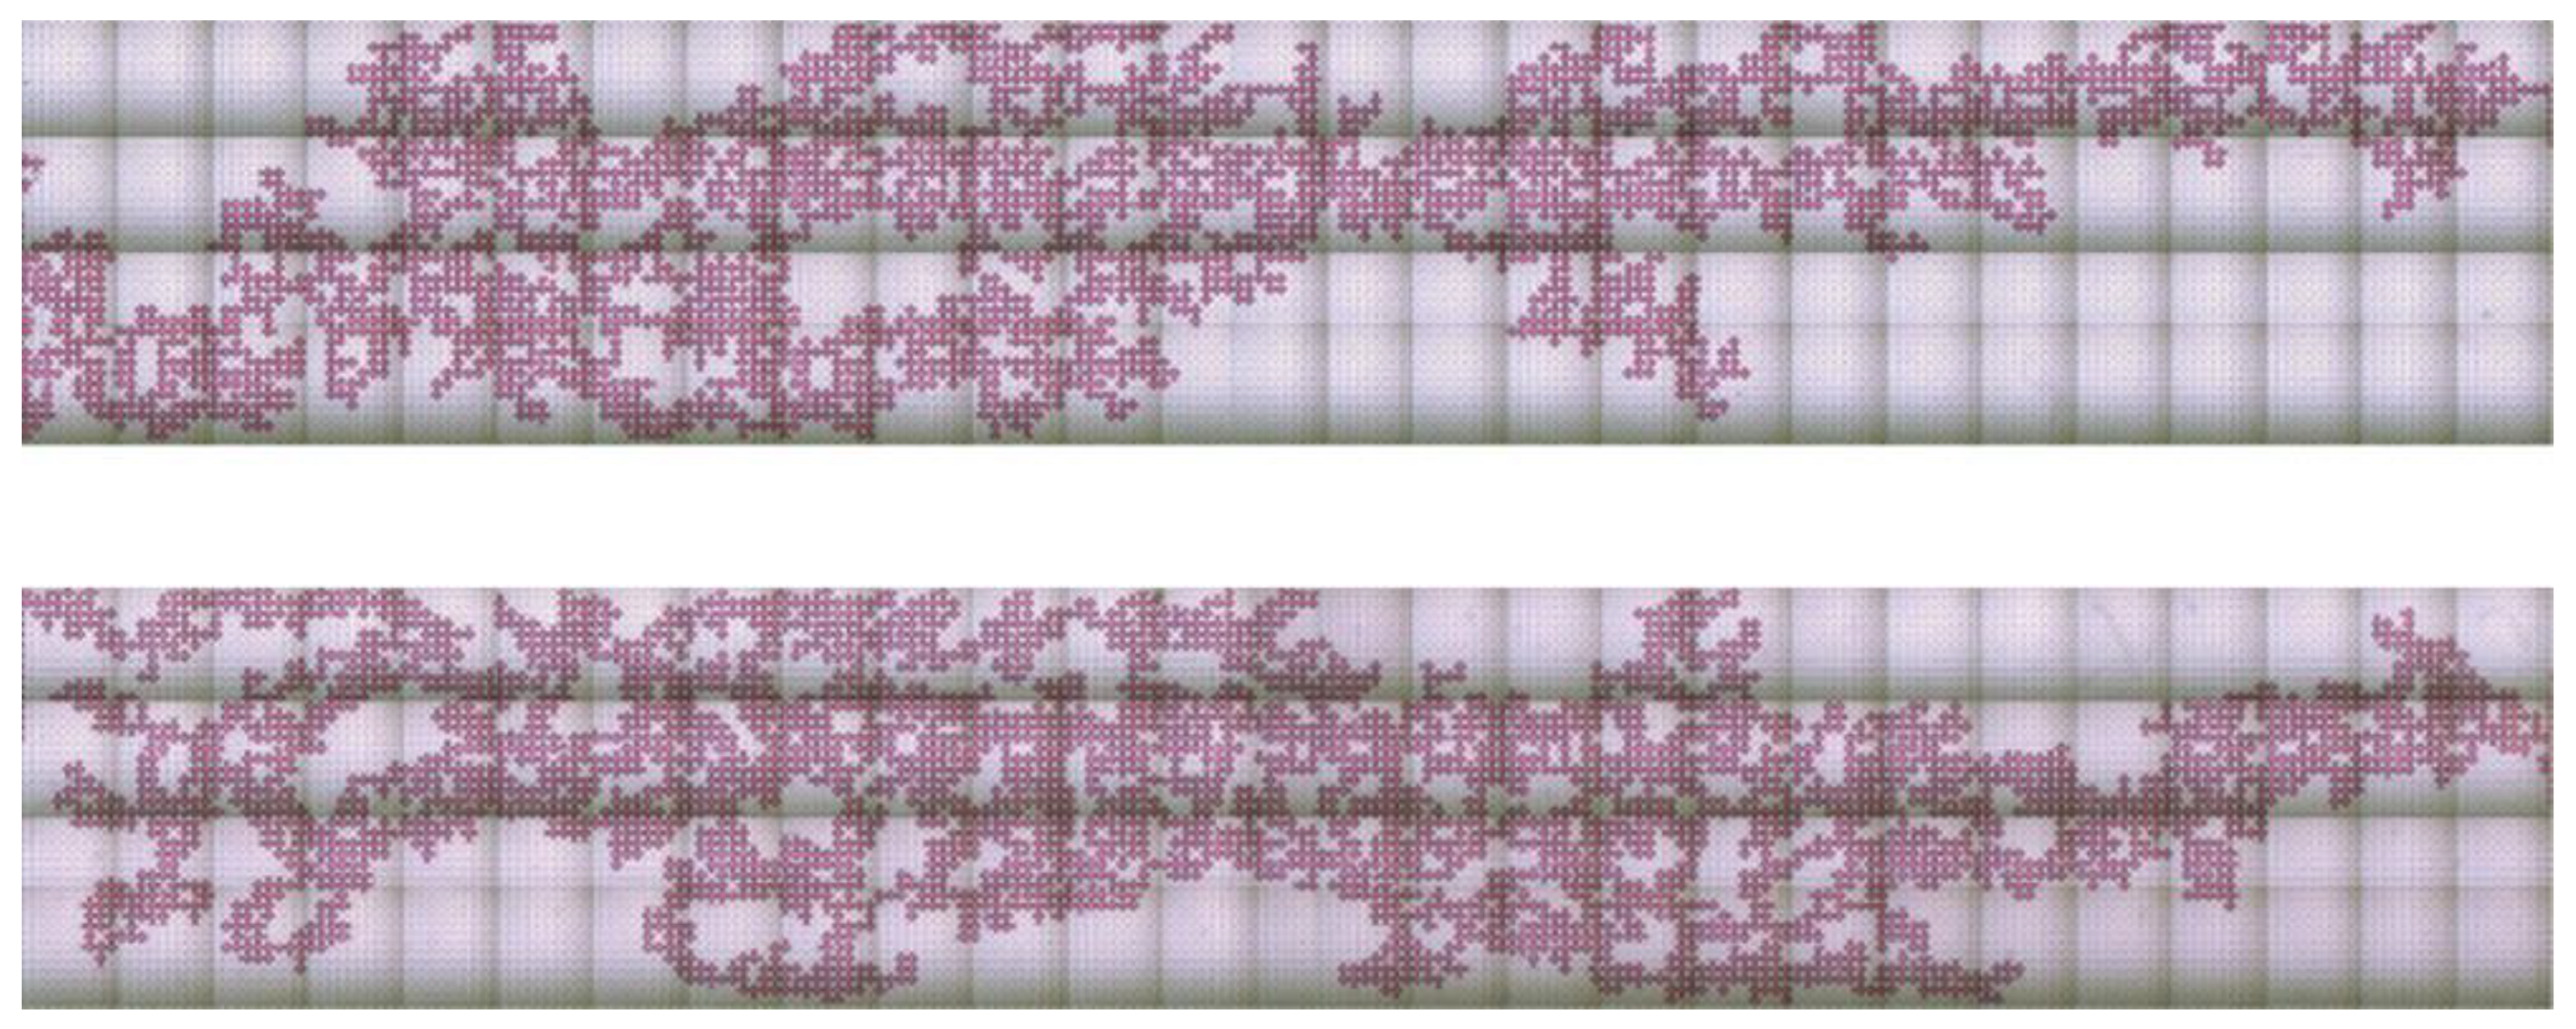
Since the water (lower viscosity) invasion process in an oil (higher viscosity) saturated porous media is an unstable flow, we first verified that the resulting residual oil saturation at the end of the process was not strongly affected by uncontrollable perturbations on the flow conditions and alignment of the device over the microscope table. Two runs of water injection experiments were performed at Q = 0.0325 mL/h (Ca = 3.5 × 10⁻⁷) for WW and at Q = 0.52 mL/h (Ca = 6 × 10⁻⁶) for OW model pore network. Figure 5 presents the final water distributions at the end of each experiment. Although the invasion pattern is not the same, it is important to note that the overall characteristics of the pattern, marked by the formation of capillary fingers, are similar and the remaining oil saturations for both runs in each device are very close: Sor = 0.56 and 0.53 in the hydrophilic model (Figure 5a) and Sor = 0.31 and 0.30 in the hydrophobic model (Figure 5b).
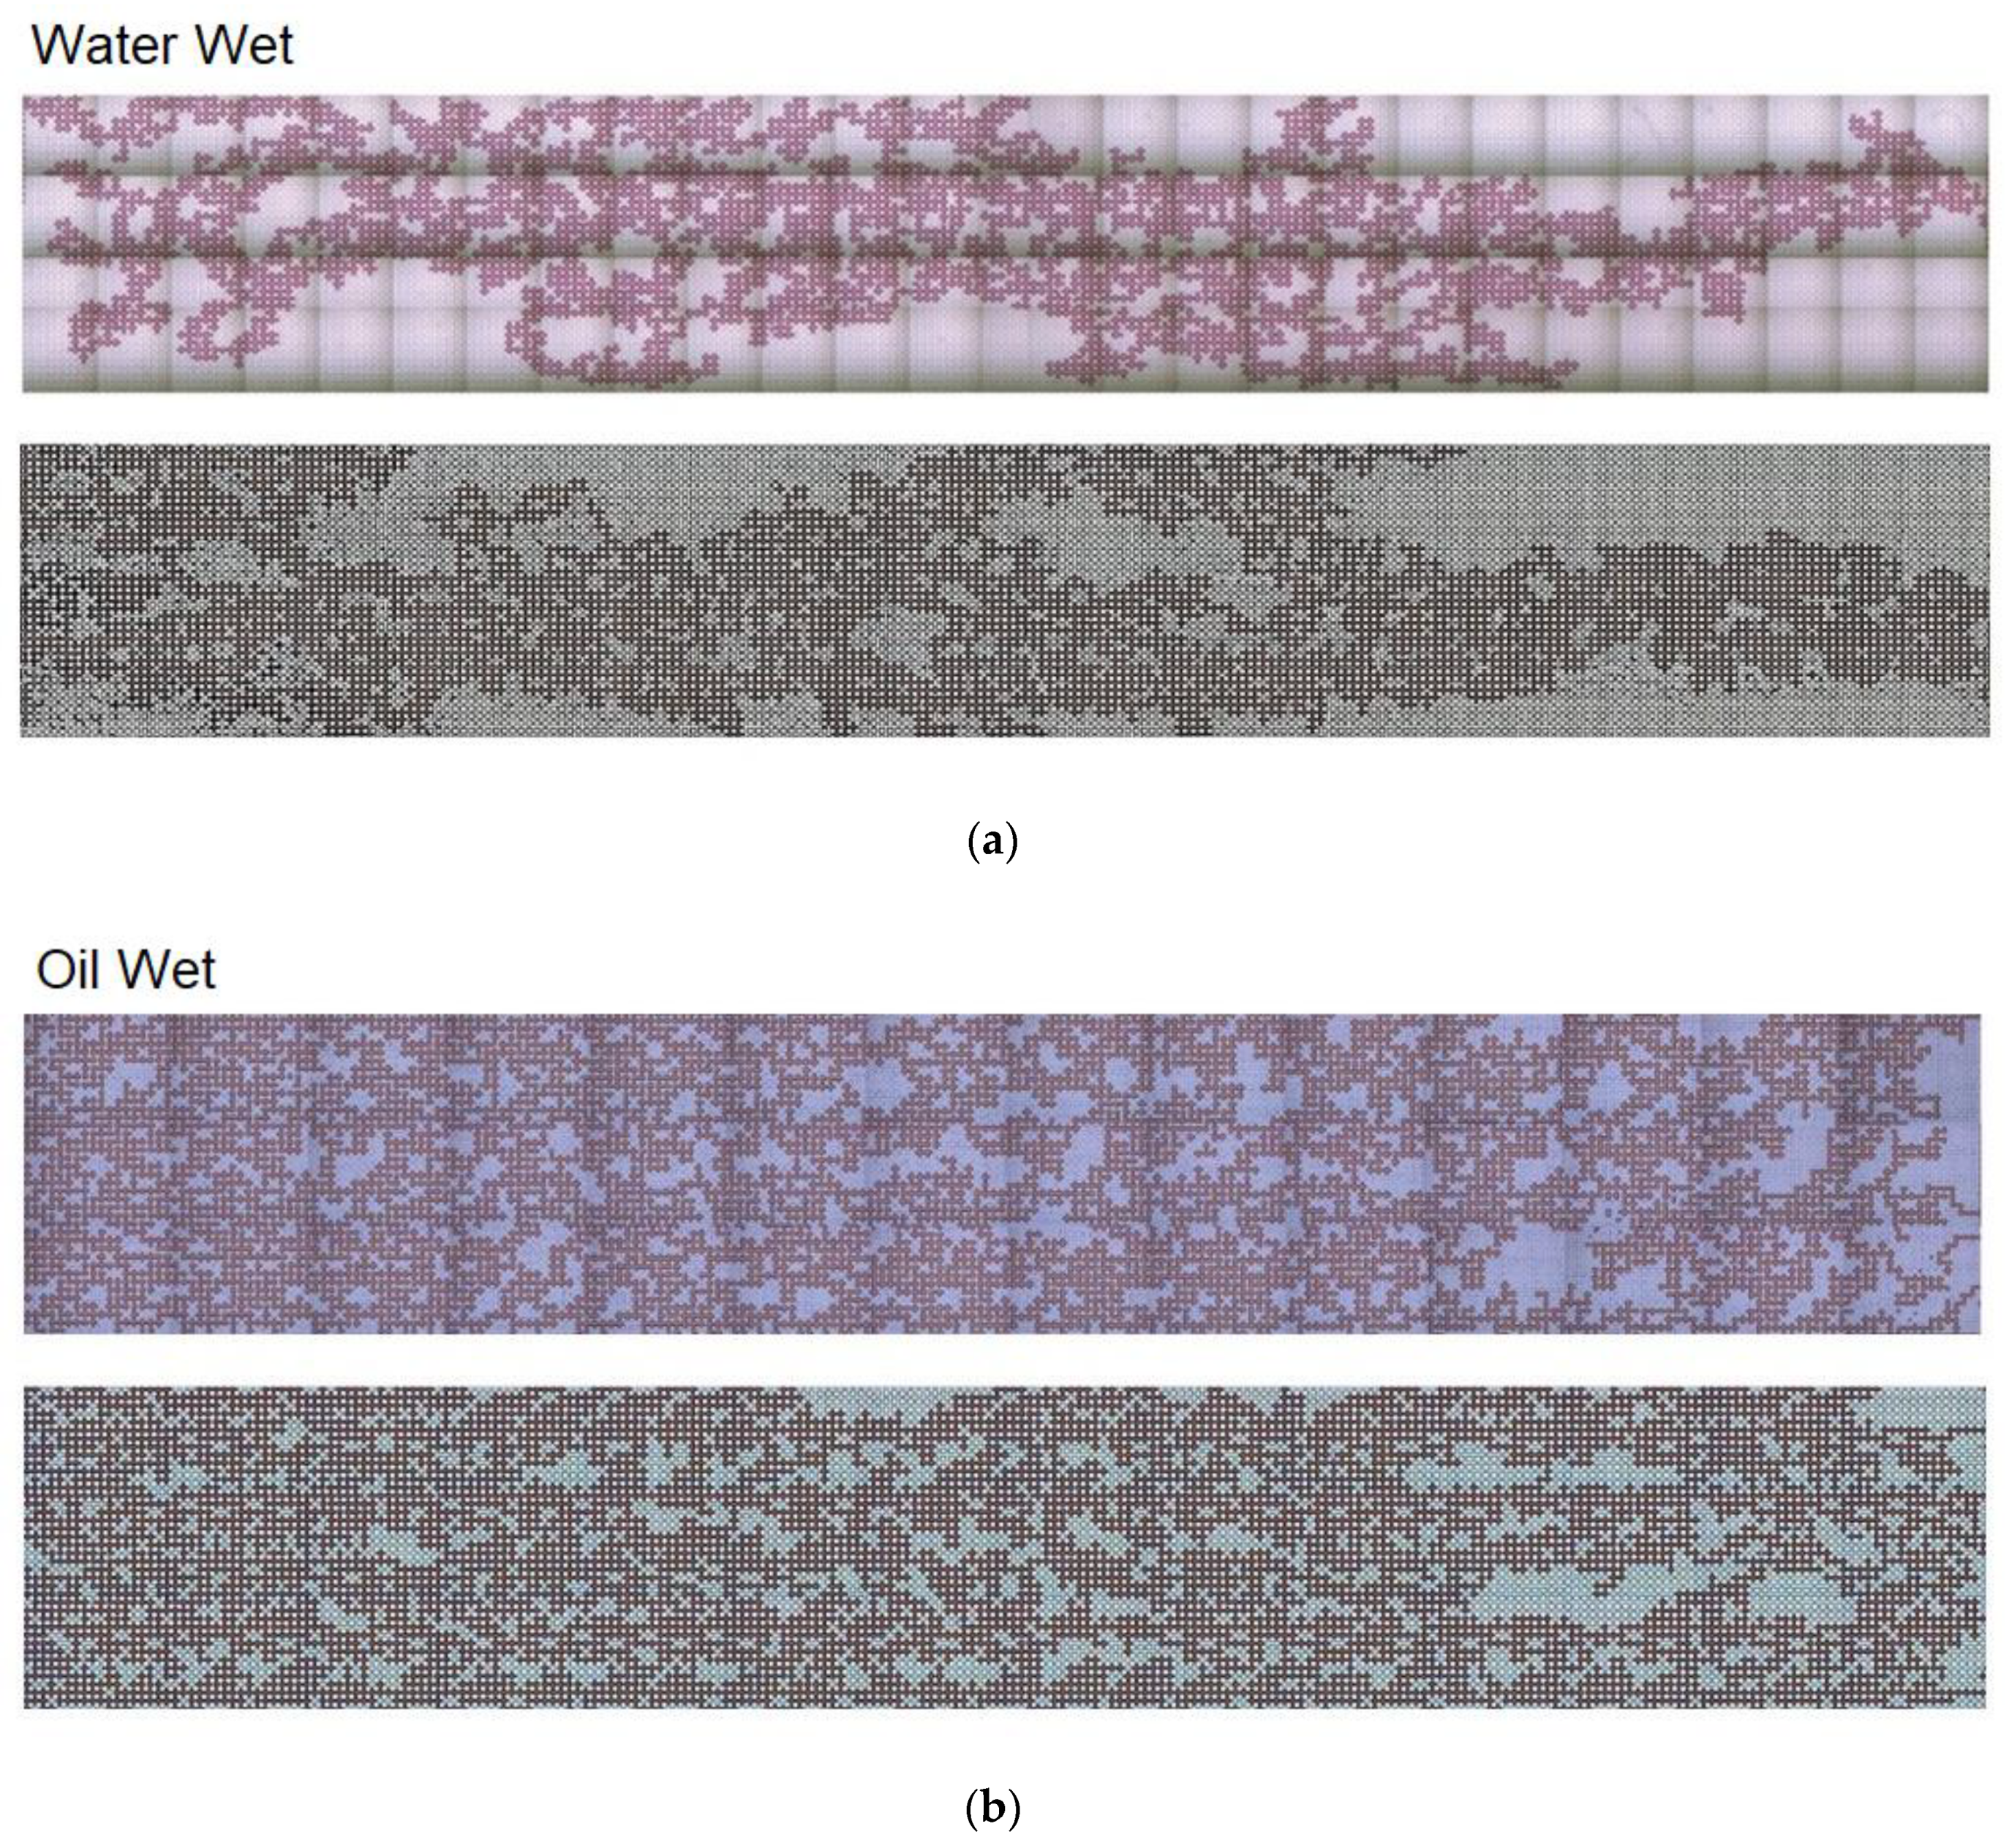
As mentioned before, all the microfluidic pore network used had the same geometric design. However, small variations in the geometry may occur, associated with the etching process of the channels. It is important to verify that the final oil saturation is not a function of the geometry of the particular micromodel used. This verification is crucial in order to ensure that the differences observed between the OW and WW are not associated with their particular channel geometry, but only with their surface properties. Water injection experiments were performed in two different hydrophilic micromodels made from the same mask (Figure 6). Their channel geometry may be slightly different because of the imperfections associated with the etching process. The experiments were run at Q = 0.0325 mL/h (Ca = 3.5 × 10⁻⁷). Figure 6 presents the final water distribution. The final oil saturation for both runs were very close; Sor = 0.56 and Sor = 0.57, respectively.
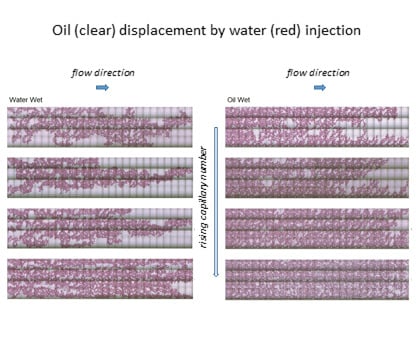
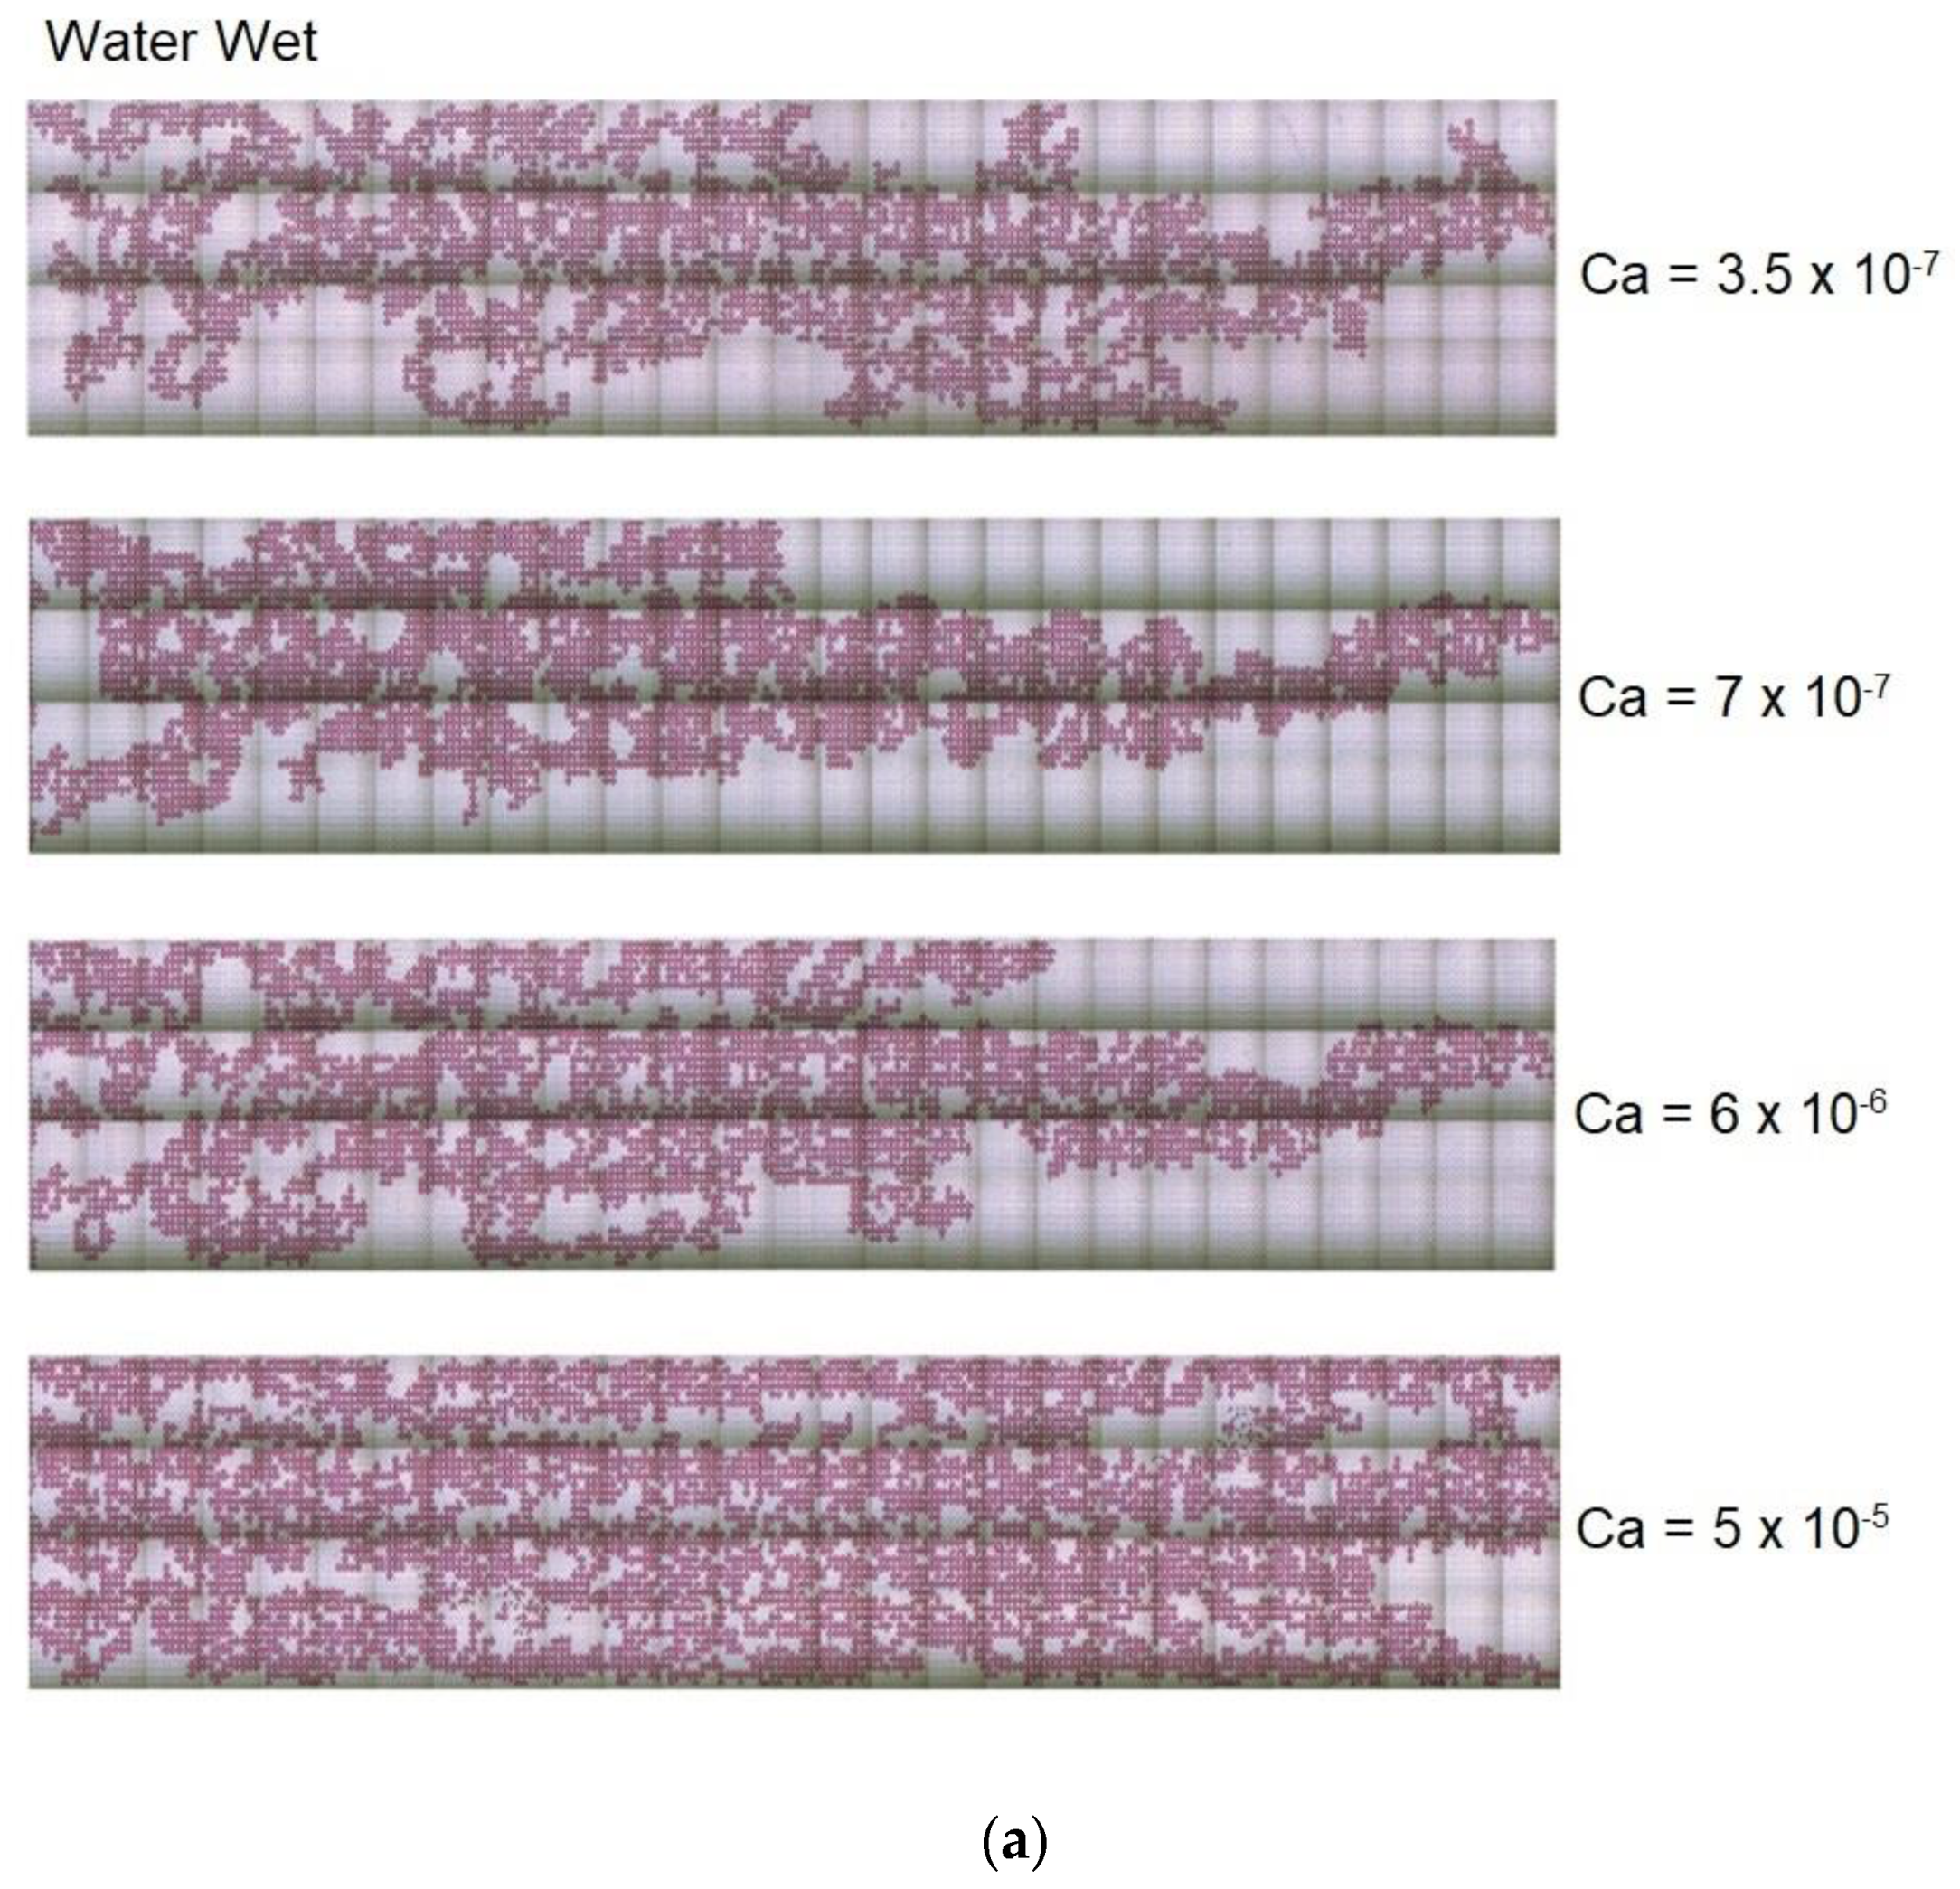
The water distribution at the end of each water injection for both WW and OW microfluidic model network with capillary number ranging from 3.5 × 10⁻⁷ to 5 × 10⁻⁵ is shown in Figure 7. With the WW micromodel and lowest capillary number, the water invasion process is very unstable. The formation of capillary fingers is clear, as expected [7,25]. A single percolated water path is formed, leading to the formation of very large areas of trapped oil. As the capillary number rises, viscous forces become stronger and capillary finger formation weakens. At the highest capillary number explored, more than one percolated path is formed, but the presence of large oil ganglia trapped by capillary forces is still present. The water invasion process in the OW device at the lower range of capillary number explored is remarkably different. Since the displacing phase does not wet the channel walls, water invades each channel only if the pressure difference is higher than the capillary pressure, leading to a more uniform displacement front, when compared to the WW case. As in the WW model, the invasion process becomes more uniform as the capillary number rises.
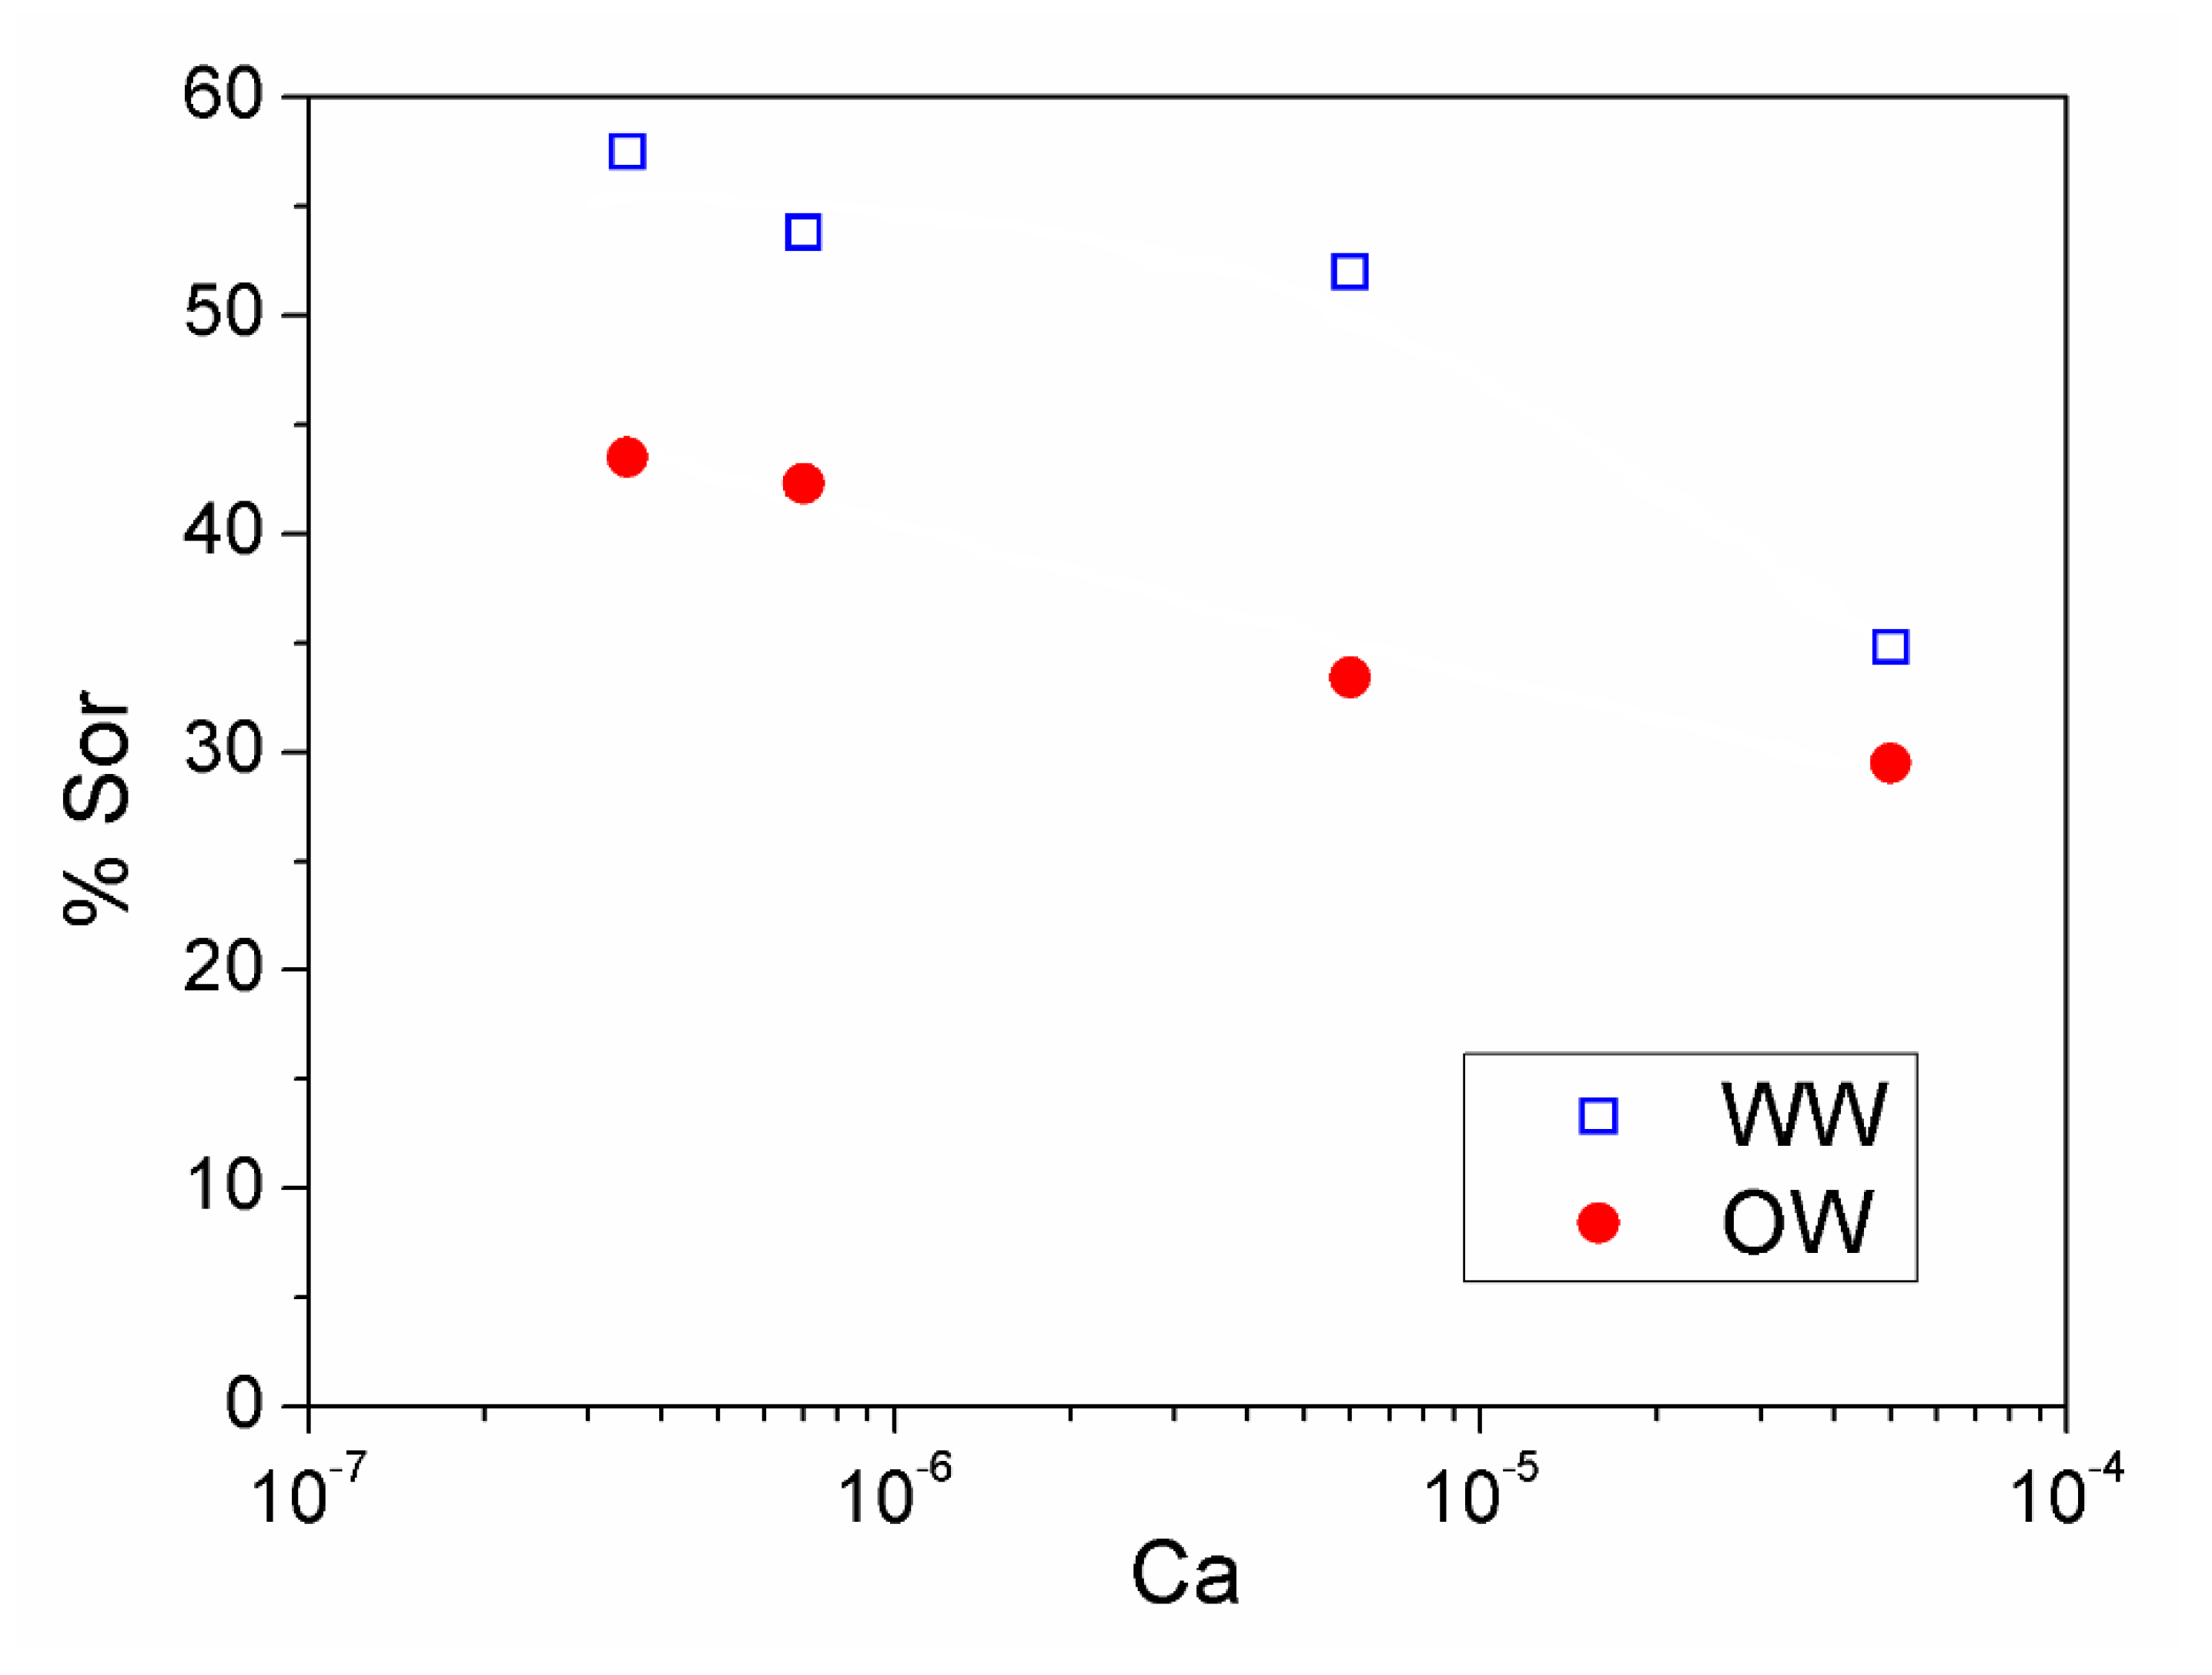
The residual oil saturation (volume of trapped oil) at the end of water injection for each case is shown in Figure 8. For the entire range of capillary number explored, oil recovery was higher in the oil-wet model pore network.
This behaviour is the opposite of what was observed by Lee et al. [18], Trojer et al. [19] and Zhao et al. [20]. It is important to note that their micromodels comprised of an array of cylindrical post with constant channel height, which is very different from the geometry of the pore space of the microfluidic model used in this study. As discussed by Xu et al. [22], the geometry of the pore network has a tremendous effect on the multi-phase flow. Micromodels with varying channel height, such as the ones used here, are able to better realistically represent snap-off and the formation if trapped oil ganglia. It is also important to note that our experiments were at a much lower capillary numbers.
As discussed before, in the WW model pore network, capillary force helps pumping the invading water phase. On the other hand, in the OW model pore network, water invades each capillary only if the pressure difference between the pores connected by the capillary is higher than the capillary pressure, which is a function of the capillary throat radius. This completely changes the invasion pattern. Figure 9 presents a sequence of images of the water phase distribution in the early stages (t < 40 s) of the invasion process for both OW and WW micromodels at Ca = 7 × 10⁻⁷. Because of the unstable nature of the displacement flow, the water-oil interface becomes non-uniform in the very beginning of the process for both OW and WW model pore networks (Figure 9a,e). In the OW network, the interface of the most advanced water paths stops at capillaries with the smallest throat. In order to overcome the small throats, the pressure difference at the interfaces needs to be higher than the capillary pressure at those locations. The pressure in the water phase rises and pushes liquid sideways, as shown in Figure 9b,c. This lateral flow traps very small oil ganglia. Once the displacement front becomes almost uniform, the front starts to advance again in a non-uniform pattern (Figure 9d). In the WW network, the unstable capillary fingers grow, with very little lateral flow, as shown in Figure 9f,h. Figure 10 presents the water distribution at longer times, until t = 240 s. Supplementary Video 2 and Video 3 show the invasion process for the OW and WW microfluidic pore network, respectively. The displacement front in the OW case is more uniform when compared to the WW flow.
The effect of wettability on phase distribution after water injection and consequently on the efficiency of oil displacement can be better understood by analyzing the characteristics (number and size distribution) of the trapped oil ganglia in each case. These results enable the direct correlation between pore scale phenomena to macroscopic observations. Image processing was used not only to evaluate the area (volume) occupied by each phase, but also to determine the number and size of each oil ganglia. The size of oil ganglia is presented in units of a unitary ganglion (UG), which is defined as the average volume of single pore body and half of the four channels connected to it. A unitary ganglion is marked with a blue square in Figure 4b.
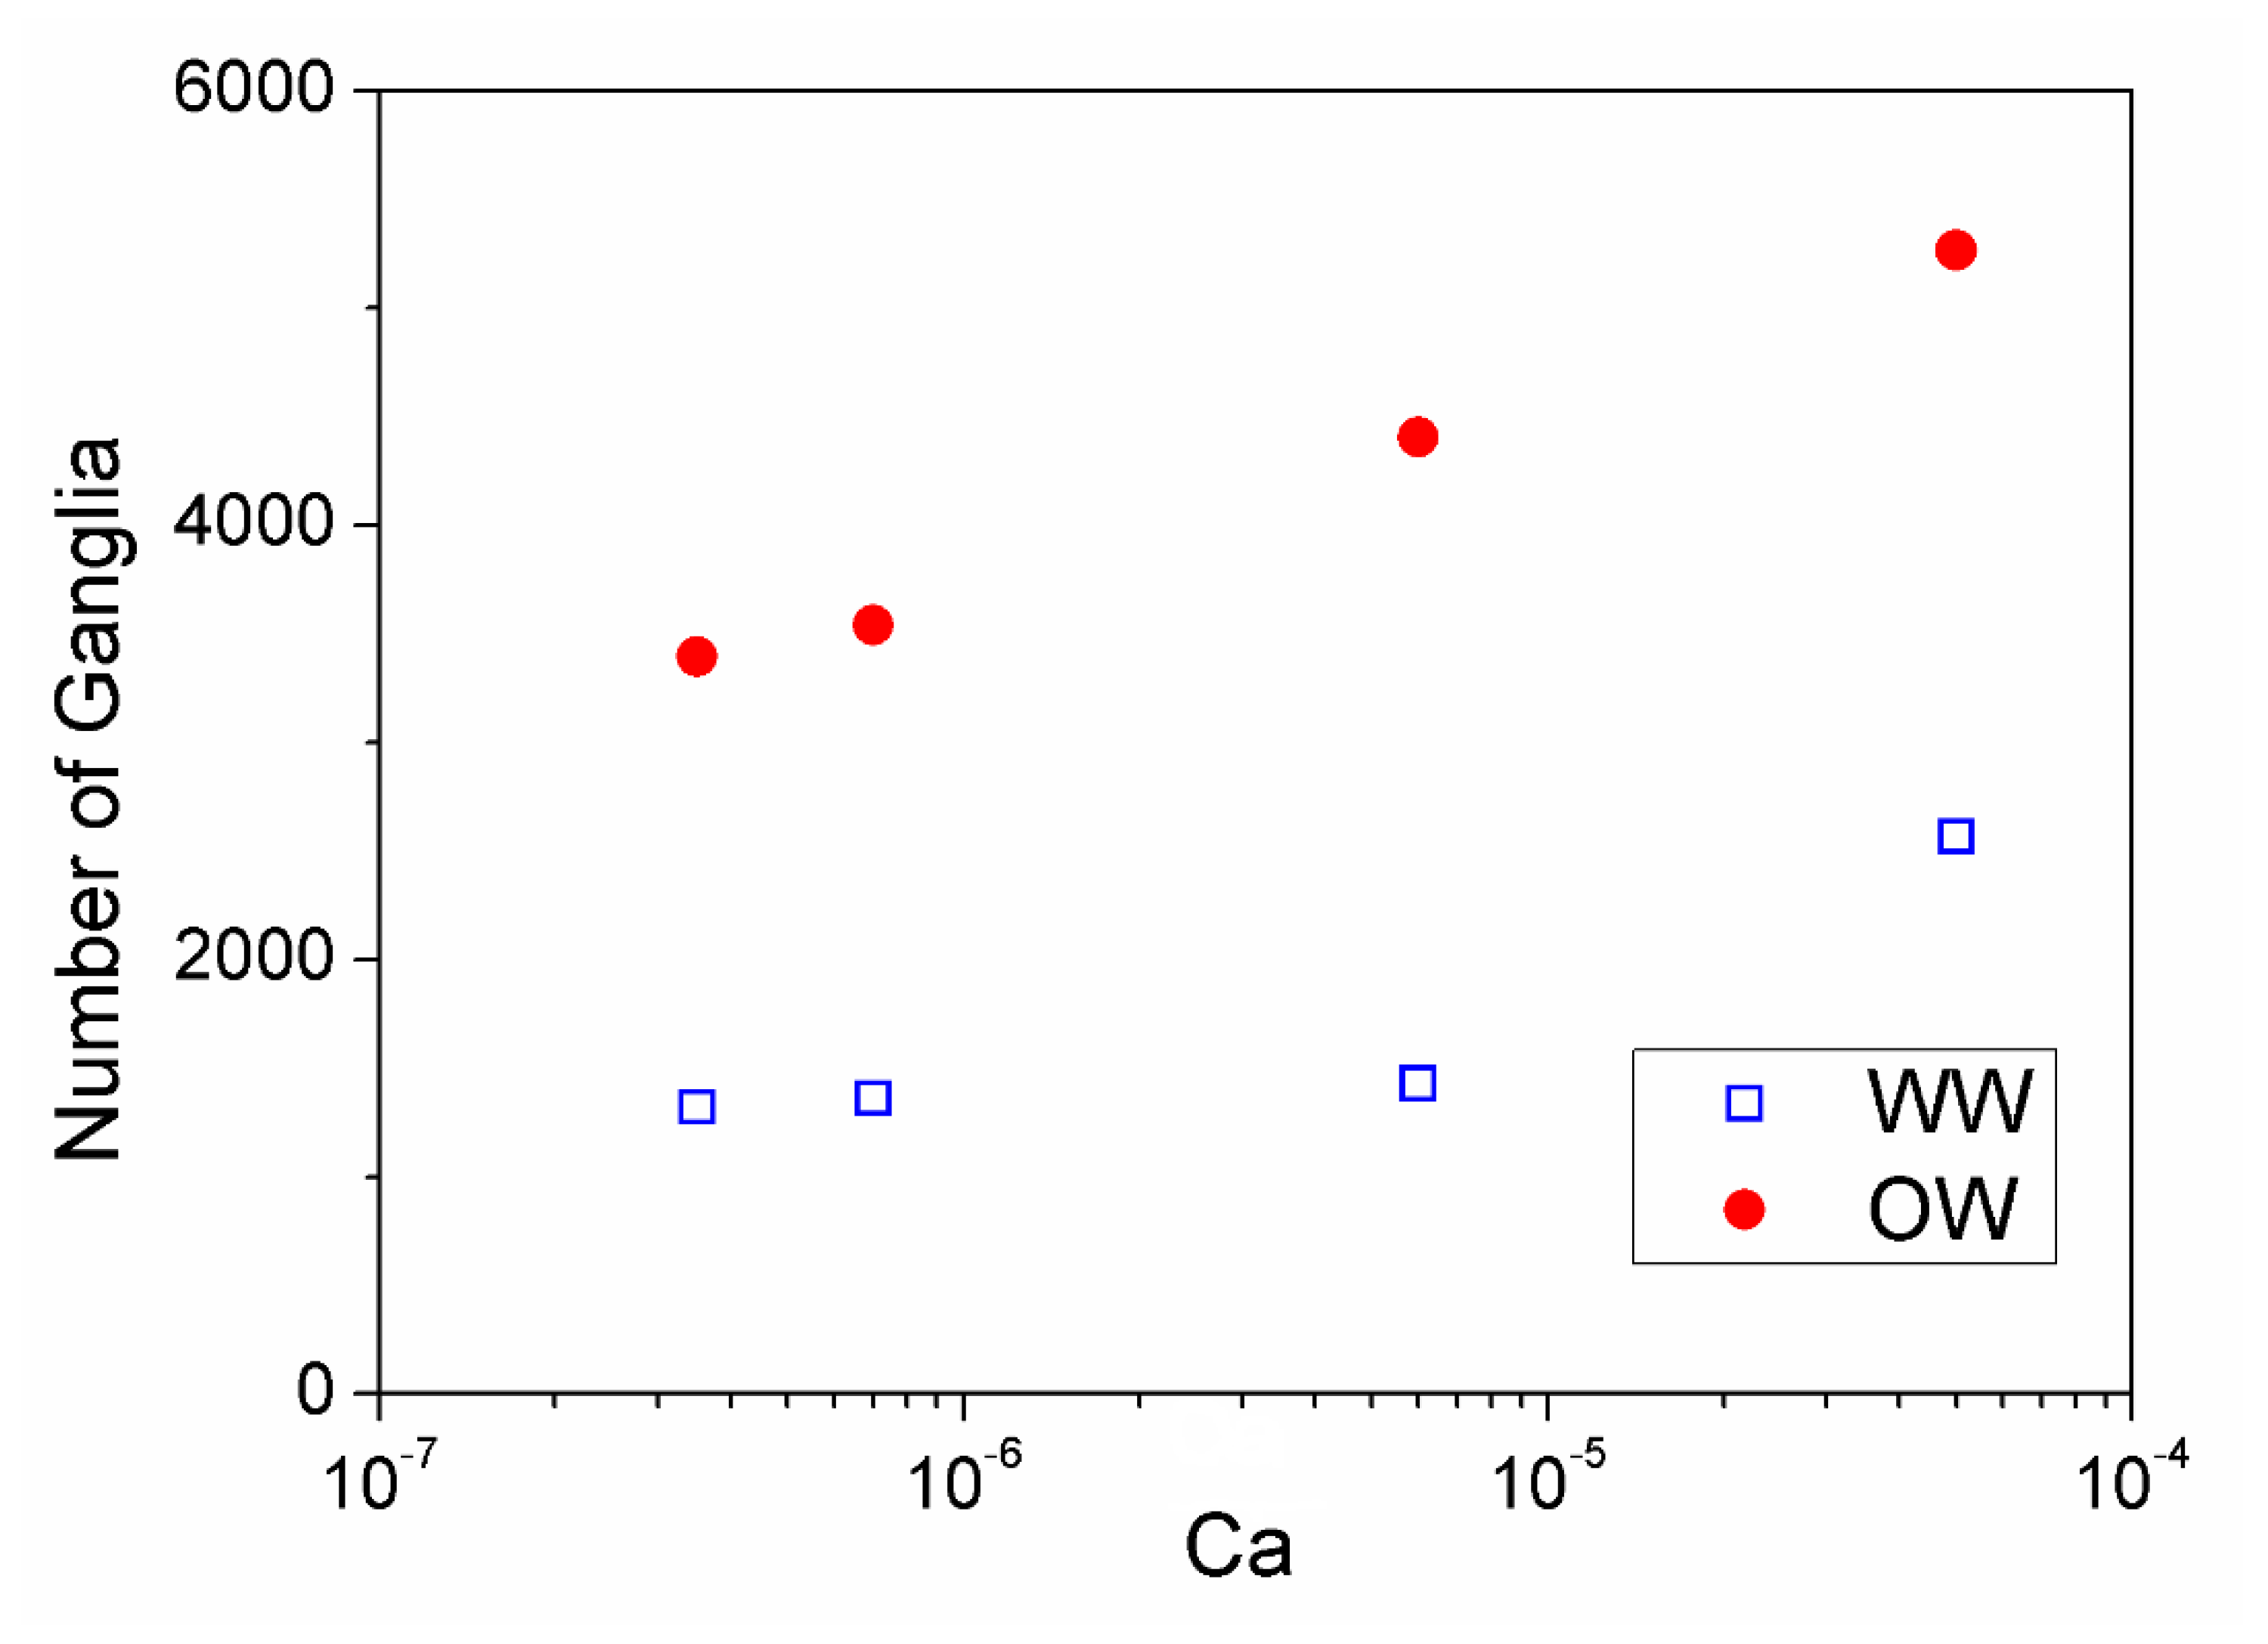
Figure 11 presents the number of ganglia as a function of capillary number for both WW and OW model pore networks. In both cases, the number grows with capillary number. As shown in Figure 7, as capillary number increases, the waterfront becomes more stable, avoiding the formation of a small number of very large oil islands that are not displaced by the injected water. With a more stable front, the water invasion leads to a large number of oil ganglia in both model pore networks. The number of oil ganglia observed in the OW network is remarkably higher than in the WW model. This is a direct consequence of the more uniform water front, which avoids the formation of a very large oil island, but promotes entrapment of a large number of ganglia.
The ganglia size distribution at the highest capillary number explored, e.g., Ca = 5 × 10⁻⁵, for both the OW and WW microfluidic porous media is presented in Figure 12. The behavior is very similar to the one presented by Oughanem et al. [26]. They have presented oil displacement experiments in water-wet sandstone plugs and used X-ray tomography (CT-scan) imaging to evaluate the oil ganglia size distribution. The number of oil ganglia first rises and then falls with ganglia volume following a power-law relation . For the WW micromodel, discarding the point associated with the smallest ganglia, the behaviour for the entire range of ganglia volume is well described by a single power law relation: , where is a dimensionless ganglia volume. Oughanem et al. [26] reported a power-law relation with an exponent that varied from to ; the difference is associated with the structure of the model pore network, much simpler than that of a sandstone core. For the OW micromodel, the data is described by two distinct power-law relations: , for , and , for . The OW network favors the formation of smaller ganglia (<10 UG) whereas the number of very large ganglia is much greater in the WW network. This behavior agrees with the results reported by Iglauer et al. [4] for sandstone cores.
The difference in the size distribution of the trapped oil ganglia has a direct effect on the residual oil saturation. Figure 13 shows the percentage of the total trapped oil as a function of the oil ganglia volume. For the WW network, it rises with the oil ganglia size; most of the trapped oil in the WW network comes in the form of very large ganglia. The behavior in the OW network is non-monotonic; the percentage of the total trapped oil rises with ganglia size until reaching a maximum value at . In the OW network, most of the trapped oil comes from oil ganglia ranging from 1 to 10 UG. The percentage of trapped oil that comes from the large ganglia is very small.
This non-monotonic behavior can be explained by the ganglia size distribution curve of the OW micromodel. The volume of trapped oil associated with ganglia of size is . The results presented in Figure 12 show that the number of ganglia of size is . Therefore, . For , and rises with . For , and decreases with . In the OW pore network model, for .
4. Conclusions
Wettability affects the immiscible displacement in porous media in different ways. If the invading water phase wets the walls of the porous space, it forms a lubricating layer of a lower viscosity liquid that facilitates oil displacement. Moreover, at a certain range of capillary number, the capillary effect may lead to cooperative pore filling phenomenon that leads to a more uniform displacement front. If oil is the wetting phase, oil drops will tend to stay attached to the walls. If only these effects are considered, the remaining oil saturation after water injection should be higher in oil-wet porous media. This was the case of some microfluidics experiments reported in the literature [18,19,20]. However, there are clear experimental evidences that show that residual oil saturation in oil-wet rocks is lower than in water-wet cores [2,3].
One possible physical mechanism that explains this discrepancy and the improved oil recovery as the walls become less water wet, is the change in the sequence of events during water invasion into an oil saturated porous space. If the walls of the porous media are wetted by the displaced phase (oil), the capillary pressure resists the flow and each pore throat is invaded by the water phase only if the pressure difference in that throat is larger than the capillary pressure, which is a function of the throat radius. The visualization of the invasion process presented here show that in the oil-wet case, there is a stronger lateral flow of the displacing water phase and the displacement front is more uniform, ultimately leading to a smaller volume of entrapped oil. The residual oil saturation obtained in the OW device was smaller than that obtained in the WW porous media for the entire range of capillary number explored. The analysis of oil ganglia size distribution shows that the number of large oil ganglia was higher in the WW devices, which led to a higher residual oil saturation.
Supplementary Materials
The following are available online at https://www.mdpi.com/1996-1073/12/4/664/s1: Supplementary video 1: Macroscopic view of water invasion process; Supplementary video 2: Water invasion process in a OW device; Supplementary video 3: Water invasion process in a WW device.
Author Contributions
Conceptualization, M.C. and J.A.; methodology, M.C., J.A. and N.L.; software, A.Q. and J.A.; investigation, N.L., A.Q. and J.A.; resources, M.C.; writing—original draft preparation, J.A.; writing—review and editing, M.C.; visualization, N.L. and J.A.; project administration, M.C. and J.A.; funding acquisition, M.C.
Funding
This research was funded by Repsol-Sinopec Brasil, the Brazilian Research Council (CNPq) and the Carlos Chagas Filho Research Support Foundation (FAPERJ).
Conflicts of Interest
The authors declare no conflict of interest.
References
- Anderson, W.G. Wettability Literature Survey-Part 6: The Effects of Wettability on Waterflooding. J. Pet. Technol. 1987, 39, 1605–1622. [Google Scholar] [CrossRef]
- Morrow, N.R. Wettability and Its Effect on Oil Recovery. J. Pet. Technol. 1990, 42, 1476–1484. [Google Scholar] [CrossRef]
- Jadhunandan, P.P.; Morrow, N.R. Effect of Wettability on Waterflood Recovery for Crude-Oil/Brine/Rock Systems. SPE Reserv. Eng. 1995, 10, 40–46. [Google Scholar] [CrossRef]
- Iglauer, S.; Ferno, M.A.; Shearing, P.; Blunt, M.J. Comparison of residual oil cluster size distribution, morphology and saturation in oi-wet and water-wet sandstone. J. Colloid Interface Sci. 2012, 375, 187–192. [Google Scholar] [CrossRef] [PubMed]
- Lenormand, R.; Zarcone, C.; Sarr, A. Mechanisms of the displacement of one fluid by another in a network of capillary ducts. J. Fluid Mech. 1983, 135, 337. [Google Scholar] [CrossRef]
- Homsy, G.M. Viscous Fingering in Porous Media. Ann. Rev. Fluid Mech. 1987, 19, 271–311. [Google Scholar] [CrossRef]
- Lenormand, R.; Touboul, E.; Zarcone, C. Numerical models and experiments on immiscible displacements in porous media. J. Fluid Mech. 1988, 189, 165–187. [Google Scholar] [CrossRef]
- Olbricht, W.L. Pore-Scale Prototypes of Multiphase Flow in Porous Media. Annu. Rev. Fluid Mech. 1996, 28, 187–213. [Google Scholar] [CrossRef]
- Kovscek, A.R.; Wong, H.; Radke, C.J. A pore-level scenario for the development of mixed wettability in oil reservoirs. AIChE J. 1992, 39, 1072–1085. [Google Scholar] [CrossRef]
- Blunt, M.J. Physically-based network modeling of multiphase flow in intermediate-wet porous media. J. Pet. Sci. Eng. 1998, 20, 117–125. [Google Scholar] [CrossRef]
- Dixit, A.B.; Buckley, J.S.; McDougall, S.R.; Sorbie, K.S. Empirical measures of wettability in porous media and the relationship between them derived from pore-scale modelling. Transp. Porous Media 2000, 40, 27–54. [Google Scholar] [CrossRef]
- Mcdougall, S.R.; Sorbie, K.S. The Application of Network Modelling Techniques to Multiphase Flow in Porous Media. Pet. Geosci. 1997, 3, 161–169. [Google Scholar] [CrossRef]
- Zhao, X.; Blunt, M.J.; Yao, J. Pore-scale modeling: Effects of wettability on waterflood oil recovery. J. Pet. Sci. Eng. 2010, 71, 169–178. [Google Scholar] [CrossRef]
- McDougall, S.R.; Sorbie, K.S. The Impact of Wettability on Waterflooding: Pore-Scale Simulation. SPE Reserv. Eng. 1995, 10, 208–213. [Google Scholar] [CrossRef]
- Berejnov, V.; Djilali, N.; Sinton, D. Lab-on-chip methodologies for the study of transport in porous media: Energy applications. Lab Chip 2008, 8, 689–693. [Google Scholar] [CrossRef] [PubMed]
- Kumar Gunda, N.S.; Bera, B.; Karadimitriou, N.K.; Mitra, S.K.; Hassanizadeh, S.M. Reservoir-on-a-Chip (ROC): A new paradigm in reservoir engineering. Lab Chip 2011, 11, 3785. [Google Scholar] [CrossRef] [Green Version]
- Wu, M.; Xiao, F.; Johnson-Paben, R.M.; Retterer, S.T.; Yin, X.; Neeves, K.B. Single- and two-phase flow in microfluidic porous media analogs based on Voronoi tessellation. Lab Chip 2012, 12, 253–261. [Google Scholar] [CrossRef]
- Lee, H.; Lee, S.G.; Doyle, P.S. Photopatterned oil-reservoir micromodels with tailored wetting properties. Lab Chip 2015, 15, 3047–3055. [Google Scholar] [CrossRef] [Green Version]
- Trojer, M.; Szulczewski, M.L.; Juanes, R. Stabilizing Fluid-Fluid Displacements in Porous Media Through Wettability Alteration. Phys. Rev. Appl. 2015, 3, 1–8. [Google Scholar] [CrossRef]
- Zhao, B.; MacMinn, C.W.; Juanes, R. Wettability control on multiphase flow in patterned microfluidics. Proc. Natl. Acad. Sci. USA 2016, 113, 10251–10256. [Google Scholar] [CrossRef] [Green Version]
- Holtzman, R.; Segre, E. Wettability Stabilizes Fluid Invasion into Porous Media via Nonlocal, Cooperative Pore Filling. Phys. Rev. Lett. 2015, 115, 1–5. [Google Scholar] [CrossRef] [PubMed]
- Xu, K.; Liang, T.; Zhu, P.; Qi, P.; Lu, J.; Huh, C.; Balhoff, M. A 2.5-D glass micromodel for investigation of multi-phase flow in porous media. Lab Chip 2017, 17, 640–646. [Google Scholar] [CrossRef] [PubMed]
- Yun, W.; Ross, C.M.; Roman, S.; Kovscek, A.R. Creation of a dual-porosity and dual-depth micromodel for the study of multiphase flow in complex porous media. Lab Chip 2017, 17, 1462–1474. [Google Scholar] [CrossRef] [PubMed]
- Dolomite Microfluidics Guide. 2011, p. 134. Available online: https://www.dolomite-microfluidics.com/support/downloads/ (accessed on 2 February 2019).
- Shahidzadeh-Bonn, N.; Tournié, A.; Bichon, S.; Vié, P.; Rodts, S.; Faure, P.; Bertrand, F.; Azouni, A. Effect of Wetting on the Dynamics of Drainage in Porous Media. Transp. Porous Media 2004, 56, 209–224. [Google Scholar] [CrossRef]
- Oughanem, R.; Youssef, S.; Bauer, D.; Peysson, Y.; Maire, E.; Vizika, O. A Multi-Scale Investigation of Pore Structure Impact on the Mobilization of Trapped Oil by Surfactant Injection. Transp. Porous Media 2015, 109, 673–692. [Google Scholar] [CrossRef]
Figure 1.
Microfluidic model pore network used in the experiments: (a) image of the device, the porous area is 10 × 60 mm2; (b) detail of the square network with constricted capillaries with different geometry; (c) cross section of the channels.
Figure 1.
Microfluidic model pore network used in the experiments: (a) image of the device, the porous area is 10 × 60 mm2; (b) detail of the square network with constricted capillaries with different geometry; (c) cross section of the channels.

Figure 2.
Visualization of the oil-water interface in a straight channel in the (a) hydrophilic (WW) and (b) hydrophobic (OW) devices. The images were used to measure the water phase contact angle for both cases.
Figure 2.
Visualization of the oil-water interface in a straight channel in the (a) hydrophilic (WW) and (b) hydrophobic (OW) devices. The images were used to measure the water phase contact angle for both cases.

Figure 3.
Detailed view of the pore space occupation after water injection: (a) water-wet (WW) micromodel; (b) oil-wet (OW) micromodel.
Figure 3.
Detailed view of the pore space occupation after water injection: (a) water-wet (WW) micromodel; (b) oil-wet (OW) micromodel.

Figure 4.
Examples of images after processing: (a) oil phase distribution in the entire model pore network; (b) zoom in of a small portion of the network showing oil ganglia of different sizes.
Figure 4.
Examples of images after processing: (a) oil phase distribution in the entire model pore network; (b) zoom in of a small portion of the network showing oil ganglia of different sizes.

Figure 5.
Water invasion pattern in two runs at the same flow conditions for the (a) hydrophilic (WW) porous media microfluidic device (Ca = 3.5 × 10⁻⁷) and (b) hydrophobic (OW) device (Ca = 6 × 10⁻⁶).
Figure 5.
Water invasion pattern in two runs at the same flow conditions for the (a) hydrophilic (WW) porous media microfluidic device (Ca = 3.5 × 10⁻⁷) and (b) hydrophobic (OW) device (Ca = 6 × 10⁻⁶).

Figure 6.
Water invasion pattern in two different hydrophilic porous media microfluidic devices manufactured from the same mask. Ca = 3.5 × 10⁻⁷.
Figure 6.
Water invasion pattern in two different hydrophilic porous media microfluidic devices manufactured from the same mask. Ca = 3.5 × 10⁻⁷.

Figure 7.
Phase distribution at the end of water injection as a function of capillary number: (a) water-wet and (b) oil-wet micromodels.
Figure 7.
Phase distribution at the end of water injection as a function of capillary number: (a) water-wet and (b) oil-wet micromodels.


Figure 8.
Residual oil saturation as a function of capillary number for water-wet and oil-wet model pore network.
Figure 8.
Residual oil saturation as a function of capillary number for water-wet and oil-wet model pore network.

Figure 9.
Sequence of images in the early stages of water invasion: (a–d) oil-wet media; (b–h) water-wet network.
Figure 9.
Sequence of images in the early stages of water invasion: (a–d) oil-wet media; (b–h) water-wet network.

Figure 10.
Sequence of images illustrating the water invasion until t = 240 s: (a) oil-wet model pore network; (b) water-wet model pore network.
Figure 10.
Sequence of images illustrating the water invasion until t = 240 s: (a) oil-wet model pore network; (b) water-wet model pore network.

Figure 11.
Number of trapped oil ganglia as a function of capillary number for water-wet and oil-wet devices.
Figure 11.
Number of trapped oil ganglia as a function of capillary number for water-wet and oil-wet devices.

Figure 12.
Ganglia size distribution at Ca = 5 × 10⁻⁵ for the water-wet and oil-wet porous media.

Figure 13.
Distribution of the trapped oil as a function of ganglia size for both WW and OW pore network models.
Figure 13.
Distribution of the trapped oil as a function of ganglia size for both WW and OW pore network models.

© 2019 by the authors. Licensee MDPI, Basel, Switzerland. This article is an open access article distributed under the terms and conditions of the Creative Commons Attribution (CC BY) license (http://creativecommons.org/licenses/by/4.0/).
Share and Cite
MDPI and ACS Style
Avendaño, J.; Lima, N.; Quevedo, A.; Carvalho, M. Effect of Surface Wettability on Immiscible Displacement in a Microfluidic Porous Media. Energies 2019, 12, 664. https://doi.org/10.3390/en12040664
AMA Style
Avendaño J, Lima N, Quevedo A, Carvalho M. Effect of Surface Wettability on Immiscible Displacement in a Microfluidic Porous Media. Energies. 2019; 12(4):664. https://doi.org/10.3390/en12040664
Chicago/Turabian StyleAvendaño, Jorge, Nicolle Lima, Antonio Quevedo, and Marcio Carvalho. 2019. "Effect of Surface Wettability on Immiscible Displacement in a Microfluidic Porous Media" Energies 12, no. 4: 664. https://doi.org/10.3390/en12040664
Note that from the first issue of 2016, this journal uses article numbers instead of page numbers. See further details here.