Experimental Study on Factors Affecting the Performance of Foamy Oil Recovery

1
Department of Polymer Science and Engineering, School of Chemistry and Chemical Engineering, Nanjing University, Nanjing 210093, China
2
State Key Laboratory for Enhanced Oil Recovery, Beijing 100083, China
3
College of Electromechanical Engineering, Geo-Energy Research Institute, Qingdao University of Science and Technology, Qingdao 266061, China
4
Research Institute of Petroleum Exploration & Development, China National Petroleum Corporation CNPC, Beijing 100083, China
*
Authors to whom correspondence should be addressed.
Energies 2019, 12(4), 637; https://doi.org/10.3390/en12040637
Submission received: 21 November 2018
/
Revised: 30 January 2019
/
Accepted: 12 February 2019
/
Published: 16 February 2019
(This article belongs to the Special Issue Enhanced Oil Recovery 2019)
Abstract
:The flow characteristics of dissolved gas driven processes in some heavy oil reservoirs, such as low gas–oil ratio and higher oil recovery rate than expected, are quite different from conventional oil production processes. Foamy oil is considered one of the main reasons behind such a production phenomenon. In this paper, the factors affecting the performance of foamy oil recovery were experimentally investigated in a sandpack medium with the assistance of computed tomography (CT) technology to help further the understanding of the mechanism. Five different experiments were applied and the results showed that (1) the linear pressure drop production model had a similar oil recovery to that of the step-down mode; (2) increasing the depletion rate could be more favorable to the oil recovery rate; (3) under a constant gas–oil ratio, raising the temperature had little impact on oil recovery, but showed obvious impact on the production curve; and (4) with higher permeability, there were more residual oil at the end of the displacement process. Lastly, a dry gas huff and puff experiment was conducted and the decreased oil saturation was observed in the inlet section, while no obvious effect was remarked in the outlet region of the medium.
1. Introduction
In recent years, the employment of dissolved gas on driving heavy oil has achieved notable development results. Due to the characteristics of high crude oil viscosity, slow gas diffusion rate, and large pressure gradient, the coalescence gas is not rapidly produced as a continuous gas phase, but it is dispersed in crude oil in the form of small bubbles that move with the crude oil. With all these descriptions, this gas–oil two-phase non-Darcy flow system is called the foamy oil flow. This special flow characteristic can increase the oil recovery rate and reduce the producing gas–oil ratio.
The phenomenon of foamy oil was first observed in the early 1960s. Smith [1] first used the term “oil–gas mixture flow” to describe the phenomenon in which small bubbles disperse in the heavy oil phase. Sarma and Maini [2] first applied the term foamy oil and defined it as the dispersed gas phase in the continuous oil phase. This definition distinguishes the foamy oil from a two-phase flow in conventional reservoirs. According to the observation of the glass micromodel experiment, Bora [3] proposed that bubble formation in a dissolved gas driven reservoir generally includes five processes: supersaturation, bubble nucleation, bubble growth, bubble merging and splitting. Busahmin et al. [4] conducted 10 experiments with different kinds of gas components to study their performance on solution gas drive in foamy heavy oil system. It turned out that ethane provided the lowest recovery, and methane obtained a higher recovery than CO2. Mohammed et al. [5] proposed a mathematical model to evaluate the pressure and depletion rate for a foamy oil driven reservoir, which resulted in a more accurate prediction of the variable pressure changes in the heavy oil reservoir. Francisco et al. [6] discussed the capillary effect of the temperature gradient of a soluble gas driven heavy oil system; the results showed that the relative permeability curve and the gas–oil interface location were strongly influenced by the temperature change. The hydromechanical deformation in the recovery process has also become a major concern in recent studies [7,8,9,10,11].
Most previous studies, such as those reported by Sheng et al. [12], Maini [13], Ostos et al. [14], Stik et al. [15], Claridge et al. [16], Alshmakhy et al. [17], Sun et al. [18] and Liu et al. [19], have focused on the characteristic curve of foamy oil extraction, which is insufficient to research the bubble generation and evolution mechanism or the mechanism of the seepage flow effect during foamy oil flow. Some efforts have been made to visualize the foamy oil displacement process in porous media. Tang et al. [20,21] carried out a series of tests on a solution gas driven system for heavy oil to study the effects of initial water saturation, temperature and the gas–oil ratio (GOR) with the help of a visual core holder. They found that initial water saturation reduces gas-bubble density, temperature increment decreases cold production efficiency due to a substantial increase in gas relative permeability, and solution GOR has a significant effect on gas-bubble nucleation for solution gas driven systems for the conditions in their work. Liu et al. [22] offered a glass beads visualized model to illustrate the stability of foamy oil in heavy oil reservoirs. Liu et al. [22] pointed out that the volume of the foam phase decreased when the injection steam was over 70 °C; thus, the thermal enhanced oil recovery (EOR) process should not be employed in the early period of developing heavy oil. Zhang and Tahmasebi [23,24] used a glass model to study how CO2 could influence the external stress of a solid system. Moulu et al. [25] was interested in the stresses at the sandstone boundaries with multiple fluid phases. Their results showed that the relative permeability was affected by the change of pore geometry.
The micromodel used in such studies has a gap in both temperature and pressure from real reservoir medium. With advanced scientific facilities, the study of the fluid mechanism has been moving into the micro-scale level. Wellington et al. [26] was one of the first groups who used the X-ray technique. Later, Kleinberg et al. [27] and Bryan et al. [28] discussed the properties of reservoir fluids through nuclear magnetic resonance (NMR) methods. The behavior of the formation volume factor of foamy oil was observed by X-ray devices and the relationship between the viscosity and the pressure was revealed with nuclear magnetic resonance (NMR) techniques. Lv et al. [29] employed the computed tomography technique to reveal three distinct stages in the foamy oil extraction: the elastic flooding single-phase oil flow stage above the bubble point pressure, the foamy oil flow stage from the bubble point pressure to the pseudo bubble point pressure and the gas flow below the pseudo bubble point pressure stage. They carried out a comprehensive analysis based on the continuous evolution of computed tomography (CT) scan saturation images and successfully employed frequency distribution curves to define the critical gas saturation and critical gas saturation of bubble generation. In addition, they established a method for the evaluation of the size and quantity of single gas bubbles and the continuous gas phase.
To scrutinize the mechanism of the foamy oil flow characteristics and thus supply valuable instruction for heavy oil recovery field practices, this paper reports extensive studies on various influential factors on foamy oil flow, including the pressure drop rate, the formation temperature and the sandpack permeability.
2. Experiment
2.1. Experimental Equipment
In this study, a core CT scanning displacement system which integrates a GE’s spiral CT scanner, QUIZIX pumps, and ISCO pumps were employed to visualize the displacement process and further analyze the seepage mechanism. A water bath circulation heater with an oil–gas separation meter was also applied to maintain the sandpack temperature. The porous medium prepared by packing 100–120 mesh silica sand was employed in the experiments. The 80-cm-long core holder was made of PEEK with a strong X-ray penetration to facilitate the CT scanning process under temperatures of 80 °C and a pressure of 10 MPa. Figure 1 presents a schematic of the experimental setup.
2.2. Experimental Fluids
White oil was employed to fill the sandpack for the subsequent saturation experiment of live oil. The live oil was recombined with the dead crude oil and a natural gas mixture to reach the original dissolved gas–oil ratio of 18 m3/m3 (more properties of live oil are listed in Table 1). The gas mixture was made of CH4 and C2H6 with a molar ratio of 87:13. And water content of the live oil is negligible in this experiment.
2.3. Experimental Procedure
The whole experiments were based on the simulated depletion of a real oil field.
- First, the dry sand-filled sandpack was CT scanned to obtain the dry model and check if the sandpack was packed uniformly.
- Then, the white oil was pumped into the sandpack to pre-saturate the sandpack, which would make the crude oil saturation process more complete.
- The live oil was injected from a mixing cell to prevent gas segregation.
- After the sandpack was saturated by live oil at reservoir pressure and temperature, the inlet valve was closed.
- The fluid was produced from the outlet, which was controlled by a relief valve.
- The pressure was recorded by the piezometers among the sandpack.
- The sandpack was scanned every 10 min to achieve the real-time monitoring of the heavy oil depletion process.
- Every single experiment was ended when the system pressure reached atmosphere and no more liquid was produced.
2.4. Experimental Conditions
Five individual experiments, as shown in Table 2, were performed under different conditions to fully investigate the parameters that influence the foamy oil production behavior.
Experiment 1 was a step-down depletion model, which was operated as follows: After dropping the pressure by 0.2 MPa at the outlet, the outlet valve was opened to produce oil until no more liquid was collected. Then the valve was closed and the pressure was dropped another 0.2 MPa. The experiment was ended when the outlet pressure reached atmosphere pressure.
The other experiments were operated with a constant depletion rate, so the oil was produced with a constant pressure drop. Experiments 2 and 3 had different depletion rates, and investigated the speed effect on the flow behavior. Experiments 2 and 4 were designed to discuss foamy oil behavior under different temperatures. Experiments 2 and 5 studied how permeability could affect the foamy oil recovery. Experiments 1 and 2 were used to analyze different types of pressure depletion modes.
Furthermore, a gas huff-n-puff process was studied in Experiment 4 to evaluate the possibility of using the produced natural gas resource on enhanced oil recovery (EOR). After the main process of Experiment 4, a gas mixture of CO2 and CH4, with a molar ratio of 13:87 (which is the same gas composition needed to form the live oil in the previous section), was injected through the outlet valve to reach the initial pressure of Experiment 4 (around 7.1 MPa). Then, the outlet was opened to simulate a huff-n-puff process.
3. Results and Discussion
3.1. Effect of the Depletion Scenario in Foamy Oil Flow Behavior
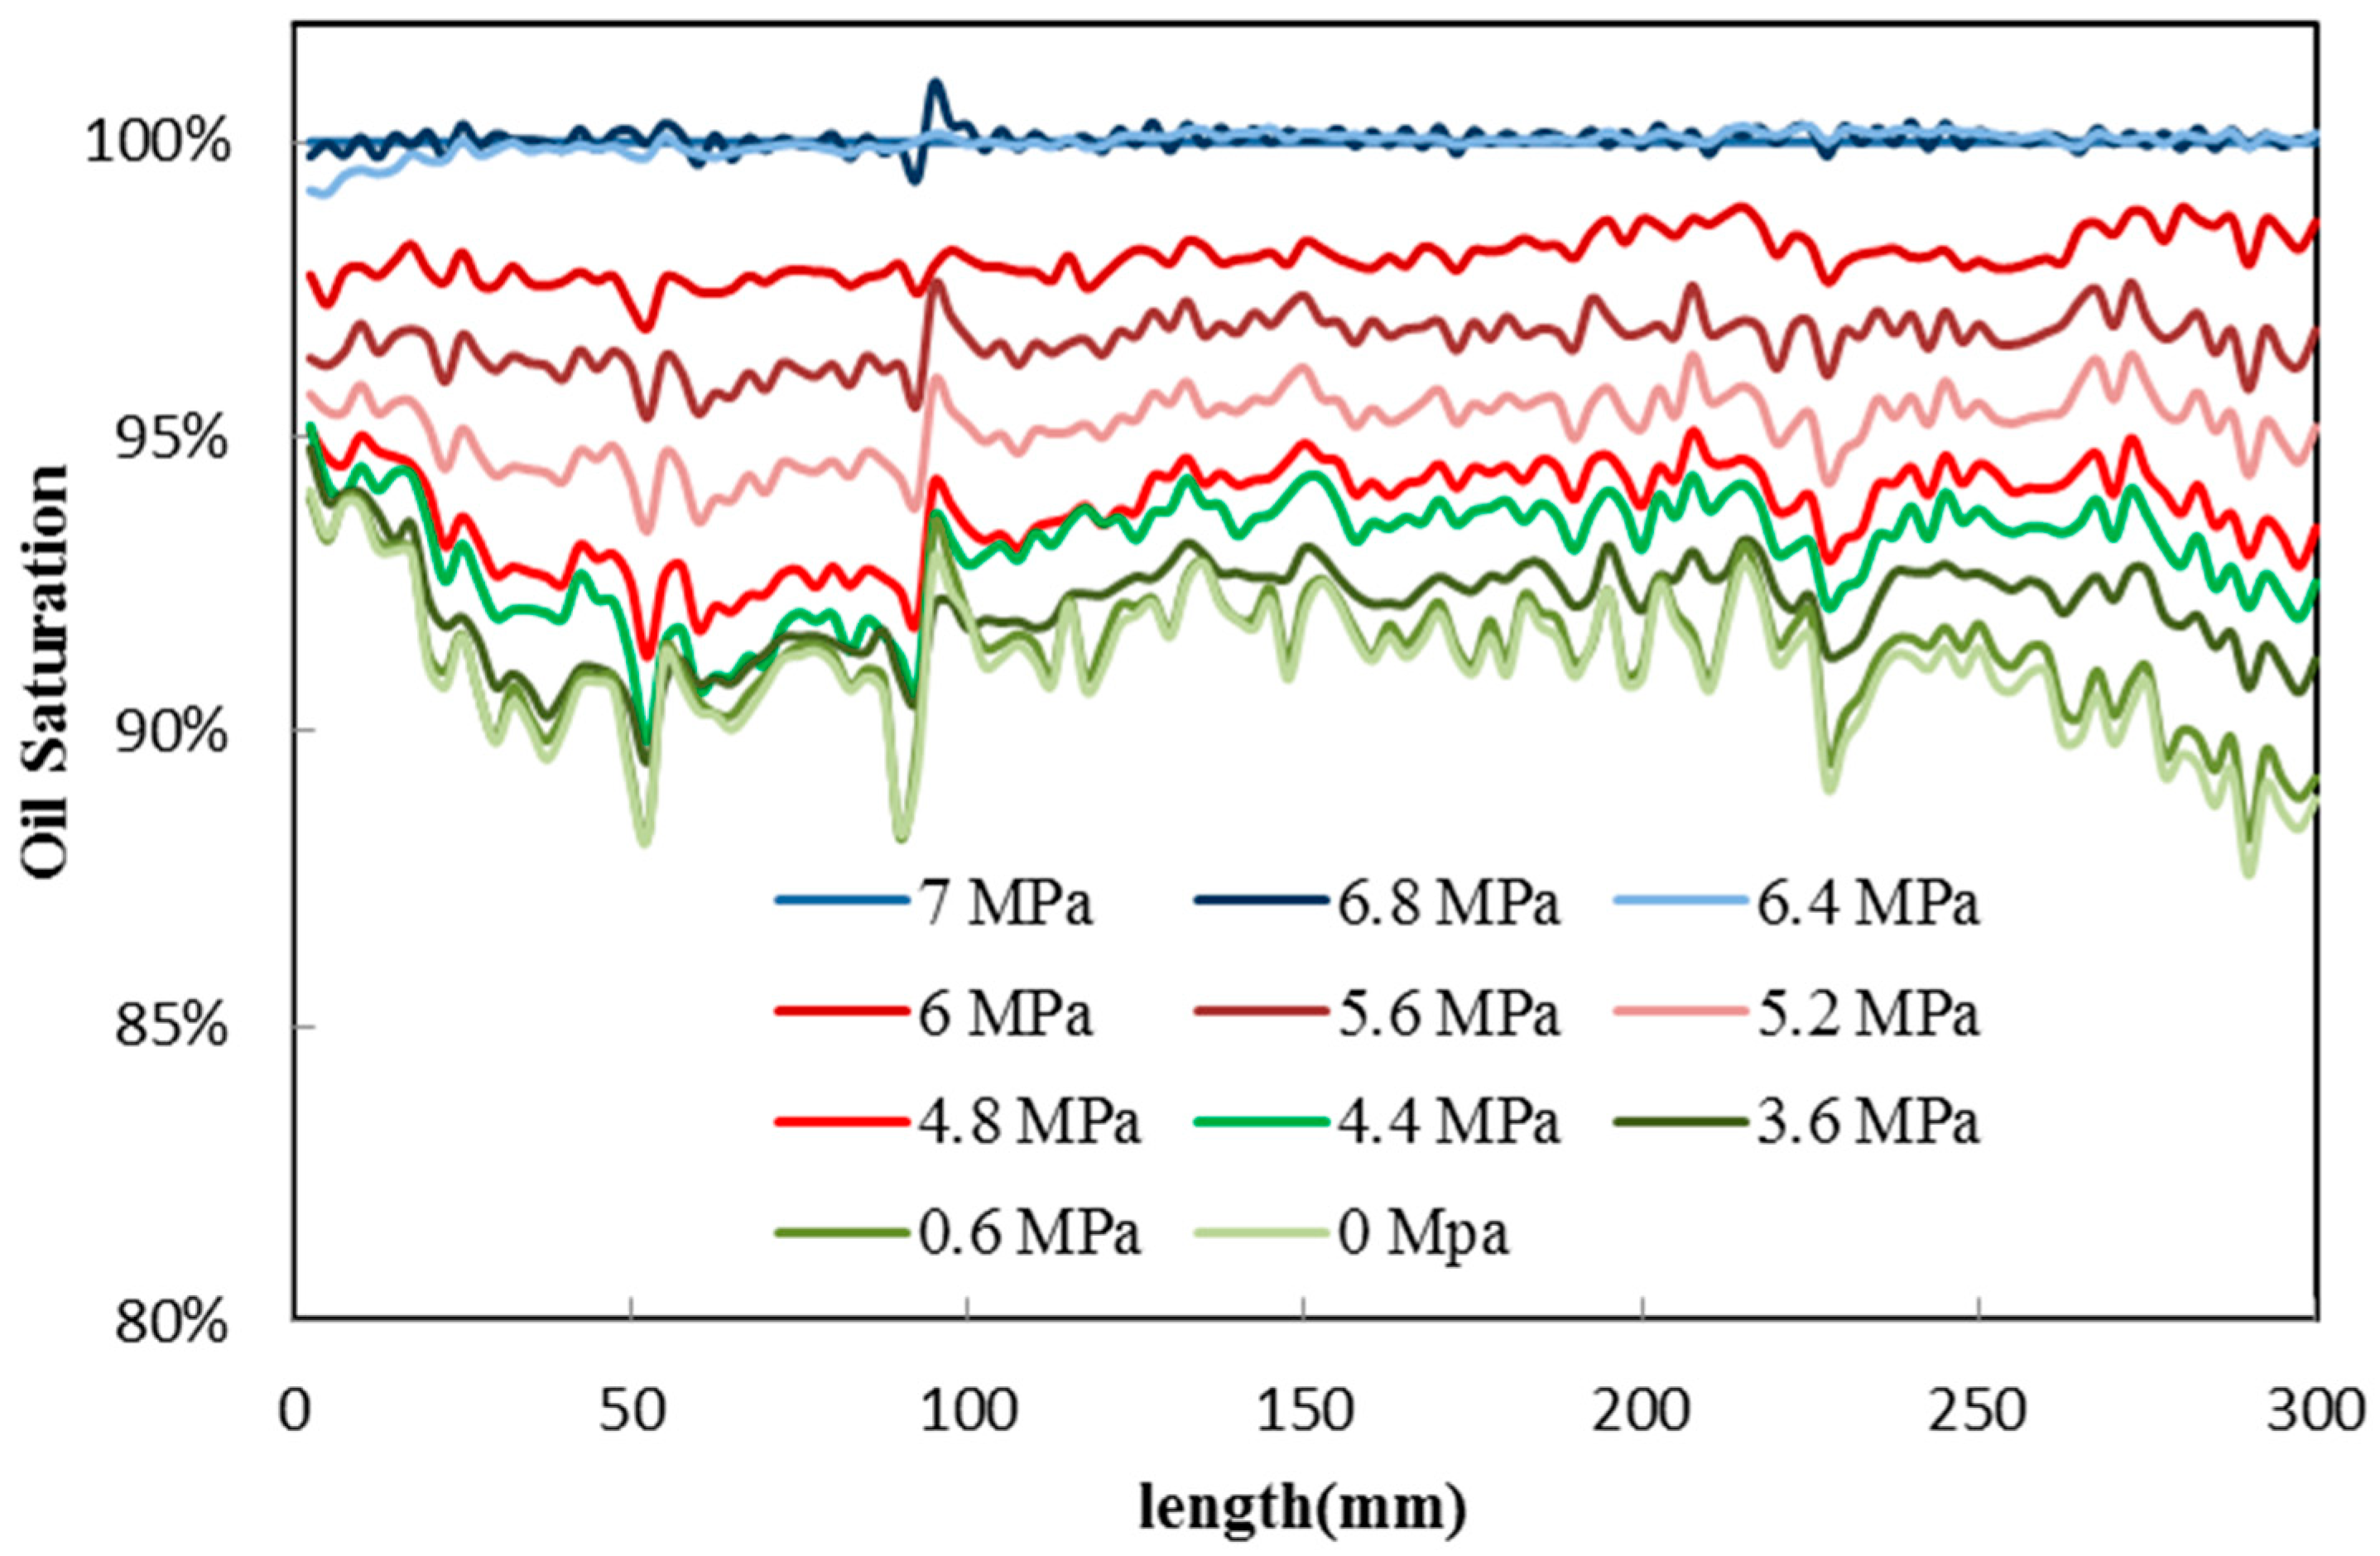
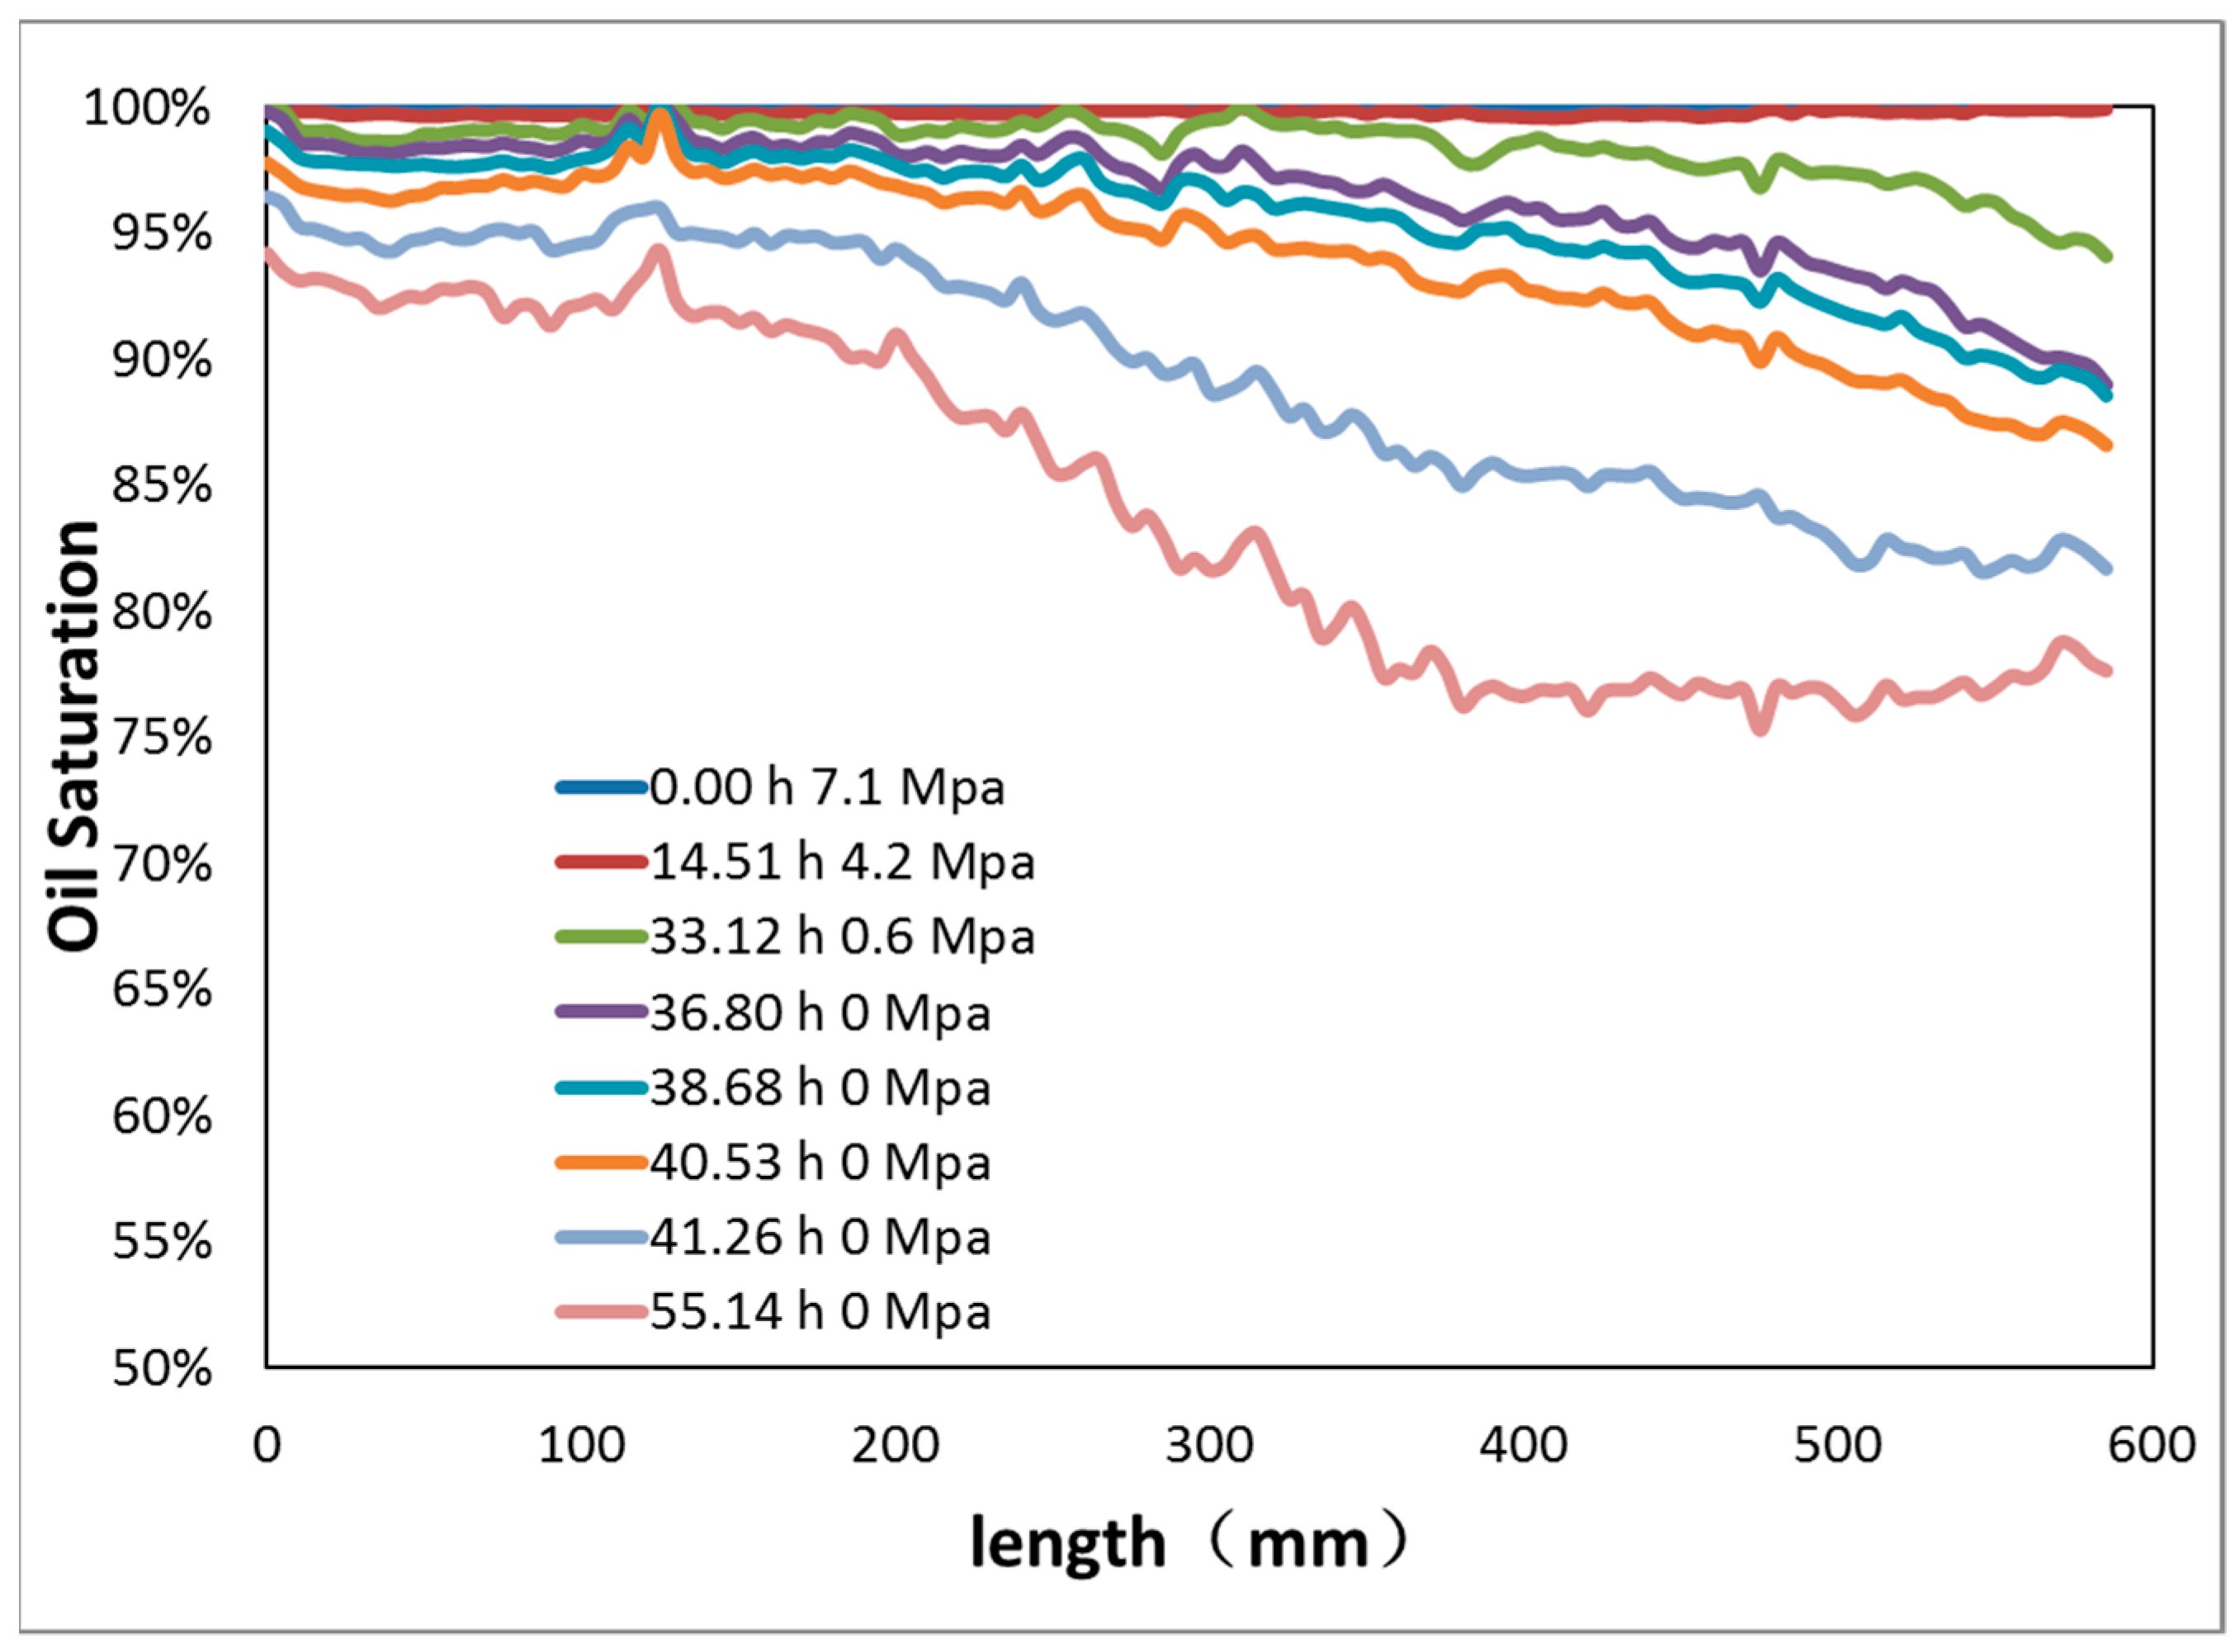
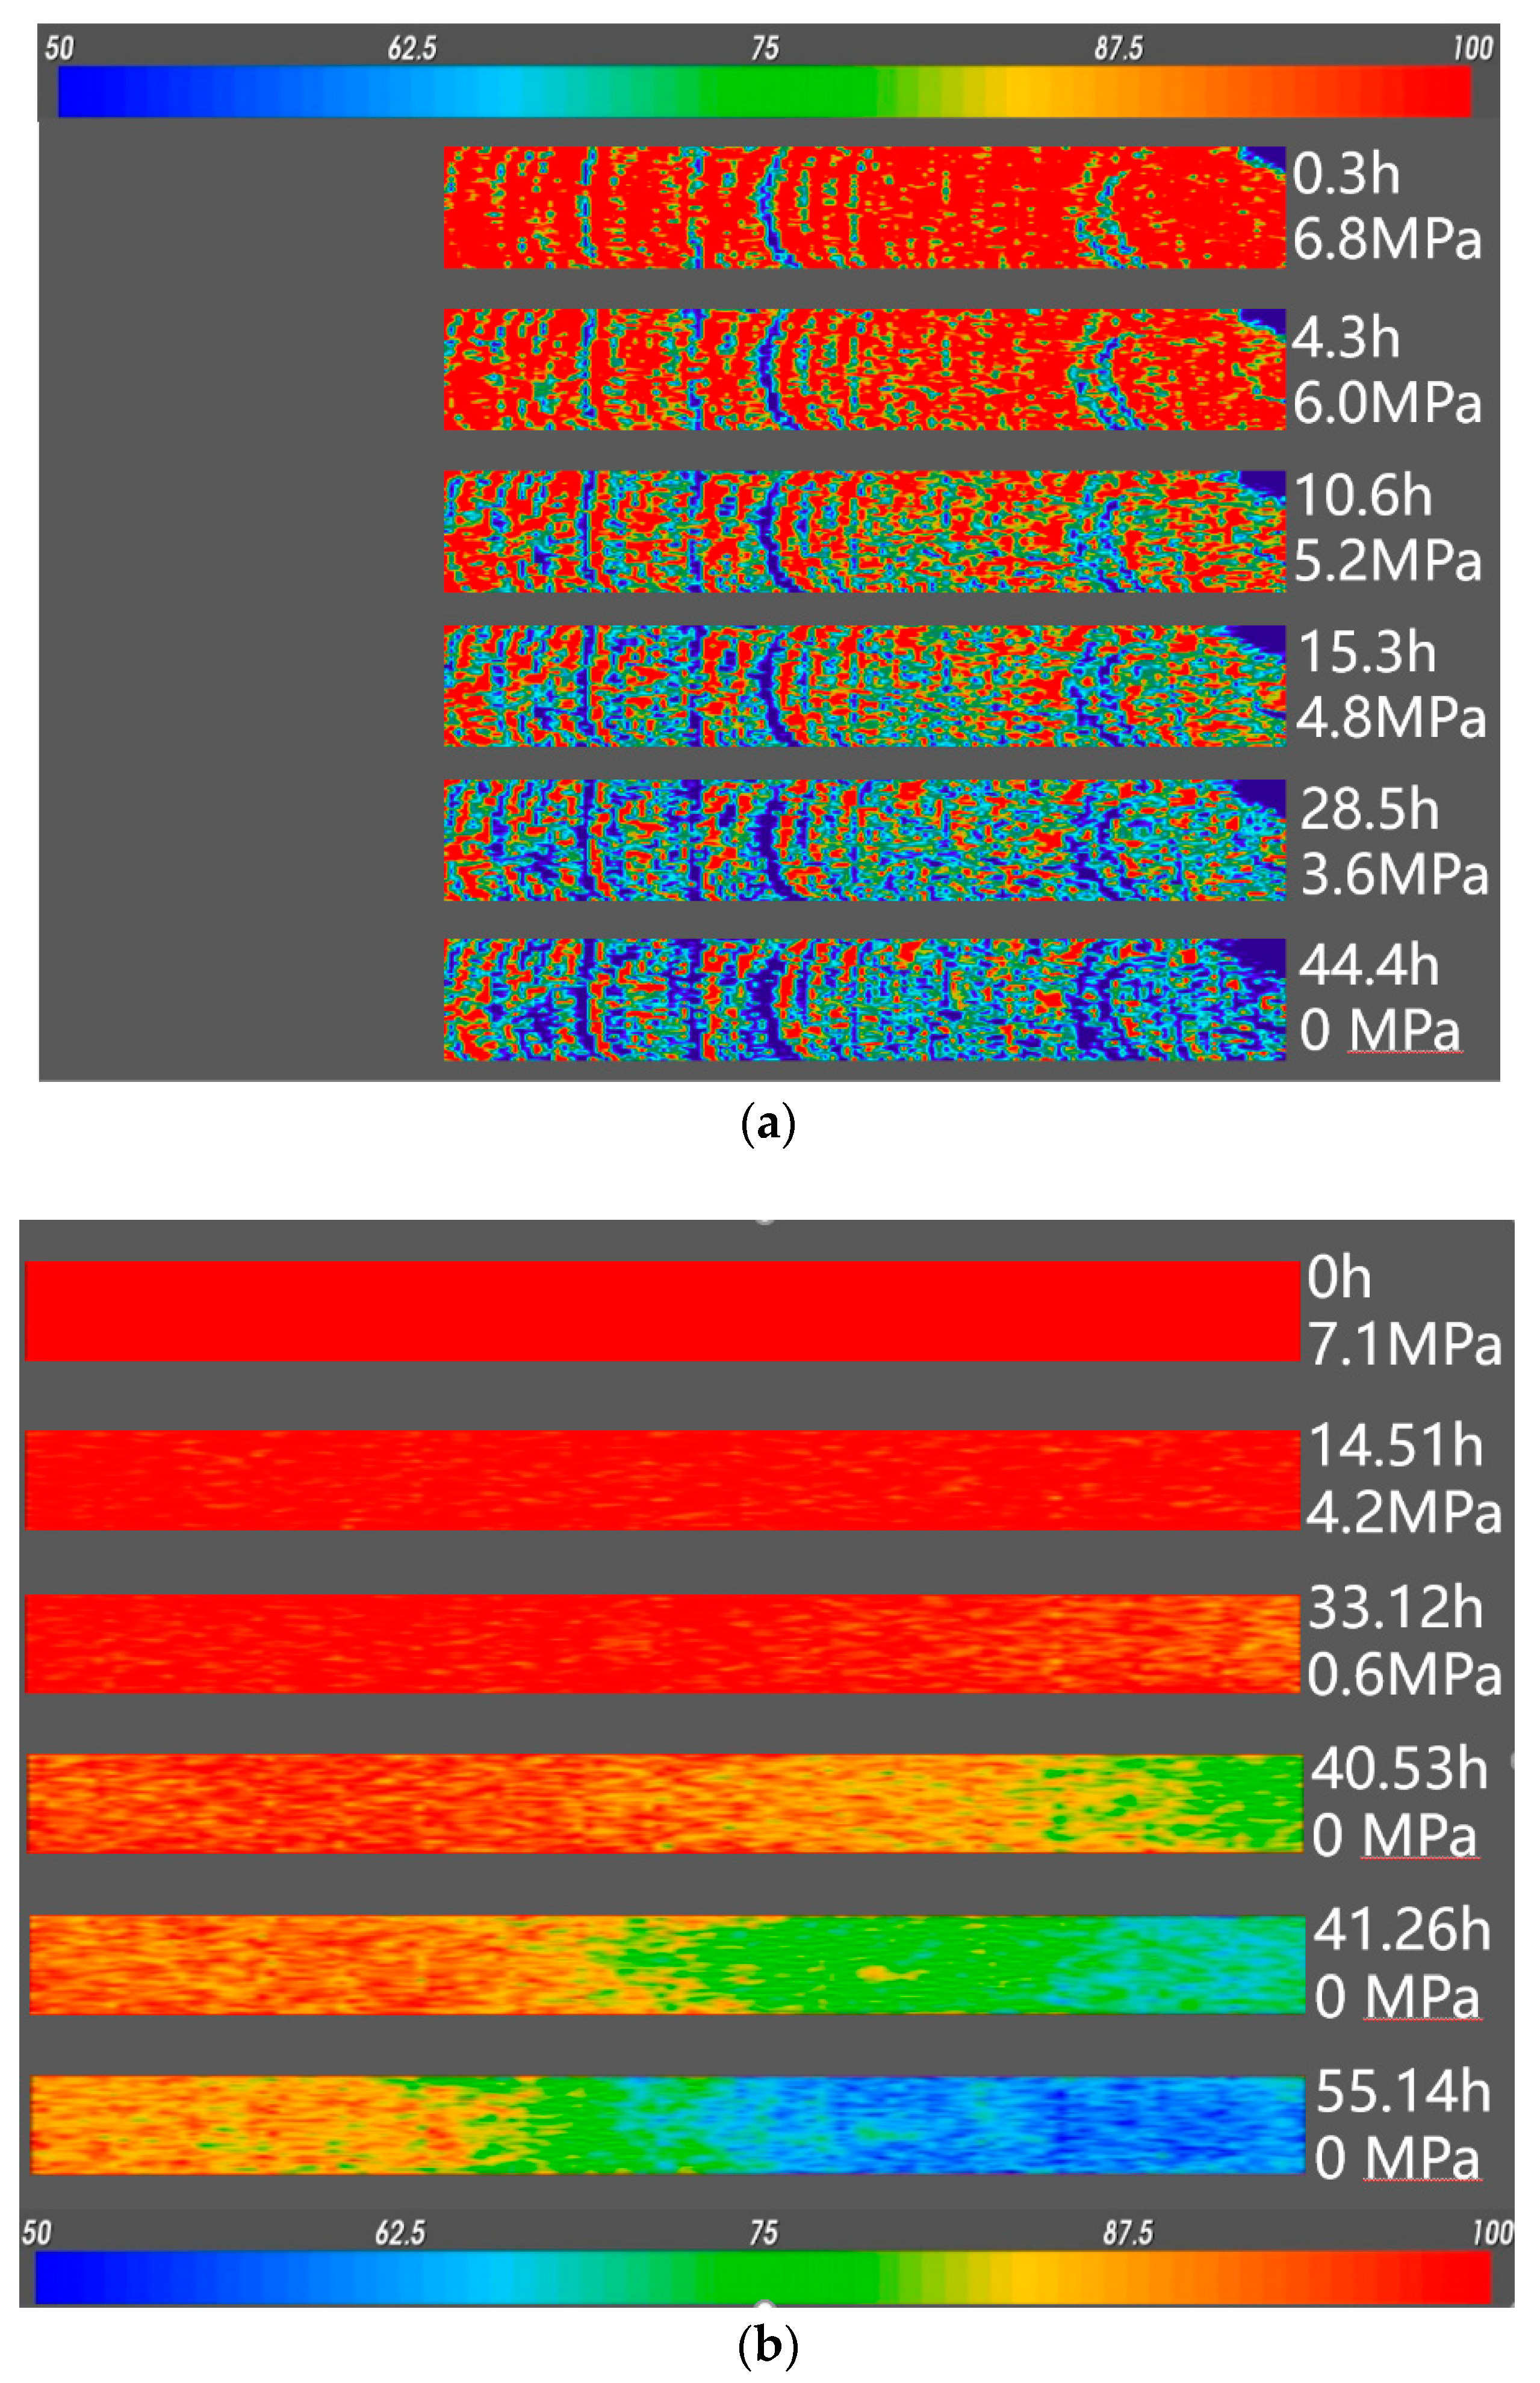
As revealed from the saturation distribution graphs, the step-down depletion presented a uniform oil saturation decline through the whole process (Figure 2). The linear depletion (Figure 3), on the other hand, resulted in a sharp decline trend after one-third of the sandpack was used to recover a significant amount of oil at the outlet, leaving a huge amount of residual oil near the inlet zone. The explanation of this difference is that, in the step-down process, the gas has enough time to form bubbles before opening of the outlet valve, which could raise the expansion energy. However, in the linear mode where gases were produced immediately with oil, bubbles did not have enough time to gather and form large bubbles. This phenomenon can also be observed in the CT reconstructed image of the oil saturation as shown in Figure 4.
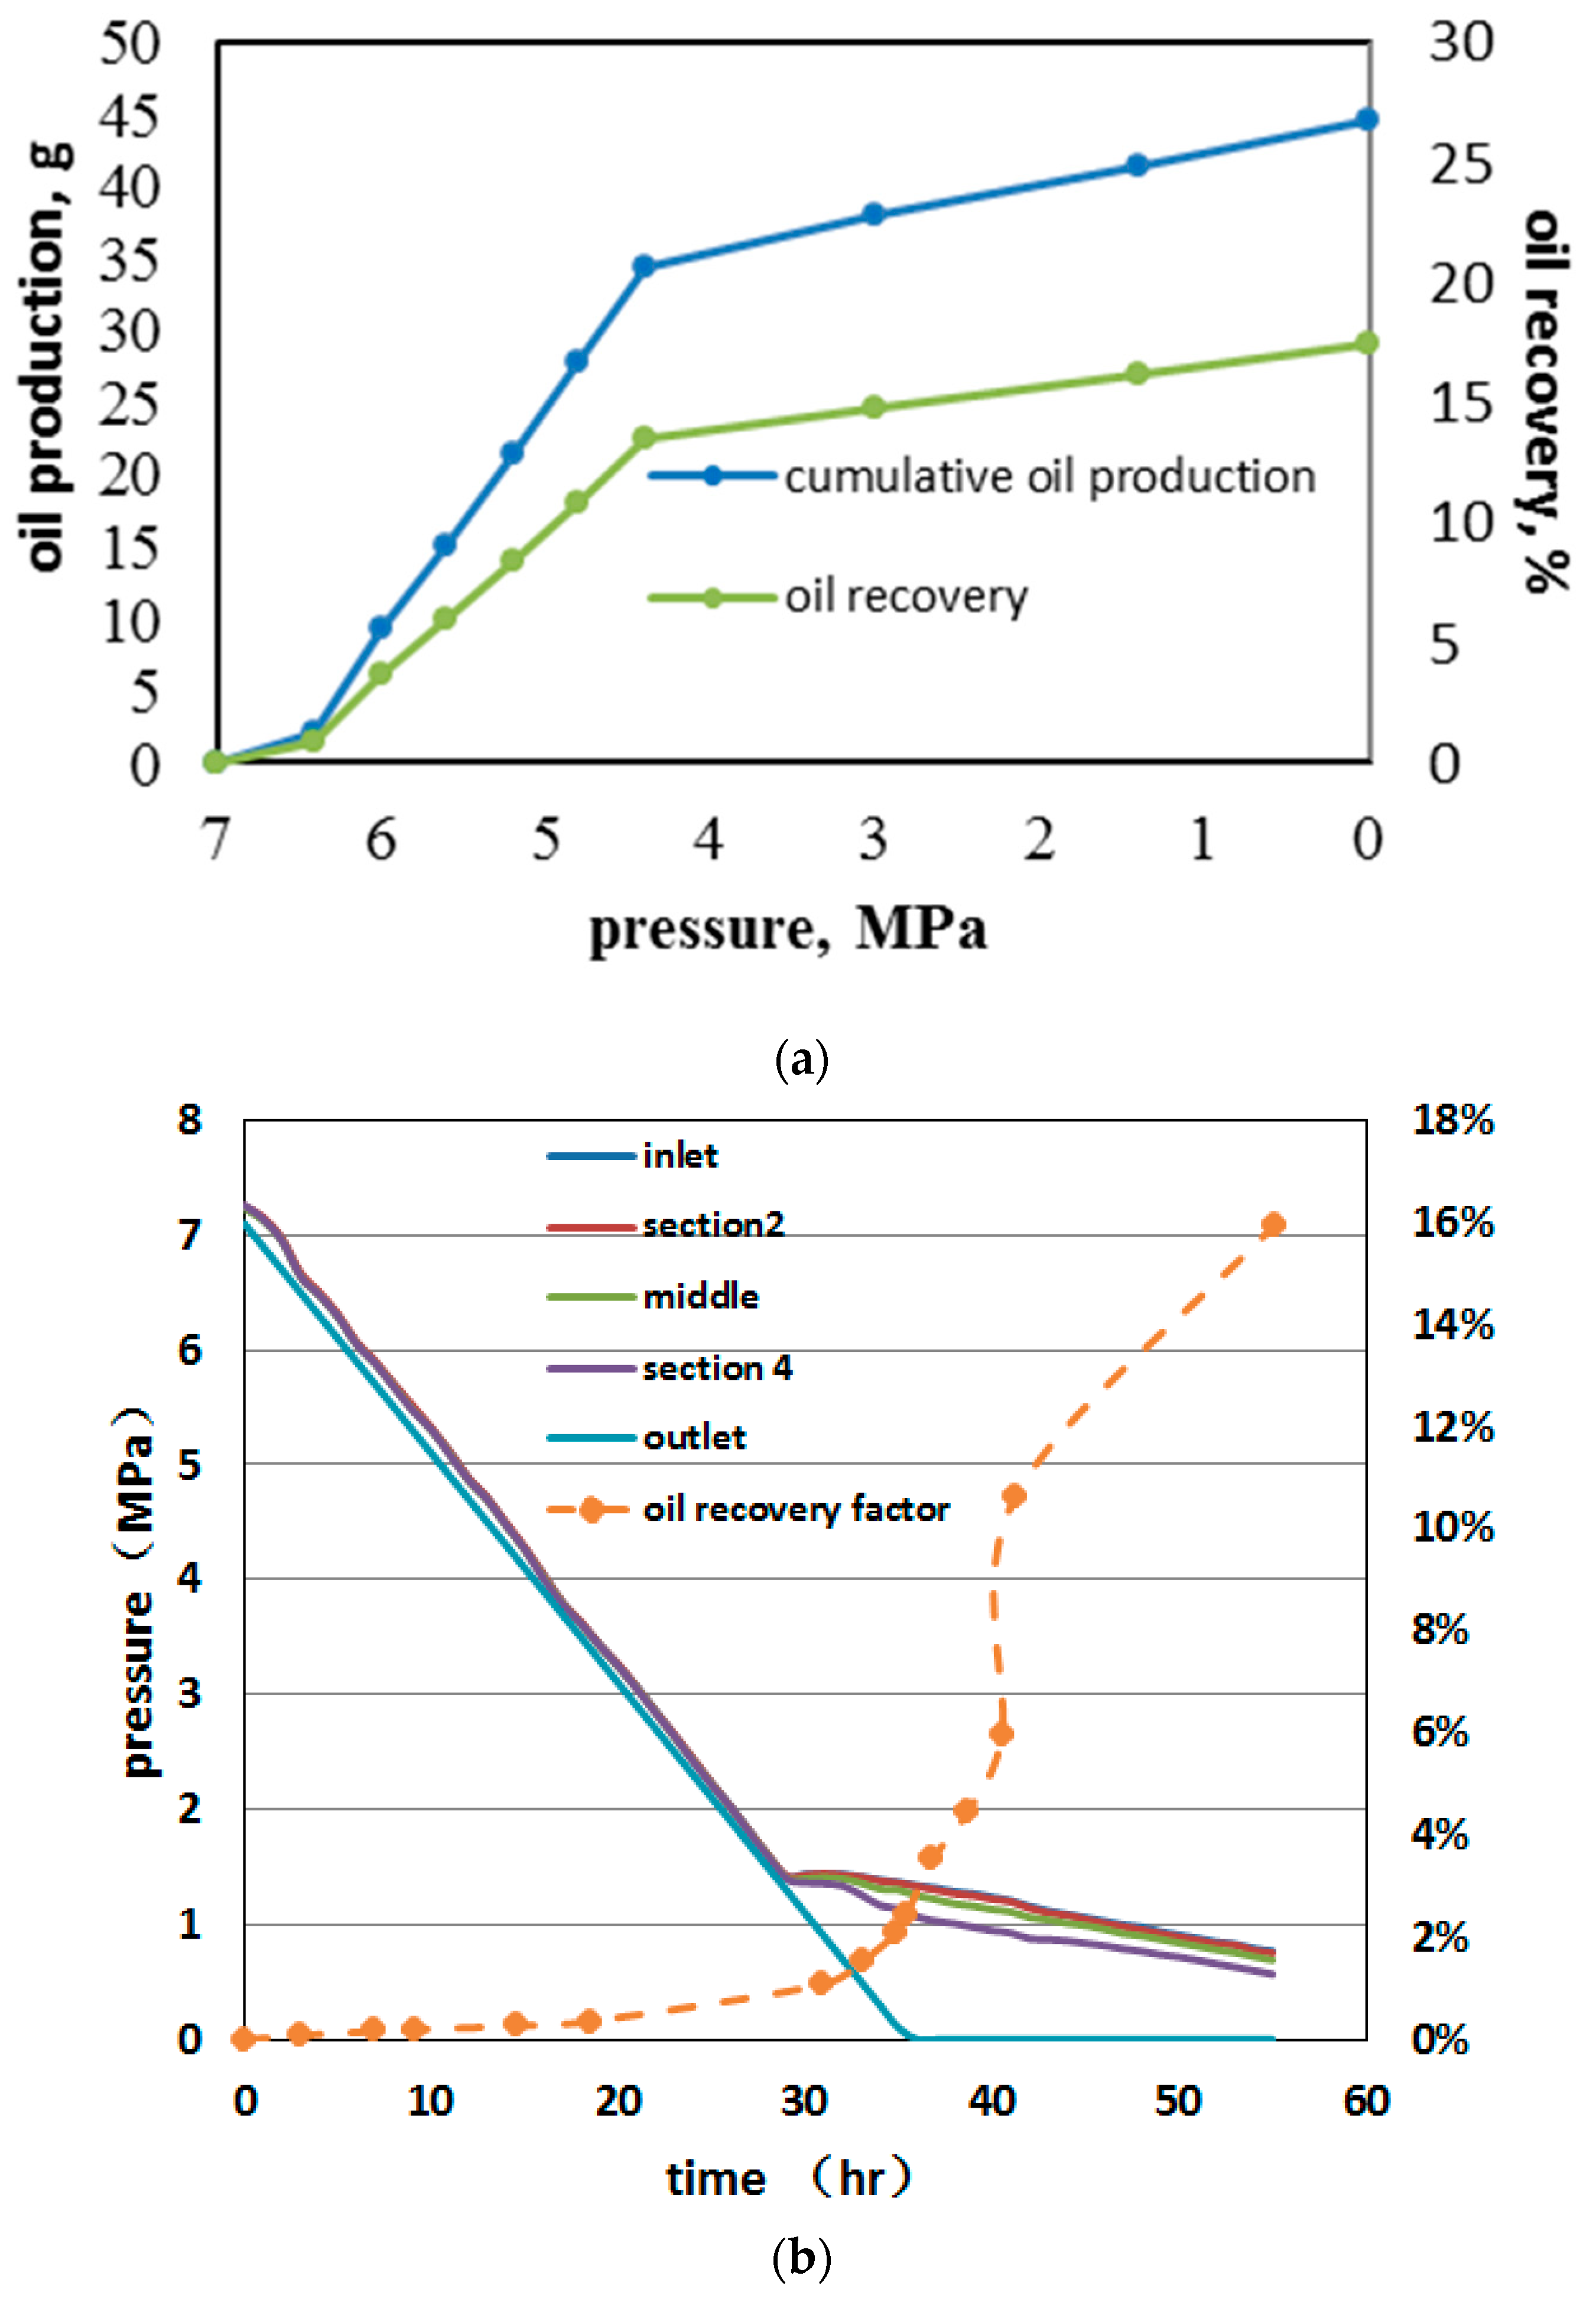
In the step-down process, three stages were presented in the development. The first started with a single oil-phase flow stage, followed by the foamy oil flow stage, and ending with the gas channeling stage. The second stage, which lies between the bubble point pressure and the pseduo bubble point pressure, was the major oil recovery period. However, as seen from Figure 5b, no apparent oil production was observed through the bubble point pressure and the major recovery part was near the atmosphere pressure. Moreover, no gas breakout was observed in the system; the gas was released from the produced oil in the atmosphere environment. Thus, it can be concluded that the linear model reduced the starting pressure of the foamy oil flow stage.
Figure 6 presents the tomography reconstruction images of three different depletion experiments. In the step-down model, noticeable gas bubbles filled around the bubble point pressure and gas gathered and joined into a continuous gas phase when the pressure was below the bubble point pressure (i.e., the green area tip on the left column of 5.6 MPa). The free gas phase was established at the end of the experiment (the blue spots indicate high gas saturation). Experiment 2, the one with a depletion rate of 0.2 MPa/h, had no clear bubbles shown until the pressure dropped to 0. Another linear system with a higher rate, Experiment 3, was similar to the former one and no obvious gas zone was detected through the entire process. However, it took only half of the time to reach 0 MPa compared to the other two experiments.
3.2. Effect of the Depletion Rate on the Linear Pressure Drop Process
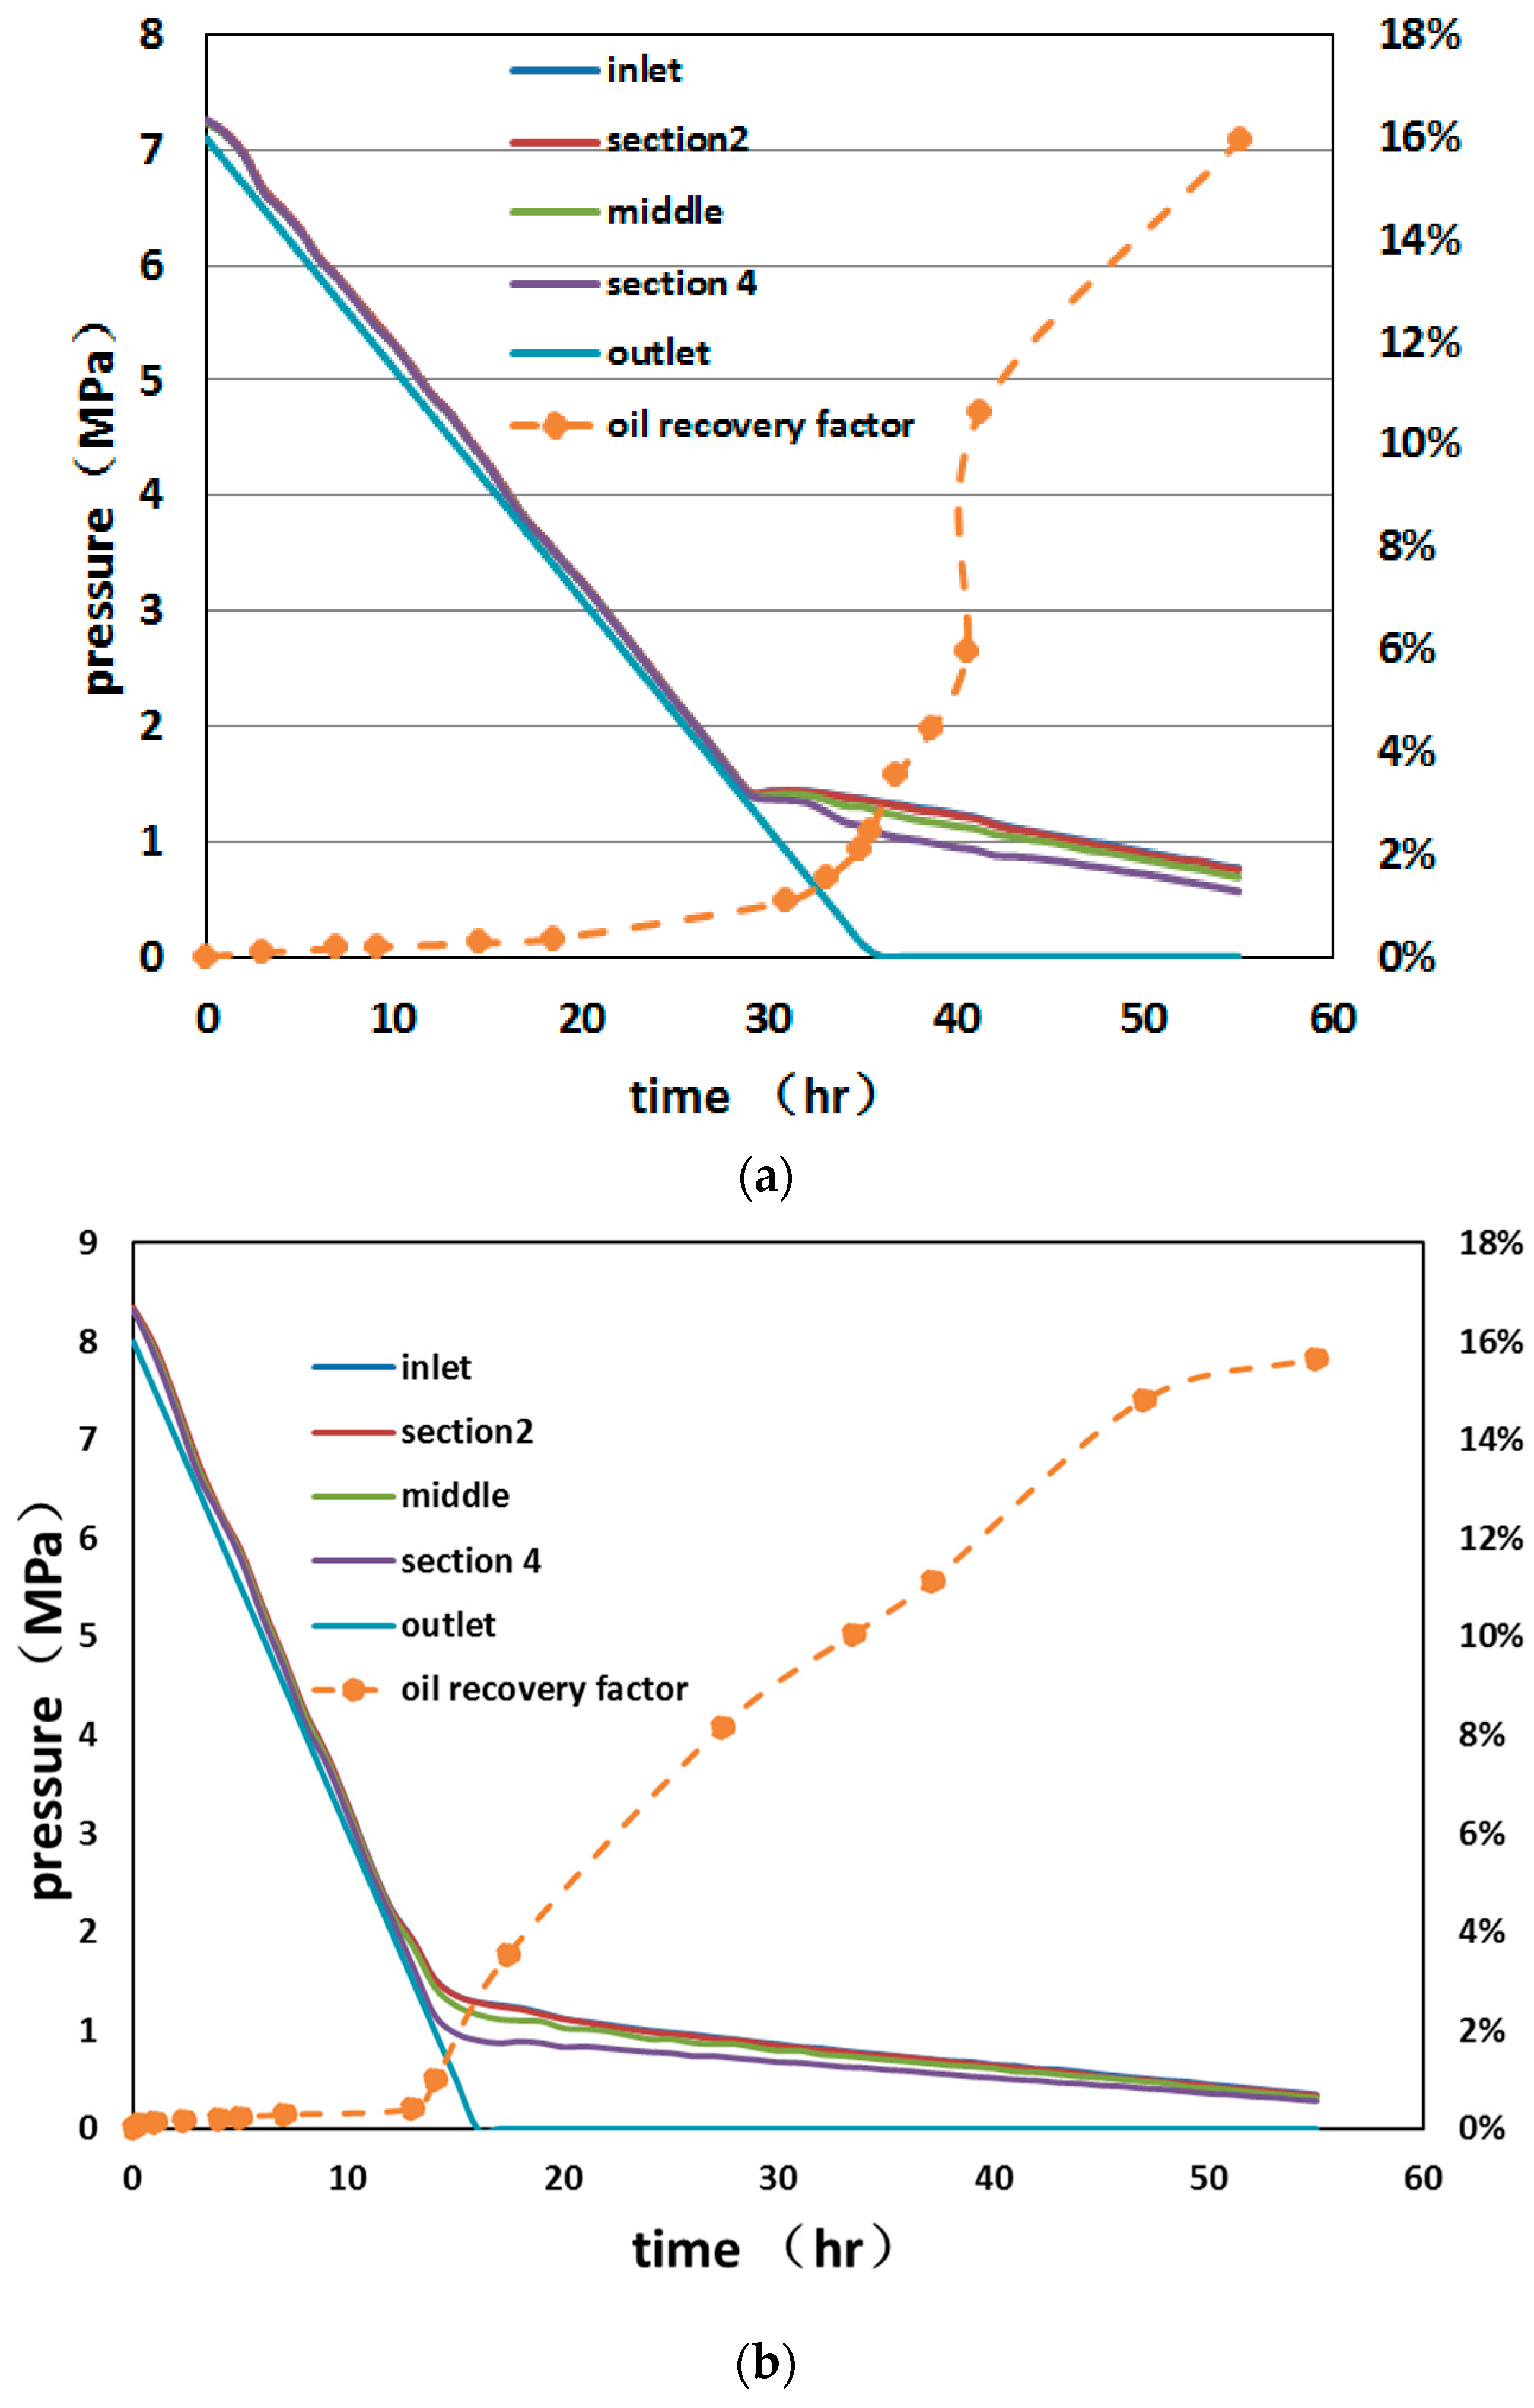
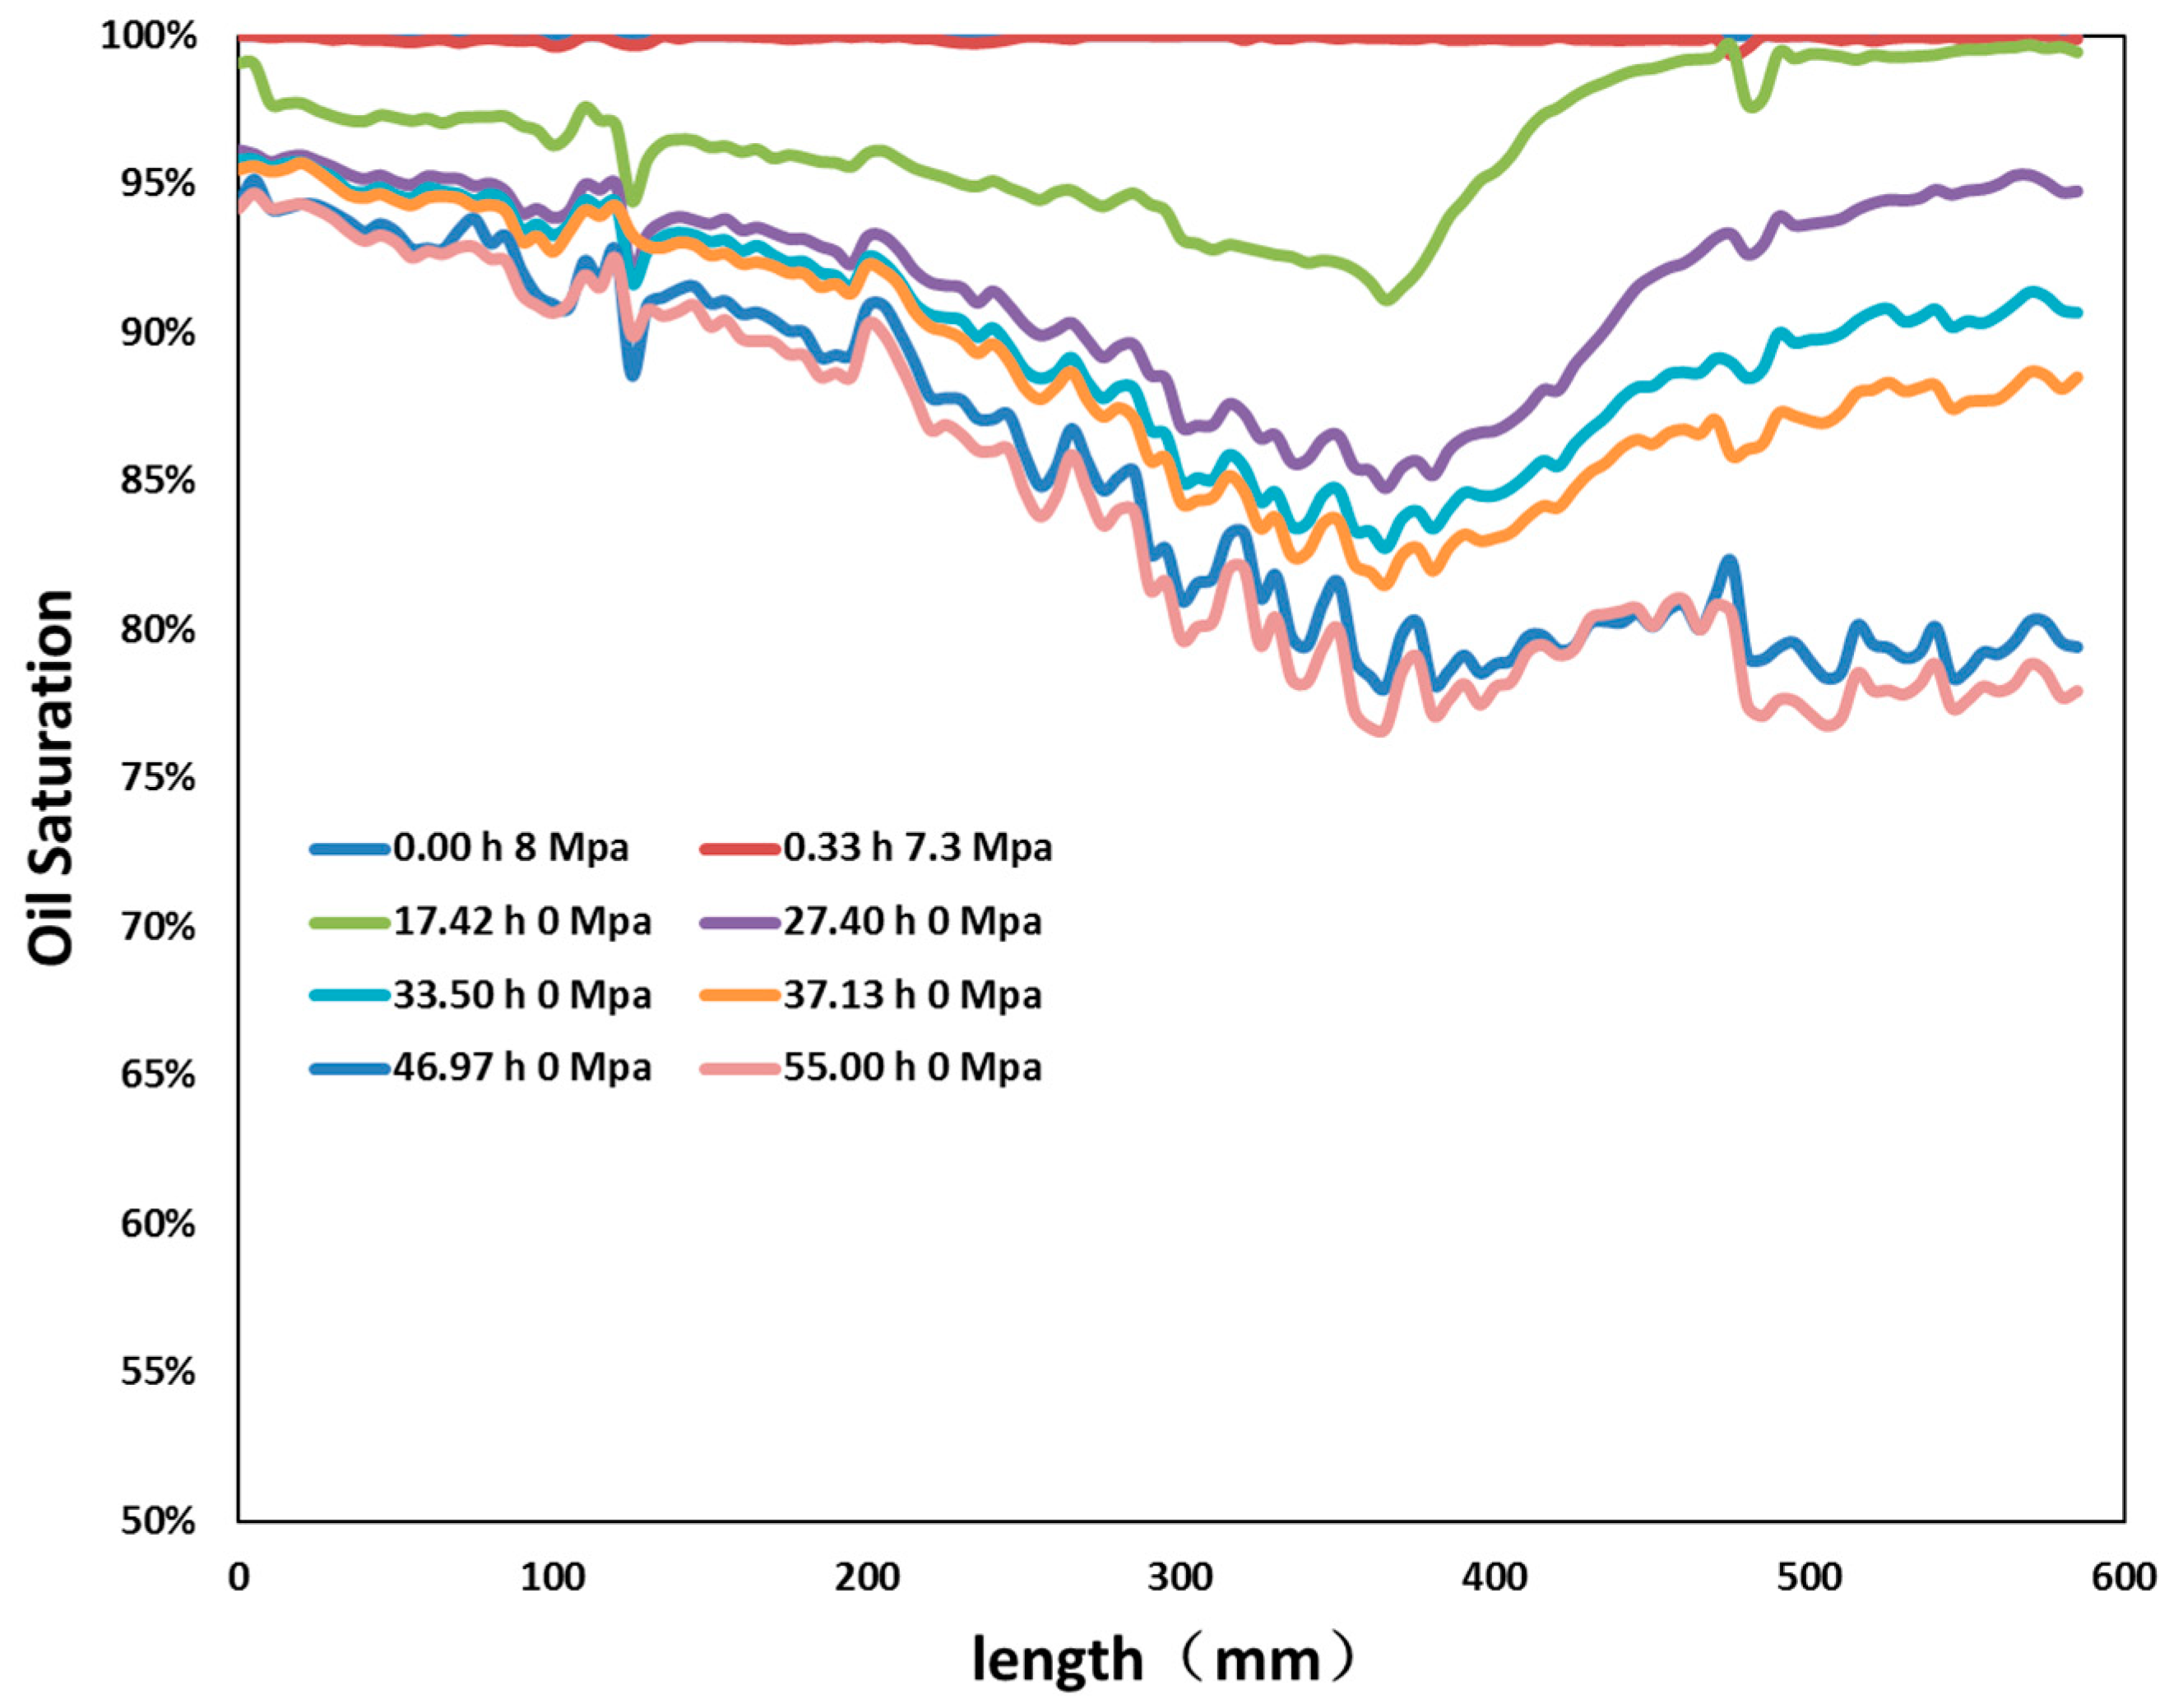
Alshmarhy and Maini [17] provided a result based on a certain foam surfactant, indicating that a slower depletion rate was beneficial to a higher recovery. A similar flow behavior was detected without any surfactant. Through the comparison of Experiments 2 and 3 (Figure 7), raising the decompression rate to a certain degree was found to influence the oil recovery performance. As exhibited in Figure 8, the residual oil in Experiment 3 mainly stayed near the inlet section; however, the oil saturation trend decreased slowly after half of the sandpack was used and the oil was gathered in the outlet part until the process reached to the end, when a significant amount of oil was produced. This can be explained by the fact that, with a higher rate, there was not enough time for gas bubbles to equally disperse, which led to the viscosity difference of the whole sandpack. The residual oil in the second half had a higher viscosity, which was more difficult for the gas (in the former half) to push the oil out of the sandpack. This resulted in a slower recovery trend in the saturation curve.
3.3. Effect of the Temperature on the Linear Pressure Drop Depletion
Comparing Experiments 2 and 4, it was clear that increasing the temperature to 80 °C increased the oil recovery from 15.96% to 17.24%, but also doubled the time to reach the same oil recovery. The differences in Figure 4b and Figure 9 show that with a higher temperature, the oil was displaced more completely near the inlet zone and the residual oil was mainly located in the outlet section, which was contrary to 60 °C. This phenomenon is attributed to the fact that the foamy oil was less stable with a higher temperature. Increasing the temperature will decrease the viscosity, which is a disadvantage for heavy oil, leading to trapped gas bubbles and increasing the possibility of gas channeling. Moreover, because the gas bubbles were more frequently moving in the crude oil, the gas was prevented from expanding into bigger bubbles, which also influenced the stability of foamy oil. Consequently, the bubbles in front of the sandpack pushed the oil flowing to the end, and the bubbles near the outlet zone tended to directly flow out from the outlet valve. Thus, due to the coming fluid and the de-gassed heavy oil, the residual oil was gathered in the outlet section. P. Liu et al. [22] conducted an experiment using hot water to increase the oil recovery with a glass beads model. Their result indicated that hot steam over 70 °C decreased the foam stability. However, this paper provided a more visualizable explanation for such phenomena. Comparing Figure 4 and Figure 9, the sandpack with a temperature of 60 °C (Experiment 2) was well developed in 55.14 h; however, at a similar time of 52.5 h, Experiment 3 (at 80 °C) reached only one-third of its recovery. This indicated that with a higher temperature, the solution gas was produced quickly, contrary to the foamy oil mechanism. The remaining amount of oil recovery was mainly due to the decrease of viscosity of the heavy oil, taking a much longer recovery period. Thus, to obtain a higher oil recovery with a shorter recovery time, the depletion temperature should be carefully determined.
3.4. Natural Gas Huff-n-Puff Process
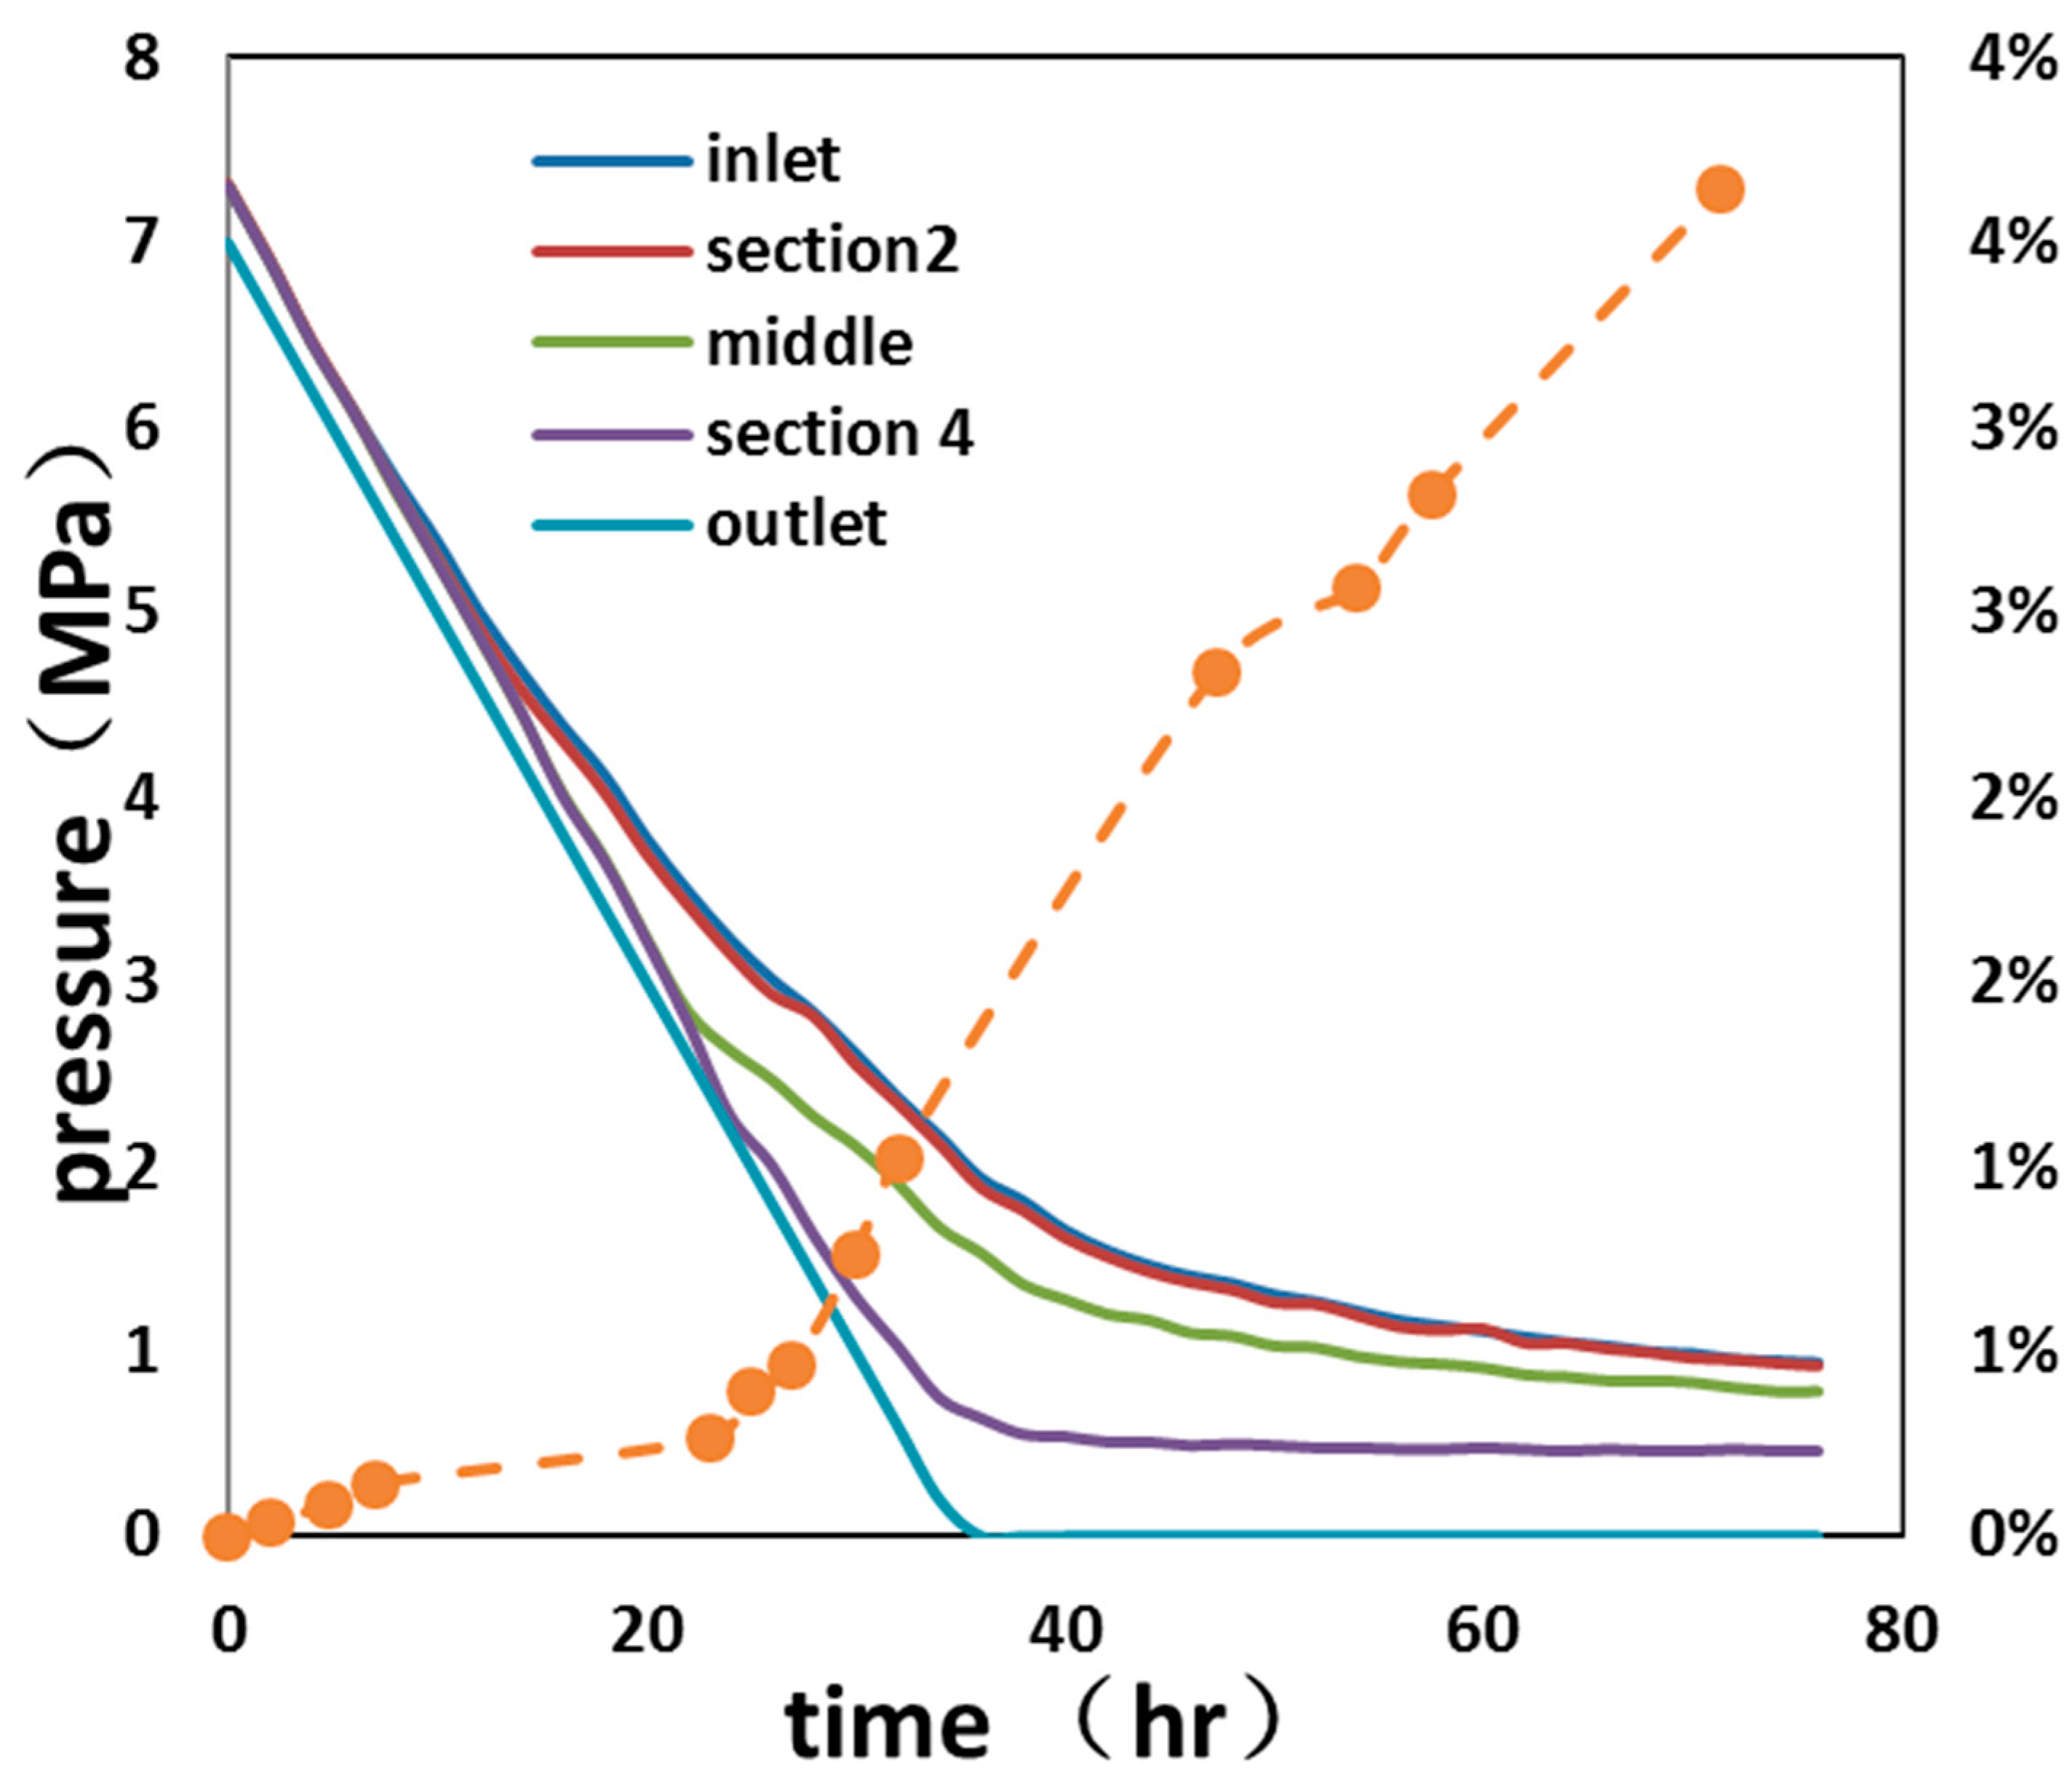
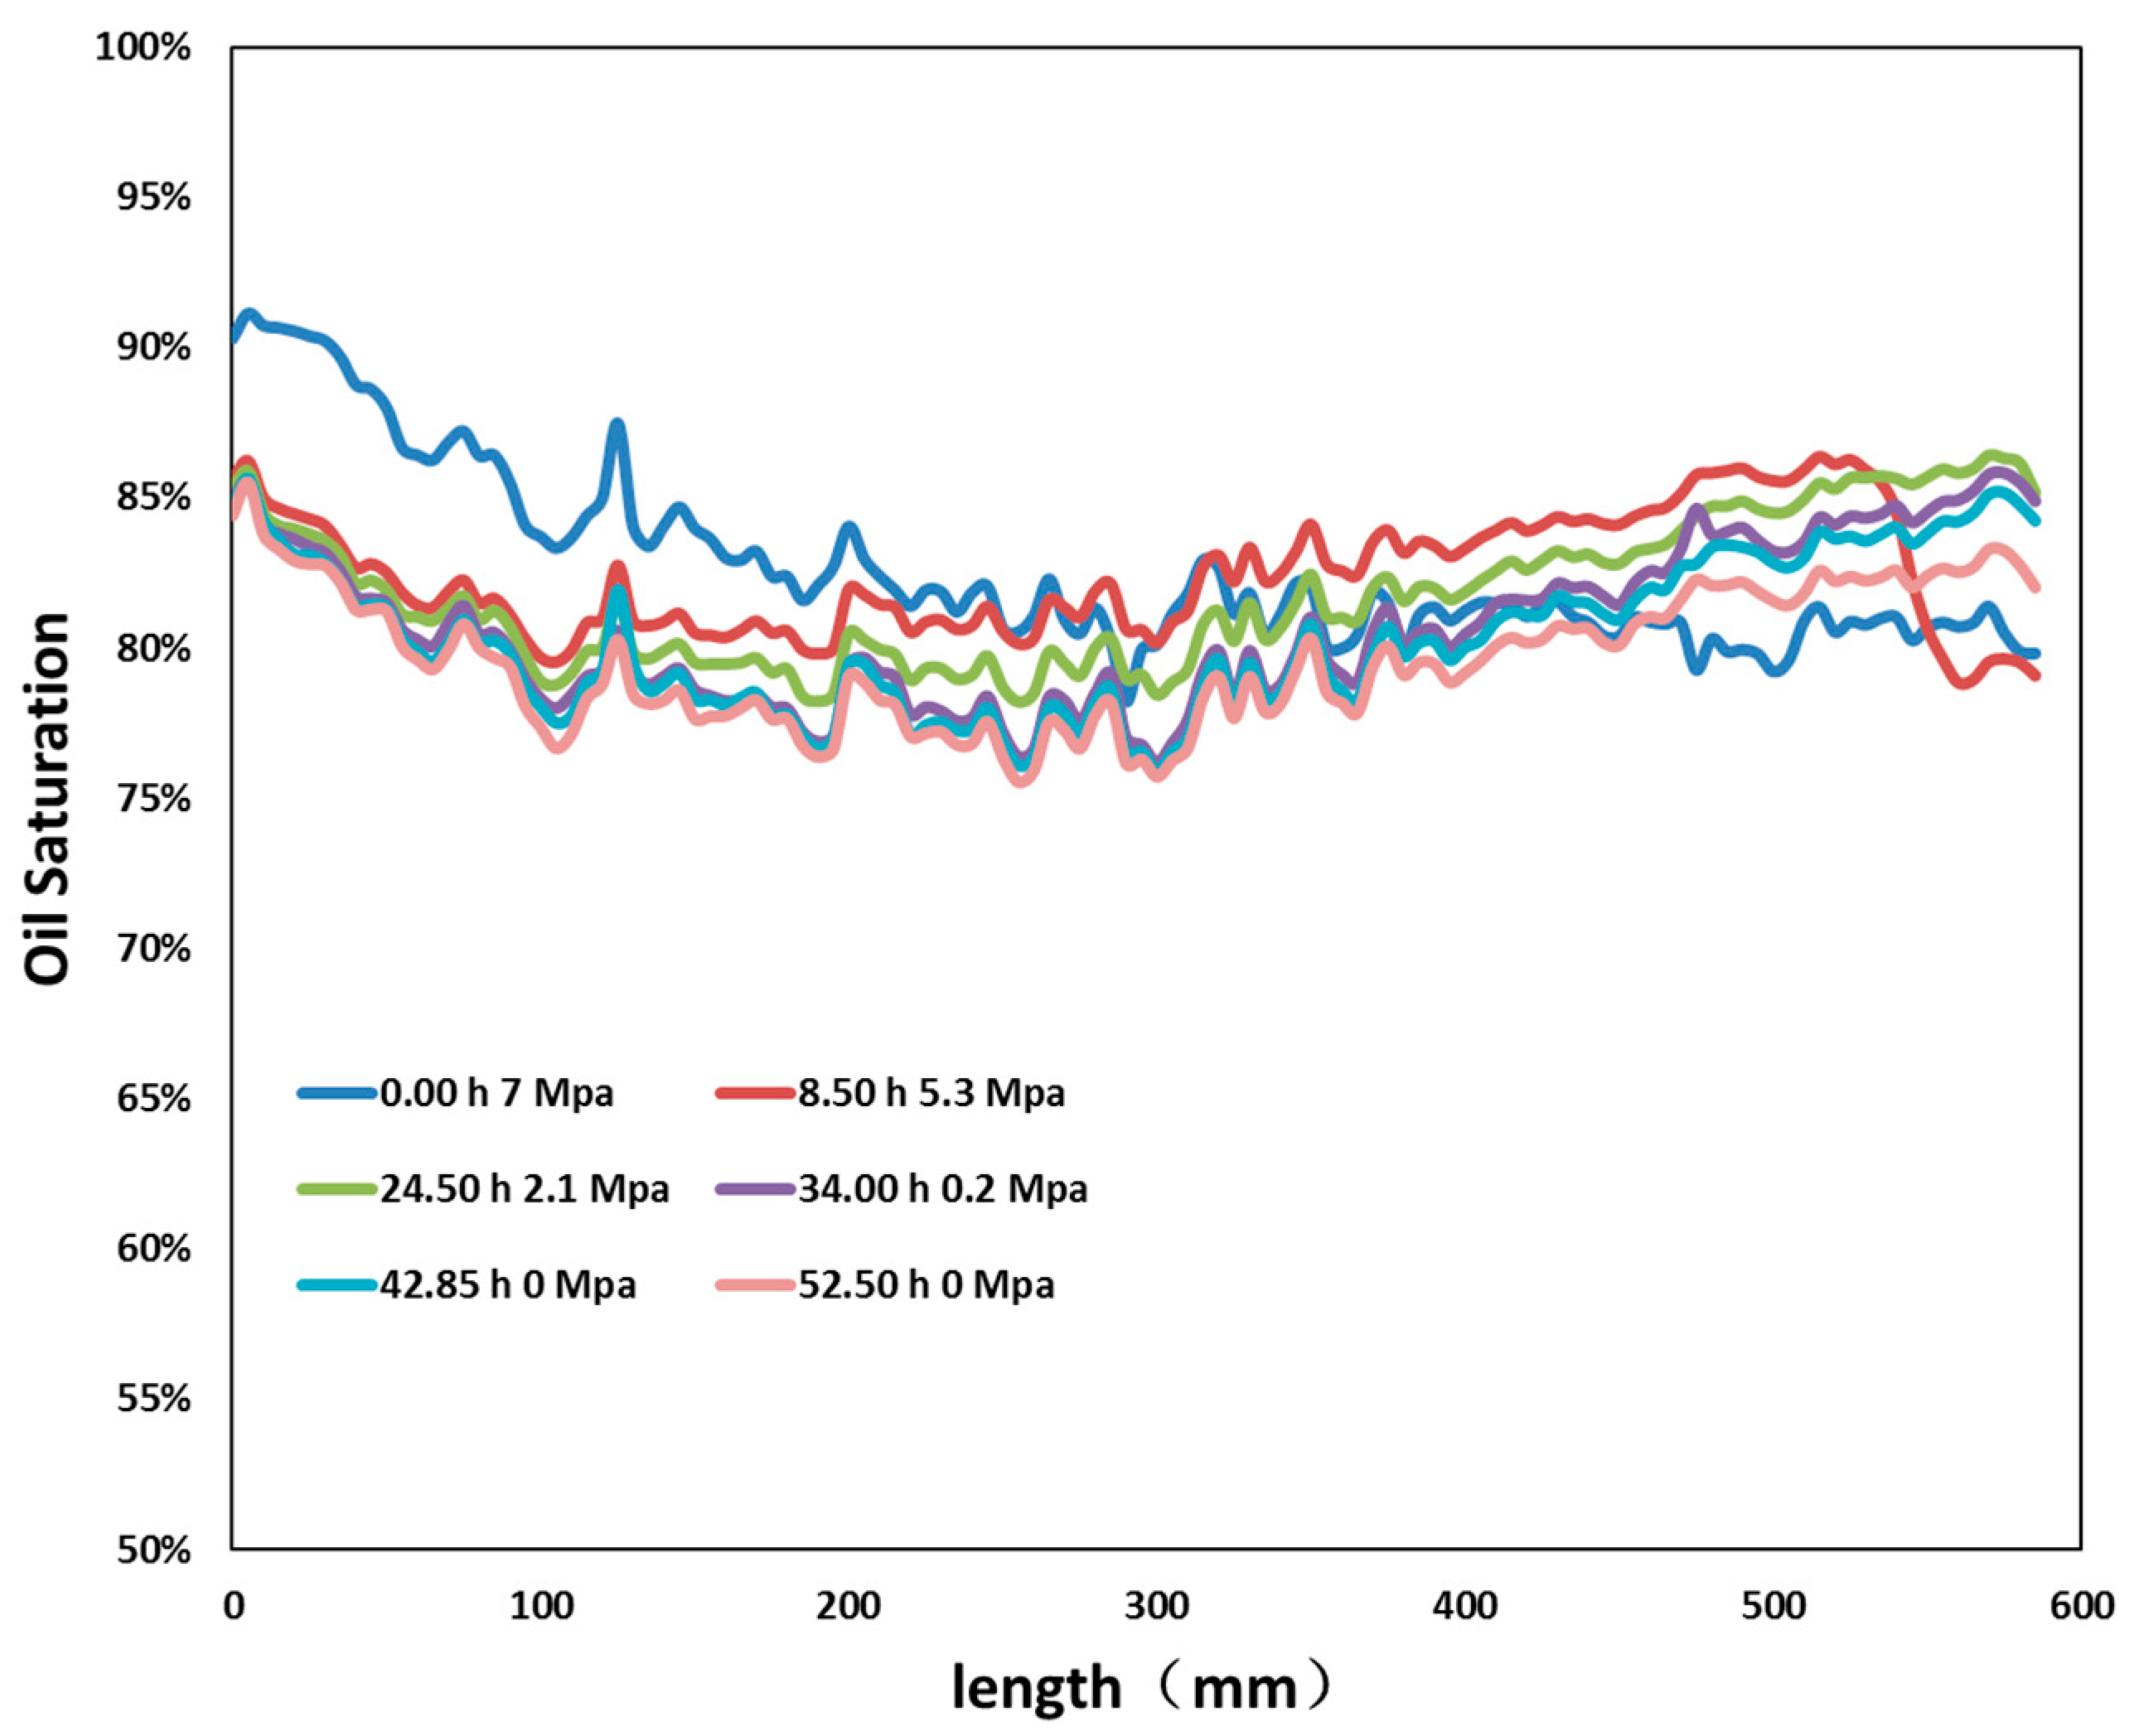
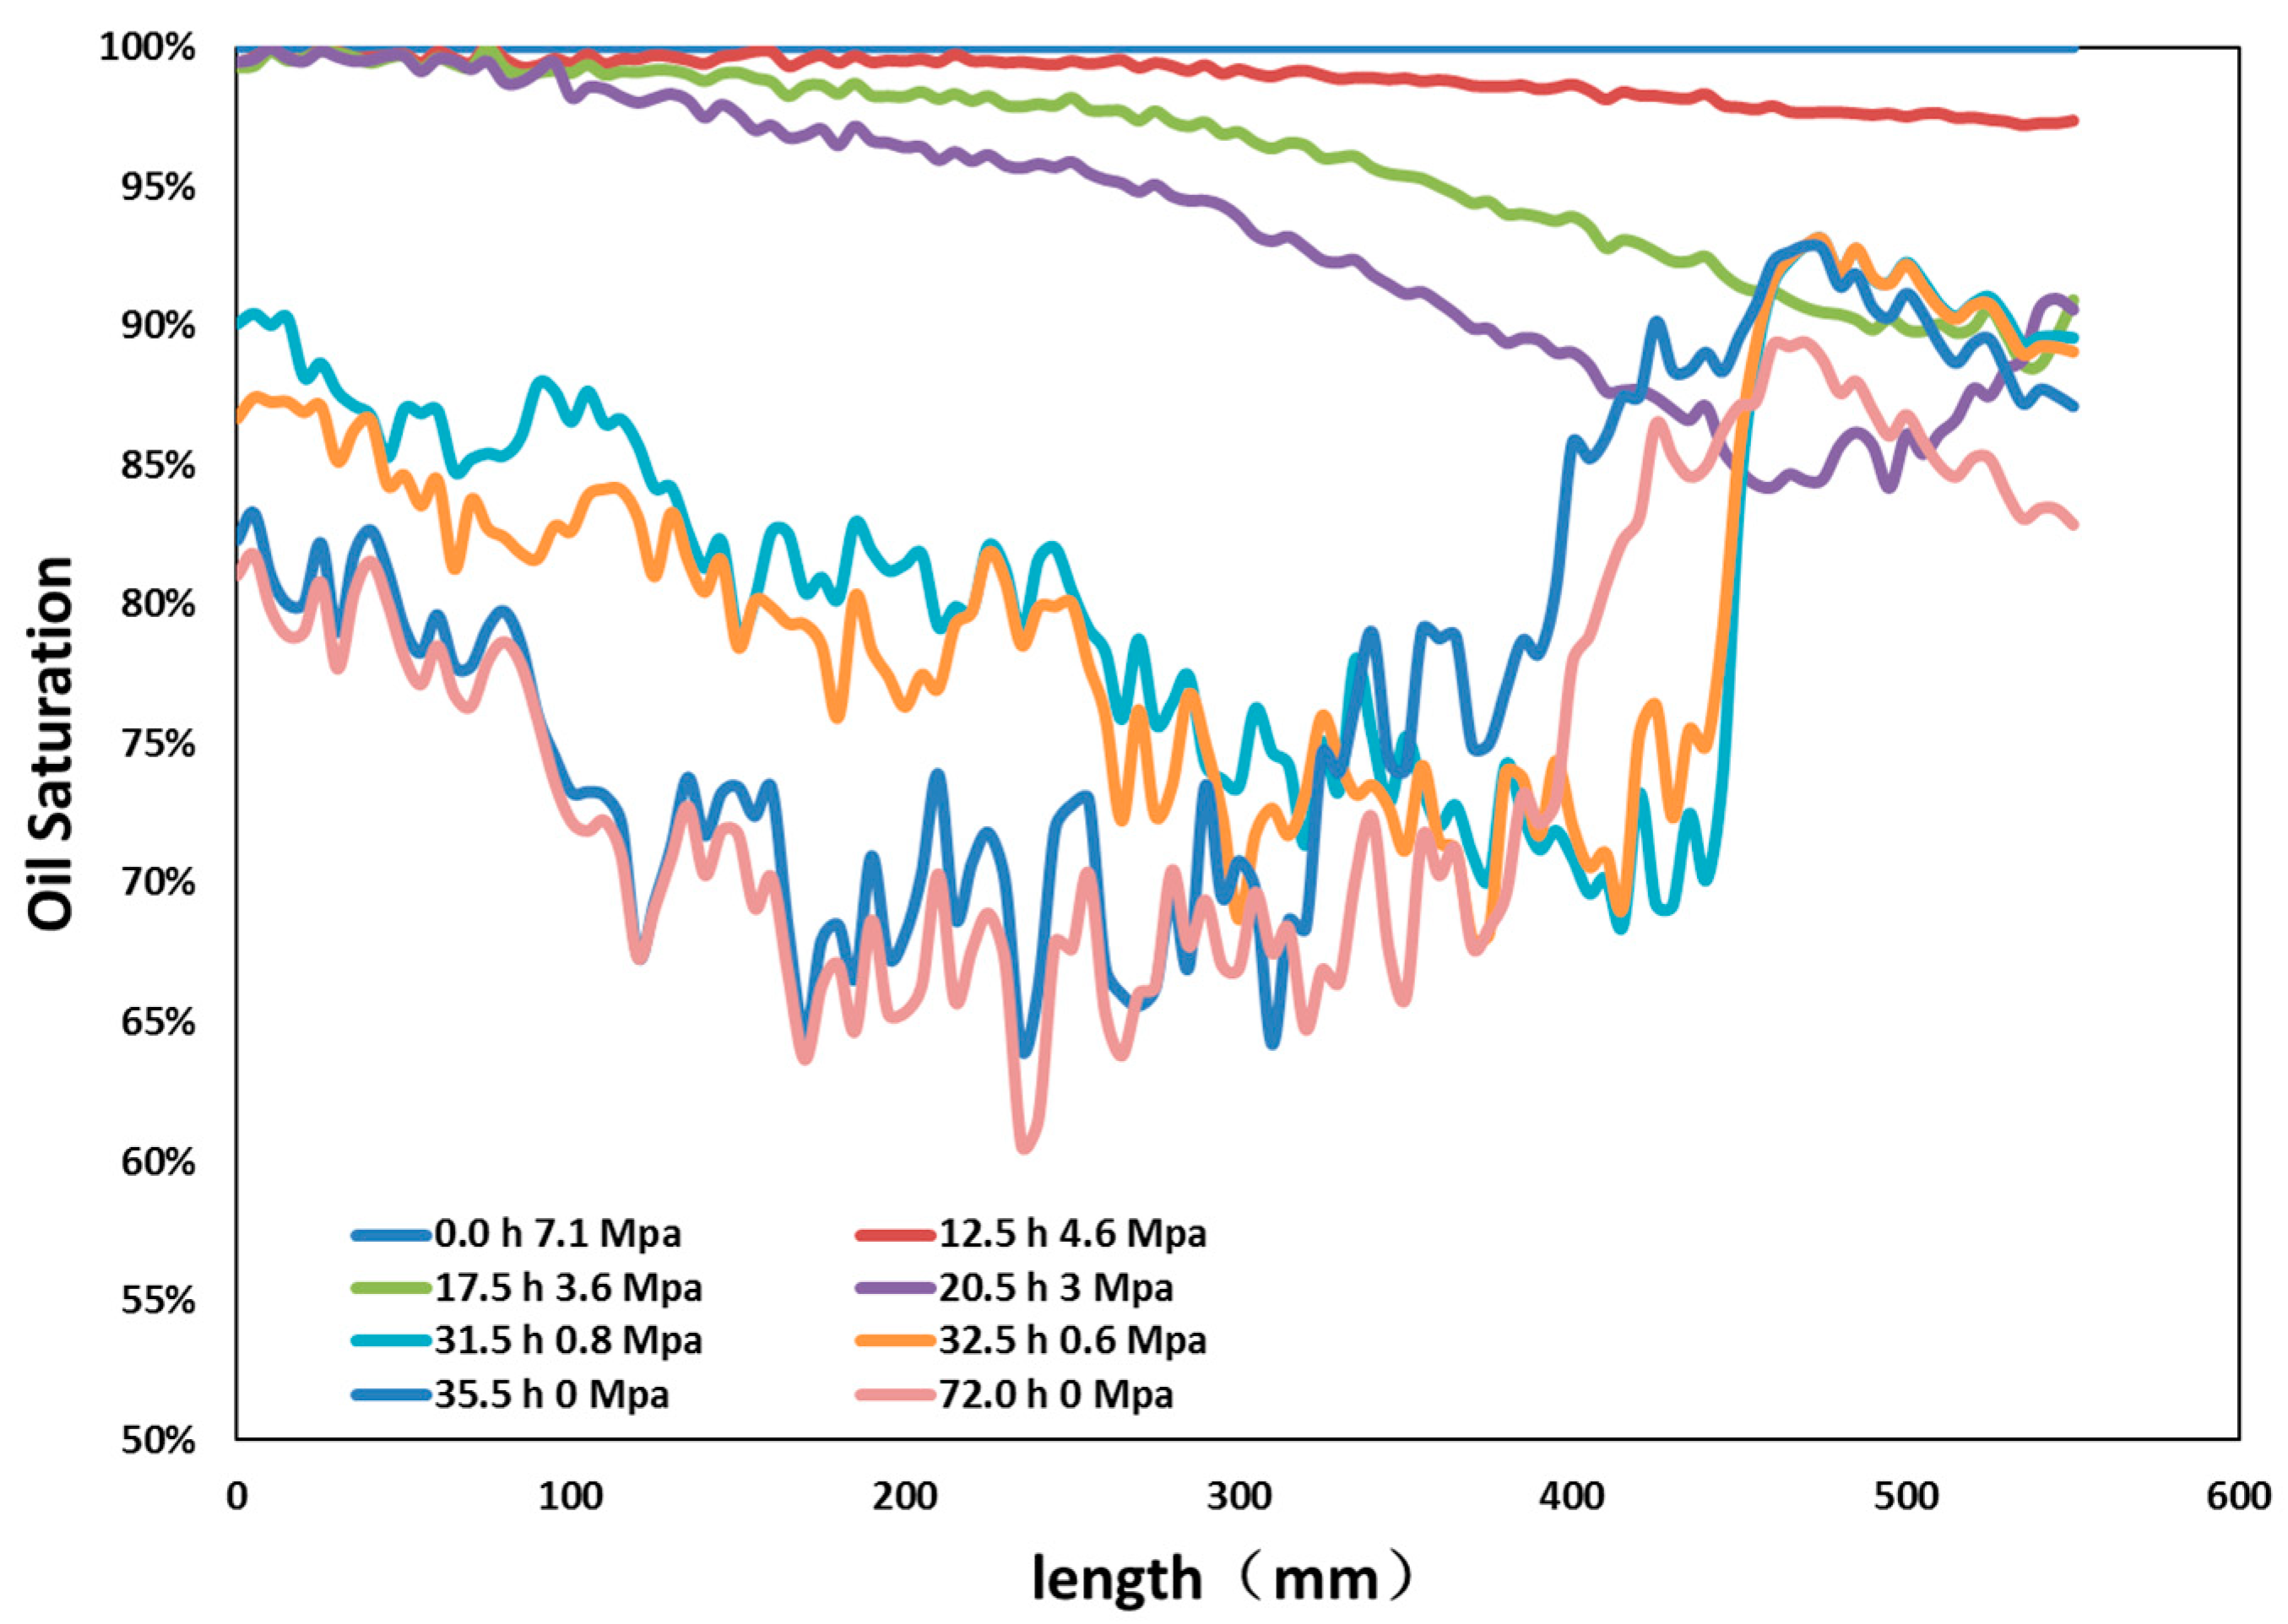
Sun et al. [18] provided a gas huff-n-puff procedure of heavy oil, which had one round of oil recovery of 19.09%, and with the second round increasing by 3.03%. In Experiment 4, an additional step was taken to study the performance produced gas on oil recovery enhancement. The gas was injected into the outlet to reach a system pressure of 7 MPa, and then soaked for 24 h. Then, the outlet valve was opened to produce the fluid. Figure 10 indicates the pressure variation of the huff-n-puff process. The primary oil recovery of foamy oil was 17.24%, which was similar to the Round 1 of Sun et al. [18], and the additional huff-n-puff improved the recovery by 3.64%. This result indicated that the natural gas huff-n-puff process was also applied to heavy oil after foamy oil depletion. However, with a large amount of gas injection, a gas channel was formed in the model and the whole process was in the third stage of foamy oil (the gas channeling stage). The oil saturation distribution curves in Figure 11 also indicate that the gas hardly pushed out the residual oil, which was held near the inlet. Although an increase was seen in the later part, the closed end presented an oil saturation decrease, meaning that the cycling gas had the ability to move the residual oil near the inlet but the energy was not enough to produce these oils.
3.5. Effect of the Sandpack Permeability on the Linear Depletion Process
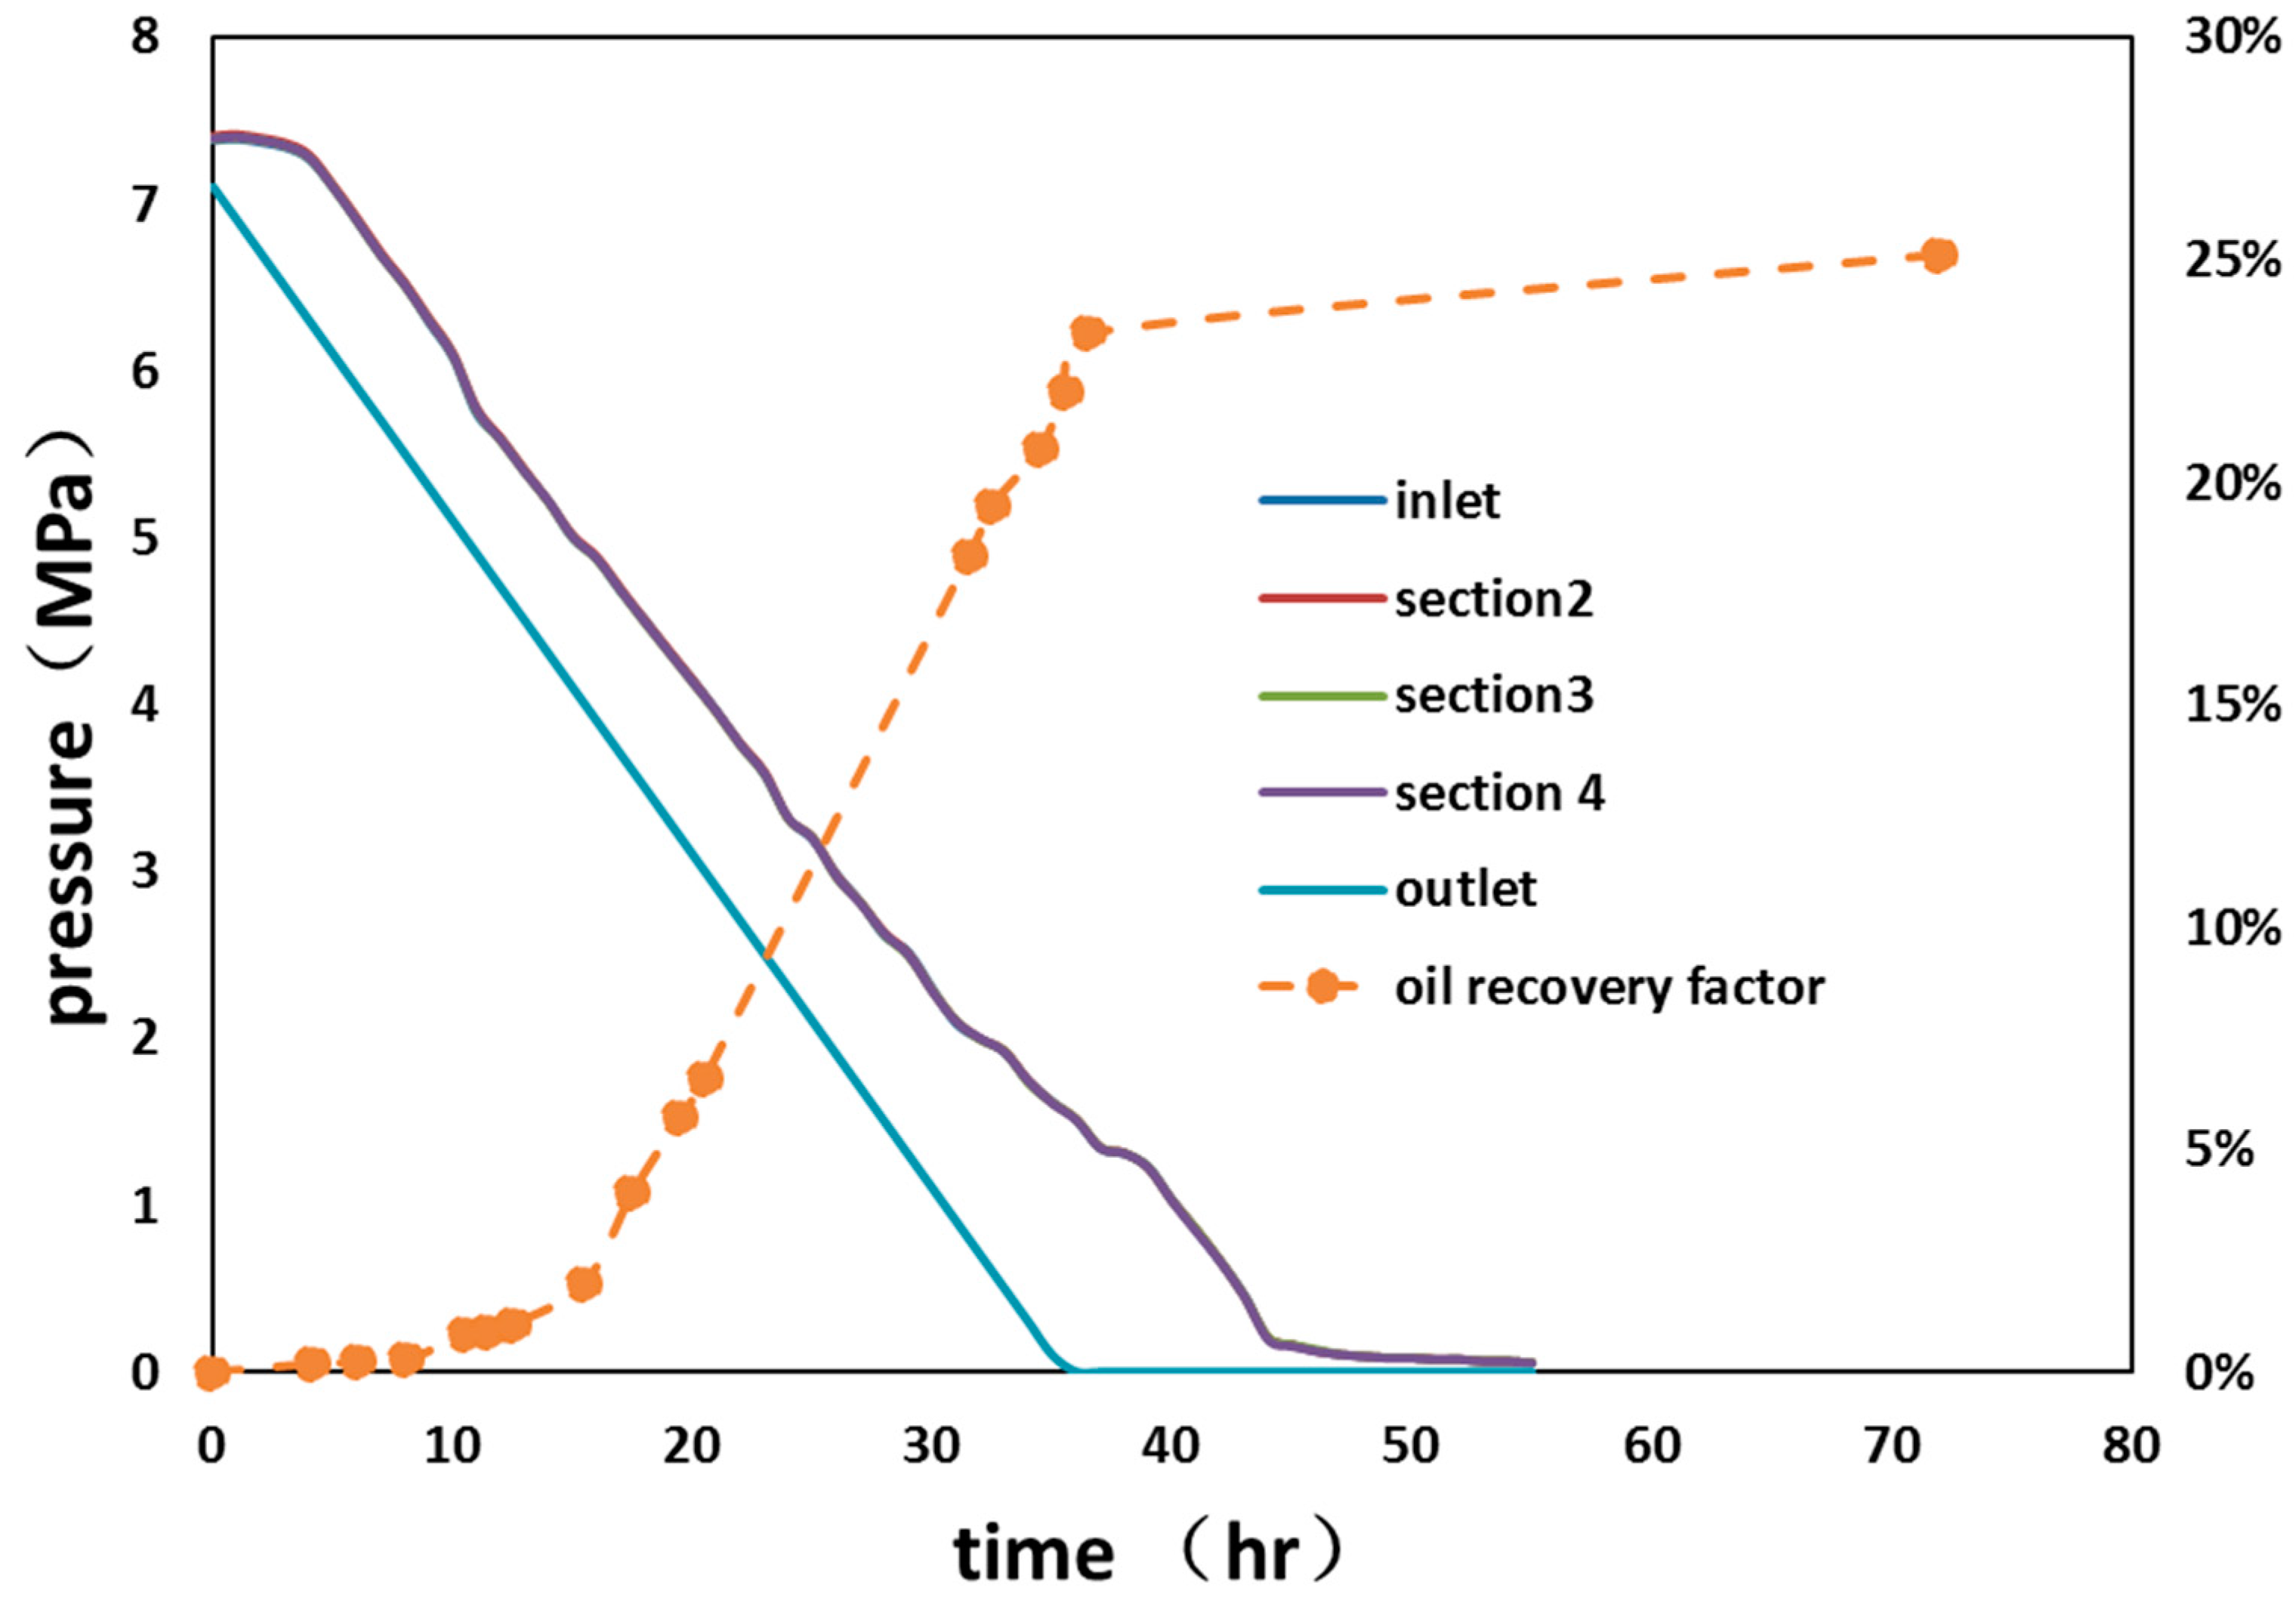
With a sandpack with higher permeability in Experiment 5, Figure 12 shows more swept area and better oil recovery. However, the behavior of the fluid production was similar to the other linear process—that is, the oil saturation increased near the outlet and the recovery improved to 25.10%. This phenomenon occurred because, with higher permeability, the oil could more easily migrate to the outlet zone. However, more gases were released from the oil, which makes it more difficult to produce the degassed heavy oil.
The pressure from the inlet to Section 4 showed little difference, depicted as one uniform line in Figure 12; however, there were three more different curves overlapping with the line of Section 4, which is different from the other three linear depletion experiments. The pressure curves in Figure 5b and Figure 7 were not totally overlapping each other. However, as time passed, four individual pressure curves were exhibited on the plots to show an uneven pressure distribution of the sandpack. Meanwhile, the outlet pressure curve showed a greater difference as compared to the other four lines, which also indicated that due to the higher permeability, no significant gas phase was formed along the sandpack to create an obvious pressure difference. Moreover, the gas bubbles were quickly released form the outlet to establish a lower outlet pressure curve, contrary to other curves. The oil recovery curve of Figure 13 also implies that the high oil recovery period ended when the outlet pressure curve reached zero, which means that without the effect of dissolved gas, it was difficult to get the heavy oil to flow.
4. Conclusions
Five independent experiments were conducted in this paper to discuss the mechanism of foamy oil recovery. Through all these experiments (including different depletion models, different depletion rates and different reservoir temperatures), the final oil recovery ranged from 15.96% to 17.24%. Changing the depletion model from a stepwise to a linear pressure drop as well as increasing the depletion rate and temperature will improve the bubble formation and enhanced the oil recovery. Moreover, a medium with a higher permeability has a similar flow behavior as that achieved when raising the temperature, which increased the residual oil saturation near the outlet zone. The details are discussed as follows:
- (1)
- Although the oil recovery factor of the linear pressure drop mode was similar to that of the step-down mode, the displacement mechanism was different between those two models. The oil saturation reduced uniformly among the entire sandpack for the step-down model; however, the linear model could produce more oil at the outlet region.
- (2)
- Increasing the rate of the linear mode was beneficial to oil recovery, because the lack of time prevented bubbles from gas channeling.
- (3)
- Under a constant gas–oil ratio, increasing the reservoir temperature had a favorable effect on the recovery efficiency and had a greater impact on the production curve.
- (4)
- In a depleted experiment, the remaining oil was mainly concentrated in the inlet section, and the outlet end had a higher degree of recovery. The gas huff-n-puff process had almost no effect on the outlet side where the gas channel was formed, but it could be employed to mobilize the remaining oil around the inlet area.
- (5)
- For the sandpack with a higher permeability, there was more residual oil at the outlet. The reason for this is that oil migration in the front is required to pass through the end, so that the outlet maintains a long period of high oil content. The longer time lasts, the more dissolved gas forms. Subsequently, the outlet accumulates a certain amount of degassed crude oil, which is difficult to drive out.
Author Contributions
Conceptualization, W.L. and J.Y.; Methodology, T.L.; Software, J.Y. and T.L.; Validation, W.L., J.Y. and D.D.; Investigation, N.J.; Resources, T.L.; Data Curation, T.L.; Writing-Original Draft Preparation, D.D and J.Y.; Writing-Review and Editing, W.L and D.D.; Visualization, J.Y.; Supervision, R.W.; Project Administration, W.L.; Funding Acquisition, W.L and N.J.
Funding
This research was funded by the China National Science and Technology Major Project [ZX05070002, 2017] and [X05031-001, 2016] and the National Science Foundation of China [No. 51476081].
Conflicts of Interest
The authors declare no conflict of interest. The funders had no role in the design of the study; in the collection, analyses, or interpretation of data; in the writing of the manuscript, and in the decision to publish the results”.
References
- Smith, G.E. Fluid Flow and Sand Production in Heavy-Oil Reservoirs Under Solution-Gas Drive. SPE Prod. Eng. 1988, 3, 169–180. [Google Scholar] [CrossRef]
- Sarma, H.; Maini, B.B. Role of Solution Gas in Primary Production of Heavy Oils. In Proceedings of the Latin America Petroleum Engineering Conference, Caracas, Venezuela, 8–11 March 1992. [Google Scholar]
- Bora, R. Cold Production of Heavy Oils: An Experimental Investigation of Foamy Oil Flow in Porous Media. Ph.D. Thesis, University of Calgary, Calgary, AB, Canada, 1998. [Google Scholar]
- Busahmin, B.; Maini, B. Effect of Solution-Gas-Oil-Ratio on Performance of Solution Gas Drive in Foamy Heavy Oil Systems. In Proceedings of the Canadian Unconventional Resources and International Petroleum Conference, Calgary, AB, Canada, 19–21 October 2010. [Google Scholar]
- Mohammed, S.; Amarfio, E.; Dankwa, O. Production Analysis for Solution Gas-Drive Reservoirs: General Variable Pressure/Variable Rate Case-Theory. In Proceedings of the SPE Nigeria Annual International Conference and Exhibition, Lagos, Nigeria, 5–7 August 2014. [Google Scholar]
- Francisco, A.; Tayfun, B. Analytical Solutions and Derivation of Relative Permeabilities for Water-Heavy Oil Displacement and Gas-Heavy Oil Gravity Drainage Under Non-Isothermal Conditions. SPE Reserv. Eval. Eng. 2016, 19, 181–191. [Google Scholar]
- Egermann, P.; Vizika, O. Critical Gas Saturation and Relative Permeability during Depressurization the Far Field and the Near-Wellbore Region. In Proceedings of the SPE Annual Technical Conference, Dallas, TX, USA, 1–3 October 2000. [Google Scholar]
- Dusseault, M.B.; Rothernburg, L. Shear dilatancy and permeability enhancement in oil sands. In Proceedings of the 4th UNITAR/UNDP Conference on Heavy Crude and Tar Sands, Edmonton, AB, Canada, 7–12 August 1988; pp. 7–12. [Google Scholar]
- Baibakovn, N.K.; Garushev, A.R. Thermal Methods of Petroleum Production; Elsevier Science Publishers: Amsterdam, The Netherlands, 1989; pp. 6–21. [Google Scholar]
- Firoozabadi, A.; Ottesen, B.; Mikkelson, M. Measurements of supersaturation and critical gas saturation. SPE Form. Eval. 1992, 7, 337–343. [Google Scholar] [CrossRef]
- Kraus, W.P.; McCaffrey, W.J.; Boyd, G.W. Pseudo-bubble point model for foamy oil. In Proceedings of the 44th Annual Technology Conference Petroleum Society of CIM, Calgary, AB, Canada, 9–12 May 1993. [Google Scholar]
- Sheng, J.J.; Maini, B.B.; Hayes, R.E.; Tortike, W.S. Critical Review of Foamy Oil Flow. Transp. Porous Media 1999, 35, 157–187. [Google Scholar] [CrossRef]
- Maini, B.B. Effect of Depletion Rate on Performance of Solution Gas Drive in Heavy Oil System. In Proceedings of the Latin American and Caribbean Petroleum Engineering Conference, Port-of-Spain, Trinidad and Tobago, 27–30 April 2003. [Google Scholar]
- Ostos, A.; Maini, B.B. Capillary number in heavy oil solution gas drive and its relationship with gas-oil relative permeability curves. In Proceedings of the SPE/DOE Symposium on Improved Oil Recovery, Tulsa, Oklahoma, 17–21 April 2004. [Google Scholar]
- Stik, C.; Robertson, C.; Kalpakci, B.; Gupta, D. A Study of Heavy Oil Solution Gas Drive for Hamaca Field: Depletion Studies and Interpretations. In Proceedings of the SPE International Thermal Operations and Heavy Oil Symposium and Western Regional Meeting, Bakersfield, CA, USA, 16–18 March 2004. [Google Scholar]
- Claridge, E.L.; Prats, M. A Proposed Model and Mechanism for Anomalous Heavy Oil Behavior. In Proceedings of the International Heavy Oil Symposium, Calgary, AB, Canada, 19–21 June 1995. [Google Scholar]
- Alshmakhy, A.B.; Maini, B.B. Effect of Foaminess on the Performance of Solution Gas Drive in Heavy Oil Reservoirs. J. Can. Pet. Technol. 2009, 48, 36–41. [Google Scholar] [CrossRef]
- Sun, X.; Zhang, Y.; Cui, G.; Duan, X.; Zhao, C. Feasibility study of enhanced foamy oil recovery of the Orinoco Belt using Natural Gas. J. Pet. Sci. Eng. 2014, 122, 94–107. [Google Scholar] [CrossRef]
- Liu, P.C.; Li, W.H.; Hao, M.Q.; Wu, Y.B.; Li, X.L. Quantitative evaluation of factors affecting foamy oil recovery in the development of heavy hydrocarbon reservoirs. Int. J. Hydrogen Energy 2016, 41, 15624–15631. [Google Scholar] [CrossRef]
- Tang, G.; Firoozabadi, A. Effect of GOR, Temperature, and Initial Water Saturation on Solution-Gas Drive in Heavy-OIl Reservoirs. In Proceedings of the 2001 SPE Annual Technical Conference and Exhibition, New Orleans, LA, USA, 30 September–3 October 2001. [Google Scholar]
- Tang, G.Q.; Sahni, A.; Gadelle, F.; Kumar, M.; Kovscek, A.R. Heavy-Oil Solution Gas Drive in Consolidated and Unconsolidated Rock. In Proceedings of the International Thermal Operations and Heavy-Oil Symposium and Western Regional Meeting, Bakersfield, CA, USA, 16–18 March 2004. [Google Scholar]
- Liu, P.; Wu, Y.; Li, X. Experimental Study on the Stability of the Foamy Oil in Developing Heavy Oil Reservoirs. Fuel 2013, 111, 12–19. [Google Scholar] [CrossRef]
- Zhang, X.; Tahmasebi, P. Micromechanical evaluation of rock and fluid interactions. Int. J. Greenh. Gas Control 2018, 76, 226–277. [Google Scholar] [CrossRef]
- Fagbemi, S.; Tahmasebi, P.; Piri, M. Pore-scale modeling of multiphase flow through porous media under triaxial stress. Adv. Water Resour. 2018, 122, 206–216. [Google Scholar] [CrossRef]
- Moulu, J.C.; Longeron, D.L. Solution—Gas drive: Experiments and simulation. In Proceedings of the 5th European Symposium, Improved Oil Recovery, Budapest, Hungary, 25–27 April 1989; pp. 145–154. [Google Scholar]
- Wellington, S.L.; Vinegar, H.J. X-ray Computerized Tomography. J. Pet. Technol. 1987, 39, 885–898. [Google Scholar] [CrossRef]
- Kleinberg, R.; Vinegar, H. NMR Properties of Reservoir Fluids. J. Log Analy. 1996, 37, 238–252. [Google Scholar]
- Bryan, J.; Kantzas, A.; Bellehmeur, B. Oil Viscosity Predictions from Low Field NMR Measurements. J. SPE Reserv. Eval. Eng. 2005, 8, 44–52. [Google Scholar] [CrossRef]
- Lv, W.; Yang, J.; Jia, N. A Study of Gas Bubble Formation Mechanism During Foamy Oil Depletion Experiment. Spec. Top. Rev. Porous Media 2018, 9, 37–45. [Google Scholar] [CrossRef]
Figure 1.
Experimental setup of foamy oil depletion with a computed tomography (CT) scanning system.
Figure 1.
Experimental setup of foamy oil depletion with a computed tomography (CT) scanning system.
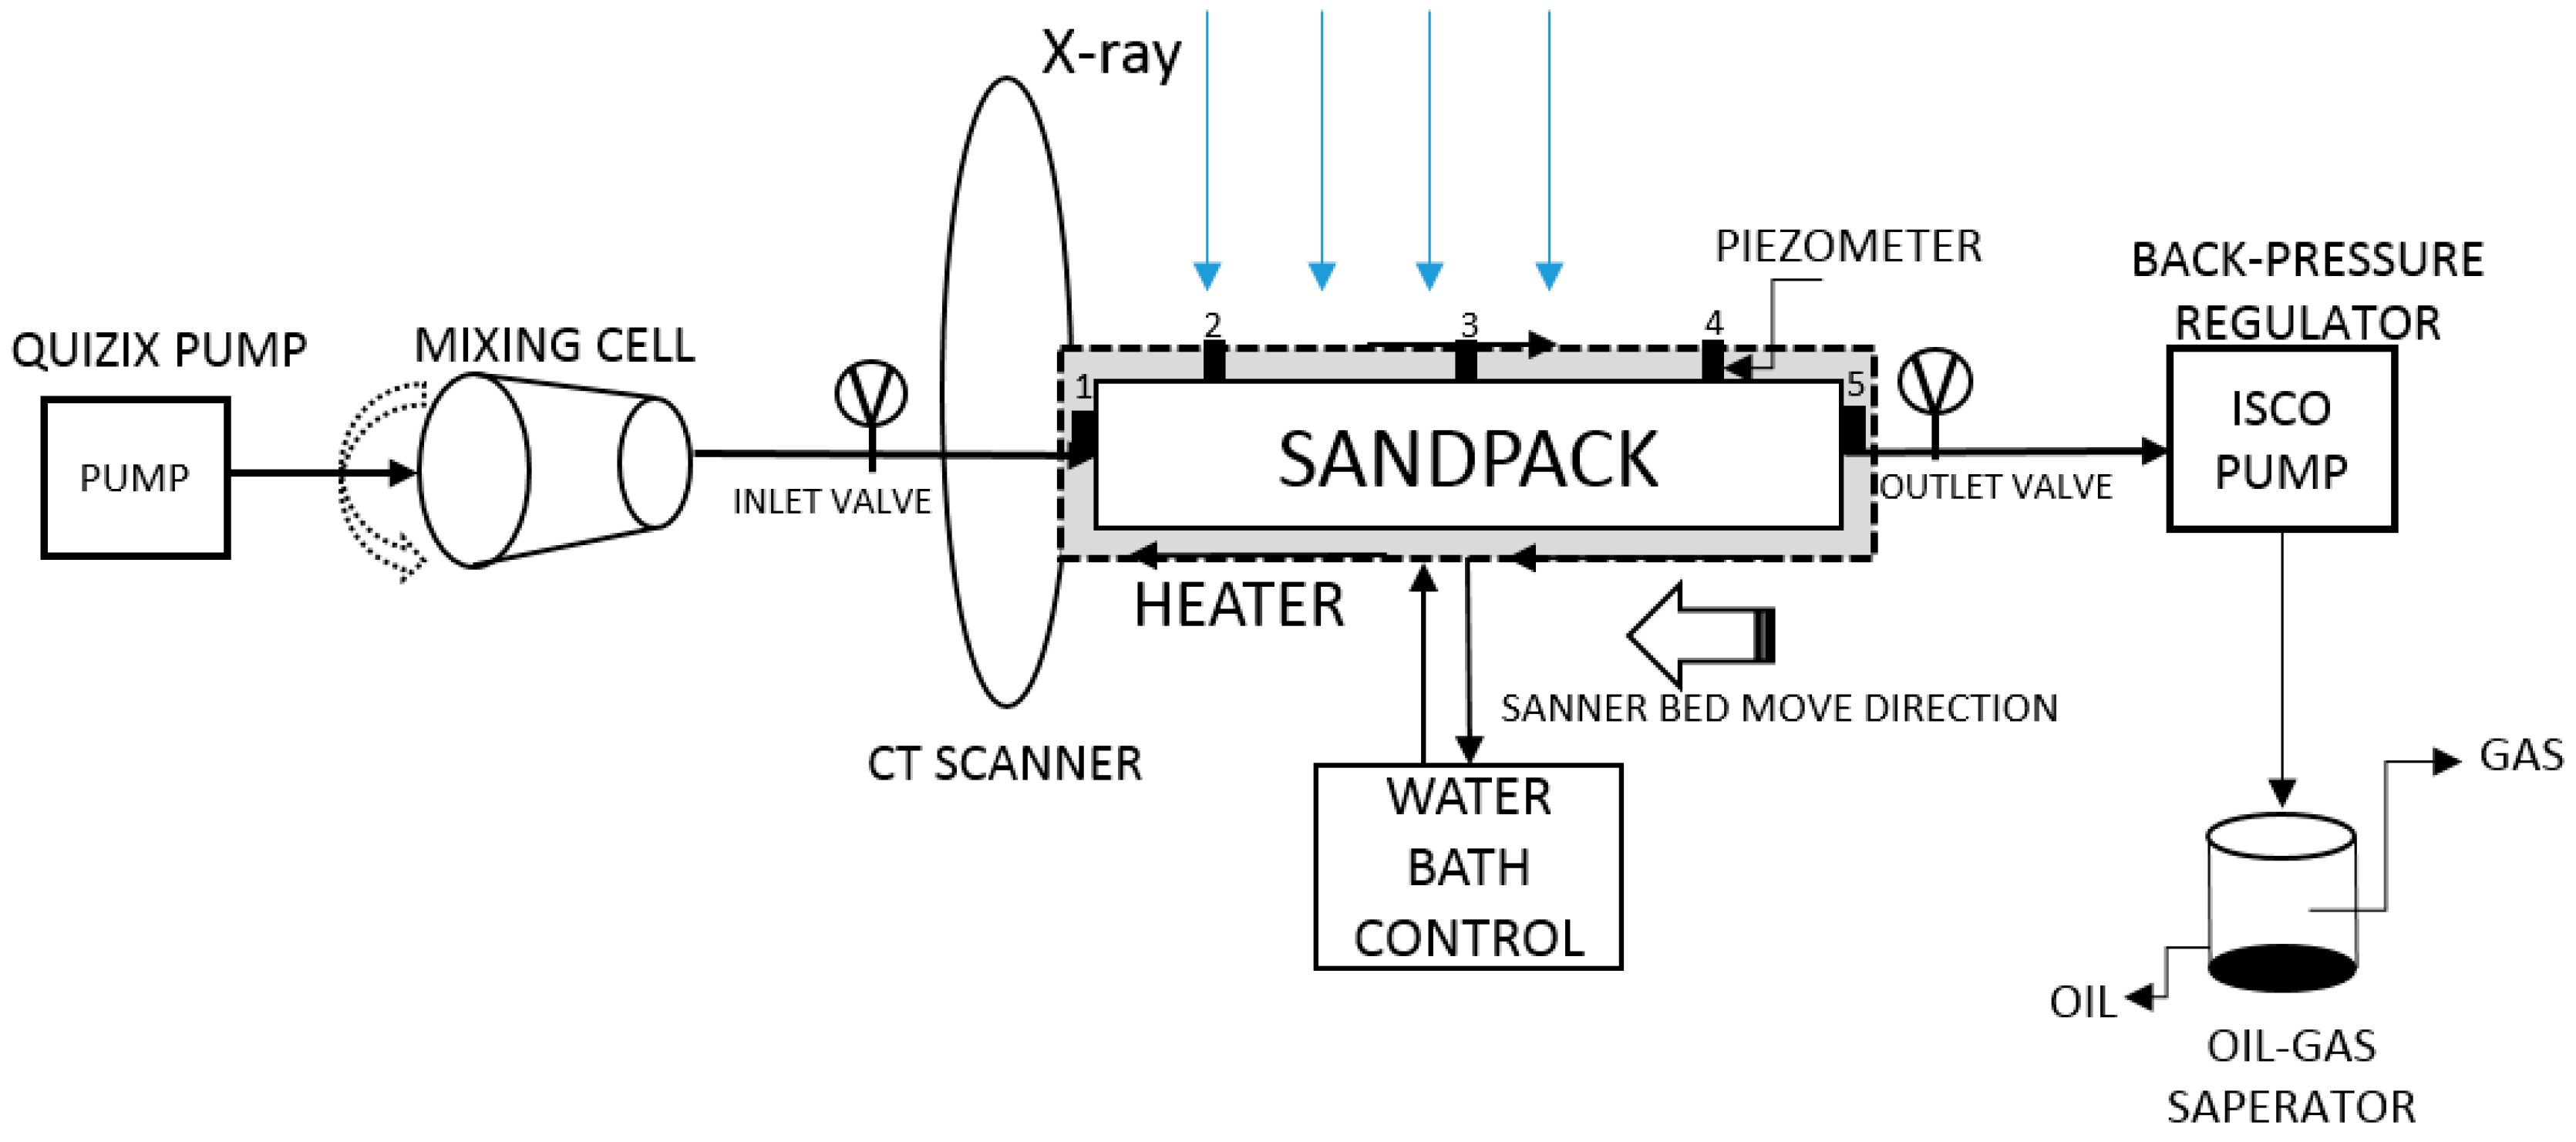
Figure 2.
Oil saturation distribution curves in Experiment 1 (300 mm is the outlet of the core).

Figure 3.
Oil saturation distribution curves in Experiment 2.

Figure 4.
Oil saturation CT reconstruction images for Experiments 1 and 2. (a) Step-down Experiment 1; (b) Linear Experiment 2.
Figure 4.
Oil saturation CT reconstruction images for Experiments 1 and 2. (a) Step-down Experiment 1; (b) Linear Experiment 2.

Figure 5.
The relationship between oil recovery and pressure change for Experiments 1 and 2. (a) Step-down Experiment 1; (b) Linear Experiment 2 (Section 2: one-quarter of the way to the inlet; Section 4: three-quarters of the way to the inlet).

Figure 6.
Oil saturation distribution of different slices in each experiment.
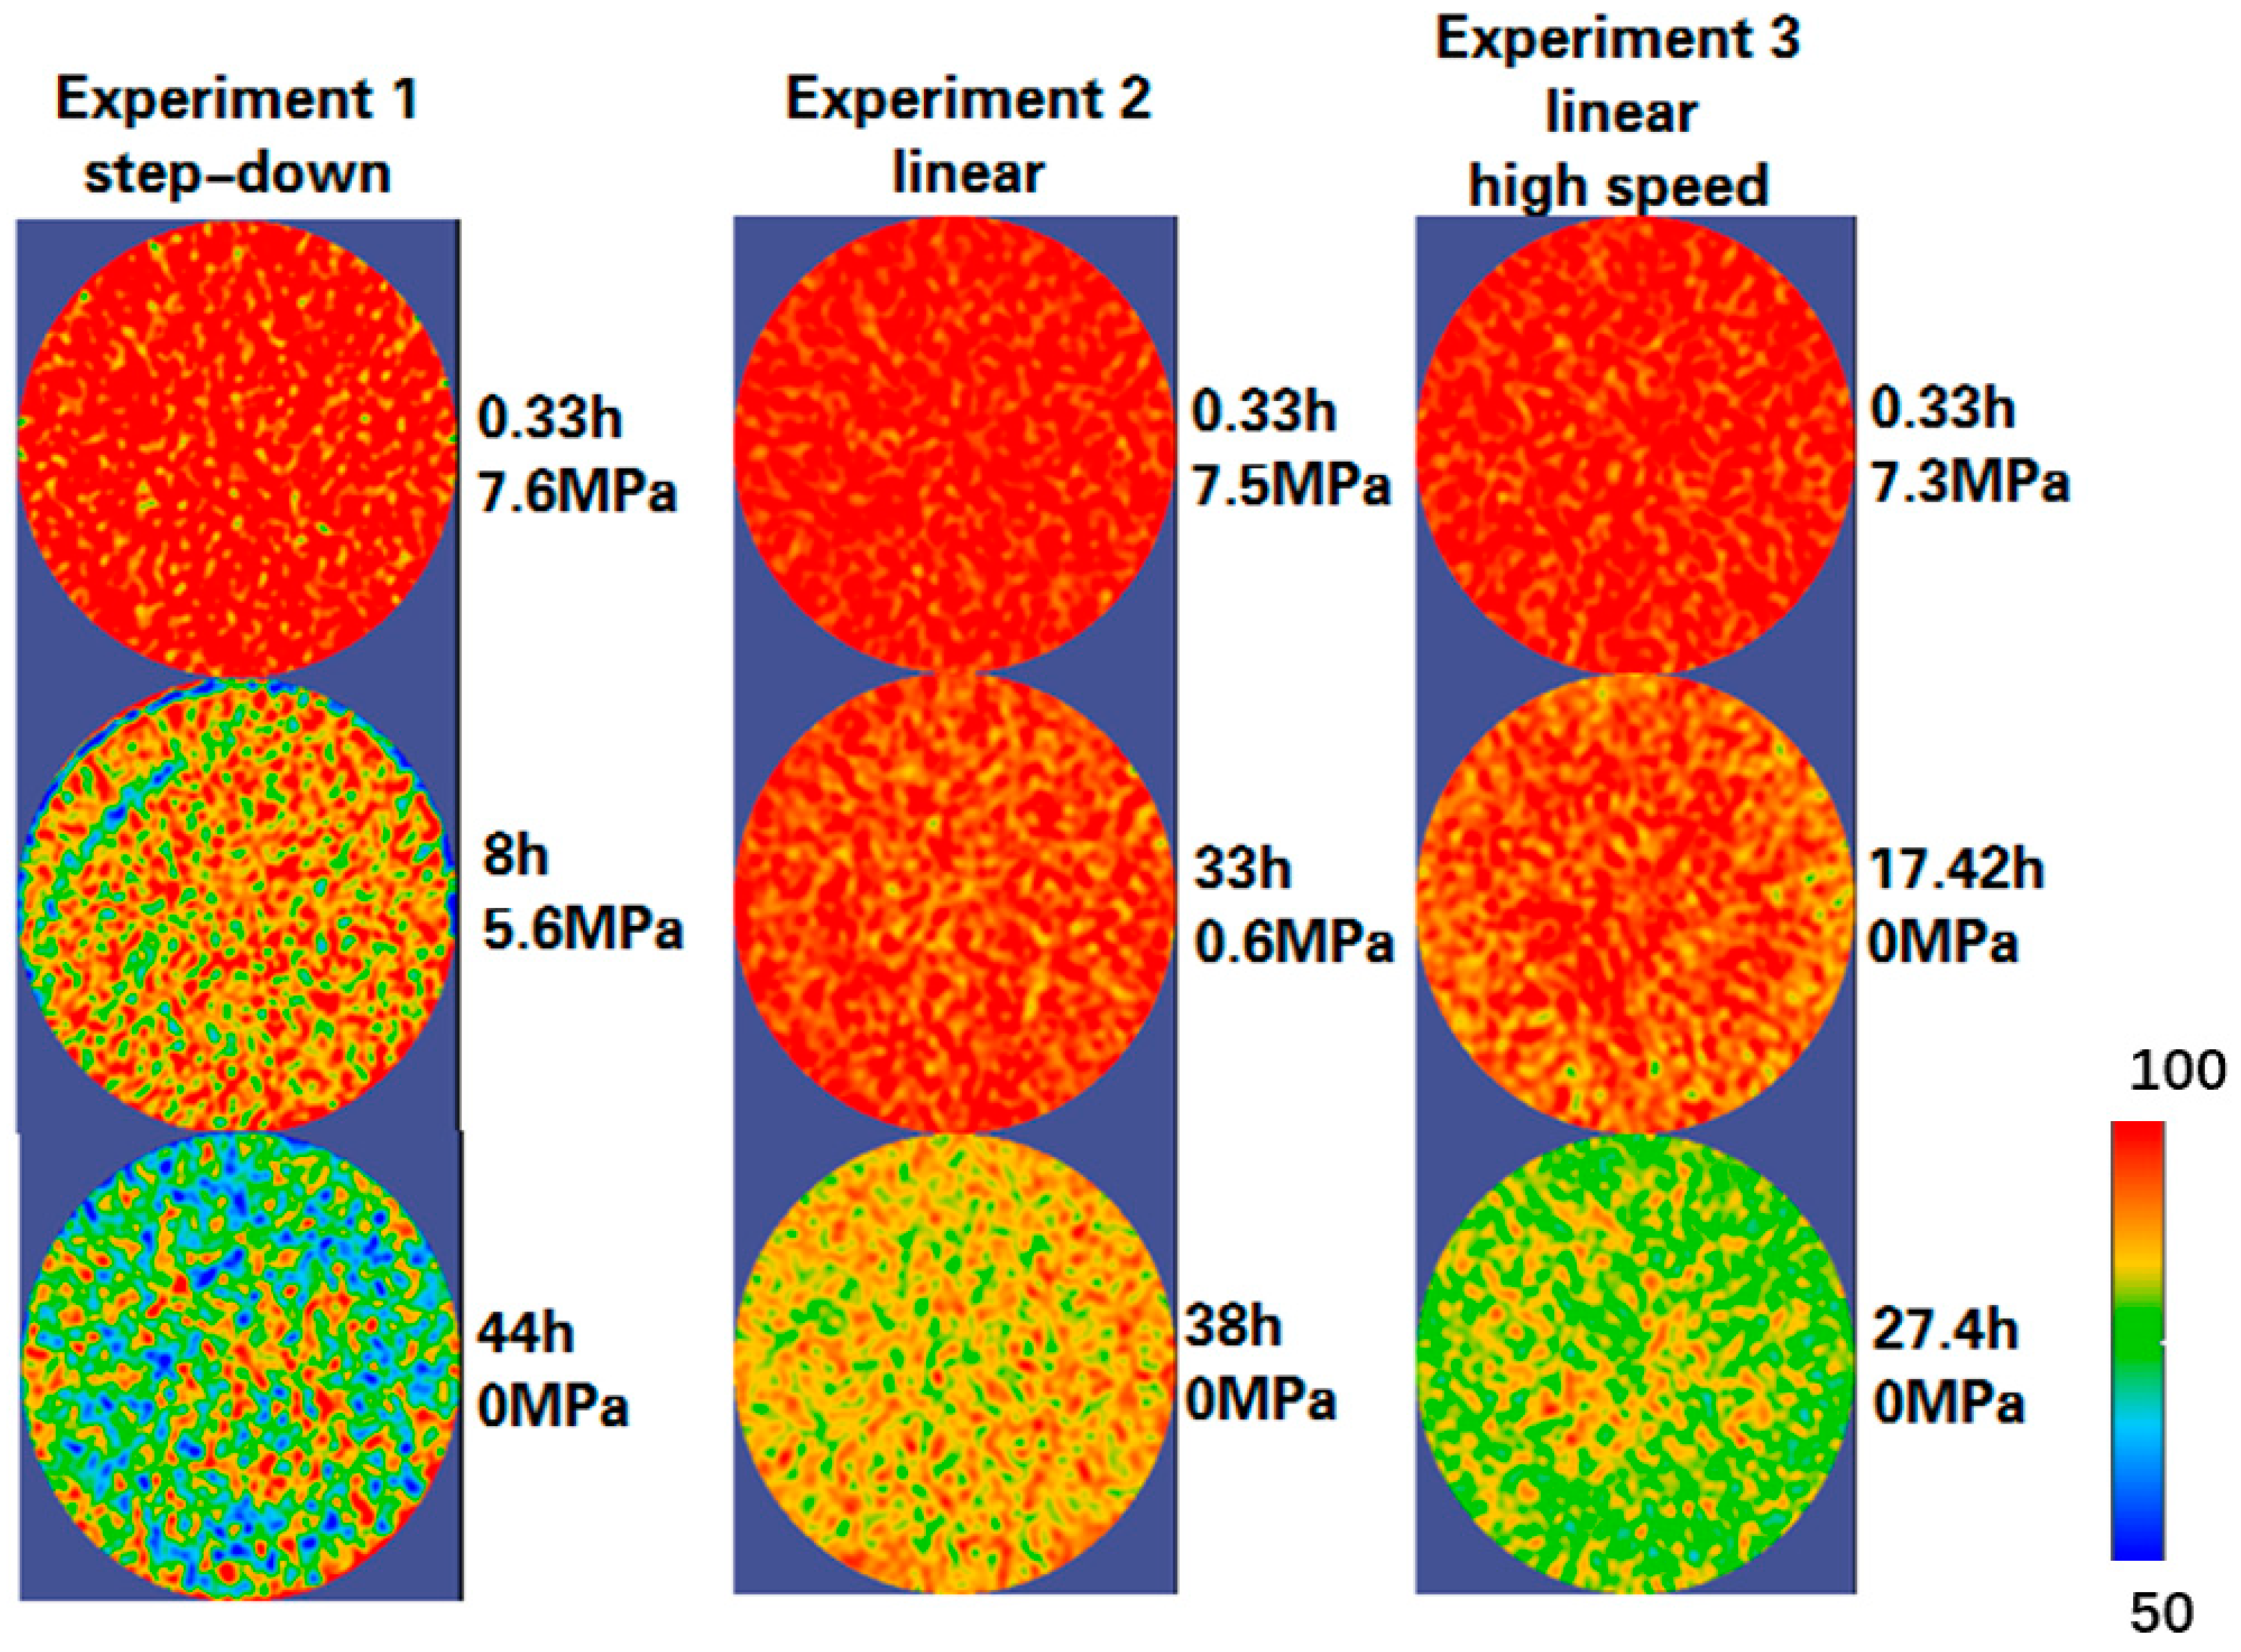
Figure 7.
The relationship between pressure changes and the oil recovery of Experiments 2 and 3. (a) Experiment 2; (b) Experiment 3.
Figure 7.
The relationship between pressure changes and the oil recovery of Experiments 2 and 3. (a) Experiment 2; (b) Experiment 3.

Figure 8.
Oil saturation distribution curves in Experiment 3.

Figure 9.
Oil saturation CT reconstruction images for Experiment 4.
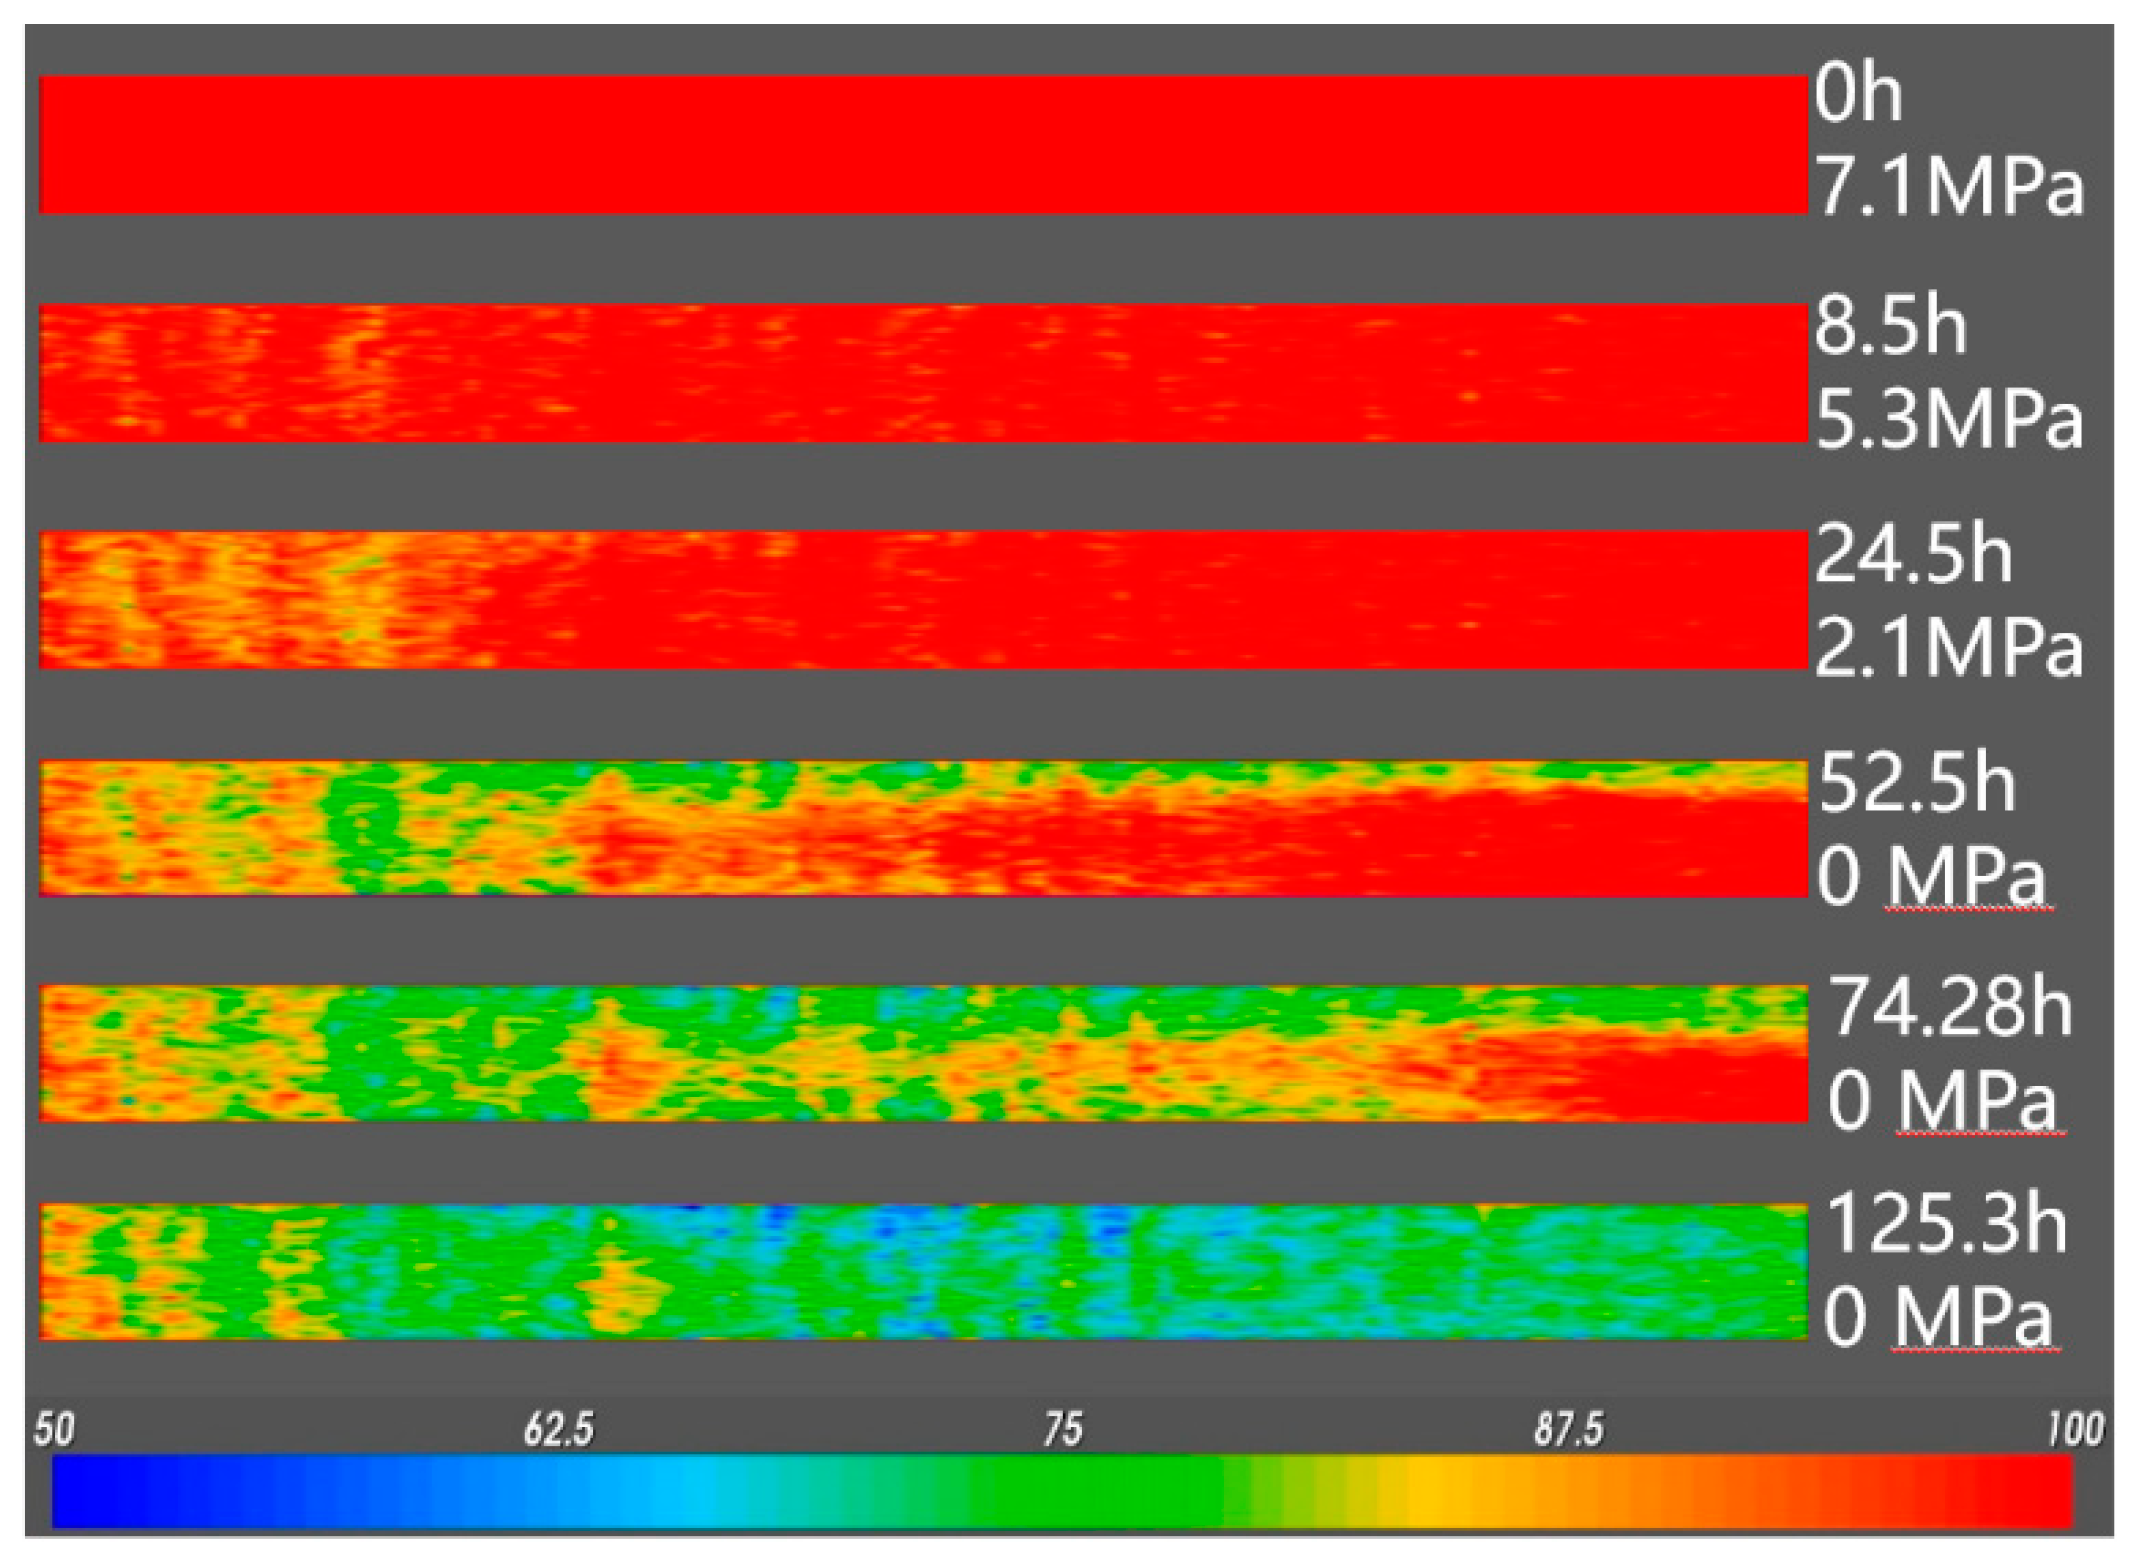
Figure 10.
Relationship between pressure changes and oil recovery in Experiment 4—gas cycling part.

Figure 11.
Oil saturation distribution curves in Experiment 4—gas cycling part.

Figure 12.
Relationship between pressure changes and oil recovery of Experiment 5.

Figure 13.
Oil saturation distribution curves in Experiment 5.


Table 1.
Properties of the experiment of live oil.
| Density | 0.975 g/cm3 |
| Viscosity under 80 °C | 8749 mPa.s |
| Bubble point pressure under 80 °C | 4.7 MPa |
| Gas–oil ratio | 18.0 m3/m3 |
Table 2.
Conditions for five foamy oil experiments.
| Experiments | Permeability (D) | Depletion Mode | Depletion Rate | Temperature (°C) |
|---|---|---|---|---|
| 1 | 8.1 | Step-down | 0.2 M/step | 60 |
| 2 | 7.6 | Linear | 0.2 MPa/h | 60 |
| 3 | 7.5 | Linear | 0.5 MPa/h | 60 |
| 4 | 8.2 | Linear | 0.2 MPa/h | 80 |
| 5 | 13.6 | Linear | 0.2 MPa/h | 60 |
© 2019 by the authors. Licensee MDPI, Basel, Switzerland. This article is an open access article distributed under the terms and conditions of the Creative Commons Attribution (CC BY) license (http://creativecommons.org/licenses/by/4.0/).
Share and Cite
MDPI and ACS Style
Lv, W.; Du, D.; Yang, J.; Jia, N.; Li, T.; Wang, R. Experimental Study on Factors Affecting the Performance of Foamy Oil Recovery. Energies 2019, 12, 637. https://doi.org/10.3390/en12040637
AMA Style
Lv W, Du D, Yang J, Jia N, Li T, Wang R. Experimental Study on Factors Affecting the Performance of Foamy Oil Recovery. Energies. 2019; 12(4):637. https://doi.org/10.3390/en12040637
Chicago/Turabian StyleLv, Weifeng, Dongxing Du, Jiru Yang, Ninghong Jia, Tong Li, and Rong Wang. 2019. "Experimental Study on Factors Affecting the Performance of Foamy Oil Recovery" Energies 12, no. 4: 637. https://doi.org/10.3390/en12040637
Note that from the first issue of 2016, this journal uses article numbers instead of page numbers. See further details here.