The Effect of Active Material, Conductive Additives, and Binder in a Cathode Composite Electrode on Battery Performance


Battery R&D, LG Chem, Ltd., 36, Janggunmaeul 3-gil, Gwacheon 13818, Korea
Energies 2019, 12(4), 658; https://doi.org/10.3390/en12040658
Submission received: 31 December 2018
/
Revised: 7 February 2019
/
Accepted: 14 February 2019
/
Published: 18 February 2019
Abstract
:The current study investigated the effects of active material, conductive additives, and binder in a composite electrode on battery performance. In addition, the parameters related to cell performance as well as side reactions were integrated in an electrochemical model. In order to predict the cell performance, key parameters including manganese dissolution, electronic conductivity, and resistance were first measured through experiments. Experimental results determined that a higher ratio of polymer binder to conductive additives increased the interfacial resistance, and a higher ratio of conductive additives to polymer binder in the electrode resulted in an increase in dissolved transition metal ions from the LiMn2O4 composite electrode. By performing a degradation simulation with these parameters, battery capacity was predicted with various fractions of constituents in the composite electrode. The present study shows that by using this integrated prediction method, the optimal ratio of constituents for a particular cathode composite electrode can be specified that will maximize battery performance.
1. Introduction
Lithium intercalation cathode materials are widely used in various industries. While lithium intercalation cathode materials provide high potential and high gravimetric energy densities, both a polymer binder and conductive additives are required in the cathode composite electrode to maintain a firm structure and to provide a continuous conduction path. For example, conductive additives such as carbon black are added to the composite electrode because of the low conductivity of the lithium intercalation cathode materials. Also, to join the active material and conductive additives together without reacting with the electrodes and electrolyte, a polymer binder such as polyvinylidene fluoride (PVDF) or an ethylene propylene diene monomer (EPDM) is needed. However, the conductive additives and polymer binder are both electrochemically inactive materials. If too much of the conductive additives and polymer binder are added to the electrode, they degrade the total capacity of the cell, while if too little are added, the electronic conductivity and the mechanical integrity of the electrode will be reduced.
In order to improve battery capacity and cell performance, detailed investigations of the effect of the conductive additives and polymer binder on battery performance is critical. Numerous studies have been performed to investigate the effects of each constituent material while considering different parameters [1,2,3]. For instance, in an effort to increase the capacity of Li(Ni1/3Co1/3Mn1/3)O2, the ionic conductivity, electronic conductivity, and porosity were investigated with different ratios of constituents [1]. In another study, electronic conductivity and discharge capacity were examined to increase capacity by varying LiMn2O4 and carbon black contents [4]. Also relevant to the current paper, one study suggested the optimal electrode for specific energy and power performance based on an effective conductivity model [5]. This effective conductivity model described the distribution of the conductive additives and polymer binder. Those findings suggested that the amount of the conductive additives and polymer binder included in the electrode influence different properties and parameters of battery performance.
In addition, parameter sensitivity studies have also been performed to determine important design parameters and ultimately improve battery performance [6,7,8,9,10,11]. Zhang et al. [7] performed sensitivity analyses of 30 different parameters using multi-physics modeling. They found that 10 parameters, including the volume fraction of the electrolyte, the active material in the negative electrode, contact resistance, and the reaction rates of the negative and positive electrode, were highly sensitive.
At the same time, previous research has also reported that both conductive additives and polymer binders accelerate side reactions in the battery. Primary side reactions such as electrolyte decomposition, Solid Electrolyte Interphase (SEI) layer formation, which mostly forms in the negative electrode, as well as manganese dissolution from the positive electrode originate with reactions between the electrode and electrolyte interface [12]. The intensity of these side reactions are mainly influenced by the electrode area in contact with the electrolyte. For example, Marks et al. [13] measured the coulombic efficiency of two Li/graphite cells, with one containing 4 wt % and the other 7 wt % Super-S carbon black. The coulombic efficiency of the negative electrode containing more carbon had a more detrimental effect since the SEI layer formation was boosted due to the larger surface area. In a similar manner, manganese dissolution is predicted to accelerate if more carbons are included in the positive composite electrode.
In addition, previous literature also reveals that a higher ratio of polymer binder to conductive additives increases interfacial resistance due to the ion-blocking effect of higher binder contents in the electrode [14]. Too little binder also increases the resistance because the binder cannot maintain the firm structure of the electrode. Collectively, prior findings suggest that there should be an optimal ratio of conductive additives, polymer binder, and active material to maximize battery performance.
To summarize, despite the contribution of prior studies in determining how different properties, such as volume fraction, conductivity, and capacity of the electrode, optimize the electrode material and performance of the cell, they have often neglected to integrate the effects of side reactions in the cell performance. Given that different amounts of conductive additives, polymer binder, and active material result in different side reactions, such as transition metal dissolution or interfacial resistance, to accurately predict battery performance they should be included in the model.
The current study aims to integrate the degradation phenomena of the cathode material with various ratios of the composite electrode constituents [1,15,16,17,18]. By considering degradation mechanisms in addition to the key parameters of the composite electrode, the cycling performance of the battery cell can be predicted. To validate the experimental and simulation results, key parameters such as the amount of manganese dissolution, electronic conductivity, and resistance of the composite electrode were experimentally measured to be used as inputs to the degradation model. Accordingly, the specific objectives of this study are as follows:
(1) To measure the amount of manganese dissolved in the electrolyte, electronic conductivity, and interfacial resistance of the composite electrode with different compositions of active material, additive material, and PVDF binder.
(2) To correlate the manganese dissolution, conductivity, and interfacial resistance with cycling performance.
(3) To simulate capacity fade due to different ratios of constituents in the composite electrode using numerical simulations.
2. Experimental Methods
2.1. Fabrication of the LiMn2O4 Composite Electrode
Fresh LiMn2O4 composite electrodes were made from LiMn2O4 electrochemical grade powder (Sigma-Aldrich), carbon black (TIMCAL), and PVDF (Kureha KF 7208) binder, with different weight ratios. They were mixed together using a Speedo Mixer (FlackTek Inc.) for 30 min. The mixed slurry was coated on a 15 µm thin piece of aluminum foil (MTI corp.) and dried in a vacuum at 100 °C for 24 h, then transferred into an Ar-filled glove box (MBraun) containing less than 0.1 ppm of oxygen and moisture. The dried electrodes were punched out as disks with a radius of 0.5 cm. Table 1 shows different samples with different compositions of active material (AM), carbon black (C), and PVDF binder. The first four samples have the same amount of active material (90%) but the ratios of carbon black and PVDF were changed from 1:1 to 0.4:1. The next four samples also have smaller amounts of active material (85%) with different ratios of C: PVDF. Using these eight samples, the effects of the different compositions of these three materials were compared. Next, LiMn2O4 positive electrodes were assembled with sealed 2032-type coin cells (MTI) with a 0.75 mm thick Lithium foil (Alfa Aesar) counter and reference electrodes. Each coin cell contained one separator (Celgard 2320) and the electrolyte solution was 100 µL of 1 M lithium hexafluorophosphate (LiPF6, Sigma –Aldrich) in a mixture (1:1, v/v) of ethylene carbonate (EC, Sigma-Aldrich) and dimethyl carbonate (DMC, Sigma-Aldrich). Formation cycling was performed three times at C/10.
2.2. Measurement of Electronic Conductivity
The conductivity of each composite electrode was measured using the four-point probe method. In order to measure the conductivities of the different ratios of active material, carbon black, and PVDF binder, the mixed slurries of composite electrodes were pasted on a heat resistant glass substrate. The slurries were dried in a vacuum at 100 °C for 24 h. The four-point probe dc method was directly applied to the composite electrode on the glass substrate using an EC-lab VMP3 Biologic potentiostat. Voltage difference was measured from the inner two probes and the current was supplied and extracted from the two outer probes. The electronic conductivity of the composite electrode was calculated as follows [19]:
where is the electrode thickness, I is input current, and V is the voltage.
2.3. Impedance Measurements
Electrochemical Impedance Spectroscopy (EIS) measurements were performed to measure impedance changes arising from the different ratios of active material, carbon black, and PVDF binder. The concentration of manganese was measured with EIS at 3.5 V. Before completing EIS measurements, the cells were rested in the Open Circuit Voltage (OCV) condition for 2 h to stabilize for accurate measurements. AC impedance spectra were obtained by applying sinusoidal waves with an amplitude of 5 mV over frequencies ranging from 100 kHz to 10 mHz. According to the previous studies [20,21], the amplitude of the perturbation of the potential (or current) should be high enough to guarantee an adequate signal-to-noise ratio. However, it also should be low enough that the induced current (or potential) follows a linear response. In the case of Potentio Electrochemical Impedance Spectroscopy (PEIS), strong linearity usually requires a potential perturbation of the order of 5–10 mV. Additionally, given that prior studies that used the same configuration (Li/LiMn2O4 Cell) with this study also used the perturbation of 5 mV [22], the present study adopted 5 mV of perturbation voltage.
2.4. Inductively Coupled Plasma–Optical Emission Spectroscopy (ICP–OES) Measurements
In order to determine the correlation between the amount of dissolved manganese and the number of cycles, the concentration of manganese in the electrolyte was also measured to observe dissolution after a series of cycles. Initial formation cycling was performed five times before the actual cycling. The C rate for the formation cycles was C/10. The LiMn2O4 composite electrode/lithium cell was cycled from 3.5 to 4.3 V using a Biologic VMP3 cycler. After cycling, the cell was disassembled by using a hydraulic disassembling machine (MTI Corp.) in the glove box. Electrolyte and the rest of the coin cell parts were transferred into a 30 mL polycarbonate syringe. These coin cell parts were rinsed three times by adding 15 mL of 5% nitric acid and removed from the syringe. All the samples were diluted to a total of 20 mL of 5% nitric acid in the syringe. ICP–OES measurements were taken three times for each sample to measure the concentration of manganese in the electrolyte using a Perkin-Elmer Optima 2000 DV.
3. Model Development
The current study builds on the pseudo-2D electrochemical model and aims to expand our understanding of electrode degradation by using updated simulation parameters with different composition ratios of active material, carbon black, and PVDF binder in the LiMn2O4 composite electrode. In addition, key parameters such as electronic conductivity, interfacial resistance, and the amount of manganese ions were measured and included in our simulations to better understand these phenomena. Different amounts of active material, carbon black, and PVDF will influence different parameters, such as the electronic conductivity, interfacial resistance, and manganese dissolution rate of the electrode. The four-point probe method was used to estimate the electronic conductivities of different samples. The manganese dissolution rate was measured using ICP–OES. Interfacial resistance was measured using Electrochemical Impedance Spectroscopy (EIS). These parameters were transferred into the numerical simulation developed in our degradation model, which can predict battery performance.
3.1. Electrochemical Modeling
In order to correlate the experiments and simulations, the battery cell model was designed to have the same configuration as the cells used in the experimental work. These cells consisted of a LiMn2O4 composite electrode, a separator, lithium foil as a counter electrode, and 100 µL of 1 M LiPF6 in EC: DMC (1:1, v/v), as shown in Figure 1. The modeling work focused on the reactions and degradation of the cathodic side, and experiments were also designed to investigate the degradation and parameters of the cathode material. The meanings of symbols are listed at the end of this paper and the key parameters for cathode, separator, and electrolyte can be found in Table 2.
The model consists of four different equations that were coupled and solved simultaneously to describe the reaction mechanisms at the cathode [23]:
(a) Two charge conservation equations for Li+ in the cathode and in the electrolyte.
(b) One equation describing the transport of Li+ in the electrolyte.
(c) One equation describing the transport of Li+ in the cathode.
3.1.1. Charge Conservation Equations
Charge conservation in the cathode and in the electrolyte can be described by
In the cathode region (), Equation (2) and Equation (3) apply. In the separator region (), Equation (3) applies with .
Now we consider the boundary conditions to solve for and .
The current density is carried entirely by the solid phase at the right end of the cathode, giving
The current density is carried entirely by the electrolyte phase at the interface between the separator and the cathode, giving
where is defined as positive when the battery discharges, i.e., when lithium ions flow from the anode to the cathode in the cell.
The lithium current density on the anode surface is given by
The potential at the anode surface is set to zero.
The total-reaction current density on the anode surface gives a boundary condition for at in terms of
The other boundary condition for the electrolyte phase can be expressed as
The current density in the electrolyte phase is continuous across the interface between the separator and the cathode regions.
3.1.2. Lithium Transport Equation in the Electrolyte
The transport equations of the species in the separator region are given by
The boundary conditions on the anode surface are given by
The flux continues across the interface between the separator and the cathode regions, given by
The material balance equation in the cathode region is
Lithium intercalation/deintercalation reactions are governed by the Butler–Volmer equation
where is the exchange current of lithium intercalation/deintercalation reactions, defined as
where is the reaction-rate constant in the positive electrode, is the maximum concentration of lithium ions in the cathode particles, and is the concentration of lithium ions on the surface of the cathode particles.
The boundary conditions at are
3.1.3. Lithium Transport Equation in the Cathode
In the solid particles of the cathode the material transport is given by
The boundary conditions for solid phase diffusion can be expressed as
3.2. Side Reactions of the Cathode Material
3.2.1. Manganese Dissolution
Mn2+ ions dissolve in the electrolyte, which causes active material loss and additional decrease in capacity. Active material loss can be described as a volume change of the electrode:
where Xa stands for the ratio of the initial and dissolved masses of manganese, defined as
where is the amount of dissolved manganese and is the initial mass of the active material. However, the dissolution of manganese not only decreases the volume fraction of the active material, but also leads to particle isolation and particle structure distortion. These will cause an additional decrease in capacity, which is also described in the previous literature [24],
where is the usable volume fraction that is used in the positive electrode and is a particle isolation coefficient. It is assumed that the volume fraction of the electrode follows the usable volume fraction, and the maximum solid phase concentration also decreases in proportion to the usable volume fraction of the electrode. The solid phase concentration only decreases by the volume fraction, giving
Also, the specific surface area of the cathode also decreases as Mn dissolution occurs, which can be expressed as
3.2.2. Charge Transfer Resistance
The ability to transfer lithium ions at the electrode/electrolyte interface changes with the different compositions of active material, carbon black, and polymer binder in the cathode. The change in interfacial resistance at the cathode/electrolyte interface has been proposed to be [25,26]
where F is Faraday’s constant, R is the gas constant, and T is the temperature.
In order to evaluate the effects of different compositions of cathode electrodes on cell performance, changes in the reaction-rate constant are considered in the simulation. This requires measuring charge transfer resistance by using an experiment at the same voltage. Information about charge transfer resistance with different compositions of cathode samples was acquired using experiment results.
Change in interfacial resistance due to the PVDF binder was considered in the simulation using Equation (27). If we measure the charge transfer resistance at the same voltage, only the reaction-rate constant changes in the equation. Since it is hard to determine the exact value of each parameter in the experiment, relative charge transfer resistance ratios were used to provide the relative value in the simulation.
3.2.3. Effective Electronic Conductivity
The effective electronic conductivity of the solid phase is related to the volume fraction of the active material, which can be defined as follows:
where is the electronic conductivity of the composite electrode and brug is the Bruggeman number.
4. Results and Discussions
4.1. Four-Point Probe Conductivity Measurements
Table 3 shows the electronic conductivity measurements of the LiMn2O4 composite electrode samples with different ratios of active material, carbon black, and PVDF binder. The results show that the conductivity of the electrode varied significantly with the different samples. For example, sample 1 had more than 33 times higher electronic conductivity compared to sample 8. These results can be mainly attributed to the amount of carbon black in the composite electrode. The electronic conductivity of LiMn2O4 was only about 100 ~10−4 S/m [27], while the conductivity of the overall composite electrode was highly dependent on the amount of carbon black and composite structure (Table 1).
4.2. Manganese Dissolution Due to Different C/PVDF Ratios
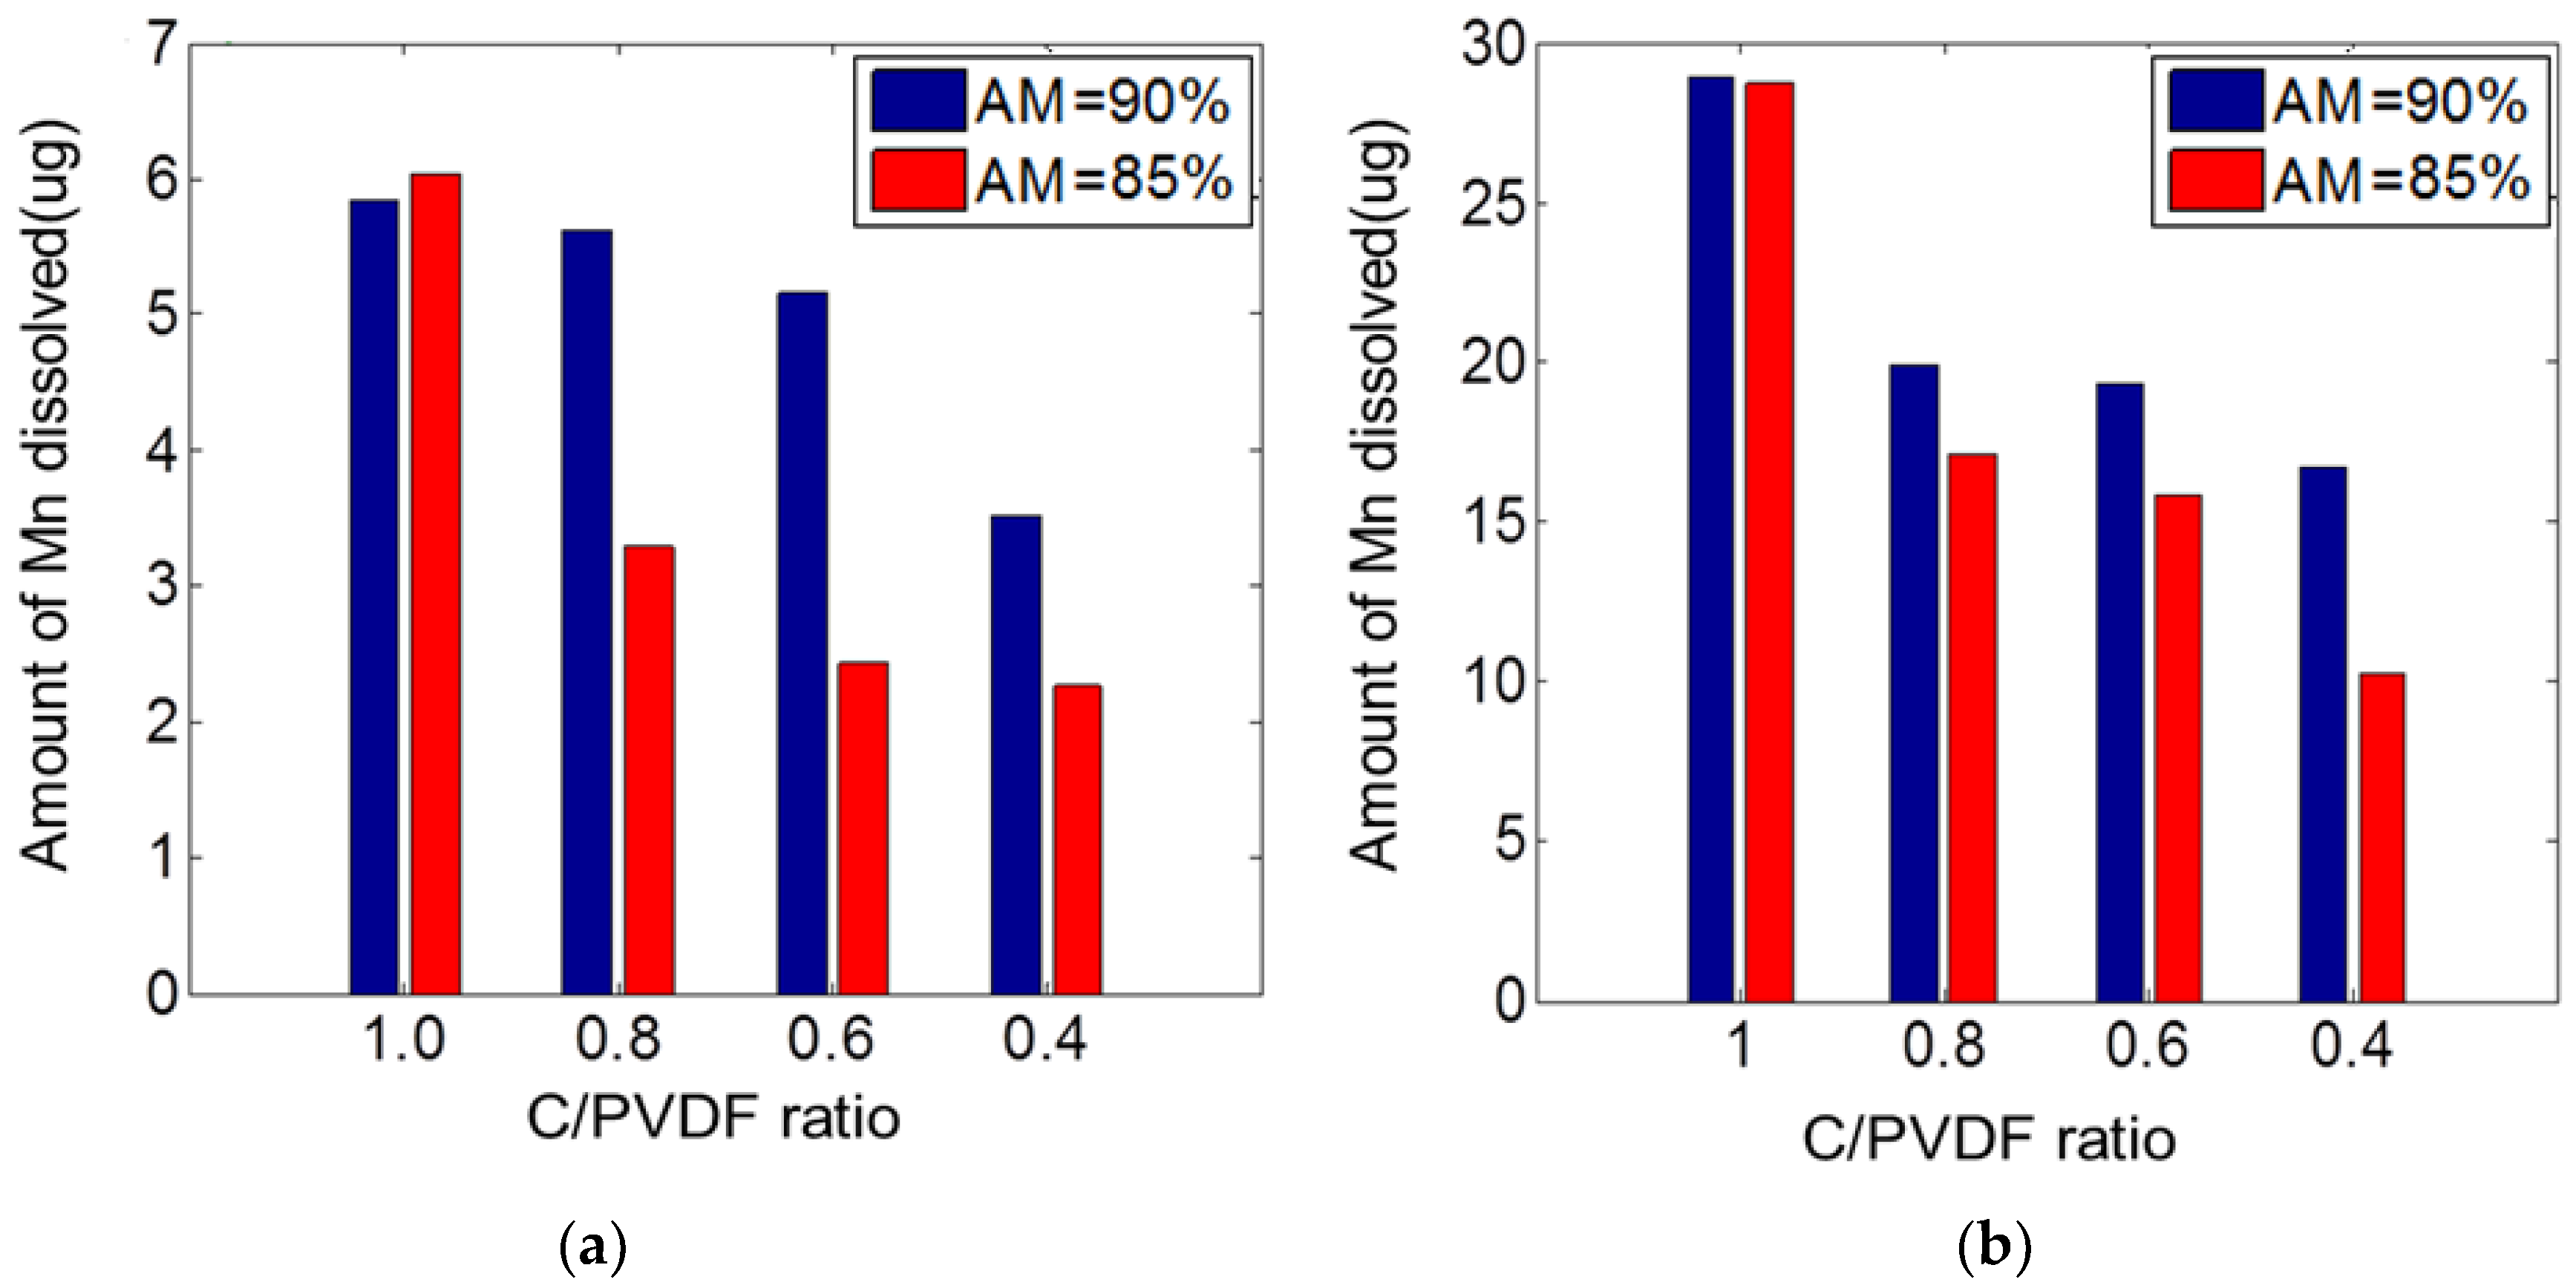
Figure 2 shows the amount of dissolved manganese ions in the electrolyte after (a) 15 cycles and (b) 50 cycles with different ratios of active material, carbon black, and PVDF binder. Higher ratios of carbon black to PVDF binder in the electrode caused more Mn dissolution. Moreover, the amount of dissolved manganese ions substantially increased when the active material was 90% compared to 85%. Dissolution rate was calculated based on the amount of dissolved manganese in the electrolyte.
4.3. Interfacial Resistance Due to Different C/PVDF Ratios
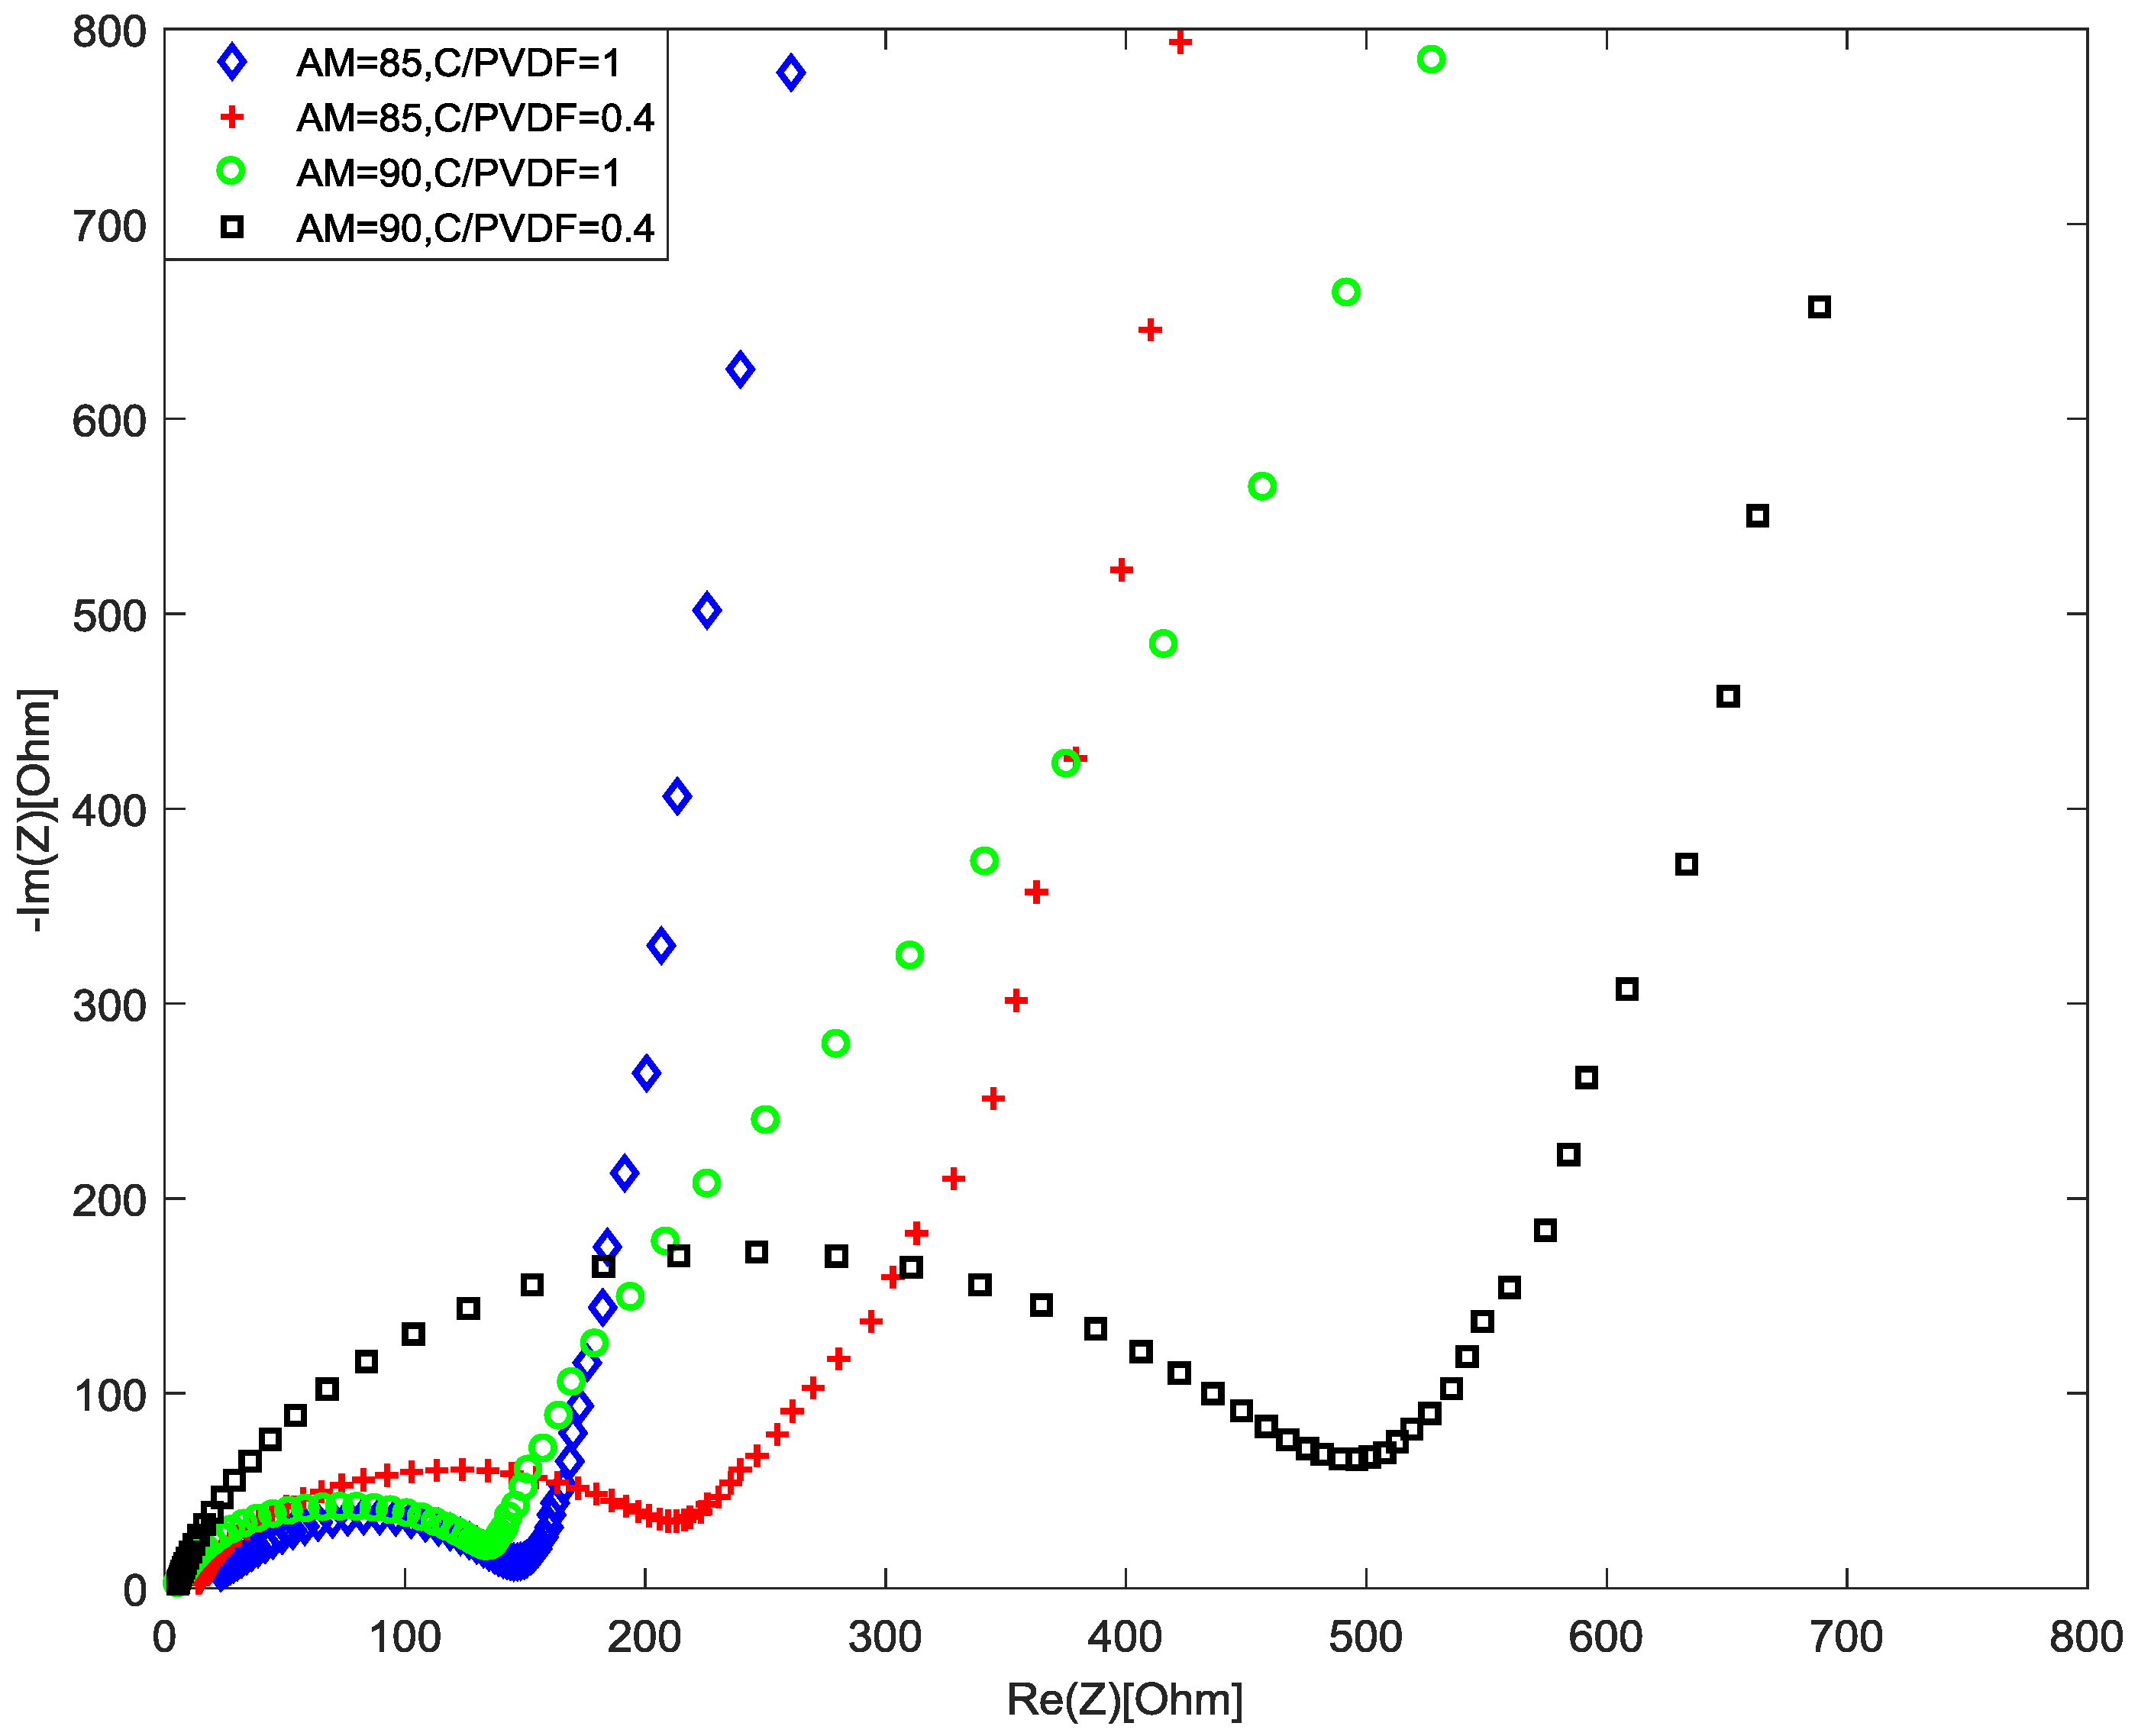
In addition to manganese dissolution and electronic conductivity, interfacial resistances also changed significantly with different ratios of PVDF and carbon black. Figure 3 shows the EIS spectra of different active material and C/PVDF ratios. When the active material was 90% and the C/PVDF ratio was 0.4, the impedance of the electrode significantly increased compared to other samples due to the imbalance in the proportion of active material, carbon black, and PVDF. When the amount of PVDF was too high compared to that of carbon black, the electronic conductivity of the composite electrode significantly decreased. When the AM was 90% and the C/PVDF ratio was 1, impedance was smallest, and when AM was 90% and the C/PVDF ratio was 0.4, impedance was largest in the samples.
This result indicates that the ratio of C/PVDF is an important factor that affects the impedance of the cell. When AM was 85%, the differences in impedance between the C/PVDF ratios of 1 and 0.4 became smaller. It seems that the larger amount of carbon black and PVDF decreased the impedance of the cell, versus when AM was 90%. Thus, the actual amount and the ratio of constituents influenced the performance of the cell. The amount of dissolved manganese and the interfacial resistance value due to different components of the electrode were used as input parameters in the numerical simulations.
The electrochemical reactions and characteristics of the electrode and electrolyte can be identified by separating the frequency region of the EIS spectra [28,29,30,31,32]. Waag et al. [28] used an equivalent circuit model that simply consists of ohmic resistance, charge transfer resistance, and double layer capacitance. In this paper, a similar model was adopted from the literature [28] to quantify the ohmic resistance and charge transfer resistance of the cell. Table 4 shows the impedance model and quantified values of circuit elements with different samples. EIS spectra were fitted by using the EC-Lab software V10.22.
The left endpoint of the semicircle in the higher frequency domain indicates the ohmic resistance of the electrolyte within the separator. Ohmic resistance is related to an immediate voltage drop caused by the pure ohmic resistance of the electrode [28,31,32]. The value of ohmic resistance did not change significantly among different samples compared to the charge transfer resistance, as can be seen in Figure 3 and Table 4. Therefore, the effects of ohmic resistance changes with different samples were neglected in this paper. The voltage decreased further due to changes in the lithium concentration of the active mass particles, which causes a change in the electromotive force (EMF) of the battery [28], which is related to the charge transfer resistance. In this paper, the effect of charge transfer resistance change was included by changing the reaction-rate coefficient of the positive electrode.
4.4. Validation of Simulation Model using Experiment Data
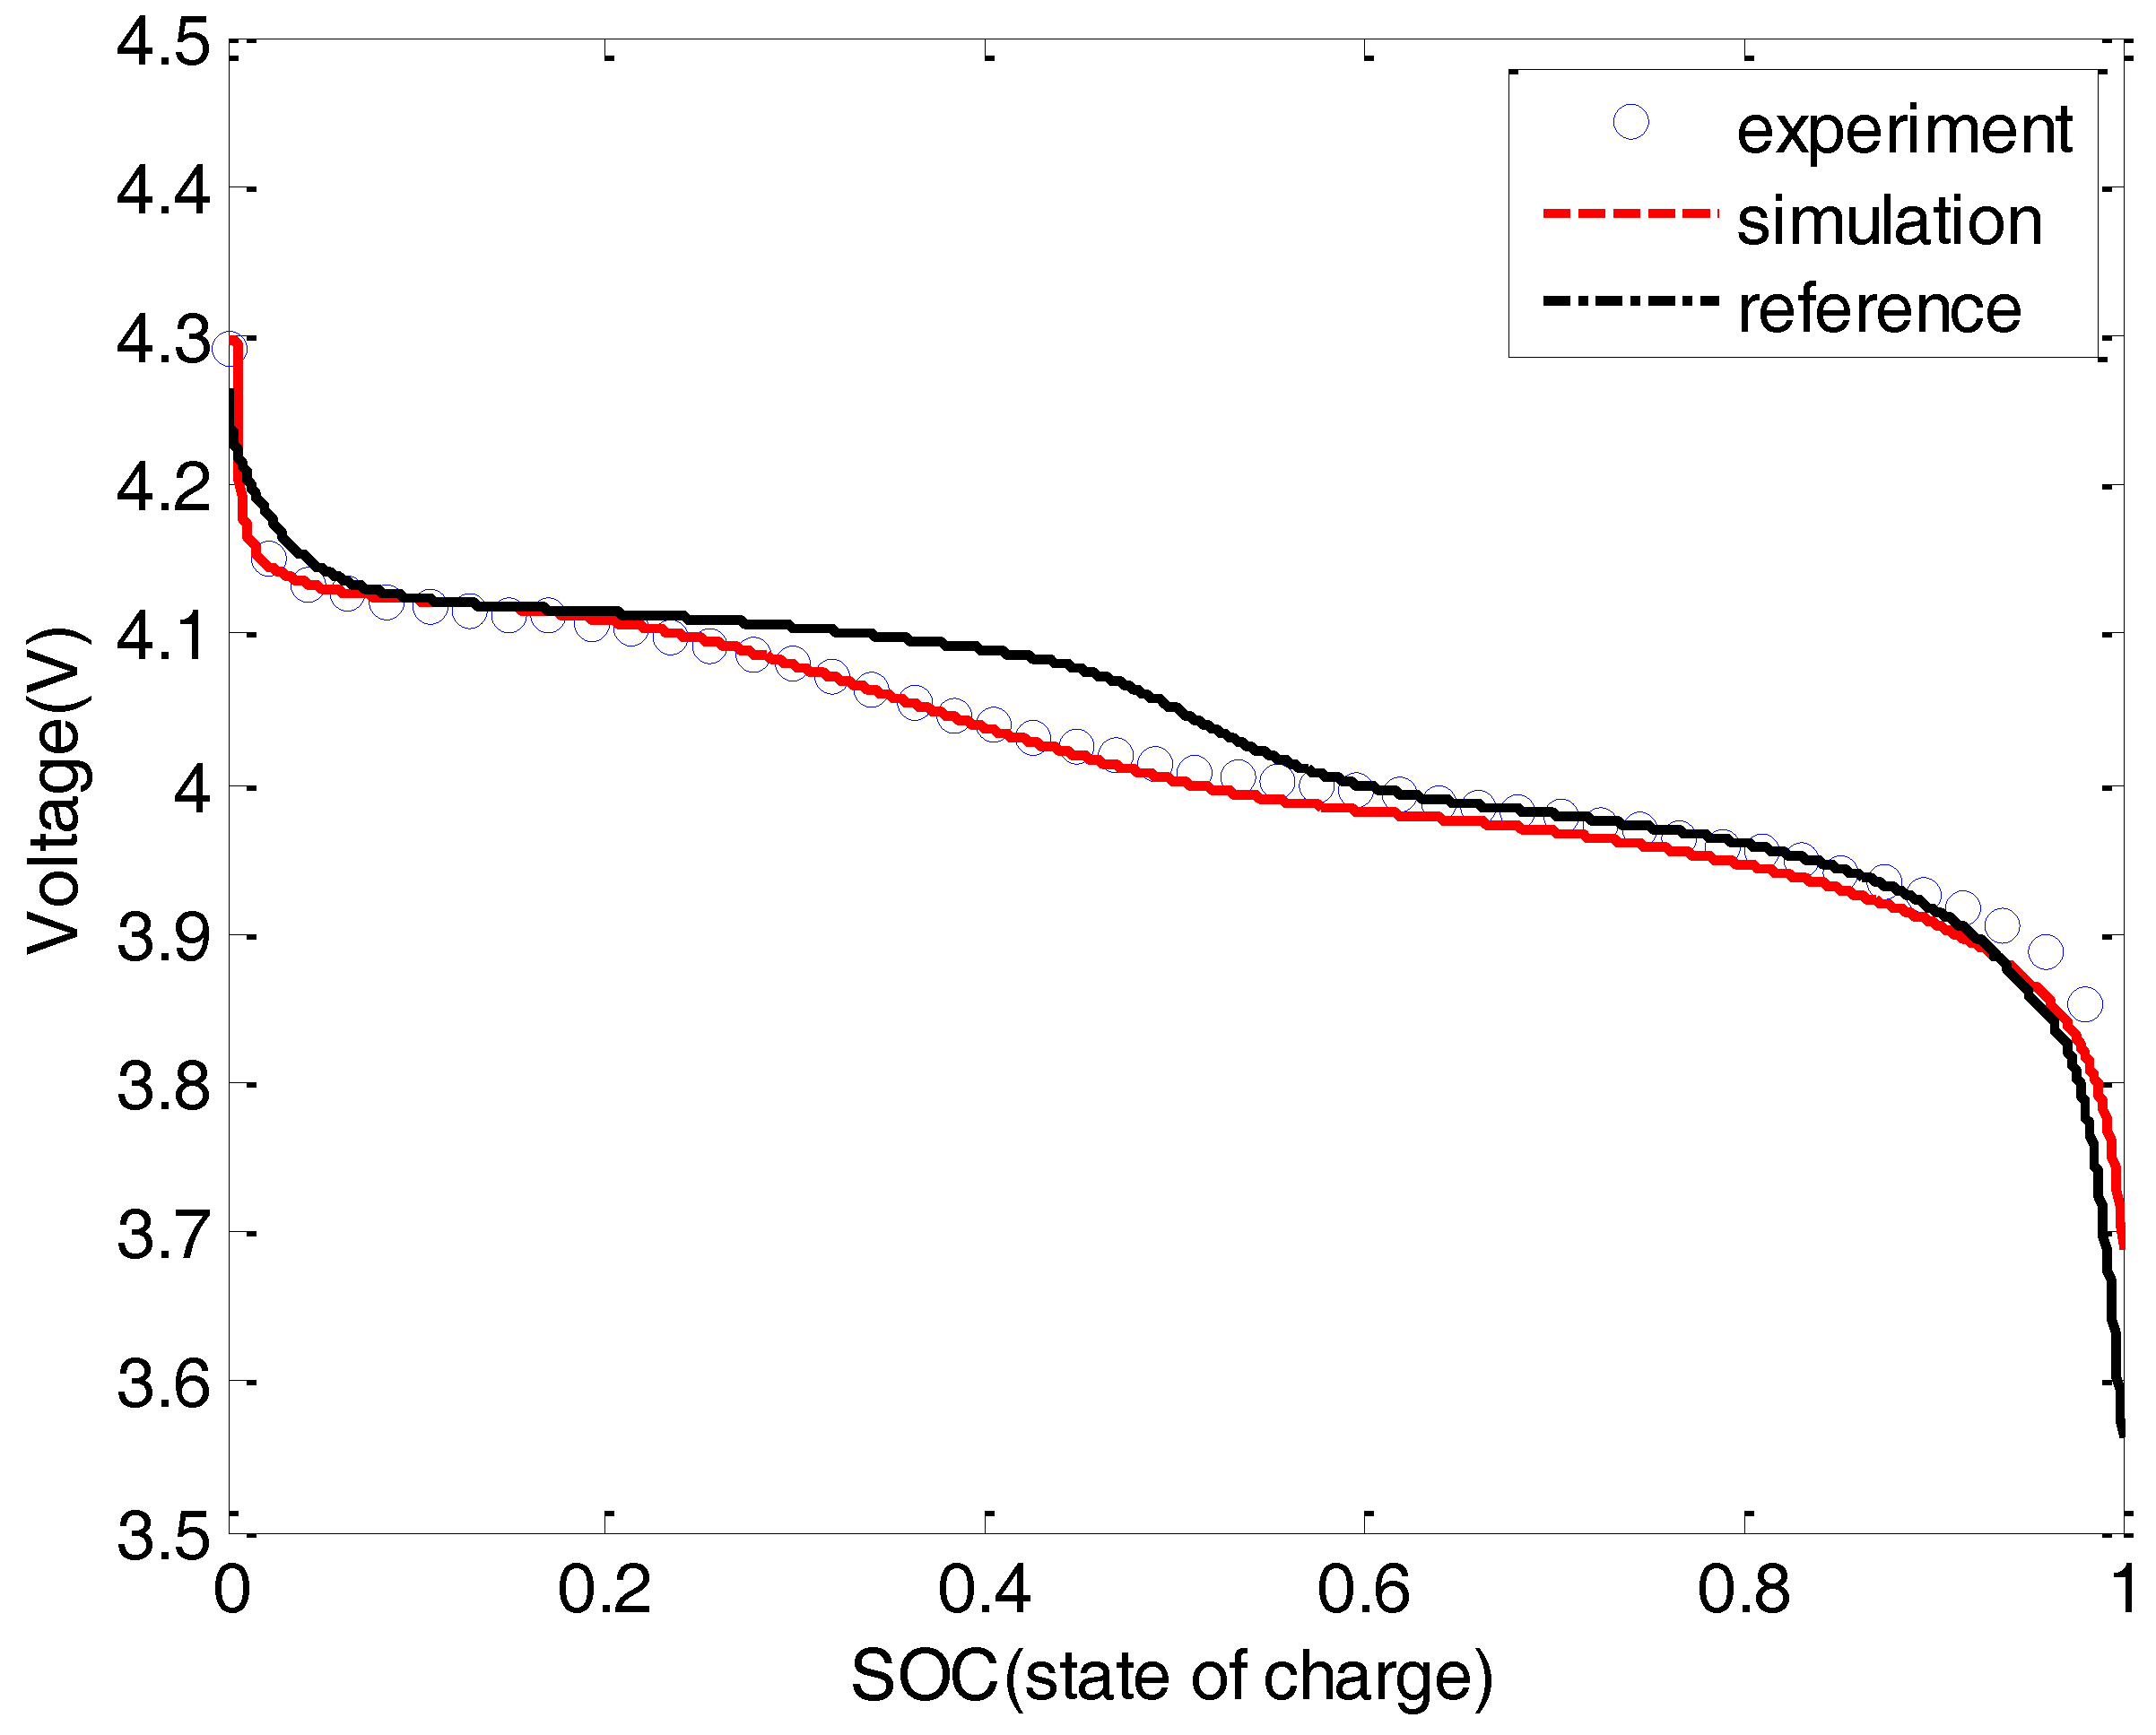
Figure 4 shows a comparison of the voltage profiles obtained by simulation and experiment. A black line shows the voltage output utilizing the OCV curve from a previous study [33], and the red line shows the voltage profile predicted by simulations using the measured OCV. The output voltage profile obtained in the simulations using the measured OCV curve (red line) was similar to the experimental result (blue circles) from the previous study. The differences between the voltage profile in the simulation and reference arose mainly from the 4.1 V plateau.
In order to predict cell performance more accurately, the measured OCV curve was used in the simulation.
Figure 5 shows comparisons of the discharge curve obtained from the experiment and simulation. When the measured OCV profile from Figure 4 was used in the simulations, the predicted discharge profiles of 1 and 50 cycles were similar to the experimental values of sample 1 from Table 3. There was a 10.5% capacity decrease in the experiment for sample 1, and a 10.9% capacity decrease was predicted using simulations.
4.5. Parametric Study of Different Composition Ratios of the LiMn2O4 Composite Electrode
Table 5 shows the parameters that were considered with different constituents of the composite electrode. Among various parameters, the volume fraction of the active material, the reaction-rate constant of lithium, effective electronic conductivity, and the dissolution rate of the Mn were considered in the model.
Before evaluating the performance of the actual sample with different amounts of active material, conductive additives, and polymer binder, a parametric study was performed for three different parameters: the electronic conductivity, reaction-rate constant, and dissolution rate of Mn. In order to elucidate the effect of each parameter, the maximum and minimum values from the samples were extracted and simulated.
First, the effect of electronic conductivity was considered. Figure 6 shows the voltage profile with two different electronic conductivities. The results clearly show that the value of electronic conductivity had almost no influence on the voltage profile with the given C-rate. Also, the effective change in electronic conductivity during cycling, which is described in Equation (28), also had no significant influence on cell performance. This result is very similar to the previous report [10], which performed a sensitivity study of electronic conductivity. The results also showed that electronic conductivity of 0.1, 1, and 10 S/m had almost no influence on the voltage profile with a 1C-rate.
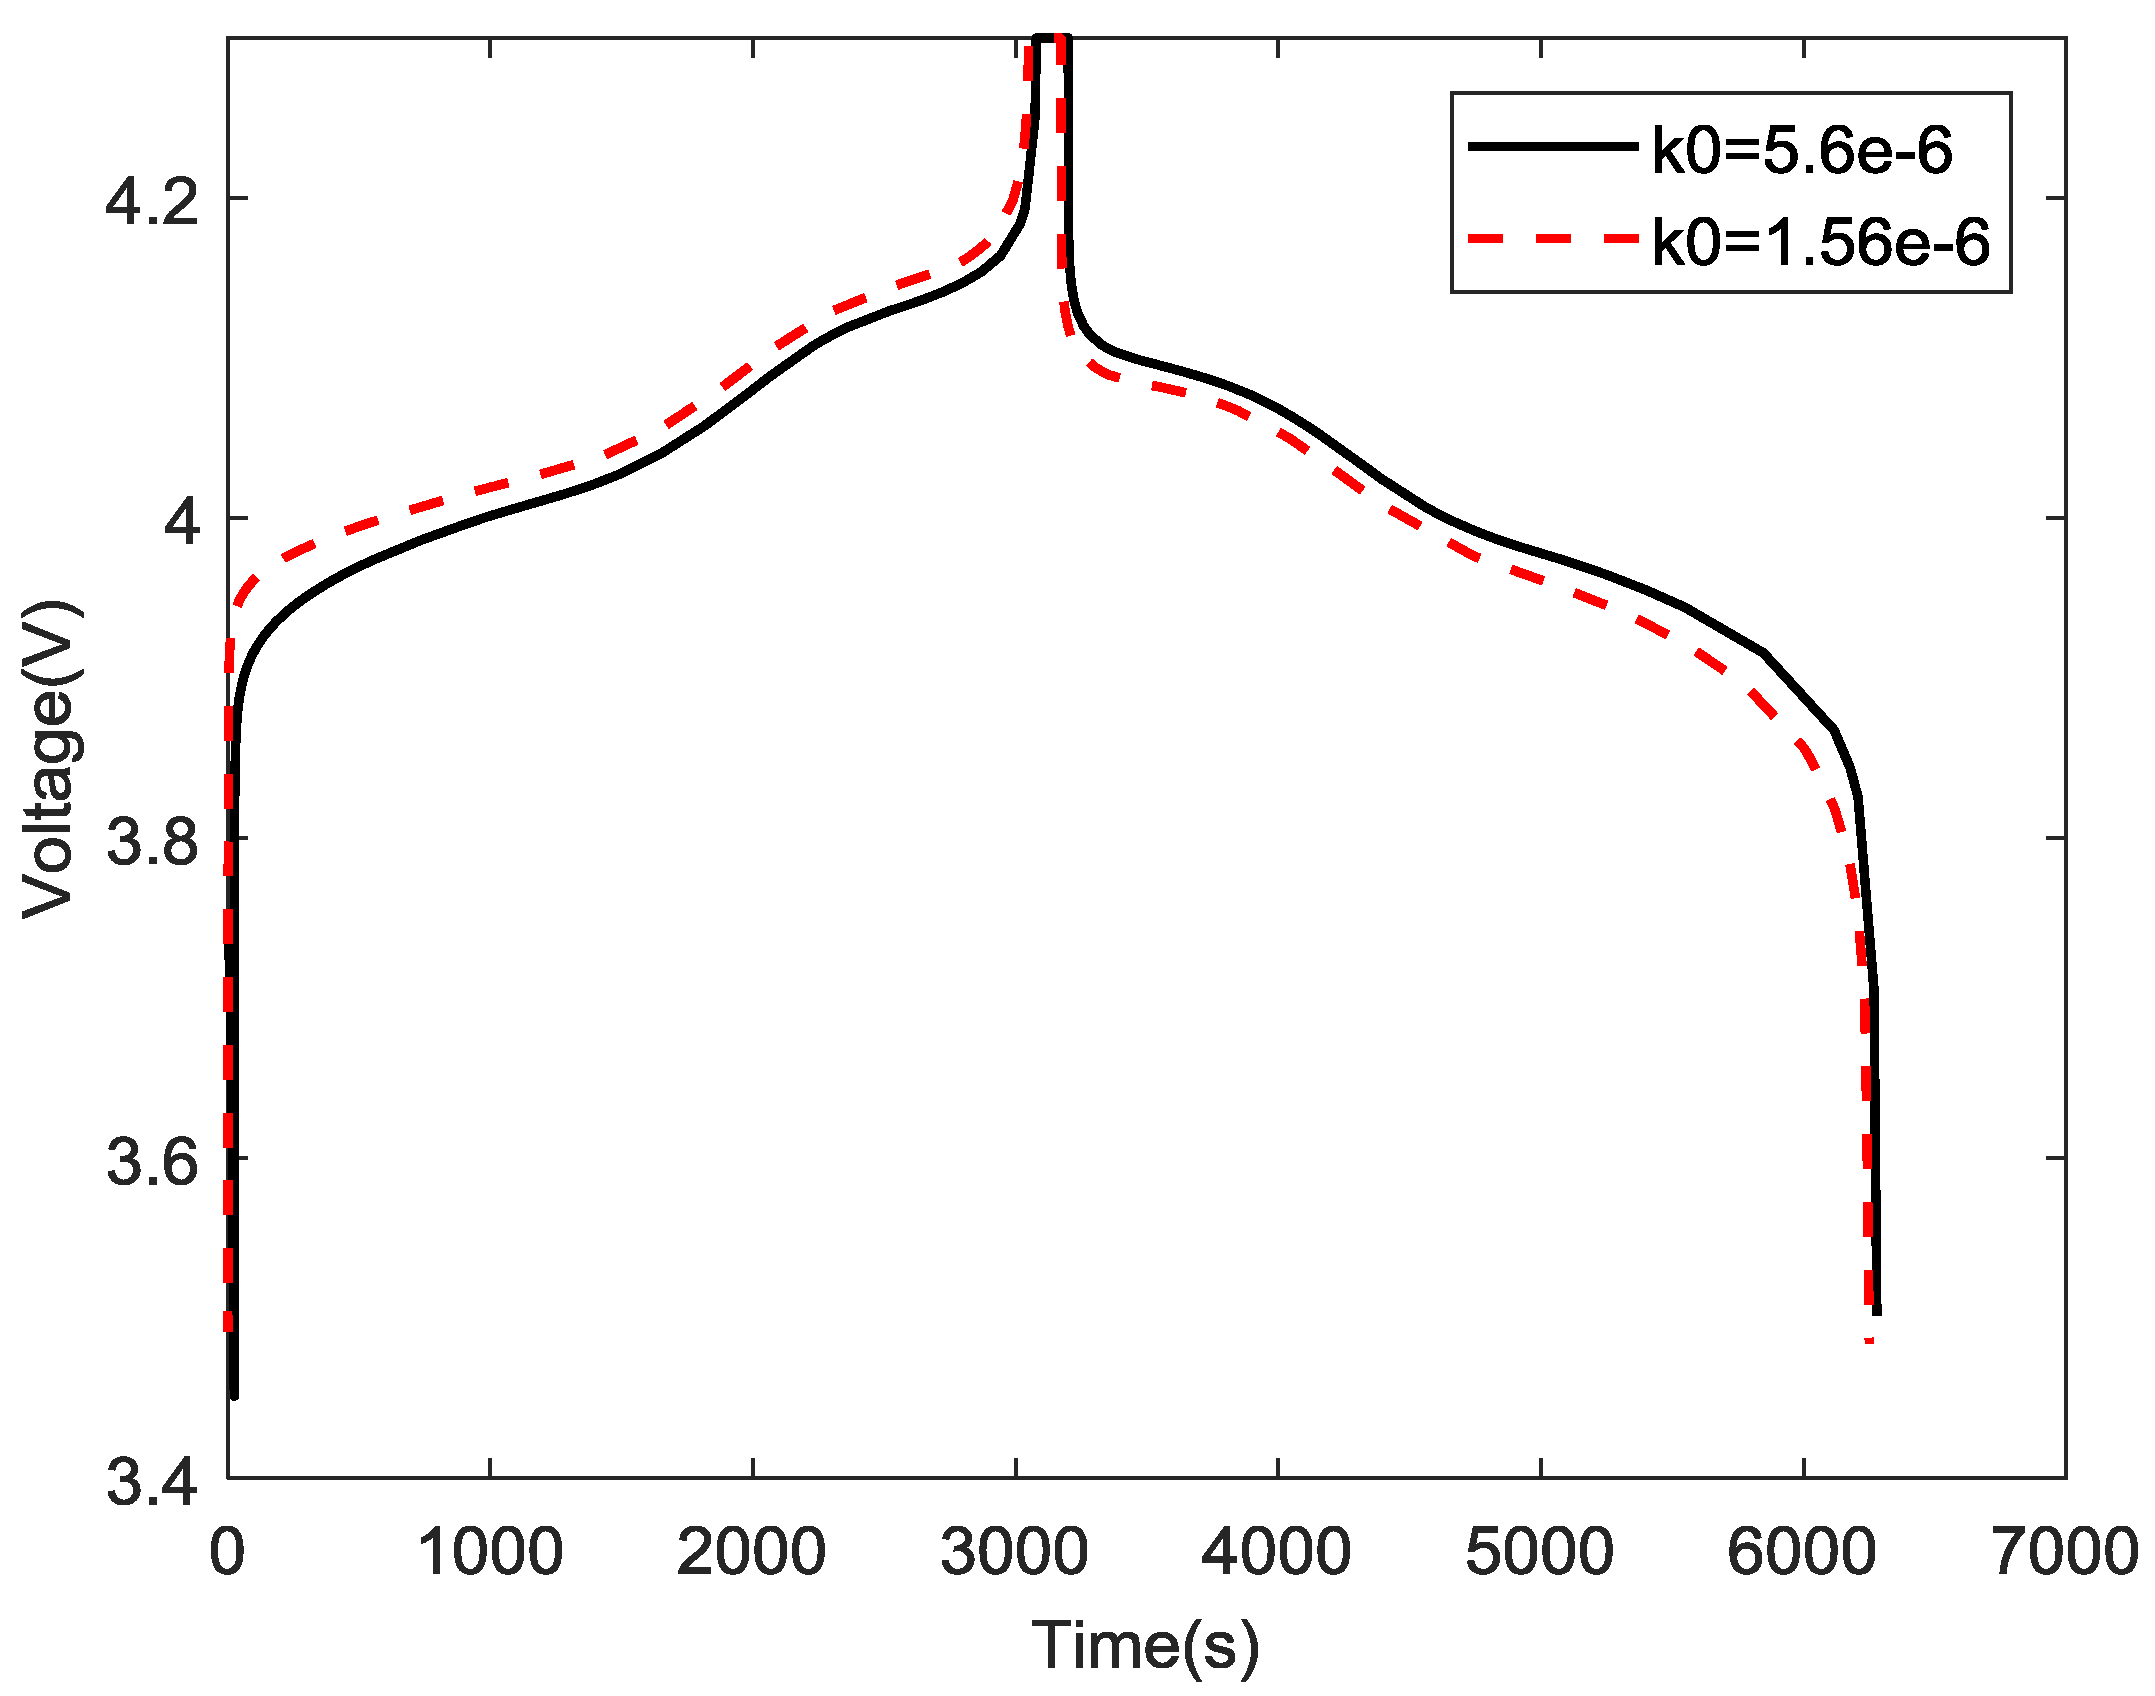
In addition, the effect of the reaction-rate constant of lithium in the composite electrode was considered (Figure 7). Higher charge transfer resistance led to a charge and discharge profile imbalance. Due to the smaller reaction-rate constant, the voltage profile shifted up during charging and shifted down during discharge. Since the resistance increased as the cycle number increased, the voltage profile changed continuously during cycling. This increase could also negatively influence the capacity of the LiMn2O4 composite electrode. Figure 8 shows a normalized capacity profile with different reaction-rate constants. With a given same dissolution rate (Xa = 2.21), the discharge capacity was also affected by the reaction-rate constant of the sample.
Lastly, the effect of the Mn dissolution rate was investigated. Figure 9 and Figure 10 show the volume fraction change and capacity change with maximum and minimum dissolution rates while other parameters are fixed. The capacity of the cell was reduced not only by the decrease in the volume fraction of the active material but also by increased particle isolation and interfacial resistance. The volume fraction of the active material only decreased by 1.17% and 2.21%, but the capacity decreased about 6% and 10.5 %, respectively. The results indicate that resistance increase and other side reactions have a more detrimental impact than the decrease in volume fraction due to Mn dissolution.
4.6. Simulation Results with Divergent Amounts of Active Material, Conductive Additives, and Polymer Binder
By applying different parameters of electronic conductivity, dissolution rate, reaction-rate constant, and volume fraction, as shown in Table 5, the cell performance was analyzed for different amounts of active material, conductive additives, and polymer binder in the positive composite electrode. Figure 11 shows the normalized change in volume fraction for eight different composite electrode samples. Since samples 5 to 8 had less active material compared to samples 1 to 4, the initial volume fractions of the former were smaller. However, since the former four samples had a higher dissolution rate compared to the latter four samples, the slope of the volume fraction decrease was steeper. The smaller C/PVDF ratio caused smaller changes in the volume fraction of the electrode.
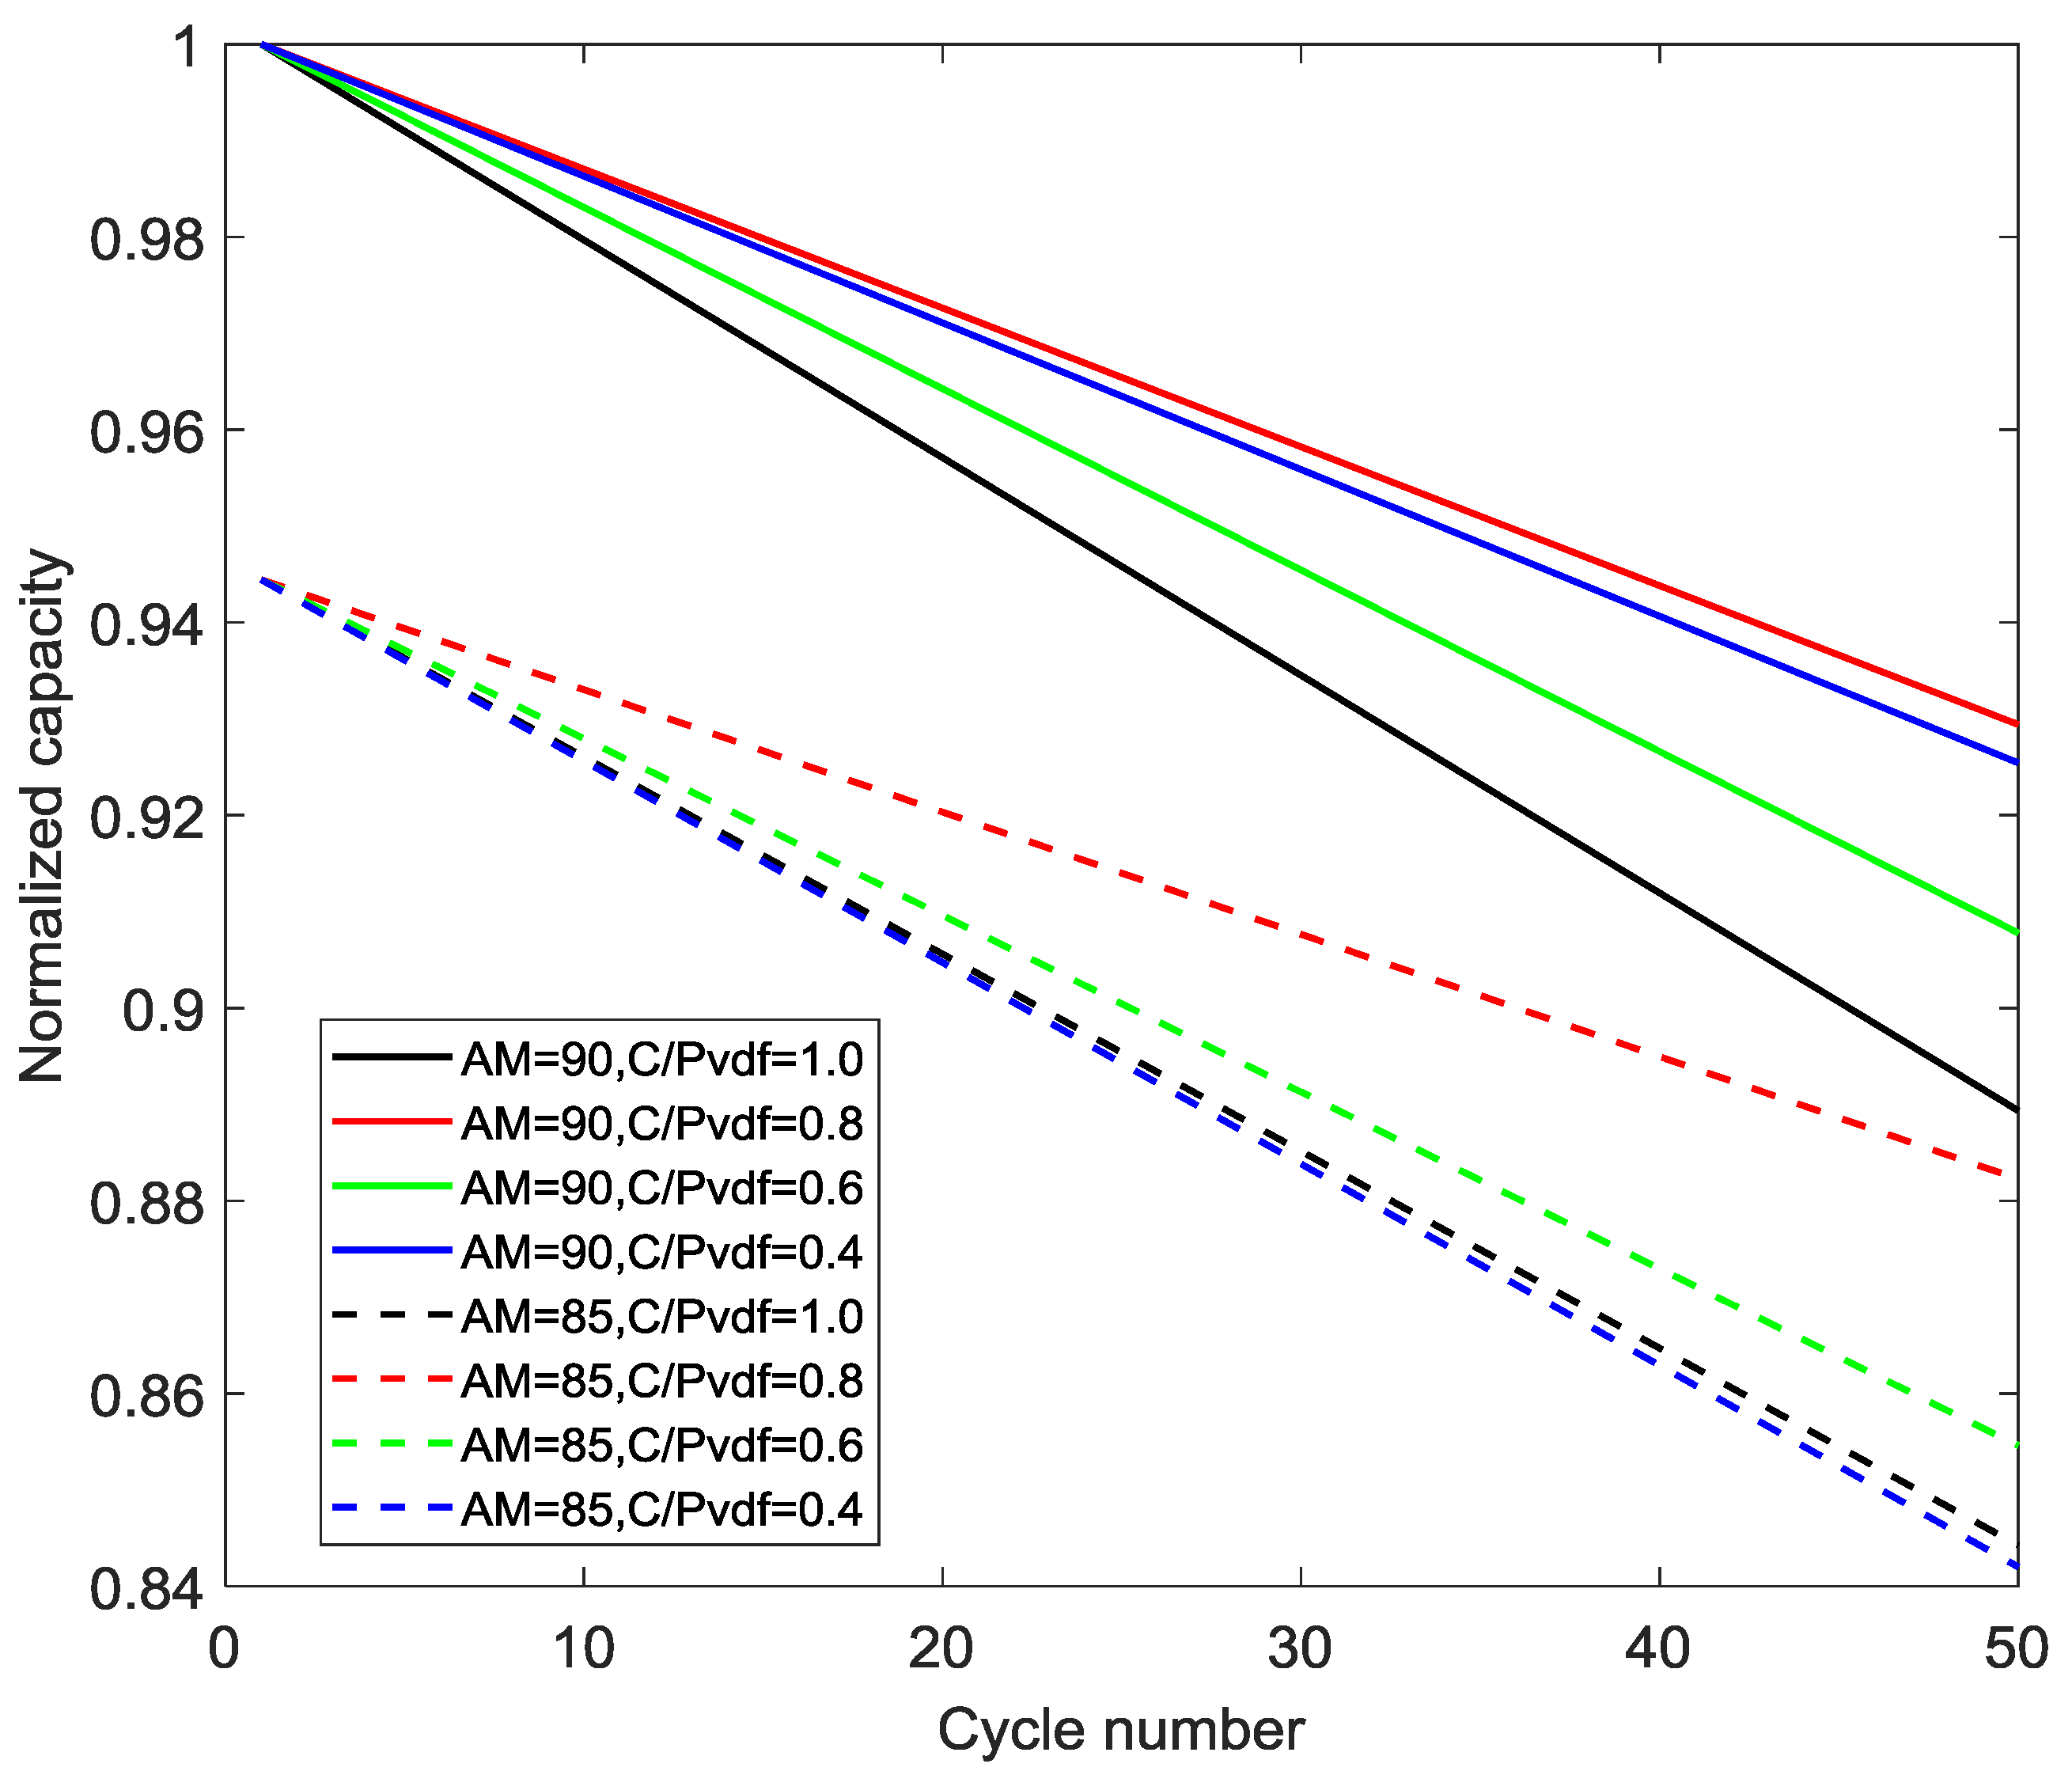
Figure 12 shows the capacity change with increasing cycle number for different amounts of active material and C/PVDF ratios. According to the results, the sample with 90% active material and a C/PVDF ratio of 0.8 had the highest capacity among all other samples. Among the samples with 85% active material, the one with a C/PVDF ratio of 0.8 also had the highest capacity. These results suggest that either the highest dissolution rate or highest interfacial resistance results in higher capacity fade, which indicates that there must be an optimum ratio of the constituents that can maximize the capacity of the cell.
Moreover, the sample with 85% active material and a C/PVDF ratio of 0.8 had a moderate slope of capacity decrease. This means that this sample will have the highest capacity at some point after 50 cycles. Thus, just by changing the amount of active material, conductive additives, and polymer binder, the cycle life of the cell can be optimized for the specified target of battery that we are trying to use. By employing this method, the optimal ratio of constituents for a particular composite electrode that can maximize the cycle life of the battery can be specified.
The current work mainly focused on the cycle life of the battery, with simplified parameter variations. Future research needs to include further optimizations of power performance with detailed degradation phenomena.
5. Conclusions
The effects of active material, conductive additives, and binder used in the composite electrode on battery performance were investigated. Various experimental techniques were used to obtain data, including electronic conductivity measurement, ICP–OES measurements, electrochemical measurements, and computational techniques. As predicted, the cell performance of the battery changed with different ratios of active material, carbon black, and PVDF binder. A higher ratio of polymer binder to conductive additives increased the interfacial resistance. Moreover, a higher ratio of conductive additives to polymer binder in the electrode resulted in an increase in dissolved manganese ions from the LiMn2O4 composite electrode.
These results imply that these factors should be considered to optimize battery performance. In addition, to investigate the effects of active material, conductive additives, and polymer binder, a pseudo-2D electrochemical model was prepared using measured parameters of conductivity, dissolution rate, and impedance data. Simulation results showed that electronic conductivity did not have a significant impact on the cell capacity with the given C-rate. Increased interfacial resistance and other side reactions, such as particle isolation, had a more detrimental impact on cell capacity compared to a decrease in volume fraction due to Mn dissolution.
In terms of maximizing capacity within 50 cycles, the samples with 90% active material and a C/PVDF ratio of 0.8 had the highest capacity among all samples. The results show that composition ratios of constituents in the LiMn2O4 composite electrode are the critical factors that determine the cycle life of the battery.
Finally, future research needs to consider all these major parameters that influence the cell performance, as well as power performance, to investigate and determine the optimal ratio of constituents to improve the current findings.
Funding
This research received no external funding.
Acknowledgments
The author extends his gratitude to WeiLu (Dept. Mechanical Eng. at Univ. of Michigan) and Jonghyun Park (Dept. Mechanical Eng. at Missouri S&T) for their help during the development of this work.
Conflicts of Interest
The author declares no conflict of interest.
Symbol
| specific surface area of positive electrode, 1/m | |
| the concentration of species i in the electrolyte, mol/m3 | |
| concentration of lithium ions in the solid phase of the cathode, mol/m3 | |
| initial concentration of lithium ions in the solid phase of the cathode, mol/m3 | |
| the maximum solid phase concentration, mol/m3 | |
| the initial maximum solid phase concentration, mol/m3 | |
| surface solid phase concentration of lithium ions in the particle electrode, mol/m3 | |
| effective diffusion coefficient of species of lithium in the electrolyte, m2/s | |
| electrolyte activity coefficient | |
| F | Faraday’s constant, C/mol |
| exchange current of lithium intercalation/deintercalation reactions at cathode, A/m2 | |
| current density due to lithium intercalation/deintercalation reaction at cathode, A/m2 | |
| current density due to reaction of lithium at lithium metal anode, A/m2 | |
| applied total current density, A/m2 | |
| particle isolation coefficient | |
| reaction rate constant of Li ion on Li metal surface, A/m0.5mol0.5 | |
| reaction-rate constant in the positive electrode, A/m2 | |
| effective electronic conductivity of the electrolyte phase, S/m | |
| ionic conductivity of the electrolyte phase, S/m | |
| length of positive electrode, m | |
| length of separator, m | |
| the amount of dissolved manganese, g | |
| initial mass of the active material, g | |
| number of electron exchanges during charge transfer reactions | |
| molar mass of lithium ion, g/mol | |
| R | universal gas constant, J/mol K |
| particle radius of active material in positive electrode, m | |
| charge transfer resistance of the electrode, Ω m2 | |
| lithium ion transference number in the electrolyte | |
| electrode thickness, mm | |
| T | room temperature, K |
| x | the intercalation level of lithium into the positive electrode |
| anodic transfer coefficient of lithium intercalation/deintercalation reactions | |
| cathodic transfer coefficient of lithium intercalation/deintercalation reactions | |
| anodic transfer coefficient at lithium metal | |
| cathodic transfer coefficient at lithium metal | |
| volume fraction of positive electrode | |
| initial volume fraction of positive electrode | |
| porosity of the region of separator and positive electrode | |
| usable volume fraction of positive electrode | |
| overpotential for lithium intercalation/deintercalation reaction, V | |
| potential of the solid phase, V | |
| potential of the electrolyte phase, V | |
| potential of lithium metal, V | |
| the ratio of the initial and dissolved masses of manganese |
References
- Chen, Y.H.; Wang, C.W.; Zhang, X.; Sastry, A.M. Porous cathode optimization for lithium cells: Ionic and electronic conductivity, capacity, and selection of materials. J. Power Sources 2010, 195, 2851–2862. [Google Scholar] [CrossRef]
- Trembacki, B.L.; Mistry, A.N.; Noble, D.R.; Ferraro, M.E.; Mukherjee, P.P.; Roberts, S.A. Mesoscale analysis of conductive binder domain morphology in lithium-ion battery electrodes. J. Electrochem. Soc. 2018, 165, E275–E736. [Google Scholar] [CrossRef]
- Inoue, G.; Kawase, M. Numerical and experimental evaluation of the relationship between porous electrode structure and effective conductivity of ions and electrons in lithium-ion batteries. J. Power Sources 2017, 342, 476–488. [Google Scholar] [CrossRef]
- Mandal, S.; Amarilla, J.M.; Ibáñez, J.; Rojo, J.M. The role of carbon black in LiMn2O4 based composites as cathodes for rechargeable lithium batteries. J. Electrochem. Soc. 2001, 148, A24–A29. [Google Scholar] [CrossRef]
- Liu, G.; Zheng, H.; Song, X.; Battaglia, V.S. Particles and polymer binder interaction: A controlling factor in lithium-Ion electrode performance. J. Electrochem. Soc. 2012, 159, A214–A221. [Google Scholar] [CrossRef]
- Zhang, L.; Lyu, C.; Wang, L.; Luo, W.; Ma, K. Thermal-electrochemical modeling and parameter sensitivity analysis of lithium-ion battery. Chem. Eng. Trans. 2013, 33, 943–948. [Google Scholar]
- Zhang, L.; Lyu, C.; Hinds, G.; Wang, L.; Luo, W.; Zheng, J.; Ma, K. Parameter sensitivity analysis of cylindrical LiFePO4 battery performance using multi-physics modeling. J. Electrochem. Soc. 2014, 161, A762–A776. [Google Scholar] [CrossRef]
- Du, W.; Gupta, A.; Zhang, X.; Sastry, A.M.; Shyy, W. Effect of cycling rate, particle size and transport properties on lithium-ion cathode performance. Int. J. Heat Mass Transf. 2010, 53, 3552–3561. [Google Scholar] [CrossRef]
- Ghaznavi, M.; Chen, P. Sensitivity analysis of a mathematical model of lithium-sulfur cells part I: Applied discharge current and cathode conductivity. J. Power Sources 2013, 257, 4–11. [Google Scholar] [CrossRef]
- Han, S.W. Transport and Kinetic Phenomena Linked to Power Performance of Lithium-ion Batteries. Ph.D. Dissertation, University of Michigan, Ann Arbor, MI, USA, 2014. [Google Scholar]
- Hosseinzadeh, E.; Marco, J.; Jennings, P. Electrochemical-thermal modelling and optimisation of lithium-ion battery design parameters using analysis of variance. Energies 2017, 10, 1278. [Google Scholar] [CrossRef]
- Arora, P.; White, R.E.; Doyle, M. Capacity fade mechanisms and side reactions in lithium-ion batteries. J. Electrochem. Soc. 1998, 145, 3647–3667. [Google Scholar] [CrossRef]
- Marks, T.; Trussler, S.; Smith, A.J.; Xiong, D.; Dahn, J.R. A guide to li-ion coin-cell electrode making for academic researchers. J. Electrochem. Soc. 2011, 158, A51–A57. [Google Scholar] [CrossRef]
- Liu, G.; Zheng, H.; Kim, S.; Deng, Y.; Minor, A.M.; Song, X.; Battaglia, V.S. Effects of various conductive additive and polymeric binder contents on the performance of a lithium-ion composite cathode. J. Electrochem. Soc. 2008, 155, A887–A892. [Google Scholar] [CrossRef]
- Shin, J.; Kostecki, R.; Richardson, T.; Song, X.; Striebel, K.A. Electrochemical analysis for cycle performance and capacity fading of a lithium-ion battery cycled at elevated temperature. J. Power Sources 2002, 112, 222–230. [Google Scholar] [CrossRef] [Green Version]
- Yang, L.; Takahashi, M.; Wang, B. A study on capacity fading of lithium-ion battery with manganese spinel positive electrode during cycling. Electrochim. Acta 2006, 51, 3228–3234. [Google Scholar] [CrossRef]
- Lee, Y.K.; Park, J.; Lu, W. A comprehensive study of manganese deposition and side reactions in li-ion battery electrodes. J. Electrochem. Soc. 2017, 164, A2812–A2822. [Google Scholar] [CrossRef]
- Lee, Y.K.; Park, J.; Lu, W. Electronic and bonding properties of LiMn2O4 spinel with different surface orientations and doping elements and their effects on manganese dissolution. J. Electrochem. Soc. 2016, 163, A1359–A2822. [Google Scholar] [CrossRef]
- Smits, F.M. Measurement of sheet resistivities with the four-point probe. Bell Syst. Tech. J. 1958, 37, 711–718. [Google Scholar] [CrossRef]
- Bard, A.J.; Inzelt, G.; Scholz, F. Electrochemical Dictionary, 2nd ed.; Springer: Berlin, Germany, 2008; ISBN 978-3-642-29550-8. [Google Scholar]
- Raccichini, R.; Amores, M.; Hinds, G. Critical Review of the Use of Reference Electrodes in Li- ion batteries: A Diagnostic Perspective. Batteries 2019, 5, 12. [Google Scholar] [CrossRef]
- Orsini, F.; Dolle, M.; Tarascon, J.-M. Impedance Study of the Li/electrolyte interface upon cycling. Solid State Ionics 2000, 135, 213–221. [Google Scholar] [CrossRef]
- Doyle, M.; Fuller, T.F.; Newman, J. Modeling of galvanostatic charge and discharge of the lithium/polymer/insertion cell. J. Electrochem. Soc. 1993, 140, 1526–1533. [Google Scholar] [CrossRef]
- Lin, X.; Park, J.; Liu, L.; Lee, Y.K.; Sastry, A.M.; Lu, W. A comprehensive capacity fade model and analysis for li-ion batteries. J. Electrochem. Soc. 2013, 160, A1701–A1710. [Google Scholar] [CrossRef]
- Levi, M.D.; Gamolsky, K.; Aurbach, D.; Heider, U.; Oesten, R. On electrochemical impedance measurements of LixCo0.2Ni0.8O2 and LixNiO2 intercalation electrodes. Electrochim. Acta 2000, 45, 1781–1789. [Google Scholar] [CrossRef]
- Zhuang, Q.C.; Fan, X.Y.; Xu, J.M.; Wei, G.Z.; Dong, Q.F.; Sun, S.G. Impedance studies of spinel LiMn2O4 electrode/electrolyte Interfaces. Chem. Res. Chin. Univ. 2008, 24, 511–515. [Google Scholar] [CrossRef]
- Park, M.; Zhang, X.; Chung, M.; Less, G.; Sastry, A.M. A review of conduction phenomena in Li-ion batteries. J. Power Sources 2010, 195, 7904–7929. [Google Scholar] [CrossRef]
- Waag, W.; Käbitz, S.; Sauer, D.U. Experimental investigation of the lithium-ion battery impedance characteristic at various conditions and aging states and its influence on the application. Appl. Energy 2013, 102, 885–897. [Google Scholar] [CrossRef]
- Aurbach, D.; Markovsky, B.; Weissman, I.; Levi, E.; Ein-Eli, Y. On the correlation between surface chemistry and performance of graphite negative electrodes for li ion batteries. Electrochim. Acta 1999, 45, 67–86. [Google Scholar] [CrossRef]
- Barcellona, S.; Piegari, L. Lithium ion battery models and parameter identification techniques. Energies 2017, 10, 2007. [Google Scholar] [CrossRef]
- Landesfeind, J.; Hattendorff, J.; Ehrl, A.; Wall, W.A.; Gasteiger, H.A. Tortuosity Determination of Battery Electrodes and Separators by Impedance Spectroscopy. J. Electrochem. Soc. 2016, 163, A1373–A1387. [Google Scholar] [CrossRef] [Green Version]
- Raccichini, R.; Furness, L.; Dibden, J.W.; Owen, J.R.; García-Araez, N. Impedance Characterization of the Transport Properties of Electrolytes Contained within Porous Electrodes and Separators Useful for Li-S Batteries. J. Electrochem. Soc. 2018, 165, A2741–A2749. [Google Scholar] [CrossRef]
- Doyle, M.; Newman, J.; Gozdz, A.S.; Schmutz, C.N.; Tarascon, J.-M. Comparison of modeling predictions with experimental data from plastic lithium ion cells. J. Electrochem. Soc. 1996, 143, 1890–1903. [Google Scholar] [CrossRef]
Figure 1.
Configuration of the LiMn2O4/Li half-cell for experiments and simulations.
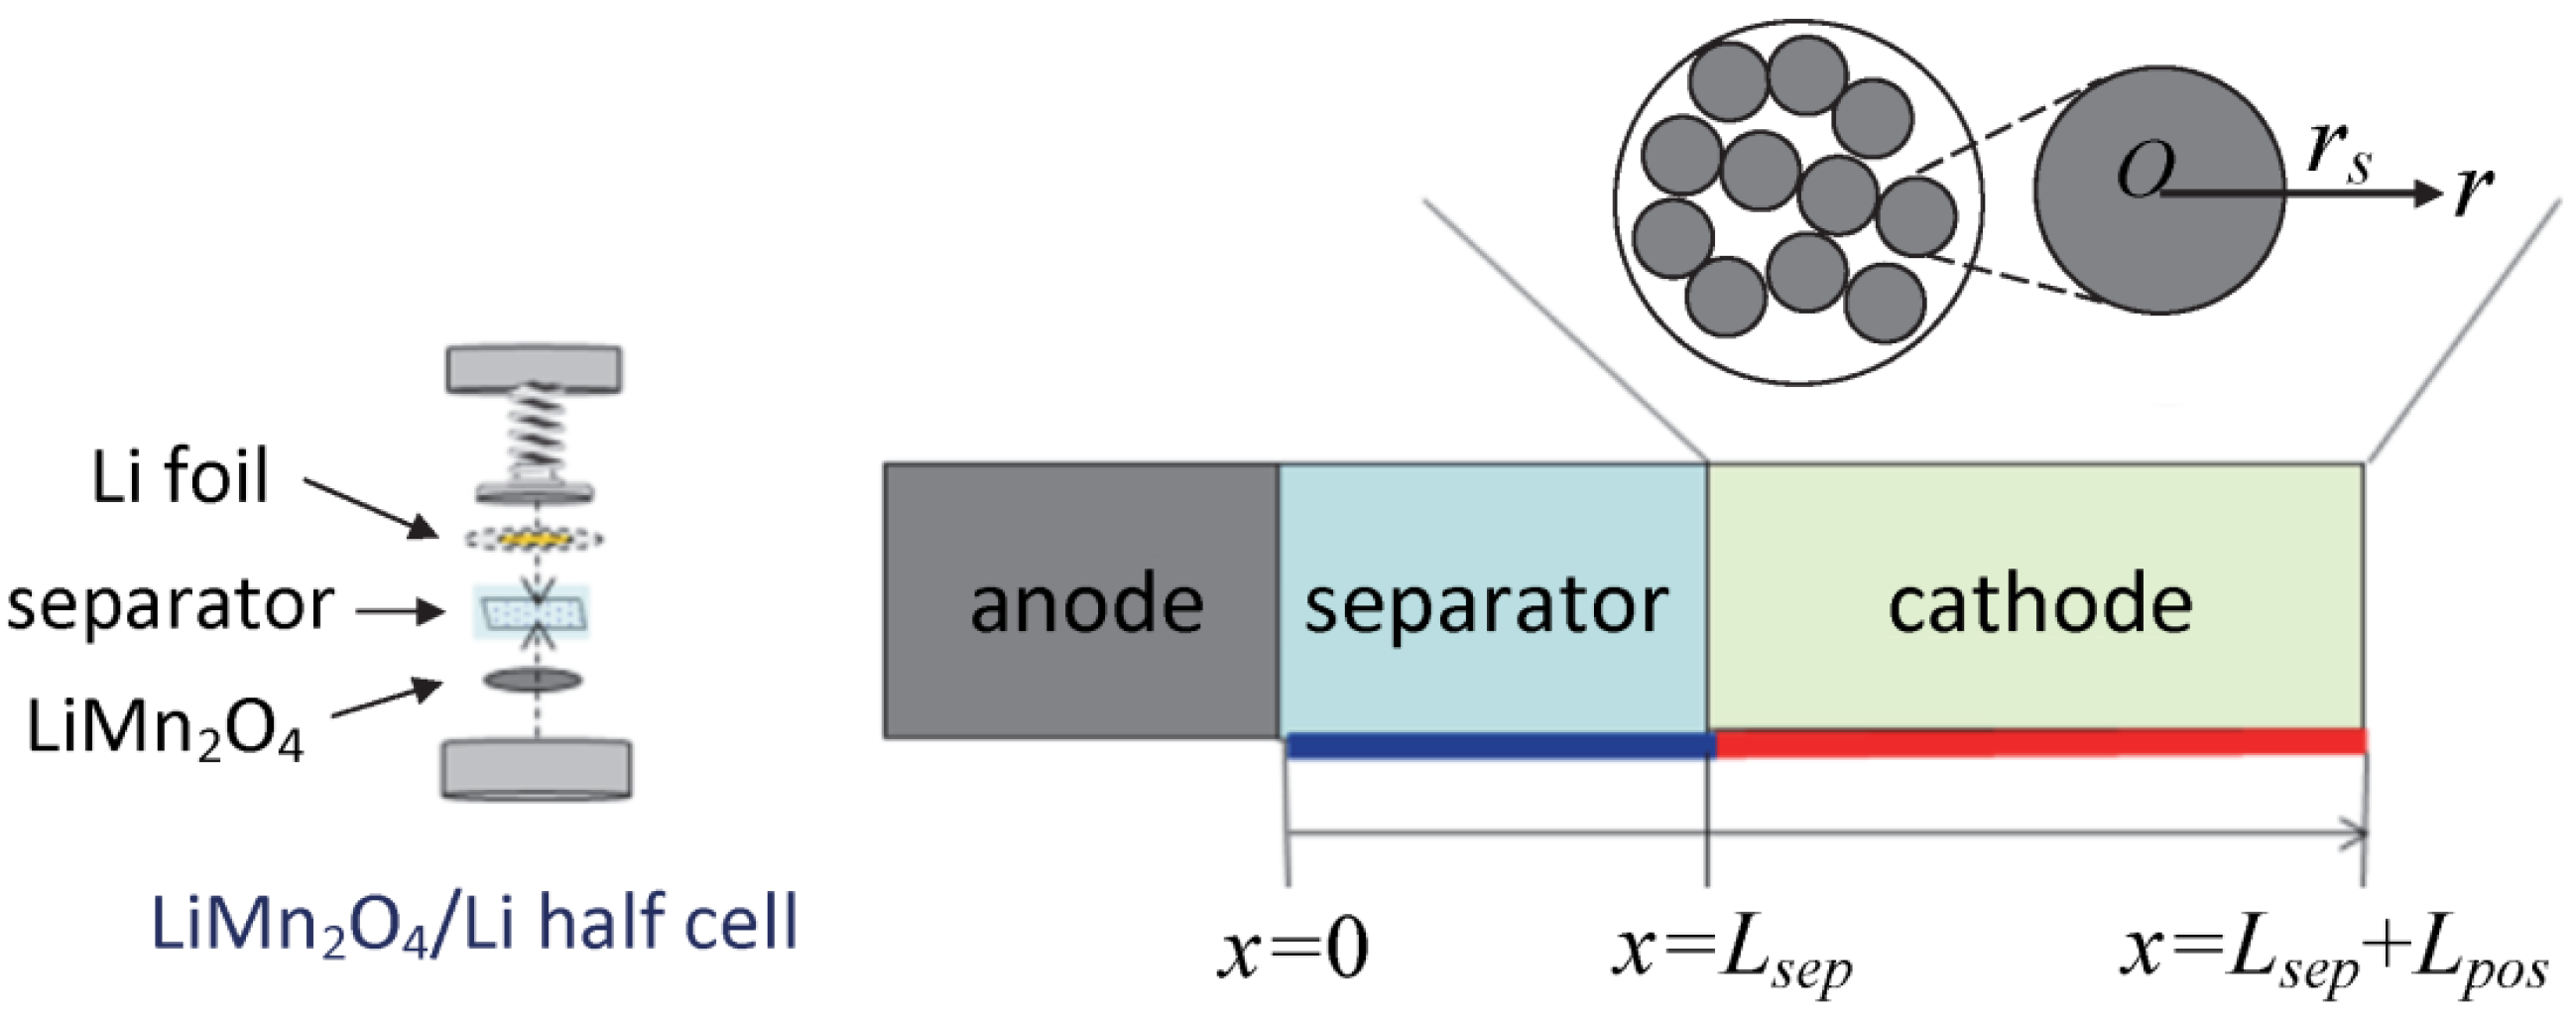
Figure 2.
The amount of manganese dissolved in the electrolyte with different C/PVDF ratios after (a) 15 cycles and (b) 50 cycles.
Figure 2.
The amount of manganese dissolved in the electrolyte with different C/PVDF ratios after (a) 15 cycles and (b) 50 cycles.

Figure 3.
EIS spectra with different C/PVDF ratios at 3.5 V.

Figure 4.
Open Circuit Voltage (OCV) profile comparing the experiment, simulation, and reference values [33].
Figure 4.
Open Circuit Voltage (OCV) profile comparing the experiment, simulation, and reference values [33].

Figure 5.
Comparison of discharge curves from experiments and simulations for sample 1.

Figure 6.
Comparisons of voltage profiles with different electronic conductivity ( = 49, 1.4).
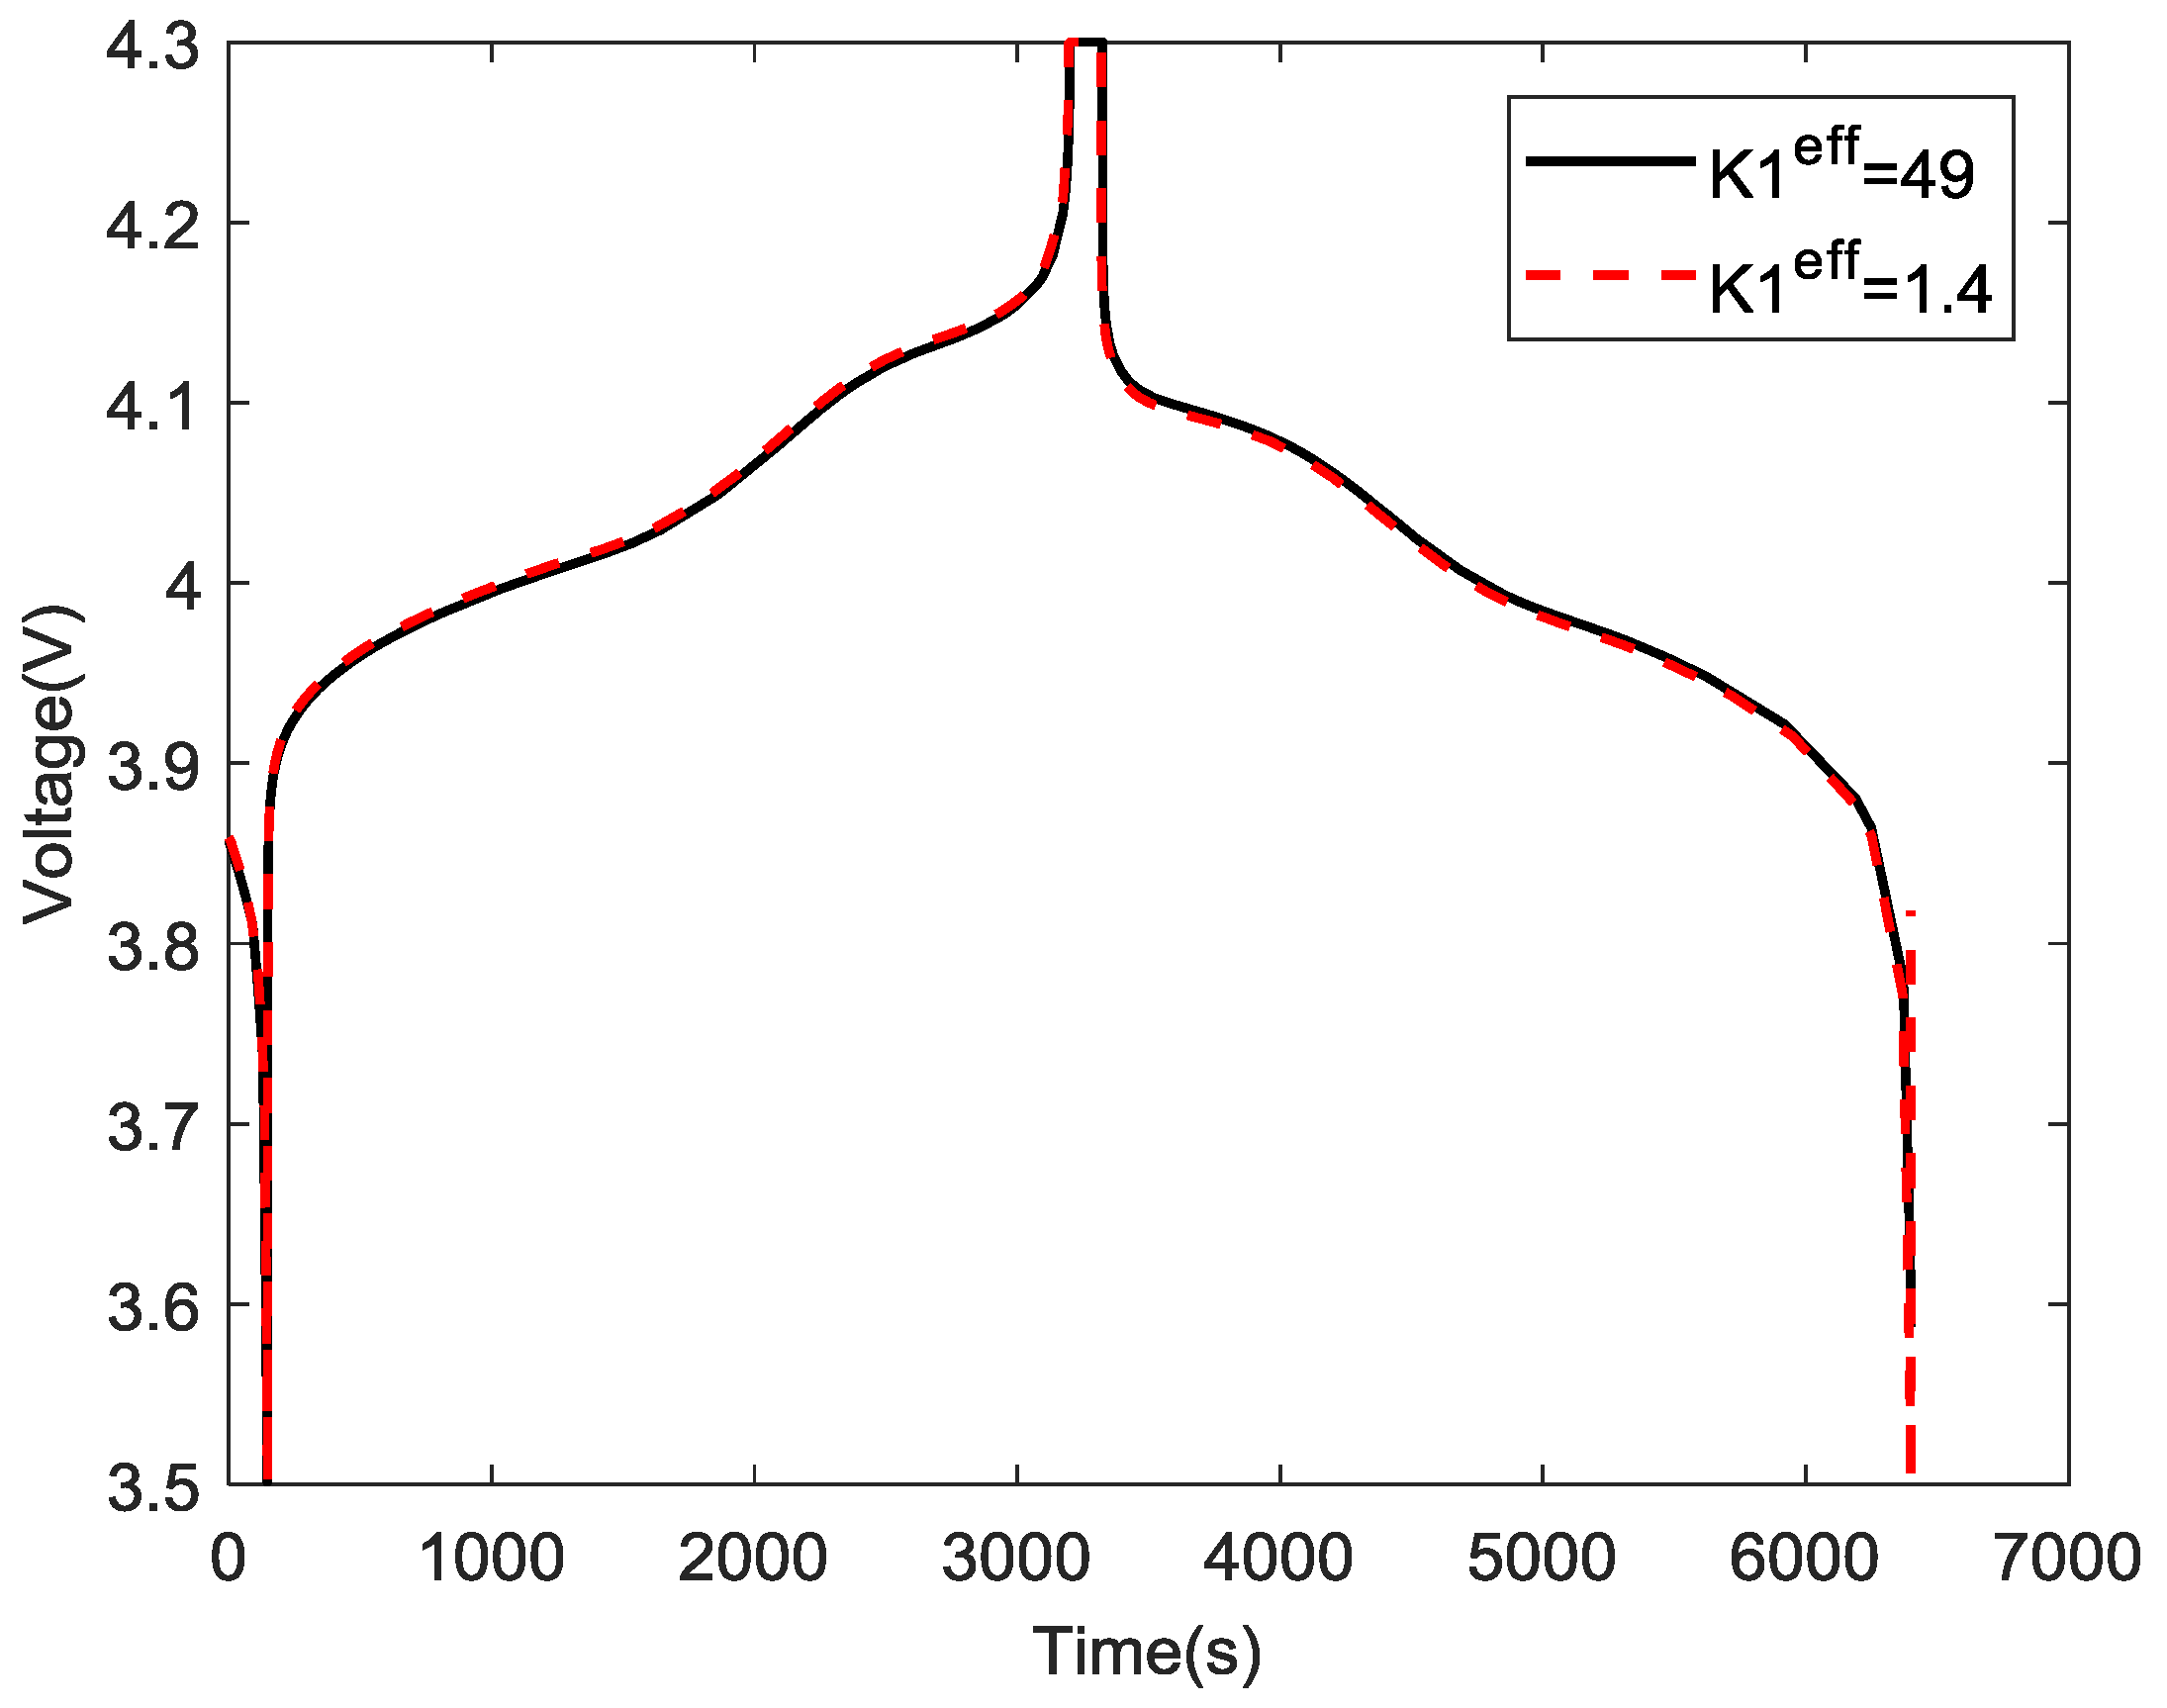
Figure 7.
Discharge curve comparisons with different reaction-rate constants ( = 5.6 × 10⁻⁶, 1.5 × 10⁻⁶).
Figure 7.
Discharge curve comparisons with different reaction-rate constants ( = 5.6 × 10⁻⁶, 1.5 × 10⁻⁶).

Figure 8.
Normalized capacity with different reaction-rate constants ( = 5.6 × 10⁻⁶, 1.5 × 10⁻⁶).

Figure 9.
Normalized volume fraction change with different Mn dissolution rates ( = 2.21, 1.17).
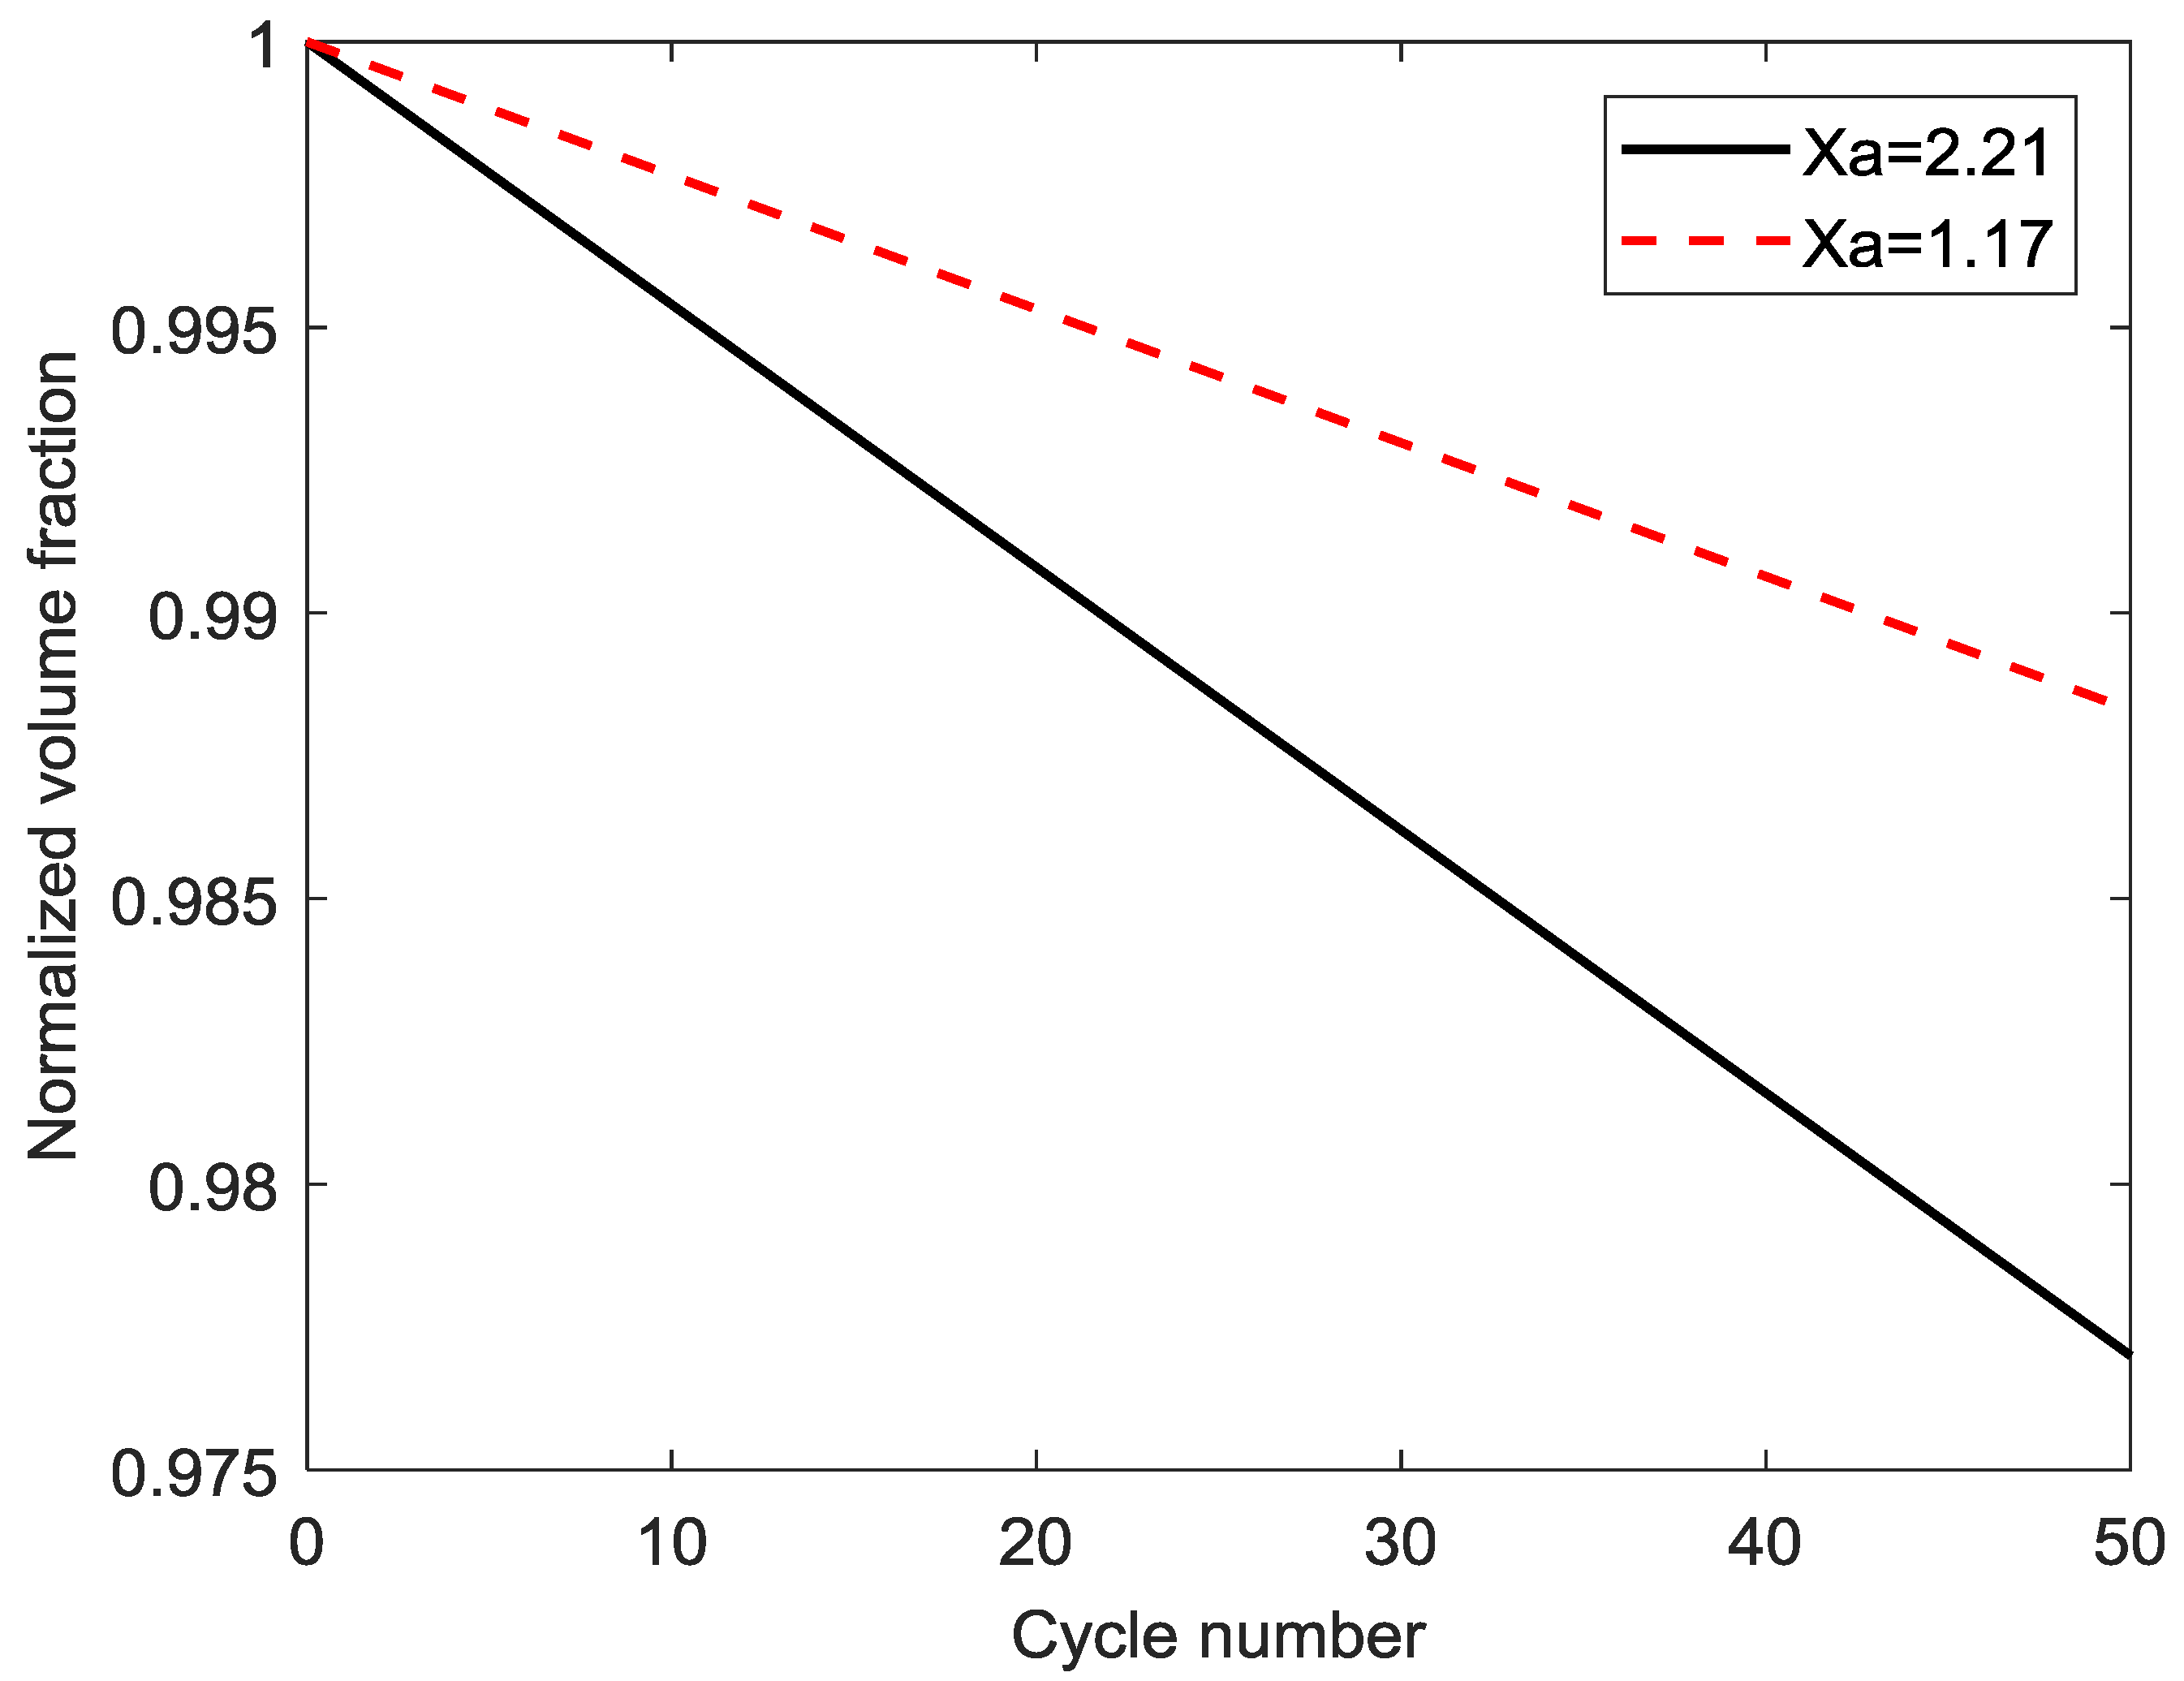
Figure 10.
Normalized capacity with different Mn dissolution rates ( = 2.21, 1.17).
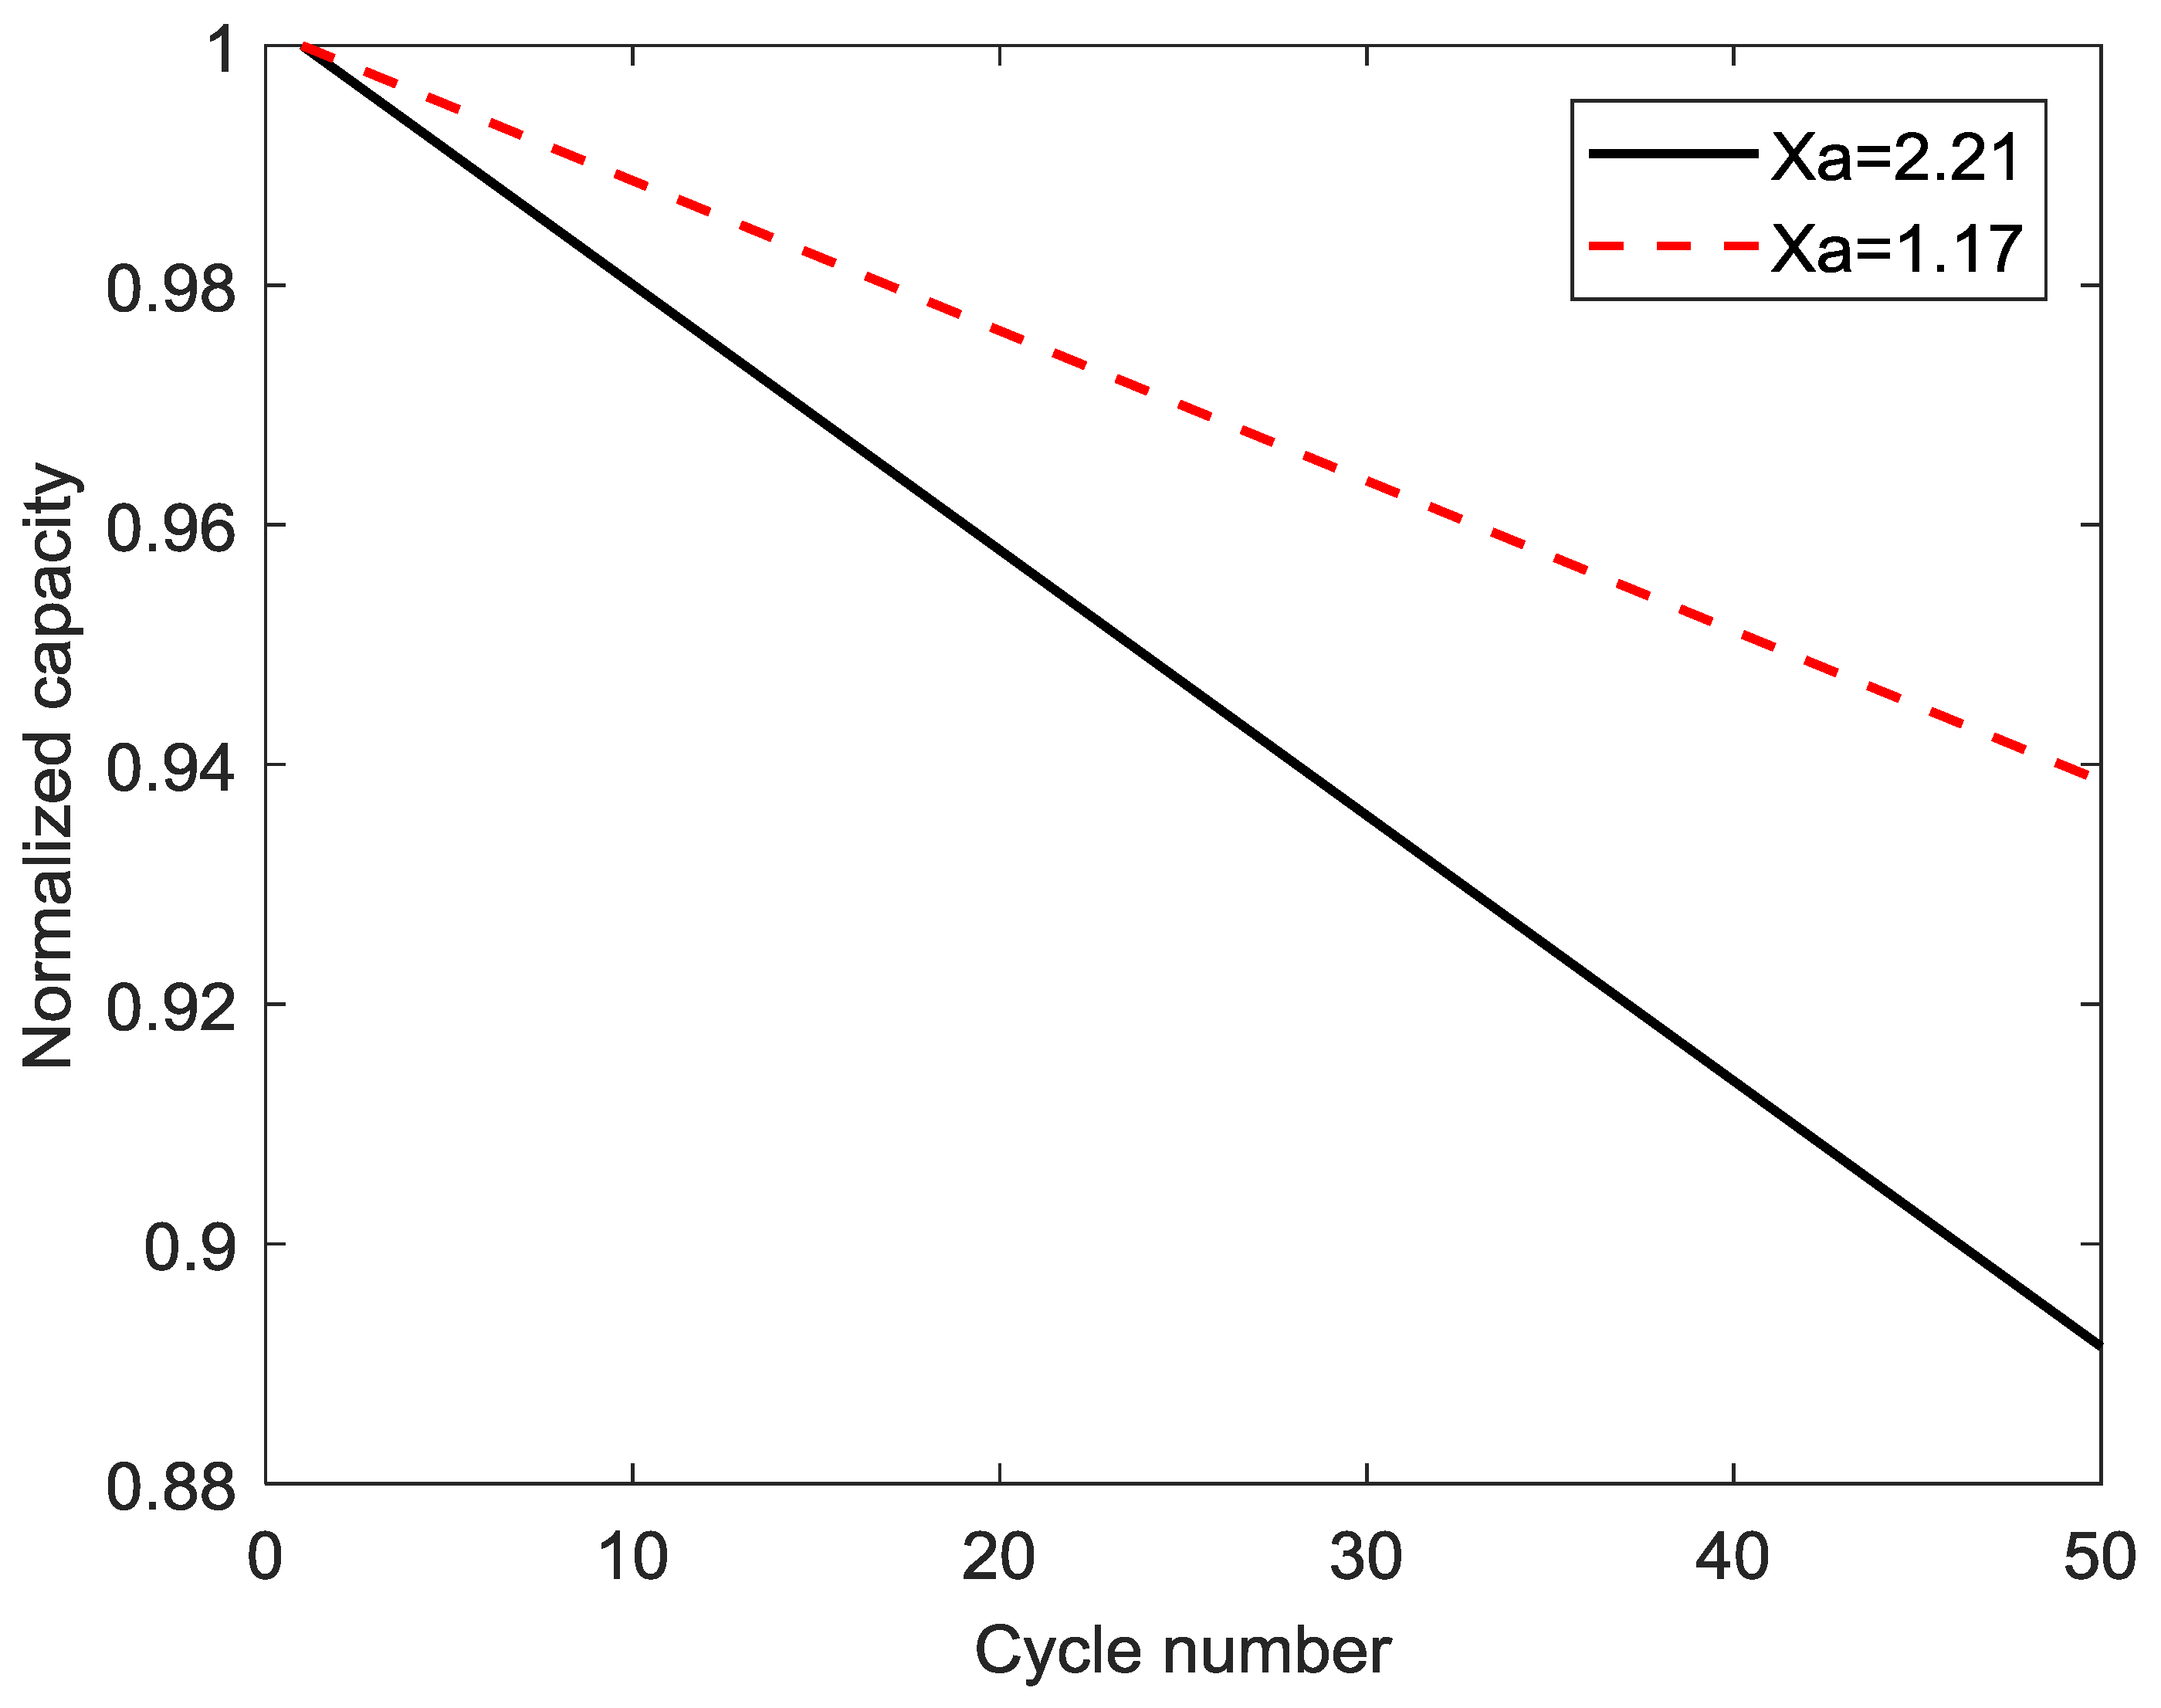
Figure 11.
Normalized volume fraction of different samples.
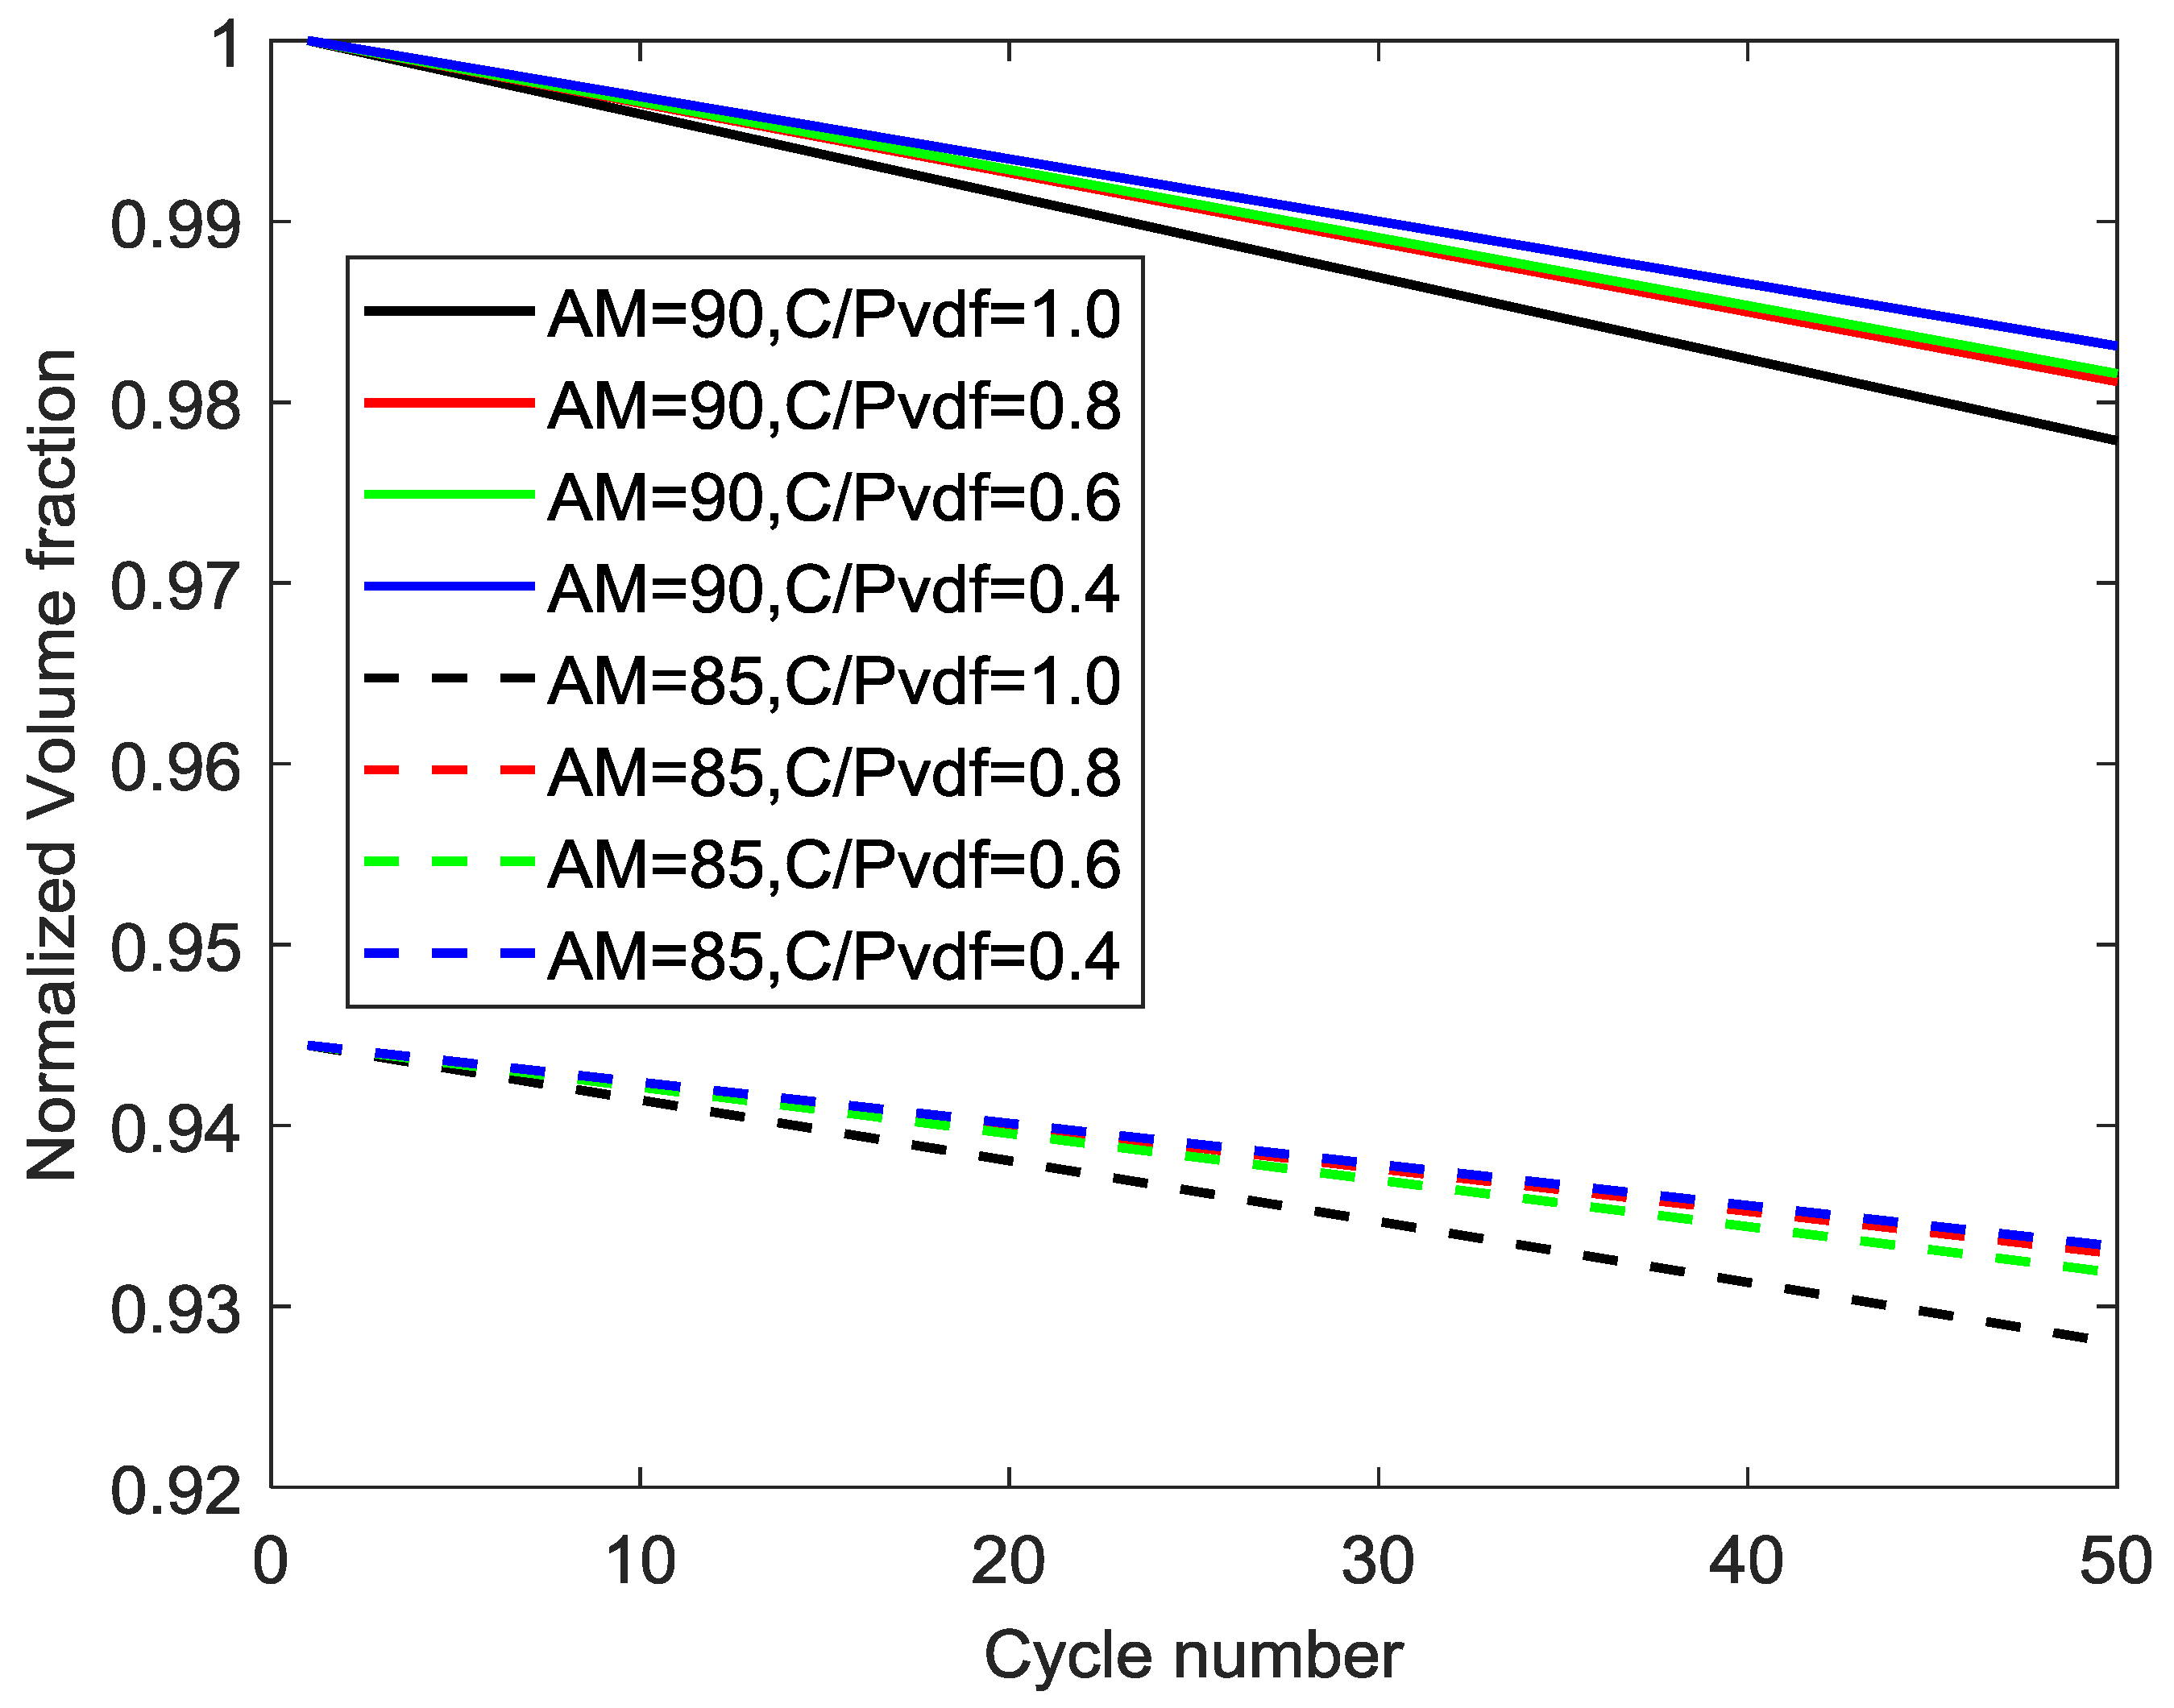
Figure 12.
Normalized capacity for different samples.


Table 1.
Cathode electrode sample ratios of active material, carbon black (C) and polyvinylidene fluoride (PVDF) binder used to make slurries. A total of eight sample electrodes were prepared.
Table 1.
Cathode electrode sample ratios of active material, carbon black (C) and polyvinylidene fluoride (PVDF) binder used to make slurries. A total of eight sample electrodes were prepared.
| Sample Number | Active Material (g) | Carbon Black (g) | PVDF Binder (g) | Ratio of Active Materials C:PVDF |
|---|---|---|---|---|
| 1 | 1.8 | 0.1 | 0.1 | 90:5:5 (1:1) |
| 2 | 1.8 | 0.0889 | 0.1111 | 90:4.44:5.56 (0.8:1) |
| 3 | 1.8 | 0.075 | 0.125 | 90:3.75:6.25 (0.6:1) |
| 4 | 1.8 | 0.0571 | 0.1428 | 90:2.86:7.14 (0.4:1) |
| 5 | 1.7 | 0.15 | 0.15 | 85:7.5:7.5 (1:1) |
| 6 | 1.7 | 0.1333 | 0.1667 | 85:6.67:8.33 (0.8:1) |
| 7 | 1.7 | 0.1125 | 0.1875 | 85:5.63:9.38 (0.6:1) |
| 8 | 1.7 | 0.0857 | 0.2143 | 85:4.29:10.71 (0.4:1) |
Table 2.
Key parameters of the cathode electrode, electrolyte, and separator in the electrochemical model.
Table 2.
Key parameters of the cathode electrode, electrolyte, and separator in the electrochemical model.
| Parameter | Value | Parameter | Value |
|---|---|---|---|
| anodic and cathodic transfer coefficient of Li metal | 0.5 | initial maximum solid phase concentration | 22,730 mol/m3 |
| anodic and cathodic transfer coefficient of Li intercalation/deintercalation reactions | 0.5 | initial solid phase diffusion coefficient | 1.31 × 10⁻¹⁴ m2/s |
| initial volume fraction of positive electrode | 0.297 | electrolyte activity coefficient | 1 |
| porosity of electrolyte | 0.444 | F Faraday’s constant | 96,487 C equiv-1 |
| radius of Cathode particle | 5 µm | applied current density | 10.5 A/m2 |
| transference number | 0.363 | length of positive electrode | 180 × 10−6 m |
| T temperature | 298 K | length of separator | 50 × 10−6 m |
| initial voltage | 3.6 V | reaction-rate constant of Li ion on Li metal | 6.1 × 10⁻⁶ A/m2 |
| Bruggemann coefficient | 1.5 | reaction-rate constant in the positive electrode | 1 × 10⁻⁵ A/m2 |
| initial electrolyte salt concentration | 1000 mol/m3 | particle isolation coefficient | 5 |
Table 3.
Electronic conductivity measurements with different composition ratios of LiMn2O4 composite electrode samples.
Table 3.
Electronic conductivity measurements with different composition ratios of LiMn2O4 composite electrode samples.
| Sample | Slope (V/mA) | Coating Thickness (inches) | Resistance (ohm∙cm) | Conductivity (S/m) |
|---|---|---|---|---|
| 1 | 0.1958 | 0.0015 | 3.381 | 29.57 |
| 2 | 1.266 | 0.0007 | 10.20 | 9.802 |
| 3 | 0.7353 | 0.003 | 25.39 | 3.937 |
| 4 | 5.881 | 0.001 | 67.70 | 1.477 |
| 5 | 0.1767 | 0.001 | 2.034 | 49.15 |
| 6 | 0.4195 | 0.001 | 4.829 | 20.70 |
| 7 | 0.498 | 0.0012 | 6.879 | 14.53 |
| 8 | 3.664 | 0.001 | 42.18 | 2.370 |
Table 4.
Impedance model and the values of circuit elements.
| Sample | Rohm (Ohm) | Rct (Ohm) | Cdl (F) | Impedance Model |
|---|---|---|---|---|
| AM = 85, C/PVDF = 1 | 7.163 | 120.9 | 1.62 × 10⁻⁶ | 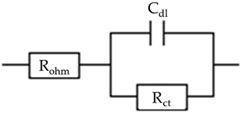 |
| AM = 85, C/PVDF = 0.4 | 28.91 | 129.4 | 9.72 × 10⁻⁶ | |
| AM = 90, C/PVDF = 1 | 17.13 | 190.5 | 1.87 × 10⁻⁶ | |
| AM = 90, C/PVDF = 0.4 | 6.395 | 440.0 | 1.49 × 10⁻⁶ |
Table 5.
Different parameters of the LiMn2O4 composite electrode samples that were considered in the simulations.
Table 5.
Different parameters of the LiMn2O4 composite electrode samples that were considered in the simulations.
| Sample | Xa | |||
|---|---|---|---|---|
| 1 | 0.297 | 5.600 × 10⁻⁶ | 29.57 | 2.212987283 |
| 2 | 0.297 | 4.246 × 10⁻⁶ | 9.802 | 1.885565102 |
| 3 | 0.297 | 2.892 × 10⁻⁶ | 3.937 | 1.841767796 |
| 4 | 0.297 | 1.539 × 10⁻⁶ | 1.477 | 1.689016773 |
| 5 | 0.2805 | 5.234 × 10⁻⁶ | 49.15 | 1.744319236 |
| 6 | 0.2805 | 4.673 × 10⁻⁶ | 20.7 | 1.221354539 |
| 7 | 0.2805 | 4.113 × 10⁻⁶ | 14.53 | 1.334272528 |
| 8 | 0.2805 | 3.553 × 10⁻⁶ | 2.37 | 1.178505667 |
© 2019 by the author. Licensee MDPI, Basel, Switzerland. This article is an open access article distributed under the terms and conditions of the Creative Commons Attribution (CC BY) license (http://creativecommons.org/licenses/by/4.0/).
Share and Cite
MDPI and ACS Style
Lee, Y.K. The Effect of Active Material, Conductive Additives, and Binder in a Cathode Composite Electrode on Battery Performance. Energies 2019, 12, 658. https://doi.org/10.3390/en12040658
AMA Style
Lee YK. The Effect of Active Material, Conductive Additives, and Binder in a Cathode Composite Electrode on Battery Performance. Energies. 2019; 12(4):658. https://doi.org/10.3390/en12040658
Chicago/Turabian StyleLee, Yoon Koo. 2019. "The Effect of Active Material, Conductive Additives, and Binder in a Cathode Composite Electrode on Battery Performance" Energies 12, no. 4: 658. https://doi.org/10.3390/en12040658
Note that from the first issue of 2016, this journal uses article numbers instead of page numbers. See further details here.