Abstract
This study describes a practical methodology for a resilient planning and routing of power distribution networks considering real scenarios based on georeferenced data. Customers’ demand and their location are the basis for distribution transformer allocation considering the minimal construction costs and reduction of utility’s budget. MST (Minimum Spanning Tree) techniques are implemented to determine the optimal location of distribution transformers and Medium voltage network routing. Additionally, the allocation of tie points is determined to minimise the total load shedding when unusual and extreme events are faced by the distribution grid, improving reliability and resilience reducing downtime during those events. The proposed methodology provides a coverage of 100%, supplying electricity to the totality of customers within statutory limits during normal and unusual conditions.
1. Introduction
Electricity demand is steadily increasing due to the fact that new and novel electric equipment is connected to the grid every day, such as factory’s machinery, household devices and also electric vehicles. Consequently, generation, transmission and distribution systems are designed and operated to satisfy customer demand with minimum outages and uninterrupted power supply [1]. In this general context, not only primary equipment (power transformers, circuit breakers, disconnectors, reclosers, etc.), but also protection, communication and control systems are needed to withstand unusual events or contingencies without supply interruption [2]. Abnormal events are largely influenced by lightning discharges, insulation ageing, overvoltage, overloading, human errors and natural disasters, which could cause a temporary or permanent outages, hazards to people, damage to faulted and un-faulted equipment; consequently, for the aforementioned adverse effects, it is mandatory to have a suitable, reliable and resilient power distribution system, which incorporates fast isolation and restoration capabilities for the entire network [3]. As a result, control and protection systems are the most strategic ancillary services of the power systems since it permits rapid recovery/reconstitution elsewhere on the system avoiding permanent loss of supply [4].
The grid resilience strategies adopted by electric utilities are focused to determine and identify the greatest risks, which produce valuable economic impacts after an extreme event. Resilience strategies are focused on mitigation and hardening actions to re-establish the electricity, generally those actions are associated not only with deployment of mobile transformers on critical locations, evaluation of risks and risk management, but also the deployment of energy storage systems with advanced communication, protection and control capabilities, which permits the synchronization and reconnection to the main grid [2,5]. However, the basic principle to improve the resilience on distribution networks is associated with an accurate planning and design stage. Some strategies are related with vegetation management, undergrounding power lines and pole reinforcing. In addition, flexibility and robustness can be achieved with an adequate design considering the placement of tie points and switch equipment in radial networks. The aforementioned hardening tasks are focused to enhance power flow capacity and provide greater control to bypass damaged areas [6]. It is important to note that accurate design and hardening activities, complemented with modern and sophisticated protection and control capabilities, will limit the outage duration and minimise its consequences, however those components will not avoid a failure or disaster [7].
2. Resilience on Power Distribution Networks
Natural and man-made disasters have been a constant issue in recent years around the world, with several natural disasters such as Marmara earthquake in 1999, hurricane Katrina in 2005, Japan Earthquake in 2011, Hurricane Sandy in 2012, and also the Ecuadorian earthquake occurred in 2016 being examples of the destructive power of nature [7]. Those events not only cause innumerable fatalities, but also extensive damage to private and public property, affecting utilities and their infrastructures. As a consequence of a disaster, usually overhead lines can be brought down, or electric equipment like circuit breakers, reclosers, distribution transformers and power substations can be affected, producing cascading events which eventually can lead to the formation of unplanned electric islands and posteriorly the entire disconnection of the distribution systems [4,8]. Power outages force people to shut down businesses and factories, close schools and impede emergency services, resulting on high economic impacts due to lost output and wages, spoiled inventory, delayed production, inconvenience and damage to grid infrastructure [2,8,9].
A paramount task on the disaster zone is to re-establish the electricity supply as soon as possible in order to restore emergency services, hospitals, health and welfare institutions, transportation and short-term food supply. Consequently, several restoration techniques and methods have been applied after abnormal events, which are normally based on three temporal stages: preparation, system restoration and load restoration. The first stage is addressed to form cleanup and replacement crews to assess the distribution grid. The second step is to reinitialize the system by black start and non-black star units, and finally the third stage deals with the connection of the main loads to the system [3]. Nevertheless, the restoration time taken to energize the system is normally exaggerated long. The importance and development of other restoration techniques is an outstanding goal to improve the grid safety, accordingly, the connection of distributed generation, microgrids and distribution automation can be feasible solutions to enhance the resilience of power grid, to get faster recovery and to prevent total system collapse [3,5].
Issues associated with power system resilience are defined as planning, resource allocation and routing problems. This paper is addressed to determine an optimal planning and routing to withstand natural or man-made disasters considering a variety of simulations taking into account the arbitrariness of disasters. Simulations will be carried out using georeferenced data to exemplify a real network throughout MatLab and Powerfactory. Research has been conducted on Resilience of distribution grids taking into account the deployment of distributed generation (DG), which are small generators connected to a distribution network capable to inject active power to grids, and consequently supply the critical infrastructure [4]. Some studies have been achieved considering the interconnection of the main grid with the affected zone by mobile transformers [5,6] Alternative solutions are related with controlled islanding and network reconfiguration to minimize the restoration time utilized by restoration crews [8,9]. Controlled islanding has been studied as achievable key to facilitate the restoration procedure, therefore suitable controlled islanding is carried out using optimization-based approaches such as ant search mechanism and particle swarm optimization [10]. On the other hand, network distribution restoration using spanning tree search has been studied in [11,12], where the topological structure is modified to enhance the operating conditions. Those studies are focused to find the candidate restoration strategy based on graph theory.
The complexity and growth of power systems have modified the operation procedures since local grids have been extended to regional or national grids, and currently it is extensively common to interconnect neighbouring countries by transmission lines at high voltage levels. According to ANSI C84.1 1-1989 voltages from 69 kV to 1100 kV are referred as high voltage and extra high voltage, whereas medium voltage refers to voltages between 0.6 kV to 69 kV, finally voltages from 0.6 kV and below are referred as low voltage. Not only a transmission grid, which operates at high voltage levels, but also distribution networks have been evolved to loop and mesh grids from conventional networks constituted mainly radial, consequently novel equipment and electrical devices have been enabled in modern grids to meet technical requirements such as quality of supply, reliability and safety [13]. However, under certain unusual conditions such as lighting discharges, insulation ageing and disasters, a failure in electricity network could cause a short- or long-term loss of the electric power, leading to a cascading outages and causing a catastrophic impact on transmission and distribution system operations [8].
Modern power grids are implemented based on communication, control, protection and computing systems, and through the years it has been transformed in more sophisticated, complex and even vulnerable distribution networks. As can be seen in Figure 1, an operating distribution network, which is continuously running 24/7, is exposed to abnormal events, which include physical, cyber and personnel vulnerabilities which can influence on the grid’s operation [5]. Personnel vulnerabilities are related to people who are running the electric power system, since they could produce inadvertently or intentionally disruptions in the operation of the power grid, causing potential failures or increase restoration times after terrorism attack or natural disasters [3]. Physical vulnerabilities are associated with equipment’s failure due to natural events or man-made attacks, then distribution transformers, circuit breakers, reclosers, disconnectors and overhead lines can be affected, where the destruction of a part of the distribution network could bring an interruption of service [3]. Finally, cyber vulnerability is associated with computing automation and high-speed communications, therefore an important abnormal event like the damage of telecommunication links will cause the inoperability of control and protection system, and also the unexpected tripping of circuit breakers and reclosers. On the other hand, a man-made attack like hacking the grid, in order to manipulate SCADA system, can lead in the disruption of power flows, and also transmit erroneous signals to operators [14].
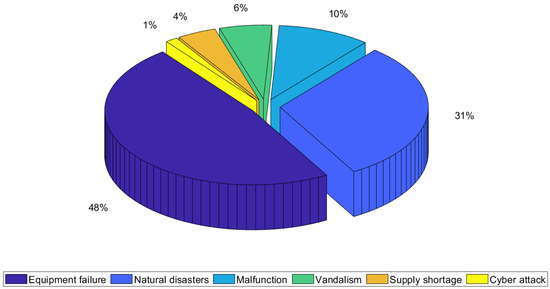
Figure 1.
Power outages for 140 worldwide outage data from 1965 to 2012.
3. Planning Distribution Networks
Set in this context, where distribution networks are exposed to uncontrollable and mostly unexpected events; planning, design and implementation of distribution grids considering tie points and switch equipment in radial networks, deployment and allocation of DG, mobile power transformers and feeder’s reconfiguration are valid techniques and strategies to provide a rapid restoration avoiding unintentional load shedding. The connection of generators to the grid it will have an impact on the operation of the network. Positive benefits of DG are related with enhancing the reliability, resiliance and integrity of the network, nevertheless, some difficulties and problems could give rise with DG deployment. Generator fault level contributions can surpass the rating of electrical equipment, steady-state rise in network voltage levels is an issue if the amount of the generated power exceeds the local demand. Voltage flicker and harmonic pollution could be produced by static power conversion equipment used to couple photovoltaic systems to the network [11].
3.1. Types of Distribution Network Topology
Distribution network planning is not only associated with newly-built districts where public facilities, residential and commercial areas are growing, but also with existing regions which have a deficient level of efficiency and insufficient capacity. Set in this context, Distribution Network Operators have the responsibility to design and plan novel and modern grids, based on sophisticated communication, control and automation capabilities, which allow the flexibility of power grids to be enhanced. Electric network transformation is mainly caused by the incessant growing of electric demand, integration of intermittent renewable sources and electric vehicles [15]. These new requirements could exceed the capacity of distribution equipment since current distribution networks were planned considering generic profiles of domestic, commercial and industrial customers. Consequently, the planning, design and reinforcement of power distribution networks face economical and technical challenges. Technical challenges are associated with operative constraints such as adequate voltage profile, accurate selectivity on protection system, and quality of supply. Whilst economical aspects are related with short-term and long-term investment considering minimum cost.
Distribution grids generally are developed in radial topology, where a unique path between the source and end users is built using overhead lines or underground cables. This topology is the cheapest and is widely used in urban and rural areas. Additionally, any disaster in the grid will interrupt the power flow, consequently it will result in complete loss of power to the customer. Normally open points (tie points) installed in strategic locations within primary feeders are used to transform a radial grid into loop or mesh systems. The last aforementioned topology is more complex to analyse, nevertheless those systems provide better continuity of service than the common topology (radial system). Subsequently, the operation of tie switches will provide operational flexibility and it will reduce the number of supply interruptions caused by natural disasters, faults or scheduled maintenance. Set in this context, graph theory has been studied as a tool for planning and reconfiguration in distribution networks, where the reconfiguration is determined by opening and closing switching devices, whilst planning and design deal with optimal location of the distribution transformers and tie points considering the end user positions [16].
3.2. Network Planning Based on Theory Graphs
Planning and sizing of distribution systems are required in order to develop an efficient, reliable and secure grid, therefore, this stage allow to minimize the construction costs and reduce utility’s budget based on the optimal allocation of technical resources such as distribution transformers, conductors and switching devices. Generally, a power distribution grid is comprised by several distribution substations, which are located near to main loads, additionally each substation is composed by a variety of primary feeders, which typically are operating in a radial configuration. Nevertheless open ties are taken into account to reconfigure the initial topology reducing downtimes [17,18].
Within this background, the topology of distribution can be modified and reinforced after a construction in order to increase resilience, reliability and security. However, this paper is focused on planning stage, where there are no existing facilities and solely georeferenced data is available, then an accurate design should meet the requirement imposed by the expected load in future. Future end customers are normally clustered in different categories considering the electricity usage and their associated used equipment (residential, commercial and industrial). Nevertheless, some utilities have divided residential customers in categories based on the load profile and electricity consumption, hence, large populations are represented by a strata with similar electricity consumption pattern [19].
Distribution networks constitute a local infrastructure that is comprised by several substations near to a populated area, which operates at primary voltage levels (46 kV to 132 kV). The power substation is not only comprised of switching and protection equipment, but also it has a control and energy management system. The control system permits the automatic connection and disconnection of three-phase primary outgoing feeders which are linked at the low voltage side of the power transformer (6.3 kV to 33 kV). Primary feeders are distributed in the surroundings of the power substations, and they are the physical medium to transport electricity to loads via a number of overhead lines or underground cables. Underground schemes are used not only in densely populated urban areas, but also in zones where high levels of reliability and resilience are required since underground cables eliminates susceptibility to wind damage, lightning, ice and wind storms and vegetation contact. The customer’s load cannot be supplied at medium voltage levels, so distribution transformers are used to provide the final voltage level at 220 V phase-to-phase.
Set in this context, a Medium Voltage (MV) underground network is composed by several padmounted distribution transformers, which meet the calculated demand design and voltage regulation requirements. In addition, Ring Main Units (RMU) are employed to provide connections to transformer and possible isolation points along the primary feeder. RMUs are an equipment completely sealed and used indoors or outdoors, which comprise switching devices that can be either circuit breakers, disconnectors, fuses and bays for transformers. These elements are extensively used in underground grid in distribution systems because they provide continuity of service, allowing network reconfiguration, and ensuring reliability for the grid and security for operators during operations in place and remote operation during abnormal conditions. On the other hand, the Low Voltage (LV) underground network is characterized by a radial topology due to the fact that a disturbance in LV grid has a minimum impact on the grid’s operation since a reduced number of end customers are affected during a contingency. Universally, those end users are connected to the low voltage grid in the nearest junction box, which are placed in range between 30 and 50 m, and also they are located near street intersections [20].
Distribution network planning is mainly related with a tree-topology, then graph theory can be applied to solve the planning problem, which is considered as NP-complete problem due to its combinatorial nature [12,21]. Additionally, clustering algorithms, like k-medoids or k-means, are focused to break the dataset up into groups, minimising the distance between the center of the cluster and each corresponding nodes. The aforementioned algorithms are used to subdivide dataset of n objects building into k clusters (primary feeders), therefore nodes are represented as distribution transformers. Contrastingly, minimum spanning tree algorithm such as Kruskal and Prim can be used to find the primary feeder route which connects each distribution transformer considering the shortest path [16,22]. Spanning tree problems not only are used to solve electrical problems, but also they are applicable in other sciences such as computer and communication networks, wiring connections and circuit design [23,24,25]. Prim’s algorithm finds a minimum spanning tree for weighted undirected graph, where the spanning tree is connected one vertex at time, consequently, at each step the nearest vertex is added to the tree [26,27].
For the present paper, the medium voltage network is designed considering a modified-prim algorithm, the aforementioned algorithm is based on prim algorithm, however, modifications permit to find the minimal path in less time. The modified-prim needs a graph G = (V,E) of order n and size m, then spanning tree T of G is defined as a connected graph spanning all the vertices of the vertex set V with exactly n − 1 edges belonging to the edge set E, considering there are not loops formed. Set in this context, modified-prim algorithm find the minimal tree cost taking into account that the created tree has a subset of edges, where every node is included in each step assuring the minimal cost [16,22,26,28,29]. Not only the MV grid but also the distribution transformers location are based on modified-prim algorithm, where transformers are placed and sized in a georeferenced map using the end user demand and the minimal distance between end user and manholes. The manholes are commonly located in the sidewalks on main streets, and they are used as point of connection from the main grid to the consumer premises. The placement of distribution transformers is based on the equivalent loading gravity center where the load demand of customers is used to find the equivalent location of the total demand within each small area by Equations (1) and (2), this procedure guaranteeing that the transformer is located near to the most loaded nodes [30].
where Si represent the load demand associated in each manhole i at location expressed in latitude and longitude (Loi, Lai). Consequently, the coordinates of each transformer is calculated as Lodt and Ladt, respectively.
4. Problem Formulation
Underground network planning considering a resilience approach is a combinatorial problem defined as NP-complete, where the connection between customers and the main grid on a georeferenced scenario is dealt using a heuristic model based on Minimum Spanning Tree (MST) techniques. The project deals with the optimal location of distribution transformers using a modified-prim algoritm based on the minimal cost of low voltage network between transformers and end customers. Secondly, clustering algorithms are used to break the dataset (number of distribution transformers) up into groups, then k-medoids algorithm determines the a defined number of clusters, which can be used as primary feeders. The next stage deals with the built up the medium voltage network based on modified-prim to determine the lowest path between main substation and distribution transformers on a georeferrenced path. The improvement of resilience is handled by the optimal location of tie points in medium voltage network, consequently, the operation of RMUs will provide operational security and flexibility reducing downtimes due to abnormal events. Finally, power system simulations are executed on PowerFactory to determine the functionality of the proposed methodology. Variables and parameters are presented in Table 1.

Table 1.
Parameter and Variables.
The first algorithm (See Algorithm 1) is targeted to develop the planning of a resilent distribution network, where manholes are located in each street based on georeferenced information, which are placed in range between 30 and 50 m. In addition, the second step considers the connection between end users and low voltage grid in the nearest manhole, and consequently a manhole’s demand is calculated by the connected end user’s demand. The third step is focused to determine the location of distribution transformers considering the manholes’ position and their demand. Subsequently, different scenarios can be simulated and analysed, where position and kVA rating of distribution transformers are determined based on maximum length of low voltage grid within a voltage drop restriction.
| Algorithm 1 Planning of a Resilent Distribution Network |
|
Algorithm 2 develops an adequate route for MV grid connecting all distribution transformers. The first stage is to establish the number of primary feeders, then a clustering methodology is used to divide the total transformers in to groups. The second stage deals with the optimal routing based on street topology and manhole location. Finally, switching equipment allocation is accomplished taken into account the nearest points between primary feeders, where the optimal placement is obtained based on the minimal distance between tie-points. As a consequence, tie-lines between primary feeders are established improving reliability and resilience.
| Algorithm 2 Routing of MV network and Switching Equipment Allocation |
|
5. Analysis and Results
5.1. Case Study
The planning of a distribution network is a paramount task for distribution operators, where the appropriate location of power substation, and distribution transformers are accomplished considering technical constraints such as voltage drop, power quality and security at the minimum capital cost. The financial strategy in distribution infrastructure is extremely related with the length of primary feeders (MV networks), secondary grids (LV network) and investments on major components such as distribution transformers, switchgear equipment (Ring Main Units) and protection systems.
For the present, the case study is characterised as a residential and commercial sector, where a vast amount of lucrative business will run in conjunction with apartment buildings. In addition leisure spaces, shopping centres and government institutions are located in this zone. As a consequence of the high urban density, more than one power feeder is used to serve this area. The case study has been designed considering 1155 residential and commercial end users, which are provided of electricity via a three primary feeders connected to the main power substation, which is located in a practical and feasible area within the case study. For simulation proposes, voltage levels and primary equipment was selected based on technical requirements, consequently an indoor substation was chosen, which operates at a primary voltage level of 66 kV. The power substation is not only comprised of switching and protection equipment, but also it has a control and energy management system. The control system permits the automatic connection and disconnection of three-phase primary outgoing feeders which are linked at the low voltage side of the transformer (11 kV).
The geographic information used for planning and routing is obtained from OSM files, which contain georeferenced features that can be mapped (roads, avenues, buildings). The gathered information is hierarchically structured and it can be divided in nodes, ways and relations. The geographical coordinates (latitude and longitude) are showed as points named nodes, whilst ways is an ordered list of nodes which can form a closed features (buildings) and none-closed features such as roads, avenues. Set in this context, the case study is composed by 1155 closed features, which are represented as end users, additionally roads, avenues and streets are represented as 88 non-closed features. Both closed and non-closed features are the basis for planning and routing, where the electrical demand of customers is extremely associated with the area of the closed features, whereas the design and configuration of the network is based on street topology. Consequently, the extracted data from OSM defines the planning and routing of the distribution networks, therefore any outdated, erroneous and incomplete collected information could lead to an erroneous planning. Table 2 shows the case study parameters and planning criteria used for the present analysis, where it is depicted the features of different primary equipment and ancillary services.
Table 2.
Case Study parameters and planning criteria.
The load forecasting is a paramount task for a proper decision in planning and operation of electric energy system, which is permanently affected by uncertain nature since there are several factors such as population, economy (income per capita), lifestyle and socio-demographic factors, weather and acquisition of new electric appliances. For the present, a relation between the customer’s demand and gross floor area is calculated using proportional demand based on ecuadorian standards i.e., a bigger floor area consumes more electricity than a small building due to the fact that the number of electric appliances in residences and commercial markets.
5.2. Results
This section depicts the results obtained from MatLab and Powerfactory by performing a planning and routing a real distribution grid from georeferenced data from OSM. Distribution utilities have used electrical studies such as power flow, fault and harmonic analysis to determine planning expansions, upgrades, refurbishments and investments. The present project is focused in planning, consequently, power flow analysis is mandatory to determine voltage levels, voltage drops, losses and loading of cables and transformers when the grid is running on normal conditions. Furthermore, unusual conditions are simulated when a partial section of a primary feeder is out of service and normally open ties (RMU) are connecting the grid in order to minimise the outages.
The secondary network transports electricity between each distribution transformer to end customers, who are connected to the low voltage grid in the nearest junction box at 220 V. Figure 2 depicts 4 possible scenarios contemplating location of distribution transformers due to the increment of length in low voltage grids. The length of LV grids is extremely related with conductor size because the cross-sectional area of the conductor determines its resistance and therefore voltage drops. Some scenarios have been analysed considering the average length of the LV network, scenario A shows an average length of 100 m between between the final customer and its distribution transformer, then this scenario is formed by 5 manholes. Similarly, Scenarios B, C and D consider an average length of secondary network of 200 m, 300 m and 400 m, respectively. Distribution transformers in each scenario has been situated considering based on the equivalent loading gravity center using the end customer’s load demand.
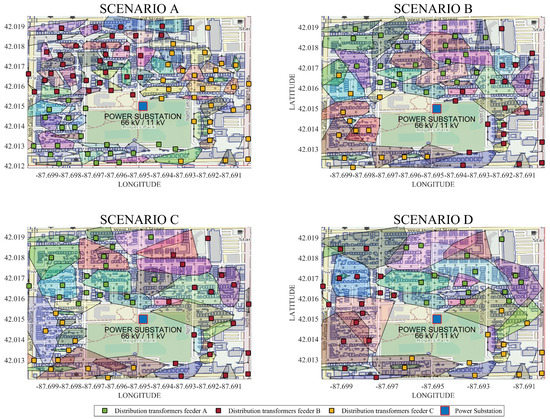
Figure 2.
Low Voltage (LV) network for 4 scenarios.
The insulated conductors used on underground networks can be buried directly in the ground or installed in ducts buried in the ground, aforementioned aspects should be considered in design and planning process, due to the fact that installation condition will affect the power cable’s performance. Set in this context, it has been selected different power cables for low and medium voltage network which meet the imposed requirements of length with a drop voltage lower than 3% in each scenario. Additionally, as can be seen in Table 3, it is depicted the average length between distribution transformer and the most distant end customer for each scenario, which is related with the amount of distribution transformers providing a coverage of 100% since it is mandatory to supply electricity to the totality of customers. Consequently, scenario A is formed by 82 distribution transformers located in 3 primary feeders with a total length of MV voltage grid grid of 7.484 km, whilst scenario D comprises 43 distribution transformers placed into 5.862 km of MV voltage grid.
Table 3.
Medium Voltage (MV) and Low Voltage (LV) network results.
Figure 3 shows the rating capacity of selected distribution transformer by each scenario, where it is clear that the number of transformers employed to feed residential and commercial customers decrease in function of the LV network’s length. Seven different kVA rating has been selected for planning process, the smallest capacity is 30 kVA to supply to reduced number of customers, whilst the bigger transformers has a nominal capacity of 1000 kVA, which are used solely in special conditions where the LV network has an average distance of 400 m. Set in this background, Scenario B and C present the most effective features due to the fact that the LV network has an average length of 200 m and 300 m, respectively. Additionally, 55 and 48 distribution transformers along 3 primary feeders (Scenario B and Scenario C) are needed to supply electricity to end customers, which have mainly a lower capacity than other scenarios; which is a paramount aspect since small transformers are more economical than large distribution transformers.
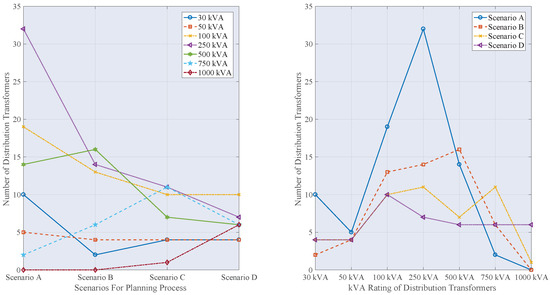
Figure 3.
Distribution transformer rating per scenario.
Figure 4 depicts the medium voltage network in each scenario, where the primary feeders connects the totality of distribution transformers. Primary feeders A, B and C are represented by green, red and yellow colours respectively for each scenario. The routing of MV network is based on MST techniques considering the lowest path between distribution transformers and power substation. As can be seen in Table 3, the length of MV network is intensely associated with the amount of distribution transformers, therefore, Scenario A shows the longest MV network, whereas, scenario C and scenario D shows the lowest length of MV grid.
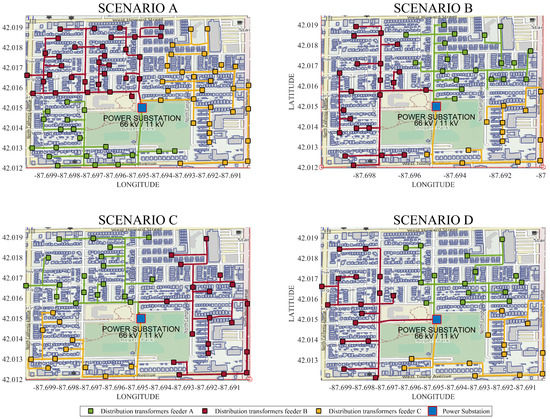
Figure 4.
Routing of primary feeders using MST techniques for each scenario.
The topology of the underground primary feeders is based on radial configuration with external interconnections (tie-lines), which have enough capacity to connect and transfer end-customers between primary feeders. Circuit breakers on auxiliary interconnections are normally open, but they allow various configurations when are tripped by emergency conditions. The operation of switching equipment can be achieved by remote control from a utility control centre. Those strategies and features provide higher service reliability and flexibility under unusual circumstances, due to the fact that customers’ loads are taken by another primary feeder in order to minimise interruption times, see Figure 5.
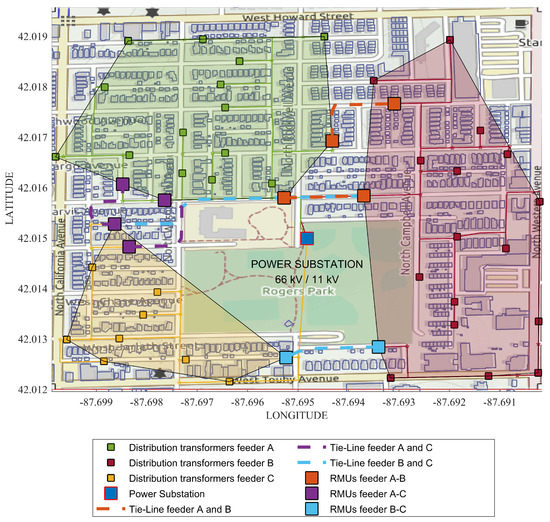
Figure 5.
Ring Main Units (RMU) allocation and tie lines for Scenario C.
The optimal allocation of switching equipment and tie lines is accomplished in three stages. The first of these consist of determining the feasible positions to allocate RMU equipment, which are defined considering the nearest points between primary feeders. Candidate positions for normally opened automatic circuit breakers are suggested considering points where distribution equipment already exists, like distribution transformers. The second step is to enumerate the possible paths to connect the candidate RMU equipment in each primary feeder. Underground tie-lines between primary feeders must be sited along public streets and roads, therefore the optimal path is selected considering the minimal distance, which will represent a reduction on excavation cost, installation and material cost. The third stage is addressed to select adequate and optimal positions for switching equipment based on the two aforementioned criteria as can be seen in Figure 5. All scenarios have been evaluated considering at least one possible tie-line between primary feeders since this principle will improve reliability and resilience, reducing downtime during contingency events.
Figure 5 depicts the normal operating conditions of a distribution network, where the grid is not subjected to unusual events. Nevertheless, any failure in a distribution system interferes with the normal system operation, which are commonly caused by insulation failure, flashover, physical damage or human error. Faults on power systems could involve all the phases in a symmetrical manner, or may be asymmetrical where only one or two phases are on short. Nevertheless, open-circuit faults are present on distribution grids due to conductors of primary feeders are broken, or circuit breakers operate only on one or two phases, leaving others connected. The aforementioned kind of fault is usually on extreme events, where sections of the grid can be affected, consequently, power outages affect end customers, producing extensive damage to private and public property, affecting utilities and their infrastructures.
Set in this context, switching equipment has a prominent function during unusual events due to the fact that they sectionalize faulted branches, as can be seen in Figure 6. For the present, it has been supposed an event that induces open-circuit faults on the distribution grid (highlighted in red) can be detected by utility’s monitoring system. The monitoring system has the capacity to order the RMU operation, changing the topology of the distribution network. Subsequently, the feeder topological infrastructure is reconfigured altering the close/open status of tie switching equipment, improving reliability and resilience.
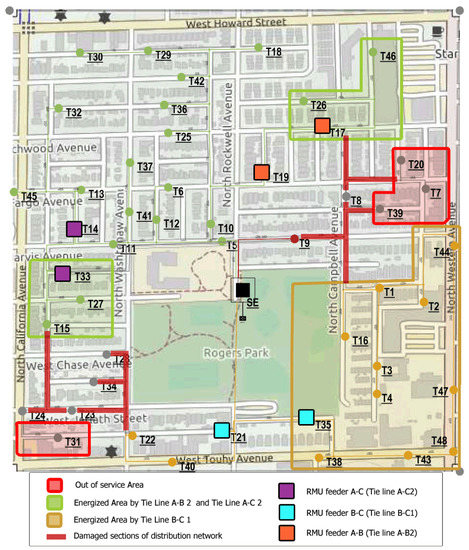
Figure 6.
Reconfiguration of distribution network (Scenario C).
Figure 6 shows the areas and energised branches taken by the nearest primary feeders after an abnormal event. The normally open switches that have been operated are connecting tie-lines A-B2, A-C2 and B-C1, which reconfigure the network, minimising out of service areas (box highlighted in red). During abnormal operating conditions feeder A takes the end user’s load from feeder B and feeder C due to faulted branches. Additionally, primary feeder C supplies the yellow area which has been out of service due to faulted lines on primary B. The aforementioned study permits to determine the functionality of the proposed algorithm, where an example of an external event is simulated on PowerFactory, considering the operation of tie-switches to reduce power outages.
Electrical analysis for both, normal and unusual operating conditions have been developed on PowerFactory, defining an external equivalent grid which is the point of connection between the sub-transmission system and the power substation. Additionally Power transformer, underground power cables and distribution transformers are considered for simulation purposes. Voltage drop analysis is showed in Figure 7, where a voltage profile depict the behaviour of the distribution network during normal conditions, where it is clearly that voltage drop is kept within standard limits that are imposed by utility policies. Figure 7 is composed by six subplots, where subplots a, c and e represent the profile voltage per feeder in normal conditions, i.e., primary feeders are connected with their maximum demand, whilst subplots b, d and f depict the voltage profile when the grid is operating during abnormal conditions.
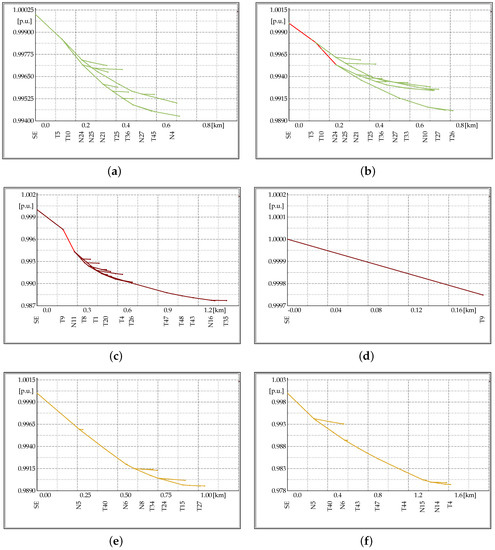
Figure 7.
A set of six subfigures: (a) Voltage profile of distribution feeder A under normal conditions (b) Voltage profile of distribution feeder B under normal conditions; (c) Voltage profile of distribution feeder C under normal conditions; (d) Voltage profile of distribution feeder A after a feeder’s reconfiguration; (e) Voltage profile of distribution feeder B after a feeder’s reconfiguration and (f) Voltage profile of distribution feeder C after a feeder’s reconfiguration.
6. Conclusions
This paper proposes a powerful and innovative methodology to design, plan and route a resilient distribution network considering geographical information from public available data, minimising the total load shedding due to tie-switches allocation, including construction costs and reduction the utility’s budget. The proposed model is based on geo-referenced data such as roads, avenues and land for construction, which is used to forecast the electrical demand customers, which is needed to determine the optimal location of distribution transformers contemplating the minimal distance between distribution transformers and end users. The routing problem has been addressed throughout MST techniques which connect distribution transformers and power substation using a MV underground network, which is sited along public streets and roads, minimising the total distance. The proposed model can be applied to different areas and location considering an increment of customers and their demand, therefore the heuristic model has been performed to develop a scalable power distribution networks based on different georeferenced maps.
Additionally, normally open points (tie-points) have been allocate in strategic locations within the distribution network. Candidate tie points have been suggested based on possible paths to connect primary feeders, however the optimal allocation is defined by the minimal distance between them. As a result, at least one and two possible tie-lines between primary feeders have been contemplated, consequently the proposed methodology has been focused on altering the close/open status of tie switching equipment, improving reliability and resilience reducing downtime during contingency events.
For this problem, not only the end customer’s demand and location but also the feeder network constraints are required to test the proposed methodology. Satisfactory results have been achieved, where there are not scenarios that overpass statuary limits associated with voltage drop (lower than 1.2%), and cable loading for both normal and abnormal operating conditions. Subsequently, the model presents a feasible solution for planning procedure providing a coverage of 100% since it is mandatory to supply electricity to the totality of customers.
Author Contributions
Conceptualization, E.I.; investigation, A.V.; writing—original draft preparation, A.V.; E.I.; S.S.; supervision, S.S.
Funding
This research received no external funding.
Acknowledgments
This work was supported by Universidad Politécnica Salesiana and GIREI—Smart Grid Research Group under the project Automatic Protection Coordination on Power System under extreme events.
Conflicts of Interest
The authors declare no conflict of interest.
References
- Nahman, J.; Perić, D. Path-set based optimal planning of new urban distribution networks. Int. J. Electr. Power Energy Syst. 2017, 85, 42–49. [Google Scholar] [CrossRef]
- Panteli, M.; Mancarella, P. Influence of extreme weather and climate change on the resilience of power systems: Impacts and possible mitigation strategies. Electr. Power Syst. Res. 2015, 127, 259–270. [Google Scholar] [CrossRef]
- Wang, Y.; Chen, C.; Wang, J.; Baldick, R. Research on Resilience of Power Systems Under Natural Disasters-A Review. IEEE Trans. Power Syst. 2015, 31, 1604–1613. [Google Scholar] [CrossRef]
- Espinoza, S.; Panteli, M.; Mancarella, P.; Rudnick, H. Multi-phase assessment and adaptation of power systems resilience to natural hazards. Electr. Power Syst. Res. 2016, 136, 352–361. [Google Scholar] [CrossRef]
- Bie, Z.; Lin, Y.; Li, G.; Li, F. Battling the Extreme: A Study on the Power System Resilience. Proc. IEEE 2017, 105, 1253–1266. [Google Scholar] [CrossRef]
- Mousavizadeh, S.; Haghifam, M.R.; Shariatkhah, M.H. A linear two-stage method for resiliency analysis in distribution systems considering renewable energy and demand response resources. Appl. Energy 2018, 211, 443–460. [Google Scholar] [CrossRef]
- Salman, A.M.; Li, Y.; Stewart, M.G. Evaluating system reliability and targeted hardening strategies of power distribution systems subjected to hurricanes. Reliab. Eng. Syst. Saf. 2015, 144, 319–333. [Google Scholar] [CrossRef]
- Amraee, T.; Saberi, H. Controlled islanding using transmission switching and load shedding for enhancing power grid resilience. Int. J. Electr. Power Energy Syst. 2017, 91, 135–143. [Google Scholar] [CrossRef]
- Jia, K.; Bi, T.; Liu, B.; Thomas, D.; Goodman, A. Advanced islanding detection utilized in distribution systems with DFIG. Int. J. Electr. Power Energy Syst. 2014, 63, 113–123. [Google Scholar] [CrossRef]
- Aghamohammadi, M.R.; Shahmohammadi, A. Intentional islanding using a new algorithm based on ant search mechanism. Int. J. Electr. Power Energy Syst. 2012, 35, 138–147. [Google Scholar] [CrossRef]
- Li, J.; Ma, X.Y.; Liu, C.C.; Schneider, K.P. Distribution system restoration with microgrids using spanning tree search. IEEE Trans. Power Syst. 2014, 29, 3021–3029. [Google Scholar] [CrossRef]
- Zhai, H.F.; Yang, M.; Chen, B.; Kang, N. Dynamic reconfiguration of three-phase unbalanced distribution networks. Int. J. Electr. Power Energy Syst. 2018, 99, 1–10. [Google Scholar] [CrossRef]
- Figueroa-Candia, M.; Felder, F.A.; Coit, D.W. Resiliency-based optimization of restoration policies for electric power distribution systems. Electr. Power Syst. Res. 2018, 161, 188–198. [Google Scholar] [CrossRef]
- Xiang, Y.; Wang, L.; Zhang, Y. Electrical Power and Energy Systems Adequacy evaluation of electric power grids considering substation cyber vulnerabilities. Electr. Power Energy Syst. 2018, 96, 368–379. [Google Scholar] [CrossRef]
- Valenzuela, A.; Montalvo, I.; Barrera-singaña, C. Electrical Vehicle: Facing Future Challenges in Quito. In Proceedings of the 2017 IEEE PES Innovative Smart Grid Technologies Conference-Latin America (ISGT Latin America), Quito, Ecuador, 20–22 September 2017; pp. 1–6. [Google Scholar]
- Mosbah, M.; Arif, S.; Mohammedi, R.D.; Hellal, A. Optimum dynamic distribution network reconfiguration using minimum spanning tree algorithm. In Proceedings of the 2017 5th International Conference on Electrical Engineering—Boumerdes (ICEE-B), Boumerdes, Algeria, 29–31 October 2017; pp. 1–6. [Google Scholar]
- Li, H.; Mao, W.; Zhang, A.; Li, C. An improved distribution network reconfiguration method based on minimum spanning tree algorithm and heuristic rules. Int. J. Electr. Power Energy Syst. 2016, 82, 466–473. [Google Scholar] [CrossRef]
- Xie, S.; Hu, Z.; Zhou, D.; Li, Y.; Kong, S.; Lin, W.; Zheng, Y. Multi-objective active distribution networks expansion planning by scenario-based stochastic programming considering uncertain and random weight of network. Appl. Energy 2018, 219, 207–225. [Google Scholar] [CrossRef]
- Raeisi-Gahrooei, Y.; Khodabakhshian, A.; Hooshmand, R.A. A new stratified random sample customer selection for load research study in distribution networks. Int. J. Electr. Power Energy Syst. 2018, 97, 363–371. [Google Scholar] [CrossRef]
- Santos, N.; Lagarto, M.; Rodrigues, C. Innovative underground distribution cabinet for low-voltage network. CIRED-Open Access Proc. J. 2017, 2017, 256–259. [Google Scholar] [CrossRef][Green Version]
- Bajpai, P.; Chanda, S.; Srivastava, A.K. A Novel Metric to Quantify and Enable Resilient Distribution System using Graph Theory and Choquet Integral. IEEE Trans. Smart Grid 2016, 3053, 2918–2929. [Google Scholar] [CrossRef]
- Moradijoz, M.; Moghaddam, M.P.; Haghifam, M.R. A flexible active distribution system expansion planning model: A risk-based approach. Energy 2018, 145, 442–457. [Google Scholar] [CrossRef]
- Inga-Ortega, E.; Peralta-Sevilla, A.; Hincapie, R.C.; Amaya, F.; Tafur Monroy, I. Optimal dimensioning of FiWi networks over advanced metering infrastructure for the smart grid. In Proceedings of the 2015 IEEE PES Innovative Smart Grid Technologies Latin America, ISGT LATAM 2015, Boumerdes, Algeria, 29–31 October 2017; pp. 30–35. [Google Scholar]
- Inga, E.; Céspedes, S.; Hincapié, R.; Cárdenas, A. Scalable Route Map for Advanced Metering Infrastructure Based on Optimal Routing of Wireless Heterogeneous Networks. IEEE Wirel. Commun. 2017, 24, 26–33. [Google Scholar] [CrossRef]
- Inga, J.; Inga, E.; Ortega, A.; Hincapíé, R.; Gómez, C. Optimal Planning for Deployment of FiWi Networks based on Hybrid Heuristic Process. IEEE Latin Am. Trans. 2017, 15, 1684–1690. [Google Scholar] [CrossRef]
- Wang, G.W.; Zhang, C.X.; Zhuang, J. Clustering with Prim’s sequential representation of minimum spanning tree. Appl. Math. Comput. 2014, 247, 521–534. [Google Scholar] [CrossRef]
- Campaña, M.; Inga, E.; Hincapié, R. Optimal Placement of Universal Data Aggregation Points for Smart Electric Metering based on Hybrid Wireless. In Proceedings of the CEUR Workshop Proceedings, Como, Italy, 27–31 August 2017; Volume 1950, pp. 6–9. [Google Scholar]
- Peralta, A.; Inga, E.; Hincapié, R. Optimal Scalability of FiWi Networks Based on Multistage Stochastic Programming and Policies. J. Opt. Commun. Netw. 2017, 9, 1172. [Google Scholar] [CrossRef]
- Peralta, A.; Inga, E.; Hincapié, R. FiWi Network Planning for Smart Metering Based on Multistage Stochastic Programming. IEEE Latin Am. Trans. 2015, 13, 3838–3843. [Google Scholar] [CrossRef]
- Chuang, H.J.; Tsai, W.Y.; Chen, C.S.; Ho, C.Y. Optimal Expansion Planning of Distribution Substations Using Loading Gravity with Genetic Algorithm. In Proceedings of the 2nd International Conference on Intelligent Technologies and Engineering Systems (ICITES2013), Taiwan, China, 12–14 December 2013; Volume 293, pp. 11–19. [Google Scholar]
© 2019 by the authors. Licensee MDPI, Basel, Switzerland. This article is an open access article distributed under the terms and conditions of the Creative Commons Attribution (CC BY) license (http://creativecommons.org/licenses/by/4.0/).