Article

An Investigation into the Acoustic Emissions of Internal Combustion Engines with Modelling and Wavelet Package Analysis for Monitoring Lubrication Conditions

1
School of Economics and Management, Taiyuan University of Science and Technology, Shanxi 030024, China
2
College of mechanical and vehicle engineering, Taiyuan University of Technology, Shanxi 030024, China
3
School of Engineering, University of Bolton, Bolton BL3 5AB, UK
4
Centre for Efficiency and Performance Engineering, University of Huddersfield HD1 3DH, UK
*
Authors to whom correspondence should be addressed.
Energies 2019, 12(4), 640; https://doi.org/10.3390/en12040640
Submission received: 11 January 2019 / Revised: 5 February 2019 / Accepted: 13 February 2019 / Published: 16 February 2019
(This article belongs to the Section F: Electrical Engineering)

Abstract

:
Online monitoring of the lubrication and friction conditions in internal combustion engines can provide valuable information and thereby enables optimal maintenance actions to be undertaken to ensure safe and efficient operations. Acoustic emission (AE) has attracted significant attention in condition monitoring due to its high sensitivity to light defects on sliding surfaces. However, limited understanding of the AE mechanisms in fluid-lubricated conjunctions, such as piston rings and cylinder liners, confines the development of AE-based lubrication monitoring techniques. Therefore, this study focuses on developing new AE models and effective AE signal process methods in order to achieve accurate online lubrication monitoring. Based on the existing AE model for asperity–asperity collision (AAC), a new model for fluid–asperity shearing (FAS)-induced AE is proposed that will explain AE responses from the tribological conjunction of the piston ring and cylinder. These two AE models can then jointly demonstrate AE responses from the lubrication conjunction of engine ring–liner. In particular, FAS allows the observable AE responses in the middle of engine strokes to be characterised in association with engine speeds and lubricant viscosity. However, these AE components are relatively weak and noisy compared to others, with movements such as valve taring, fuel injection and combustions. To accurately extract these weaker AE’s for lubricant monitoring, an optimised wavelet packet transform (WPT) analysis is applied to the raw AE data from a running engine. This results in four distinctive narrow band indicators to describe the AE amplitude in the middle of an engine power stroke. Experimental evaluation shows the linear increasing trend of AE indicator with engine speeds allows a full separation of two baseline engine lubricants (CD-10W30 and CD-15W40), previously unused over a wide range of speeds. Moreover, the used oil can also be diagnosed by using the nonlinear and unstable behaviours of the indicator at various speeds. This model has demonstrated the high performance of using AE signals processed with the optimised WPT spectrum in monitoring the lubrication conditions between the ring and liner in IC engines.

1. Introduction

The lubricant plays a vital role in internal combustion engines to reduce the friction of moving parts and prevent abnormal wear. It also dissipates heat from the components and clean particle contamination on the contact surfaces [1]. Especially, it considerably impacts the performance of oil thermal management for the further reduction of friction and emissions [2]. Traditional monitoring of lubricant quality is often based on the laboratory oil samples taken at given time intervals. The sample analysis method has some deficiencies such as sample contaminations, high costs and time-delayed results, which is both inconvenient and unrealistic. An online monitoring technique is imperative to prevent the above deficiencies, a technique that allows timely analysis of the lubrication condition and optimal actions for safe and efficient operations. Many studies and sensor technologies have been developed online monitoring lubrication performance as reviewed in References [1] and [3]. The ultrasound method is an attractive non-intrusive method in condition monitoring without any invasion. Xu et al. [4] reported the simulation investigations and physical model analysis results by using an ultrasonic oil debris sensor to identify the solid debris and air bubbles. Li and Jiang [5] presented theoretical analysis of the ultrasonic sensor to recognise the wear debris in the lubricating oil. In particular, Mills et al. [6] developed an ultrasonic approach to measure the lubricant film thickness formed between the piston and cylinder wall in a fired engine. These achievements demonstrate the possibility to detect the lubrication performance by using the active ultrasound techniques.
Acoustic emission, a passive type of ultrasound, is the rapid release of strain energy generated spontaneously from the materials that undergo deformation or fracture due to external forces or temperature gradients [7]. Recently, AE signals have been demonstrated to be effective for assessing the engine conditions such as combustion processes [8], valve faults [9], fuel injection behaviours [10] and fault detection for diesel engines [11]. A number of prior works concerning AE monitoring of the friction and wear process were undertaken using dedicated testing rigs [12,13]. AE monitoring towards the slider to disk test rigs revealed that the sliding speed, acceleration and load can affect the AE root mean square (RMS) values [14], whereas there is not a significant difference in AE signals between the smooth and textured surfaces [15]. These discoveries promote the investigations of AE monitoring on the friction and wear processes between piston rings and cylinder surfaces. Shuster et al. [16] established the relationship between AE signals and different levels of the scuffing phenomenon and suggested three different easy-to-measure levels of scuffing damage between the piston ring and cylinder liner. Douglas et al. [17] investigated the tribology of the piston ring and cylinder liner surfaces by performing a series of AE experiments on engines. It proved that the RMS values of AE signals are related to asperity contacts between the ring pack and liner and found that it is possible to monitor the extreme condition of turning off the engine oil supply. To correlate the AE with the viscosity of the engine lubricating oil, Elamin et al. [18,19] reported the possibility of predicting the quality of engine oil using AE RMS values acquired from a four-cylinder engine. Although these studies show that AE is promising to monitor engine tribological behaviours, there are limited studies on monitoring the gradual degradation of lubrication in a running engine, which is vital to prevent any unnecessary wear and avoid any wastage of lubrication oil that is still usable.
To gain further insight into AE mechanisms for monitoring oil degradation, Nasha Wei et al. [20] have applied discrete wavelet transform (DWT) to AE signals from the engine body to suppress noise influences and more accurately characterise the weak AE components relating to viscous friction. The authors also studied the potential impacts of alternative fuels on acoustic emission signals of the cylinder [21], which all show positive results.
This paper improves the above initial findings by using a more powerful analysis of wavelet packet transform (WPT) spectrum to characterise AE signals acquired under the base line lubricating oils and used oil, and thereby establishes a more accurate and reliable AE indicator for monitoring the tribological behaviours of the engine ring–liner. First, a new AE model is developed to gain more insight into the AE from hydrodynamic lubrication (HL) regimes. An optimal WPT analysis is then implemented to characterise the tribological AEs in HL regimes accurately. Finally, the performance of the model and the indicator from WPT analysis is evaluated by differentiating between the different lubricating oils.

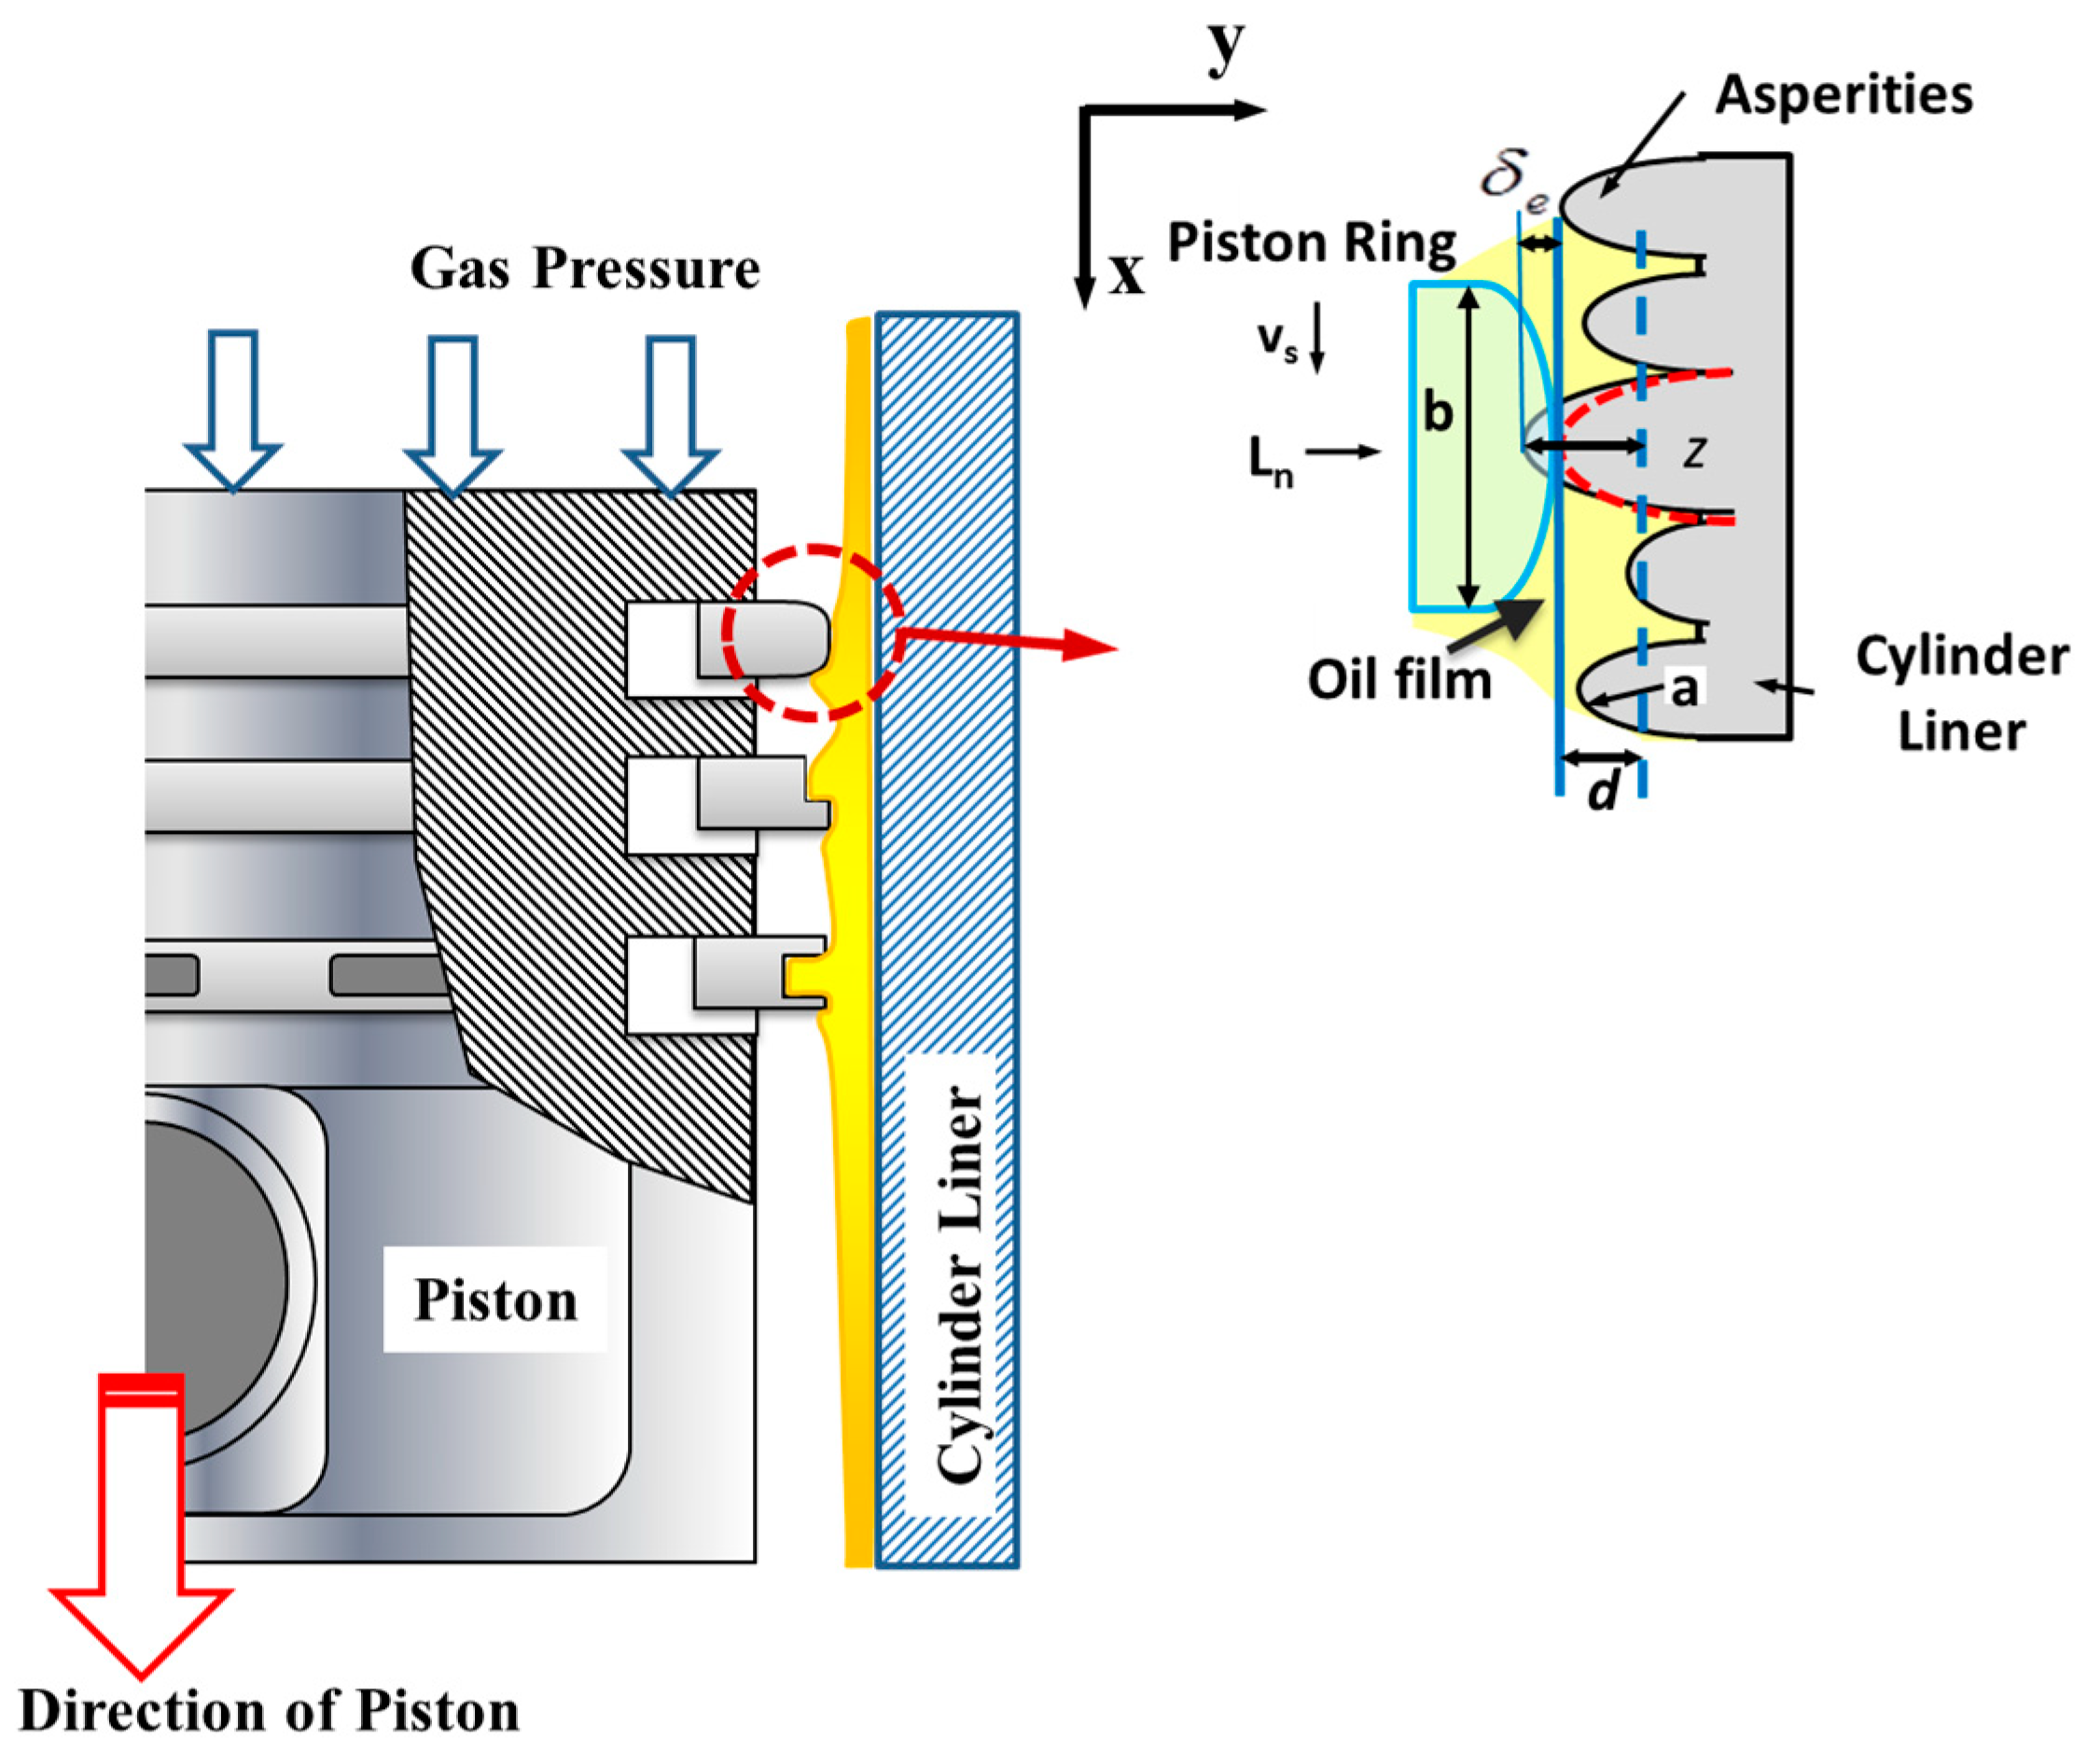
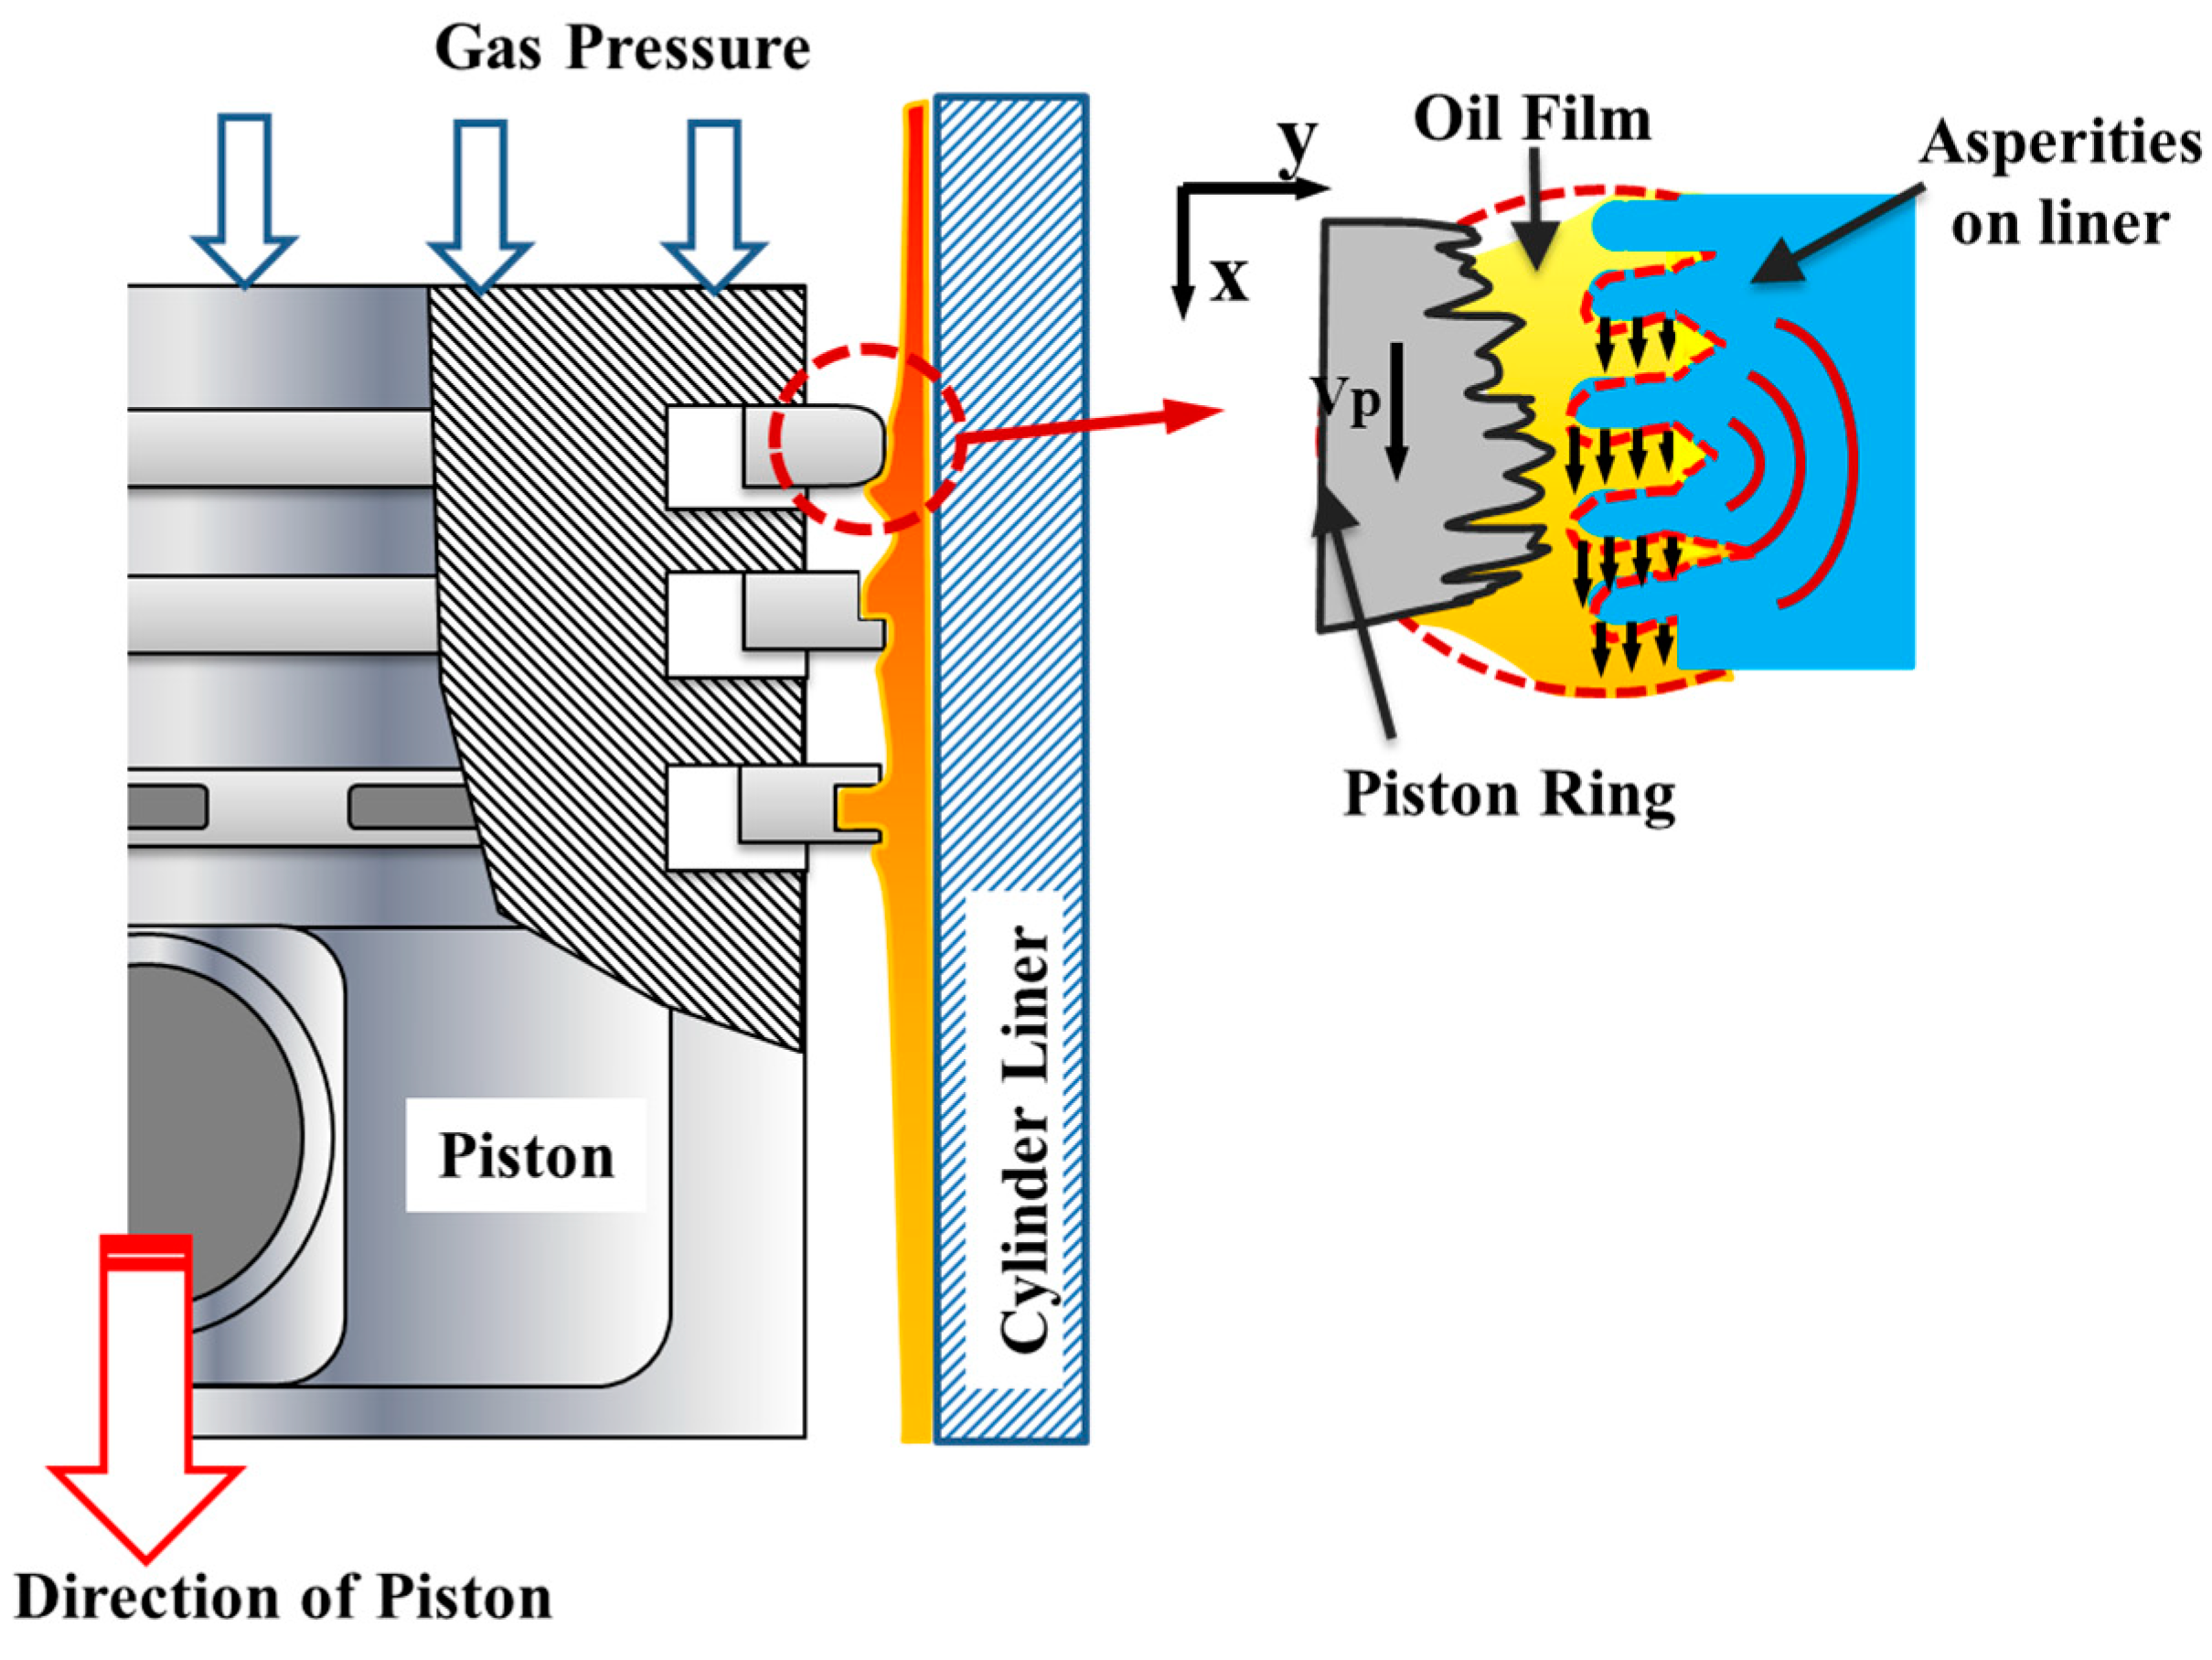
2. Tribodynamic AE from the Conjunction between the Piston Ring and Cylinder Liner

Based on well-known lubrication mechanisms, it is generally accepted that the main tribological process of the surfaces between the ring and liner usually have three general lubrication regimes: boundary lubrication (BL), mixed lubrication (ML), and HL [22]. In BL and ML regimes, asperity contacts exist in which AE generation can be described in great accuracy by the model of asperity–asperity collision (AAC) suggested by Fan et al. [23]. However, in HL regimes, which is the lubrication status in the mid stroke of piston motion, there is no asperity contact and the AE observed [17,18,21] cannot be explained by the AAC effect. To understand the generation and characteristics of AE in HL regimes, which serves for AE signal analysis and evenly lubrication monitoring, this section develops a new AE model by examining the tribodynamics of the lubrication regimes between the piston ring and cylinder liner.

2.1. Asperity–Asperity Collisions

Asperity collision during sliding contacts has been discovered as the primary source of acoustic emissions from the test ball in a ball-on-cylinder test apparatus by Boness and Mcbride [24]. AE activities have been demonstrated in References [25,26] to correlate with asperity contact behaviour between the slider and disk interface. Furthermore, the study in Reference [13] shows that the sliding speed, the applied load and the surface condition of the components are the main factors influencing AE characteristics. The asperity contacts during the sliding process are defined as the indentation of an elastic half-space by a rigid frictionless sphere [23]. Further, Komvopoulos et al. [27] stated that the boundary lubrication is associated with the asperities friction and wear. Particularly, Douglas et al. [17] related AE activity to asperity contacts between the ring-pack and liner and it also elaborated the evaluation of lubrication oil fed rates under the extreme conditions of turning off the lube oil supply.
Of particular interest is the AE model developed by Fan et al. [28]. According to asperity–asperity collisions (AAC) from the sliding friction between rough surfaces, which is developed based on the dynamic deformations of asperities, the AAC model can correlate AE signals with the fast energy release rate in the course of dynamic deformations of asperities under different contact loads and sliding speeds, as shown in Figure 1. Moreover, it allows the analysis of AE frequency contents of the sliding contact to be examined. Considering the elastic deformations of asperity collisions between sliding surfaces, the characteristic time duration ta for the interaction of two asperities with an equal radius a at sliding speed vp can be expressed as:
t a = 2 a v p
the energy release rate in the period from the compression to recovery is related to the sliding velocity, contact load and topographic characteristics of the contact surfaces. The portion of the energy rate for AE responses at an arbitrary time can be expressed according to Equation (2) [28]:
AE c ( t ) = U ˙ A E _ a s p ( t ) = k c N ( t ) L n ( t ) v p ( t ) F 1 ( h ) R 1 / 2 F 1 / 2 ( h )
where k c = 0.4 k e k m and k e denotes the portion of the elastic strain energy converted to AE pulses and k m is the gain of the AE measurement system, N is defined as the total number of asperity contacts between the two rough surfaces, v p is the average sliding speed of the surfaces, Ln is the normal load on a surface, F 1 ( h ) and F 1 / 2 ( h ) are the probability density functions of the standardised separation h between two sliding surfaces, and R′ is the radius of the curvature in the Hertzian contact area. Based on Equation (2), AE responses from the ring and liner can be explained sufficiently around various dead centres of IC engines where the lubrication condition is mainly in BL regimes and a large number of AACs can present.

2.2. Fluid–Asperity Shearing

However, the AAC model proposed in Reference [28] is not sufficient for describing the AE in the middle of the stroke where HL is dominated where there are little asperities in contact. Specifically, Mhmod Hamel et al. [29] found significant AE events in the HL lubrication conditions of a gear transmission and were regarded broadly due to the shearing of the oil films. Authors in both References [20] and [21] also observed that significant AE events are concentrated in the middle of each stroke in a diesel engine and these AE amplitudes increase with the speed and viscosity. To explain and characterise these AE responses, a new AE model should be produced to show the interactions between fluid and asperities.
According to the fluid shearing effect or viscous friction generated between fluid layers and the liner boundaries in HL regimes, pressurised entrainment flows in the converging–diverging conjunction will shear the rough surfaces of the ring and liner. Consequently, asperities on the liner surface will bend and recover when the ring moves across them, as illustrated Figure 2, and the bending deflection energy will be partially coupled to the liner in the form of AE waves. Based on this fundamental understanding of the modelling of AE excitations due to AAC, a new AE model can be established by describing the dynamic effect of fluid–asperity shearing (FAS) that takes into account the dynamic bending deflections of asperities driven by the fluid shear forces. Considering that cylinder liner surfaces with a honing finishing exhibit a non-Gaussian distribution [30] of asperity height z with a constant width w the characteristic time duration tb of the asperities from bend to recovery across the ring width b will be:
t b = b v p
It is straightforward to establish a correlation of AE signals with the piston velocity, cylinder pressure and temperature dependence η(x, y, t) of lubricant and hydrodynamic film characteristics in association with the topographic characteristics, specifically:
AE b ( t ) = π d r k b v p ( t ) N d ( t ) z i w 3 E l I i 0 z i [ h ( x , y , t ) 2 p ( x , y , t ) + η ( x , y , t ) h ( x , y , t ) v ( x , y , t ) ] d y
where I i is a random asperity’s equivalent section moment of inertia, y is along the film thickness, x is along the circumference of the ring, El is the Yong’s modulus of the cylinder liner, d r is the radius of the piston ring, kb denotes the portion of the elastic strain energy that converts to AE waves, and N d is the total number of asperities under bending deflection. p ( x , y , t ) , v ( x , y , t ) and h ( x , y , t ) are pressure, velocity distribution of fluid flows and the nominal film thickness, respectively, which can be obtained by solving the average Reynold equation under given boundary and operating conditions including the contact load due to ring expansion and gas pressure.

2.3. General Characteristics of AE in the Time and Frequency Domains

AE behaviours in BL and HL regimes can be explained mainly with AAC and FAS models, respectively. For the ML regime, as it presents both asperity collisions and flow shearing, its AE can be predicted using AAC and FAS models jointly. As both AE models are developed based on deformation energies, it is sufficient to linearly add these AEs together from both models to represent the total AE in the ML regime. Therefore, these two models are sufficient to describe AE behaviours for the entire process of the ring-piston lubrication under different engine operating conditions.
As aforementioned, FAS induced AE can exhibit more stationary behaviour in HL regimes when the specific value of η v p / L n is high. This can be the main behaviour when the piston moves around the middle of an engine stroke where the piston speed is at its highest. At all dead centres of the piston motions, the velocity is close to zero; therefore, the two AE models all result in zero AE amplitudes. It is very different from the peaks of asperity friction forces predicted in many ring–liner tribological models, limiting the use of AE to indicate the lubrication in these extreme conditions, but gives more information about engine key events of fuel injection and combustion.
As the piston moves away from the dead centres, AAC-induced AE activity is significantly high because of the “solid–solid” impacts from the contacted asperities, compared with the “solid–soft” impacts from FAS generation mechanisms. These characteristics of AE events are valuable for indicating the early and abnormal wear around the top and bottom of a liner, especially in the BL regime, allowing the performance of anti-wear additives to be evaluated.
Furthermore, by taking the collision of a single pair of asperity as a time impulse with a width t a , its Fourier spectrum in the frequency domain will spread across a very wide frequency range as the time duration is very short. Typically, the dimension of roughness for the surface of a liner-ring is approximately several micrometres and the velocity of the piston is several metres per second. This means that AE from AAC due to the “solid–solid” impacts can be as high as several megahertz according to:
f a = v p 2 a
Comparatively, the occurrence of FAS is in the form of “solid–soft” impacts, and the slope of bending deformation or the rising of the impulse is smaller than that of the “solid–solid” impacts and result in a lower frequency AE, which may be in the range of several kilohertz together with many low amplitudes.
In summary, in the mid-stroke of piston motion, AE is mainly from FAS effects, which exhibits nearly continuous profiles along the time direction and less distributed frequency bands along with smaller amplitudes. Based on this basic understanding, it can be deduced that the lubrication condition becomes unacceptable if large spike AE responses are observed because they are mostly caused by AAC due to more direct contacts and greater particle contamination. In addition, these models can be also included in the future into a thermodynamic model-based engine failure simulation system [31] to study AE responses to a wide range of combustion faults.

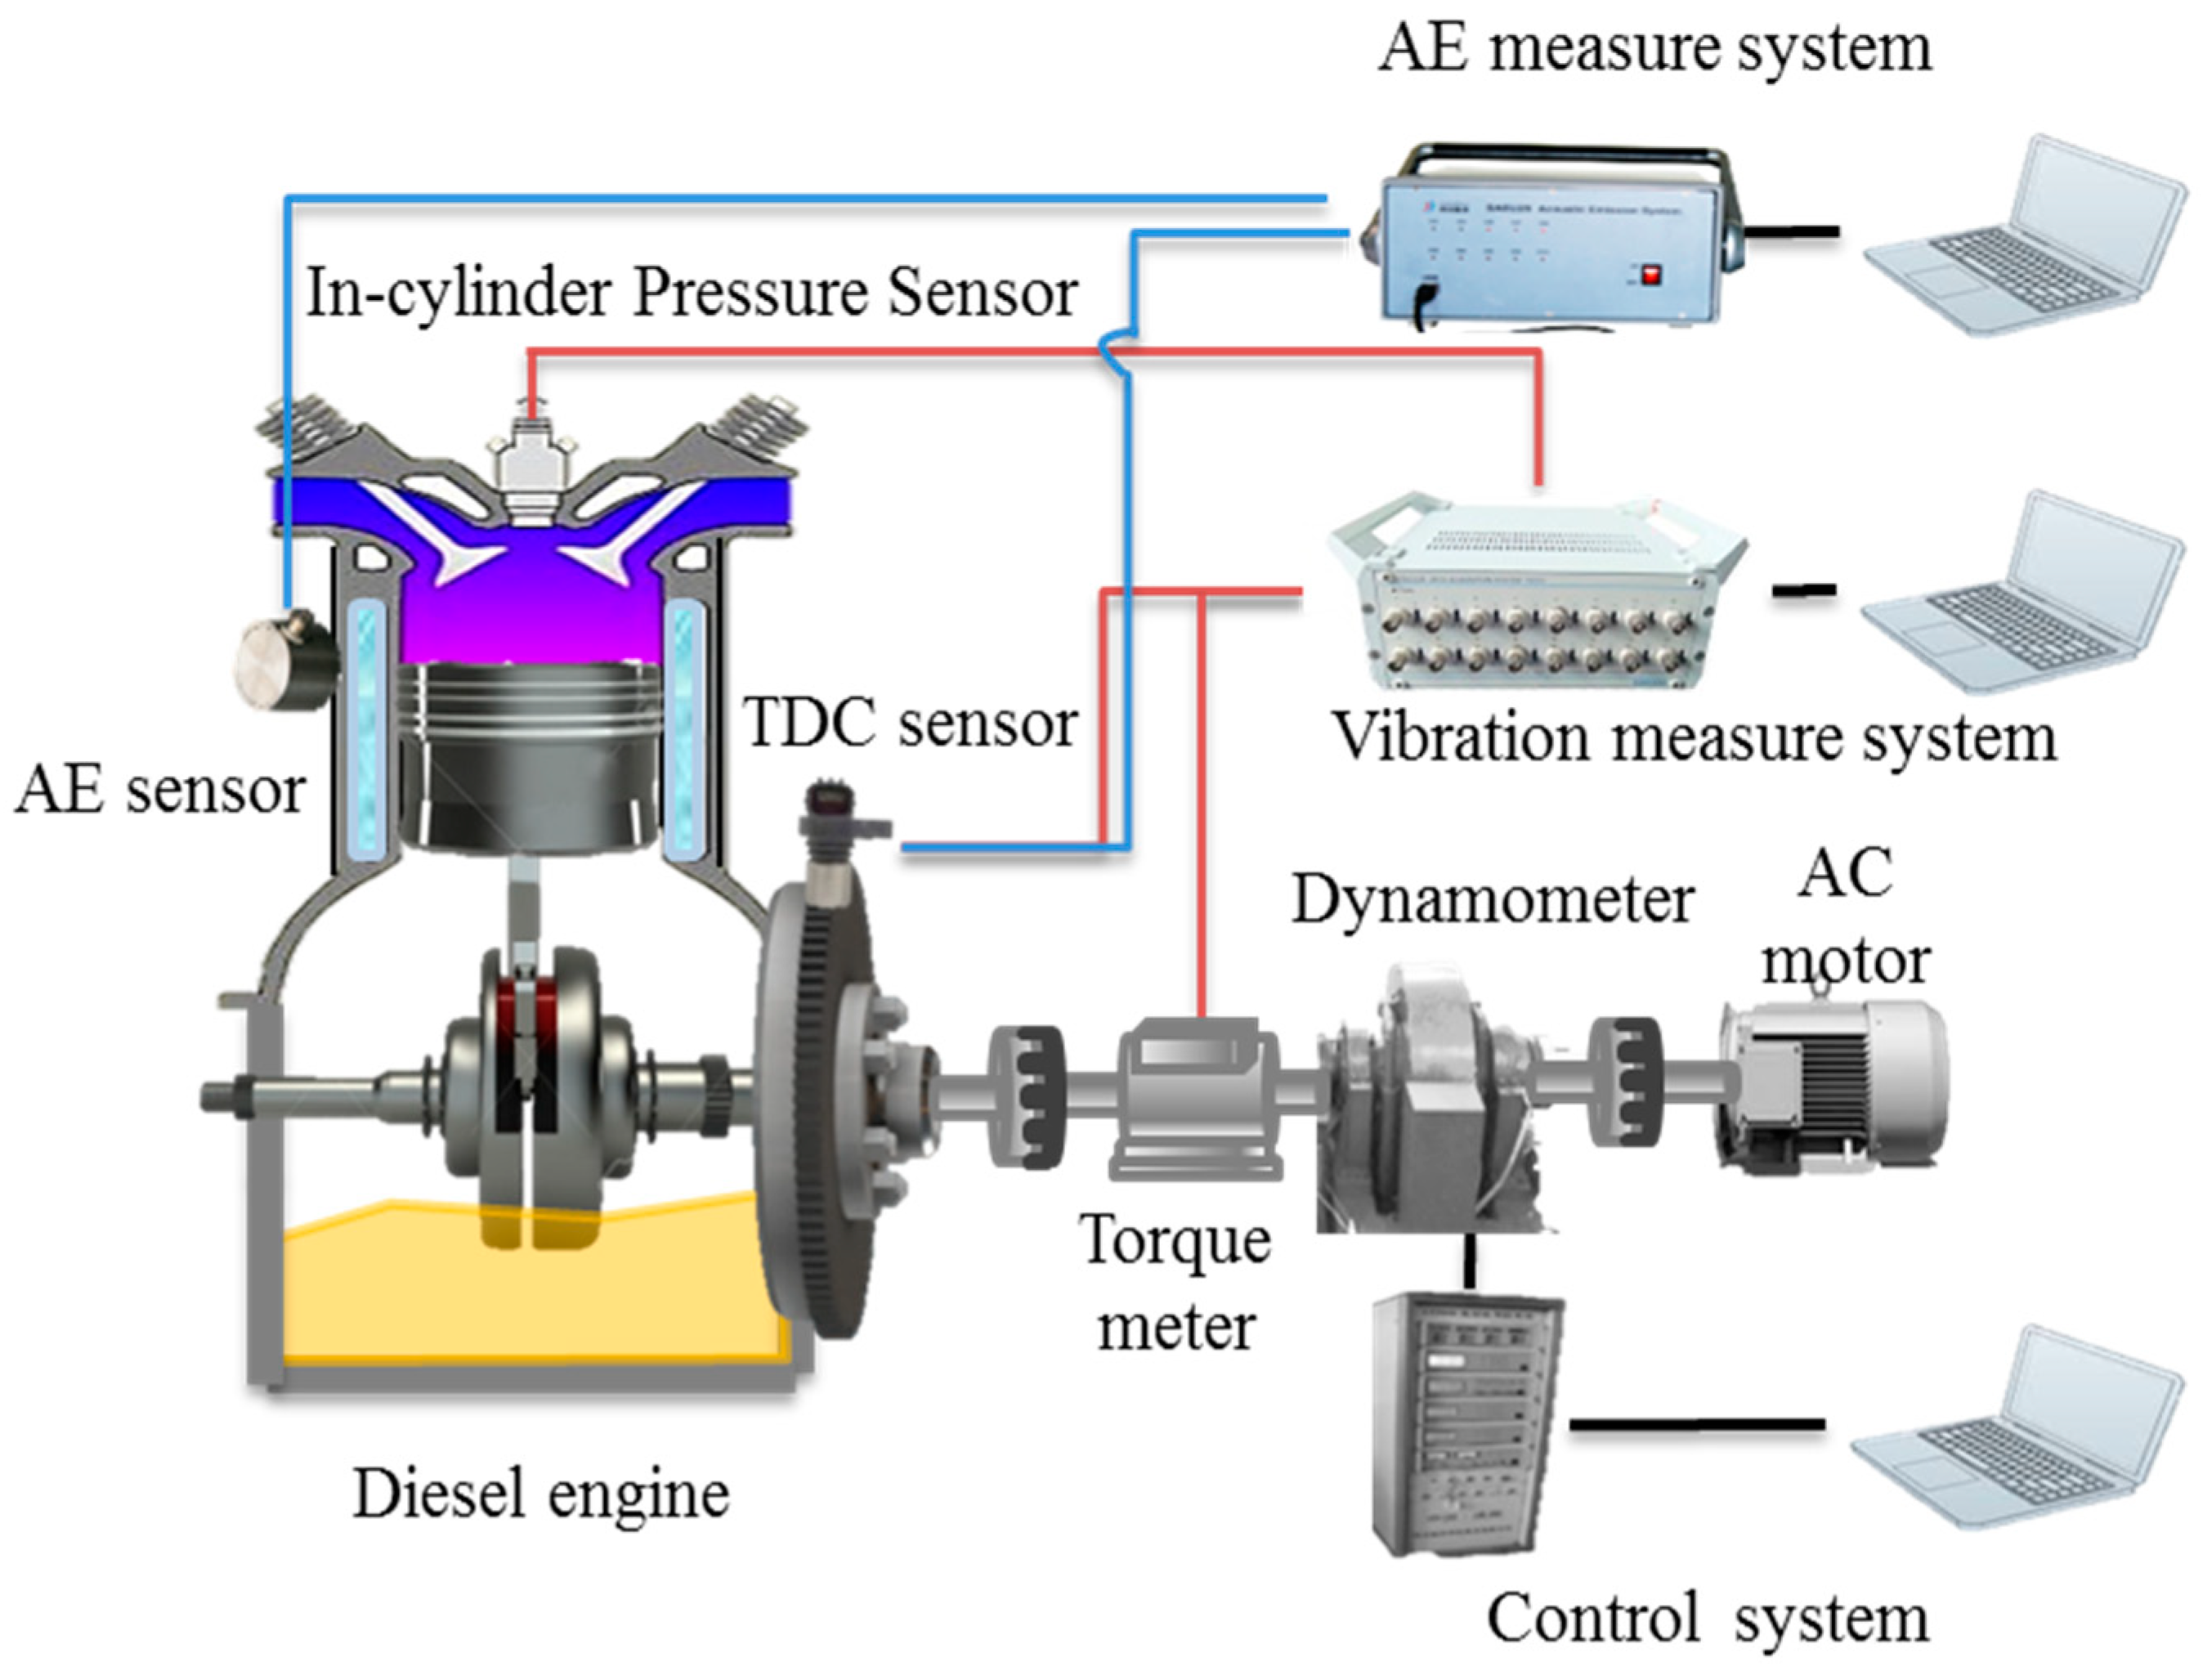
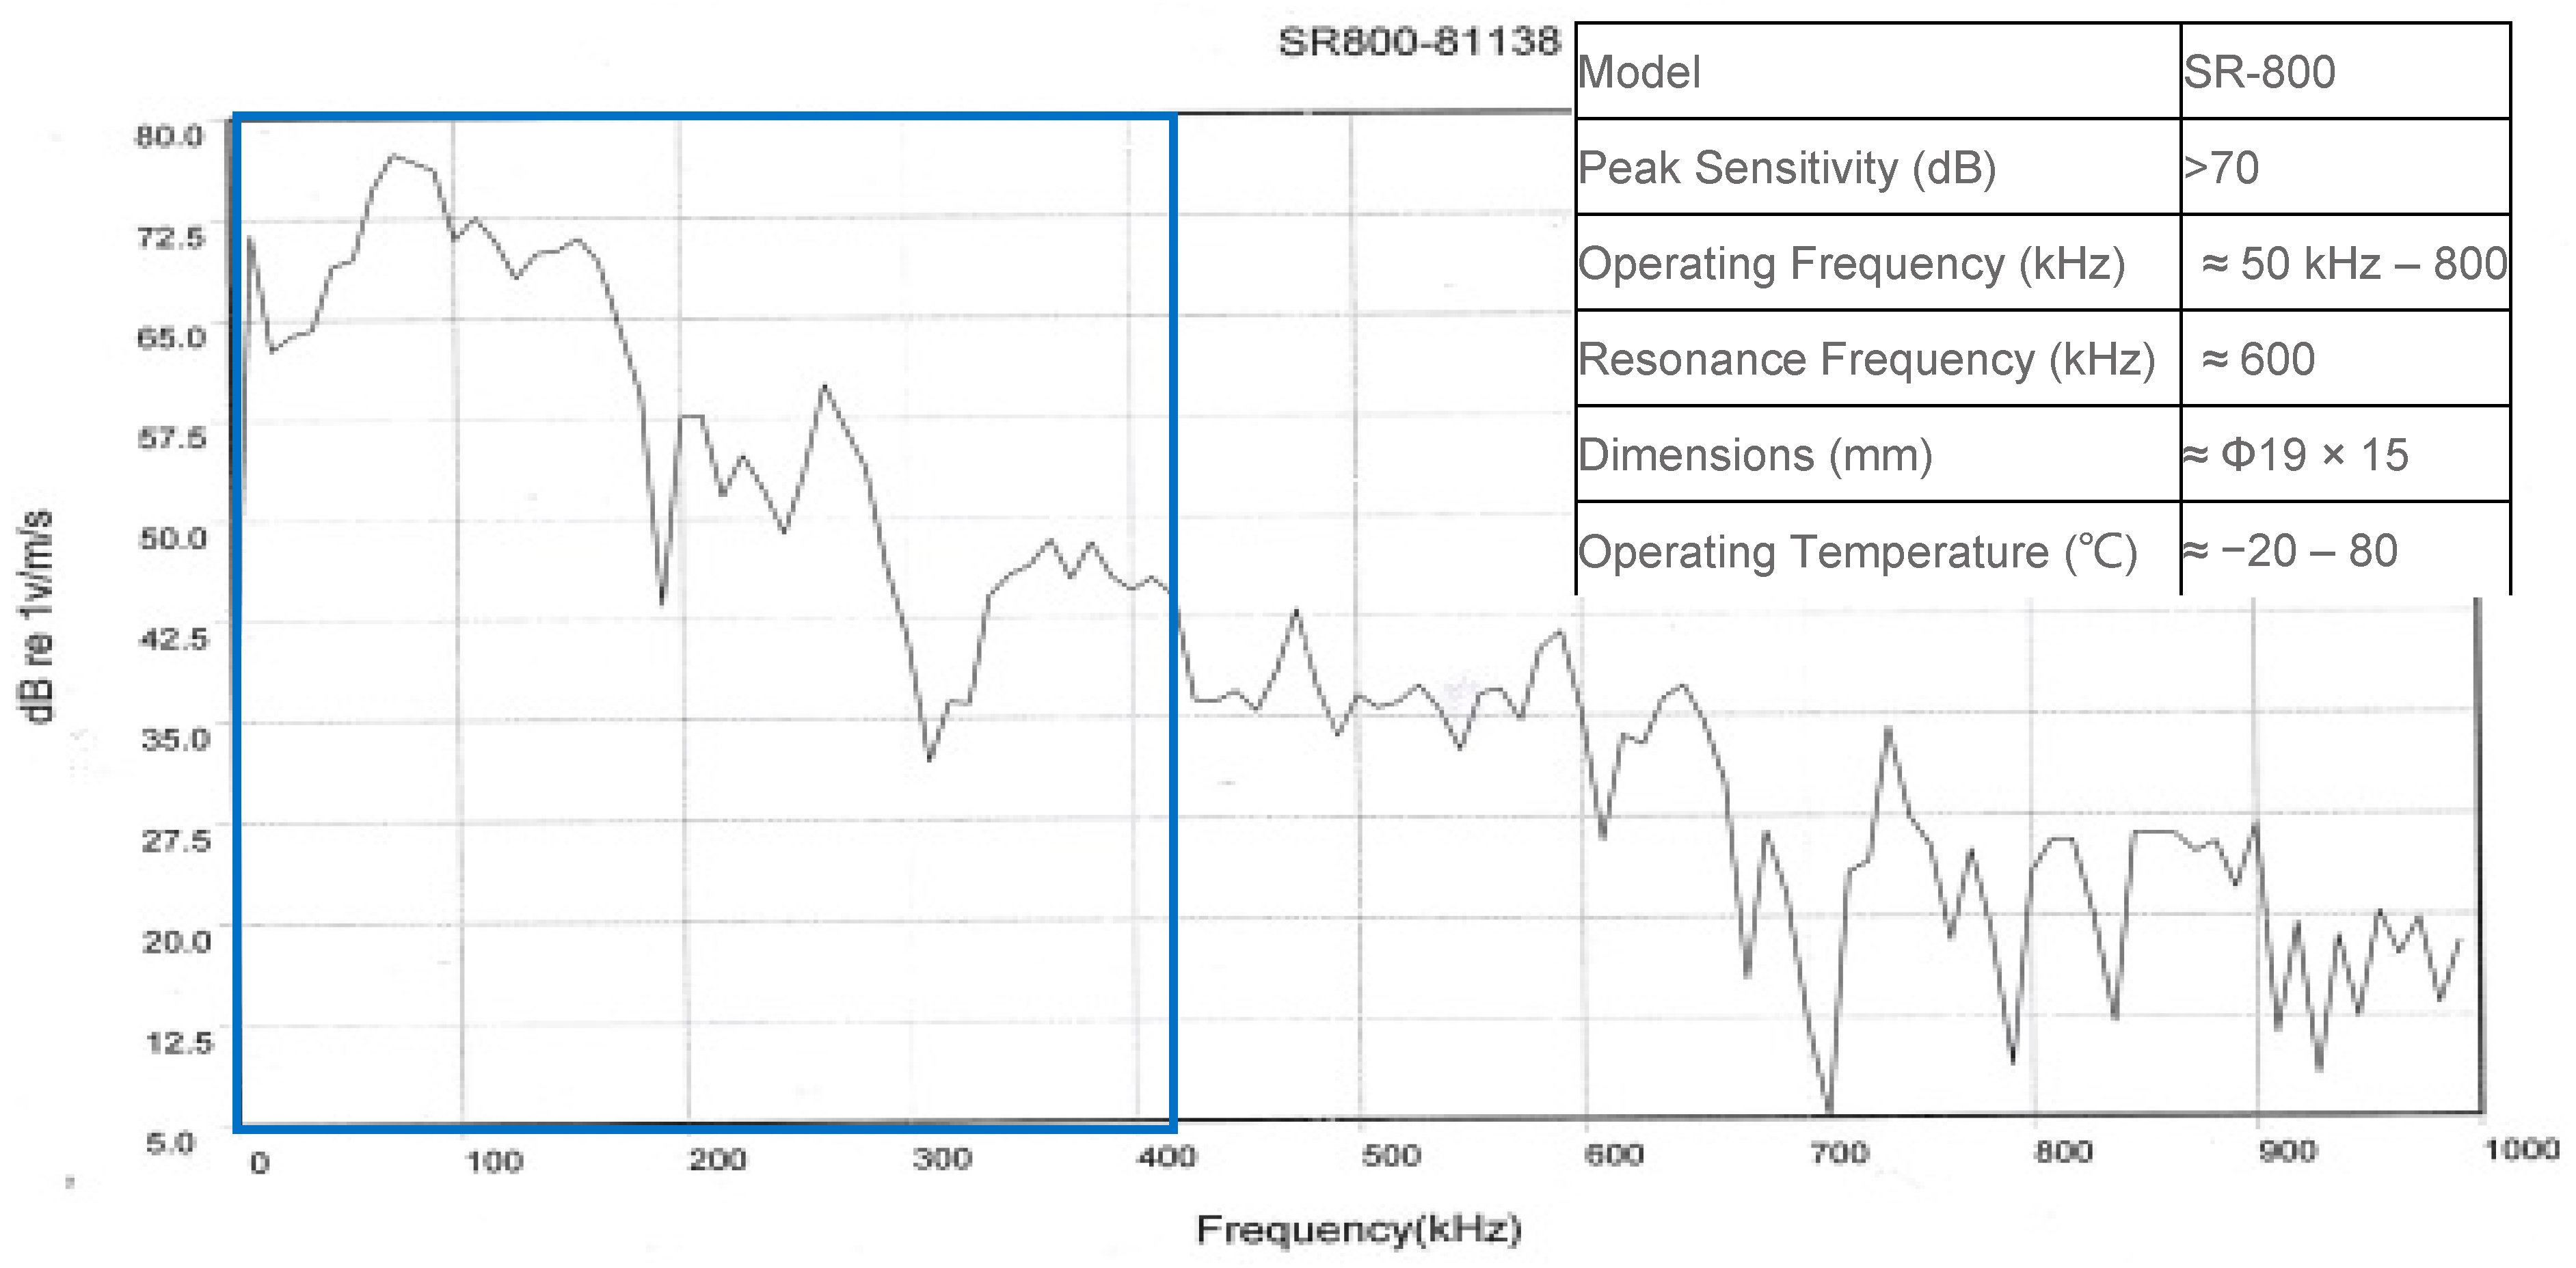
3. Experimental Methodologies and AE Measurements

This experimental study was conducted on a vertical single cylinder compression ignition direct injection (CIDI) engine (Anhui Quanchai Engine Co., Ltd., China) to assess the performance of using AE measurements for lubrication conditions monitoring. The single-cylinder engine has less AE events compared with a multiple cylinder engine without interference from other cylinders, which allows the tribological weak AE to be analysed accurately. The key specification of the test engine is given in Table 1. The engine is coupled with an eddy current dynamometer and a controller (Chengbang, China, Model: DW 160). Engine speed and load are controlled by varying excitation current to the eddy current dynamometer. Figure 3 illustrates the basic construction of the engine, engine test system and location of the AE sensor.
An SR800 wideband AE sensor from Soundwel Technology Co., Ltd [32] is mounted on the external surface of the cylinder body to measure AE responses. Considering the properties of basic AE wave propagations, the sensor is closer to the cylinder head where the main transmission path causes less wave attenuation due to the tight fitting between the upper edge of the cylinder liner and the engine body. In addition, the sensor position is more accessible for most engines, which means that it is convenient for achieving online monitoring. The nominated band of the sensor is up to 1 MHz. However, based on its calibration chart in Figure 4, it was found that the frequency response in the band from 20 kHz and 400 kHz was significantly higher. A number of trial tests also showed that AE signals of interest were more significant below 250 kHz. Therefore, the frequency band in this study was focused around 20 kHz to 400 kHz.
Three types of engine lubricating oils were tested when the engine was operating under different loads and speeds detailed in Table 2. The first two tested oils (10W30 and 15W40) were new and taken as the baseline. They were used for verification of the models and signal analysis tools, along with an evaluation of AE sensitivity in differentiating the viscosities between these two oils. The third oil was a used oil that was collected from an automotive diesel engine after the vehicle had operated for about 10,000 km after its previous maintenance and was used for further verification of monitoring sensitivity and reliability.
AE signals for each type of lubricating oil were collected whilst under steady operating conditions of the engine as detailed in Table 2. The length of each recording was approximately 11 s, sampled continuously at a rate of 800 kHz, which covered over 100 engine working cycles of sufficient averages, thus obtaining reliable results. In addition, a top dead centre (TDC) reference signal was also recorded along with the AE signals such that the angular domain analysis can be implemented to associate AE signals with key engine events.

4. Tribological Monitoring Features from AE Signals
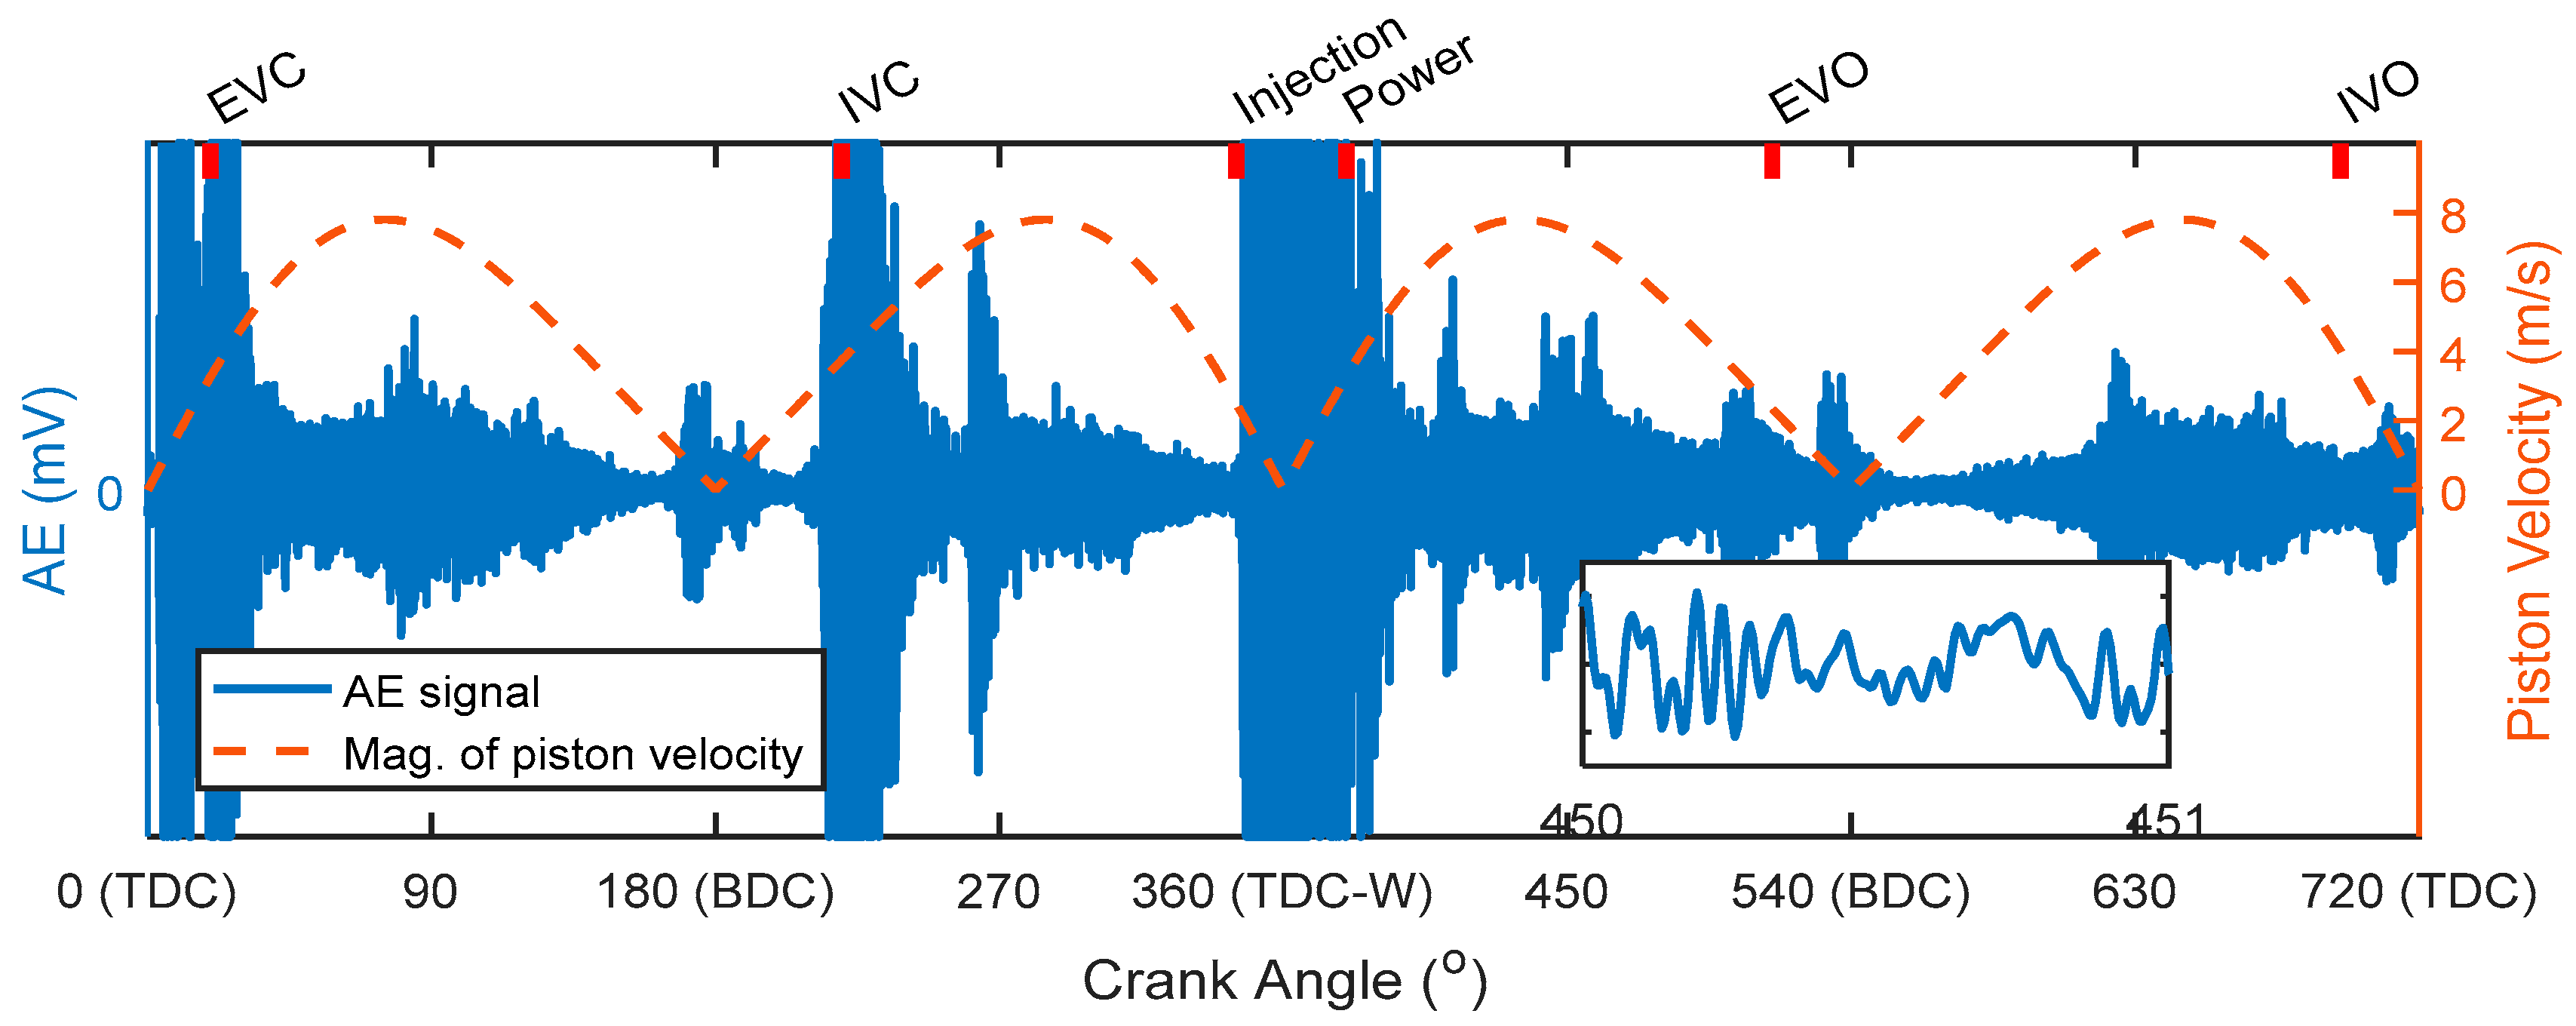
As shown in previous studies, the measured AE signal is inevitably influenced by various noises such as random instrument noise and other engine AE sources. These noises have to be suppressed in order to extract AE contents that correlate more with the engine tribological behaviours. Moreover, considering the high nonstationarity and large size of AE signals sampled at a high rate, the WPT analysis is employed in this work as it is more effective and efficient in dealing with these types of signals, especially when compared against widely used short time Fourier transform (STFT) and continuous wavelet transform (CWT). The WPT analysis has been explored extensively for signal feature extractions, such as EEG (electroencephalogram) signals [34] and AE signals [35]. Specifically, this technique is also widely used in condition monitoring and fault diagnosis in rotary mechanical systems such as generators [36], gears [37], bearings [38] and diesel engines [39,40]. Remarkably, Reference [41] developed a wavelet packet decomposition within the framework of multi-resolution analysis theory to investigate the failure of tribological systems using AE.

4.1. AE Signals

Figure 5 presents a typical AE signal in the angular domain for a complete engine cycle, which is obtained by calculating an angular displacement using the TDC signal and then interpolating AE signals at constant angular intervals with a cubic spline. According to engine operation process, the signal in the angular domain allows the major AE events to be attributed sequentially to the excitations due to exhaust valve closing (EVC), inlet valve closing (IVC), and fuel injection, combustion shocks, exhaust valve open (EVO) and inlet valve opening (IVO). Each of them exhibits strong AE bursts and reflects the short impulses of the sources, whose characteristics can be used as the basis for diagnosing the behaviour of valve operations [9], fuel injection [10] and combustion qualities [11].
Moreover, Figure 5 also shows quasi-continuous weak AE activities in the middle of each engine stroke. Their amplitudes change in accordance with the profile of the piston velocity, showing the strong correlation with the tribological behaviour between the ring and liner. Reference [17] has demonstrated that these weak AE activities result from a combined effect of asperity contact, lubricant flow and/or blow-by, and demonstrated that the average RMS can be an indicator for extreme operating cases of turning-off lube-oil supplies. To utilise these AE components for more accurate condition monitoring of the lubrication process, the References [19,20] employed a discrete wavelet transform (DWT) to further highlight the AE contents relating to the tribological process and succeeded in creating small differences between oils with different lubricant viscosities.
However, in addition to the known influences, including valve landing, fuel injection and combustion, the weak AE can also be affected by a series of other lesser known excitations in a running engine, which can be oil supply turbulences and throttle valve impacts, bearing clearance impacts, cam and bearing tribological AE, debris collisions of combustion residual or soot, etc. These influences can cause more difficulties to successfully separate the weak AE content from the undesirable signals. Measured AE signals can also be influenced by AE transmission paths and noise in AE measure systems. Particularly, the dynamic responses of the wide-band AE sensors usually have larger tolerances in their measurement bandwidth, which can magnify the responses in the bands with clear resonance effects whilst also suppressing responses in the bands with lower resonance amplification. This means that more effective approaches are required to characterise AE signals more extensively such that the weak AE contents that correlate more to the tribological process can be extracted accurately to reliably indicate the behaviour of the lubrication conditions between the ring and the liner.

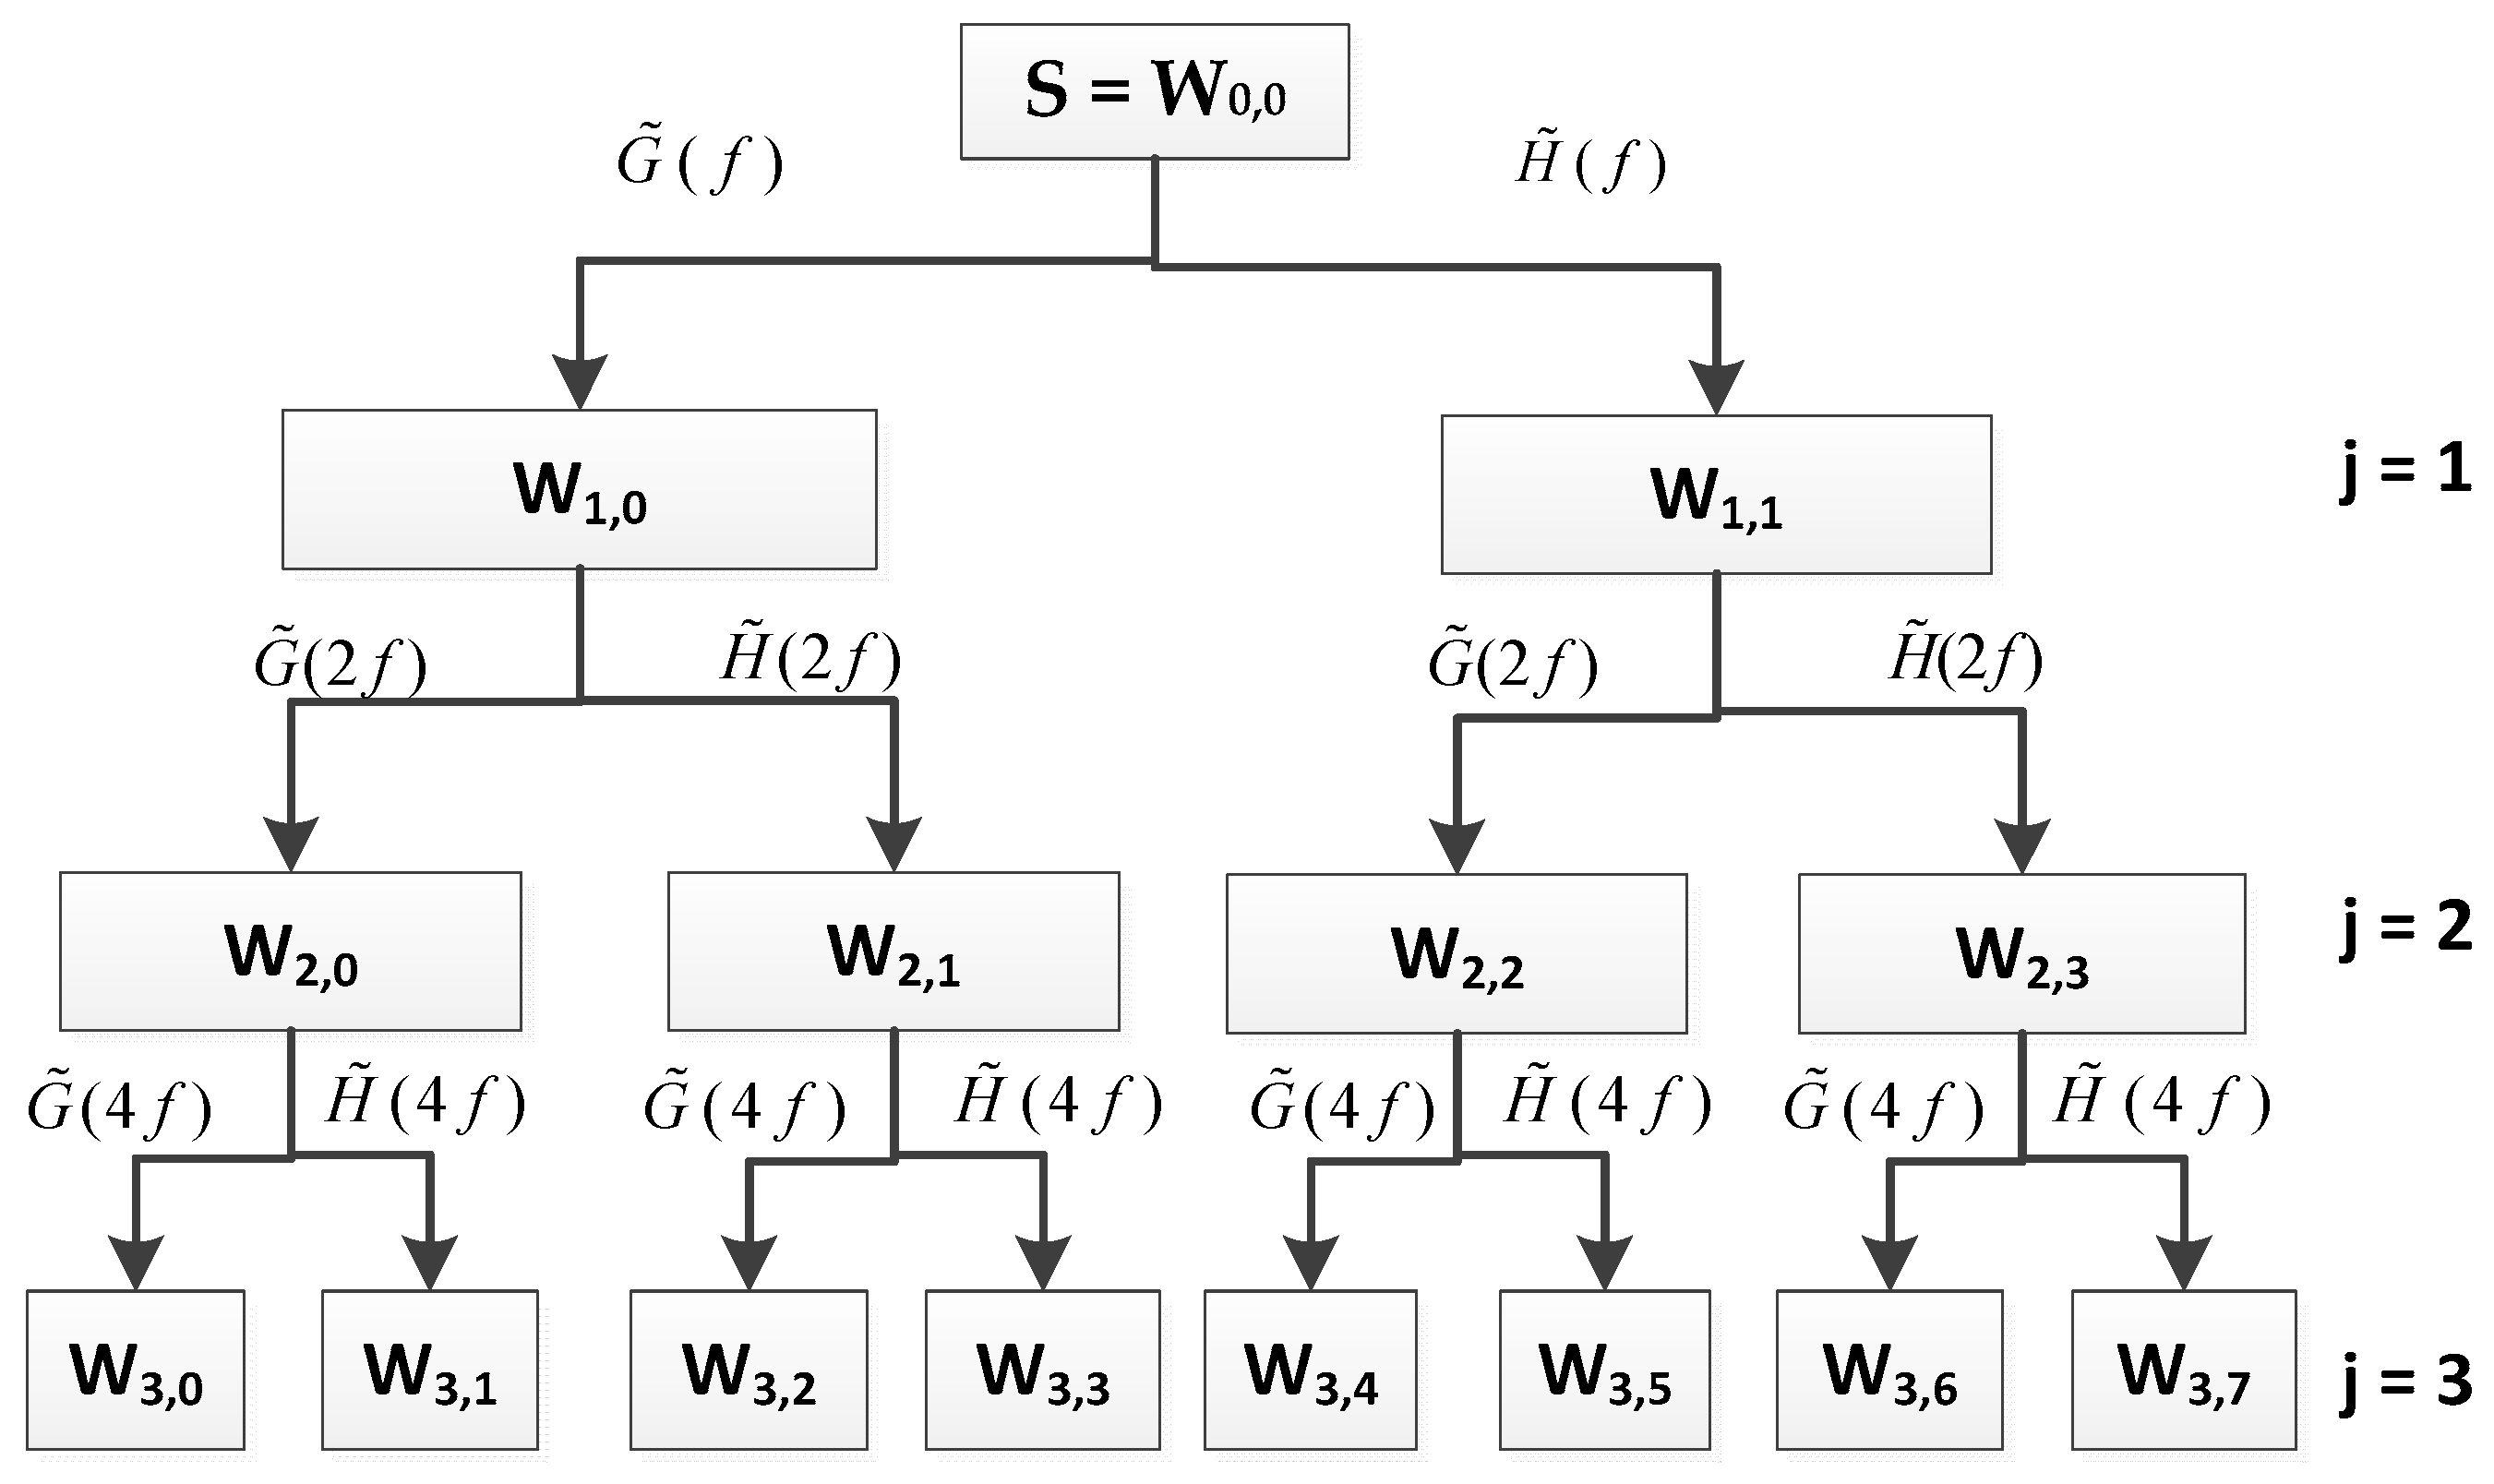
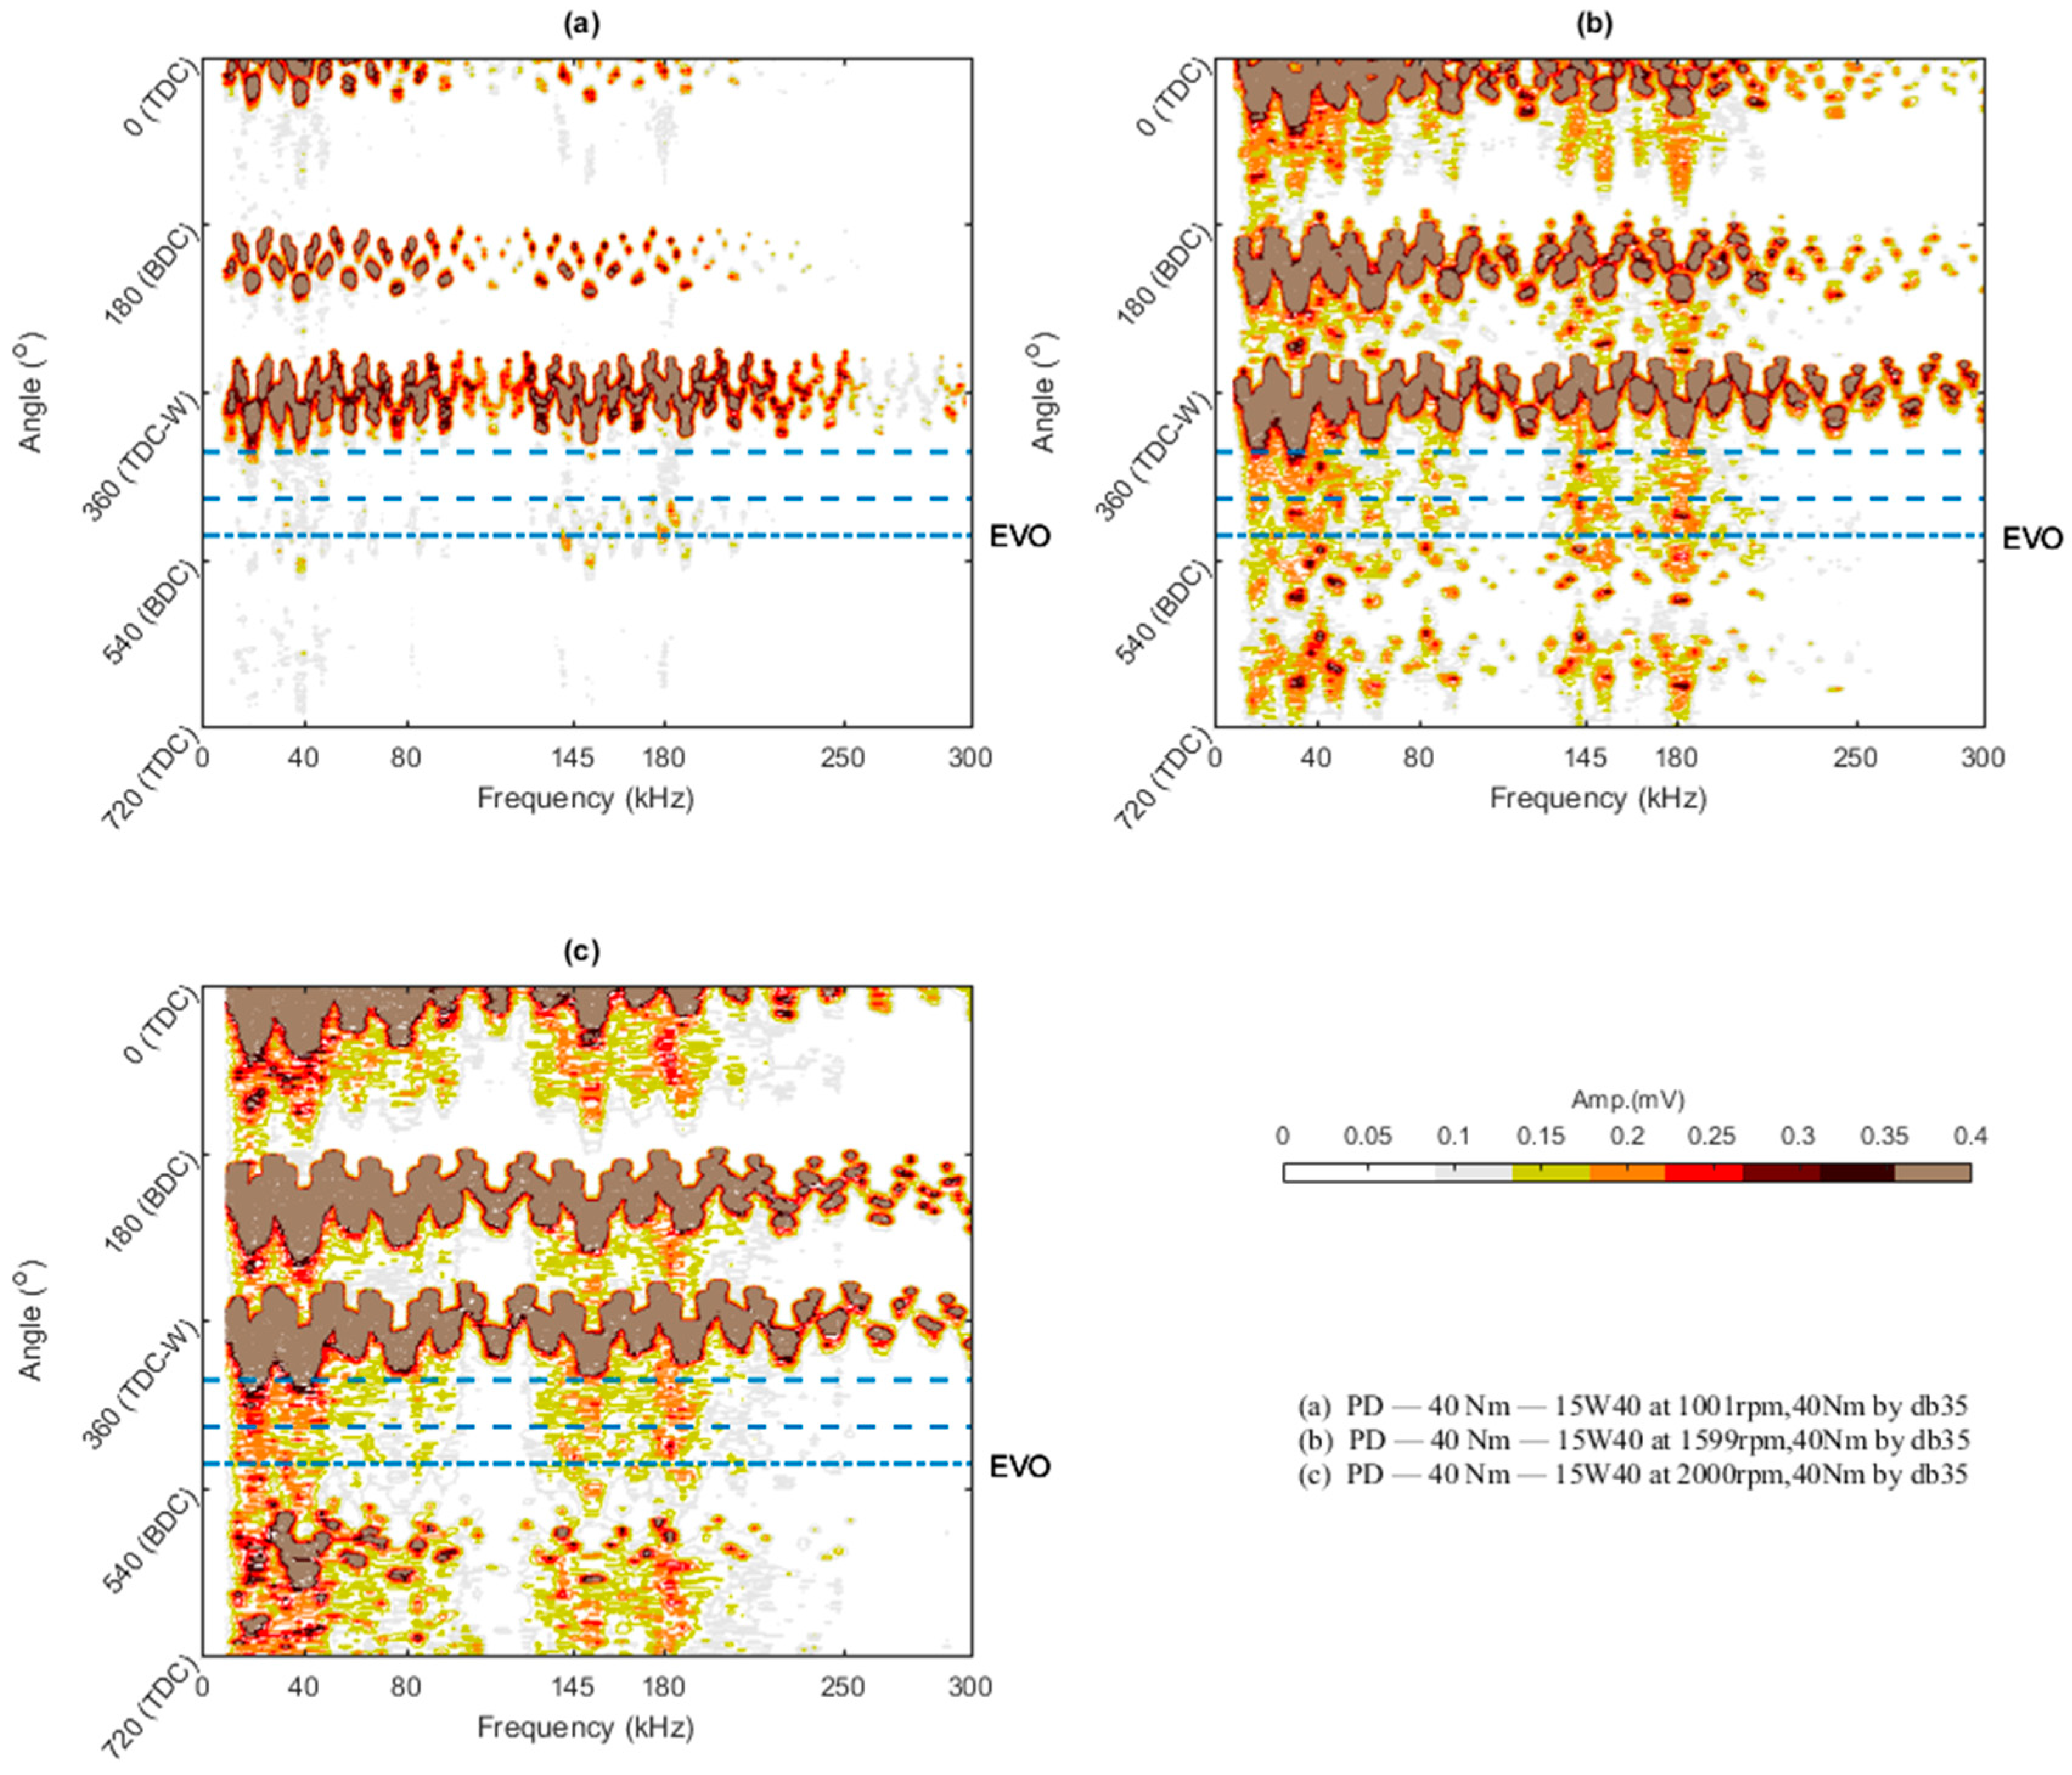
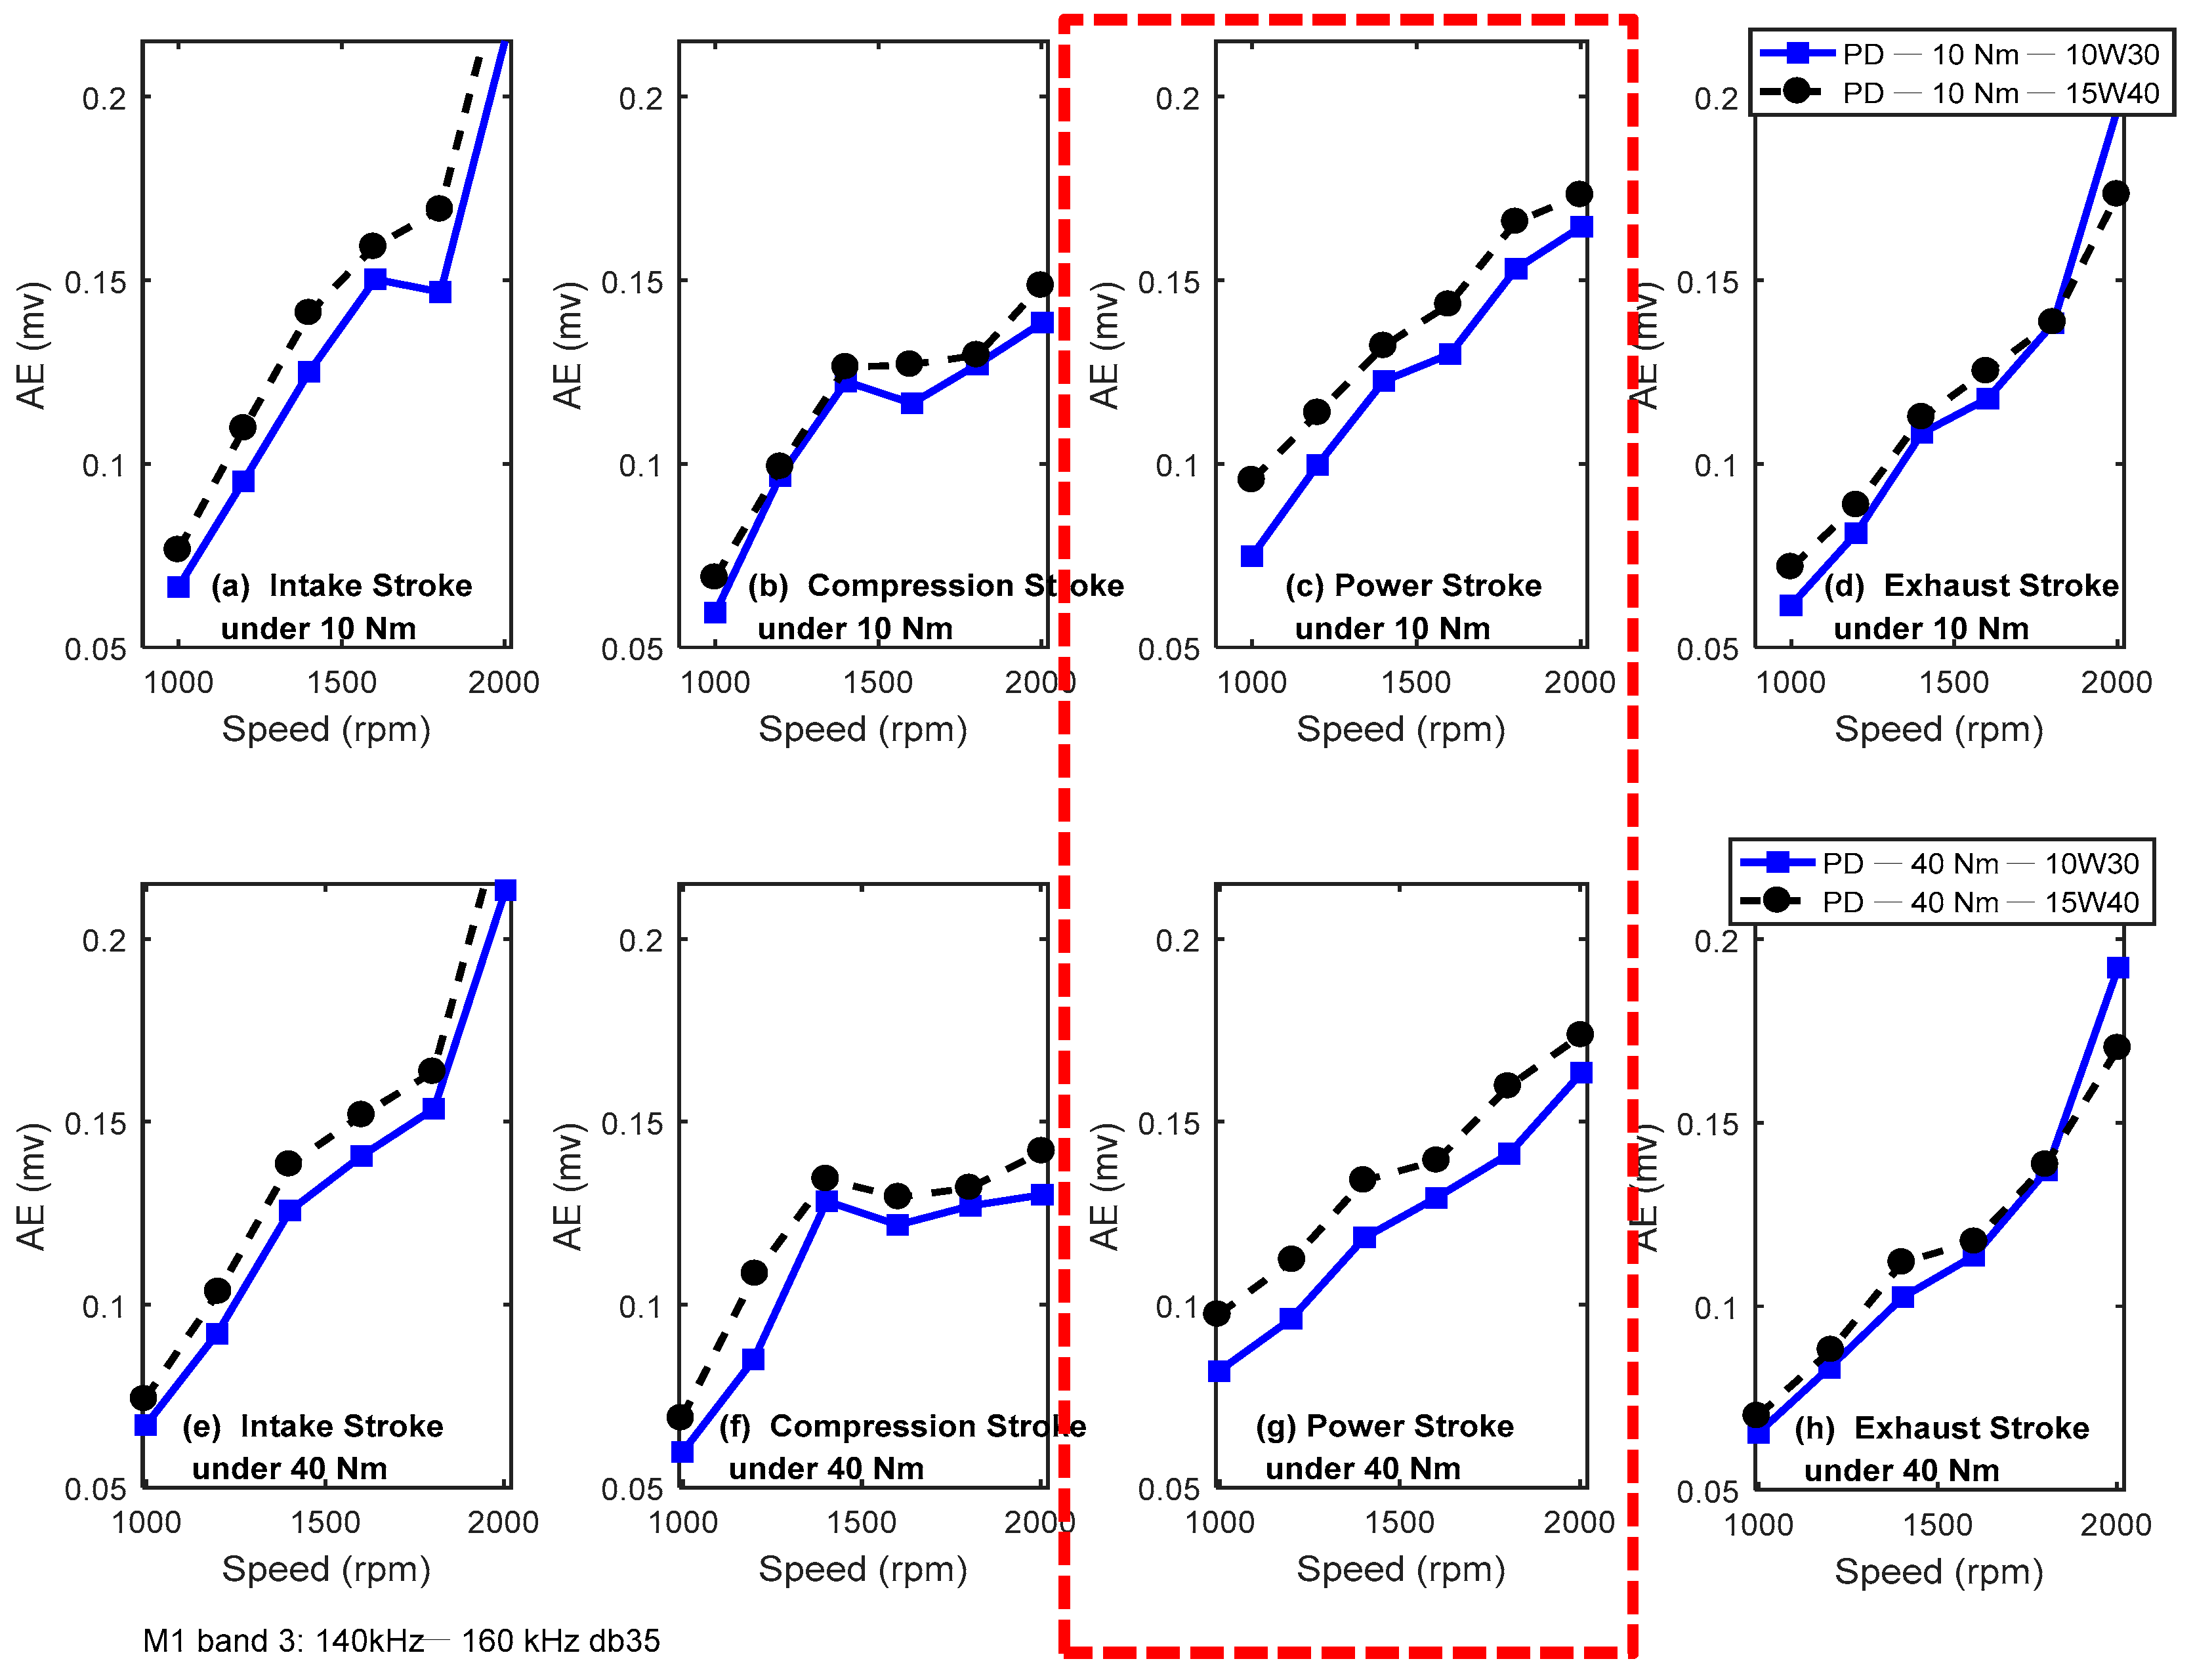
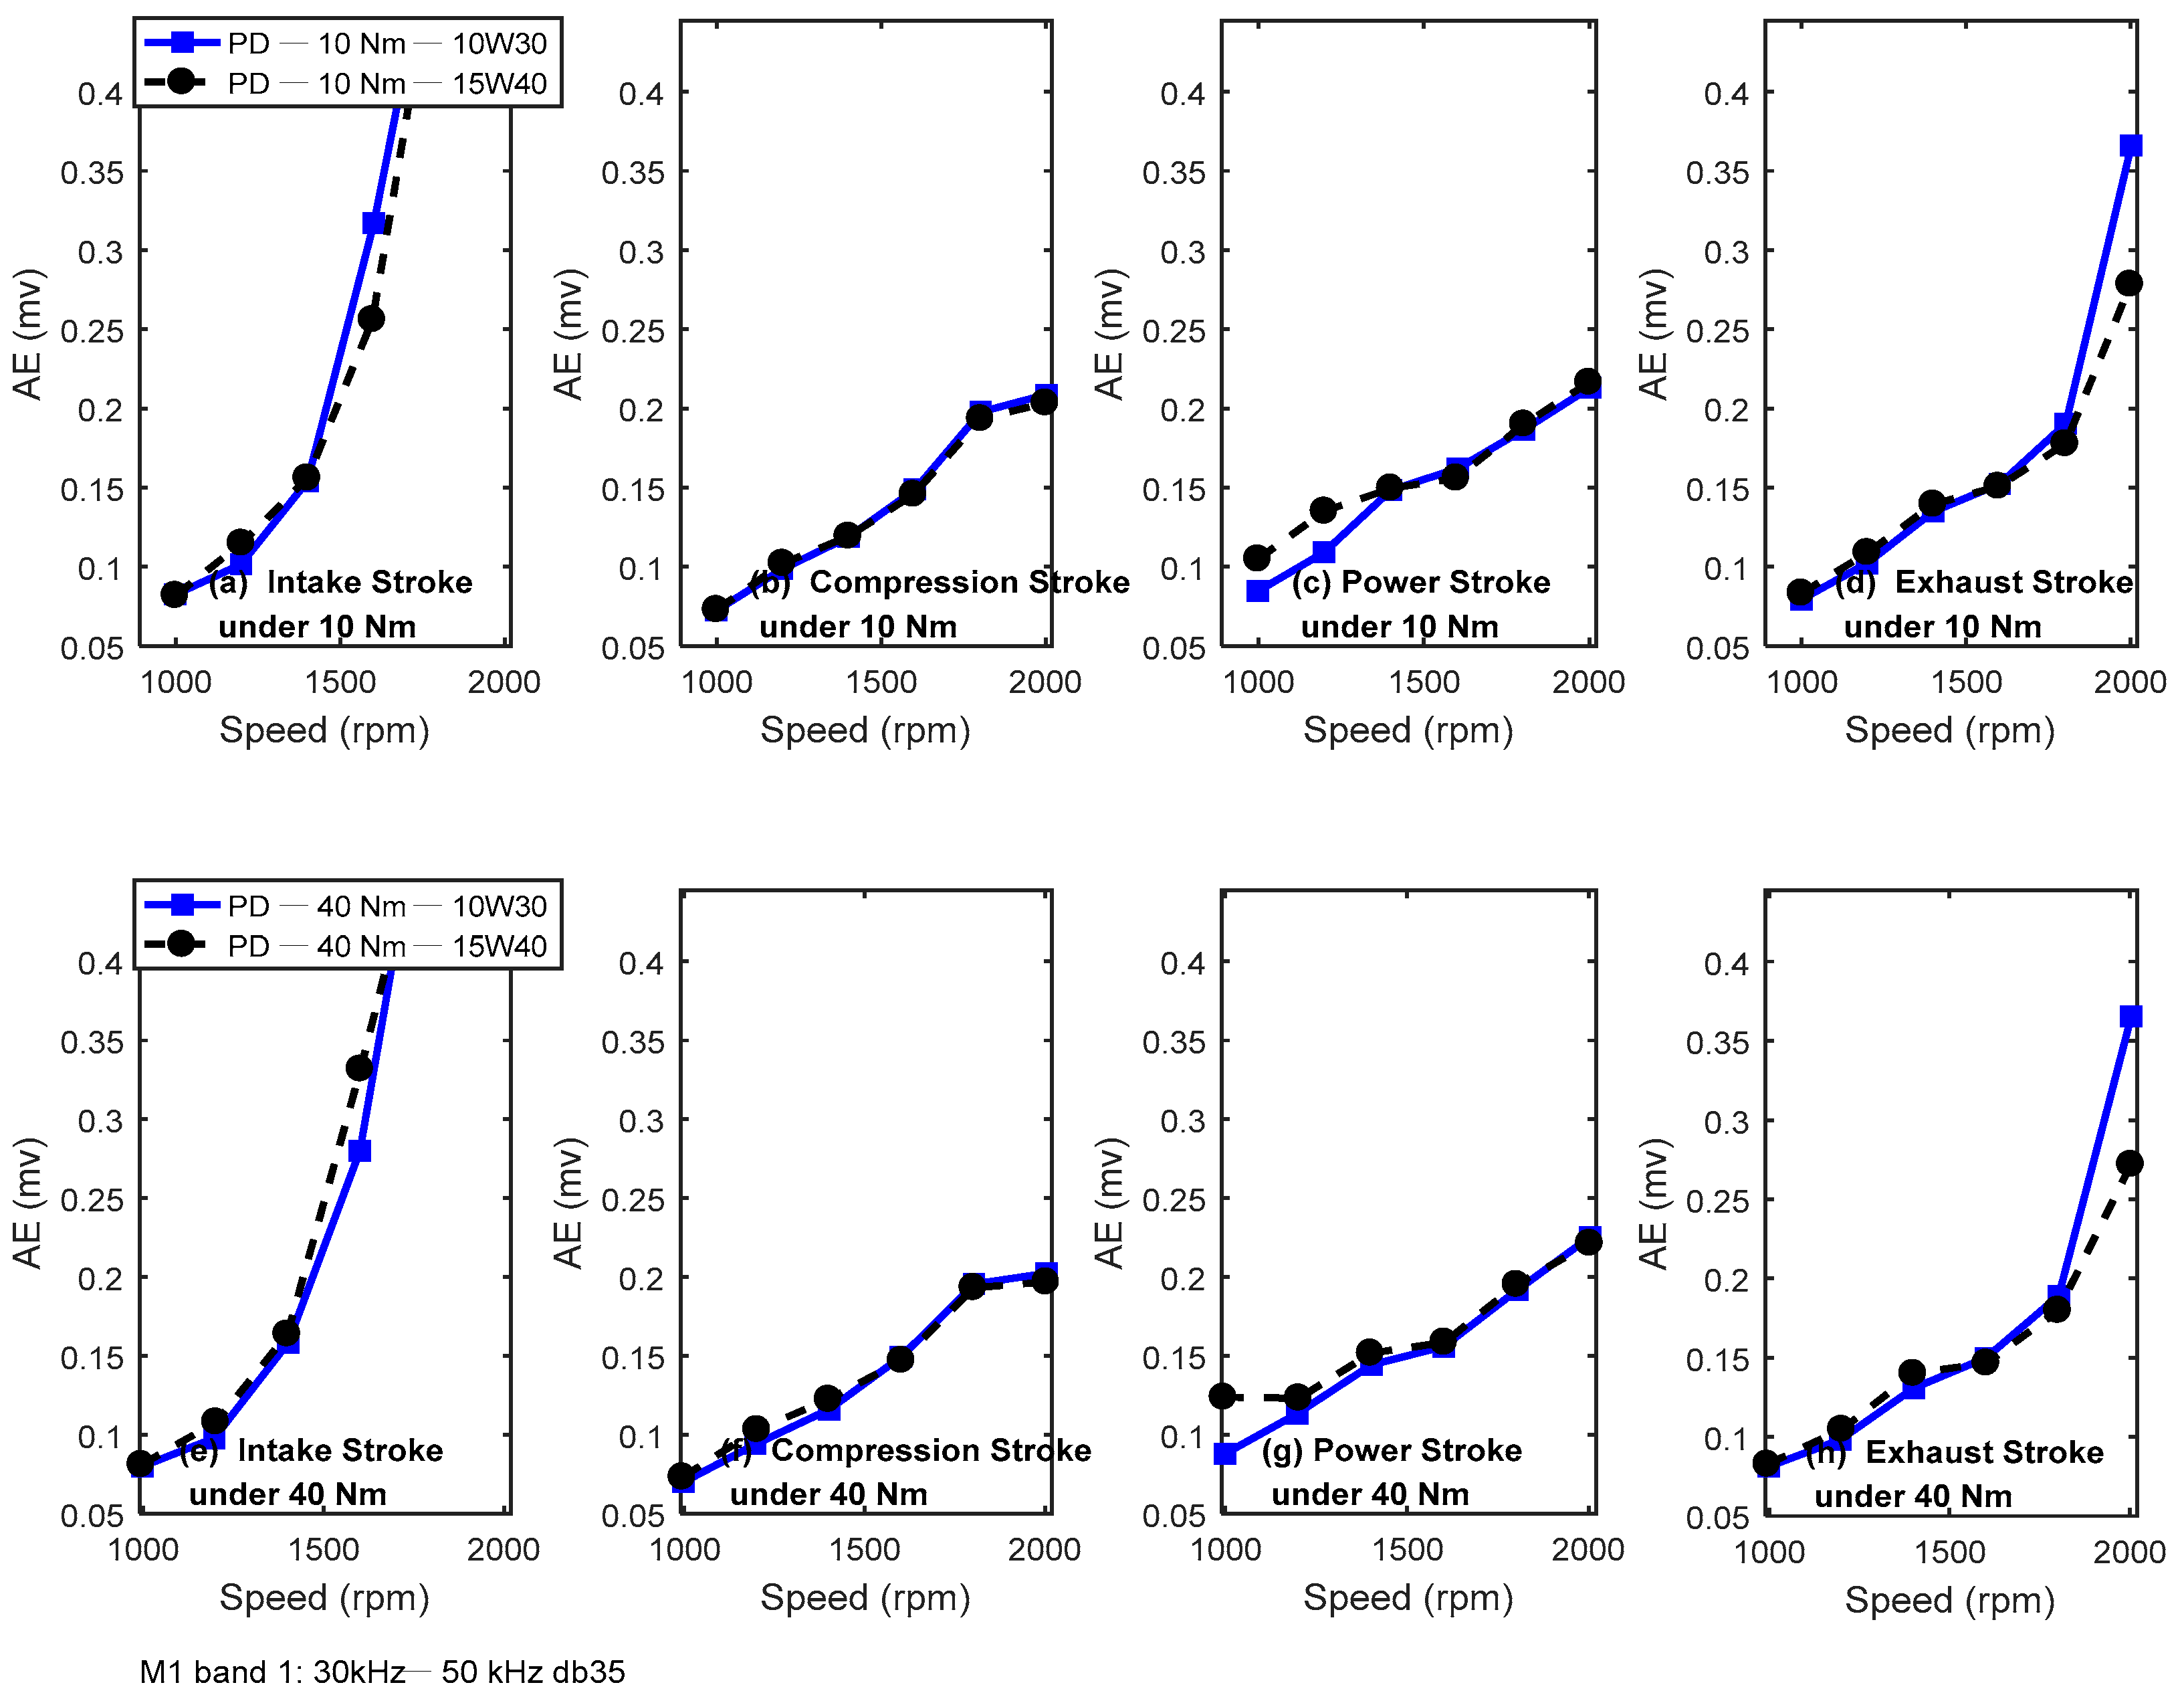
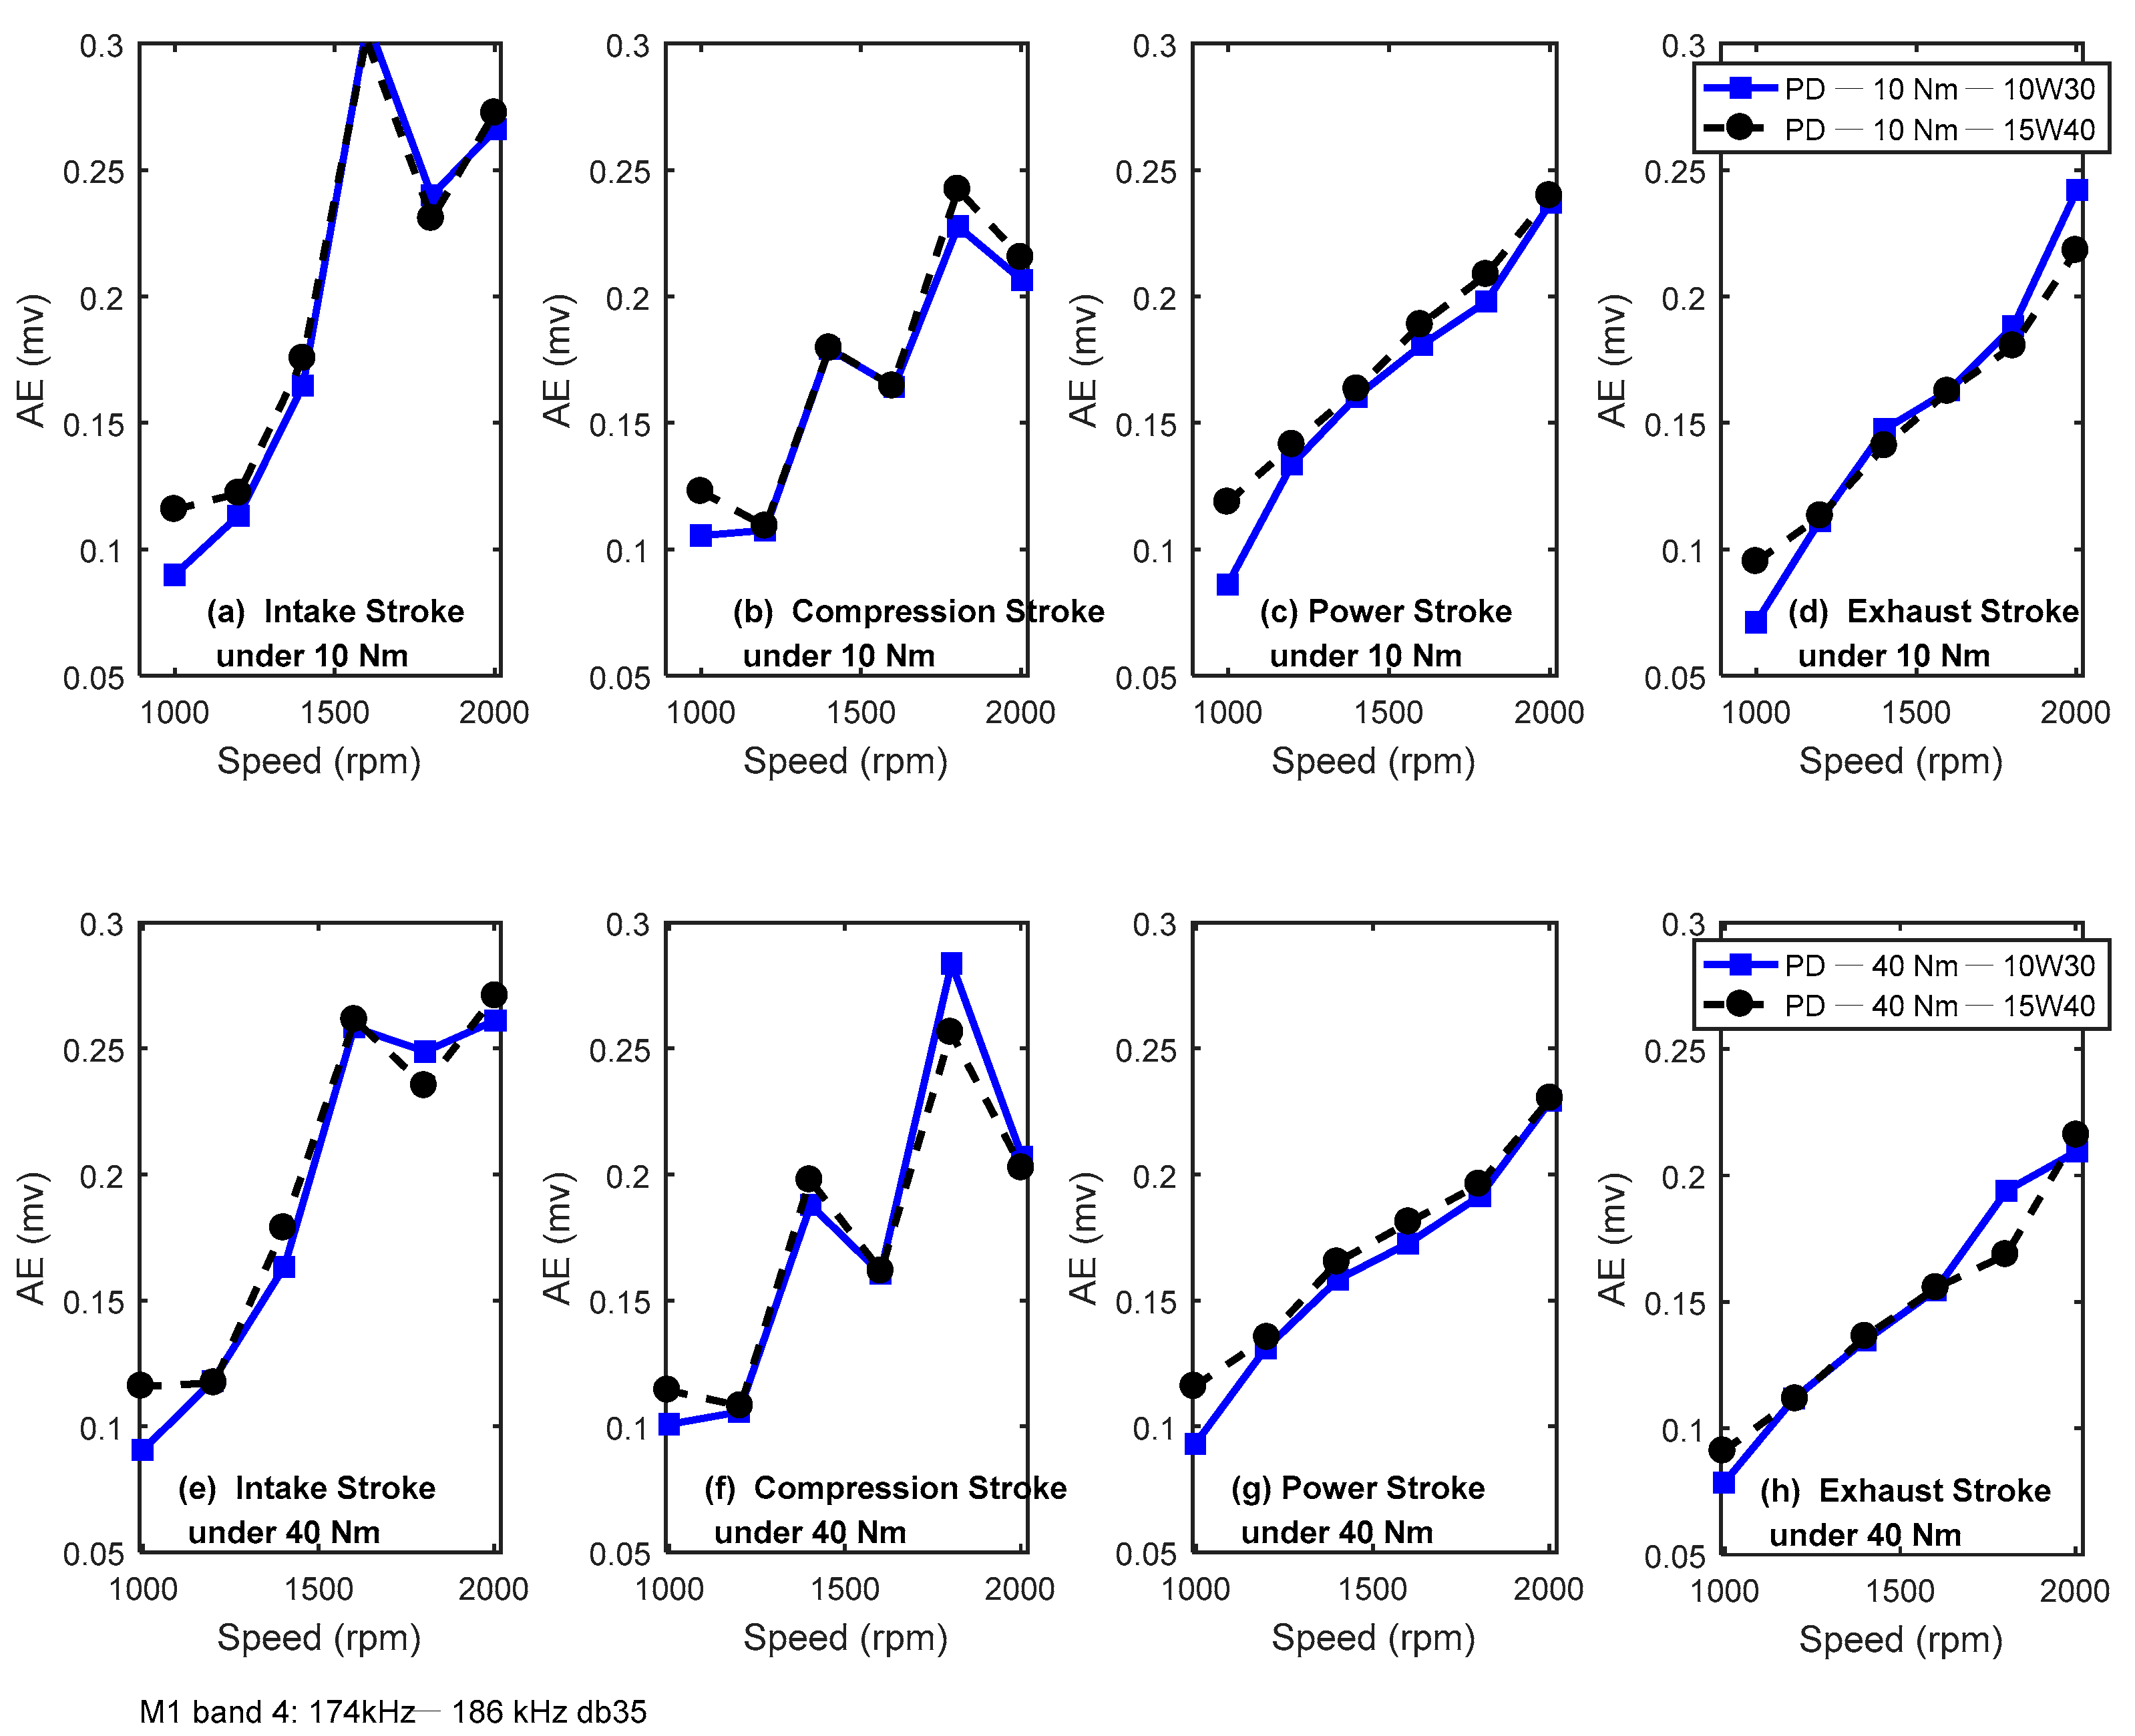
4.2. Wavelet Packet Transform Spectrum

Wavelet packet transform (WPT), developed by Coifman, Meyer and Wickerhauser in 1992, can decompose all the approximate and detailed information to a desired level [42], as illustrated by the full wavelet packet tree down to level 3 in Figure 6, which results in a narrow and equal-width sub-band filtering of AE signals as opposed to the coarser octave band filtering found in the DWT. Consequently, this offers a wealth of information for characterising a complex non-stationary signal. In particular, at the Jth level of WPT, the frequency axis can be expressed as ( n F s 2 J , ( n + 1 ) F s 2 J ) , n = 0,1,2,3, … 2J-1, where Fs is the sampling frequency. This finer sub-band-based representation makes WPT analysis significantly superior over DWT in that WPT allows more detailed characterisation of the content in the AE signals and hence provides more detailed features for differentiating small changes in the tribological behaviour. Along with the advantages of many types of wavelets available for selection, it is possible to represent the signal to a much better degree of sparsity and allows key and stable features to be enhanced from random noise components.
A more efficient analysis based on WPT is the WPT spectrum, which presents the absolute values of the coefficients from the frequency and time ordered terminal nodes of the input binary wavelet packet tree [43]. As a result, the WPT spectrum shows more flexible time–frequency resolutions, which can be more effective and efficient for characterising AE signals with complex contents of larger data sizes compared with conventional DWT, which provides too coarse a frequency resolution. CWT has to be implemented with high computational complexity and classic Fourier basis representations, such as STFT, which is considerably less efficient to represent the AE signals with high non-stationarity.
Figure 7 presents representative WPT spectra for a baseline lubrication oil (15W40) with the engine running at different speeds under a constant torque of 40 Nm. Based on a widely accepted principle that the asymmetric and gradual attenuation profile of the Daubechies (db) wavelet can effectively highlight the weak AE contents with similar asymmetric characteristics that are illustrated in the magnified graph in Figure 5, Daubechies (db) wavelets are used for calculating the WPT spectrum. Especially, the Daubechies wavelets have been widely demonstrated to be effective in processing vibration and AE signals for data compression, denoising, classification and feature fusions [44]. Furthermore, there are many different orders of smaller wavelets available in the Daubechies wavelet family for different applications. By minimising the overlap effects in the time domain and frequency domain simultaneously, this study has found that a db35 (or 35 vanishing moments) wavelet is found to be optimal to decompose the AE signals at the level j = 8 for highlighting the weak AE content.
As shown in Figure 7, these WPT analysis parameters result in adequate WPT spectra at different engine speeds. They allow the spectrum peaks to be observed in several discrete frequency bands around 40 kHz, 80 kHz, 145 kHz, 180 kHz and 250 kHz. Spectral peaks in these frequencies appear in the middle of the power and exhaust strokes and become more significant with engine speeds, which is in good agreement with the tribological behaviours predicted using the FAS model, and is regarded as the AE content for indicating lubrication conditions.
Figure 7 also shows that AE induced by combustion and valve opening and closing impacts spread continuously over much wider frequency bands with very high amplitudes, which fully reflects the feature of short duration impact behaviour as predicted by the AAC model. Particularly, the impacts from the combustion show much stronger AE responses and spread across wider bands, which are useful for separating it from the others when performing combustion diagnosis.
In addition, in the low frequency range from 0 to 40 kHz, there are many discrete AE spikes. Although they increase with engine speeds, they do not show a higher amplitude in the middle of strokes, as shown in Figure 7. Therefore, they may come from other remote AE sources, such as cam-followers and bearing junctions, rather than the ring–liner conjunction of interest. Obviously, it is not very accurate to include these spikes for the quantitative indication of the tribological conditions between the ring and liner. The detailed results obtained by WPT spectrum cannot be achieved using the coarse analysis of DWT, which is one of the reasons that DWT could not produce a very consistent result in differentiating the lubricating conditions over a wide range of engine operations [20,21].

5. Diagnosis of Lubrication Conditions

To verify the optimised wavelet for diagnosing lubrication conditions, WPT spectra are calculated for all different tested oil cases and operating conditions using db35 wavelet. The average wavelet amplitudes are calculated as the condition indicators fall into four characteristic bands: 30 kHz–50 kHz, 70 kHz–80 kHz, 140 kHz–160 kHz and 174 kHz–186 kHz. It is identified in Figure 6 of Section 4.2 that AE amplitudes were more significant and hence allowed the tribological behaviours to be quantified with greater accuracy as the noise to signal ratio (SNR) was higher when compared with the band around 250 kHz. AE indicators in other strokes were also calculated within the angular periods in which the tribological AE contents were understood to be more significant and less affected by major AE events of valve impacts and other potential AE, including cam frictions. These indicators can be used as references for an evaluation of the optimised indicator obtained in the power stroke.

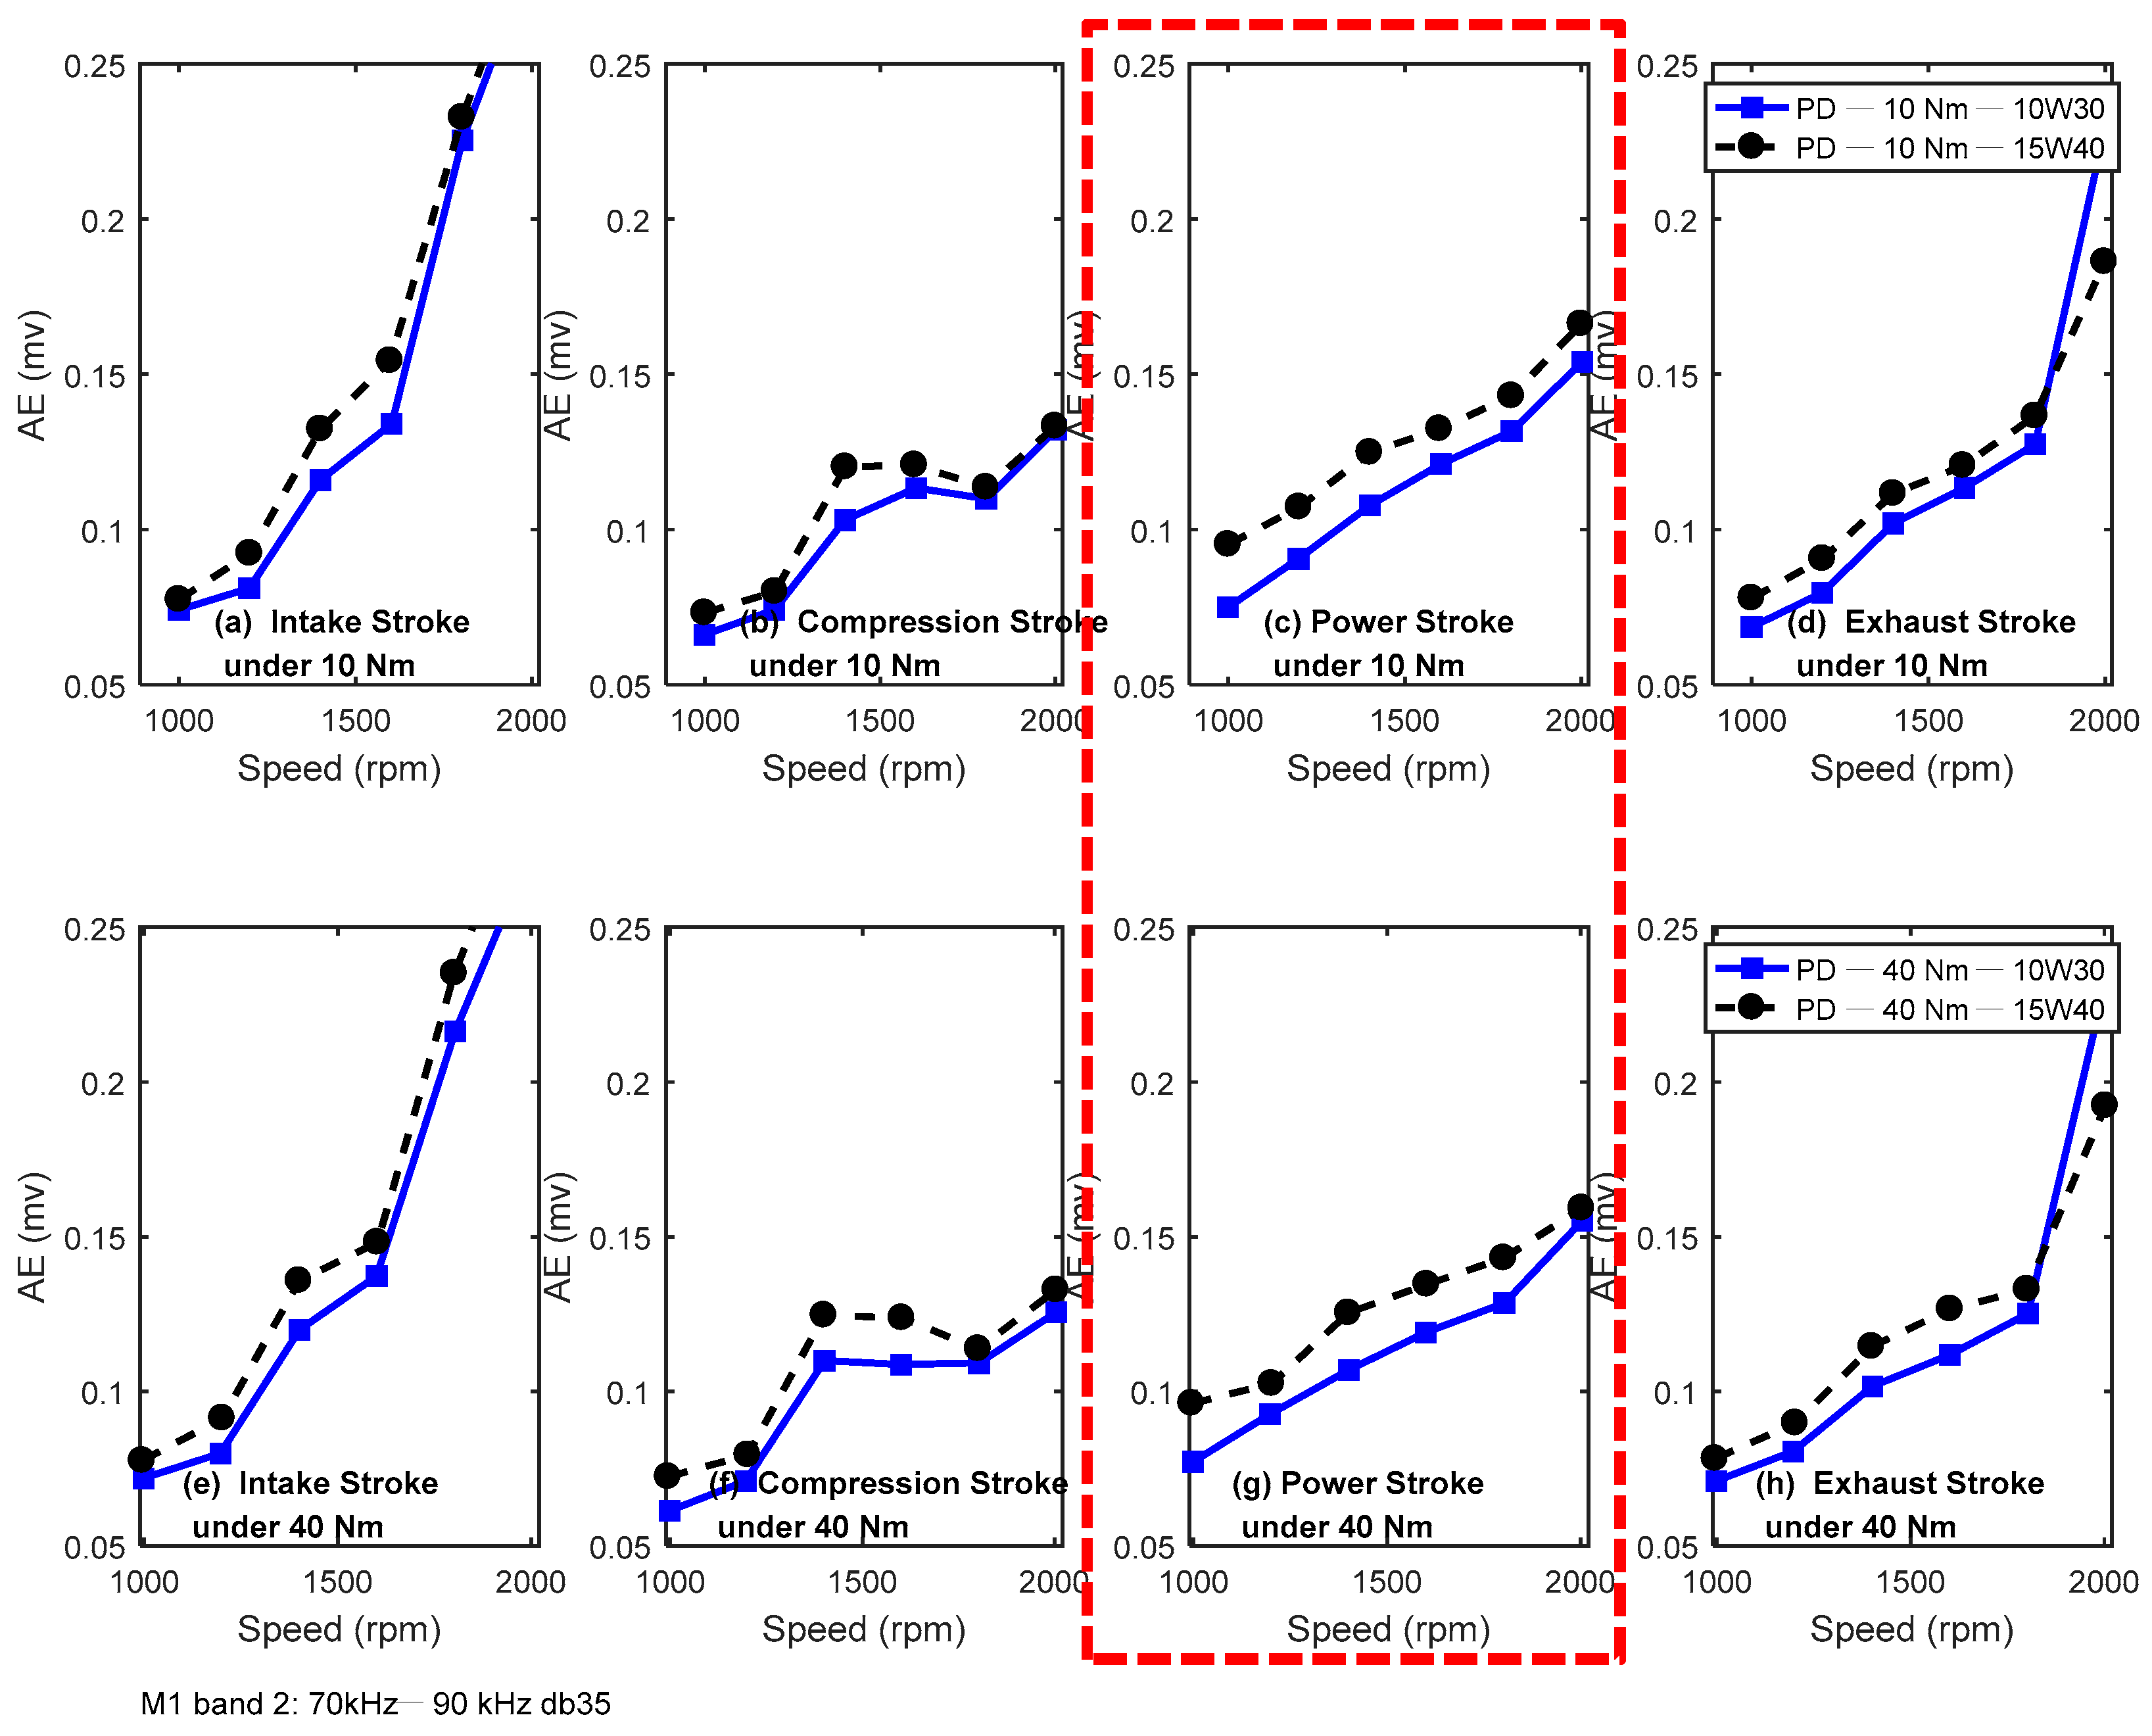
5.1. AE Differences between Two Baseline Oils

Figure 8 and Figure 9 show the differences of AE indicators between two tested baseline oils: 15W40 and 10W30 in two frequency bands: 70 kHz–90 kHz and 140 kHz–160 kHz, respectively, in which the indicator showed better performance in differentiating different oils that were predicted based on the AE models established in Section 2. It can be seen in these two bands that AE responses increased monotonically with engine speeds, showing a agreeable connection with model predictions and engine viscous friction characteristics. Particularly, the AE indicator in the power stroke showed a better linear connection. These results showed a higher degree of agreement with the prediction from the FAS model for the conjunction between the ring and liner.
AE responses in the power stroke for 15W40 oil with higher viscosity exhibited greater amplitudes than 10W30 with lower viscosity. This indicates further that AE responses behaved very close to the model prediction, demonstrating that the externally measured AE signals were sufficiently sensitive to small changes in the properties of lubricants. In particular, both bands gave consistent results so they can, therefore, be used as a reliable source to detect and diagnose the deterioration of lubricating oils.
However, AE responses in other strokes presented more fluctuating increases with speed and provided smaller differences between the two oils. The main reason for the lack of diagnostic capabilities in these strokes is that the wavelets used were not optimal for these strokes. The AE indicators based on WPT were more erroneous because different degrees of overlap effects could happen under different operating conditions. Another possible influence is that AE responses in these strokes could be more greatly influenced by the tribological dynamics of other lubrication conjunctions, which include the valve landing impacts and AACs from the conjunctions of the cam-follower and the valve-rocker. Nevertheless, these results show a potential for using AE to diagnose the condition of valve trains, which can be a challenging research subject for further expanding AE diagnostic capabilities.
Figure 10 and Figure 11 present AE amplitude comparisons between the two tested baseline oils in the other two frequency bands: 30 kHz–50 kHz and 174 kHz–186 kHz. It can be seen that there was a marginal increase in the higher viscosity oil in the power stroke, although they all exhibited an increasing trend across all engine operating conditions, showing less sensitivity to oil changes. This was because the low frequency AE could be more greatly influenced by other sources far away from the sensor, such as the cam-follower and bearing conjunctions, because at these lower frequencies, AE contents were less attenuated with wave propagation distances. Similarly, because of more attenuation in the very high frequency band of 174 kHz–186 kHz, the small changes in AE from the liner–ring junction could not be reflected clearly in this band.
In general, the AE responses extracted in the power stroke through the optimized WPT allowed the small changes in oil viscosity to be consistently and reliably differentiated in two middle-frequency bands. This achievement can be satisfactory for monitoring the tribological behaviour of the ring–liner conjunction, and hence the lubrication conditions for entire engine lubrication.

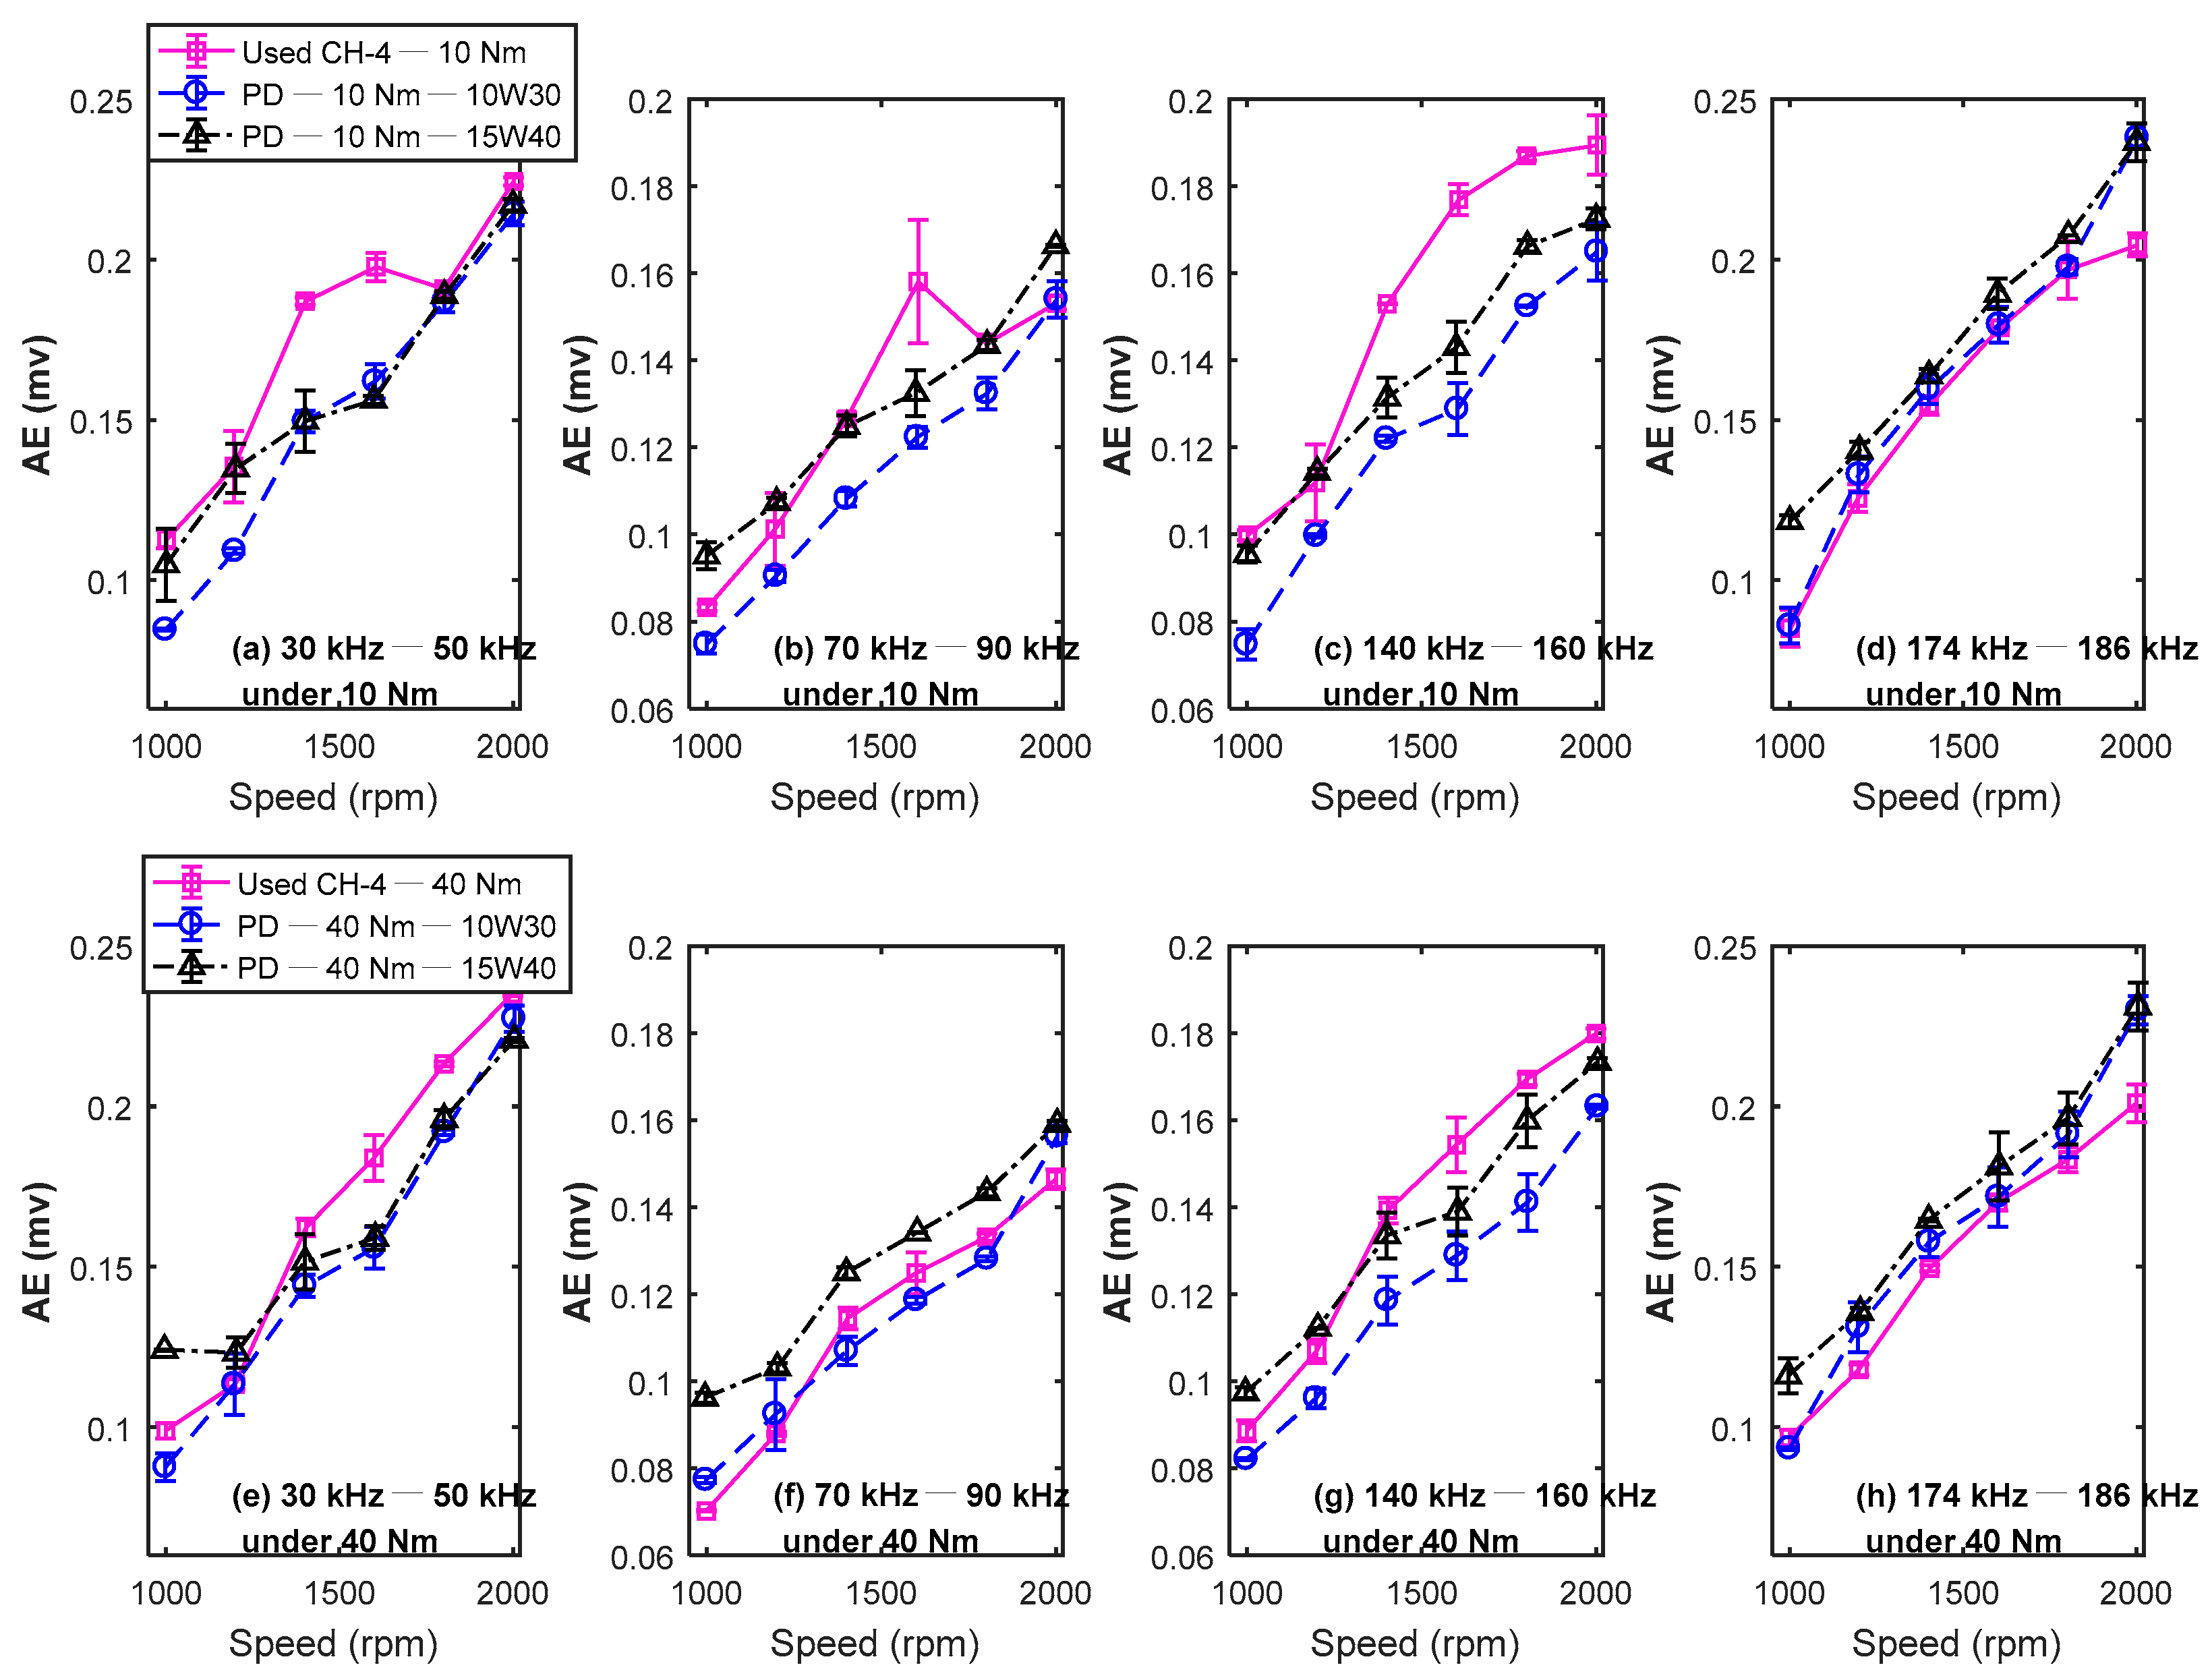
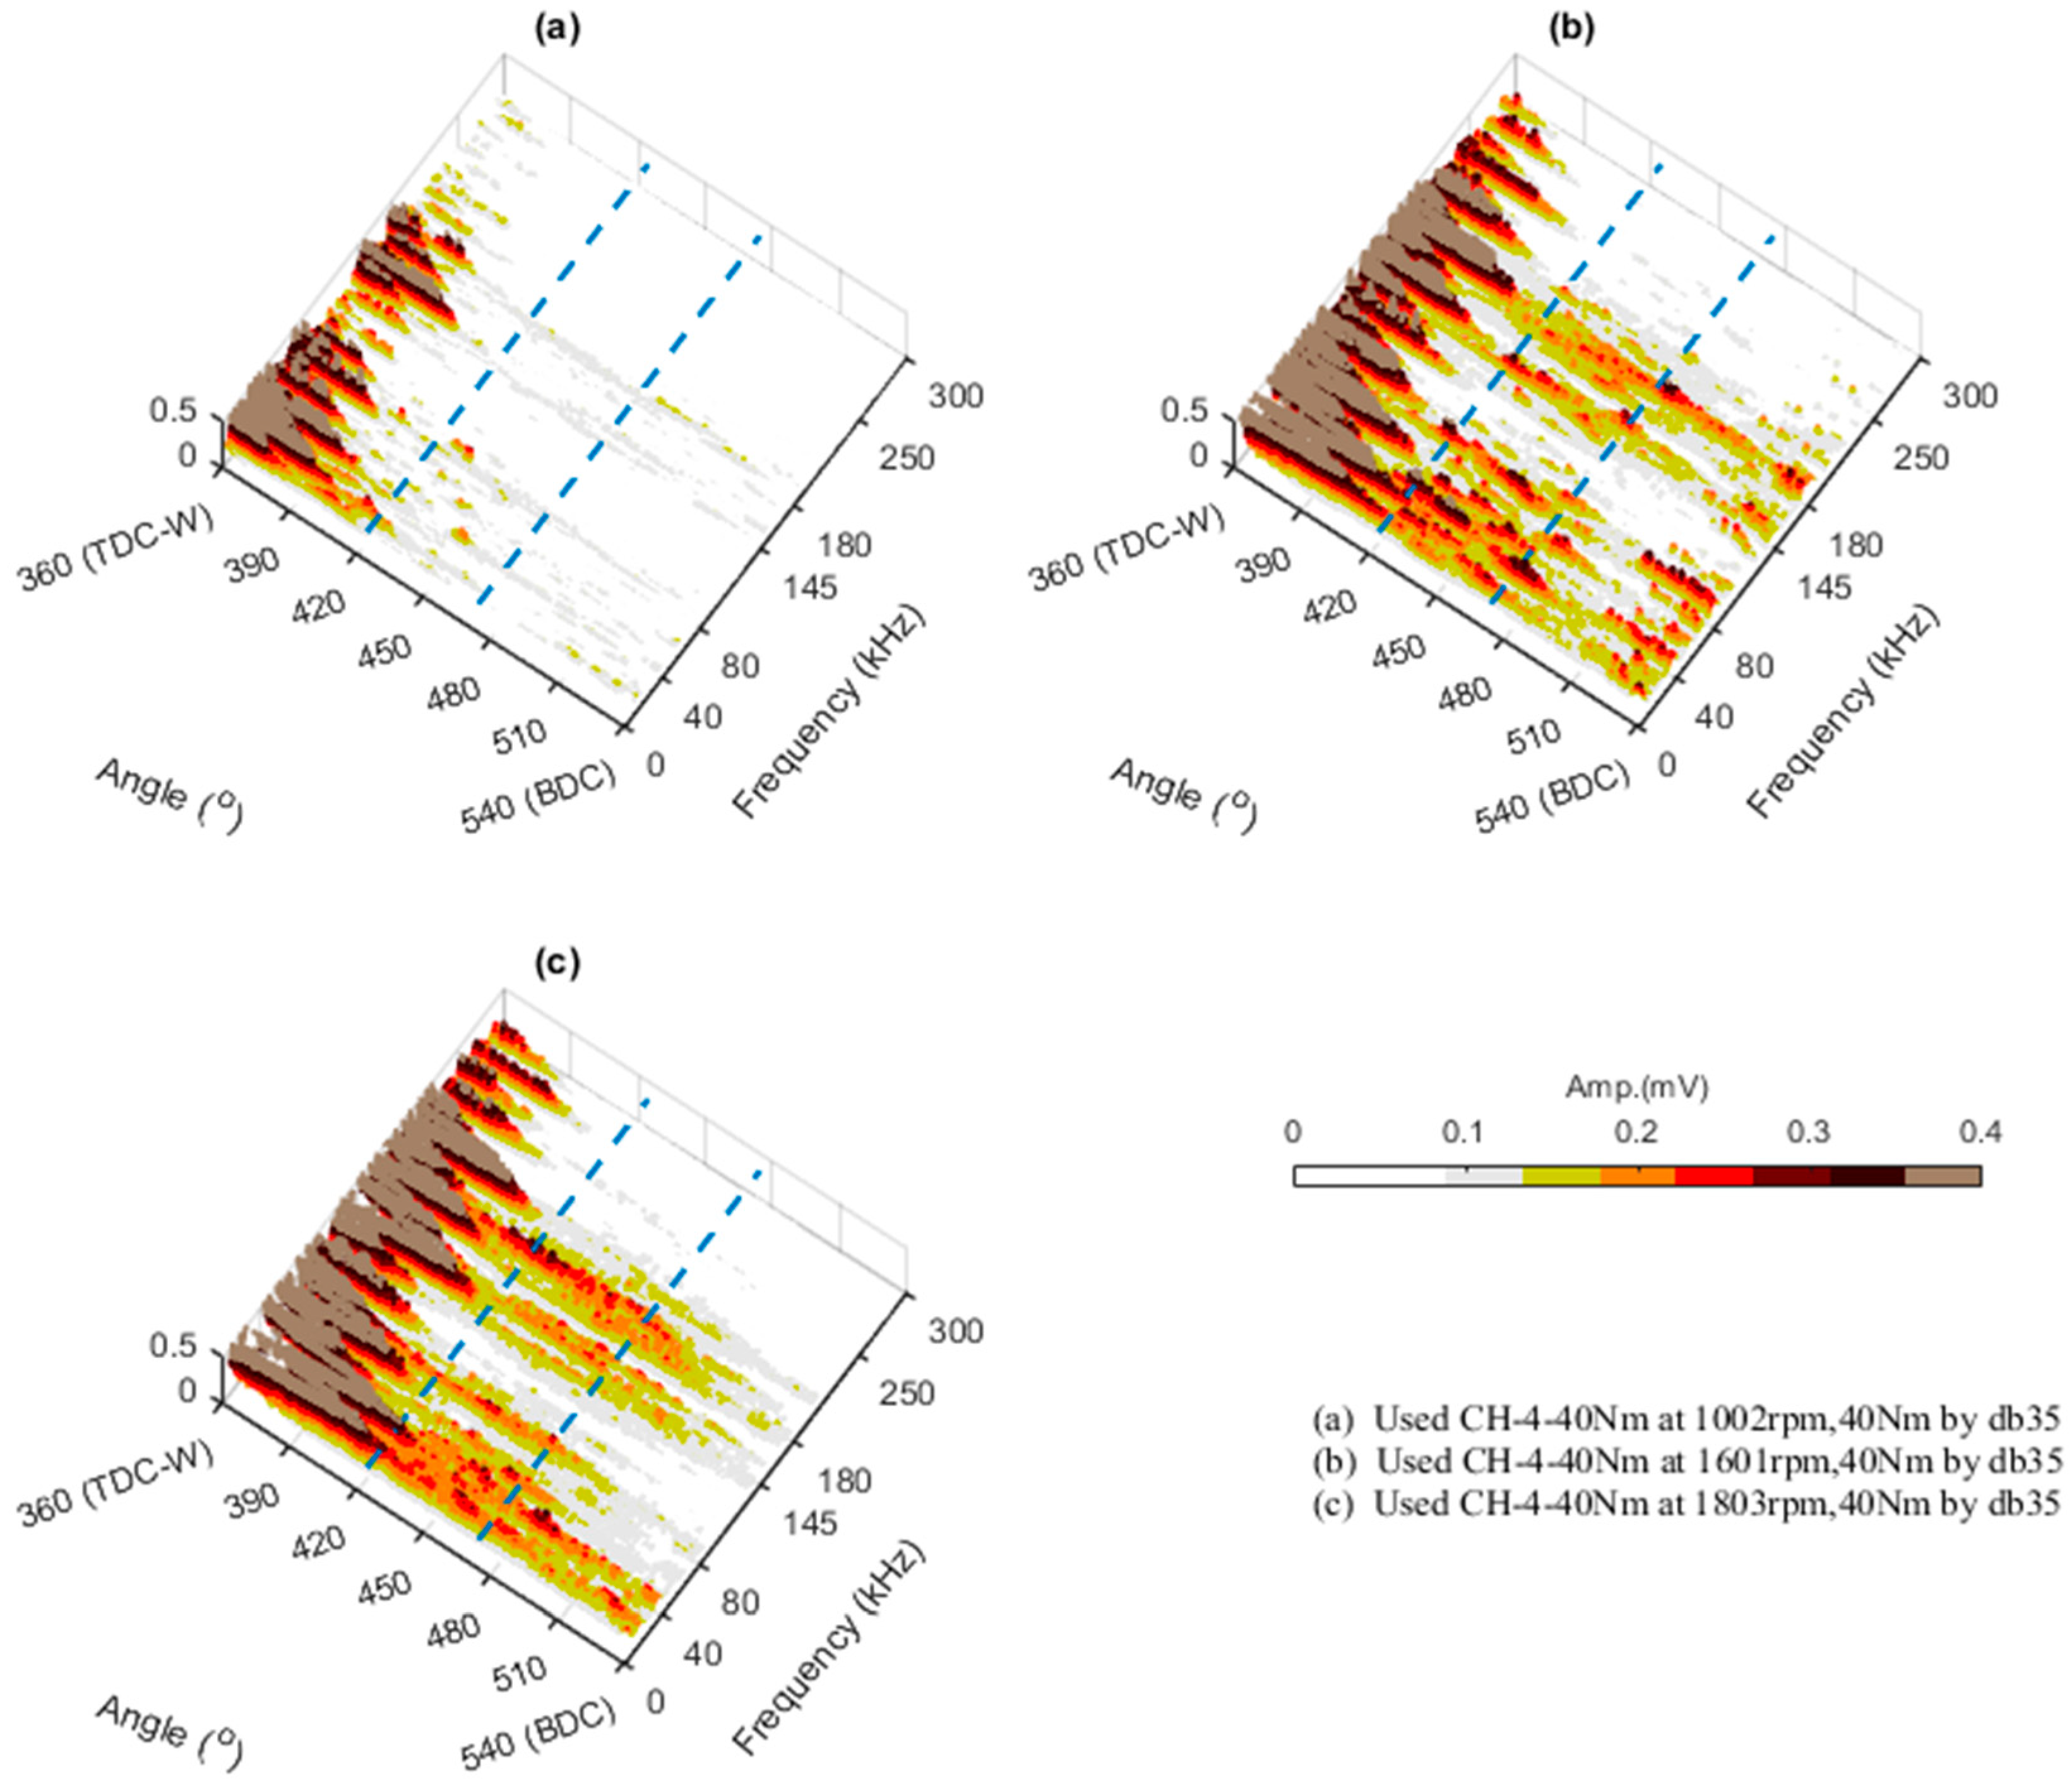
5.2. Diagnostics of Used Oil

To further verify the diagnostic performance of using the AE responses extracted by the optimised WPT spectrum, a comparison of the AE indicators in the power strokes is made between the two baseline oils and the used oil. Figure 12 presents the comparison results for all interested frequency bands. In general, the AE responses from the used oil showed a more nonlinear increase in behaviour with engine speeds along with local jumps. This indicates that the lubrication condition was not very stable due to the combined effects of the oxidation at the high temperature and contamination by soot, water, wear particles and fuel [45]. This nonlinearity and instability can be an effective indicator of the degradation of lubricating oils.
In particular, the higher value of AE in the frequency bands of 30 kHz–50 kHz and 140 kHz–160 kHz at high speeds from 1400 rpm up was caused by the AAC effect of wear particles along with the increased viscosity owing to the formation of high molecular weight products, polymerization [3] and soot content [46]. Among these reasons, it is most probable that the wear particles were the most influential as they made the AE responses more nonstationary, as shown in Figure 13, where there are more local spectral peaks in the middle of the power stroke due to the occasional AAC effects between surface asperities and the particles as the entrainment oil flows may bring particles in and out of the ring–liner conjunction from time to time [47].
Moreover, AE in the other two bands, 70 kHz–90 kHz and 174 kHz–186 kHz, exhibited slightly lower amplitudes than that of lubricant 15W40, which is inconsistent with the FAS model in that the used oil with higher viscosity, shown in Table 2, should produce the higher AE. This inconsistency was also caused by the instability of lubrication because FAS effects can be weakened by local water evaporations and air bubbles [48] when their sizes match with the wavelengths in these two bands. This also shows that the measurement of oil viscosity [3] is not very reliable to determine the lubrication conditions or running engines.
These diversities of changes in AE amplitudes in different bands can also be effective indicators of the degradation of lubricating oils, as the deviations from linear trends can provide additional reliable information for differentiating between baseline oils and used oils.

6. Conclusions

AE responses from the tribological conjunction of the ring–liner have been modelled according to dynamic elastic deflections of its micro asperities. It shows that around all engine dead centres, the boundary and mixed lubrication conditions contained more asperities, undertaking dynamic compression. However, because of a very low sliding velocity, these AAC-induced AE responses were not very significant when the lubrication condition or oil was normal. The high velocity of piston motions led to hydrodynamic lubrication conditions in the middle of each stroke; hence, the high AE activities were mainly sourced from bending deflections of the asperities driven by fluid shearing forces. This fluid–asperity shearing (FAS)-induced AE was more proportionally related to the relative velocity and oil viscosity, but less so to the engine load. In addition, in the time domain, AE responses exhibited a quasi-continuous behaviour as the dynamic deflections on millions of asperities were stimulated by the velocity of the piston, which was more continual in the middle of a stroke. In the frequency domain, FAS-induced AE could spread to several kilohertz whereas the AAC-induced AE could have extremely wide bands.
Similar to the time-varying behaviour of other engine AE sources, AE signals measured on the engine body were highly noisy along with large data sizes. As such, wavelet packet analysis was an effective tool for extracting the AE in the middle of the power stroke that is relating more to the ring-liner conjunction. The optimal wavelet spectrum with a wavelet basis db35 at level 7 was obtained using the proposed scheme of minimising the time and frequency overlaps in the WPT spectrum, which provided more details and hence a wealth of information regarding the tribological behaviour in multiple frequency bands.
The AE indicator extracted from narrower frequency bands could be used to diagnose lubrication conditions under different lubricants as well as the used oil. The AE indicators in the two middle frequency bands of 70 kHz–90 kHz and 140 kHz–160 kHz showed a higher amplitude and good increasing trend with speed for the high viscosity lubricant, allowing a consistent monitoring result to be achieved for differentiating the two baseline lubricants. To diagnose the used lubricant, the nonlinear and unstable behaviours of the AE indicators with speeds needed to be referred.

Author Contributions

N.W. and F.G. were involved in the full process of producing this paper including modelling, test designing, data processing and preparing the manuscript. Z.C., T.W. and A.B. provided valuable comments for improving the model and test design, G.L. supported by coordinating and conducting various tests. J.X.G. reviewed and edited the manuscript at all stages.

Funding

The support of the National Natural Science Foundation of China (No. 51375326) is gratefully acknowledged and supported by the Doctor Research Foundation of Taiyuan University of Science and Technology (No. 20162026).

Acknowledgments

Thanks are due to Jie Zhao, Huanhuan Wang, Miaoshuo Li, Haoyu Lu, Xingchen Lu, Hu Zhang and Xuan Dang, of Taiyuan University of Technology, for their help in modelling and testing.

Conflicts of Interest

The authors declare no conflict of interest.

List of Nomenclature

aEqual radius of asperity
bThe ring width
drDiameter of the piston ring
ElYoung’s modulus of the cylinder liner
faThe frequency of a single pair of asperity collision
FsThe sampling frequency
F1(h)
F1/2(h)
The probability density function of the standardized separation
h(x, y, t)The film thickness distribution
HHeight between two sliding surfaces
IiThe random asperity’s equivalent section moment of inertia
JThe decomposition level of WPT
kbThe portion of the elastic strain energy that converts to AE waves
kcConversion rate of elastic strain energy to AE energy
keEnergy conversion rate that the elastic strain energy converts to AE pulses
kmEnergy conversion rate gained from the AE measurement system
LnNormal load on a surface
NTotal number of asperity contacts between the two rough surfaces
NdThe total number of asperities under bending deflection
p(x, y, t)The pressure distribution of fluid flows
RRadius of the curvature in the Hertzian contact area
taCharacteristic time duration for the interaction of two asperities
tbCharacteristic time duration of the asperities from bend to recovery across the ring with a width of b
vpAverage sliding velocity between two rough surfaces
v(x, y, t)The velocity distribution of fluid flows
wA constant width of the asperities
xDirection along the circumference of the ring
yDirection along the film thickness
zAsperity height z

List of Abbreviations

AACAsperity–Asperity Collision
AEAcoustic Emission
BDCBottom Dead Centre
BLBoundary Lubrication
CWTContinuous Wavelet Transform
DWTDiscrete Wavelet Transform
dbDaubechies
EVOExhaust Valve Opening
EVCExhaust Valve Closing
FASFluid–Asperity Shearing
HLHydrodynamic Lubrication
ICInternal Combustion
IVOInlet Valve Opening
IVCInlet Valve Closing
MLMixed Lubrication
STFTShort-Time Fourier Transform
TDCTop Dead Centre
WPTWavelet Packet Transform
WPWavelet Packets

References

  1. Lubricating oil conditioning sensors for online machine health monitoring—A review. Tribol. Int. 2017, 109, 473–484. [CrossRef]
  2. Engine Oil Warm-Up through Heat Recovery on Exhaust Gases—Emissions Reduction Assessment during Homologation Cycles | IRIS Università degli Studi dell’Aquila. Available online: https://ricerca.univaq.it/handle/11697/121446#.XFgEafmSyTg (accessed on 4 February 2019).
  3. Zhu, J.; He, D.; Bechhoefer, E. Survey of Lubrication Oil Condition Monitoring, Diagnostics, Prognostics Techniques and Systems. J. Chem. Sci. Technol. 2013, 2, 100–115. [Google Scholar]
  4. Ultrasonic echo waveshape features extraction based on QPSO-matching pursuit for online wear debris discrimination. Mech. Syst. Signal Process. 2015, 60–61, 301–315.
  5. Du, L.; Zhe, J. An integrated ultrasonic–inductive pulse sensor for wear debris detection. Smart Mater. Struct. 2013, 22, 025003. [Google Scholar] [CrossRef]
  6. Mills, R.S.; Avan, E.Y.; Dwyer-Joyce, R.S. Piezoelectric sensors to monitor lubricant film thickness at piston–cylinder contacts in a fired engine. Proc. Inst. Mech. Eng. Part J J. Eng. Tribol. 2013, 227, 100–111. [Google Scholar] [CrossRef]
  7. Mthis, K.; Chmelk, F. Exploring Plastic Deformation of Metallic Materials by the Acoustic Emission Technique. In Acoustic Emission; Sikorski, W., Ed.; InTech: Rijeka, Croatia, 2012; ISBN 978-953-51-0056-0. [Google Scholar] [Green Version]
  8. Jiang, J.; Gu, F.; Gennish, R.; Moore, D.J.; Harris, G.; Ball, A.D. Monitoring of diesel engine combustions based on the acoustic source characterisation of the exhaust system. Mech. Syst. Signal Process. 2008, 22, 1465–1480. [Google Scholar] [CrossRef]
  9. Elamin, F.; Fan, Y.; Gu, F.; Ball, A. Diesel Engine Valve Clearance Detection Using Acoustic Emission. Adv. Mech. Eng. 2010, 2010. [Google Scholar] [CrossRef]
  10. Albarbar, A.; Gu, F.; Ball, A.D. Diesel engine fuel injection monitoring using acoustic measurements and independent component analysis. Measurement 2010, 43, 1376–1386. [Google Scholar] [CrossRef] [Green Version]
  11. Elamin, F.; Glikes, O.; Gu, F.; Ball, A. The Analysis of Acoustic Emission Signals from the Cylinder Head of a Diesel Engine for Fault Detection. In Proceedings of the Seventh International Conference on Condition Monitoring and Machinery Failure Prevention Technologies(CM 2010 and MFPT 2010), Stratford-upon-Avon, UK, 22–24 June 2010. [Google Scholar]
  12. Miettinen, J.; Siekkinen, V. Acoustic emission in monitoring sliding contact behaviour. Wear 1995, 181, 897–900. [Google Scholar] [CrossRef]
  13. Jiaa, C.L.; Dornfeld, D.A. Experimental studies of sliding friction and wear via acoustic emission signal analysis. Wear 1990, 139, 403–424. [Google Scholar] [CrossRef]
  14. Lee, D.-Y.; Lee, J.; Hwang, J.; Choa, S.-H. Effect of relative humidity and disk acceleration on tribocharge build-up at a slider–disk interface. Tribol. Int. 2007, 40, 1253–1257. [Google Scholar] [CrossRef]
  15. Suzuki, S.; Nishihira, H. Study of Slider Dynamics over Very Smooth Magnetic Disks. J. Tribol. 1996, 118, 382–387. [Google Scholar] [CrossRef]
  16. Shuster, M.; Combs, D.; Karrip, K.; Burke, D. Piston Ring Cylinder Liner Scuffing Phenomenon Studies Using Acoustic Emission Technique; SAE International: Warrendale, PA, USA, 2000. [Google Scholar]
  17. Douglas, R.M.; Steel, J.A.; Reuben, R.L. A study of the tribological behaviour of piston ring/cylinder liner interaction in diesel engines using acoustic emission. Tribol. Int. 2006, 39, 1634–1642. [Google Scholar] [CrossRef]
  18. Elamin, F.; Gu, F.; Ball, A. Online Monitoring of Engine Oil Quality Based on AE Signal Analysis. In Future Technologies in Computing and Engineering, Proceedings of Computing and Engineering Annual Researchers’ Conference 2010: CEARC’10, Athens, Greece, 7–10 July 2010; Lucas, G., Xu, Z., Eds.; University of Huddersfield: Huddersfield, UK, 2010; pp. 116–123. ISBN 978-1-86218-093-2. [Google Scholar]
  19. Elamin, F.; Gu, F.; Ball, A. Diesel Engine Lubricating Oil Condition and Performance Monitoring Using Acoustic Emission Measurements. In Proceedings of the 24th International Congress on Condition Monitoring and Diagnostics Engineering Management (COMADEM), Stavanger, Norway, 30 May–1 June 2011. [Google Scholar]
  20. Wei, N.; Gu, F.; Wang, T.; Li, G.; Xu, Y.; Yang, L.; Ball, A.D. Characterisation of acoustic emissions for the frictional effect in engines using wavelets based multi-resolution analysis. In Proceedings of the 2015 21st International Conference on Automation and Computing (ICAC), Glasgow, UK, 11–12 September 2015; pp. 1–6. [Google Scholar]
  21. Wei, N.; Ball, A.; Gu, F. A Study of Alternative Fuels Potential Effects on the Combustion Engines using acoustic emission. In Proceedings of the Computing and Engineering Annual Researchers’ Conference 2013: CEARC’13, San Juan, Puerto, 18–22 May 2013; Lucas, G., Ed.; University of Huddersfield: Huddersfield, UK, 2013; p. 239. [Google Scholar]
  22. Lu, X.; Khonsari, M.M.; Gelinck, E.R. The Stribeck Curve: Experimental Results and Theoretical Prediction. J. Tribol. 2006, 128, 789–794. [Google Scholar] [CrossRef]
  23. Yibo Edward Fan The Condition Monitoring of Mechanical Seals Using Acoustic Emissions. Ph.D. Thesis, The University of Manchester, Manchester, UK, 2007.
  24. Boness, R.J.; McBride, S.L. Adhesive and abrasive wear studies using acoustic emission techniques. Wear 1991, 149, 41–53. [Google Scholar] [CrossRef]
  25. Khurshudov, A.G.; Talke, F.E. A Study of Subambient Pressure Tri-Pad Sliders Using Acoustic Emission. J. Tribol. 1998, 120, 54–59. [Google Scholar] [CrossRef]
  26. Ravikiran, A.; Liew, T.; Low, T.S. Effect of disk acceleration on the generation of acoustic emission signal at the head–disk interface. J. Appl. Phys. 1999, 85, 5612–5614. [Google Scholar] [CrossRef]
  27. Komvopoulos, K.; Saka, N.; Suh, N.P. The Mechanism of Friction in Boundary Lubrication. J. Tribol. 1985, 107, 452–462. [Google Scholar] [CrossRef]
  28. Fan, Y.; Gu, F.; Ball, A. Modelling acoustic emissions generated by sliding friction. Wear 2010, 268, 811–815. [Google Scholar] [CrossRef]
  29. Hamel, M.; Addali, A.; Mba, D. Monitoring oil film regimes with acoustic emission. Proc. Inst. Mech. Eng. Part J J. Eng. Tribol. 2014, 228, 223–231. [Google Scholar] [CrossRef]
  30. Hu, S.; Brunetiere, N.; Huang, W.; Liu, X.; Wang, Y. Bi-Gaussian surface identification and reconstruction with revised autocorrelation functions. Tribol. Int. 2017, 110, 185–194. [Google Scholar] [CrossRef]
  31. Pagán Rubio, J.A.; Vera-García, F.; Hernandez Grau, J.; Muñoz Cámara, J.; Albaladejo Hernandez, D. Marine diesel engine failure simulator based on thermodynamic model. Appl. Therm. Eng. 2018, 144, 982–995. [Google Scholar] [CrossRef]
  32. Soundwel Technology Co., Ltd. Available online: http://www.soundwel.cn/ (accessed on 14 February 2019).
  33. AnHui Full Chai Group Co., Ltd. Available online: http://www.quanchai.com.cn/esitecn/ (accessed on 1 February 2019).
  34. Li, M.; Zhu, W.; Liu, H.; Yang, J. Adaptive Feature Extraction of Motor Imagery EEG with Optimal Wavelet Packets and SE-Isomap. Appl. Sci. 2017, 7, 390. [Google Scholar] [CrossRef]
  35. Kek, T.; Kusić, D.; Grum, J. Wavelet Packet Decomposition to Characterize Injection Molding Tool Damage. Appl. Sci. 2016, 6, 45. [Google Scholar] [CrossRef]
  36. Lv, Y.; Gao, Y.; Zhang, J.; Deng, C.; Hou, S. Symmetrical Loss of Excitation Fault Diagnosis in an Asynchronized High-Voltage Generator. Energies 2018, 11, 3054. [Google Scholar] [CrossRef]
  37. Fan, X.; Zuo, M.J. Gearbox fault detection using Hilbert and wavelet packet transform. Mech. Syst. Signal Process. 2006, 20, 966–982. [Google Scholar] [CrossRef]
  38. Dalvand, F.; Kalantar, A.; Safizadeh, M.S. A Novel Bearing Condition Monitoring Method in Induction Motors Based on Instantaneous Frequency of Motor Voltage. IEEE Trans. Ind. Electron. 2016, 63, 364–376. [Google Scholar] [CrossRef]
  39. Wang, X.; Liu, C.; Bi, F.; Bi, X.; Shao, K. Fault diagnosis of diesel engine based on adaptive wavelet packets and EEMD-fractal dimension. Mech. Syst. Signal Process. 2013, 41, 581–597. [Google Scholar] [CrossRef]
  40. Wu, J.-D.; Liu, C.-H. An expert system for fault diagnosis in internal combustion engines using wavelet packet transform and neural network. Expert Syst. Appl. 2009, 36, 4278–4286. [Google Scholar] [CrossRef]
  41. Bianchi, D.; Mayrhofer, E.; Gröschl, M.; Betz, G.; Vernes, A. Wavelet packet transform for detection of single events in acoustic emission signals. Mech. Syst. Signal Process. 2015, 64–65, 441–451. [Google Scholar] [CrossRef]
  42. Gómez, M.J.; Castejón, C.; García-Prada, J.C. Review of Recent Advances in the Application of the Wavelet Transform to Diagnose Cracked Rotors. Algorithms 2016, 9, 19. [Google Scholar] [CrossRef]
  43. Wickerhauser, M.V. Lectures on Wavelet Packet Algorithms; Washington University in St. Louis: Washington, DC, USA, 1991. [Google Scholar]
  44. Vonesch, C.; Blu, T.; Unser, M. Generalized Daubechies Wavelet Families. IEEE Trans. Signal Process. 2007, 55, 4415–4429. [Google Scholar] [CrossRef] [Green Version]
  45. Heredia-Cancino, J.A.; Ramezani, M.; Álvarez-Ramos, M.E. Effect of degradation on tribological performance of engine lubricants at elevated temperatures. Tribol. Int. 2018, 124, 230–237. [Google Scholar] [CrossRef]
  46. Mujahid, A.; Dickert, F.L. Monitoring automotive oil degradation: Analytical tools and onboard sensing technologies. Anal. Bioanal. Chem. 2012, 404, 1197–1209. [Google Scholar] [CrossRef] [PubMed]
  47. Ferraro, G.; Fratini, E.; Rausa, R.; Baglioni, P. Impact of oil aging and composition on the morphology and structure of diesel soot. J. Colloid Interface Sci. 2018, 512, 291–299. [Google Scholar] [CrossRef] [PubMed]
  48. Bewsher, S.R.; Leighton, M.; Mohammadpour, M.; Rahnejat, H.; Offner, G.; Knaus, O. Boundary friction characterisation of a used cylinder liner subject to fired engine conditions and surface deposition. Tribol. Int. 2019, 131, 424–437. [Google Scholar] [CrossRef]
  49. Minami, I. Molecular Science of Lubricant Additives. Appl. Sci. 2017, 7, 445. [Google Scholar] [CrossRef]
Figure 1. The schematic of asperity–asperity collisions between the piston ring and cylinder liner surfaces.
Energies 12 00640 g001
Figure 2. The schematic of asperity–fluid interaction between the piston ring and cylinder liner surfaces.
Energies 12 00640 g002
Figure 3. Schematic diagram of the diesel engine test system.
Energies 12 00640 g003
Figure 4. The frequency characteristic curve of the acoustic emission sensor SR800.
Energies 12 00640 g004
Figure 5. AE raw signals in a working cycle.
Energies 12 00640 g005
Figure 6. Full wavelet packet tree down to level 3.
Energies 12 00640 g006
Figure 7. WPT spectra for 15W40 oil using db35 wavelet decomposed at level j = 7.
Energies 12 00640 g007
Figure 8. AE indicators from 70 kHz to 90 kHz for four strokes under different operating conditions.
Energies 12 00640 g008
Figure 9. AE indicators from 140 kHz to 160 kHz for four strokes under different operating conditions.
Energies 12 00640 g009
Figure 10. AE indicators from 30 kHz to 50 kHz for four strokes under different operating conditions.
Energies 12 00640 g010
Figure 11. AE indicators from 174 kHz to 186 kHz for four strokes under different operating conditions.
Energies 12 00640 g011
Figure 12. AE indicators in power stroke for different oils and operating conditions.
Energies 12 00640 g012
Figure 13. AE WPT spectra in power stroke for the used oil at different speeds and high load.
Energies 12 00640 g013
Table 1. Specification of the test engine [33].
Technical ParametersTechnical Data
Engine TypeNaturally aspirated four-stroke diesel
Anhui Quanchai Engine Co., Ltd., PR. China
Number of cylindersOne
Combustion systemDirect injection, vertical type
Bore/stroke125/120 mm
Displacement volume1.473 L
Compression ratio18:1
Rated power20.6 kW @ 2200 rpm
Maximum torque67 Nm @ 1920 rpm
Table 2. Engine operating conditions and lubricants tested.
Lube-oilEngine Speed (rpm)Load (Nm)Viscosity
(Pa·s) at 40 °C
Viscosity
(Pa·s) at 100 °C
CD-10W301000, 1200, 1400, 1600, 1800, 200010, 400.07650.0099
CD-15W400.11280.0147
CH4-Used0.23540.0339

