Coal Strength Development with the Increase of Lateral Confinement


1
State Key Laboratory for GeoMechanics and Deep Underground Engineering, China University of Mining and Technology (Beijing), Beijing 100083, China
2
School of Energy and Mining Engineering, China University of Mining and Technology (Beijing), Beijing 100083, China
3
College of Mechanics and Civil Engineering, China University of Mining and Technology (Beijing), Beijing 100083, China
*
Author to whom correspondence should be addressed.
Energies 2019, 12(3), 405; https://doi.org/10.3390/en12030405
Submission received: 30 October 2018
/
Revised: 4 January 2019
/
Accepted: 24 January 2019
/
Published: 28 January 2019
(This article belongs to the Section L: Energy Sources)
Abstract
:The high stress environment brings many challenges in underground coal mining. In order to address the strength behavior of coal under various confining stresses and hence shed light on coal pillar design optimization, compressive tests were conducted under the lateral confinement of 0–8.0 MPa, and the strength enhancement mechanism was studied from the grain scale using PFC modeling. The results show that the coal strength and cumulative axial strain at failure increased with the confinement, while the Young’s modulus of coal is independent of confinement. However, this confinement-dependent strength property can be significantly weakened by existing cracks. Compared to the significant increase in peak compressive stress, the crack initiation stress slightly increased with the confinement. The strength component mobilized with the confinement enhancement. In the early stage of loading, the high confinement restrained the development of microcracks, while in the later stage, it enhanced the frictional resistance strength component. The two mechanism shifted the compressive strength of coal together and the latter one contributed to the strength component mobilization. The coal showed three failure modes sequentially with the increase of confinement, namely axial splitting, mixed failure and shear failure mode. With regard to failure envelope, the Mohr-Coulomb, Hoek-Brown and S-shaped failure criteria can generally represent the confinement-dependent coal strength with R-square larger than 0.9. The confinement of rapid strength promotion section of S-shape failure envelope falls in a range of 1.5–3.0 MPa. This leads to the difficulty of S-shaped failure envelope justification due to the soft nature and heterogeneity of coal.
1. Introduction
With the increase of mining depth, a number of new challenges have been encountered in underground coal mining [1]. In order to mitigate the hazards potentially threatening miners and make underground mining economically attractive, a thorough understanding of the mechanical behavior of coal under a wide range of confinements is essential. For example, in underground coal mining, the compressive strength characterization of coal is useful for both stiff and yield pillar design in underground mining [2]. Conservative design of yield pillars may leave the pillar a large elastic core, inducing excessive elastic energy accumulation for a high level of rock burst tendency. On the other hand, stiff pillars of too optimistic design may fail due to insufficient width-to-height ratio, causing excessive surface subsidence for mining under buildings and railways.
The strength is used to describe the ultimate load bearing capacity of rocks under different loading conditions, which is widely used in stability evaluation of rock engineering. In past decades, the strength properties of different intact rock types such as granite [3], marble [4], sandstone [5], clay shale [6] have been extensively studied. However, studies on coal strength are relatively limited when compared with other rock types. There are two main reasons for this fact. First of all, in underground mining, the coal strength is fully utilized in gateways that serve for a short production period. After excavation, a limit equilibrium zone of abutment pressure develops in surrounding rock mass, forming fractured damage, plastic and elastic zones. This is distinctly different from civil geotechnical construction operations such as tunneling, that has a long service period. Additionally, the natural coal contains massive inherent fabrics and cleats, leading to difficulty in laboratory sampling and also large scatter in testing results.
The compressive strength and deformability are the most significant properties in rock strength characterization, but they are affected by site-specific geological conditions and intrinsic properties, such as mineralogy, water content, porosity and discontinuities [7]. Ishii et al. [8] demonstrated that rock strength can be dominantly determined by grain aggregation. The water can be detrimental to the engineering stability of rocks by reducing mechanical strength and softening the rock. Conducting triaxial tests on meta-siltstone and -sandstone, Li et al. [9] found that the water-weakened strength can be described by friction angle reduction in Mohr-Coulomb envelope or a reduction of mi in Hoek-Brown failure envelopes, while water-enhanced deformability can be related to Young’s modulus reduction and Poisson’s ratio increase. Peng et al. [10,11] found that a constant parameter mi is insufficient to represent a specific rock for some rocks and expressed mi as a negative exponential function of confinement. Furthermore, the brittleness of intact rock can be reduced more significantly by water for rocks of higher porosity [12]. Using a pore-emanated crack model, where small cracks initiate from the pores, and the sliding wing crack models, Baud et al. [13] found that the pore size can be another factor influencing the uniaxial compressive strength (UCS) of intact rocks.
For rock under compressive loading, its deformation usually consists of elastic and plastic components, where the plastic deformation are contributed by crack closure, sliding, new crack development and propagation until massive cracks coalesce into a macro failure band. Hsieh et al. [14] argued that the elastic and plastic deformation of rock under compressive loading co-occurs for many rocks, and Young’s modulus increases during the deformation phase where crack closure dominates. Using Nuclear Magnetic Resonance, Shang et al. [15] characterized rock damage with porosity increment at the loading levels of 0.1, 0.2, 0.4, 0.6 and 0.8 UCS, verifying the progressive failure process of rock under loading.
In theoretical modeling, the compressive strength of intact rock is usually divided into cohesive and frictional components, such as Mohr-Coulomb and Hoek-Brown failure criteria [16,17]. The rock strength in field is generally lower than that measured in laboratory due to size effects. In addition, the strength of rocks also varies with the confinement of specific geoenvironment. Hajiabdolmajid et al. [18] argued that the mobilization of cohesive loss and frictional strengthening can lead to the low strength of hard brittle rock failure near the excavation boundary. According to the rule of thumb, the in situ strength of rocks is considered approximately (0.4 ± 0.1) UCS that is measured in laboratory, However, Cai and Kaiser [19] found that the in situ rock strength can be up to (0.8 ± 0.05) UCS if the surface irregularity of excavation profile is considered.
For coal, Buzzi et al. [20] experimentally investigated the compressive strength of an Australian coal under confining stresses from 0 to 2.0 MPa using small cylindrical specimens of 12 mm in diameter and 24 mm in height, and indicated a non-convex failure envelope, even though it failed to ascertain the S-shaped criterion proposed by Kaiser and Kim [21] due to apparatus limitations on confinement. Currently, the mechanical behavior of coal under high confinement is still untested.
In order to study the strength characteristics of coal under a wide range of confinement and hence shed insights for pillar stability and design, triaxial compressive tests were conducted with the lateral confinement ranging 0–8.0 MPa. Meanwhile, Particle Flow Code (PFC) numerical modeling was conducted to reveal the strength enhancement mechanism from the micro scale. Subsequently, the confinement-dependent strength and deformability characteristics of coal were analyzed.
2. Sample Information and Description
In this study, the coal was obtained from the No. 2 coal seam of the Taoli coal mine, located in Inner Mongolia, China. In the Taoli coalfield, the No. 2 and No. 4 coal seams are minable with a vertical distance of 50–89 m between them. The two coal seams are nearly horizontal, with the dipping angle of 2–8° and the thicknesses of the No. 2 and No. 4 coal seams are 9 m and 2.25 m, respectively. Compared to the No. 4 coal seam, the No. 2 coal seam tends to be simple in geological structure. Therefore, the No. 2 coal seam is preferred in this study to reduce the structure complexity of coal.
The coal samples have a density of 1.58 g/cm3 with horizontal bedding structure. Cleats are well developed in vitrinite of the coal, occasionally filled with muddy, calcareous and pyrite. The coal and rock are interbeded, forming a 3–5 mm strip structure and 1–3 mm thin strip band. The mass fractions of water in coal is 12.56%, ash 15.55% and volatile matter 39.14%. In the ash content, silicon dioxide dominates with a mass fraction of 44.71–49.28%, followed by aluminium sesquioxide with a mass fraction of 16.18–16.97%. The main chemical elements in coal are carbon (73.33–74.30%), hydrogen (4.05–4.61%), nitrogen (1–1.26%) and oxygen (19.57–21.02%).
The porosity and pore size are one of factors influencing the compressive strength of intact rocks [7,13]. The pore characteristics of the coal are investigated using mercury intrusion porosimetry, Quantachrome Corporation, US. Figure 1 shows the cumulative volume of intruded mercury with the increase of mercury pressure. It can be seen that the amount of mercury intrusion in the No. 1 coal specimen is 0.2099 cc/g under the mercury pressure of 0.28 MPa, approximately 77.6% of the total volume of mercury intrusion. The amount of mercury intrusion in the No. 2 coal specimen is 0.1412 cc/g under the mercury pressure of 0.21 MPa, approximately 81.7% of the total volume of mercury intrusion. The pore size distribution is quantitatively shown in Figure 2, where the ordinate represents the differential of cumulative volume of intruded mercury over the logarithmic scale of pore diameter, and the abscissa represents the pore diameter. It shows that macro pores, possibly micro cracks with diameter larger than 30 µm, dominate in the pore volume and the rest are micro pores with diameter less than 1 µm. There are almost no pores of a diameter between 1 and 30 µm. Here, it cannot be ascertained whether the source of these large macropores if of coal origin or induced during specimen preparation. However, Figure 2 shows that the coal indeed contains both the micro- and macropores [21].
3. Sampling and Experimental Procedure
3.1. Specimen Preparation
Large coal blocks were transported to the laboratory from the Taoli coal mine. Cylindrical coal specimens were then cored to be 50 mm in diameter along the direction perpendicular to the bedding planes to resemble the horizontal bedding nature in the field. The raw cylindrical specimens are of an initial height of 140-210 mm and then trimmed shorter. After that, the two parallel ends were carefully polished with a Kemet lapping machine, Kemet Far East Pte Ltd, Singapore (Version, Manufacturer, City, UK). The final prepared coal specimens are 50 mm in diameter and 100 mm in height with a height-to-diameter ratio of 2 [21]. In total, twenty cylindrical coal specimens were prepared for triaxial compressive tests.
3.2. Triaxial Compressive Test Set-Up and Procedure
Triaxial compressive tests were conducted under room temperature using the MTS 815 servo-hydraulic rock testing system, MTS Systems Corporation (Eden Prairie, MN, USA) as shown in Figure 3. Firstly, the polished cylindrical coal specimens were enclosed with sleeve-shaped DuPont Fluorinated ethylene propylene fluorocarbon membranes, which are 0.5 mm in thickness. Two rubber O-rings with an inner diameter of 38 mm were placed between the membrane and specimen caps, and then fixed with two hose clamps to prevent confining oil leakage into specimen during test. Subsequently, the assembled cylindrical specimen was placed on the bottom seating and the triaxial cell was finally assembled.
The strain gauge was used to measure the circumferential strain by wrapping the coal cylinder as shown in Figure 3, while the axial strain was monitored by a linear variable differential displacement transducer. During triaxial testing, the axial stress was kept as the major principal stress. Prior to the test, the axial stress and confining stress were applied simultaneously to the required confining stress level, but the axial stress was always kept 0.2 MPa higher than the confining stress to avoid specimen movement. Then, the axial load was increased by a constant displacement rate of 0.15 mm/min until failure while keeping the confining stress constant. For the tests, the specimens were loaded axially to failure at the confining stresses of 0.25, 0.5, 1.0, 2.0, 3.0, 4.0, 5.0, 6.0, 7.0 and 8.0 MPa, respectively.
In order to assess the failure mode of coal cylinder under different confinements, the axial loading was manually stopped after initial cracking in case of specimen crushing by excessive loading. For each confinement level, two coal specimens were used as shown in Figure 4. In general, the integrity of the former group is relatively better than the latter group, where the coal specimens in group 2 contain more or less minor damage. Since prevention of such damage is almost impossible due to the inherent soft nature of coal, compressive tests on such coal specimens are counted in this study. The specimens are numbered sequentially and relevant information is given in Table 1.
4. Results
4.1. Stress-Strain Curves
The stress-strain curves of twenty coal specimens under different confining stresses are shown in Figure 5. For group 1, the axial peak stress generally increased when the confining stress increased from 0.25 to 8.0 MPa. An inconsistent increase trend was found under the confinements of 1.0, 5.0 and 6.0 MPa. Visual examination of specimen integrity revealed that cracks existed in these three coal specimens before the triaxial compressive tests, as illustrated in Figure 6. Therefore, this inconsistent increase trend in peak axial stress can be attributed to the variability of heterogeneity in these coal specimens. Another important phenomenon that can be found from Figure 5a is that the linear segments of axial stress-strain curves under different confinement levels are almost parallel in the stress-strain diagrams, except the confinement levels of 1.0, 5.0 and 6.0 MPa. This indicates that the Young’s modulus is independent of lateral confinement while compressive strength is confinement-dependent.
For group 2, as shown in Figure 5b, the peak axial stress before failure also generally increased with the confining stress, except at the confinement levels of 0.5, 1.0, 2.0 and 7.0 MPa. Furthermore, it is hard to find any parallel trend for the linear segments of axial stress-axial strain curves. As stated previously in Section 3.2, cracks were visually observed in coal specimens of group 2 prior to the triaxial tests. This significantly influences the stress-strain behavior of the tested coal cylinder.
Figure 5a also shows that the amount of axial strain at failure generally increased with the lateral confinement, except for the abnormalities encountered at the confining stresses of 1.0 MPa, 5.0 MPa and 6.0 MPa. This increase in peak axial strain at failure is expected as the Young’s modulus is independent of confinement while the peak strength shows confinement dependency.
Volumetric strain reflects the volume change per unit of volume and can be calculated by ignoring the second and third order of strain:
where εv is the volumetric strain, εc is the circumferential strain, εa is the axial strain, is the volume change and V0 is the initial volume. The measured axial stress-volumetric strain curves of coal specimens are plotted in Figure 7. Figure 7a shows that the volume of coal specimens decreased sharply at the early stage of compressive loading, then decreased gradually following an approximate linear trend. After this linear decrease in volume, the axial stress-volumetric strain behavior tends to be different between low and medium confinement (σ3 ≤ 4.0 MPa) and high confinement (σ3 ≥ 5.0 MPa).
For σ3 ≤ 4.0 MPa, axial stress drop occurred after the linear decrease of coal volume, indicating peak axial stress already reached, while for σ3 ≥ 5.0 MPa, the axial stress still increased, but such an increase in axial stress deviated from the previous linear trend. This indicates that brittle-ductile transition occurred at the confinement higher than 5.0 MPa. Note that the result of compressive tests at the confinement level of 1.0 MPa is an exception, possibly due to the visually-observed cracks as shown in Figure 6. The change of axial stress after the linear behavior of axial stress-volumetric strain can be generally found in group 2, as shown in Figure 7b.
4.2. Failure Mode
Figure 8 shows the failure patterns of coal cylinders under different confinement levels. Three failure modes were revealed from the experimental result.
For the confining stress σ3 ≤ 0.5 MPa, axial splitting failure occurred with the failure plane approximately parallel to the axial stress (major principal stress for this study). For the confining stress in the range of 1.0 MPa ≤ σ3 ≤ 3.0 MPa, a combined failure mode with shear and axial splitting was observed, where a part of the failure plane is parallel to the axial stress and the other part of the failure surface is inclined at 10°–30° from the axial direction. For the confining stress σ3 ≥ 4.0 MPa, shear failure occurred with the failure plane inclined at approximately 30°–45° from the axial direction, except the confining level of 5.0 MPa. The inconsistency for the confining stress of 5.0 MPa may be caused by the defects as shown in Figure 6.
4.3. Confinement-Dependent Strength Behavior
The peak axial stresses for coal specimens of group 1 are shown in Figure 9. It can be seen that peak axial stress at failure generally increased with the confining stress. The peak axial stress approximately increased from 35.2 MPa to 70.0 MPa when the confinement increased from 0.25 MPa to 8.0 MPa. In other words, the compressive strength of coal at the confinement of 8.0 MPa is approximately 1.9 times of that at the confinement of 0.25 MPa. Therefore, the confinement dependency of peak axial stress is considerable.
4.4. Failure Envelope
The confinement-dependent failure envelope of coal was studied here. In order to better evaluate the description capability of Mohr-Coulomb, Hoek-Brown and S-shaped failure criteria, the inconsistent results of the confinement of 1.0 MPa, 5.0 MPa and 6.0 MPa were not considered due to specimen defects as illustrated in Figure 6.
Mohr-Coulomb yield criterion has been widely used in rock mechanics and rock engineering for its simplicity in parameter measurement:
where σ1 is the major principal stress and equals axial stress in this case, σ3 is the minor principal stress and equals confining stress in this case, c is the cohesion and ϕ is the internal friction angle. The best-fit curve with Equation (2) is shown in Figure 10. It can be seen that the Mohr-Coulomb failure criterion can generally capture the overall increase trend of coal with an R-square value of 0.92.
Another widely-used failure law for intact rock is the nonlinear Hoek-Brown criterion:
where m and s are the empirical parameters, a is a constant. Assuming a is equal to 0.5, the best-fit curve using the Levenberg-Marquardt method with Equation (3) is shown in Figure 11. Evidently, it can also generally describe the confinement-dependent strength property of coal with an R-square of 0.94.
Kim and Kaiser [17] modified the classic Hoek-Brown failure criterion and proposed a S-shaped failure criterion:
where ACS is the apparent uniaxial compressive strength that can be obtained by linear back projection of a linear fit to high confinement data with slope k2. In the S-shaped criterion, spalling limits is defined as the transition curve from low confinement to high confinement with a slope ks = σ1/σ3. σ30 is then defined as and δσ3 = Cσ30, where C is a constant within the range of 0.1–0.3. Kim and Kaiser [17] proposed such a S-shaped failure criterion as they found that the strength is less sensitive to confinement at very low confinement; with the continual increase of confinement, there is a rapid strength shift, while the strength increase rate lowers under the high confinement. This can be schematically shown in Figure 12. In this study, the UCS = 32 MPa, ACS = 45 MPa and k2 =2.8. Using the Levenberg-Marquardt method, the best-fit with S-shaped failure criterion is shown in Figure 13. It shows that the S-shaped failure criterion can describe the strength property of coal under a wide confinement range with an R-square of 0.96.
5. Discussion
5.1. Mechanism of Strength Enhancement
In order to investigate the strength enhancement mechanism from the micro scale perspective, PFC3D was used to simulate the failure process of coal specimens with the increase of confining stress. PFC3D is a kind of discrete element method, simulating interaction behavior among grains and hence being of great advantages in capturing the failure process of rocks on the micro scale. Another significant advantage of PFC3D are that it only needs the Newton’s second law for the grains and force-displacement rule for the bond contacts, instead of any implemented constitutive equations. Therefore, the PFC3D was preferred here.
There are two bond models in PFC: contact bond model and parallel bond model [22]. Here, the parallel bond model was used as it can simultaneously transfer the force and moment among particles, and also promptly reduce stiffness once bond breaks [23,24].
In the PFC model input, it is difficult to directly obtain the micro parameters in laboratory. The PFC model parameters are calibrated by matching the macro mechanical properties of the simulated rocks with the experiment data [25,26,27], therefore, the trial and error method was used to determine the micro parameters for PFC modeling by comparing the stress-strain curve, UCS and axial strain at peak stress.
The developed three-dimensional PFC model is 100 mm in height and 50 mm in diameter as shown in Figure 14. It consists of 3490 particles with radii ranging from 4 mm to 6 mm. Figure 15 shows the finalized stress-strain curve for the confining stress of 0.25 MPa, where the micro parameters were used for this PFC study. The determined micro parameters for PFC model are given in Table 2. After micro parameter determination, the failure processes of coal specimens under the confining stresses of 0.25–8.0 MPa were investigated with the PFC3D.
Figure 16 shows the development process of cracks at different loading stages, where the red disks represents cracks. It can be seen that the microcracks firstly appeared at the two ends of the coal specimens, and then gradually extended to the middle core of coal specimens. Taking the stages of strain ε = 0.02 and ε = 0.03 as the examples, it is known that the increase of confining stresses from 0.25 MPa to 8.0 MPa restrained the number of new cracks, thereby enhancing the load bearing capacity of coal specimens. From Figure 16, it is also noticeable that failure mode transition occurred with the confinement enhancement.
To further study the failure mechanism, the evolution of the number of tensile and shear cracks during the increase of confining stresses was shown in Figure 17. Here, only typical cases of confining stresses were presented for comparison. It shows that there was almost no crack development in the early stage of triaxial loading, then followed by a slow increase stage and finally transited to a sharp increase stage when approaching peak stress. Also, the tensile cracks dominated in the damage of coal specimens. However, the shear cracks appeared when the confining stress exceeding 3.0 MPa, but mainly in the residual strength stage. With further increase of confining stress, shear cracks started to appear near the peak stress and also the number of shear crack increased with the confining stress. Figure 17 and Figure 18 also show that the density and the total number of cracks at peak stress increased with confining stresses.
5.2. Strength Characterization
By analogy with the measurement of linear compressibility, Brace et al. [28] took the axial stress at which the axial stress-volumetric strain curve deviates from linearity to nonlinearity as an estimate for the crack initiation. This method was used by Amann et al. [6] in studying the brittle behavior of clay shale. Even though the volumetric strain calculated from Equation (1) is not accurate due to the omission of high-order-terms, the volumetric strain calculated with Equation (1) has been confirmed to be an effective damage indicator with micro acoustic emission technique [6].
For the cases that the axial stress dropped after linear segment of axial stress-volumetric strain curve, the peak axial stress is taken as the crack initiation stress, while for the cases that the axial stress increased nonlinearly after the linear segment of axial stress-volumetric strain curve, the first stress point deviating from the linearity is taken as the crack initiation stress. Figure 19 shows the thresholds of crack initiation stress under different confinement levels for specimens of group 1. The confinement dependency of crack initiation stress can be clearly observed, except at the confinement level of 1.0 MPa due to specimen defect stated previously.
The volumetric strain at the point of crack initiation is shown in Figure 20. It can be found that the volumetric strain at crack initiation stress ranged approximately from 1.26% to 1.91% under the confinement of 0.25, 0.5, 2.0, 3.0, 4.0, 7.0 and 8.0 MPa, with an average of 1.51%, while at the confining stresses of 1.0, 5.0 and 6.0 MPa, it approximately covered the range from 0.53% to 0.59%, much smaller than the former cases. As shown in Figure 6, coal specimens used for the tests under the confinement of 1.0, 5.0 and 6.0 MPa contain macrocrack defects.
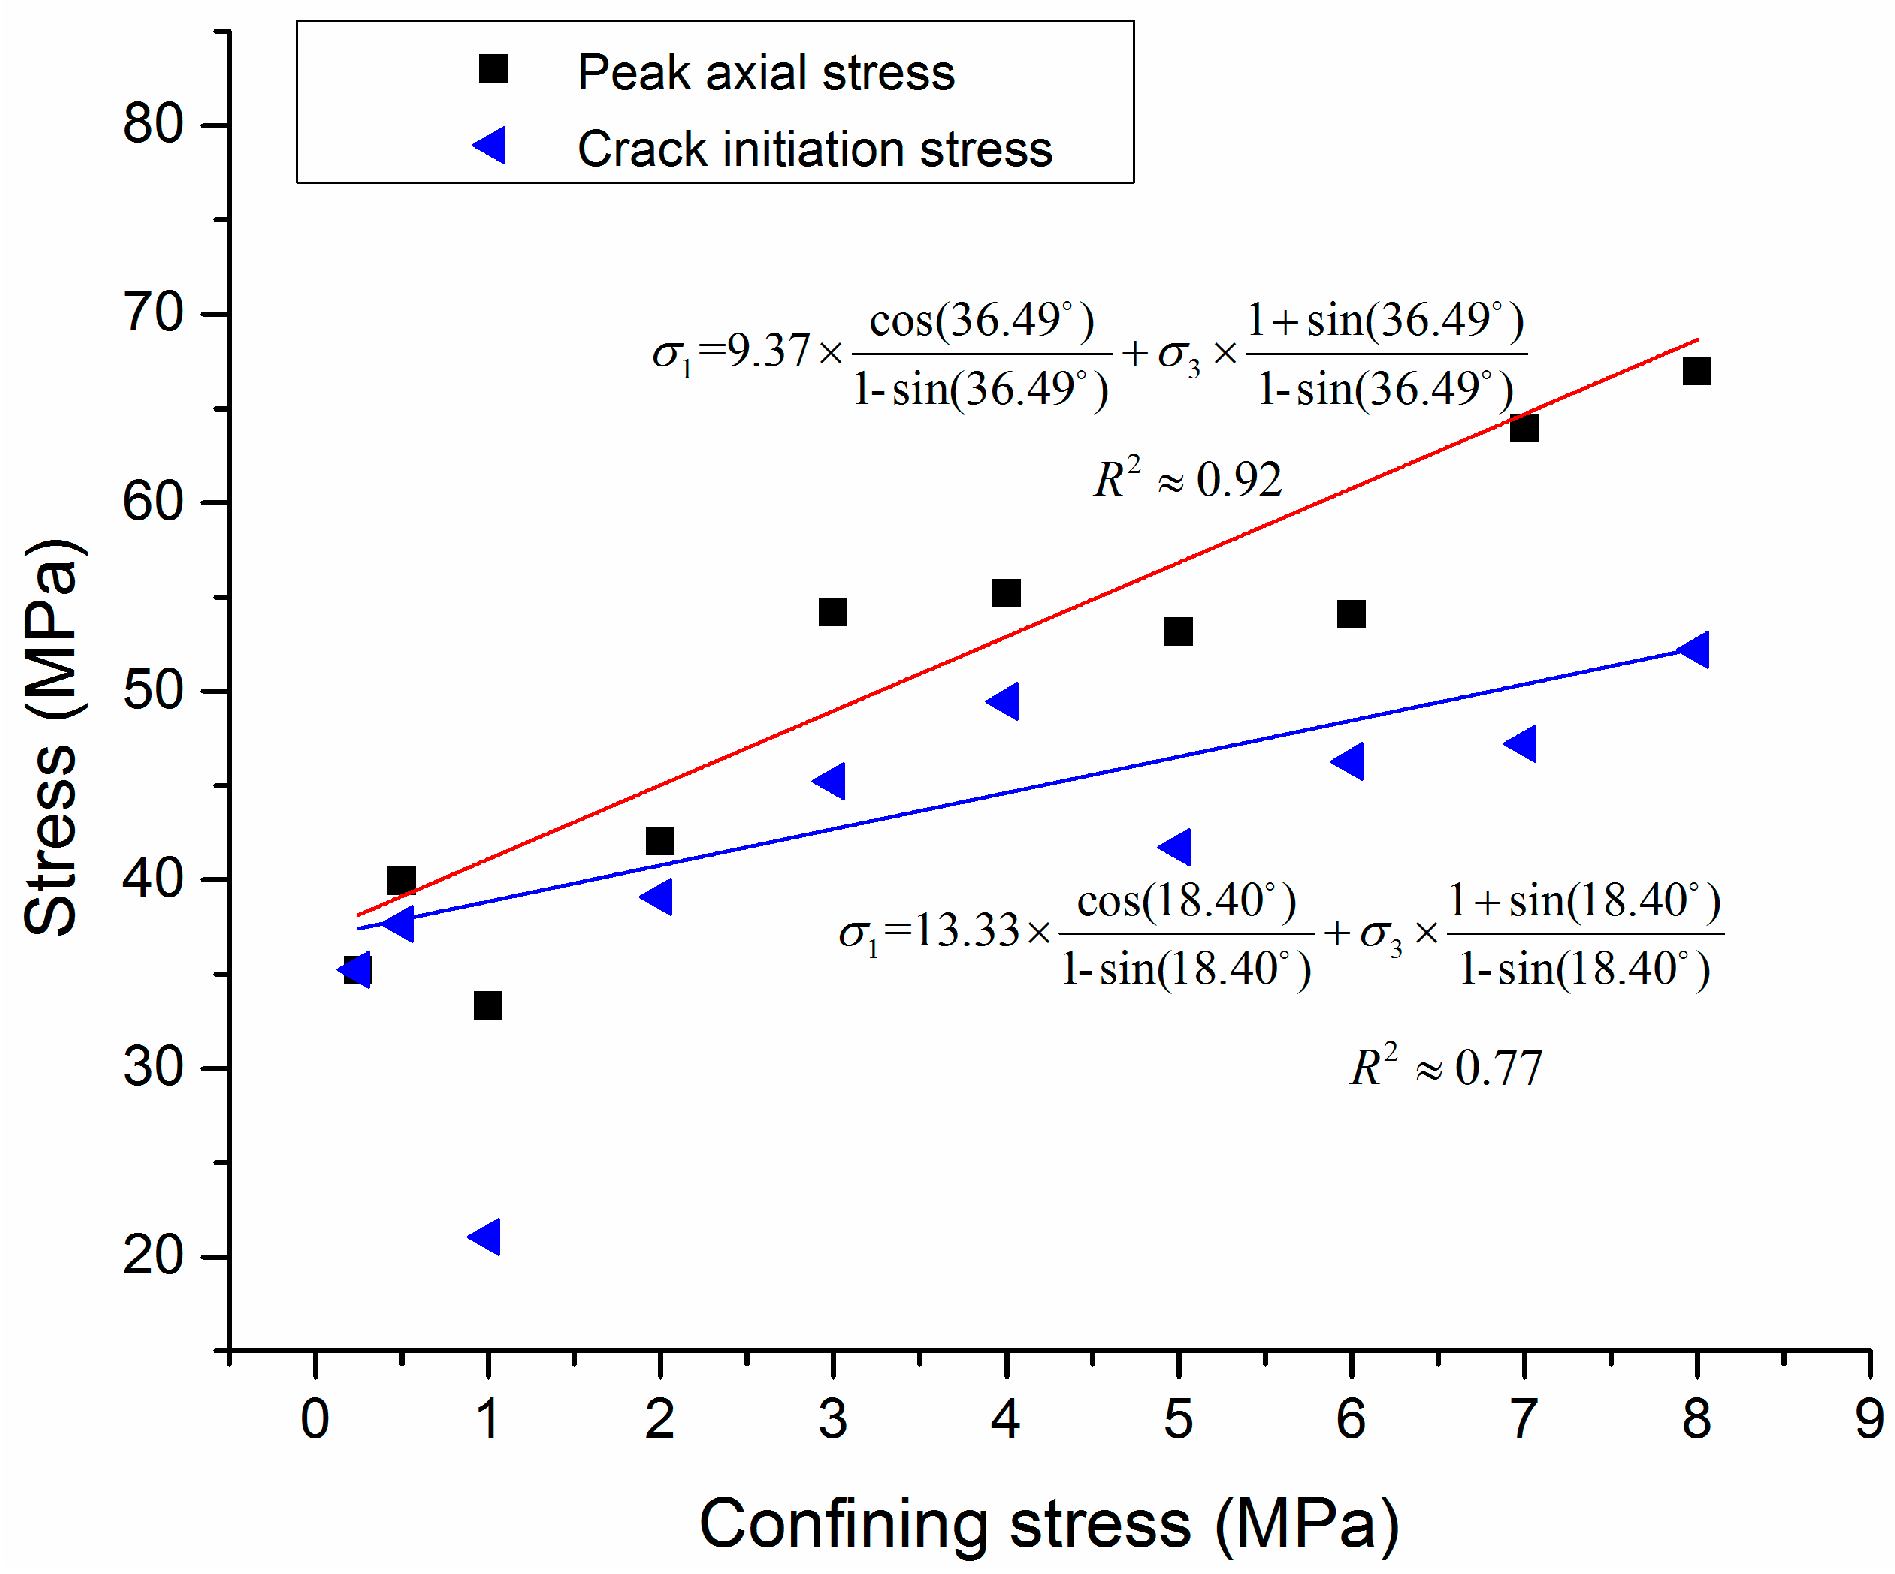
Figure 21 shows the increase in peak axial stress and crack initiation stress with the enhanced confinement. It can be seen that the threshold of crack initiation approximately increased by 48% when the lateral confining stress increased from 0.25 to 8.0 MPa. However, the peak axial strength increased by a factor of 1.9 for the same confining stress range. In order to reveal the mechanism of such increase in peak axial stress and crack initiation stress, best-fit with Mohr-Coulomb failure criterion of Equation (1) were conducted as shown in Figure 21. It can be seen that the significant increase in peak axial stress can be attributed to the enhanced frictional strength component, where internal frictional angle is approximately 36.49° compared to the 18.40° for crack initiation stress. Such strength component mobilization is consistent with the experimental study of Amann et al. [6] on clay shale. Therefore, strength components mobilized with the increase in confinement and the increased frictional resistance shifted the compressive strength of coal. This is also the reason that a larger number of cracks can be developed at the peak stress and residual stress at a higher confinement as shown in Figure 17 and Figure 18.
At low confinement, the constraint to lateral expansion is low and this enhances the rapid opening and propagation of axial cracks under axial loading, finally leading to the failure of axial splitting and low compressive strength. With the increase of confinement, the absolute length of axial cracks are considerably suppressed and the possibilities to coalescing into a single axial crack are significantly reduced [29]. Instead, frictional resistance of contacted crack walls increases at a higher confinement [6,30]. Therefore, strength components mobilized with the increase of confinement, where cohesive strength dominates in the mechanical behavior of coal specimen at the low confinement, while the frictional strength dominates in the later-phase mechanical behavior under the high confinement. This leads to the failure mode transition from low confinement to high confinement.
Figure 10, Figure 11 and Figure 13 show that the classic Mohr-Coulomb, Hoek-Brown failure criteria and the S-shaped failure criterion proposed by Kaiser and Kim [16] can similarly fit the confinement- dependent coal strength with R-square values greater than 0.90, even though the former one is linear and the latter two are nonlinear mathematically. This indicates that all fits may be appropriate for confinement-dependent coal strength. However, a linear fit with Mohr-Coulomb failure criterion may be accurate enough when considering the scatter in the data due to the soft nature of coal. It should be noted that the S-shaped failure envelope is not well justified by the data due to the heterogeneity of coal and data scatter. Furthermore, the confinement for fastest strength promotion rate fails in a small range, approximately 1.5–3.0 MPa for coal as shown in Figure 12 and Figure 18. This leads to the experiment difficulty in justifying the rapid transit segment of S-shaped failure envelope.
Kim and Kaiser [17] took transition curve from spalling to shear failure as the spalling limit and is assumed to be σ1/σ3 passing the origin. Under the condition of the left side of transition curve, pillars fail mainly in the form of spalling, while under the condition of the right side of transition curve, the pillars fail dominantly in the form shear mode. In this study, the spalling limit of coal is consistent with Kaiser and Kim [16] falling in the range 20–25 as shown in Figure 12.
6. Conclusions
The compressive strength of coal is experimentally investigated under a wide range of confining stresses from 0.25 to 8.0 MPa with an emphasis on the coal pillar strength development. PFC3D numerical modeling was carried out to investigate the strength enhancement mechanism from the micro scale.
The results show that the strength of coal generally increased with the confinement, while the Young’s modulus of coal tends to be confinement-independent. However, such confinement- dependent strength properties can be significantly degraded by existing cracks. The axial strain at macro failure increased with the confinement. Compared to the significant increase in peak compressive strength, the crack initiation stress slightly increased with the confinement. In the early stage of loading, the high confinement restrained the development of microcracks, while in the later stage, it enhanced the frictional resistance. The two mechanisms contribute to the compressive strength enhancement together. With the increase of confinement, three failure modes of coal specimens were revealed: axial splitting at the low confinement, mixed failure mode at the medium confinement and shear band failure mode at the high confinement. Such a failure mode transit is caused by the strength component mobilization due to the increased frictional resistance. The results also show that Mohr-Coulomb, Hoek-Brown and S-shaped failure criteria are all appropriate in describing the confinement-dependent coal strength characterization. The confinement of rapid strength promotion section of S-shape failure envelope falls in a range of 1.5–3.0 MPa, leading to the difficulty of S-shaped failure envelope justification due to the soft nature and heterogeneity of coal.
Author Contributions
J.Z. conceived and designed the experiments and performed the experiments; J.Z. and Y.L. analyzed the data; Y.L. contributed materials and analysis tools; J.Z. wrote the paper.
Funding
The study was financially supported by National Key R&D Program of China (2018YFC0604703) and the research fund of the State Key Laboratory for GeoMechanics and Deep Underground Engineering, CUMTB (SKLGDUEK1828).
Conflicts of Interest
The authors declare no conflict of interest.
List of symbols:
| UCS | Uniaxial compressive strength |
| εv | Volumetric strain |
| εc | Circumferential strain |
| εa | Axial strain |
| Volume change | |
| V0 | Initial volume |
| σ1 | Major principal stress |
| σ3 | Minor principal stress/confining stress |
| c | Cohesion |
| ϕ | Internal friction angle |
| m | Empirical parameter in Hoek-Brown criterion |
| s | Empirical parameter in Hoek-Brown criterion |
| a | constant in Hoek-Brown criterion |
| ACS | Apparent uniaxial compressive strength |
| C | Constant |
| k2 | Slope of the linear fit of UCS to high confinement data |
References
- Kaiser, P.K.; Kim, B.H.; Bewick, R.P.; Valley, B. Rock mass strength at depth and implications for pillar design. Min Technol. 2011, 120, 170–179. [Google Scholar] [CrossRef]
- Yu, B.; Zhang, Z.; Kuang, T.; Liu, J. Stress changes and deformation monitoring of longwall coal pillars located in weak ground. Rock Mech. Rock Eng. 2016, 49, 3293–3305. [Google Scholar] [CrossRef]
- Nara, Y. Effect of Anisotropy on the long-term strength of granite. Rock Mech. Rock Eng. 2014, 48, 959–969. [Google Scholar] [CrossRef]
- Peng, J.; Rong, G.; Cai, M.; Yao, M.; Zhou, C. Comparison of mechanical properties of undamaged and thermal-damaged coarse marbles under triaxial compression. Int. J. Rock Mech. Min. Sci. 2016, 83, 135–139. [Google Scholar] [CrossRef]
- Yang, S.; Jing, H.; Wang, S. Experimental investigation on the strength, deformability, failure behavior and acoustic emission locations of red sandstone under triaxial compression. Rock Mech. Rock Eng. 2012, 45, 583–606. [Google Scholar] [CrossRef]
- Amann, F.; Kaiser, P.; Button, E.A. Experimental study of brittle behavior of clay shale in rapid triaxial compression. Rock Mech. Rock Eng. 2011, 45, 21–33. [Google Scholar] [CrossRef]
- Rybacki, E.; Reinicke, A.; Meier, T.; Makasi, M.; Dresen, G. What controls the mechanical properties of shale rocks?—Part I: Strength and Young’s modulus. J. Pet. Sci. Eng. 2015, 135, 702–722. [Google Scholar] [CrossRef]
- Ishii, E.; Sanada, H.; Iwatsuki, T.; Sugita, Y.; Kurikami, H. Mechanical strength of the transition zone at the boundary between opal-A and opal-CT zones in siliceous rocks. Eng. Geol. 2011, 122, 215–221. [Google Scholar] [CrossRef]
- Li, D.; Wong, L.N.Y.; Liu, G.; Zhang, X. Influence of water content and anisotropy on the strength and deformability of low porosity meta-sedimentary rocks under triaxial compression. Eng. Geol. 2012, 126, 46–66. [Google Scholar] [CrossRef]
- Peng, J.; Cai, M.; Rong, G.; Zhou, C.; Wang, X. Author’s reply to discussion of the paper “an empirical failure criterion for intact rocks” by Peng et al. Rock Mech. Rock Eng. 2014, 47, 825–834. [Google Scholar] [CrossRef]
- Peng, J.; Rong, G.; Cai, M.; Wang, X.; Zhou, C. An empirical failure criterion for intact Rocks. Rock Mech. Rock Eng. 2014, 47, 347–356. [Google Scholar] [CrossRef]
- Heidari, M.; Khanlari, G.R.; Torabi-Kaveh, M.; Kargarian, S.; Saneie, S. Effect of porosity on rock brittleness. Rock Mech. Rock Eng. 2013, 47, 785–790. [Google Scholar] [CrossRef]
- Baud, P.; Wong, T.; Zhu, W. Effects of porosity and crack density on the compressive strength of rocks. Int. J. Rock Mech. Min. Sci. 2014, 67, 202–211. [Google Scholar] [CrossRef]
- Hsieh, A.; Dyskin, A.V.; Dight, P. The increase in Young’s modulus of rocks under uniaxial compression. Int. J. Rock Mech. Min. Sci. 2014, 70, 425–434. [Google Scholar] [CrossRef]
- Shang, J.; Hu, J.; Zhou, K.; Luo, X.; Aliyu, M.M. Porosity increment and strength degradation of low-porosity sedimentary rocks under different loading conditions. Int. J. Rock Mech. Min. Sci. 2015, 75, 216–223. [Google Scholar] [CrossRef]
- Kaiser, P.K.; Kim, B.H. Rock mechanics changes in underground construction and mining. In Proceedings of the 1st South Hemisphere International Rock Mechanics Symposium, Perth, Australia, 16–19 September 2008; pp. 1–14. [Google Scholar]
- Kim, B.H.; Kaiser, P.K. Rock strength characterization for excavation in brittle failing rock. In Proceedings of the 3rd CANUS Rock Mechanics Symposium, Toronto, ON, Canada, 9–15 May 2009; p. 3946. [Google Scholar]
- Hajiabdolmajid, V.; Kaiser, P.; Martin, C.D. Mobilised strength components in brittle failure of rock. Géotechnique 2003, 53, 327–336. [Google Scholar] [CrossRef]
- Cai, M.; Kaiser, P.K. In-situ rock spalling strength near excavation boundaries. Rock Mech. Rock Eng. 2013, 47, 659–675. [Google Scholar] [CrossRef]
- Buzzi, O.; Sieffert, Y.; Mendes, J.; Liu, X.; Giacomini, A.; Seedsman, R. Strength of an Australian coal under low confinement. Rock Mech. Rock Eng. 2013, 47, 2265–2270. [Google Scholar] [CrossRef]
- ISRM. Suggested methods for determining the strength of rock materials in triaxial compression. Int. J. Rock Mech. Min. Sci. Geomech. Abstr. 1978, 15, 47–51. [Google Scholar] [CrossRef]
- Potyondy, D.O.; Cundall, P.A. A bonded-particle model for rock. Int. J. Rock Mech. Min. Sci. 2004, 41, 1329–1364. [Google Scholar] [CrossRef]
- Cho, N.; Martin, C.; Sego, D. A clumped particle model for rock. Int. J. Rock Mech. Min. Sci. 2007, 44, 997–1010. [Google Scholar] [CrossRef]
- Xu, X.; Wu, S.; Gao, Y.; Xu, M. Effects of Micro-structure and Micro-parameters on Brazilian Tensile Strength Using Flat-Joint Model. Rock Mech. Rock Eng. 2016, 49, 3575–3595. [Google Scholar] [CrossRef]
- Fakhimi, A.; Villegas, T. Application of dimensional analysis in calibration of a discrete element model for rock deformation and fracture. Rock Mech. Rock Eng. 2007, 40, 193–211. [Google Scholar] [CrossRef]
- Yoon, J. Application of experimental design and optimization to PFC model calibration in uniaxial compression simulation. Int. J. Rock Mech. Min. Sci. 2007, 44, 871–889. [Google Scholar] [CrossRef]
- Liu, G.; Rong, G.; Peng, J.; Zhou, C.B. Numerical simulation on undrained triaxial behavior of saturated soil by a fluid coupled-DEM model. Eng. Geol. 2015, 193, 256–266. [Google Scholar] [CrossRef]
- Brace, W.F.; Paulding, B.R.; Scholz, C. Dilatancy in fracture of crystalline rocks. J. Geophys. Res. 1966, 71, 3939–3953. [Google Scholar] [CrossRef]
- Kaiser, P.K.; Kim, B.H. Characterization of strength of intact brittle rock considering confinement-dependent failure processes. Rock Mech. Rock Eng. 2015, 48, 107–119. [Google Scholar] [CrossRef]
- Hoek, E. Rock Fracture under Static Stress Conditions. PhD Thesis, University of Cape Town, Cape Town, South Africa, 1965. [Google Scholar]
Figure 1.
Cumulative volume of intruded mercury into coal from low to high pressure.
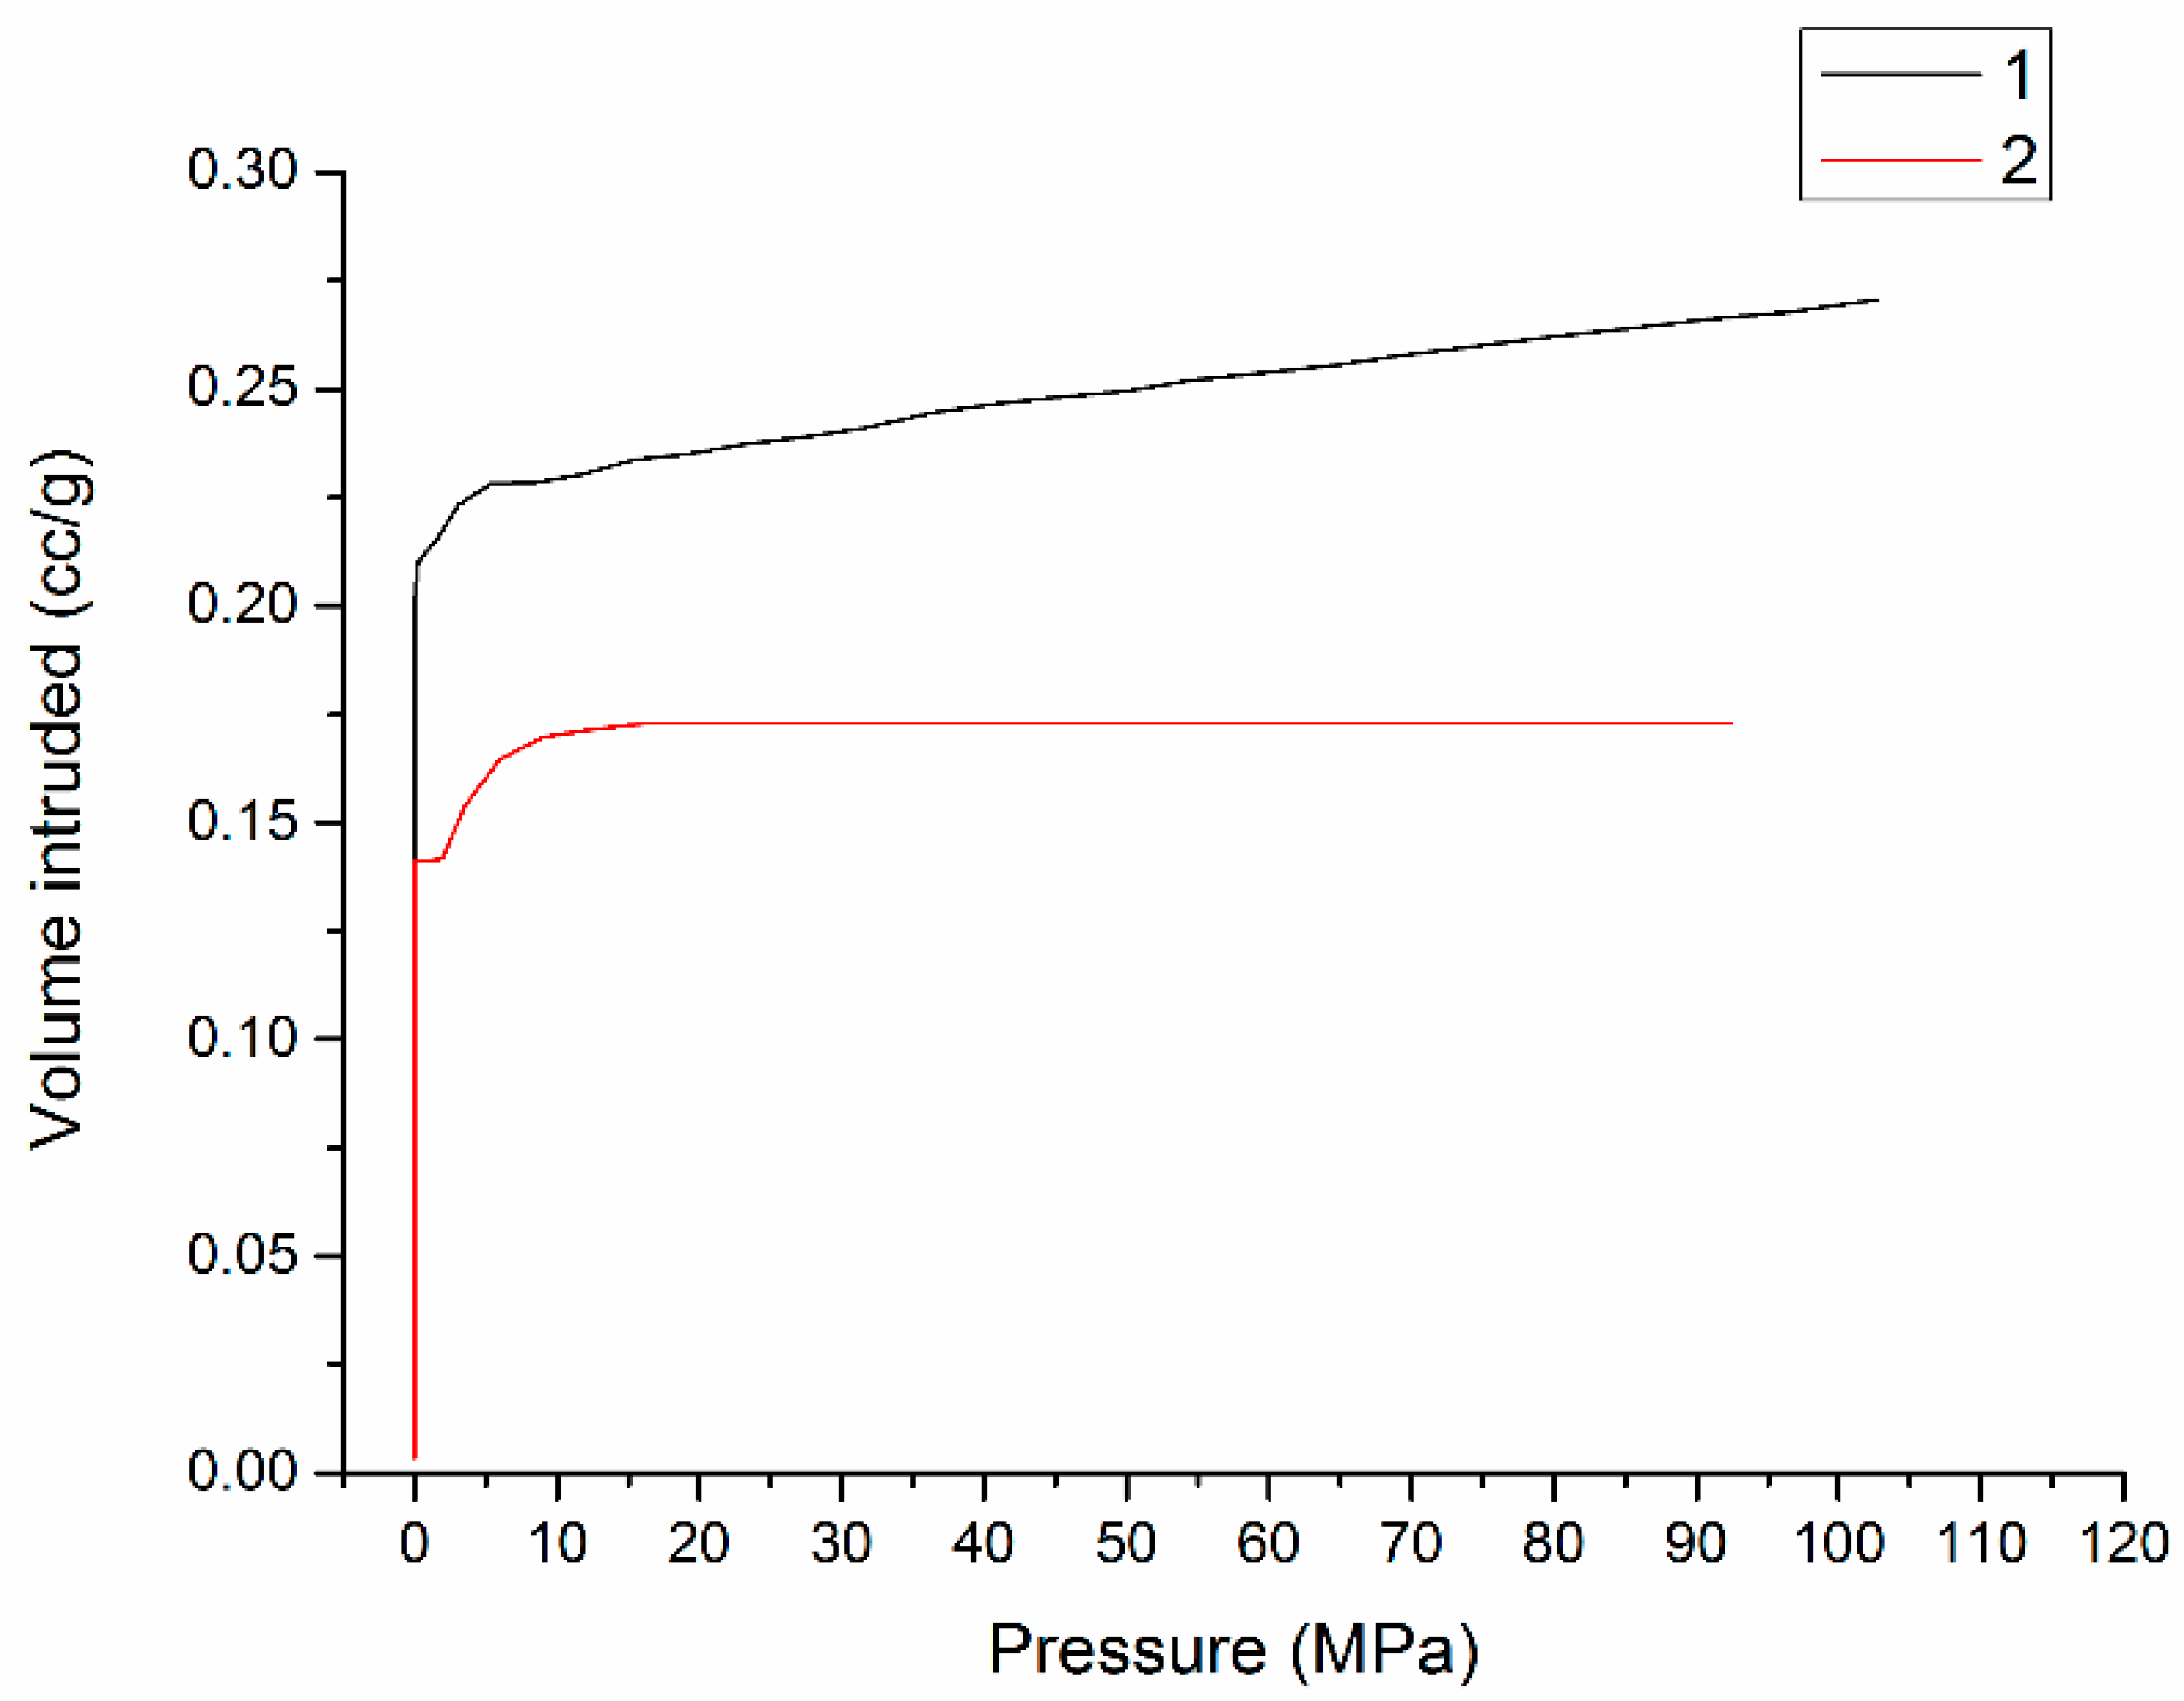
Figure 2.
Pore size distribution of coal.
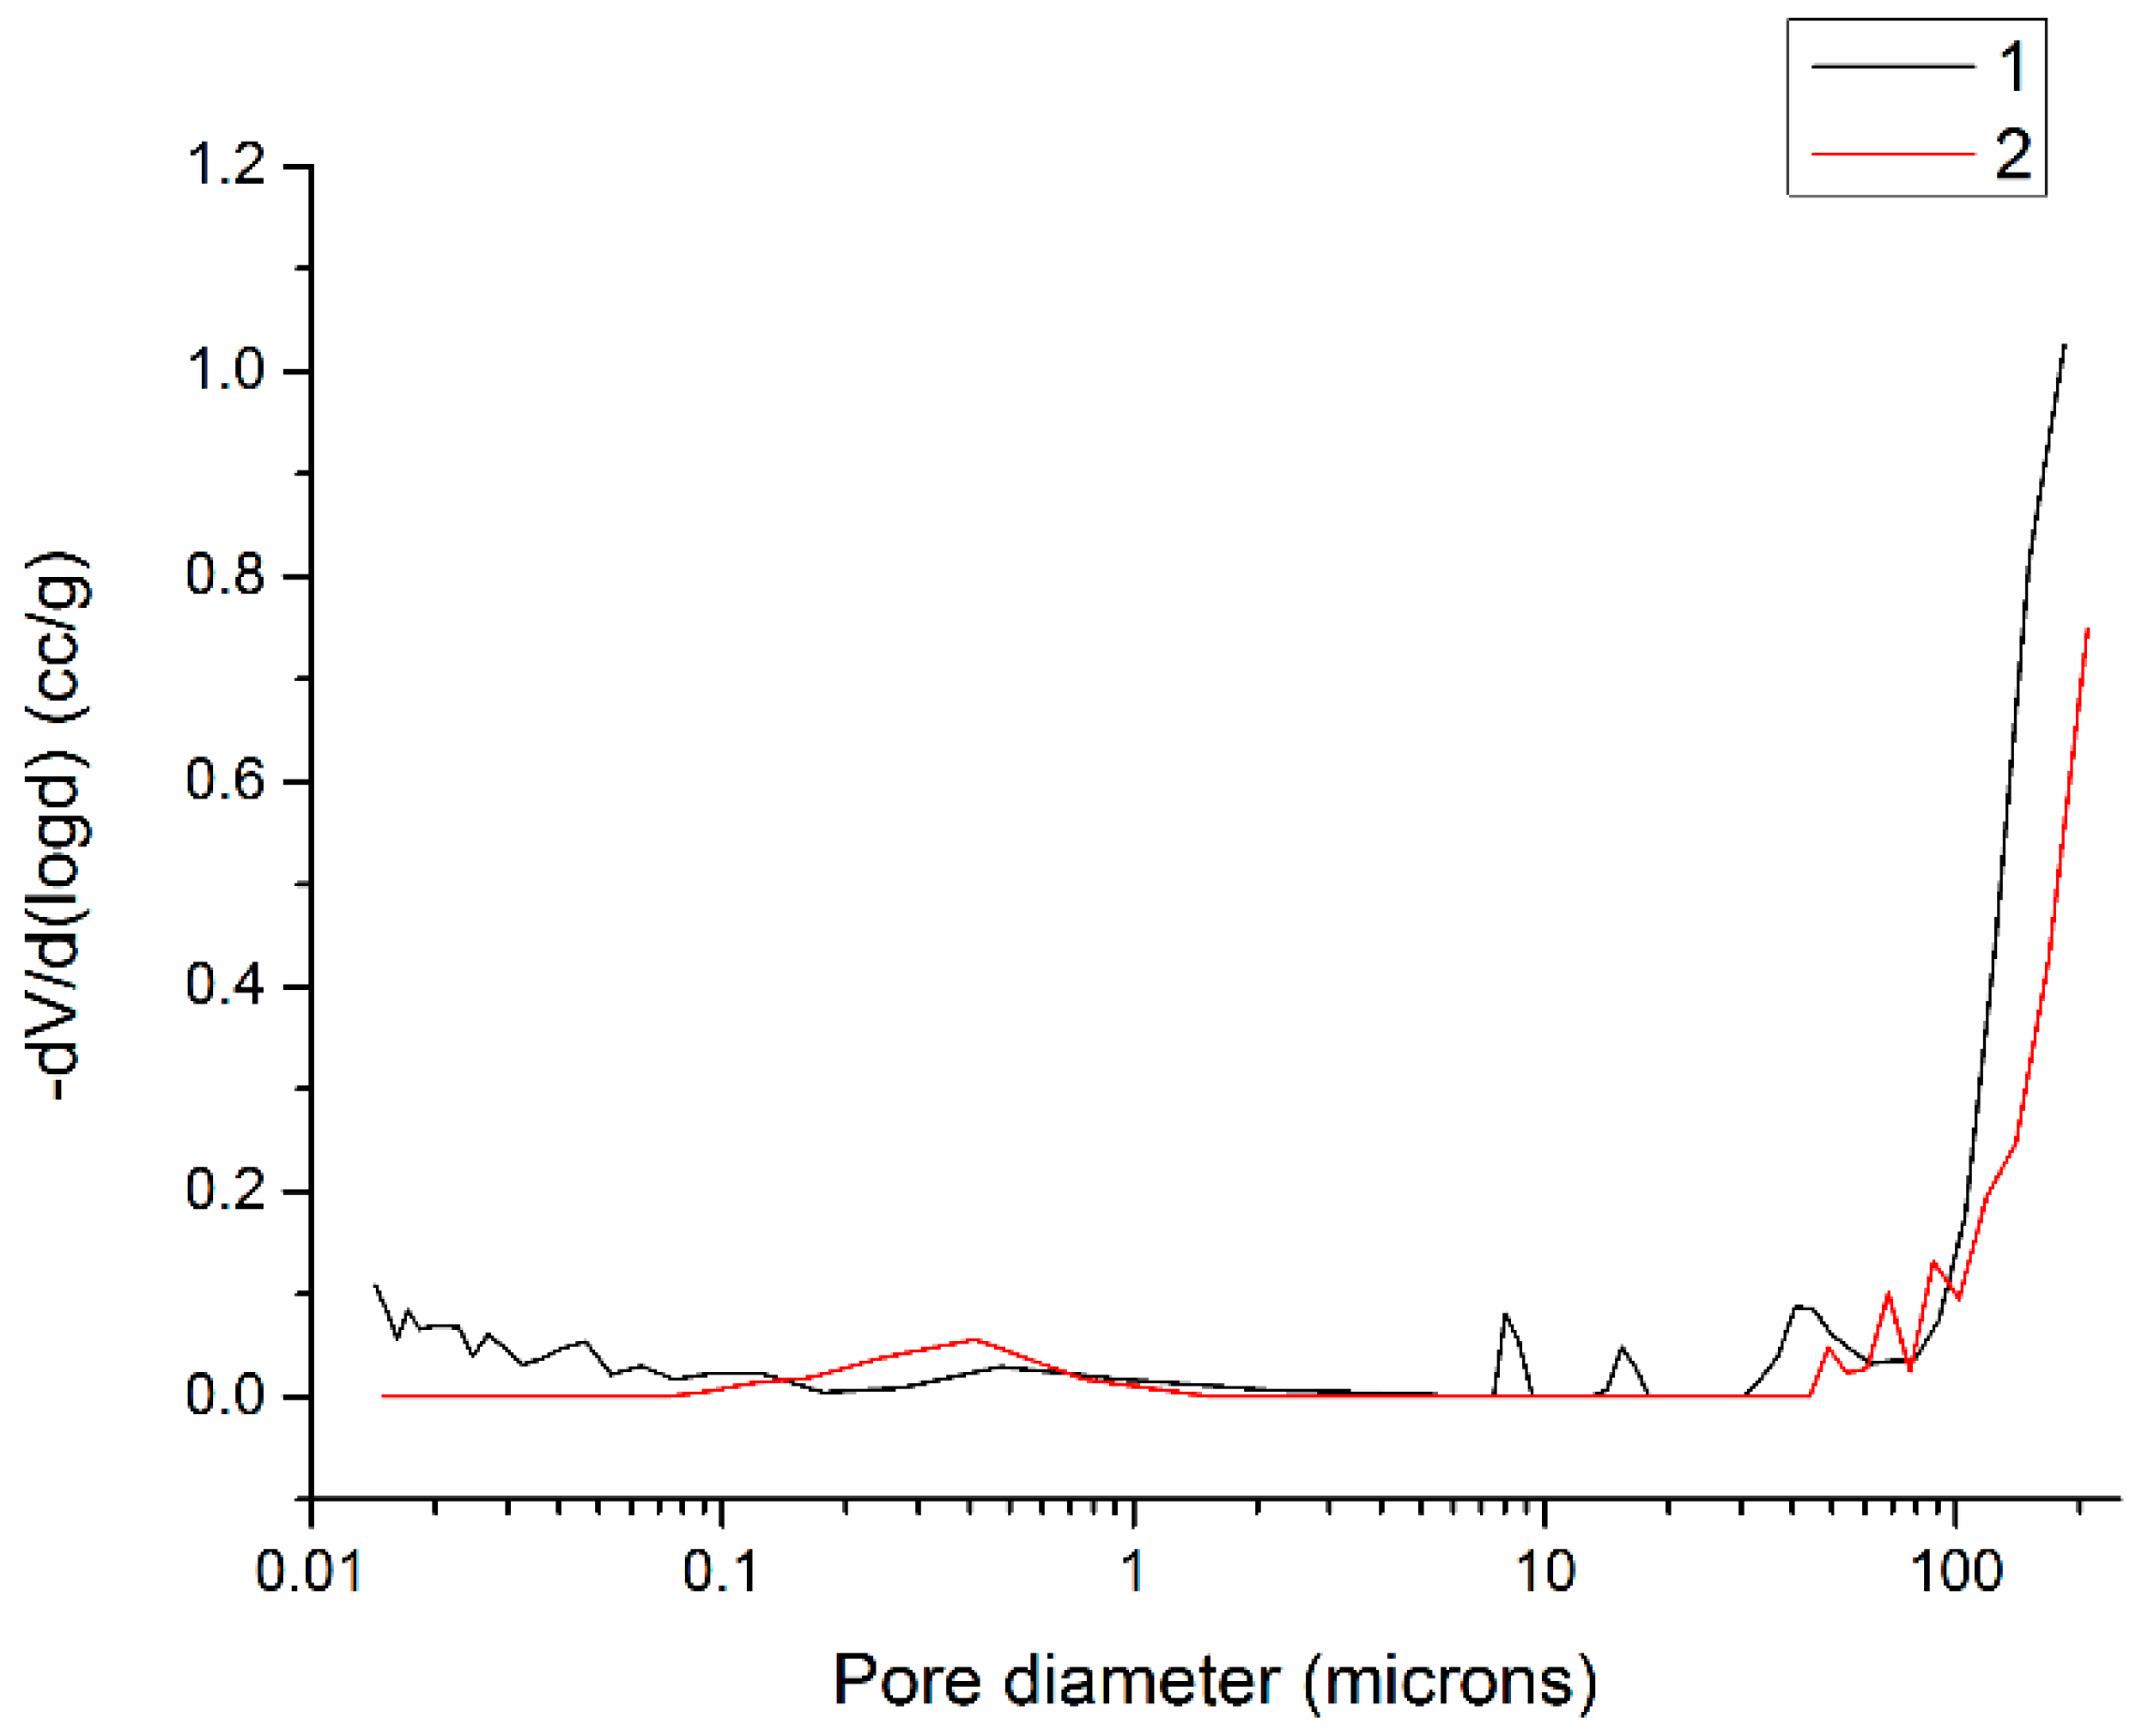
Figure 3.
Experimental set-up for the triaxial tests.
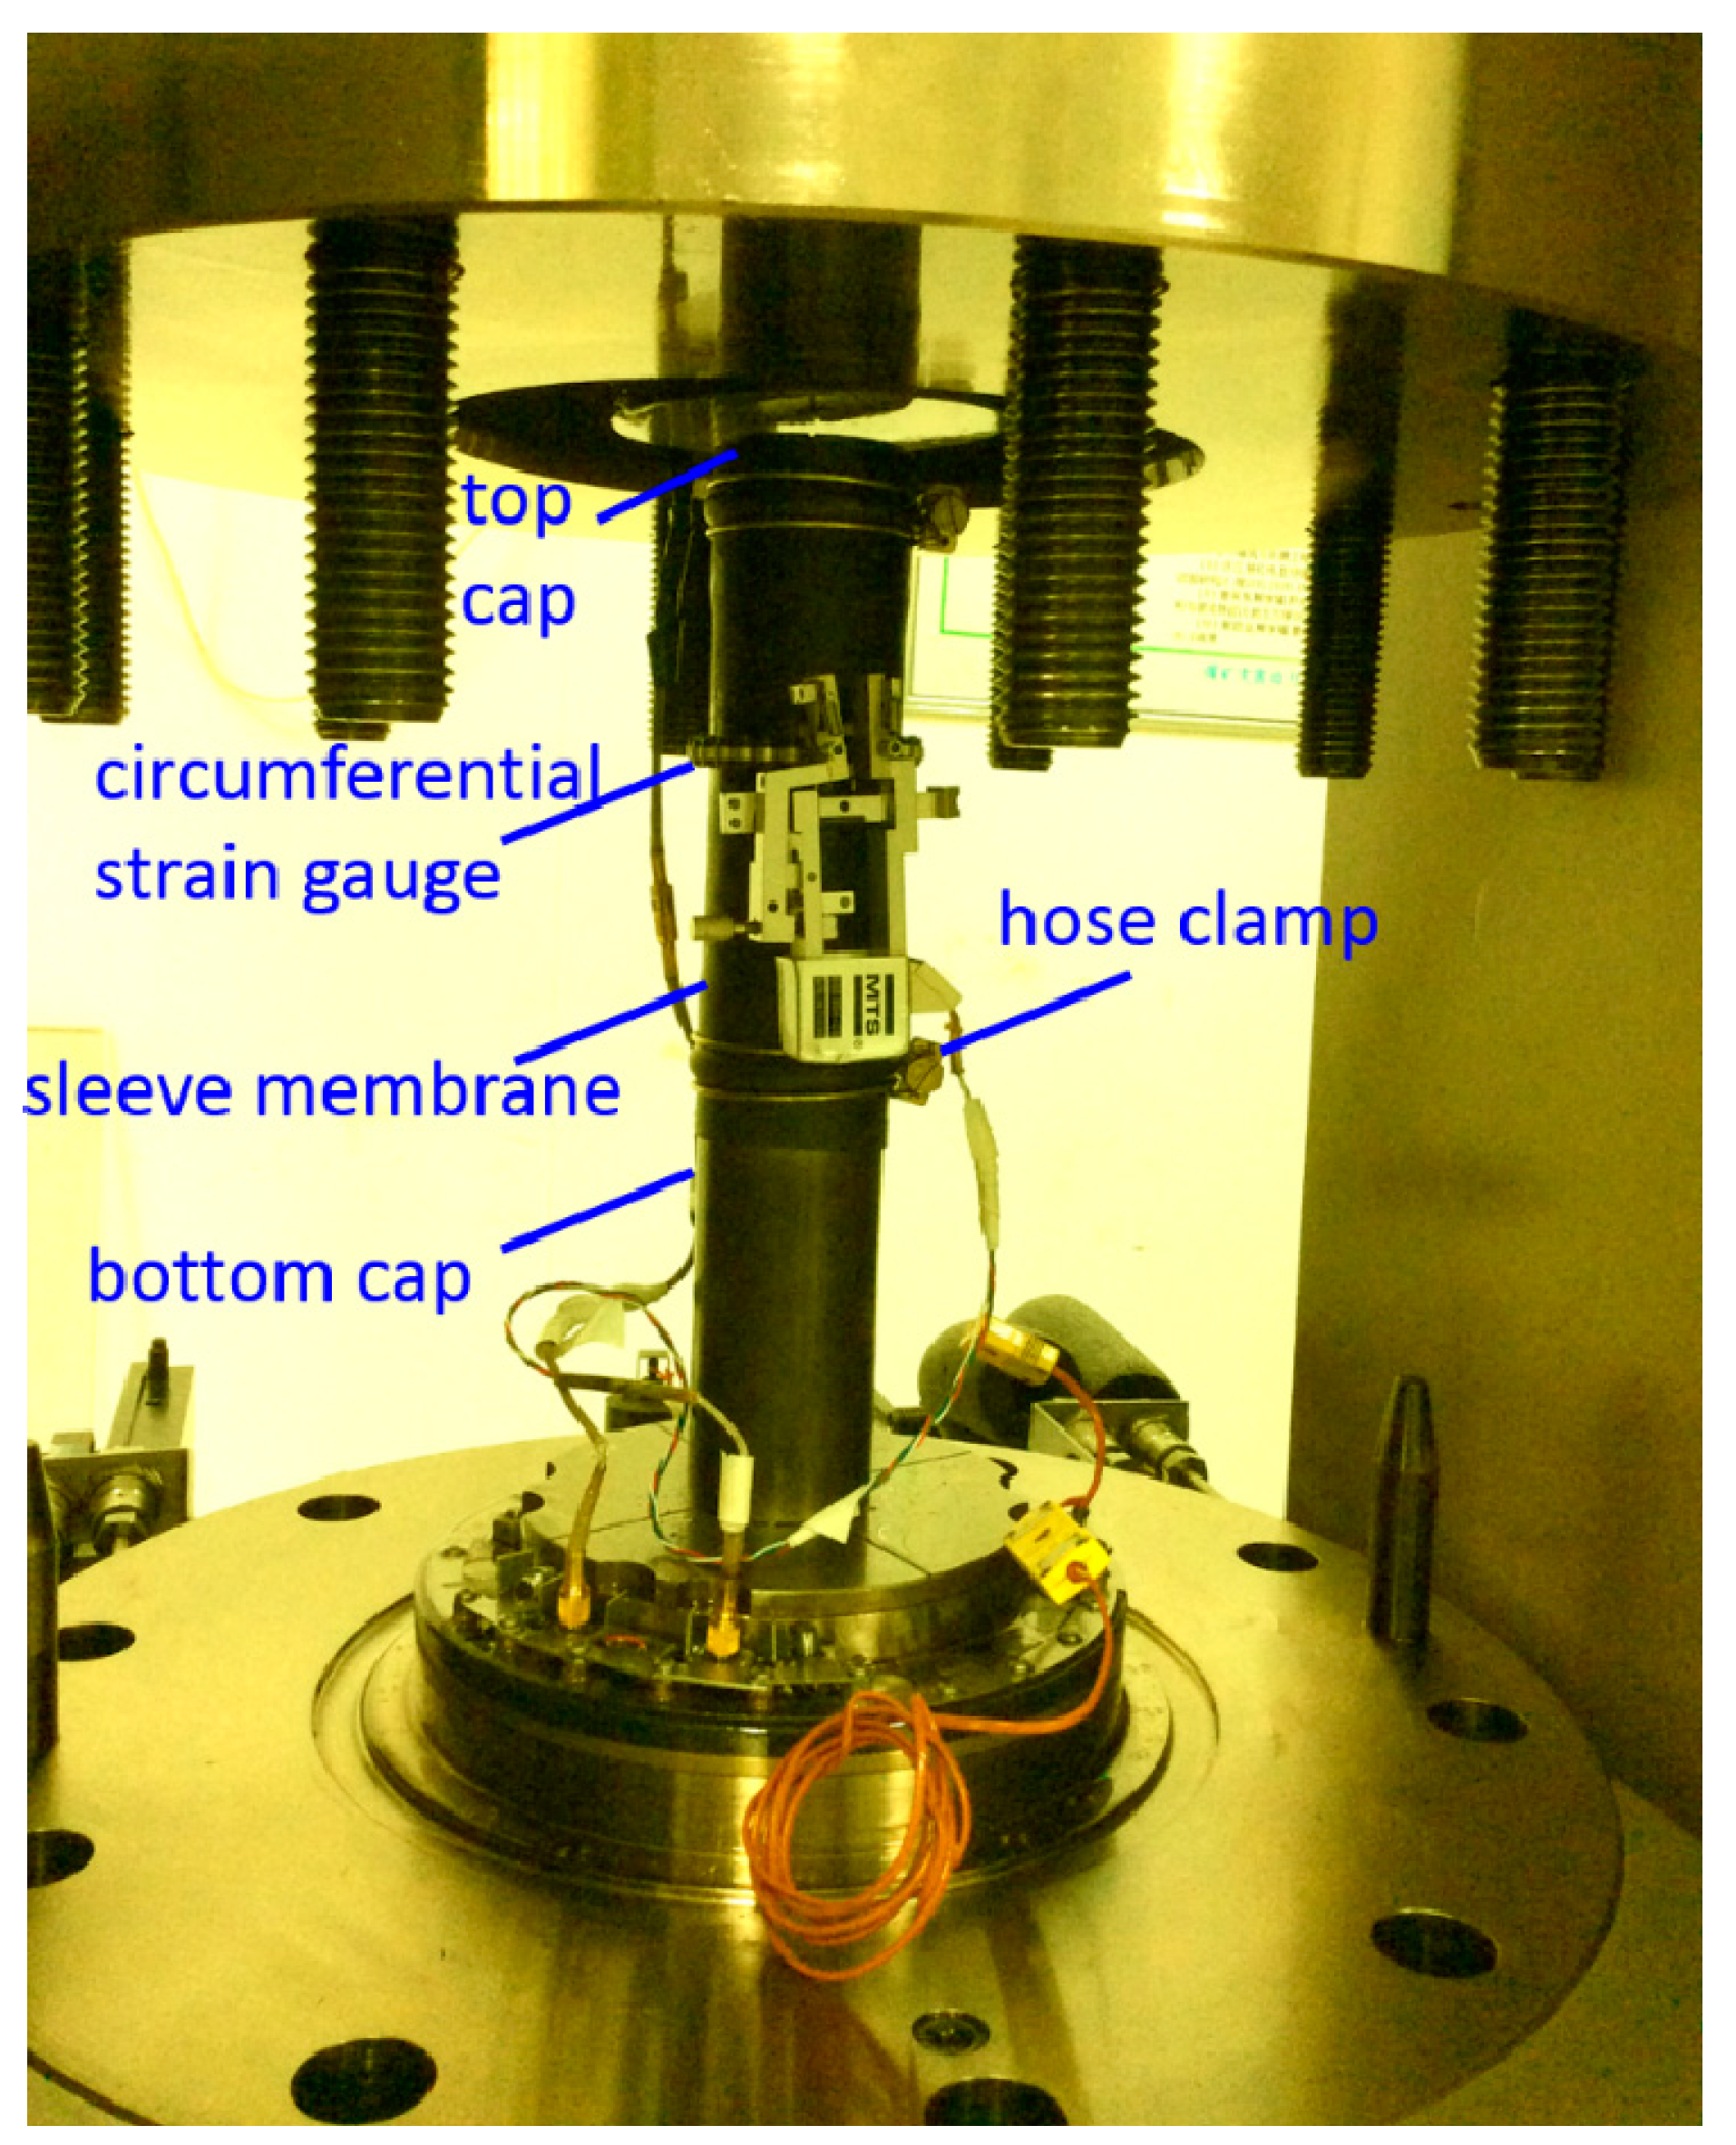
Figure 4.
Specimens used for triaxial tests: (a) group 1, (b) group 2.

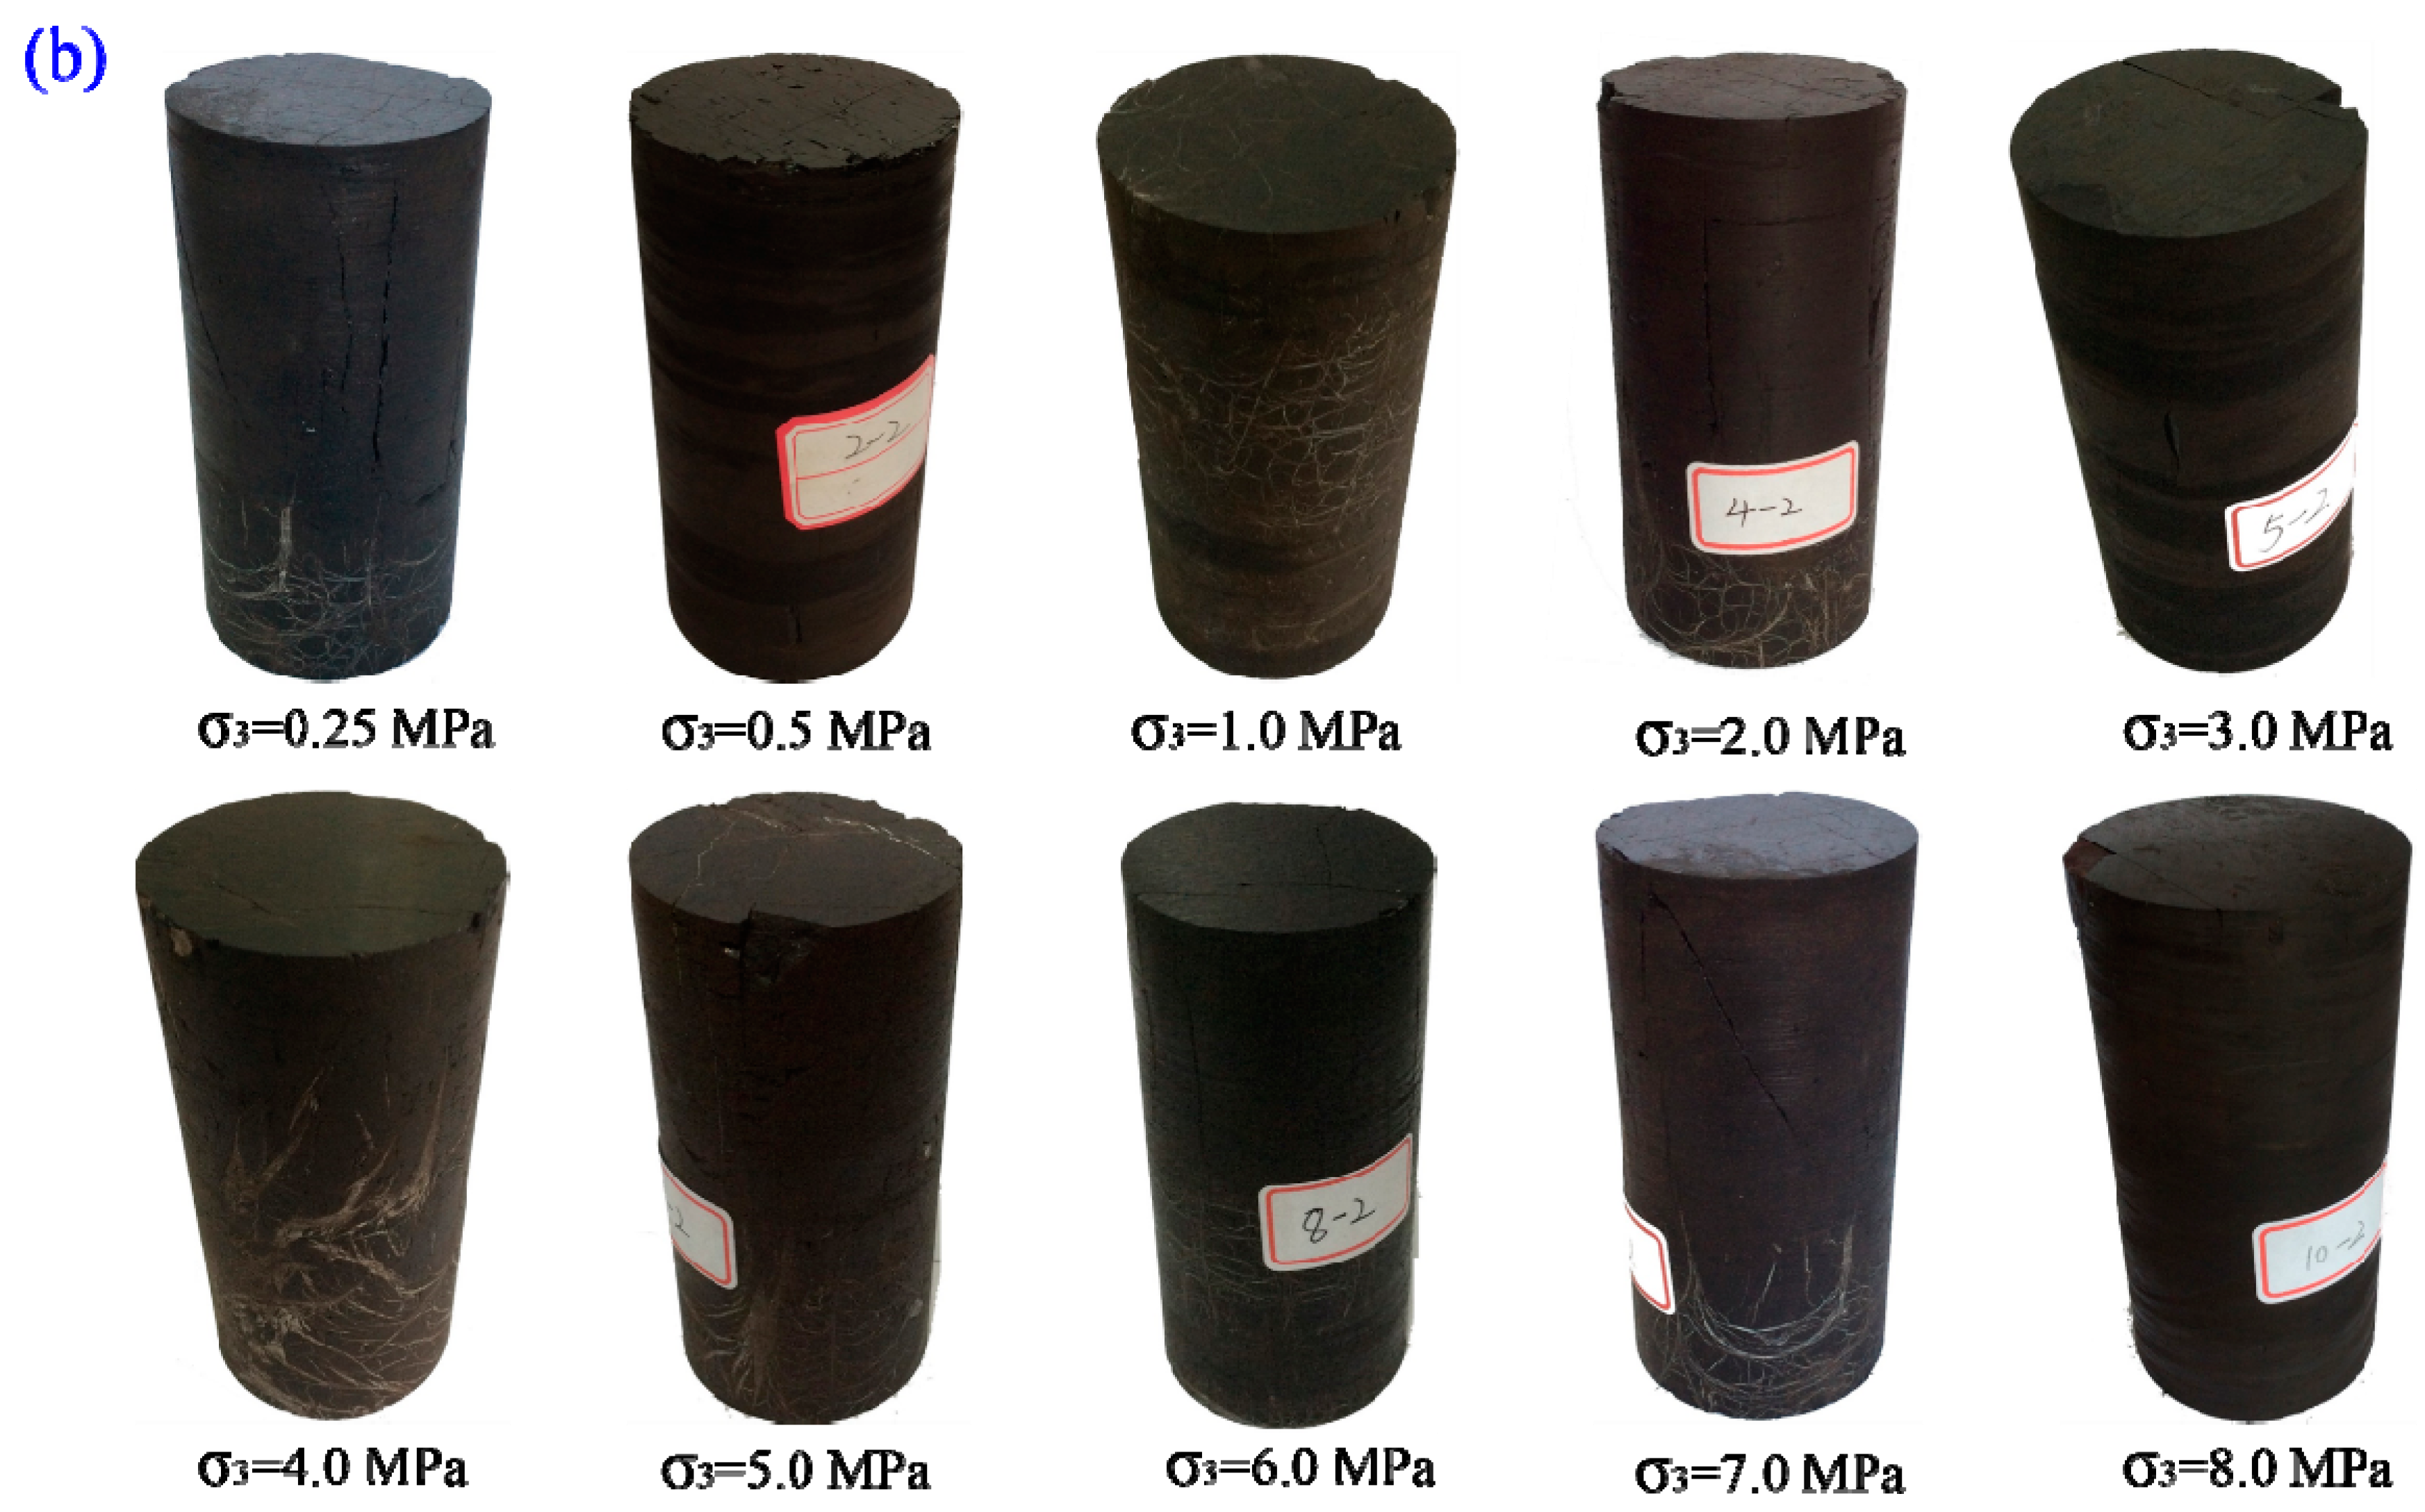
Figure 5.
Axial and circumferential strain behavior of coal specimens under different confining stresses: (a) group 1; (b) group 2.
Figure 5.
Axial and circumferential strain behavior of coal specimens under different confining stresses: (a) group 1; (b) group 2.
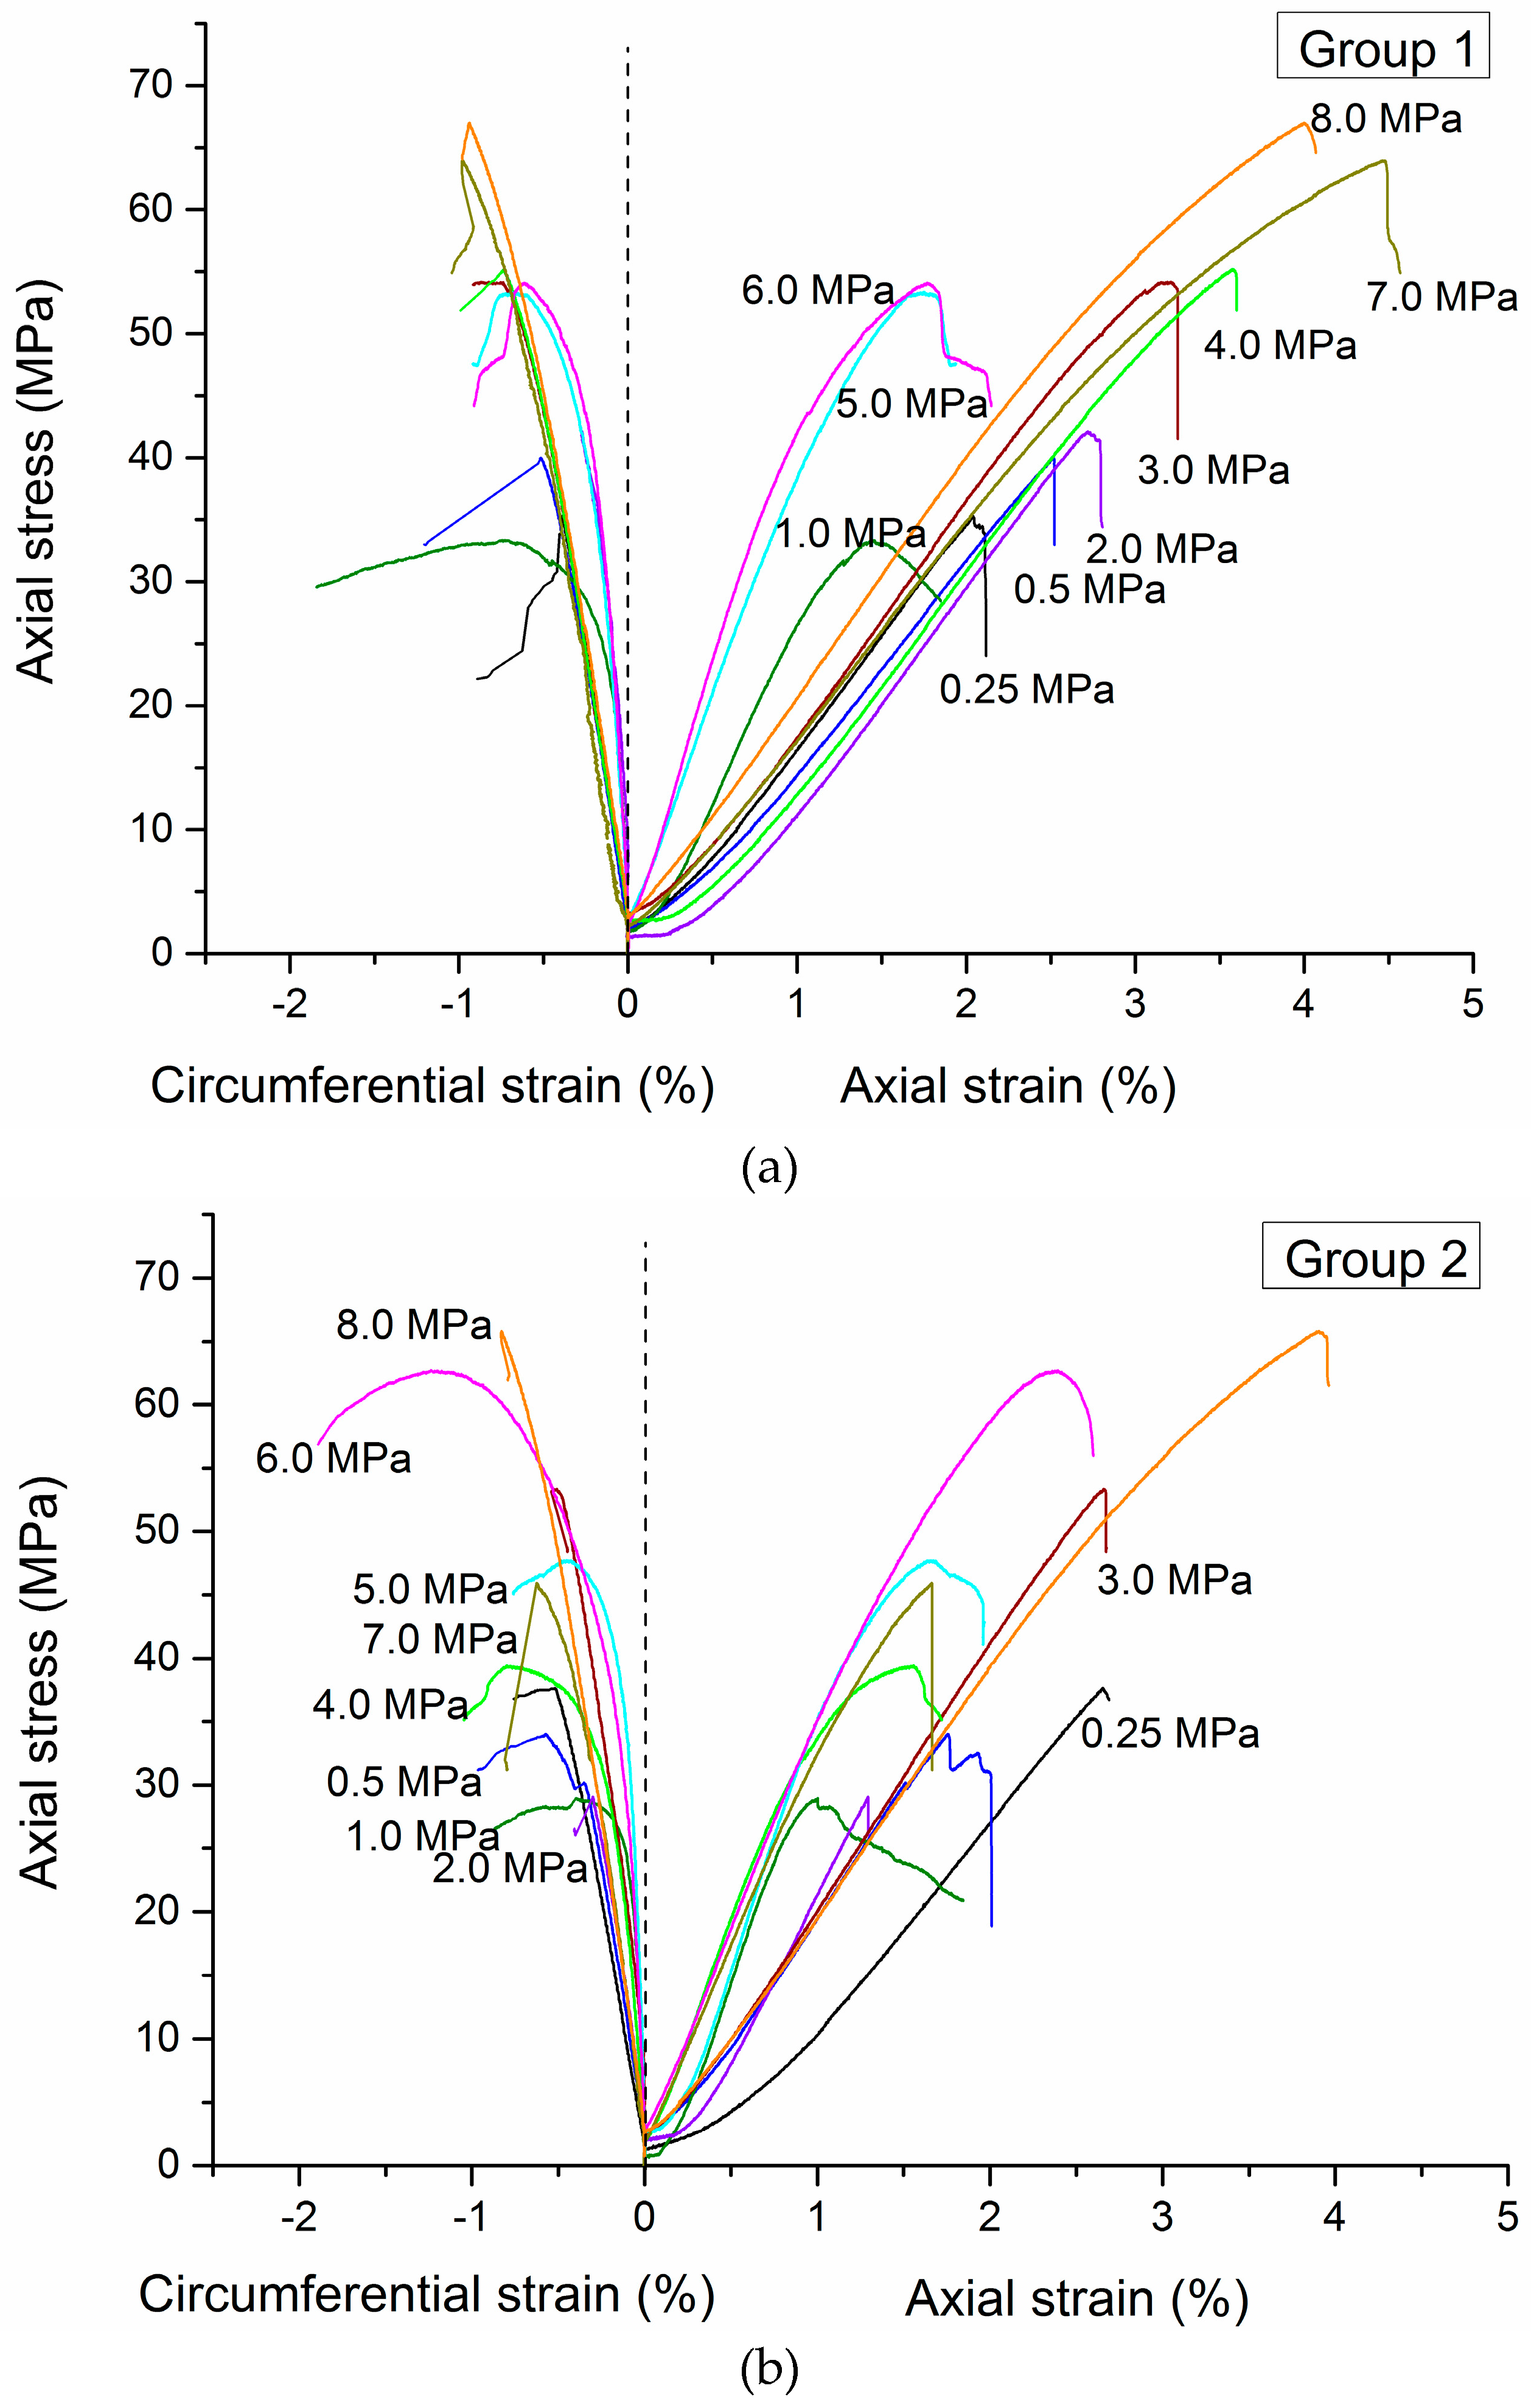
Figure 6.
Visually-observed defects of coal specimens before triaxial tests: (a) σ3 = 1.0 MPa; (b) σ3 = 5.0 MPa; (c) σ3 = 6.0 MPa.
Figure 6.
Visually-observed defects of coal specimens before triaxial tests: (a) σ3 = 1.0 MPa; (b) σ3 = 5.0 MPa; (c) σ3 = 6.0 MPa.
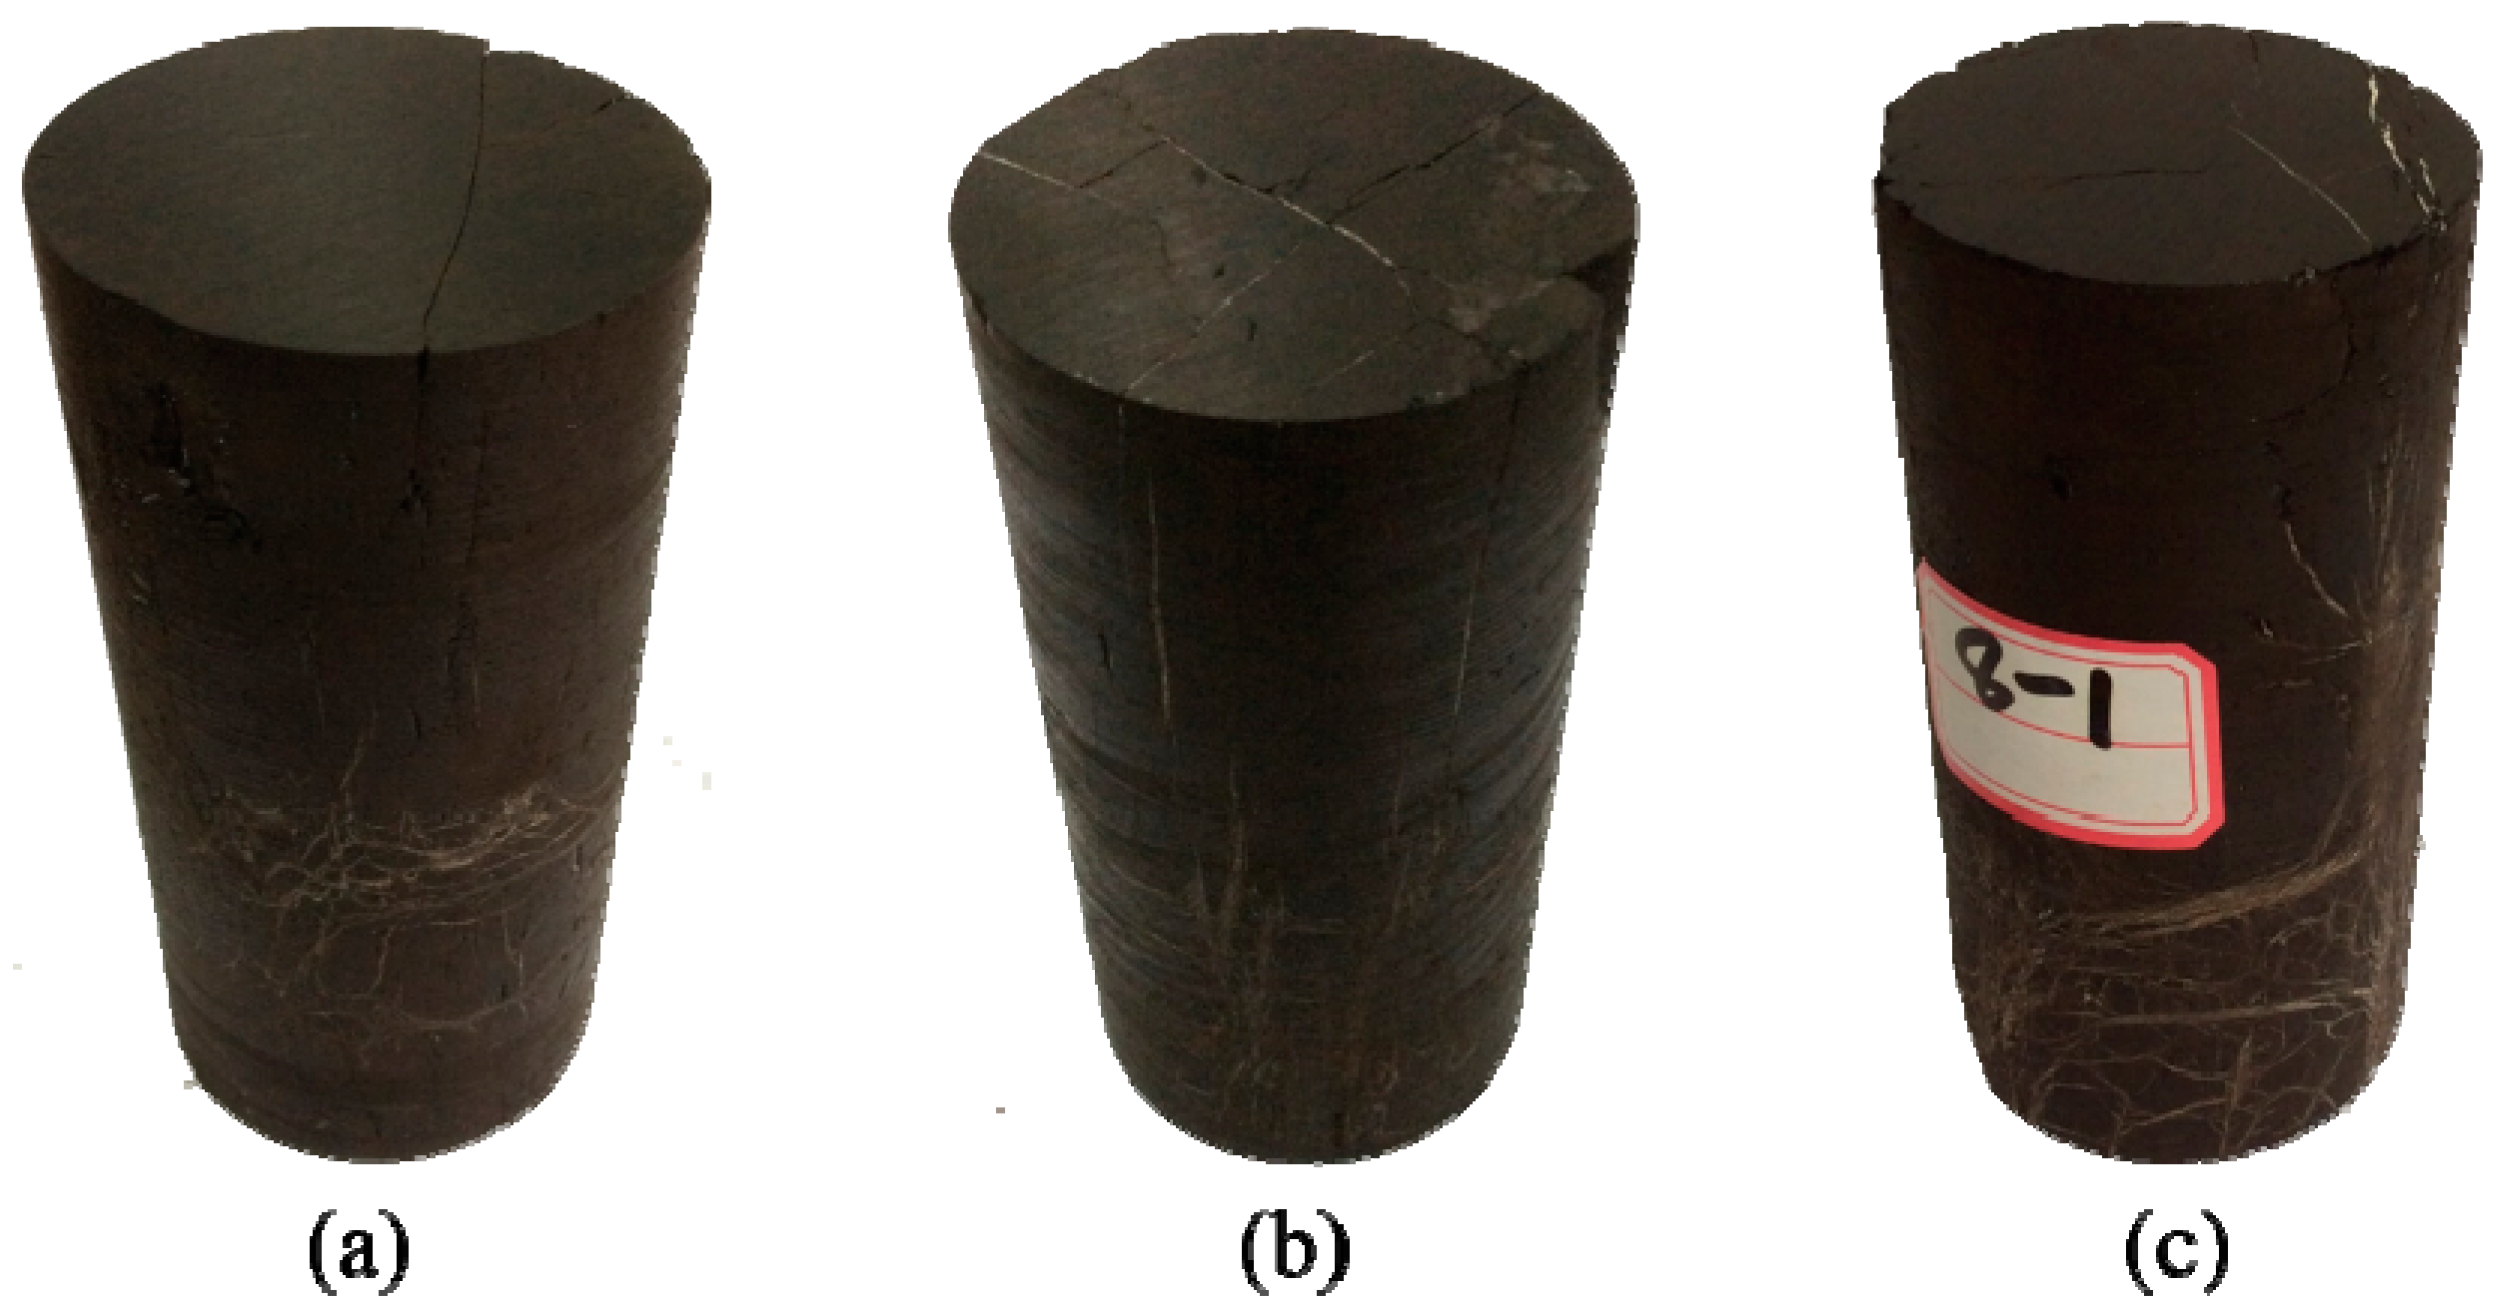
Figure 7.
Axial stress and volumetric strain behavior of coal specimens under different confining stresses: (a) group 1; (b) group 2.
Figure 7.
Axial stress and volumetric strain behavior of coal specimens under different confining stresses: (a) group 1; (b) group 2.
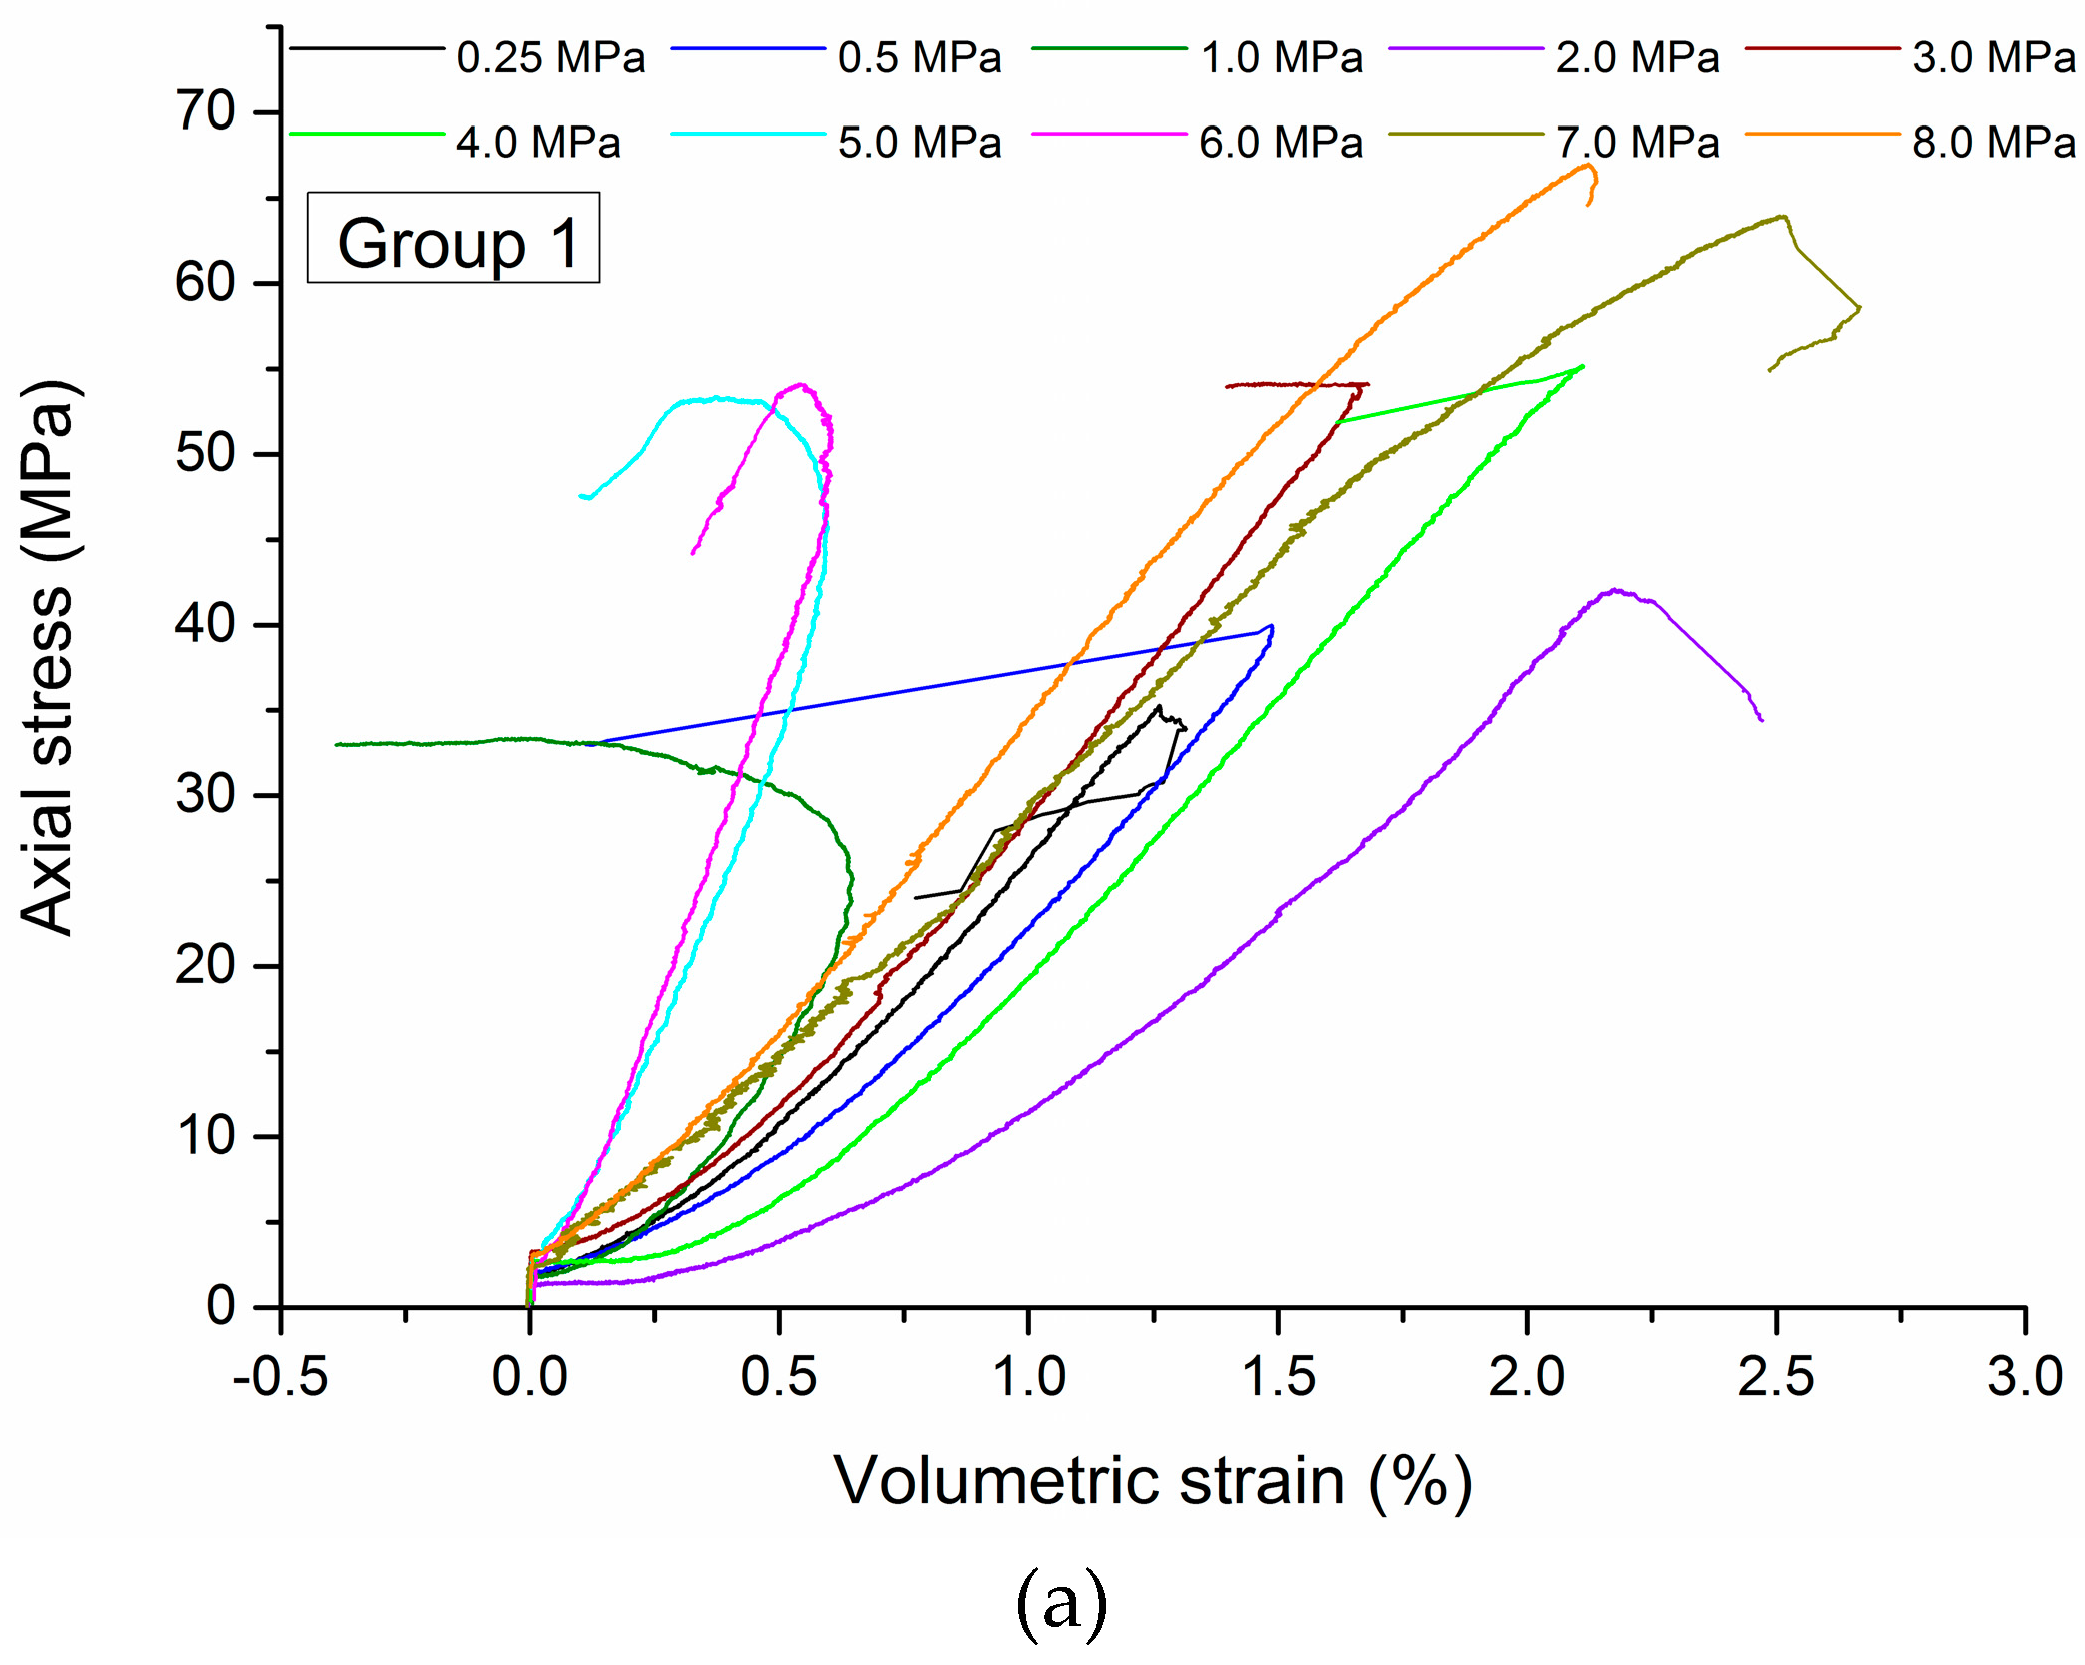
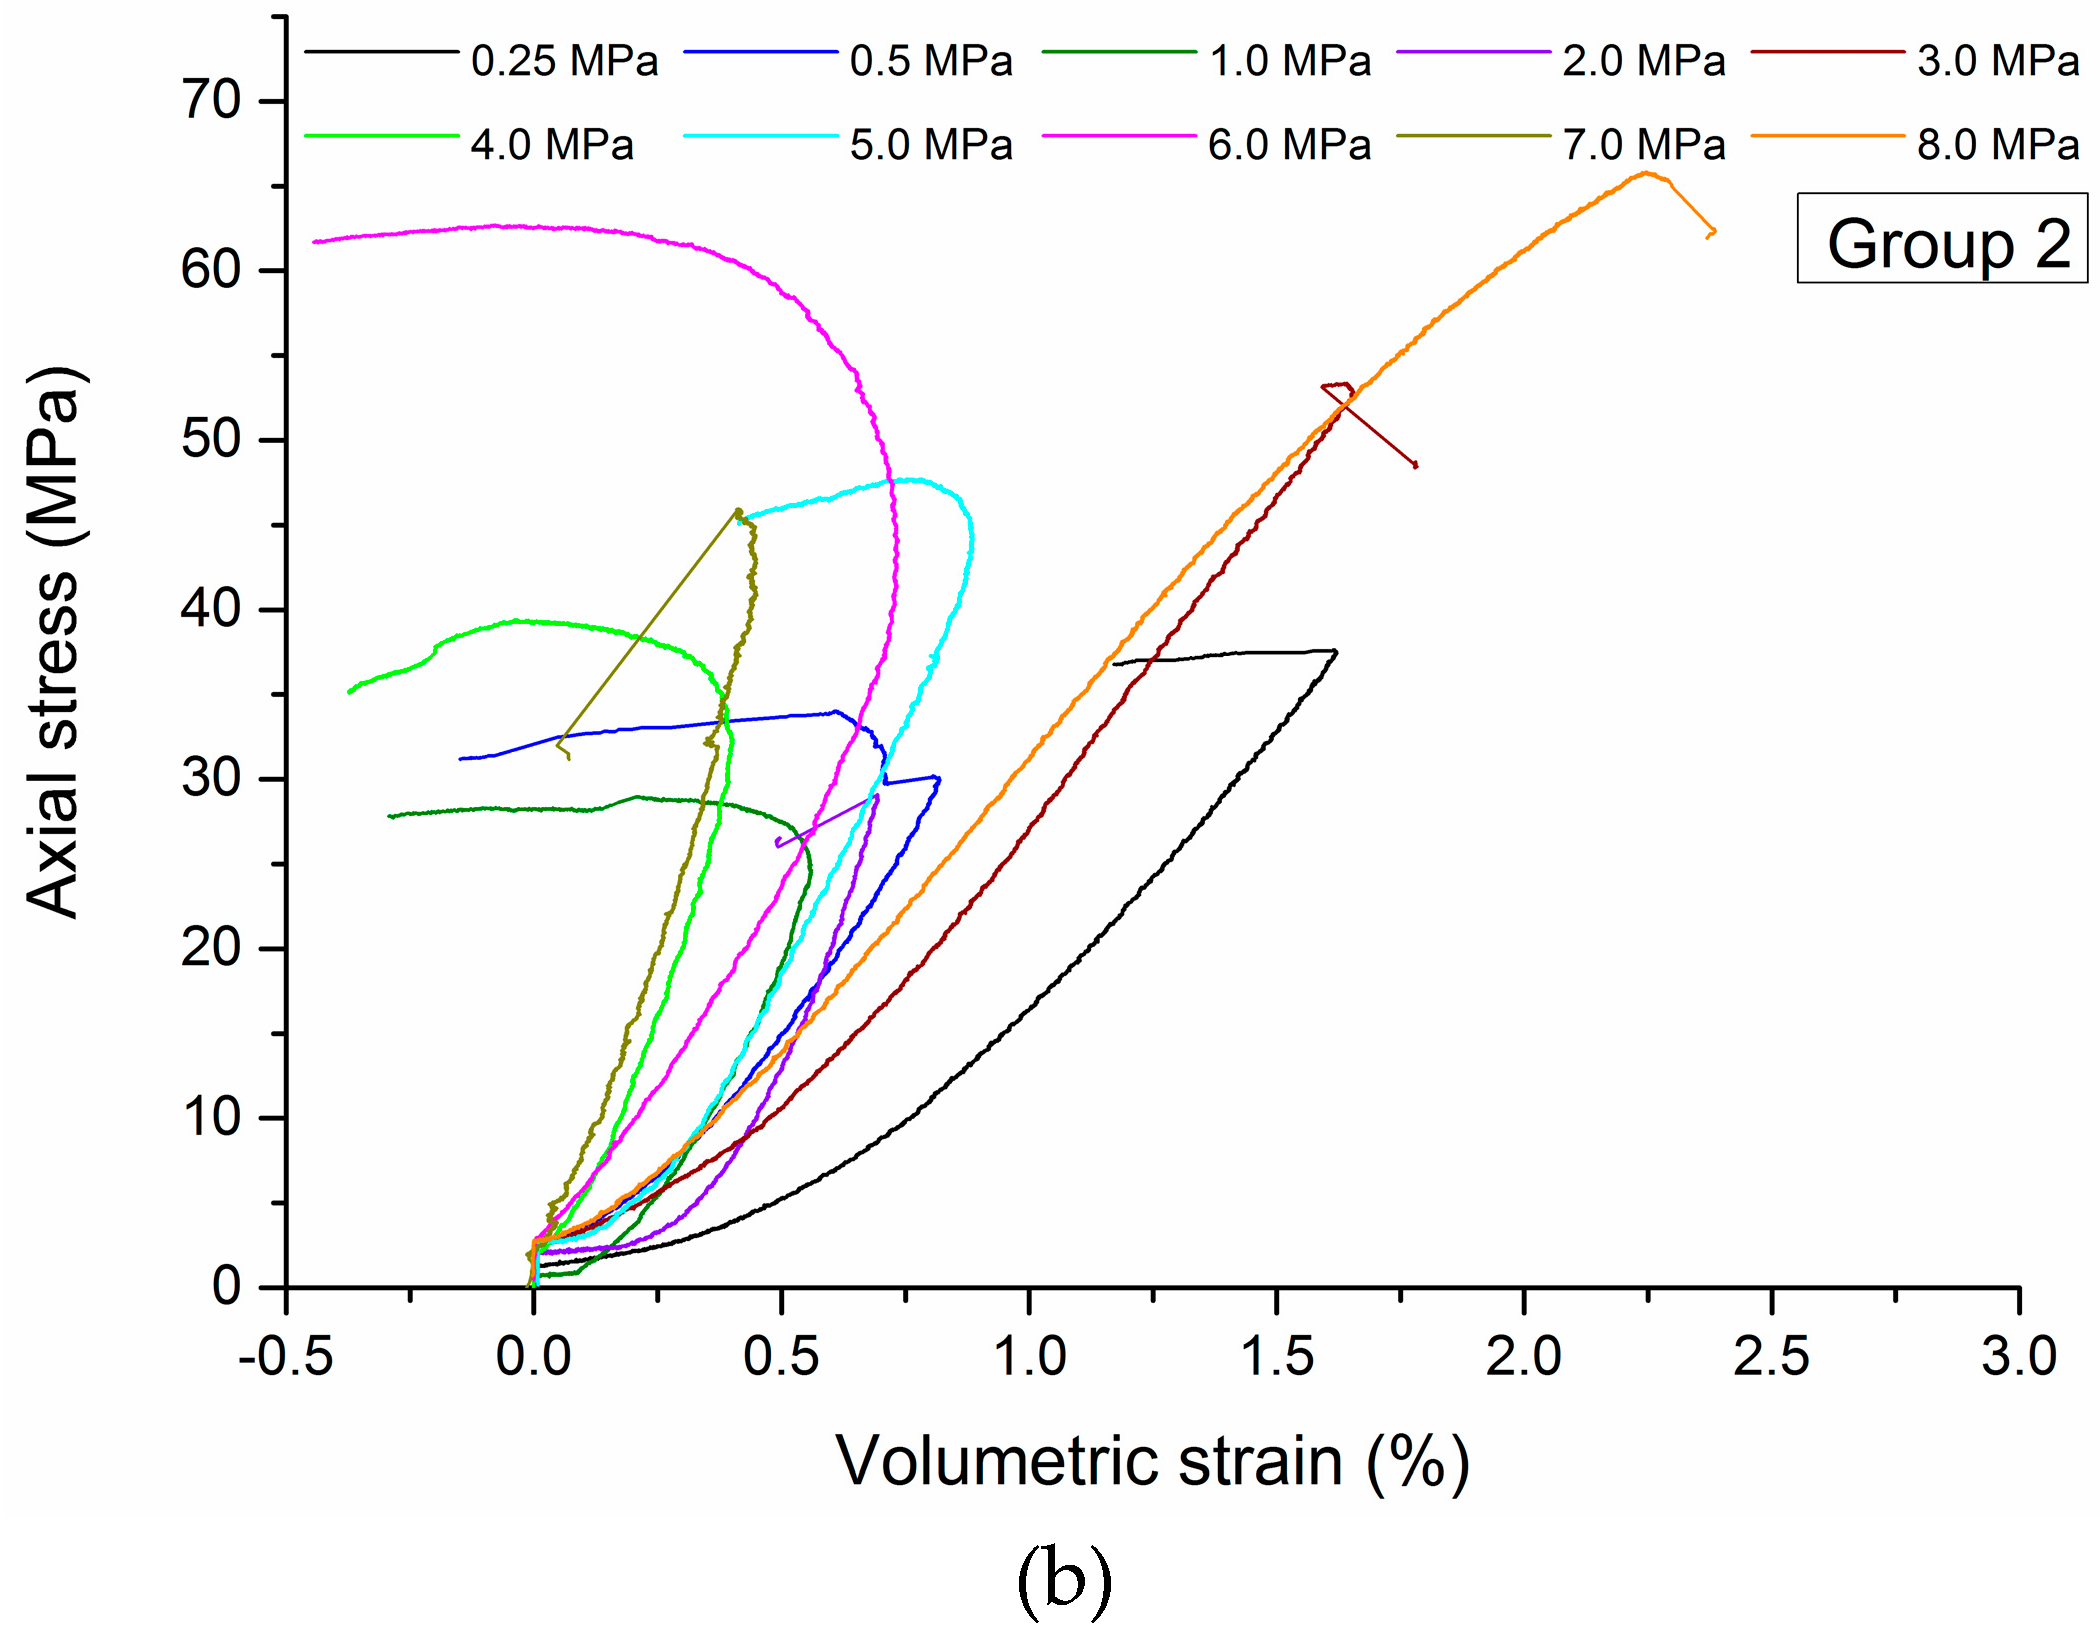
Figure 8.
Failure pattern evolution with the increase of confining stress.
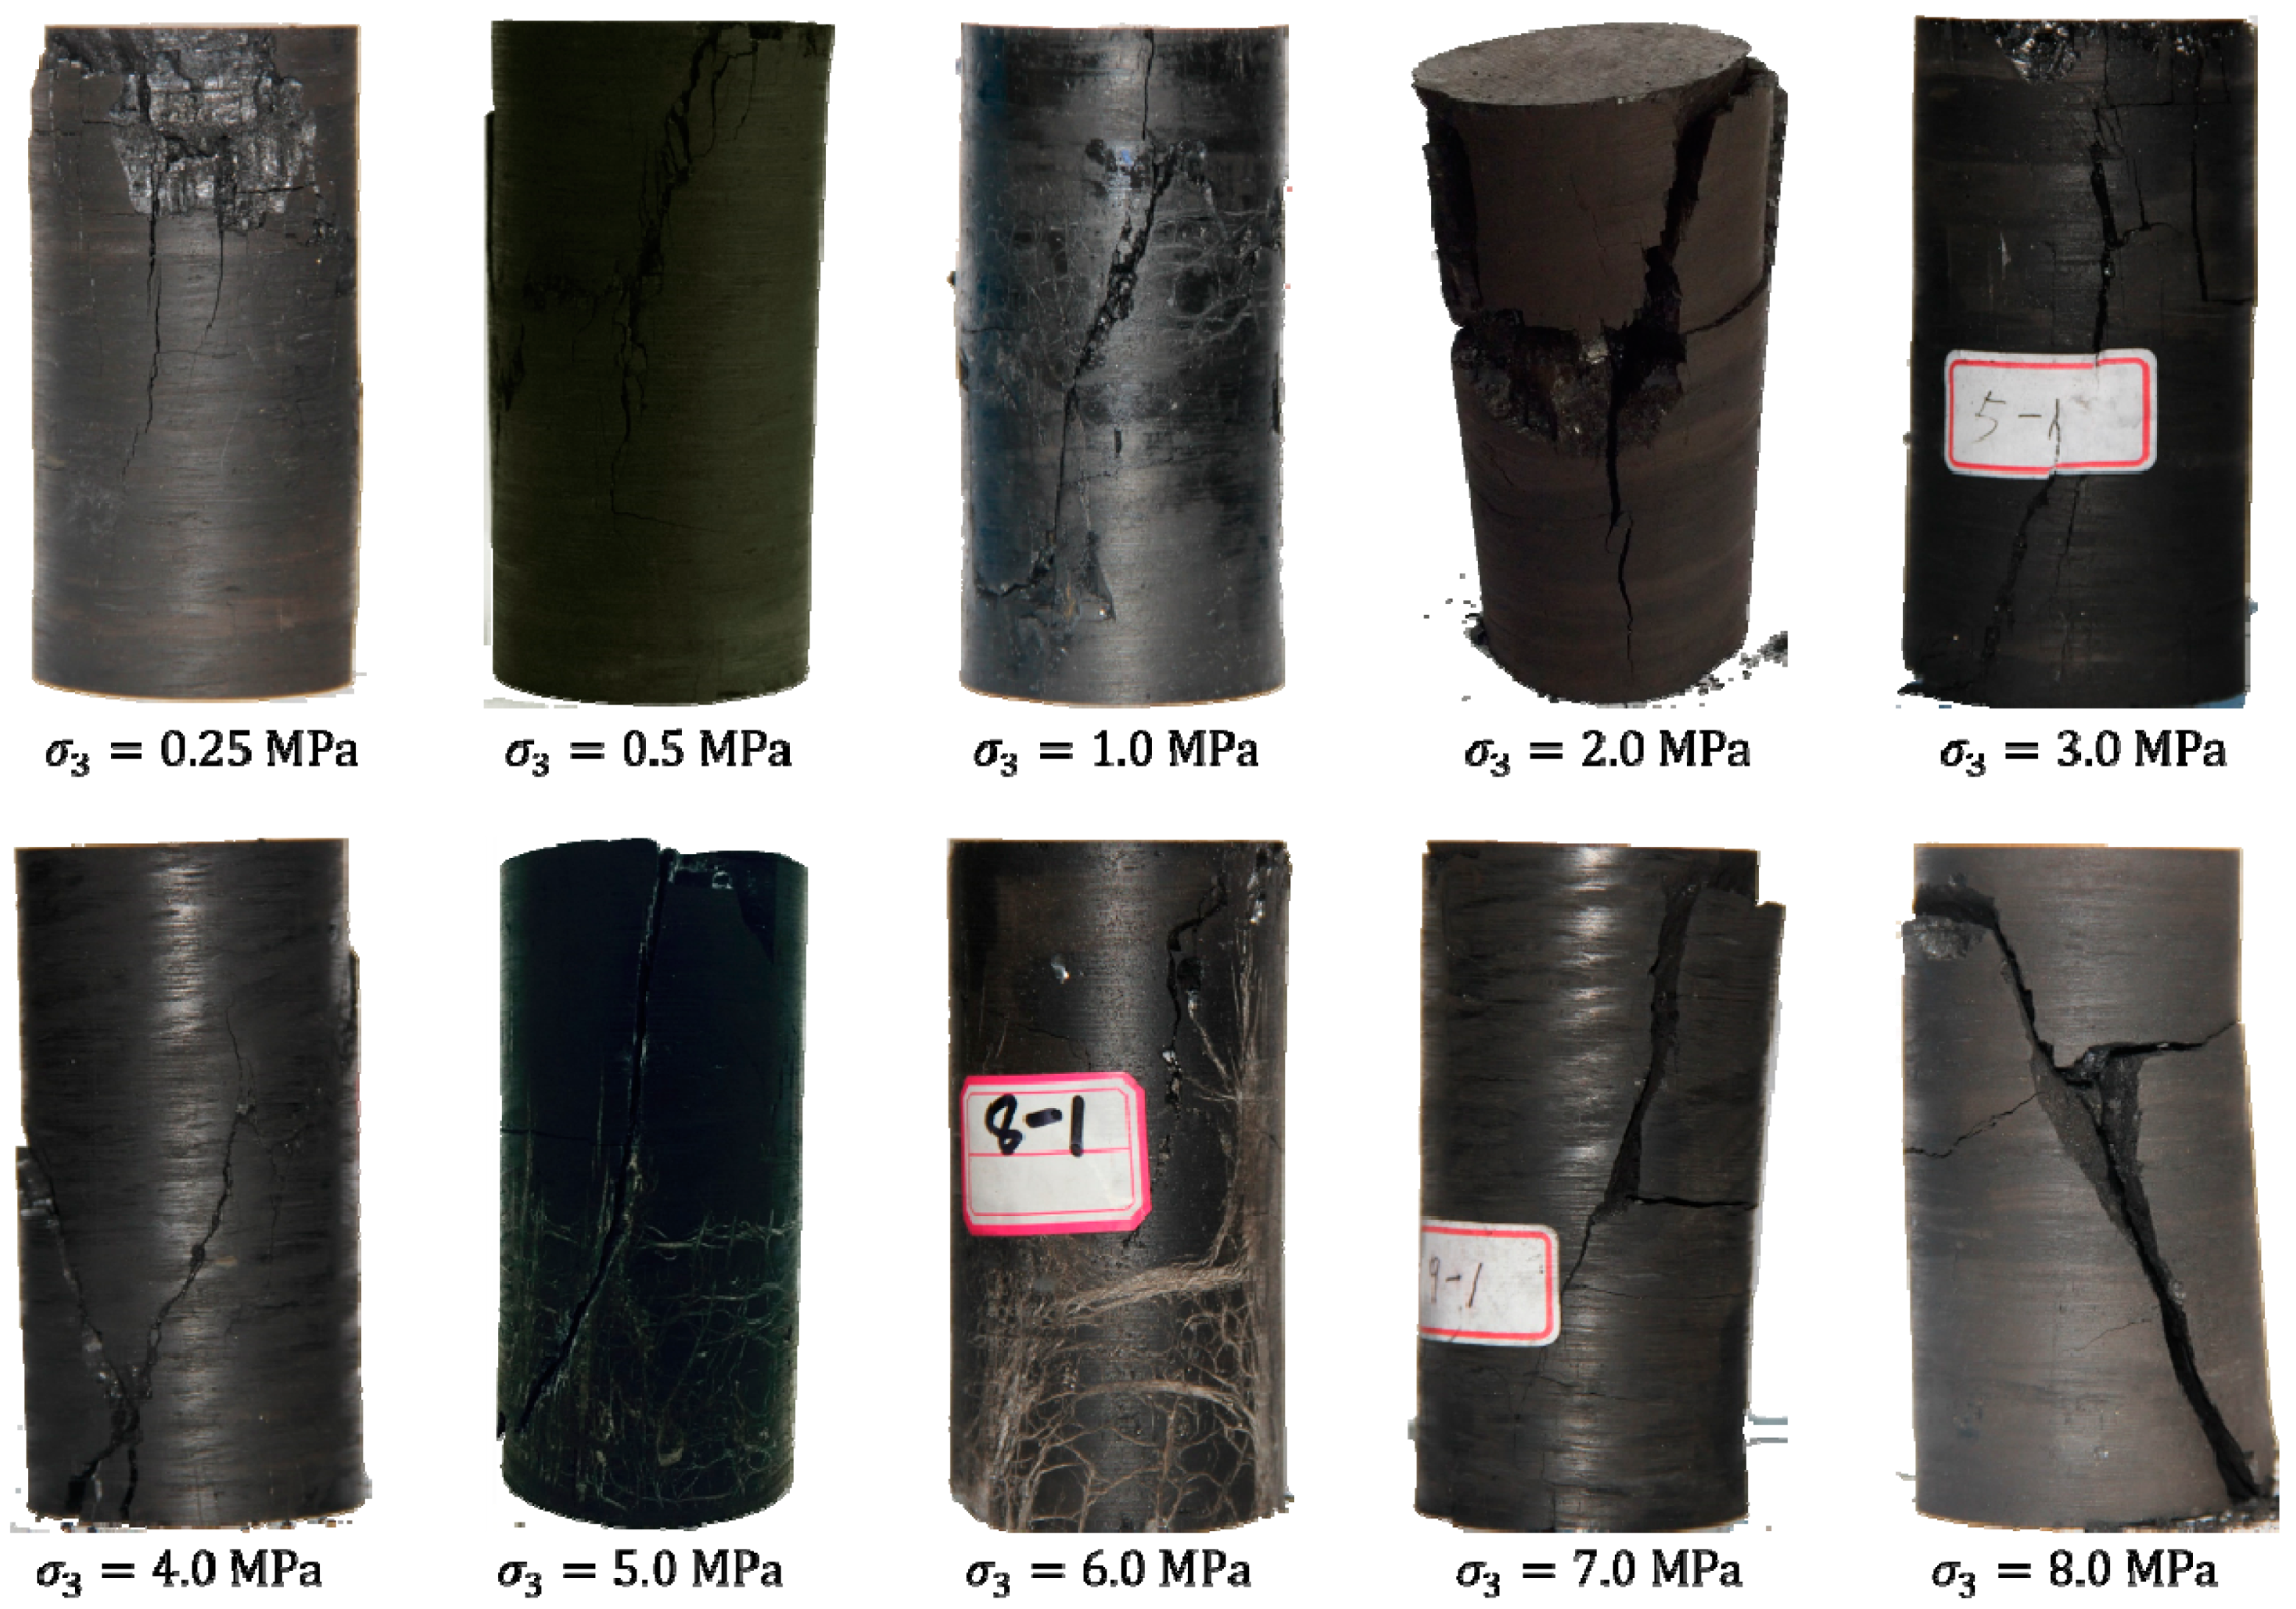
Figure 9.
Confinement dependency of peak axial stress for coal specimens of group 1.
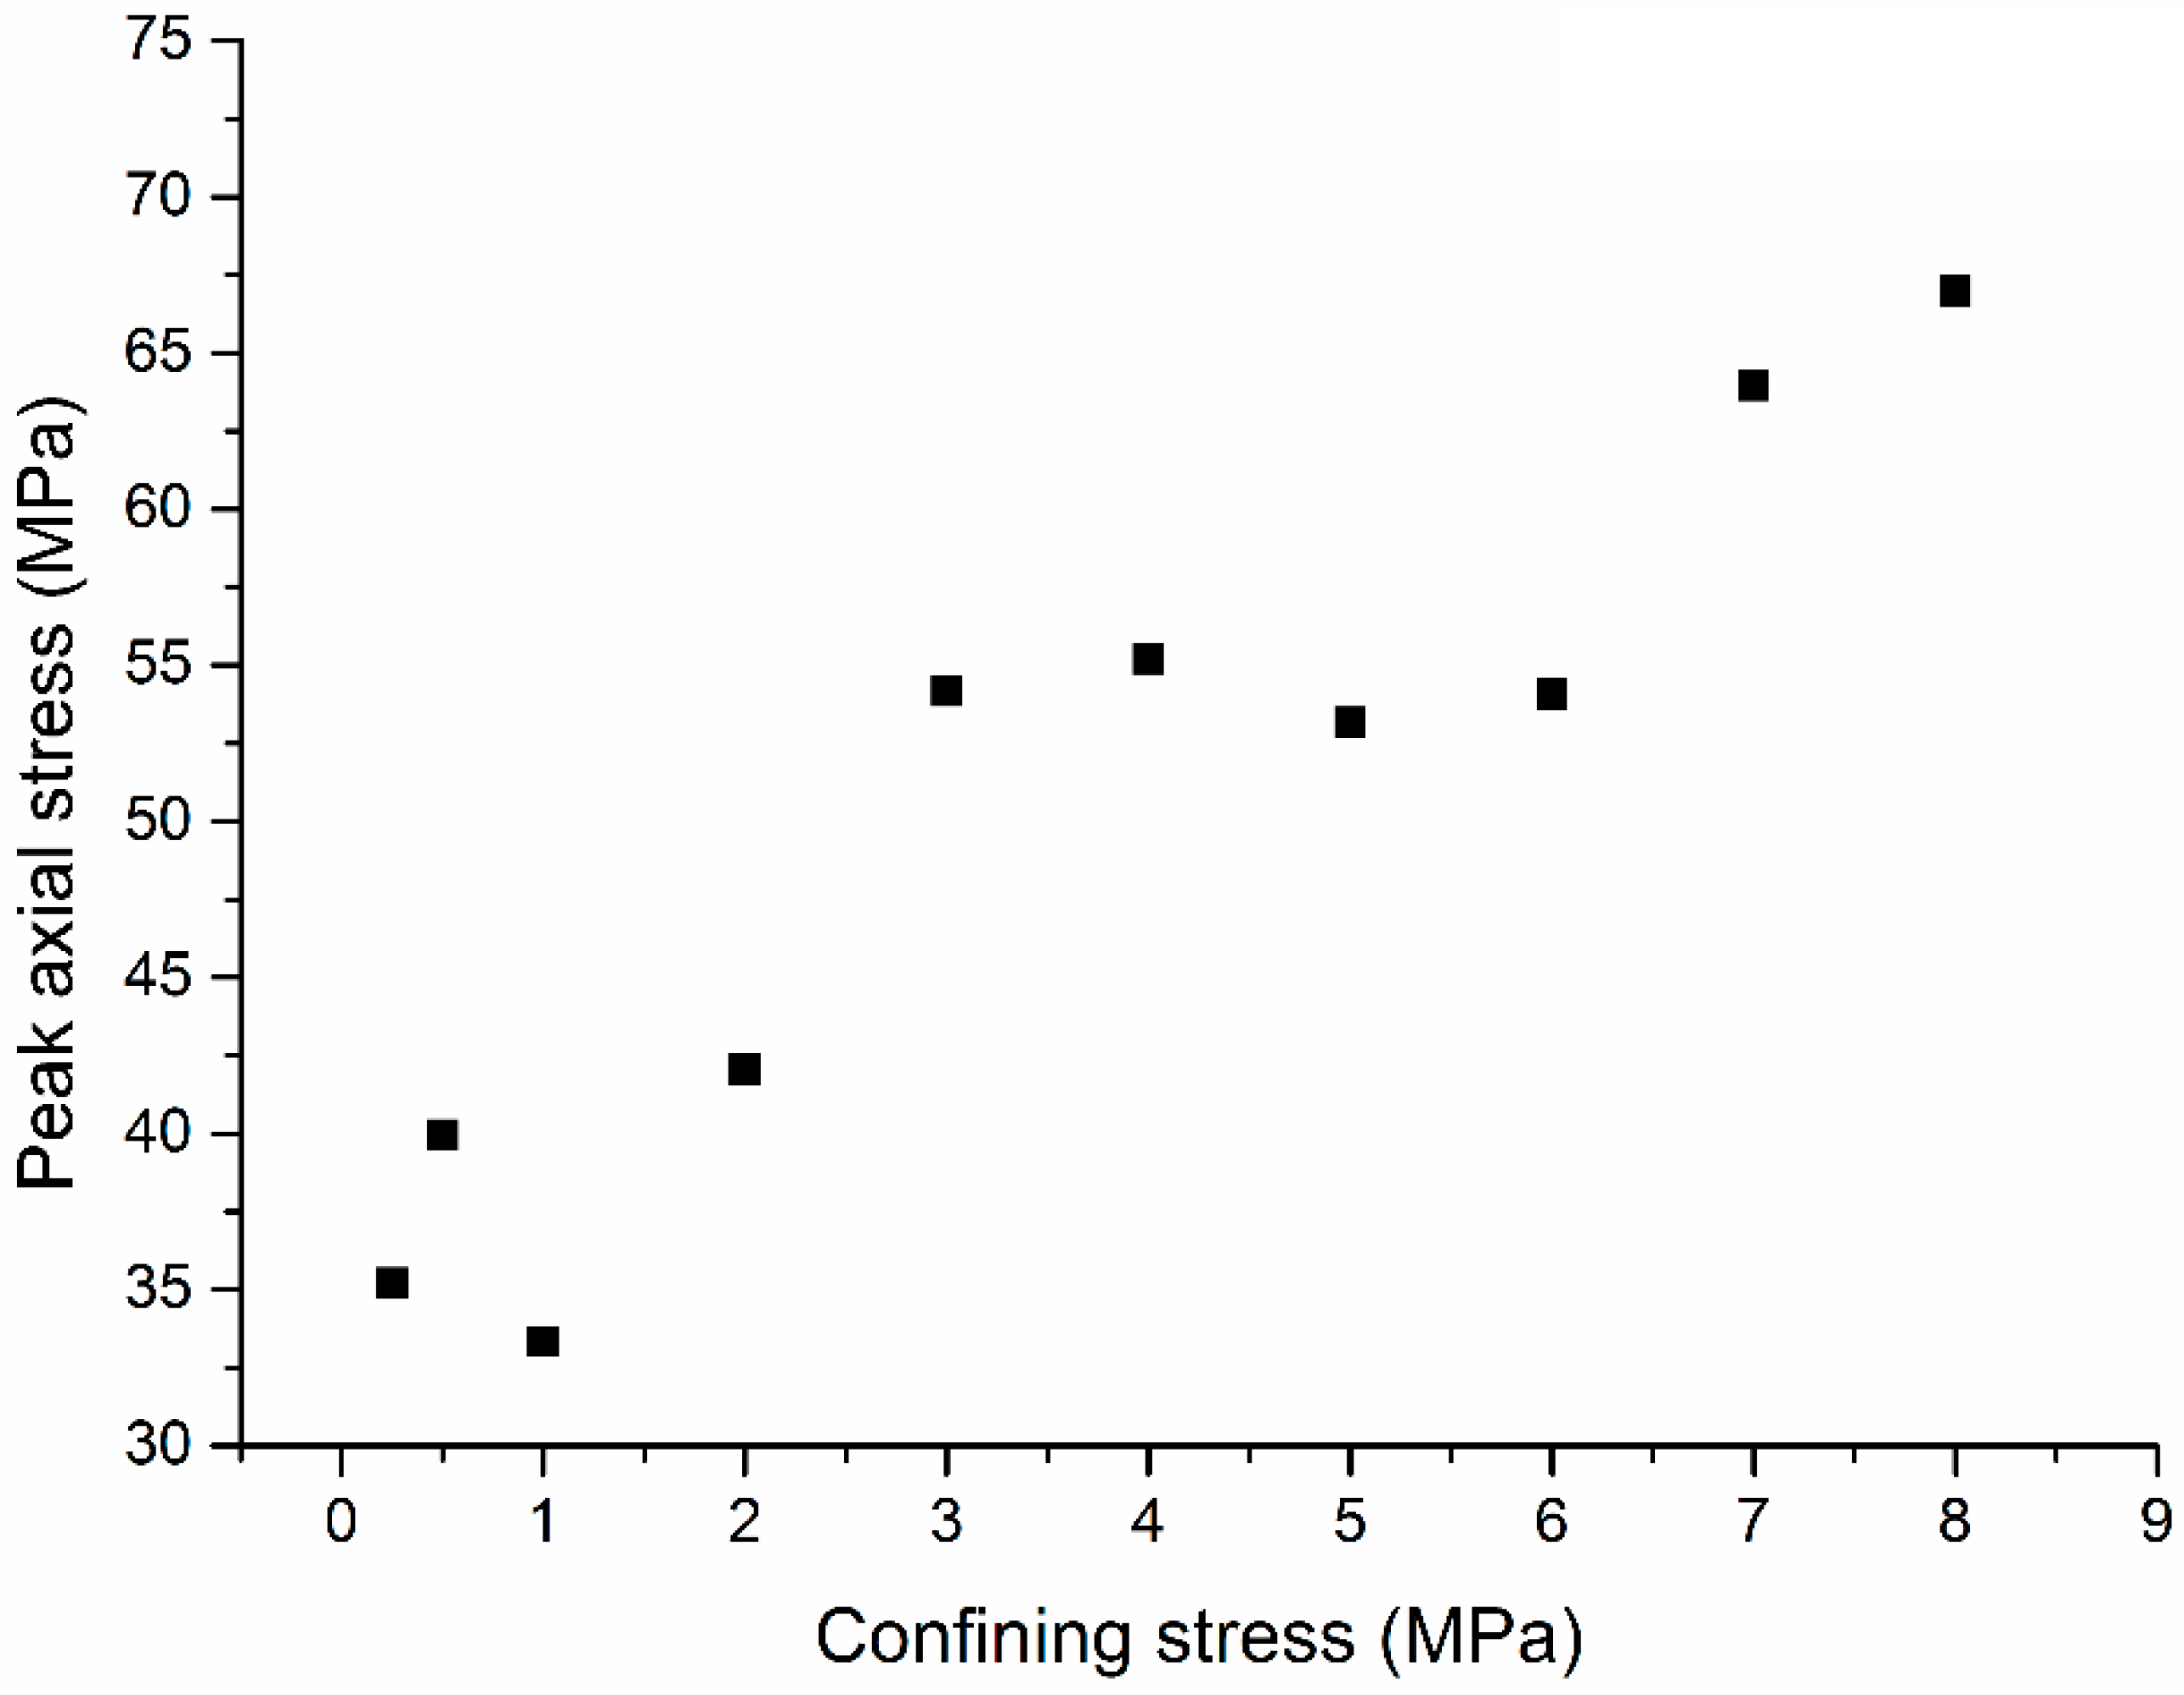
Figure 10.
Strength property for Mohr-Coulomb failure criterion based on the peak axial stress at failure.
Figure 10.
Strength property for Mohr-Coulomb failure criterion based on the peak axial stress at failure.
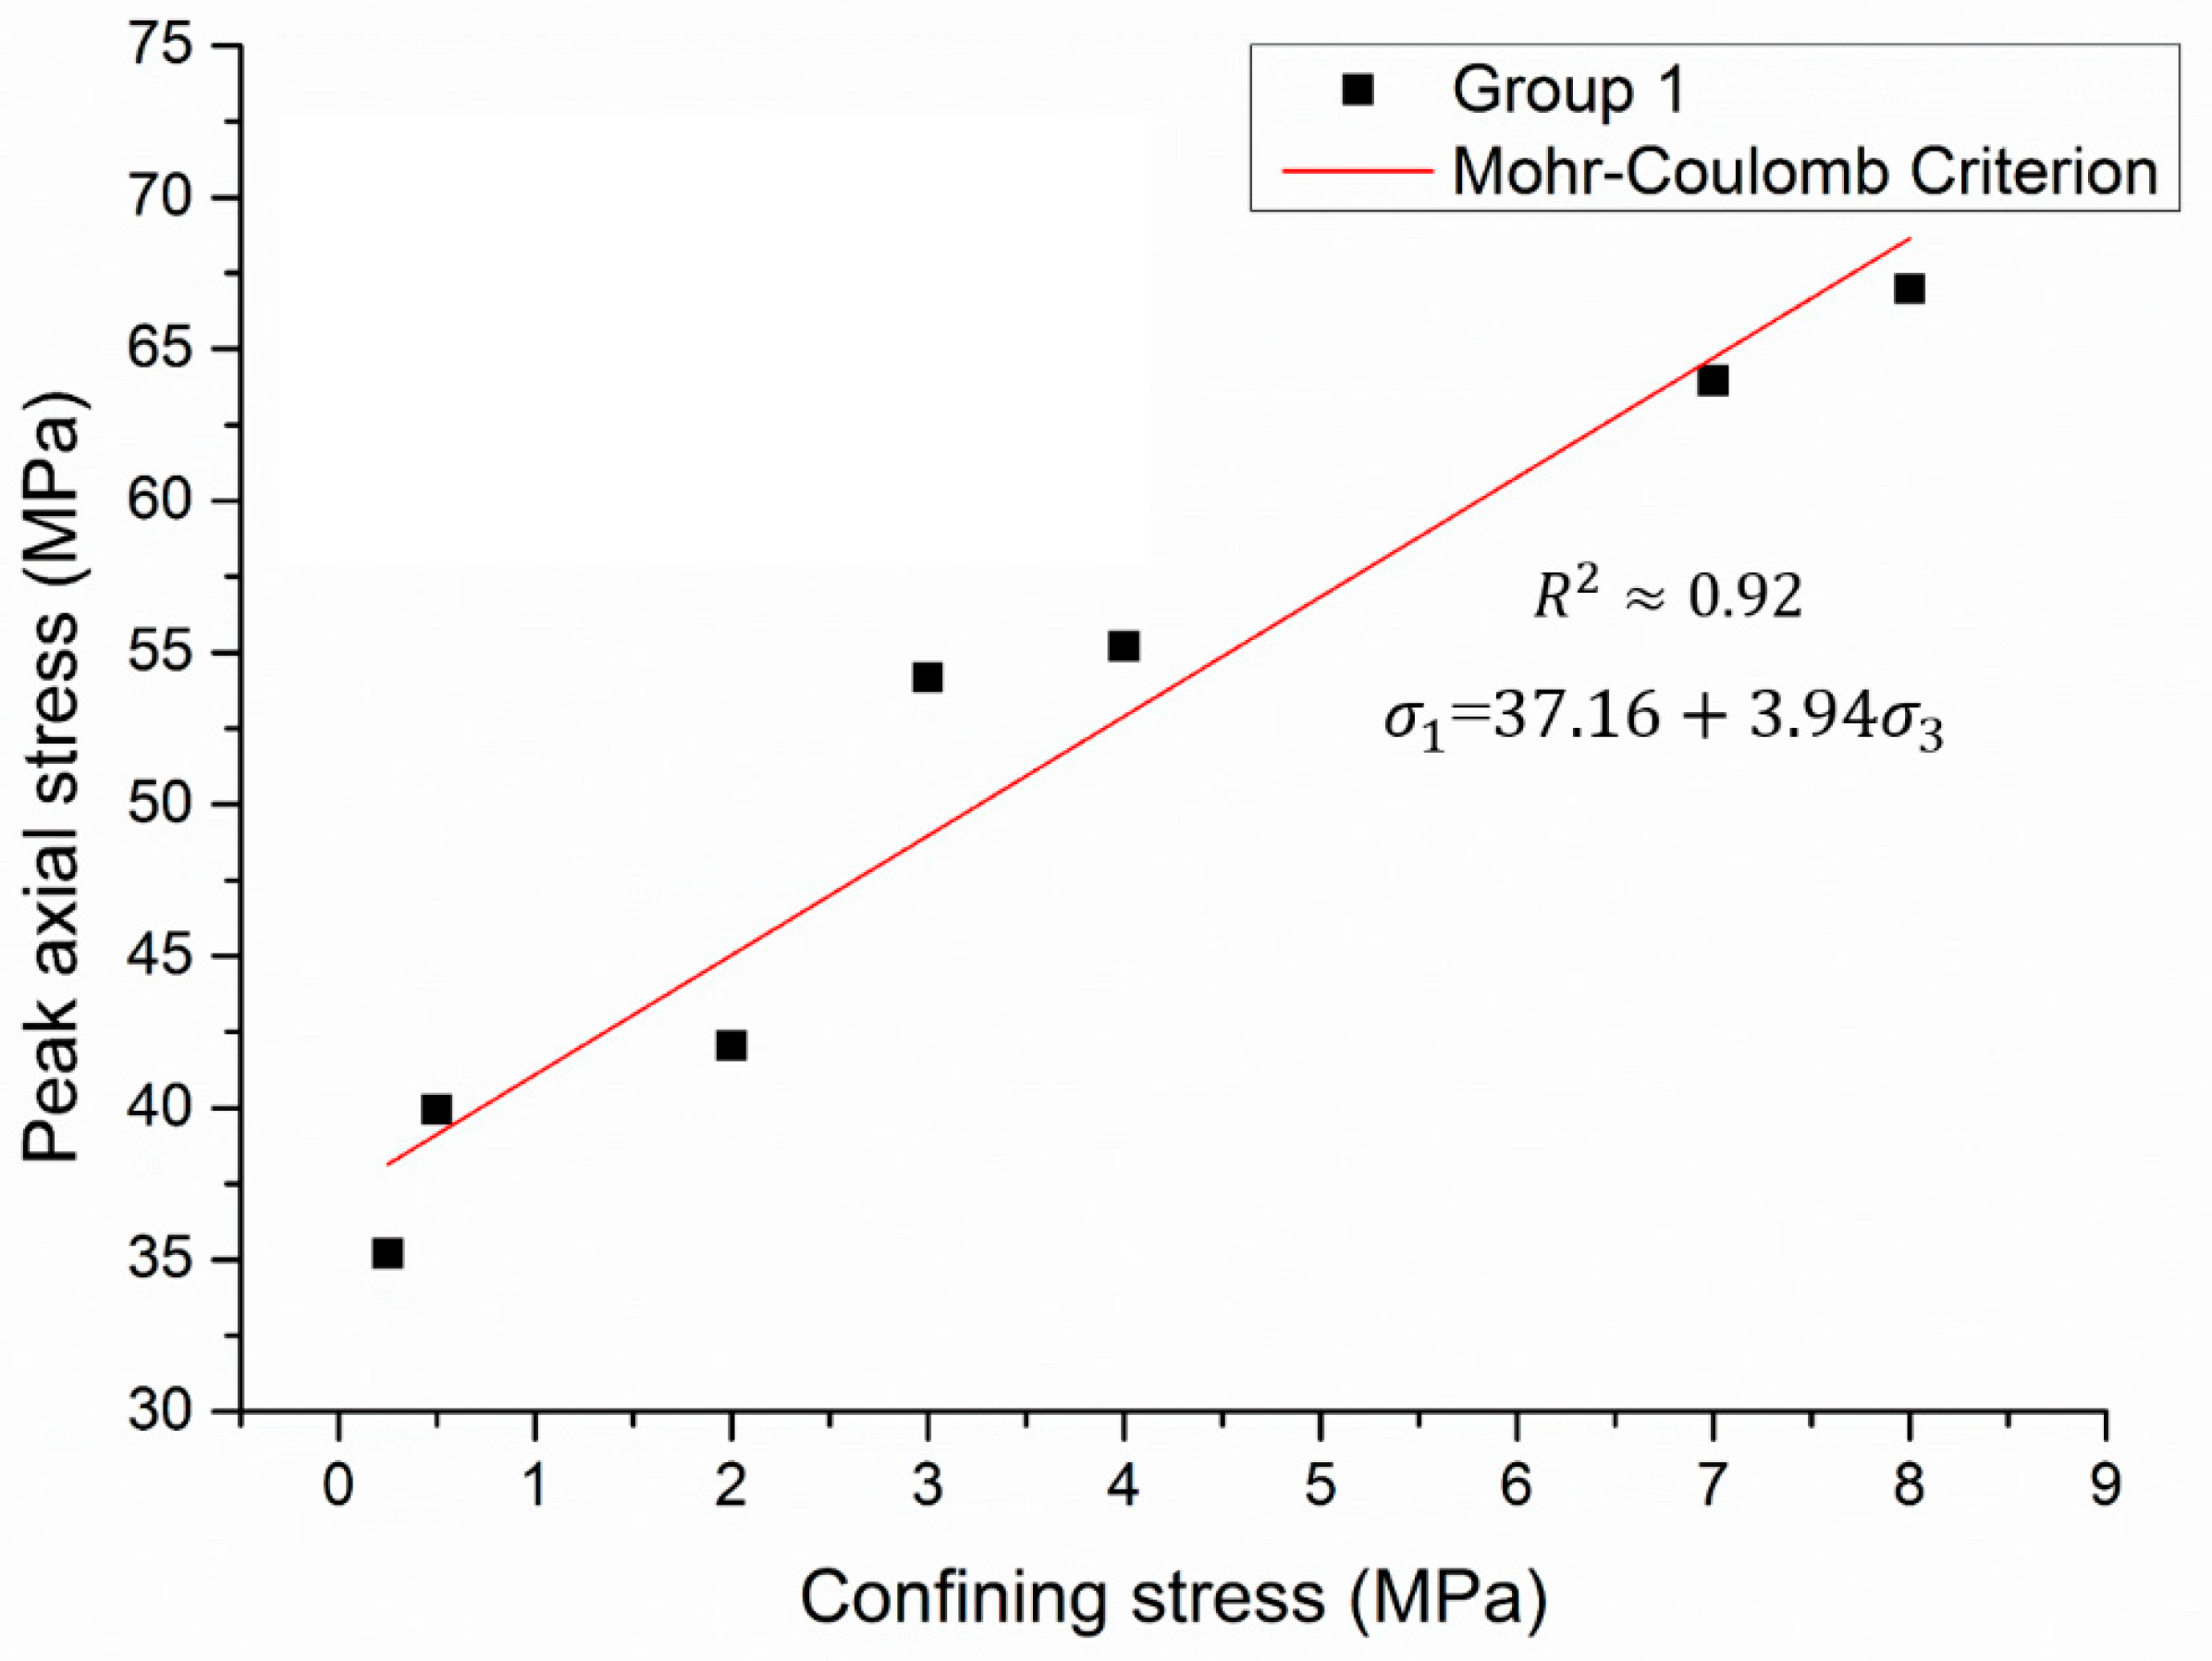
Figure 11.
Strength property for Hoek-Brown failure criterion based on the peak axial stress at failure.
Figure 11.
Strength property for Hoek-Brown failure criterion based on the peak axial stress at failure.

Figure 12.
Strength evolution under a wide range of confinement.
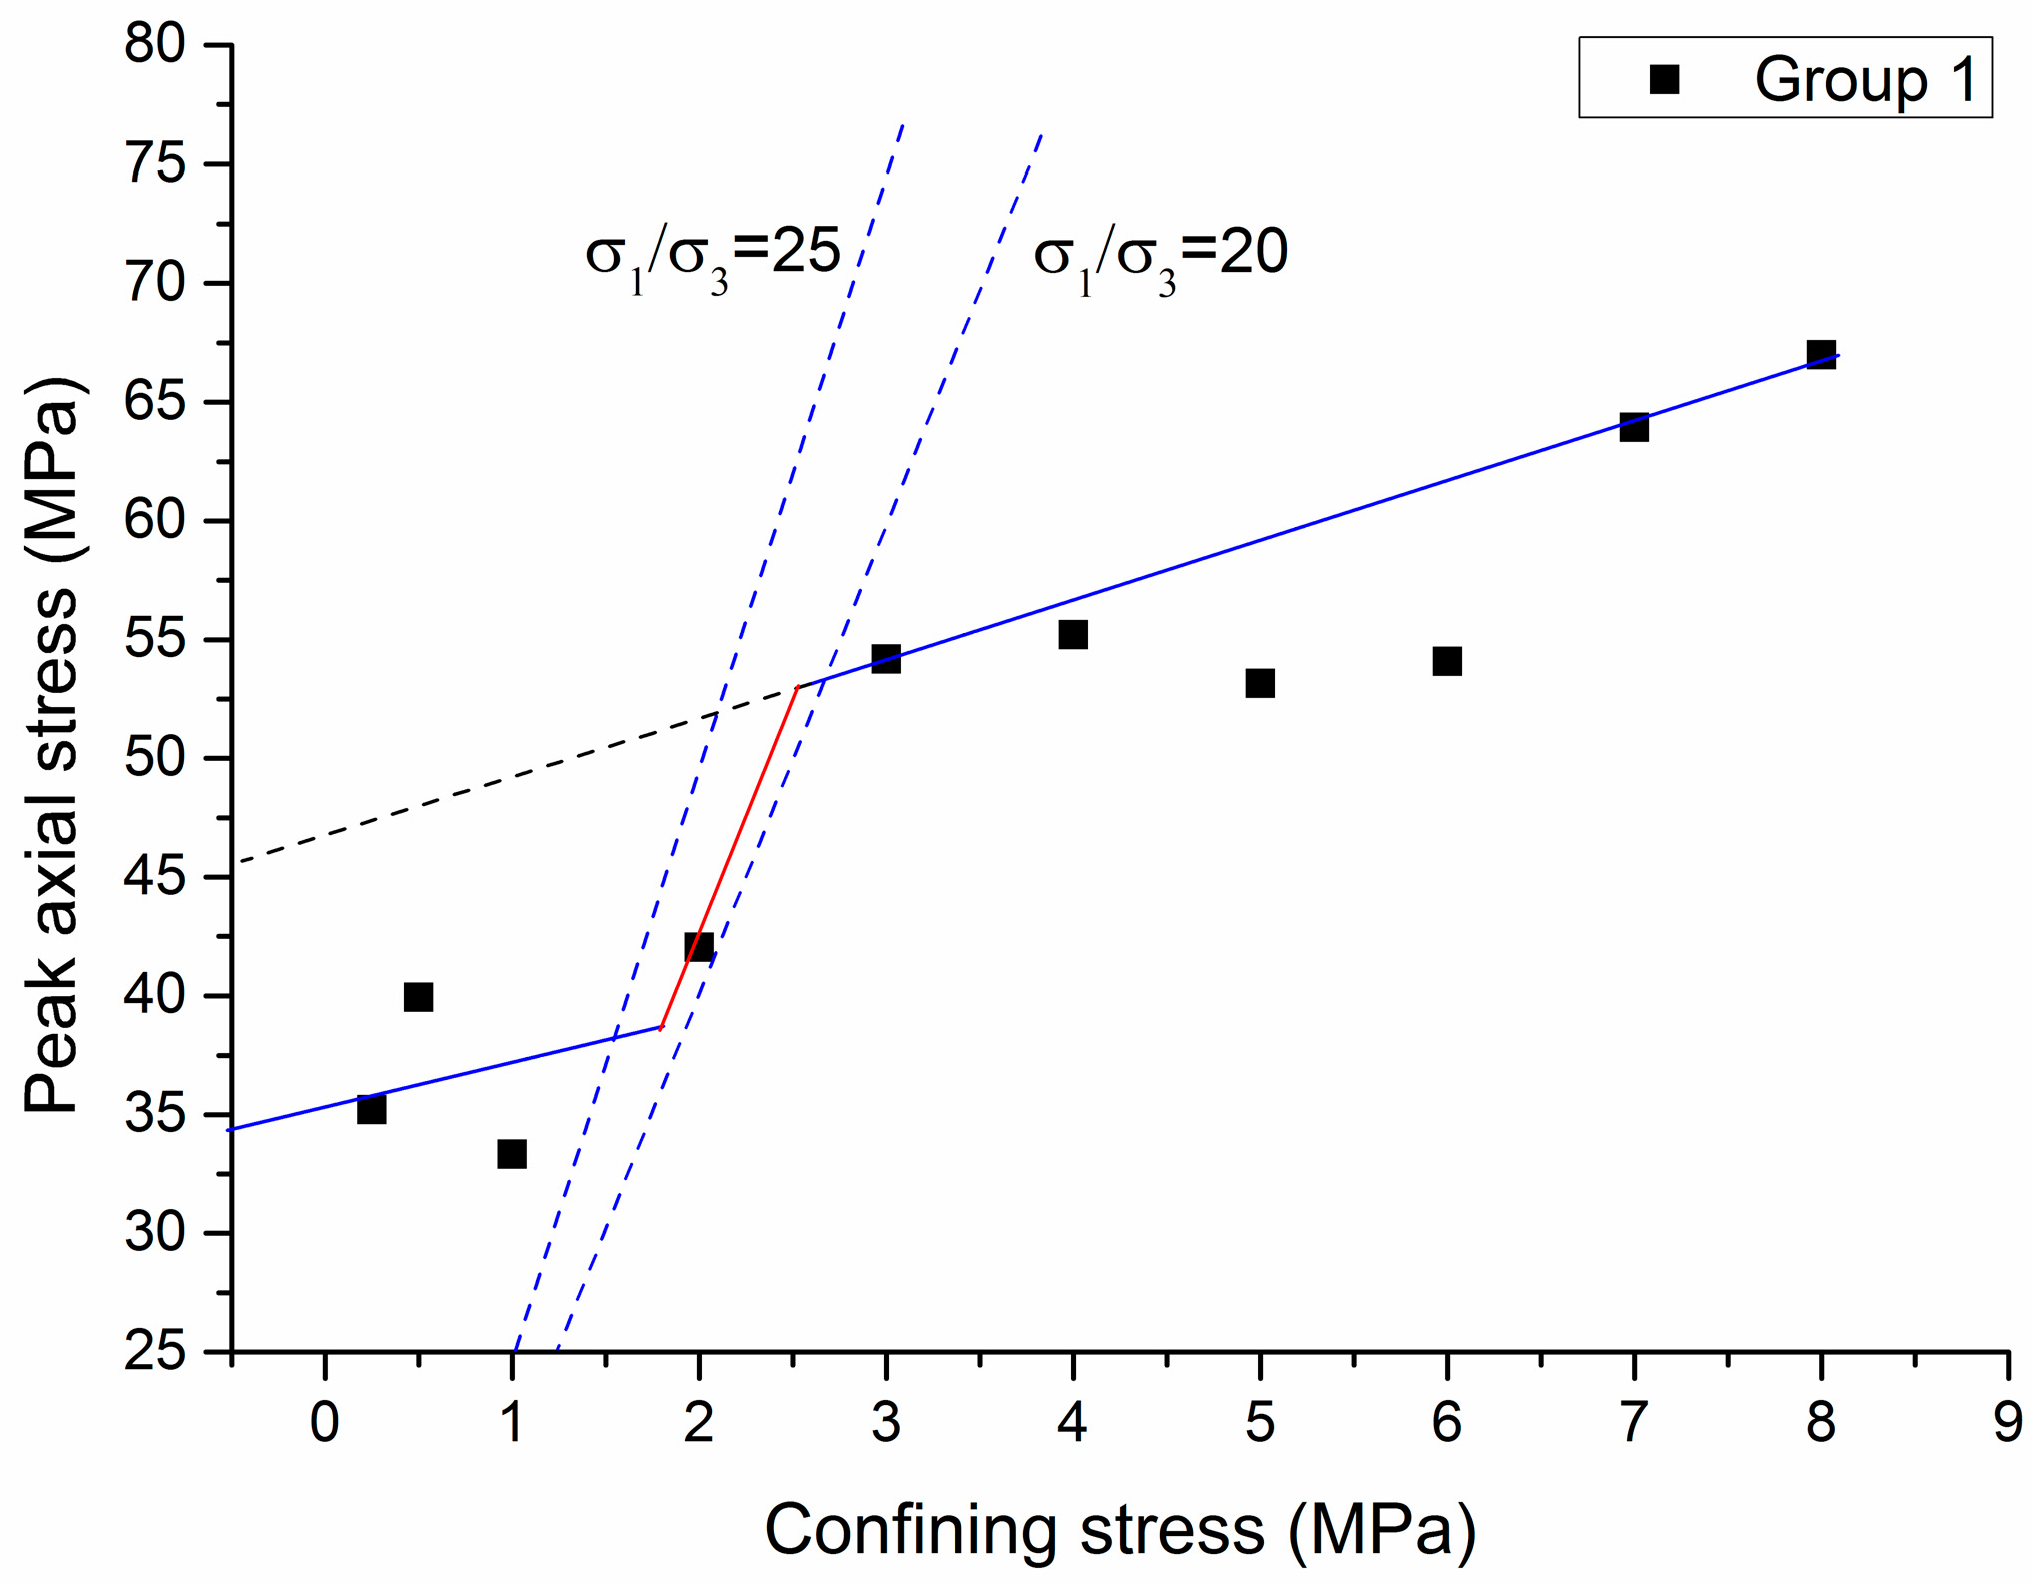
Figure 13.
Strength property for S-shaped failure criterion based on the peak axial stress at failure.
Figure 13.
Strength property for S-shaped failure criterion based on the peak axial stress at failure.

Figure 14.
PFC geometrical model for triaxial tests of coal specimens.
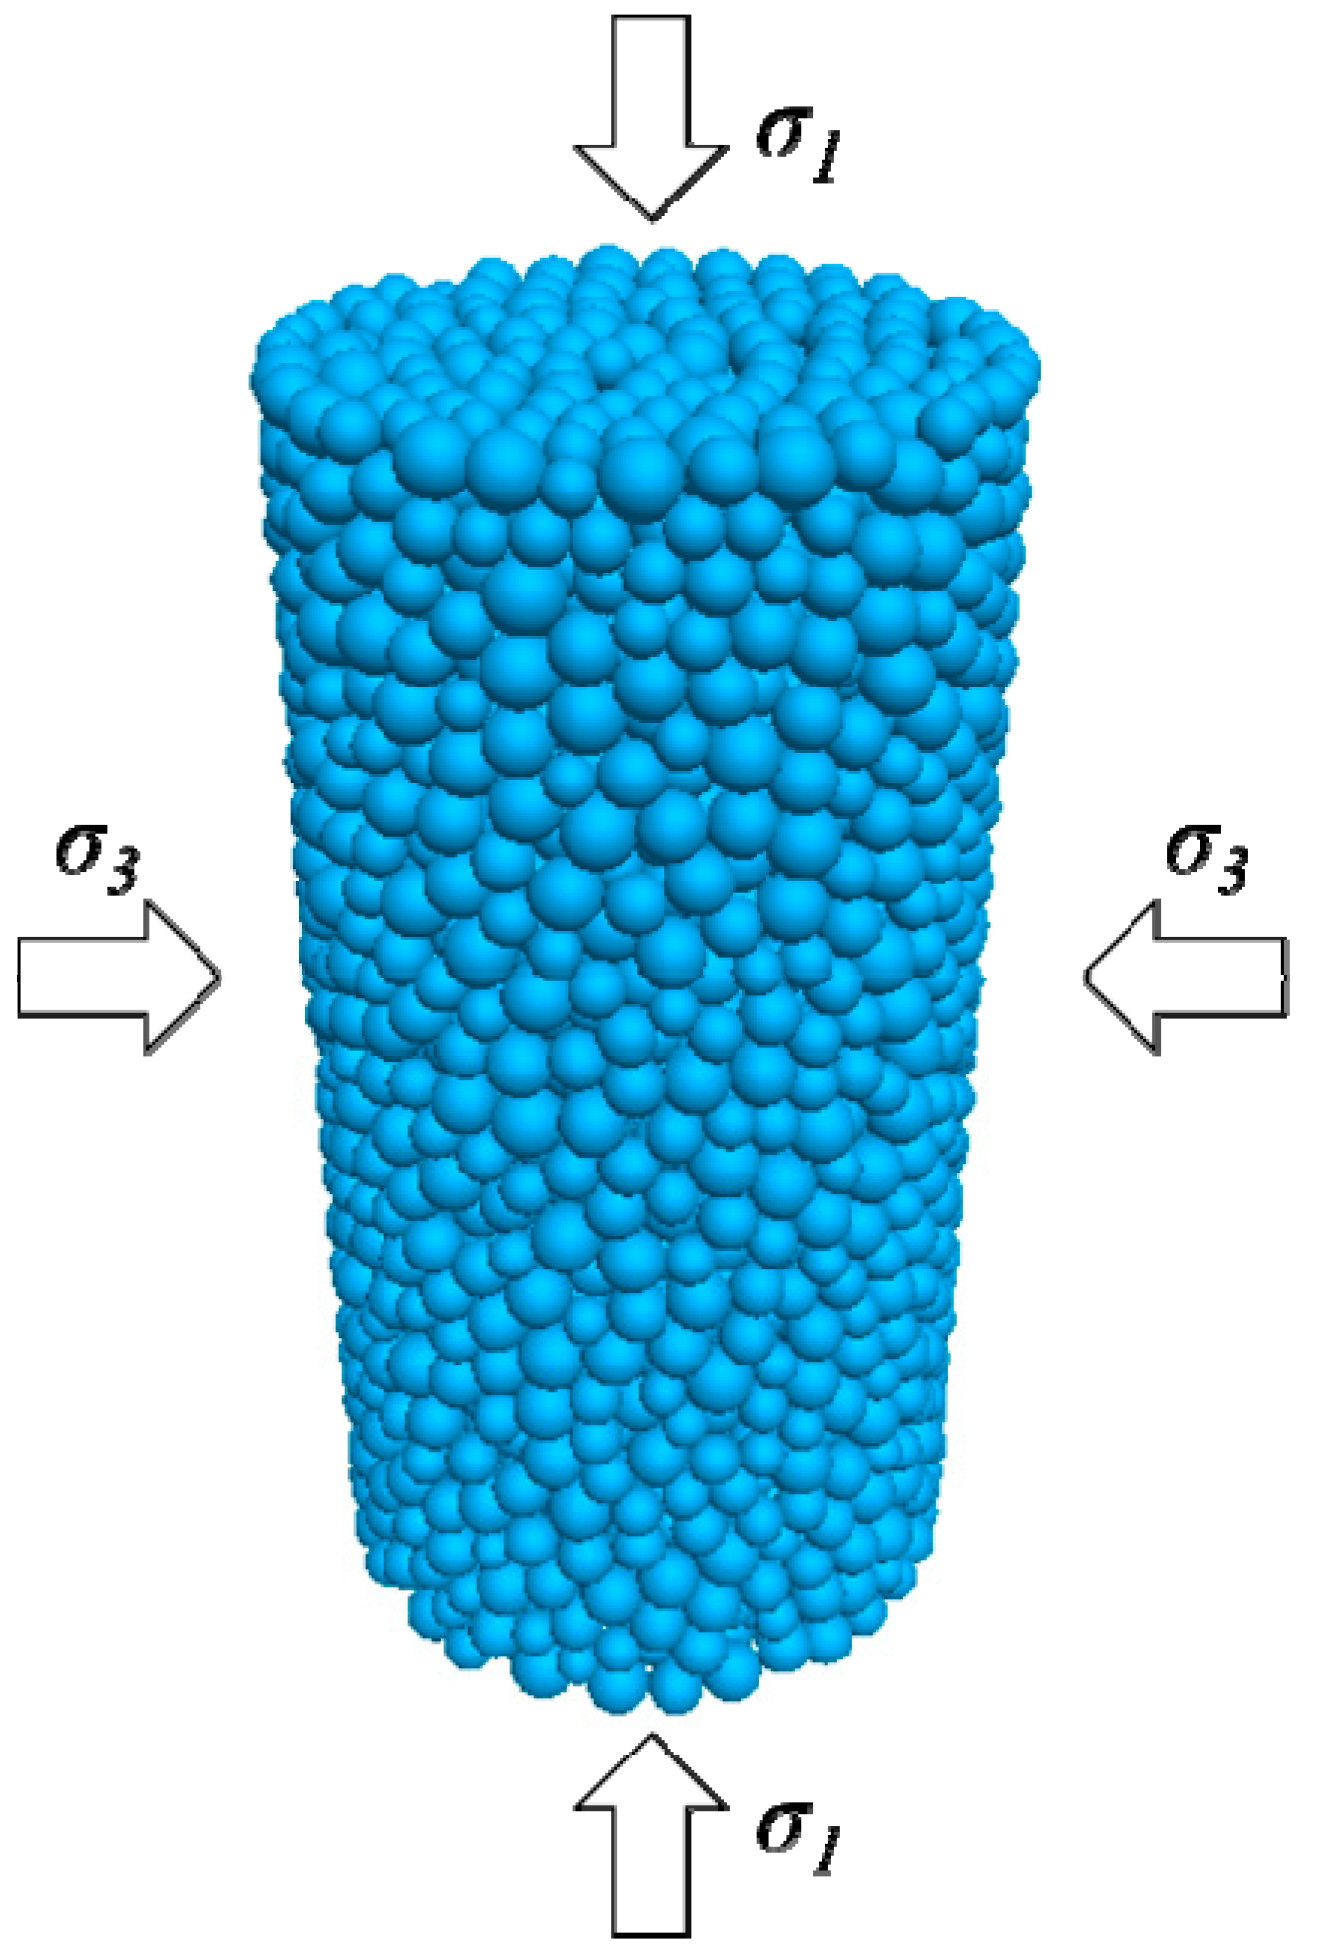
Figure 15.
Comparison of stress-strain curves between numerical modeling and experimental tests under the confining stress of 0.25 MPa.
Figure 15.
Comparison of stress-strain curves between numerical modeling and experimental tests under the confining stress of 0.25 MPa.
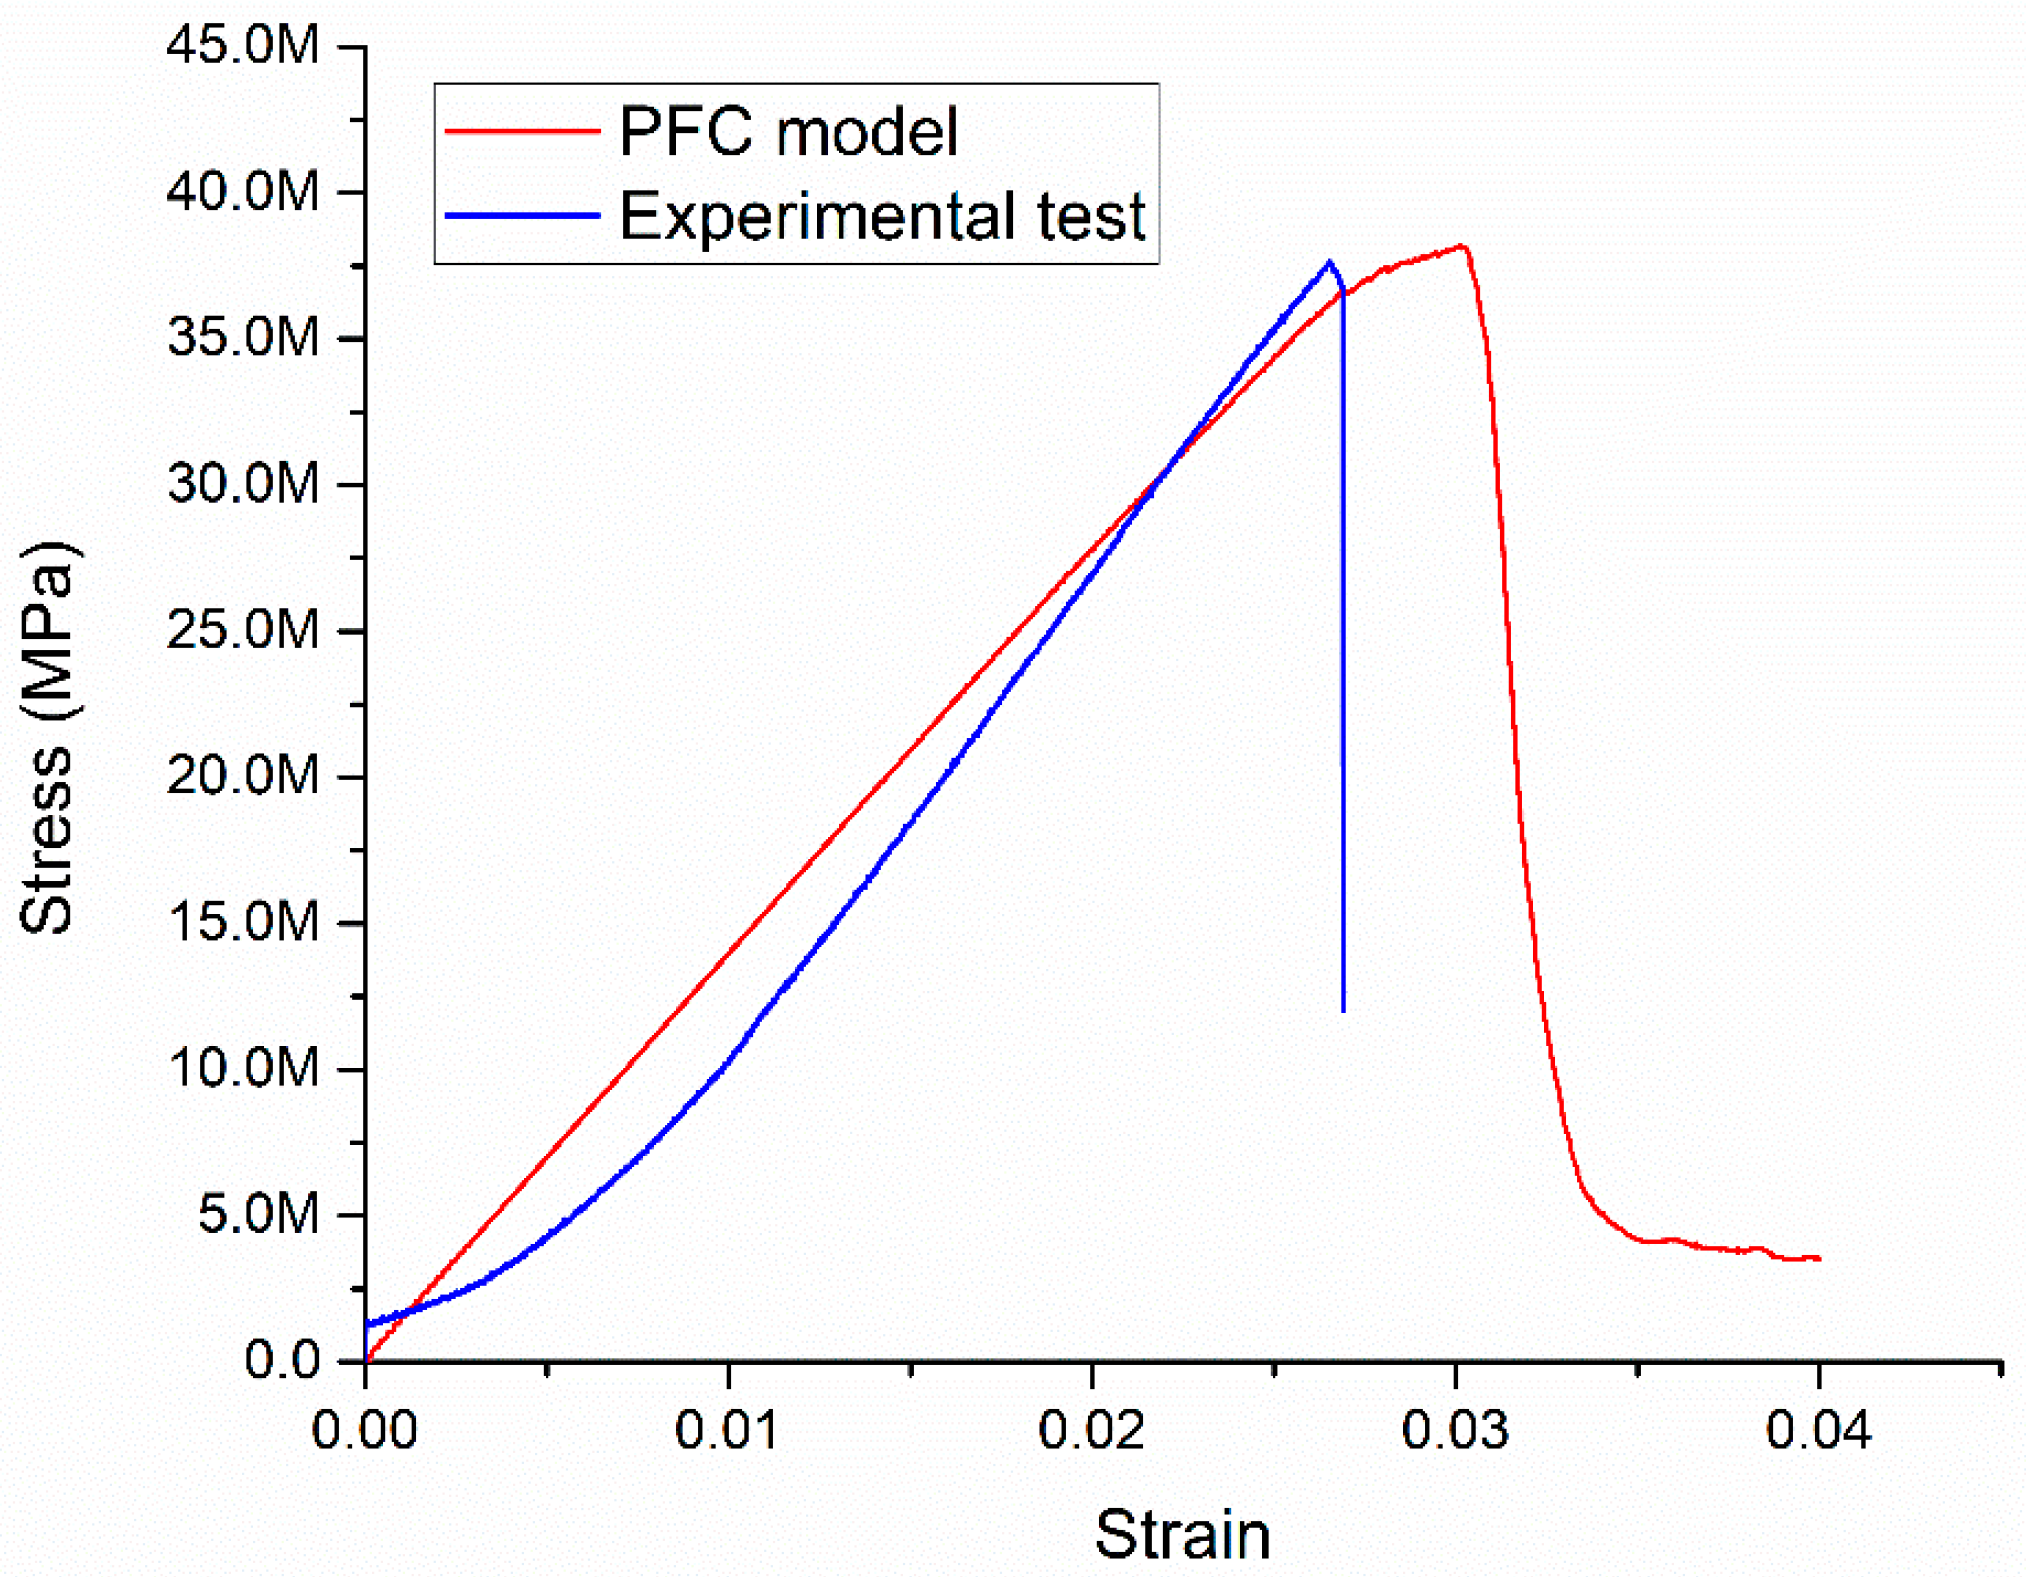
Figure 16.
Crack development of coal specimens under different confining stresses.
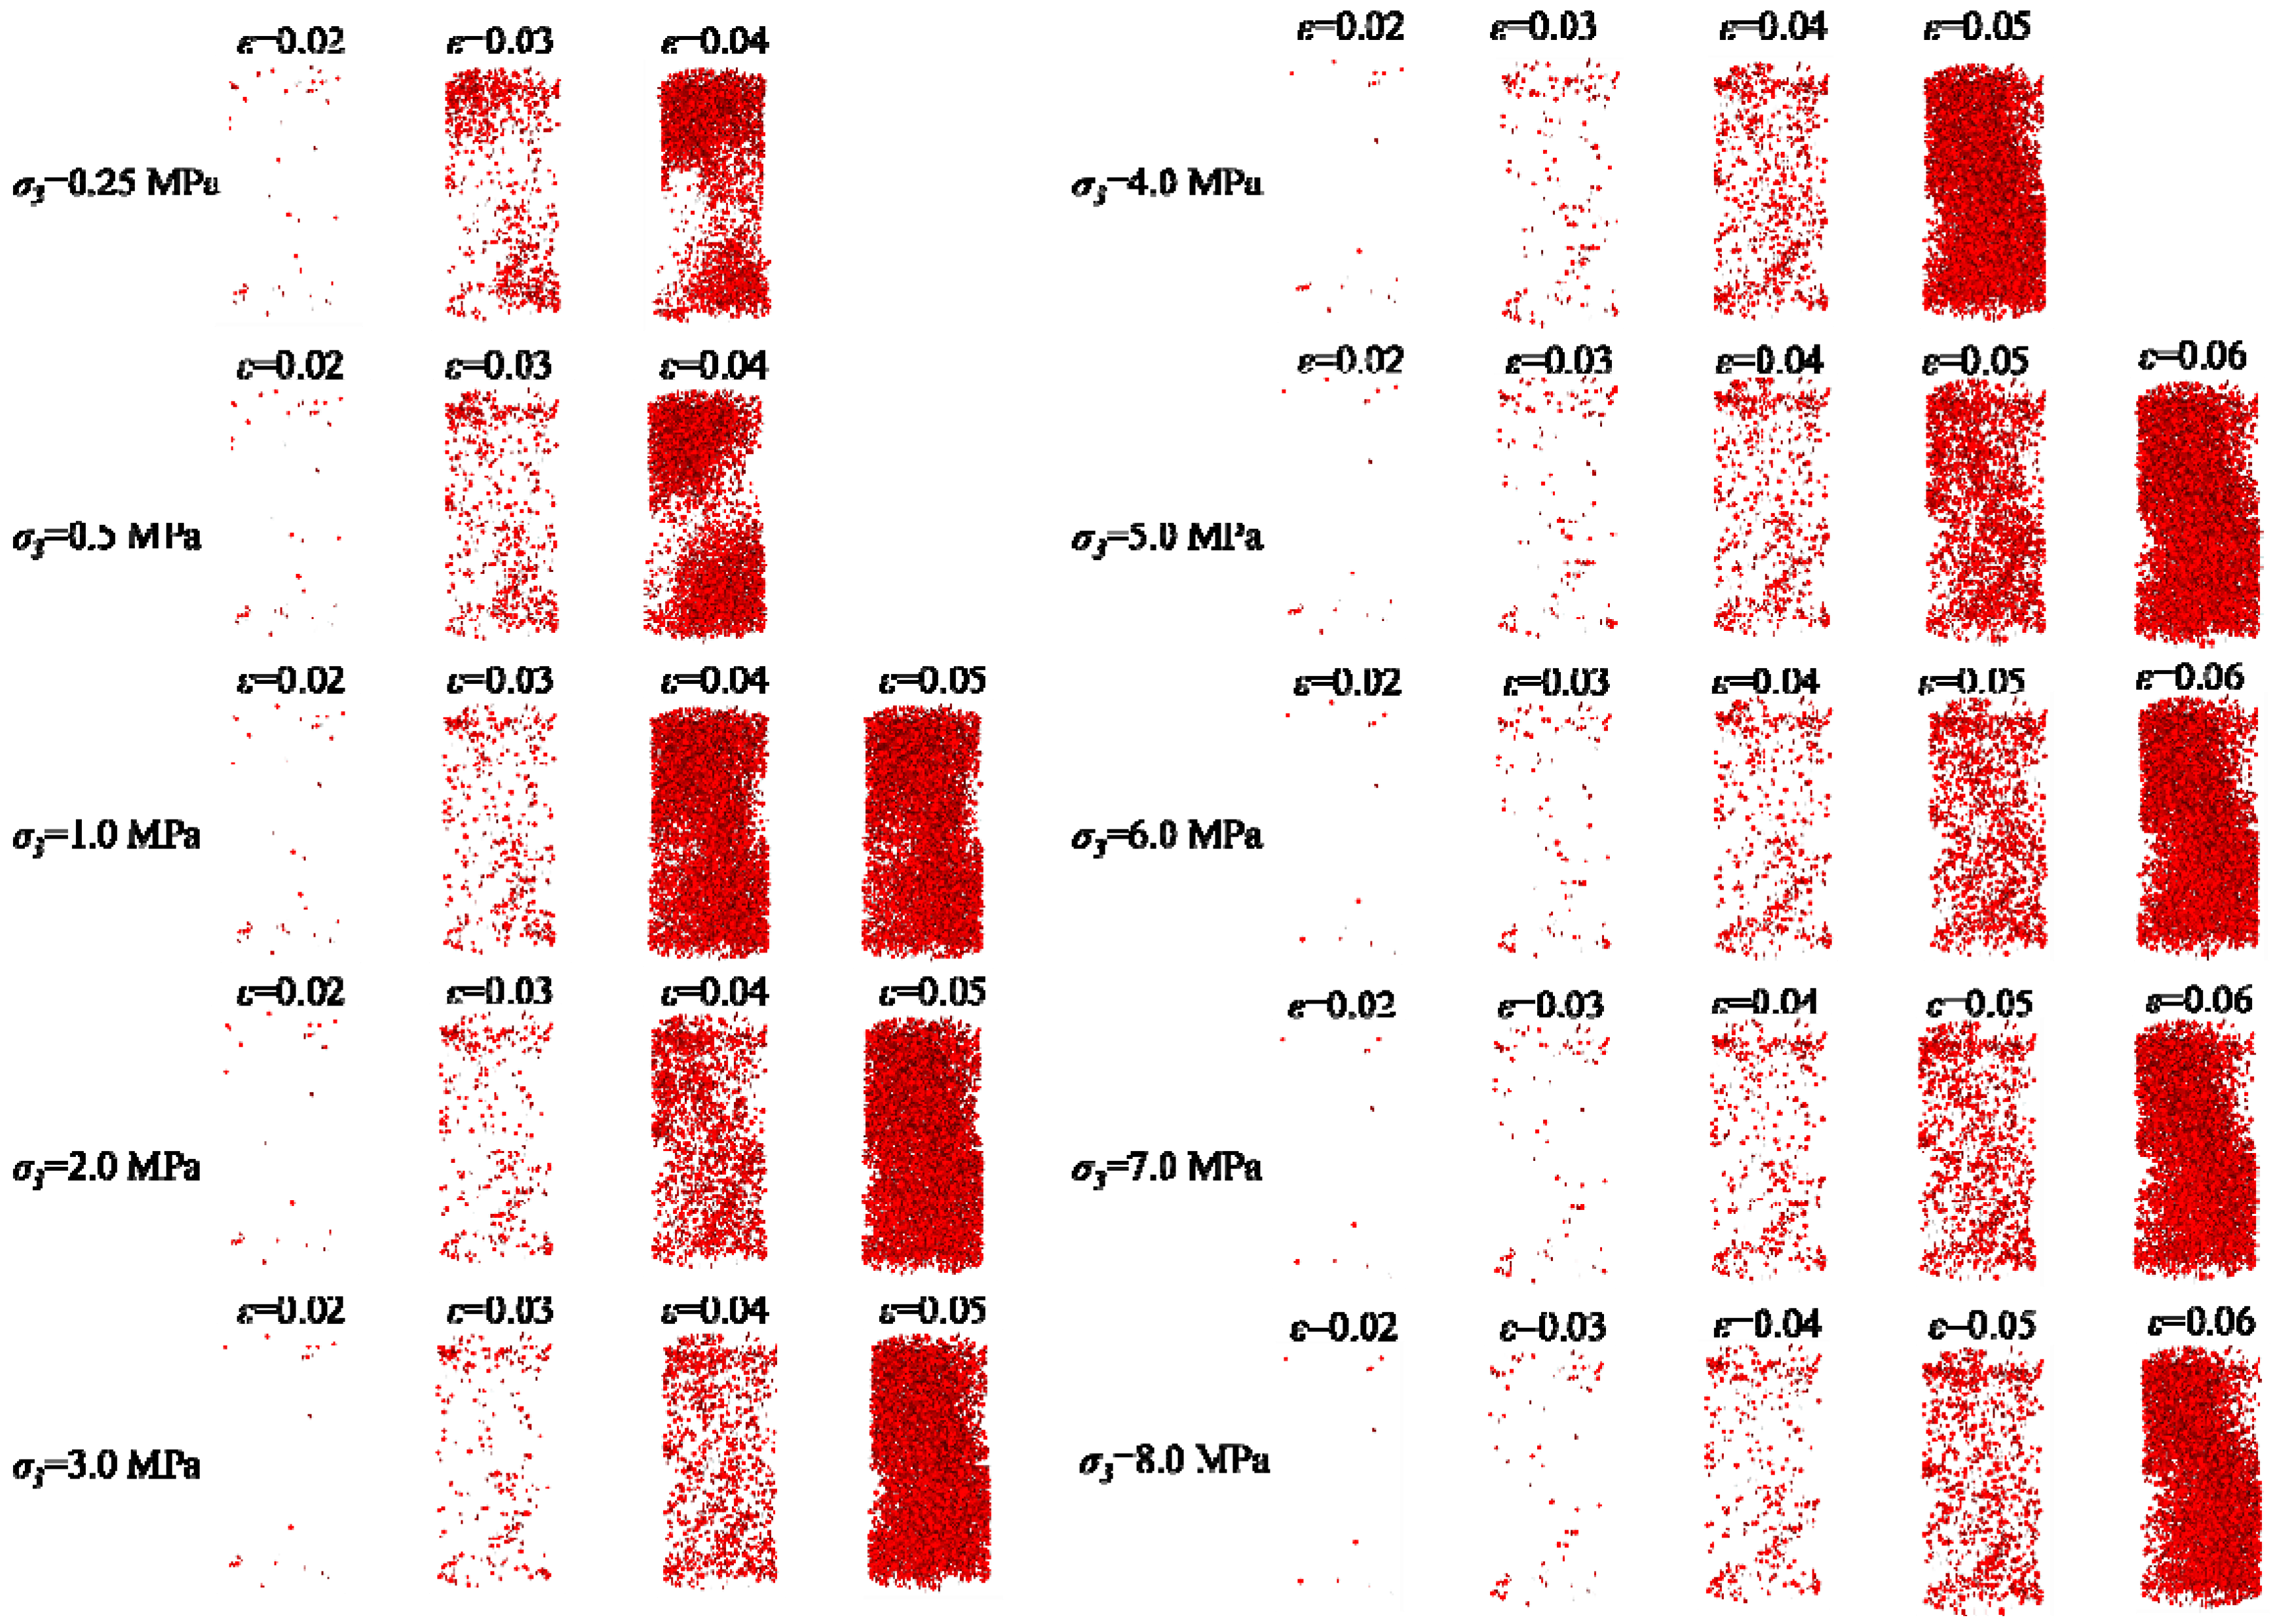
Figure 17.
The development and number of tensile and shear cracks during the increase of confining stresses.
Figure 17.
The development and number of tensile and shear cracks during the increase of confining stresses.

Figure 18.
Crack initiation stress for coal specimens of group 1 under different confining stresses.
Figure 18.
Crack initiation stress for coal specimens of group 1 under different confining stresses.
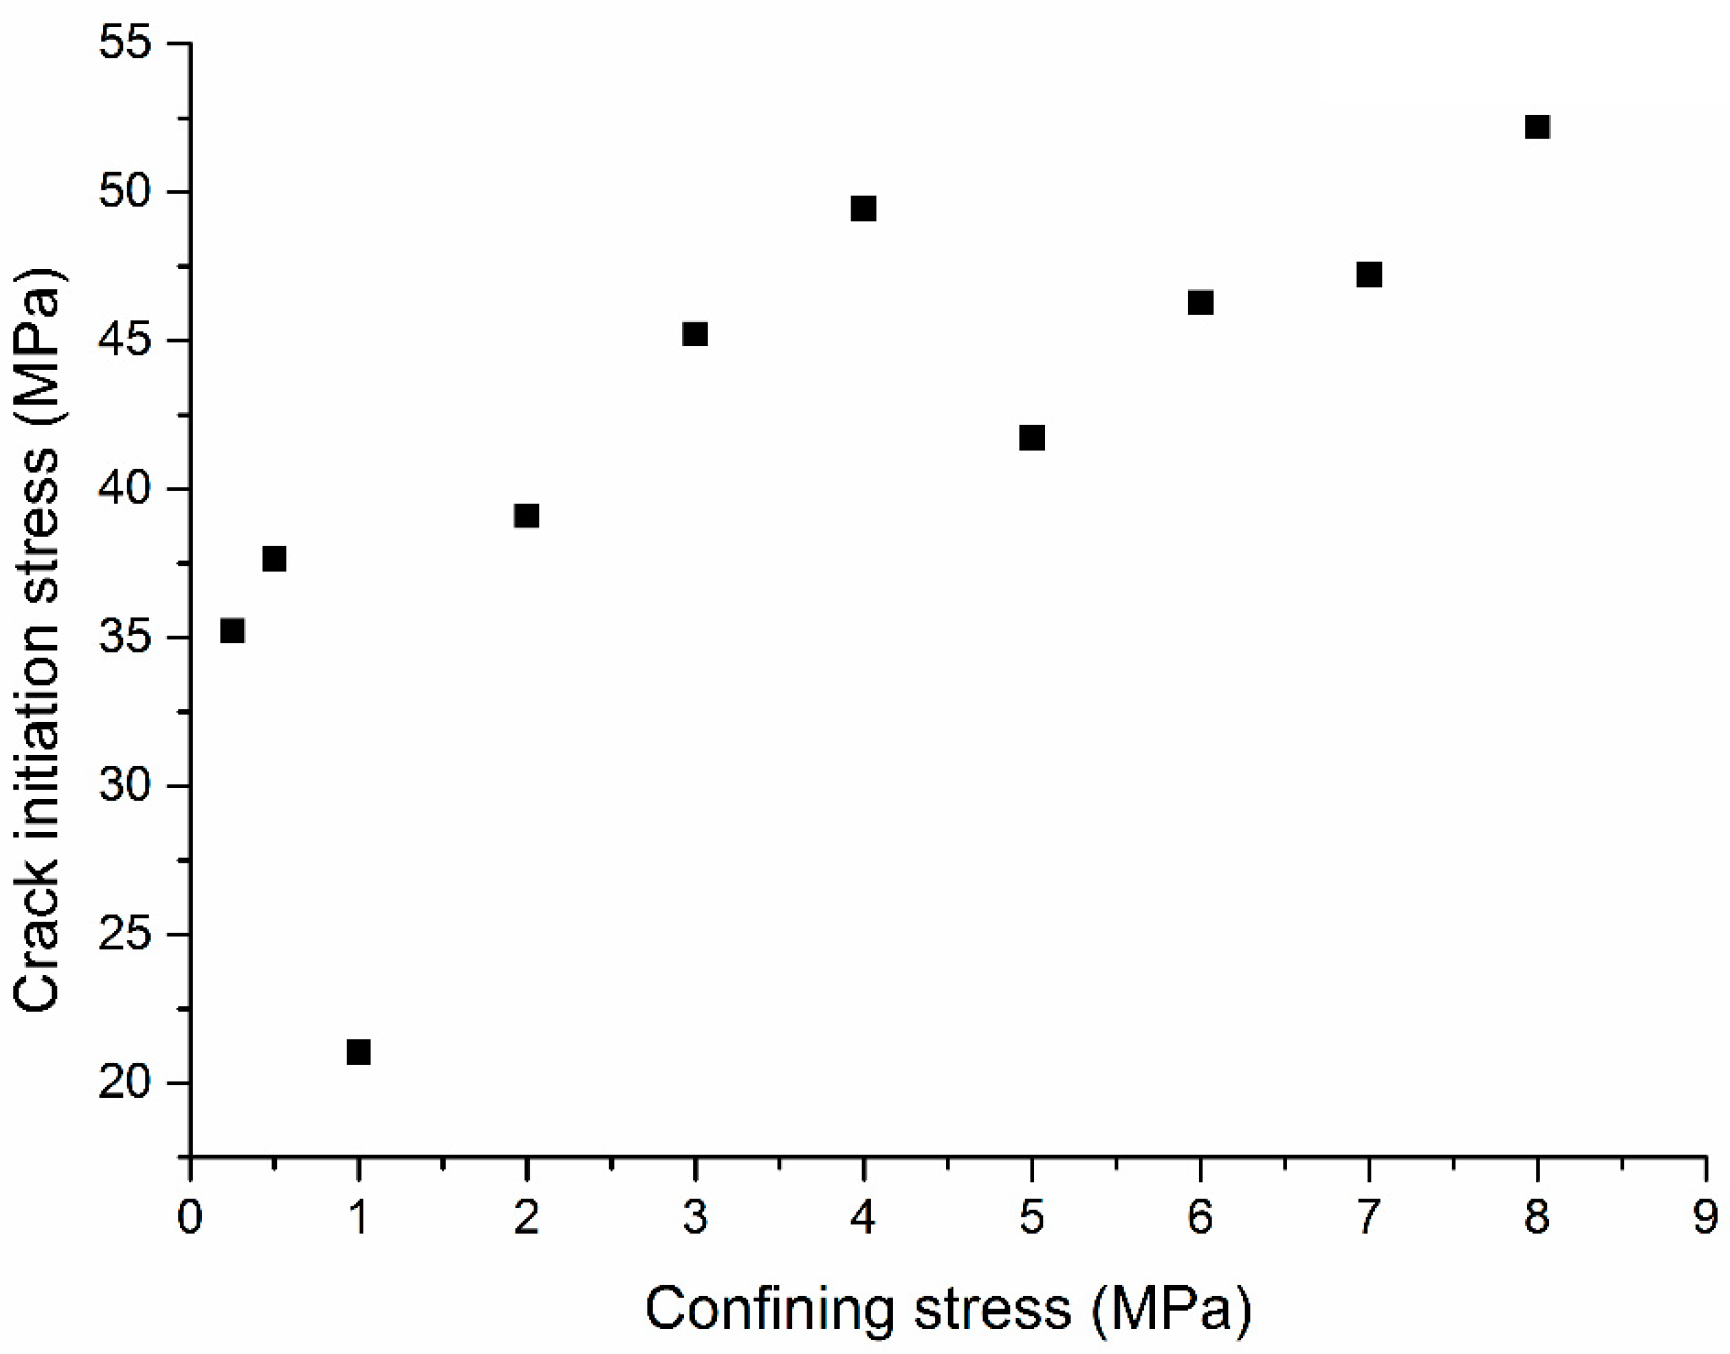
Figure 19.
Crack initiation stress for coal specimens of group 1 under different confining stresses.
Figure 19.
Crack initiation stress for coal specimens of group 1 under different confining stresses.
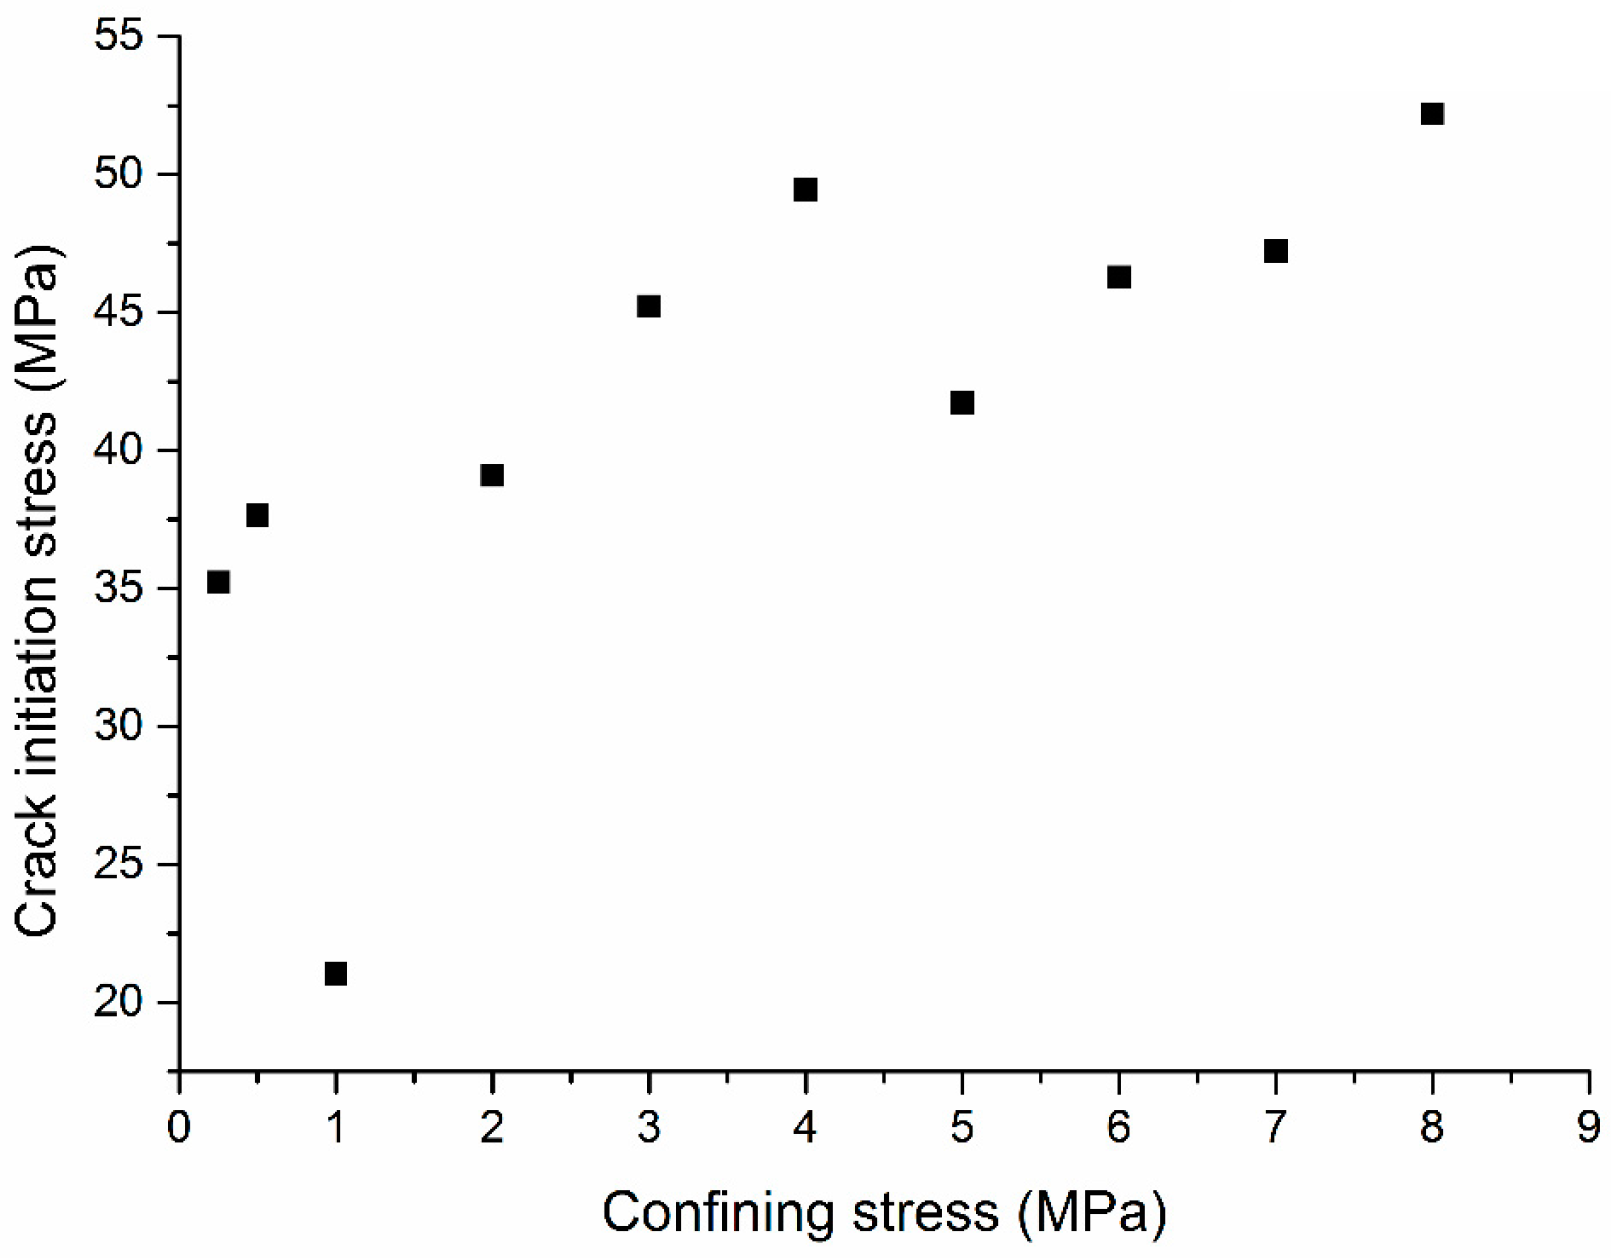
Figure 20.
Volumetric strain at the crack initiation threshold for coal specimens in group 1.

Figure 21.
The increase in peak axial stress and crack initiation stress with the enhanced confinement.
Figure 21.
The increase in peak axial stress and crack initiation stress with the enhanced confinement.

Table 1.
Loading condition and geometric dimension of coal specimens.
| Specimen Numbering | Confining Stress (MPa) | Axial Loading Rate (mm/min) | Diameter (mm) | Height (mm) | Note |
|---|---|---|---|---|---|
| 1-1 | 0.25 | 0.15 | 49.00 | 100.00 | Group 1 |
| 1-2 | 0.25 | 0.15 | 49.91 | 100.00 | Group 2 |
| 2-1 | 0.5 | 0.15 | 49.05 | 100.00 | Group 1 |
| 2-2 | 0.5 | 0.15 | 49.35 | 100.00 | Group 2 |
| 3-1 | 1.00 | 0.15 | 49.55 | 100.00 | Group 1 |
| 3-2 | 1.00 | 0.15 | 49.39 | 100.00 | Group 2 |
| 4-1 | 2.00 | 0.15 | 48.66 | 100.00 | Group 1 |
| 4-2 | 2.00 | 0.15 | 49.55 | 100.00 | Group 2 |
| 5-1 | 3.00 | 0.15 | 49.2 | 100.03 | Group 1 |
| 5-2 | 3.00 | 0.15 | 49.39 | 100.00 | Group 2 |
| 6-1 | 4.00 | 0.15 | 49.63 | 100.00 | Group 1 |
| 6-2 | 4.00 | 0.15 | 49.35 | 100.00 | Group 2 |
| 7-1 | 5.00 | 0.15 | 49.29 | 100.00 | Group 1 |
| 7-2 | 5.00 | 0.15 | 49.56 | 100.02 | Group 2 |
| 8-1 | 6.00 | 0.15 | 49.40 | 100.00 | Group 1 |
| 8-2 | 6.00 | 0.15 | 49.30 | 100.02 | Group 2 |
| 9-1 | 7.00 | 0.15 | 49.59 | 100.00 | Group 1 |
| 9-2 | 7.00 | 0.15 | 49.43 | 100.00 | Group 2 |
| 10-1 | 8.00 | 0.15 | 49.80 | 100.00 | Group 1 |
| 10-2 | 8.00 | 0.15 | 49.70 | 100.00 | Group 2 |
Table 2.
Micro parameters of the parallel bond model.
| Micro Parameters | Value |
|---|---|
| Particle density (kg/m3) | 1960 |
| Effective modulus (GPa) | 1.0 |
| Normal-to-shear stiffness ratio | 1.5 |
| Friction coefficient | 0.4 |
| Gap interval | 0.0 |
| Radius multiplier | 1.0 |
| Bond effective modulus (GPa) | 1.0 |
| Bond effective modulus (GPa) | 1.5 |
| Moment contribution factor | 1.0 |
| Tensile strength (MPa) | 10.0 |
| Cohesion (MPa) | 40.0 |
© 2019 by the authors. Licensee MDPI, Basel, Switzerland. This article is an open access article distributed under the terms and conditions of the Creative Commons Attribution (CC BY) license (http://creativecommons.org/licenses/by/4.0/).
Share and Cite
MDPI and ACS Style
Zhang, J.; Li, Y. Coal Strength Development with the Increase of Lateral Confinement. Energies 2019, 12, 405. https://doi.org/10.3390/en12030405
AMA Style
Zhang J, Li Y. Coal Strength Development with the Increase of Lateral Confinement. Energies. 2019; 12(3):405. https://doi.org/10.3390/en12030405
Chicago/Turabian StyleZhang, Junwen, and Yulin Li. 2019. "Coal Strength Development with the Increase of Lateral Confinement" Energies 12, no. 3: 405. https://doi.org/10.3390/en12030405
Note that from the first issue of 2016, this journal uses article numbers instead of page numbers. See further details here.