Multiple-Point Voltage Control to Minimize Interaction Effects in Power Systems

School of Electronic and Electrical Engineering, Daegu Catholic University, Gyeongbuk 38430, Korea
*
Author to whom correspondence should be addressed.
Energies 2019, 12(2), 274; https://doi.org/10.3390/en12020274
Submission received: 8 November 2018
/
Revised: 19 December 2018
/
Accepted: 9 January 2019
/
Published: 16 January 2019
(This article belongs to the Special Issue Intelligent Control in Energy Systems)
Abstract
:This paper proposes an advanced continuous voltage control method that implements multiple-point control to ensure peak power system performance. Most control schemes utilize generators to regulate the pilot point voltage of a control area. However, exact control of a single pilot point is difficult because of the influence of adjacent areas in a meshed power system. To address this challenge, the proposed method accesses multiple pilot points to mitigate the effects of the neighboring area. In simulations of the Korean power system, the proposed control scheme offered a considerable improvement in performance when compared with the conventional, currently implemented voltage control system.
1. Introduction
The problem of controlling voltage and reactive power in large and complex electric systems requires a great deal of effort on the part of system operators to design and implement sophisticated control schemes. Various devices are used to control these parameters in electrical power systems. Generators are usually equipped with automatic regulators that smooth the voltage variations caused by load fluctuations or failures. Other devices are also installed for this purpose, such as capacitors, reactors, and transformers with load tap changers. Faced with rapid changes in network and operating conditions, electric utilities are increasingly becoming interested in holistic, coherent control systems. These systems are expected to coordinate local facilities for better voltage control, allowing more stable and faster reactions within different regions of the network in case of high voltages and reactive power variations.
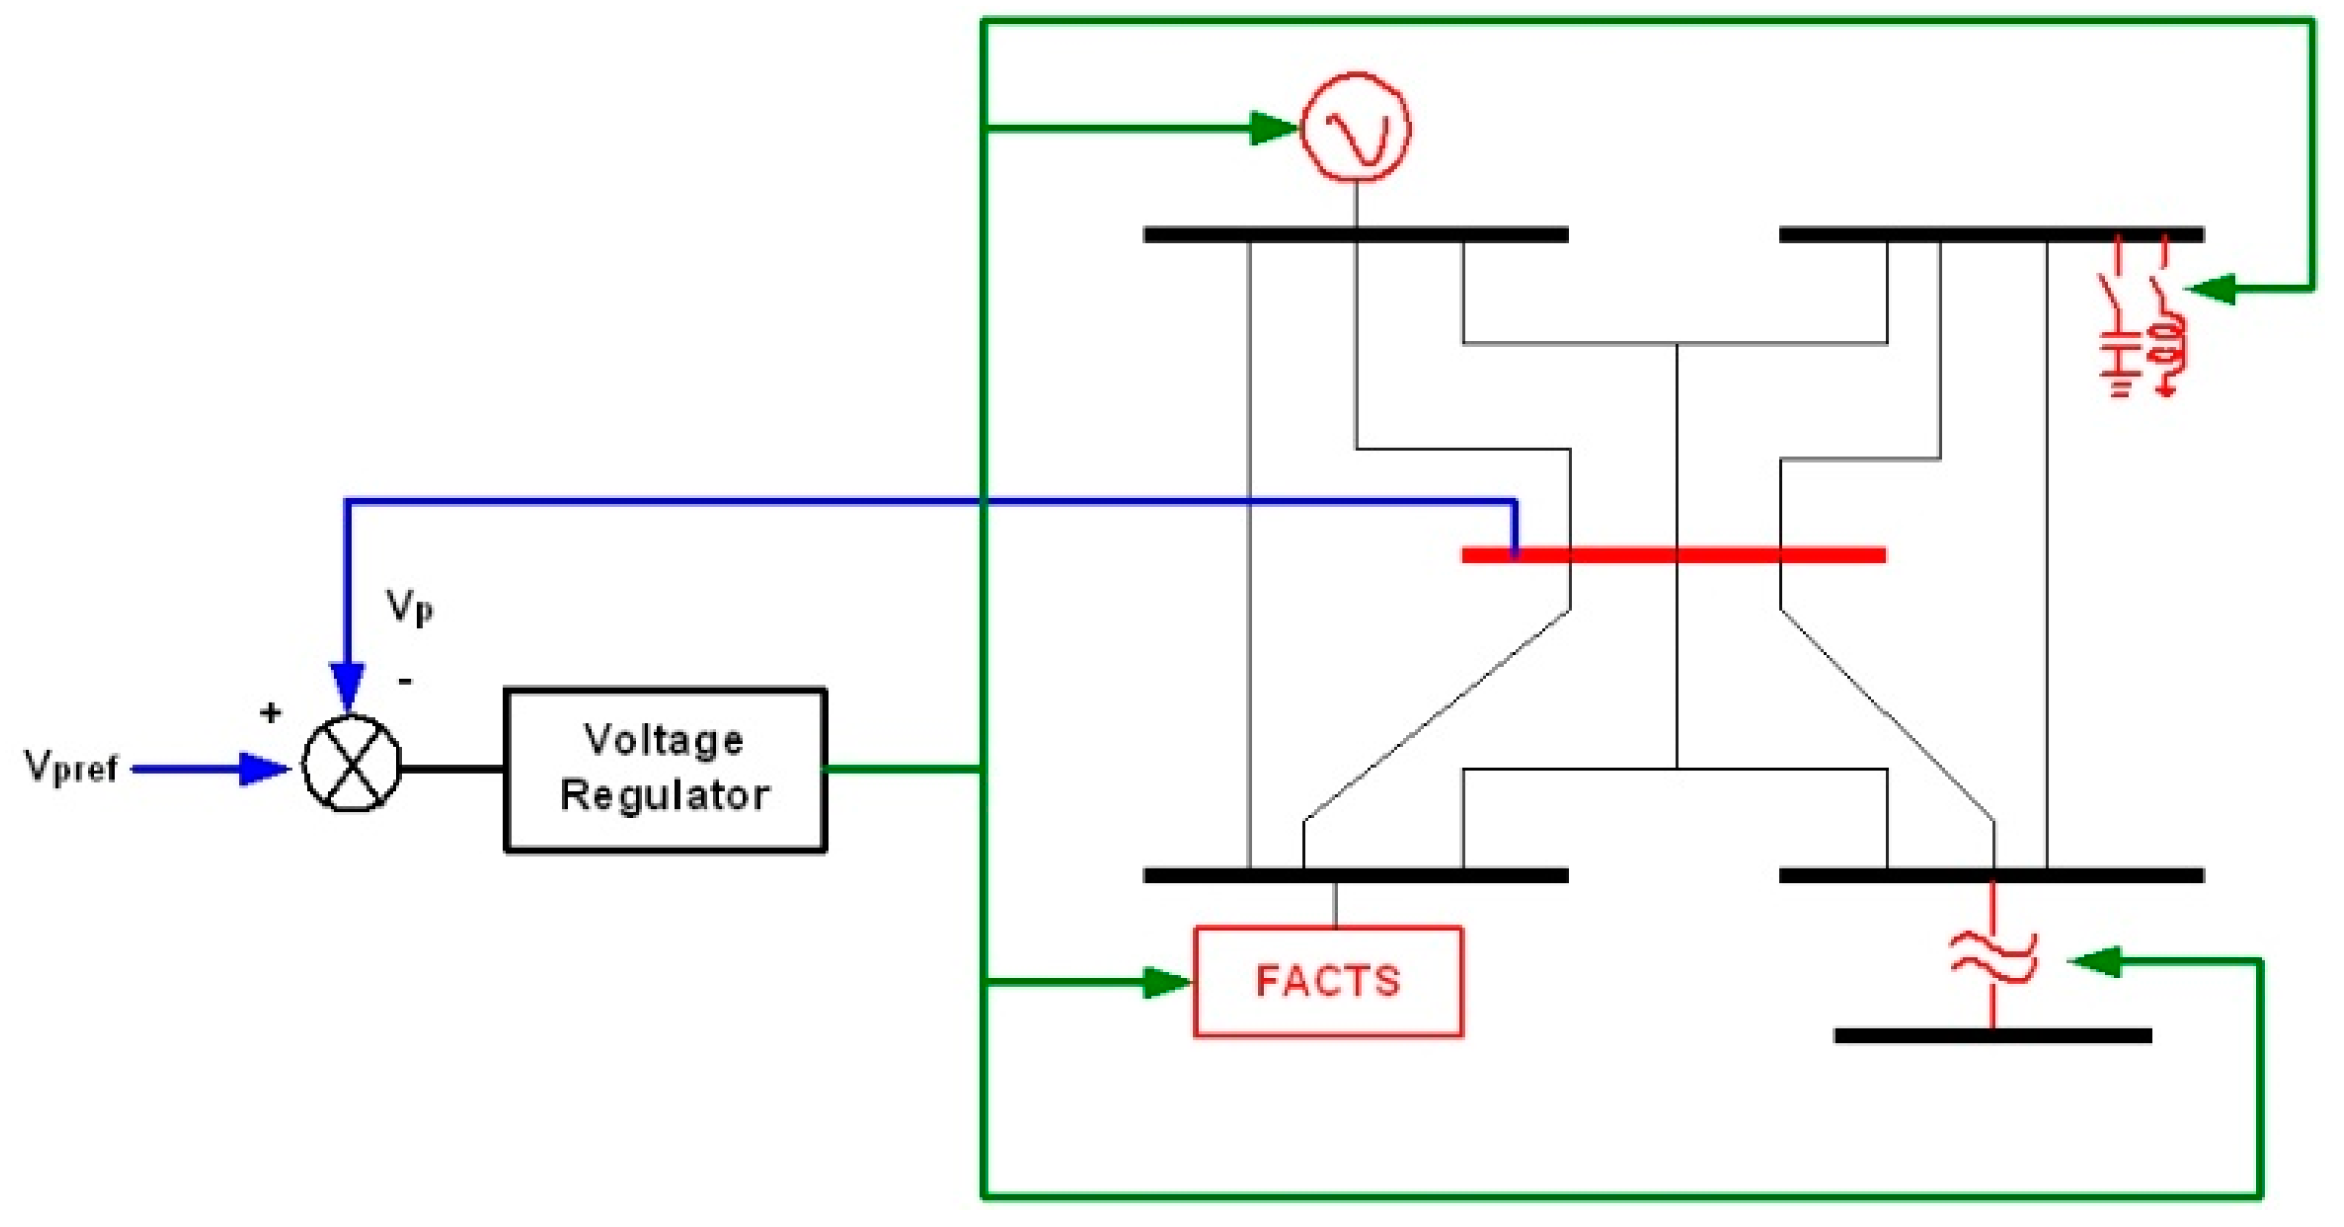
Electrical power utilities have always been aware of the need for voltage control facilities in the transmission network, and a wide variety of approaches have been designed and implemented worldwide [1,2,3,4,5,6]. In Europe, hierarchical control structures are deployed to automatically coordinate reactive power resources to support a constant system voltage. Novel approaches called secondary voltage regulation (SVR) have been tested in France, Italy, Belgium, and Spain, and some of these have already been extended to the national level working on real systems [6]. Hierarchical control systems are organized in a three-level structure: primary, secondary, and tertiary voltage regulation. The primary level controls the terminal voltage of the generator with an automatic voltage regulator. The secondary level, which is based on the pilot point concept, controls the voltage at pilot points by varying the output of generators in each control area of the transmission network. Figure 1 illustrates the concept of secondary-level voltage regulation. Finally, tertiary control computes changes in generator voltage to regulate load voltages on the entire interconnected system.
Recent studies on closed-loop control have mainly focused on the quality of models in model predictive control implementations [7] and the feedback design of proportional–integral–derivative (PID) control systems [8]. Various control methods are applied to the closed-loop control. While voltage control of an interconnected, large-scale power system is widely recognized as an important problem, the basic formulation of a control scheme is often specific to the utility. Voltage control is typically viewed as a static problem, whose solution is identical to centralized open-loop, optimization-based voltage management. This approach is often referred to as tertiary control, particularly in the literature about European power systems [9,10].
To ensure that the different levels of hierarchical control do not adversely affect each other and to reduce the risks of oscillation or hunting, each hierarchical level has a different time response. At the primary level, control devices, such as generator automatic voltage regulators (AVRs), act locally on rapid voltage variations to keep the local voltages at their reference values. The time constant of these devices is generally in the range of hundreds of milliseconds to seconds. At the secondary level, slower and larger voltage variations in the control area, such as those caused by hourly load changes or contingencies, are fed back to the controller as voltage variations from the reference value of a pilot point. Secondary-level controllers act upon these deviations and update the reference values at the primary level with a time constant of the order of tens of seconds to a few minutes. Finally, at the tertiary level, power system data is used to compute optimal pilot point voltages to ensure economy and security of the power system operations. These computations are achieved by solving optimization problems, either automatically or manually. The time constant for these computations can be tens of minutes.
This paper develops a multiple-point algorithm for continuous voltage control (CVC), which processes multiple voltage points that interact with multiple continuous voltage control (MCVC) in each zone. The CVC is based on the SVR but has several problems such as interaction effects and voltage oscillations. Therefore, the MCVC algorithm can regulate the voltages at pilot points around set-point values while separating the evolutions of those voltages. Operators generally want to modify device operations locally, which is possible when adjusting the set-point voltage of a pilot point. In addition, the proposed control method can prevent voltage oscillations at adjacent pilot points via the existing CVC. The MCVC algorithm addresses the reference voltage at all pilot points. First, the target voltage is regulated for voltage stability within a zone; then, adjustments are made to the target voltages in neighboring zones to smooth the voltage profile of the whole system. The proposed control algorithm was tested using the data of the Korean power system.
2. Multiple-Point Control Algorithm for the CVC
2.1. Principle of the Control Algorithm
Voltage variations in each control zone are represented by the variations at the pilot points. The aim of the multiple-point control algorithm is to hold the voltages at these pilot points at set-point values, such as the CVC. However, the number of generators, and thus the number of control variables, is generally greater than the number of pilot-point output variables. The multiple-point control algorithm improves the CVC so that it can control larger zones compared to the original CVC, which was designed to control smaller zones. With enhanced coordination, the advanced CVC achieves better performance in terms of the interactions between control zones. Consequently, the reactive power generation of the control generator can be minimized, and reactive power reserves can be conserved to cope with any disturbance in the control zone [11,12].
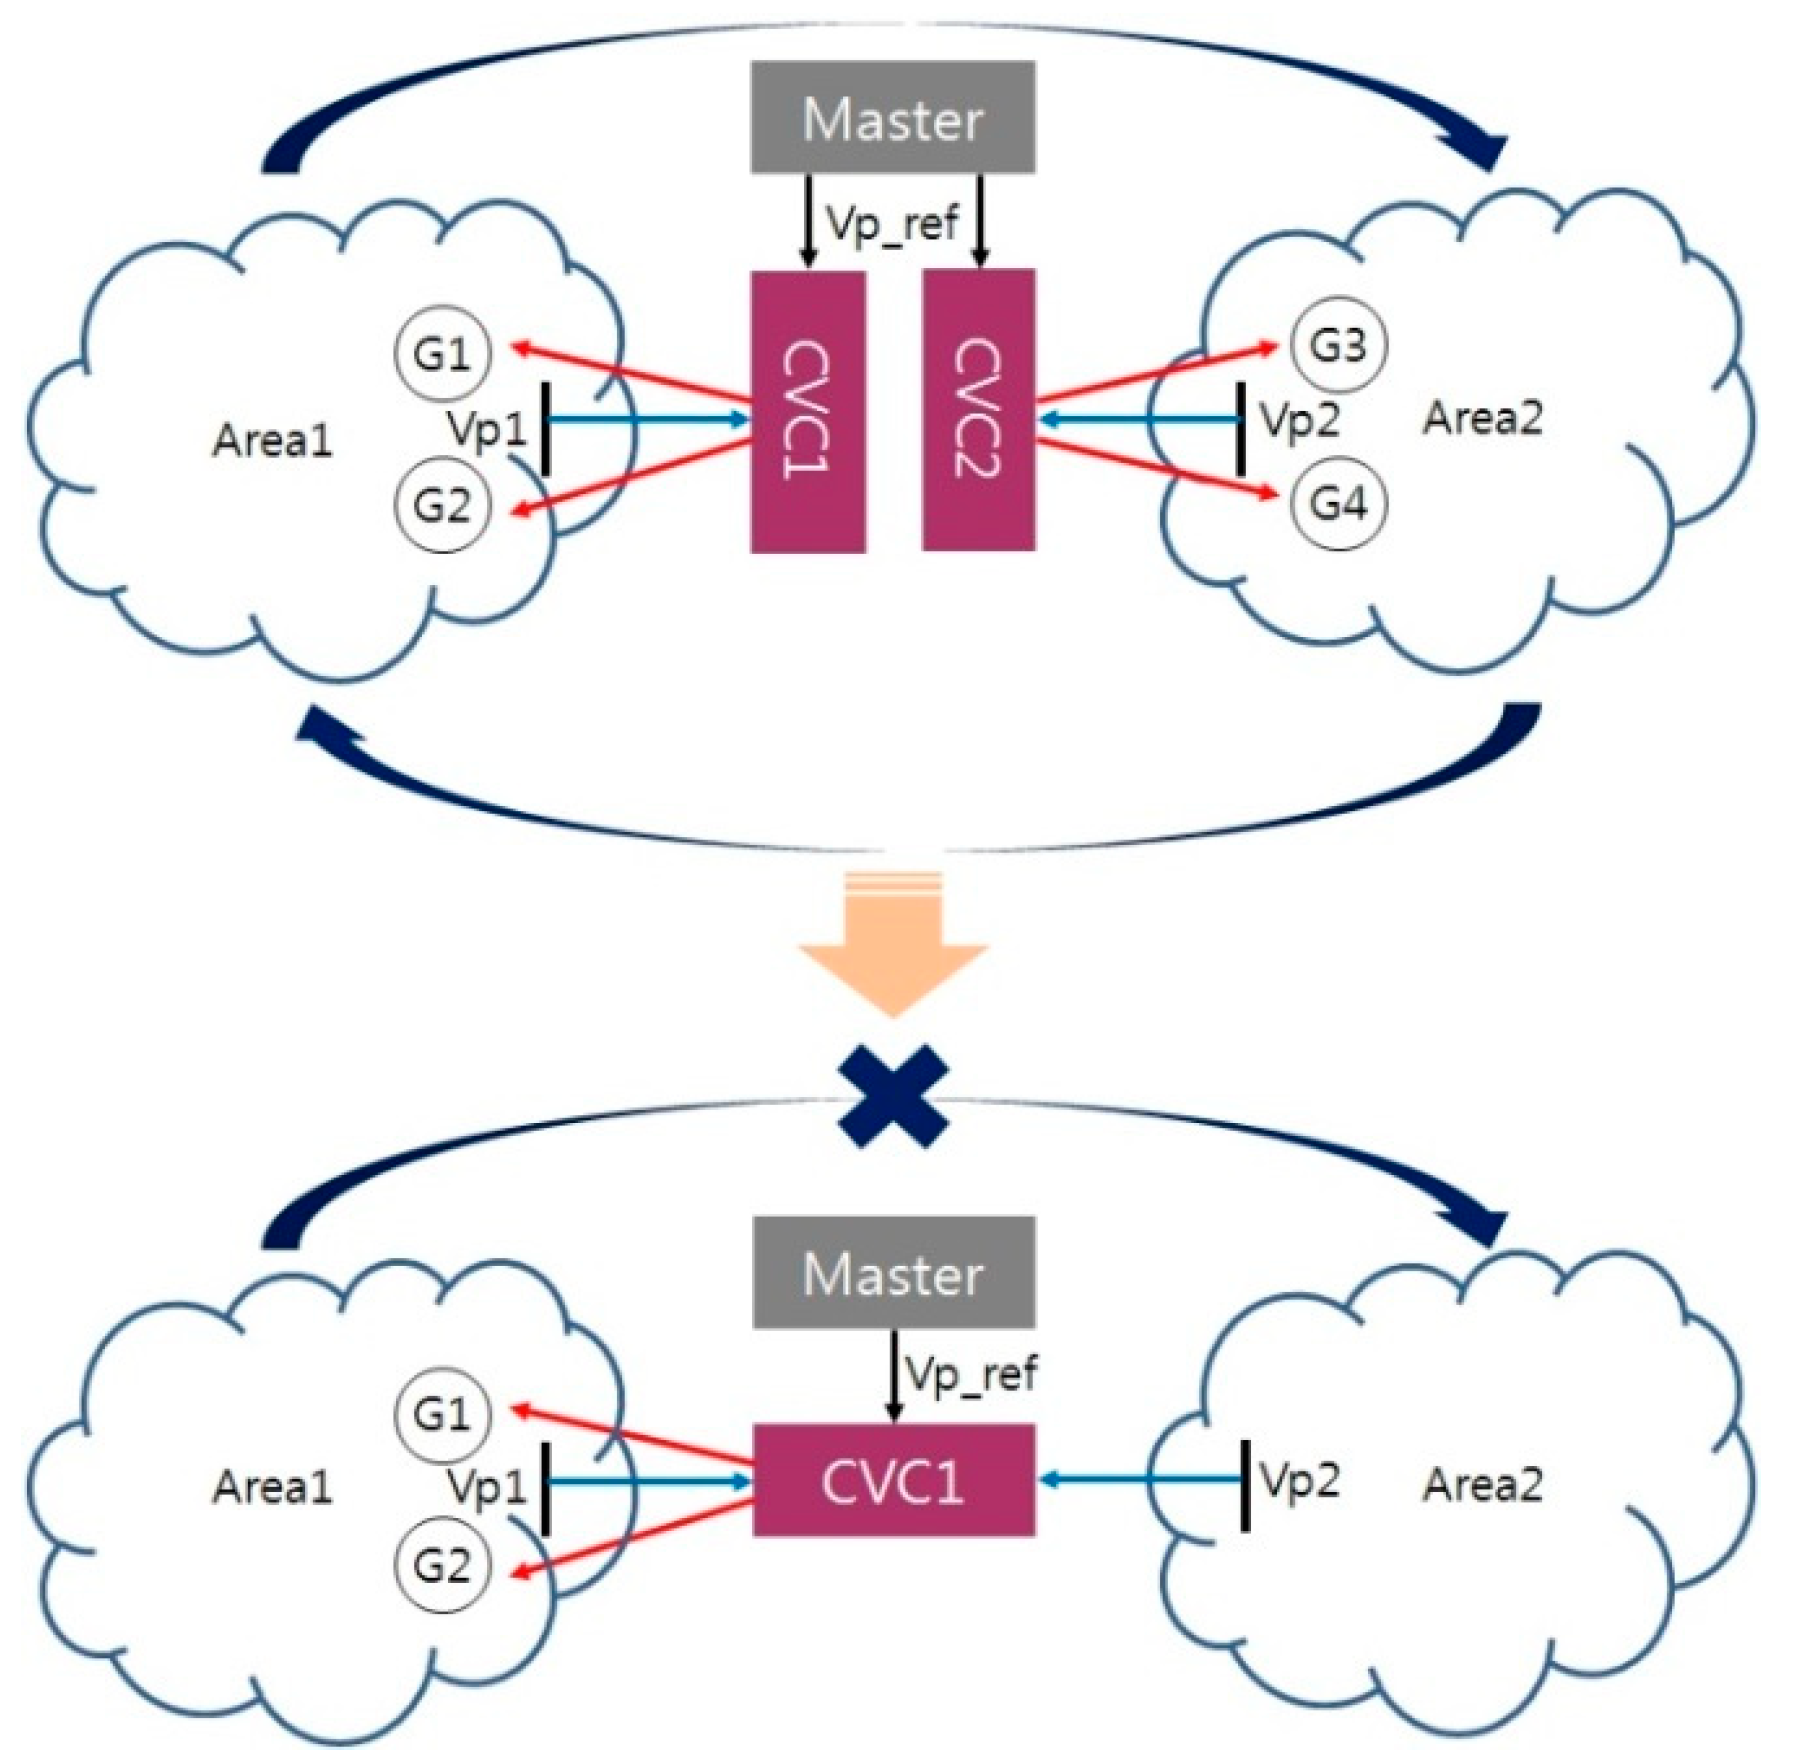
The basic structure of the multiple-point control algorithm with distributed hierarchical control systems is shown in Figure 2. The MCVC is treated as two controllers: a coordination controller governed by the corresponding execution controllers and an individual primary voltage controller for the reactive power dispatcher (RPD). Taken together, these controllers form the multiple-point control system. All the control generators are coordinated for a common objective: to minimize the voltage deviation under normal operating conditions and to maintain an acceptable regional voltage profile in case of system contingencies.
The MCVC algorithm accounts for the existing voltage of pilot points in neighboring zones along with the reference voltage of a pilot point in a single zone, as depicted in Figure 2. The primary objective is to regulate pilot points in a single zone, which was obviously the role of the original CVC. The MCVC also includes the secondary objective of preventing mutual influence between two zones. The Master in Figure 2 gives the voltage reference value. In MCVC, the Master sends the voltage reference to the CVC, and the CVC then compares the voltage from Area 1 and Area 2. The CVC decides the set-point of the generator by comparing the results.
2.2. Operating Mechanism of the Control Algorithm
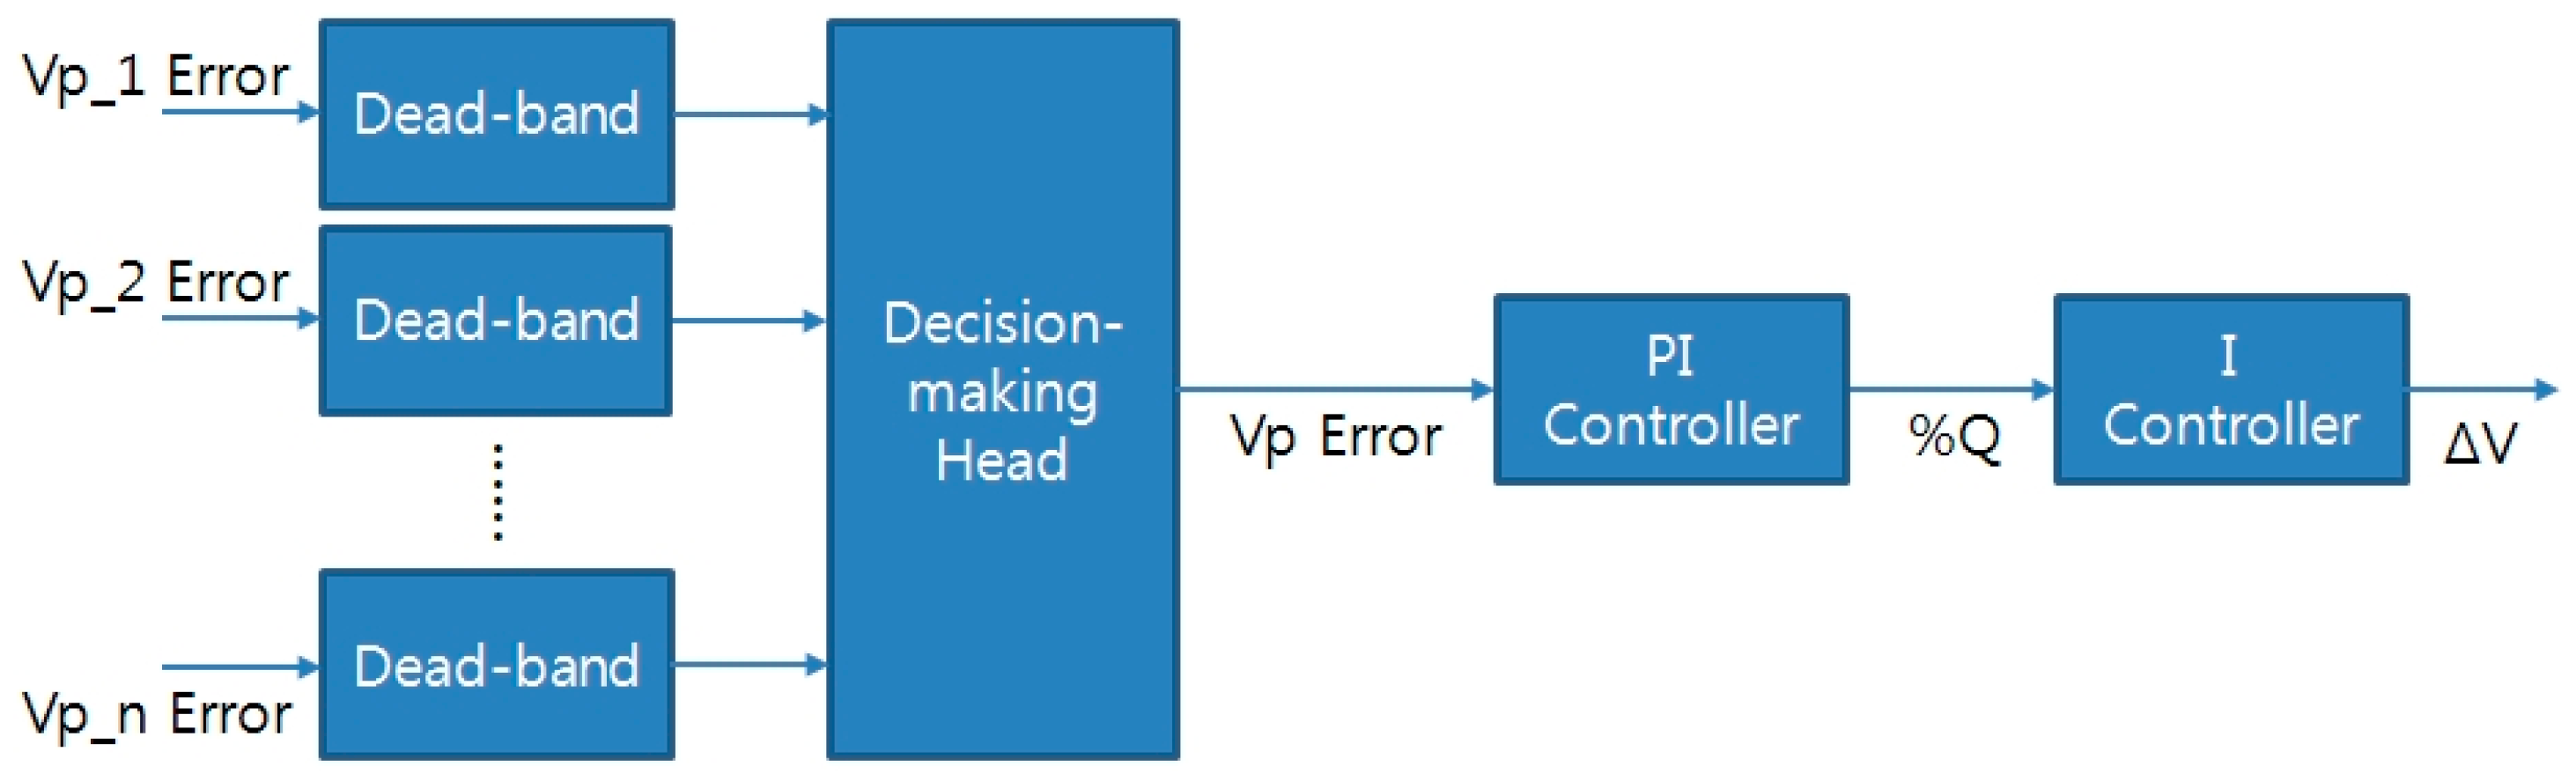
The control algorithm is composed of four sections: a dead-band, a decision-making section, a proportional integral (PI) controller, and an integral (I) controller. The relationships between these steps are illustrated in Figure 3.
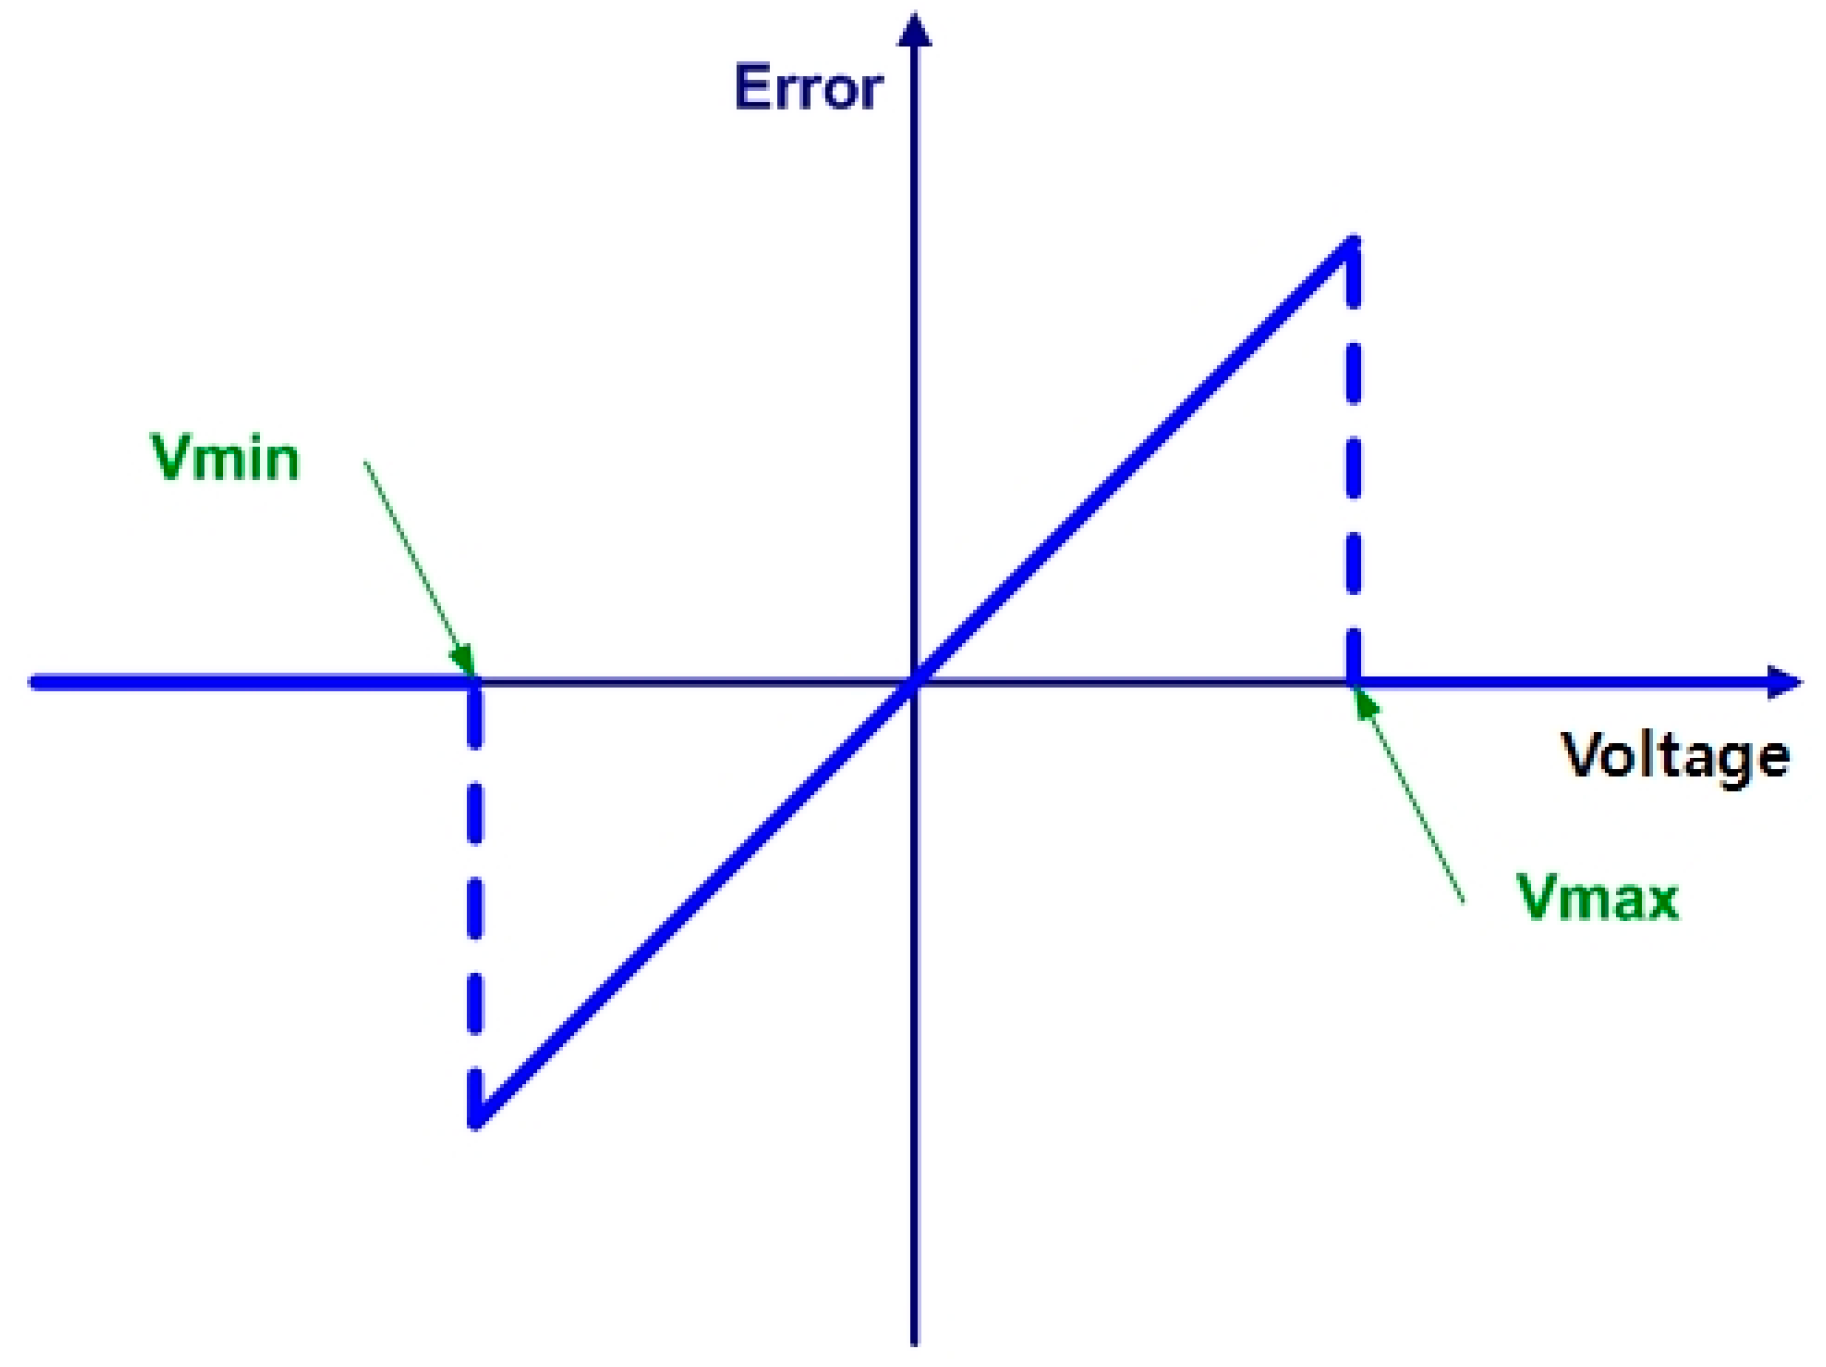
The dead-band section includes two processes. The first process is a protection logic that enables the controller to avoid abnormal signals that are, for example, very intense or out of sequence. If the input signal is over a standard threshold, the control block changes this output signal to zero. An alarm condition is also included if no sequence is input to the dead-band block. In this case, the algorithm is stopped. The rule of the protection logic is described in Figure 4, and the abnormal signal condition therein is as follows. Vmax and Vmin are generically defined as 1.05 (p.u.) and 0.95 (p.u.) in Figure 4.
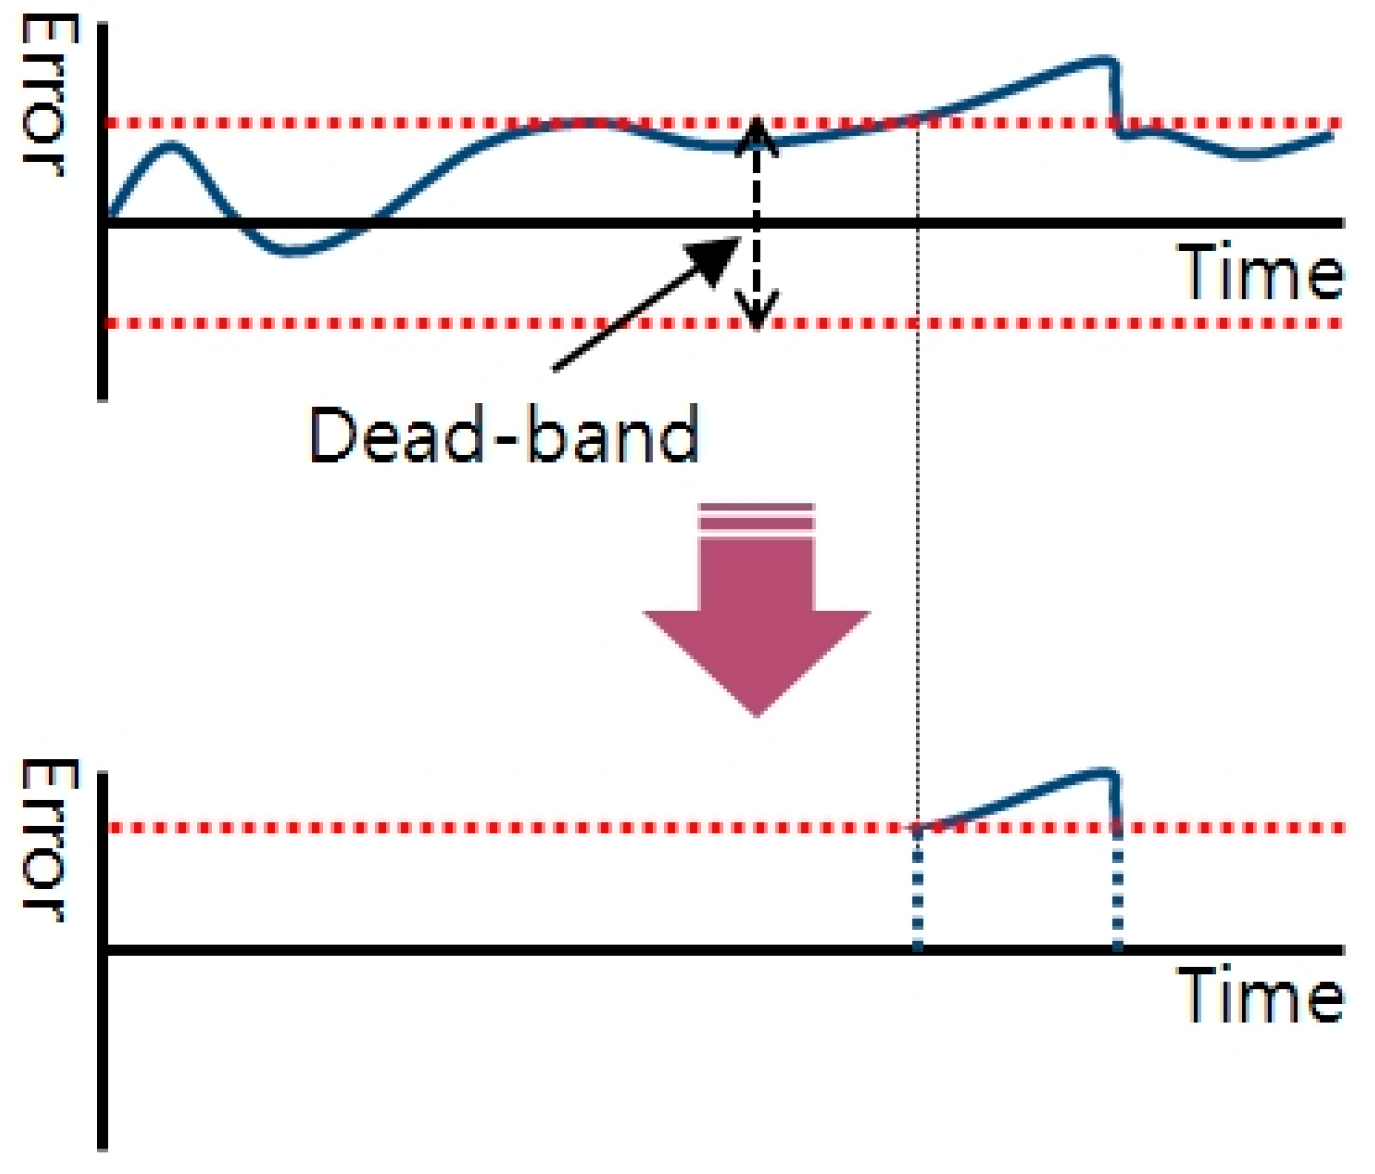
The second process within the dead-band accounts for sampling error. This prevents control oscillations or unnecessary control interventions. Its concept is similar to that underlying the time integration method [13]. The concept behind the second process is illustrated in Figure 5. Emax and Emin are 0.01 and −0.01, respectively, in Figure 5. ε1 and ε2 are the heuristic values and are set by the system operator. The sampling error condition is as follows:
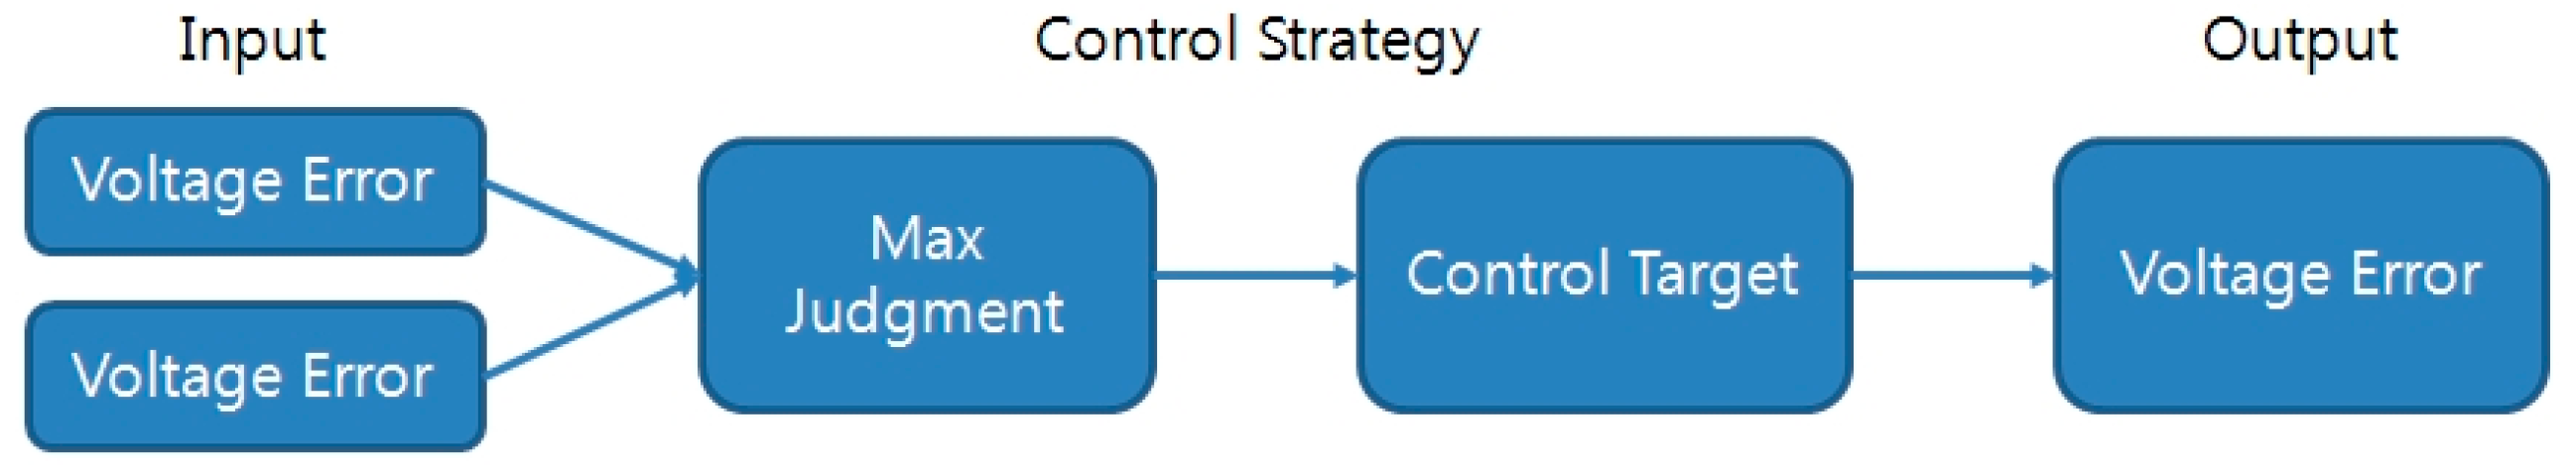
The decision-making head is the core of the control algorithm. To ensure optimal control, the decision-making head compares the voltage error of a particular pilot point with those of the other pilot points. It selects the most important bus, which needs to be controlled more than the other buses, for every time constant. The procedure for selecting the main pilot point for control is described in Figure 6.
First, the voltage errors of all pilot points are input to the max judgment block. In this mode, the maximum value among all the voltage errors is identified. The bus with this maximum error is in more urgent need of regulation than the other buses. After this mode, the original voltage error is normalized to the maximum value. In the final mode, a logic control switch judges the situation and determines whether to alter the generator output. If the selected voltage error is equal to the maximum value, the controller sends the output to the power plant’s CVC; if it is not, this means that one of the other pilot points should be taken as the control target. Equation (3) relates the input errors caused by all pilot points and considers the mutual effects between them.
where
- represent the voltage error;
- VP1(t) represents the present voltage of the target pilot point at time t;
- VP2(t),…, VPN(t) represent the present voltages of the participating pilot points from the 2nd to the Nth adjacent zone at time t, respectively;
- VP_REF1(t) is the reference voltage of the target pilot point at time t; and
- VP2(0),…, VPN(0) are initial voltages of pilot points that are included in the 2nd to the Nth adjacent zone at the initial time, respectively.
The maximum value is selected from this set of vectors as in Equation (4):
Using this scheme, the control target is selected by the decision-making head, and the control action is initiated. The PI controller section implements the MCVC. The relevant mathematical equations are as follows:
where
- QG%(t) is the reactive power to be generated in each RPD, and KPC and KIC are the proportional and integral gain, respectively, in the MCVC.
The reactive power levels are generated in each RPD and sent to the RPD controller. The PI controller calculates the reactive power level using the difference between the pilot point voltage and the reference value. Then, the I controller adjusts the reference voltage of the AVR using the difference between the calculated reactive power level and the generated reactive power. KPC and KIC are chosen using the sensitivity matrix that relates the pilot points with the control generators. These coefficients must also take time constants into consideration to clearly establish the control hierarchy. The control signals must be arranged to prevent any negative effects resulting from overlapping with the other controllers, such as AVRs. The time constants are generally assumed to be such that AVR (ms) < RPD (5 s) < MCVC (50 s). In addition, QG%(t) has a limit block that corresponds to the generator’s available capacity. To respond to the reactive power generation appropriately, the generator’s available capacity curve must be known. However, a constant reactive power limit determined from the supervisory control and data acquisition/energy management system (SCADA/EMS) data has been used in this study to determine the upper and lower limits because the actual generator specifications were not available.
The I controller section is called the RPD. The equations involved are as follows:
where
- QG(t) represents the reactive power of each generator at time t;
- QG_REF(t) is the reference reactive power at time t;
- QG%(t) is the reactive power to be generated according to the MCVC control signals;
- QG_MIN/MAX(t) is the lower/upper limit of the reactive power; and
- KIR is the integral gain in the RPD.
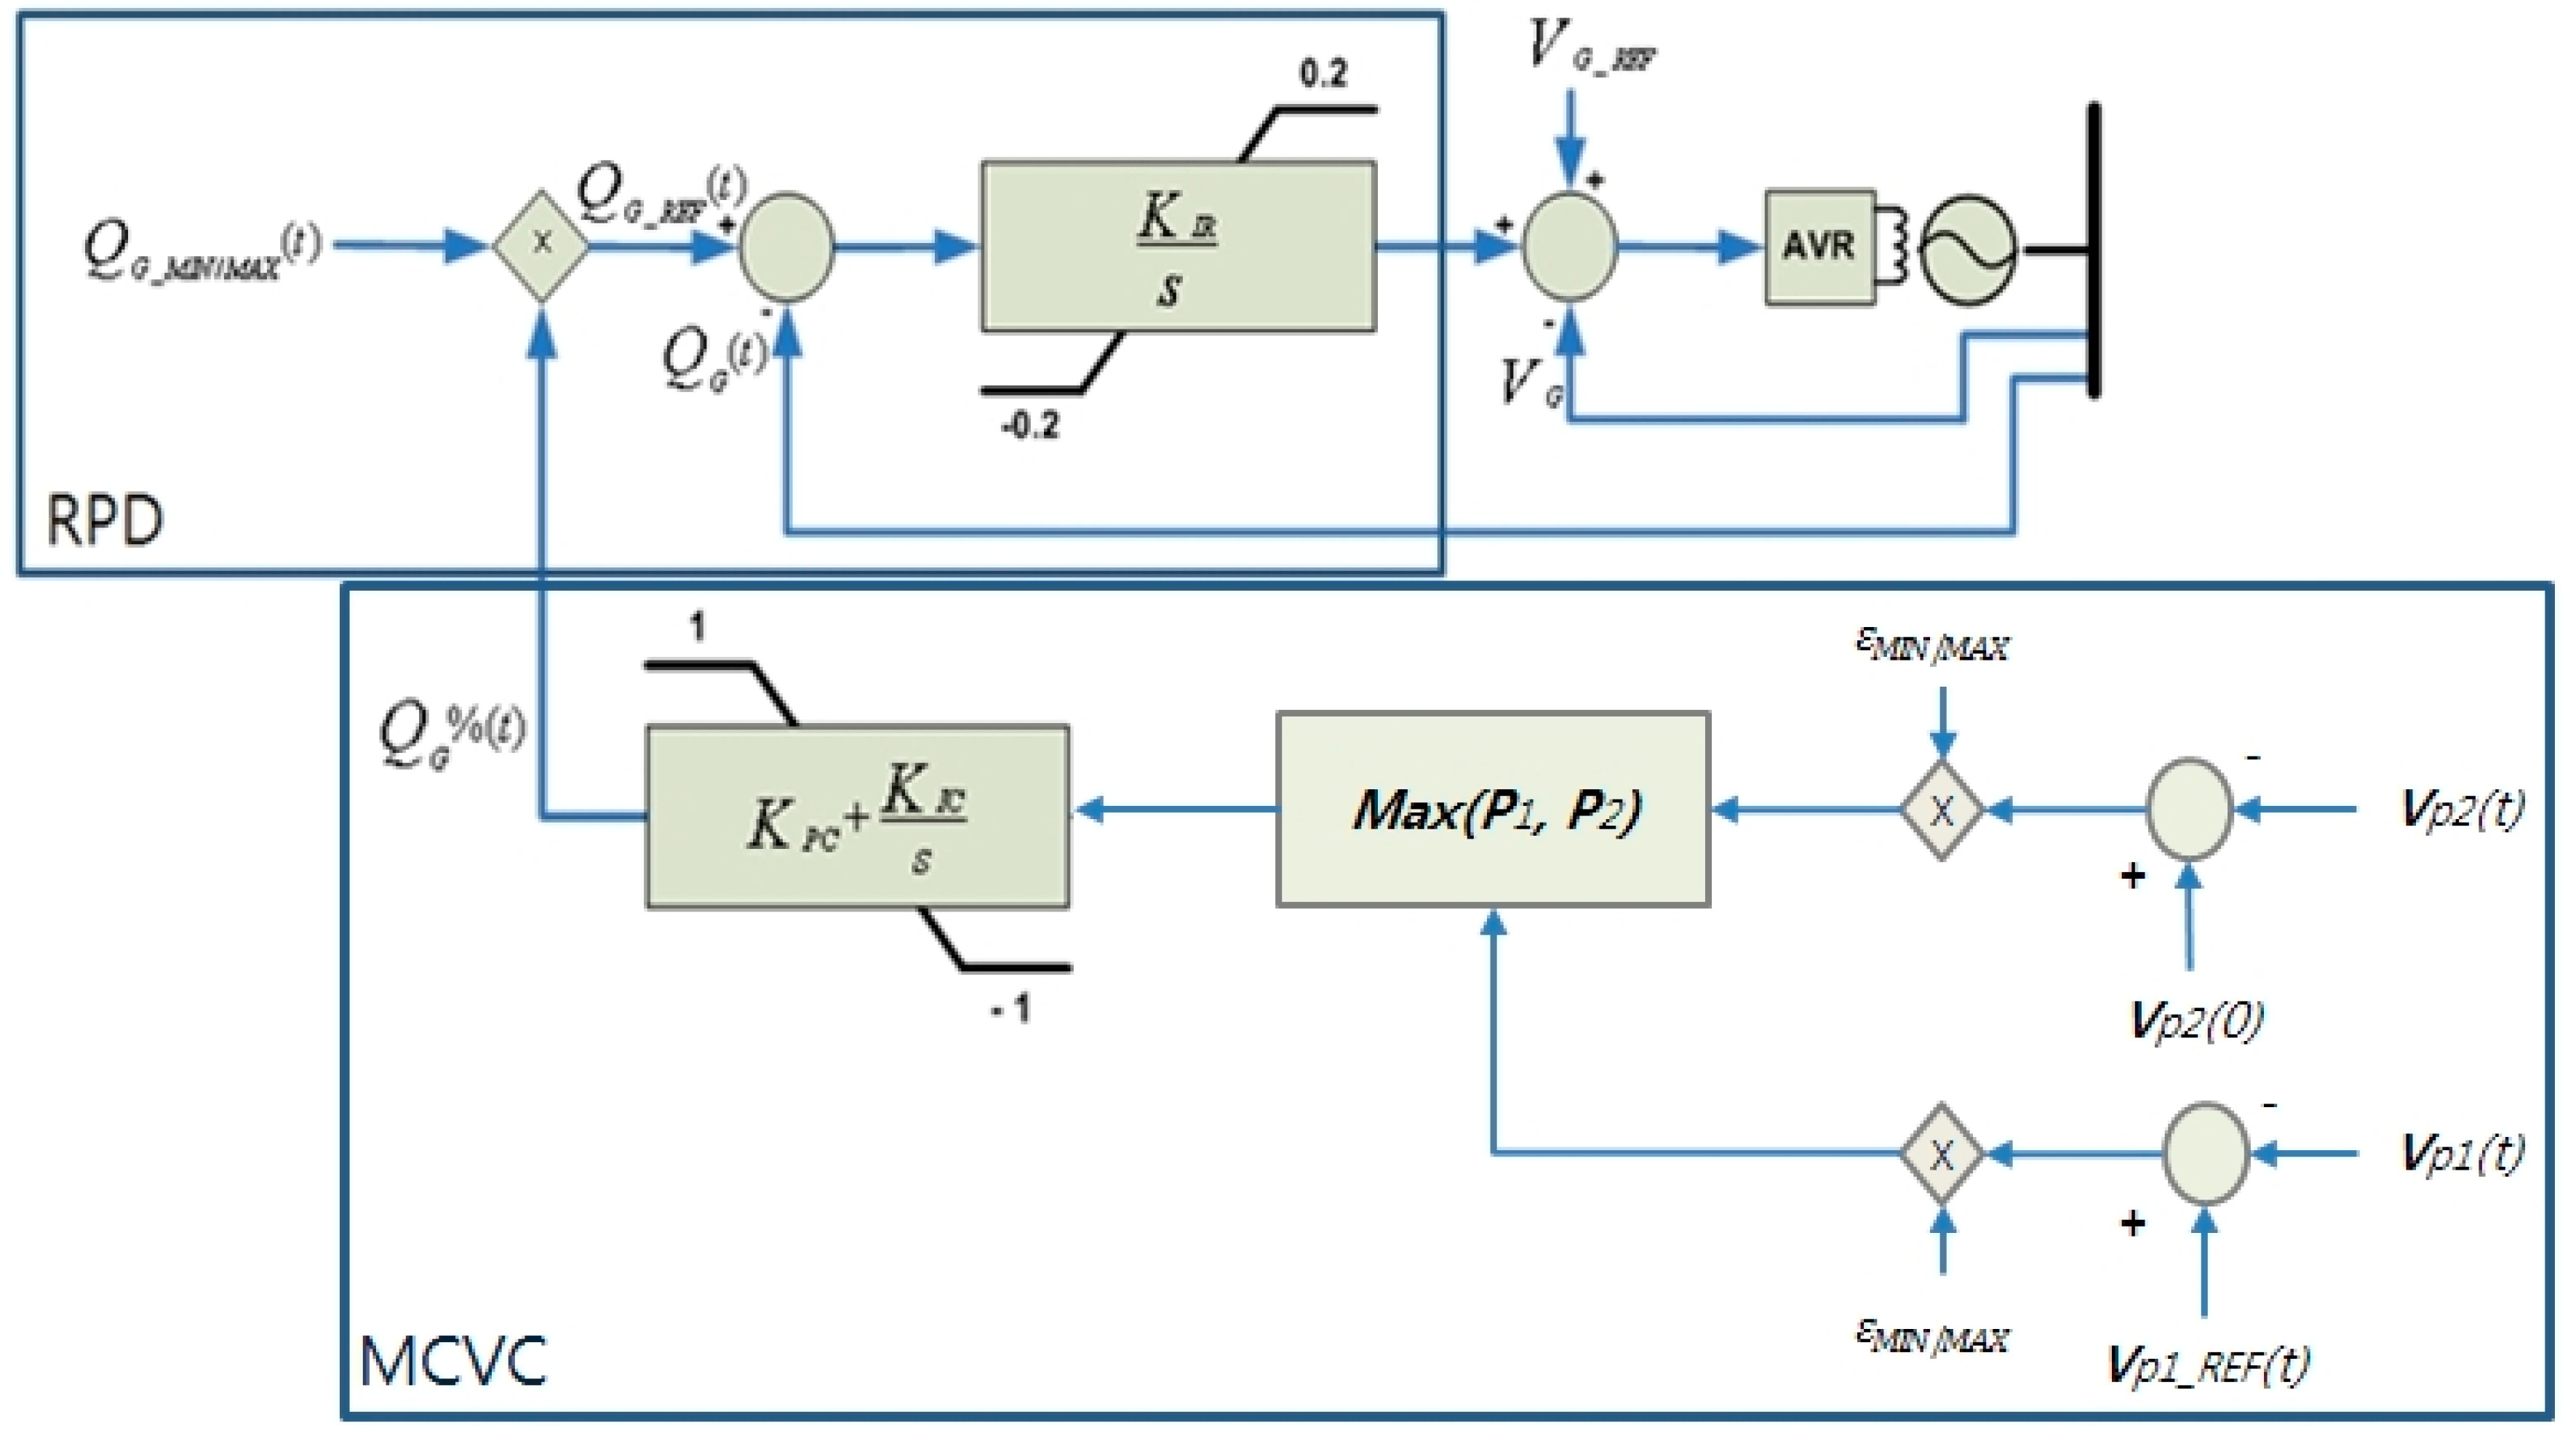
The RPD controller outputs a control signal to regulate the reactive power output of its own generator, and it also sends a signal to the AVR to change the reference voltage of the terminals at other generators. The amount of reactive power that is to be generated is calculated from QG%(t) in the MCVC controller. The calculated reactive power is then compared with the reactive power that is presently being generated, and the difference is used to adjust the reference voltage of the AVR by the I controller. KIR is calculated with consideration of the time constant of the RPD and the reactance of the step-up transformer of each generator. Figure 7 describes the control blocks for the MCVC and the RPD.
The parameters of the control block can be calculated from the following equations:
where
As mentioned above, Xt is the reactance of the step-up transformer installed with each generator, and Xeq is calculated using the sensitivity matrix of the pilot point and the control generators.
where
- ΔQi and ΔQj are the reactive power of the load and the generator, respectively; Bii, Bij, Bji, and Bjj are the transmission line conductance; ΔVi and ΔVj are the voltage of the bus, respectively.
The equations for calculating Xeq in Equations (8) and (9) are drawn from the Jacobian matrix, which represents the sensitivity of the relationship between the pilot point and the control generators [14]. Table 1 lists the values of the control parameter for the control generators in the Korean power system.
Determining the response time of MCVC is the time constants of the PI and I controllers. Therefore, the response time can be reduced by adjusting the time constant. The time constant of the current PI controller is 50 s, and the time constant of the I controller is 5 s.
3. Control Scheme for the MCVC
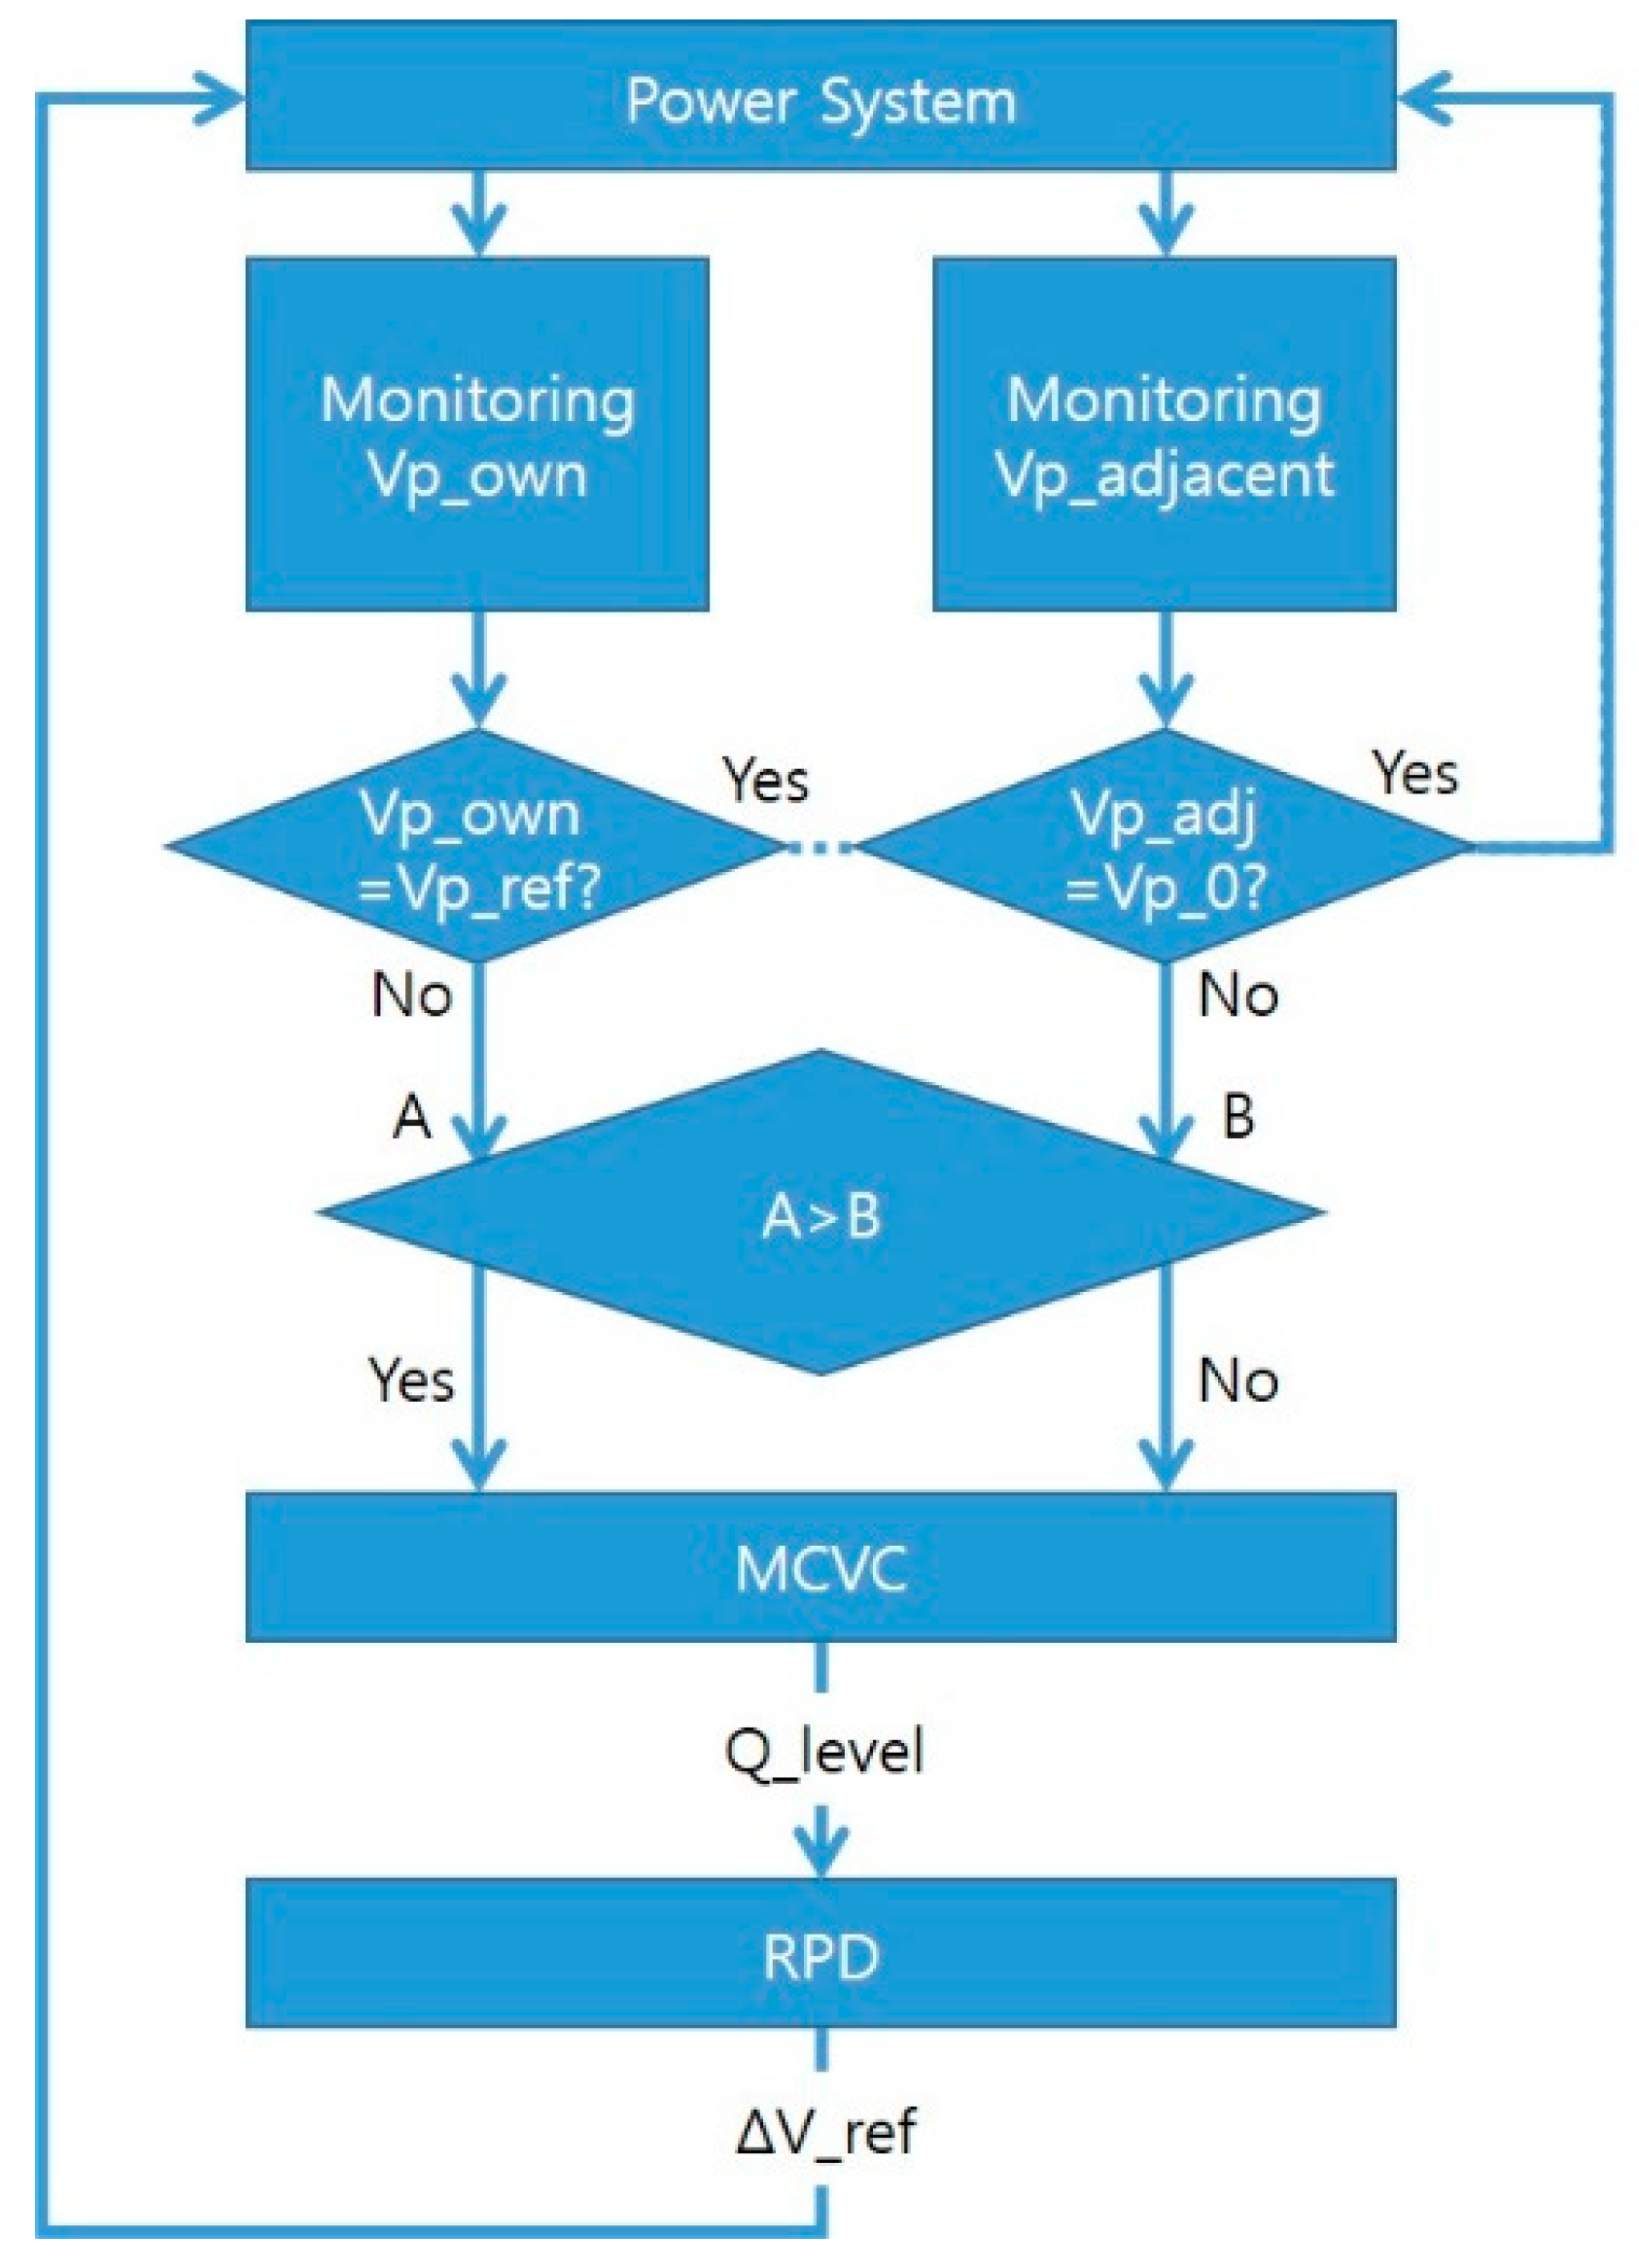
The flowchart of the control scheme for the MCVC, shown in Figure 8, has the following steps:
- Step 1.
- Monitor the pilot points in the control zones of the target power system.
- Step 2.
- Compare the voltage of a target pilot point to its reference voltage.
- Step 3.
- Compare the voltages of pilot points in neighboring zones with their present voltage.
- Step 4.
- Select the control target with the smallest voltage violation among pilot points.
- Step 5.
- Go to step 1 if none of the pilot points have abnormal voltage.
- Step 6.
- According to the control target, determine the requisite reactive power ratios of generators with the MCVC algorithm.
- Step 7.
- According to these reactive power ratios, determine the terminal reference voltages of control generators with the RPD.
- Step 8.
- Repeat the control process from steps 1 to 3.
4. Characteristics of the Korean Power System
4.1. Summary of the Korean Power System
The Korean power system includes about 260 generators and 1400 load buses. Approximately 40% of the total load is concentrated in metropolitan areas, and most of the generators are in nonmetropolitan areas. Furthermore, most of the generation plants in the nonmetropolitan areas have low operating costs. For this reason, a large amount of active power is transmitted from nonmetropolitan to metropolitan areas via interface lines to maximize economy. This transfer of power is defined as interface flow. Any increase in this interface flow, however, may lead to voltage instability due to the lack of reactive power support in the metropolitan areas [15]. Therefore, it is important that the reactive power reserves of power plants in the metropolitan area are defined accurately. The Korean power system is summarized in Table 2.
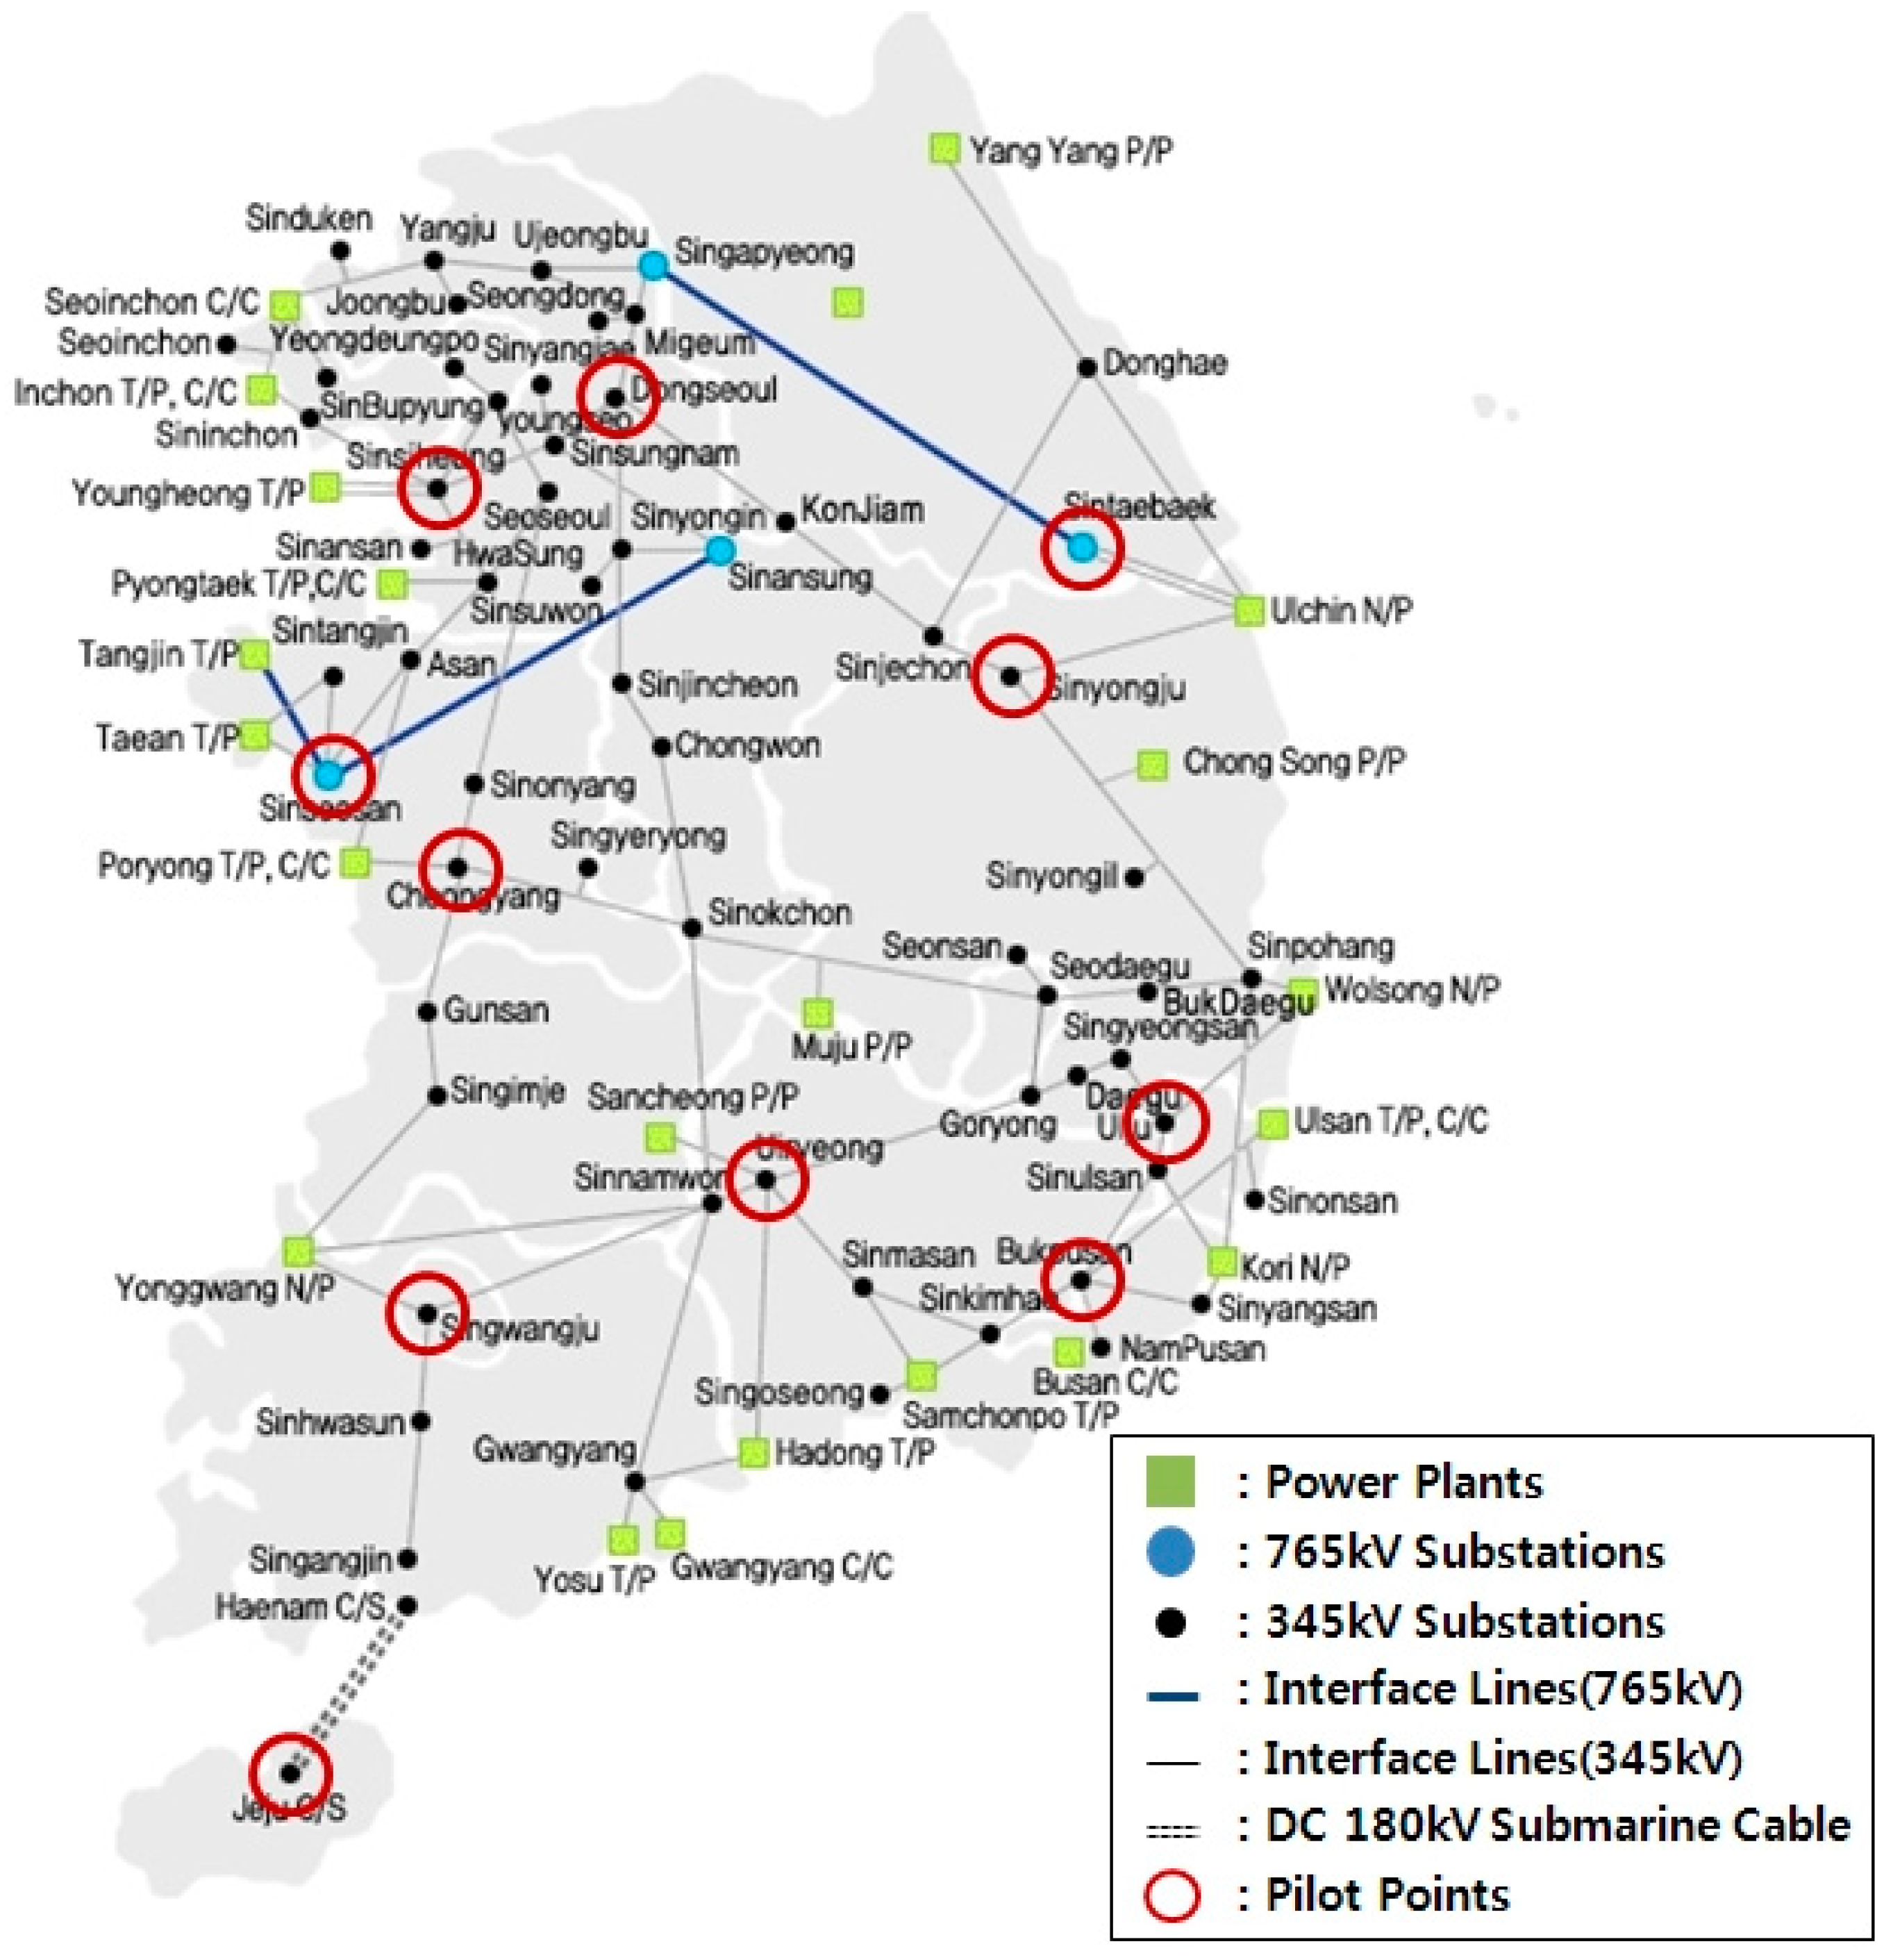
The peak load on the Korean power system is approximately 53,470 MW in the summer. Most plants are in the southwest and southeast regions, while most loads are concentrated in the northern metropolitan area. In addition, switched shunt capacitors and reactors are installed for voltage control at the substations in the north. Figure 9 shows a map of the transmission networks that handle more than 345 kV and the major generating plants in the Korean power system [16].
4.2. Difficulties of CVC Application in the Korean Power System
The Korean power system is a tightly coupled network, especially in the metropolitan area. Therefore, pilot points in adjacent zones are difficult to isolate from each other. For this reason, the actions of control generators need to be coordinated to allow efficient control of coupled zones.
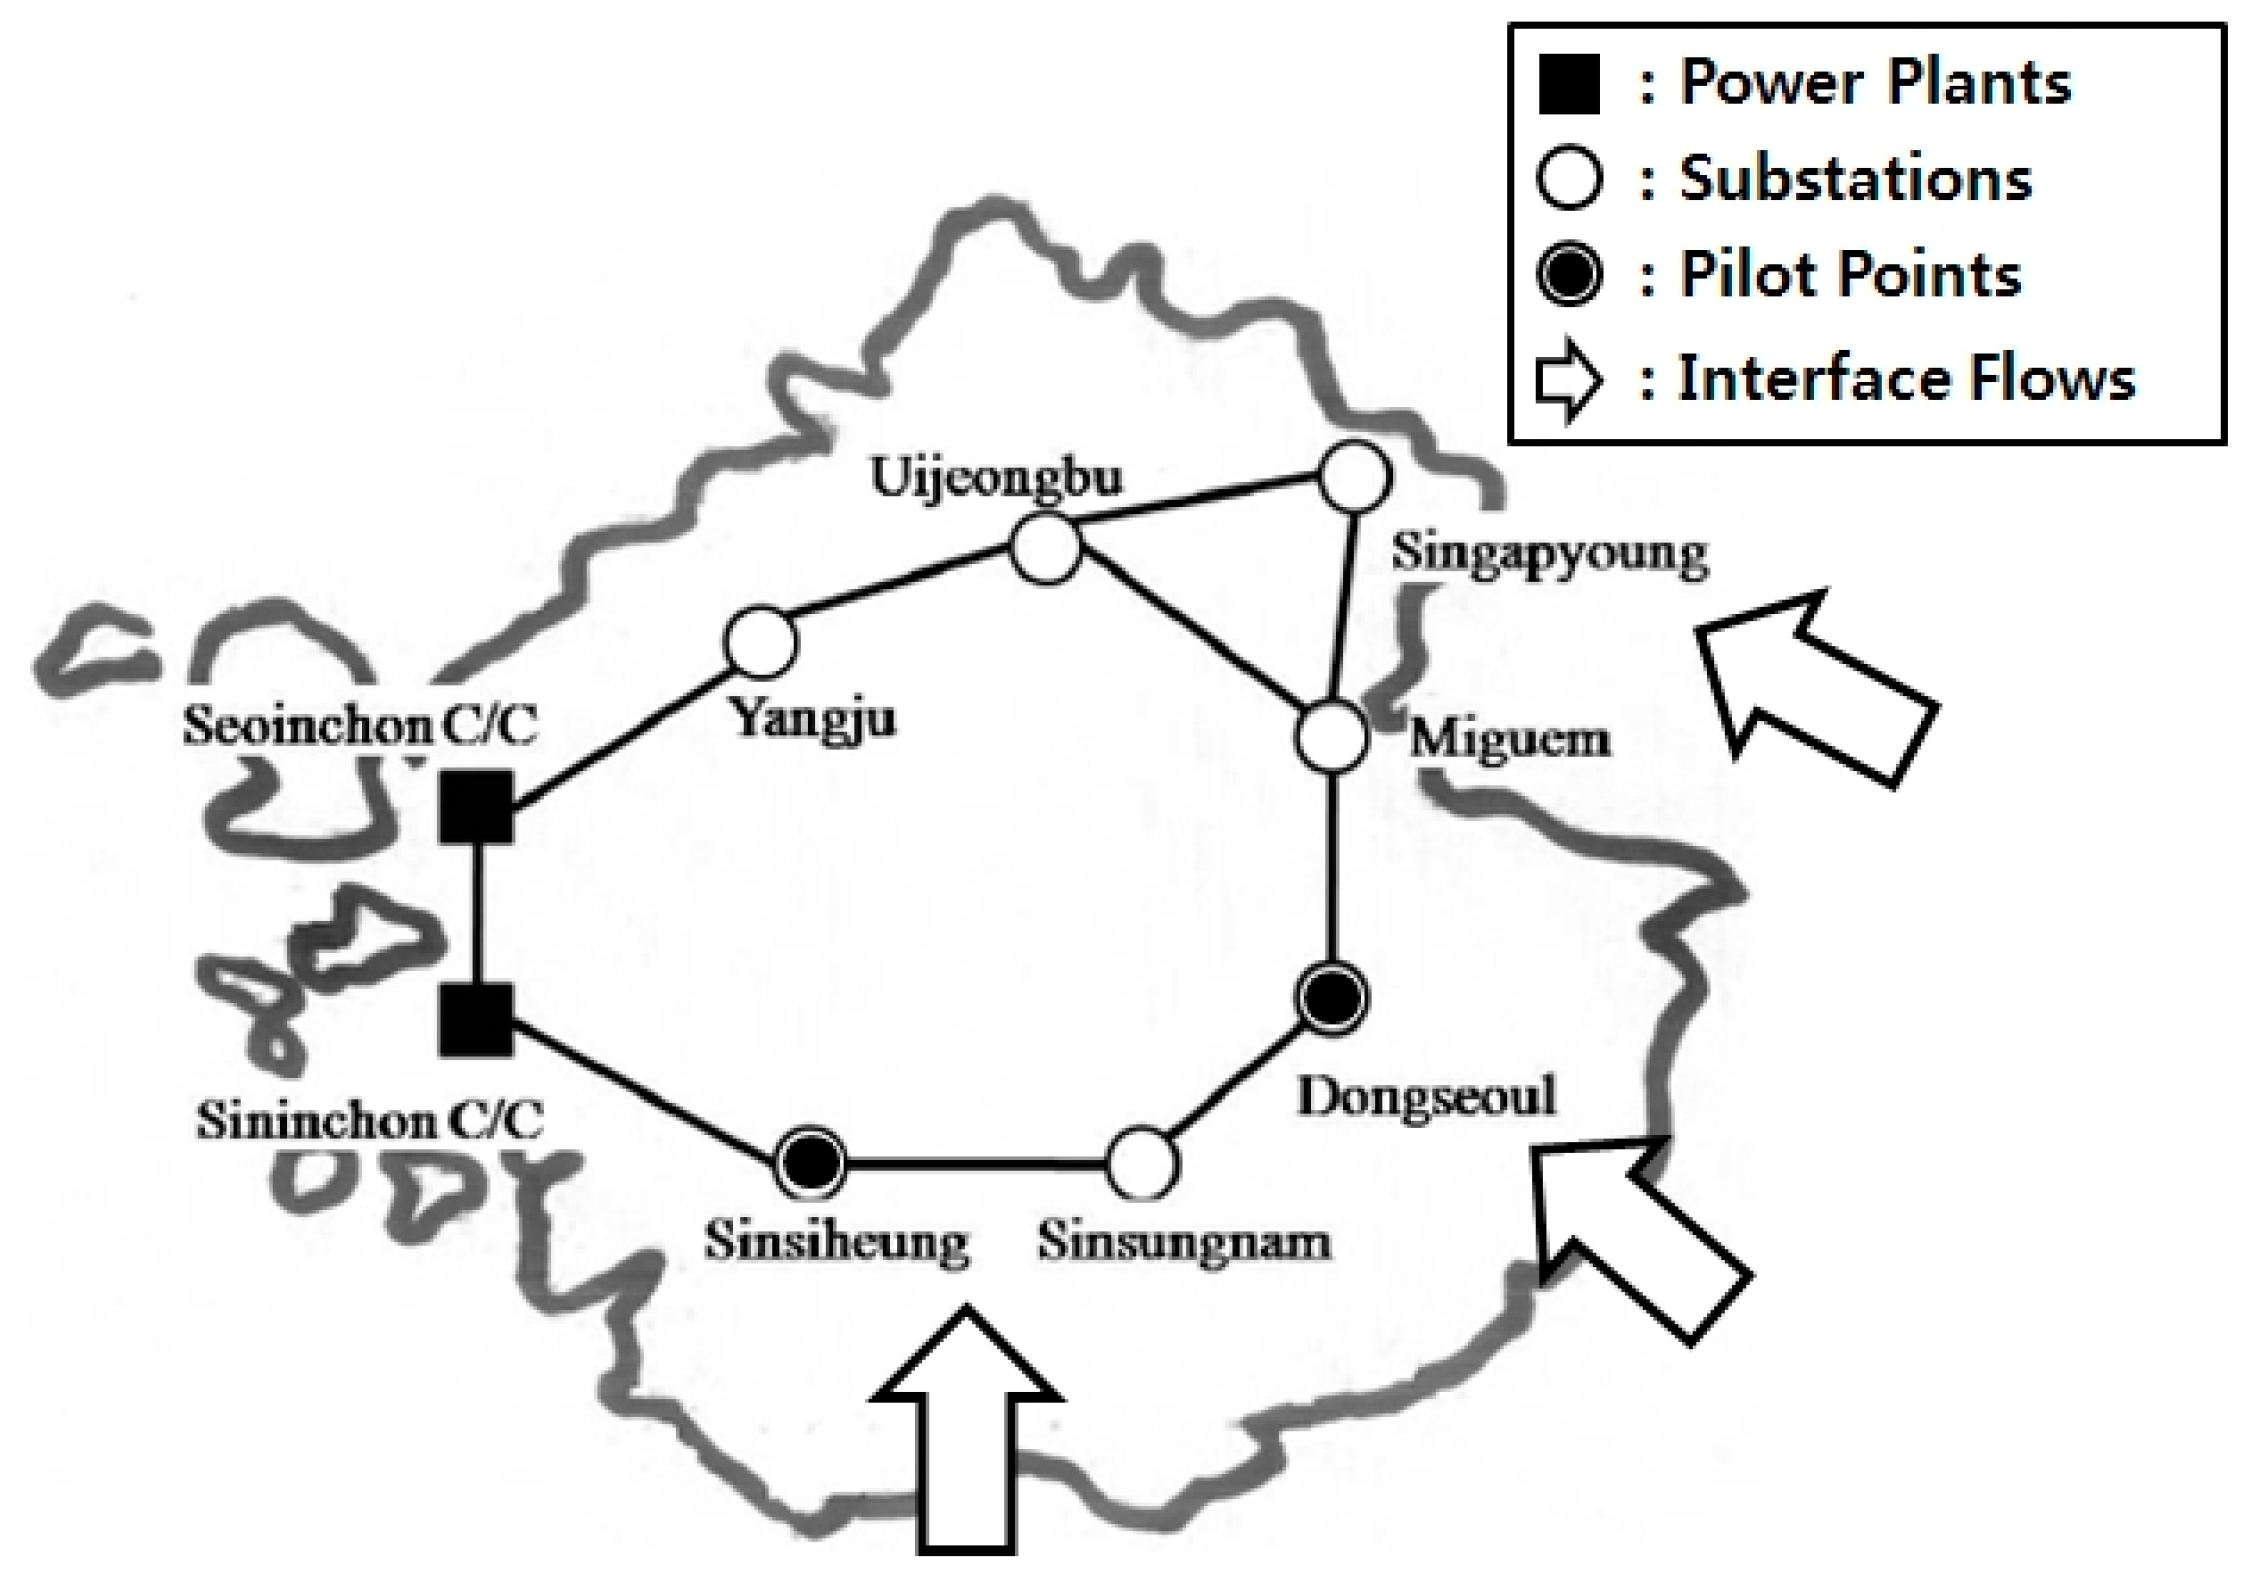
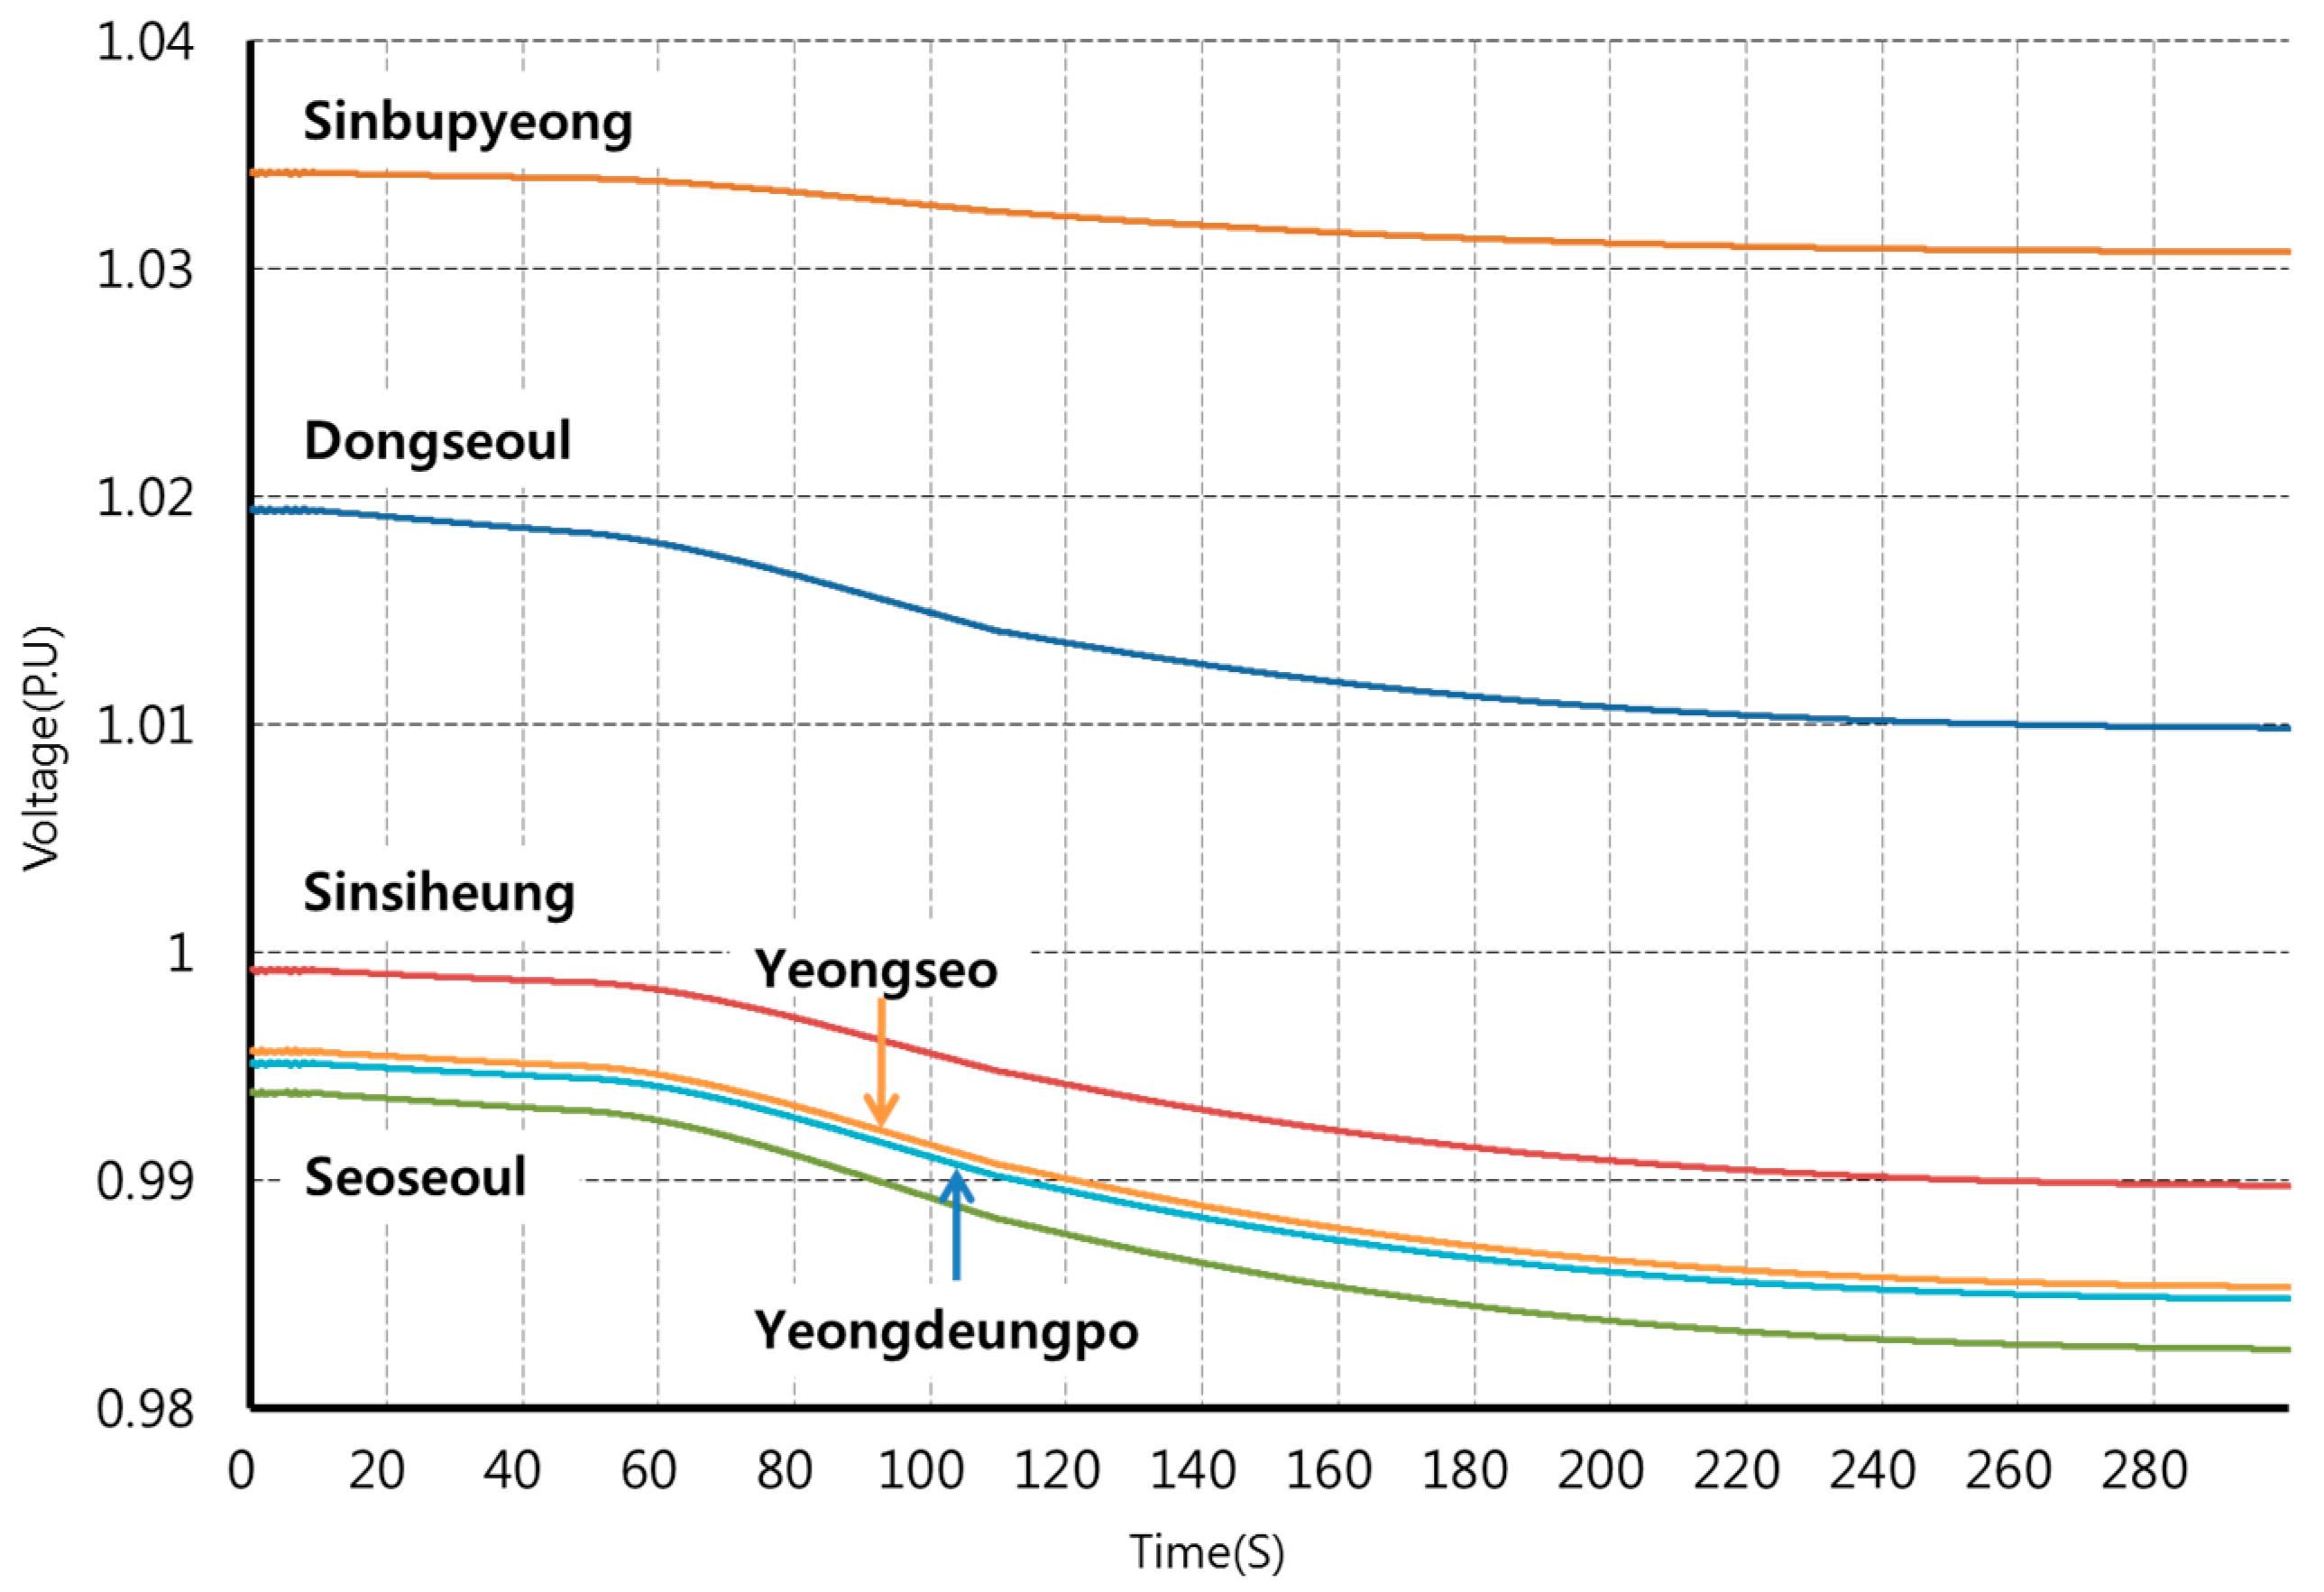
The transmission lines in the metropolitan area form a ring network, as depicted in Figure 10 [17]. The metropolitan area of the Korean power system has two distinct voltage control zones. The buses feeding the corresponding pilot points are called the Dongseoul and Sinsiheung buses. Each pilot point is closely connected to the other load buses. Therefore, this meshed system responds to the voltage controller as if it is only a single bus. For example, if the voltage at the Dongseoul control target is lowered from an initial value of 1.02 (p.u.) to 1.01 (p.u.), the voltages in the other buses will also fall. The Sinsiheung, Sinbupyeong, Yeongseo, Seoseoul, and Yeongdeungpo pilot points are influenced by this condition. This situation is illustrated in Figure 11.
The meshed power system makes voltage control difficult in some situations. For example, circular var flow and clogging voltage instability may arise. Circular var flow mainly occurs in complicated, large power systems. It results in wasted reactive power resources and can lead to higher line currents as well as unnecessary switching of the reactive power controls [10]. Clogging voltage instability occurs when the network configuration of generators and a particular bus blocks the flow of reactive power to some subregion without expending any reactive power reserves. This means that the needed extra reactive power loads cannot be supplied reliably, or the generators in the network will have an insufficient amount of reactive power in reserve [18,19,20].
Although the metropolitan area of the Korean power system has many control generators, the control generators in the Dongseoul zone have less than 50 Mvar of reactive capacity. Table 3 compares the reactive power reserves of the Dongseoul and Sinsiheung zones. The Dongseoul zone has much less reactive power in reserve than the Sinsiheung zone. Due to this, the Dongseoul zone faces potential voltage instability. To detect voltage instability and promptly respond to severe system conditions, an effective generator control scheme is needed.
5. Simulation Results
To test how the MCVC strategy can manage serious system abnormalities, the results of three cases are summarized in this section. Table 4 lists the cases that were tested.
5.1. Case (I) Protection Logic Test
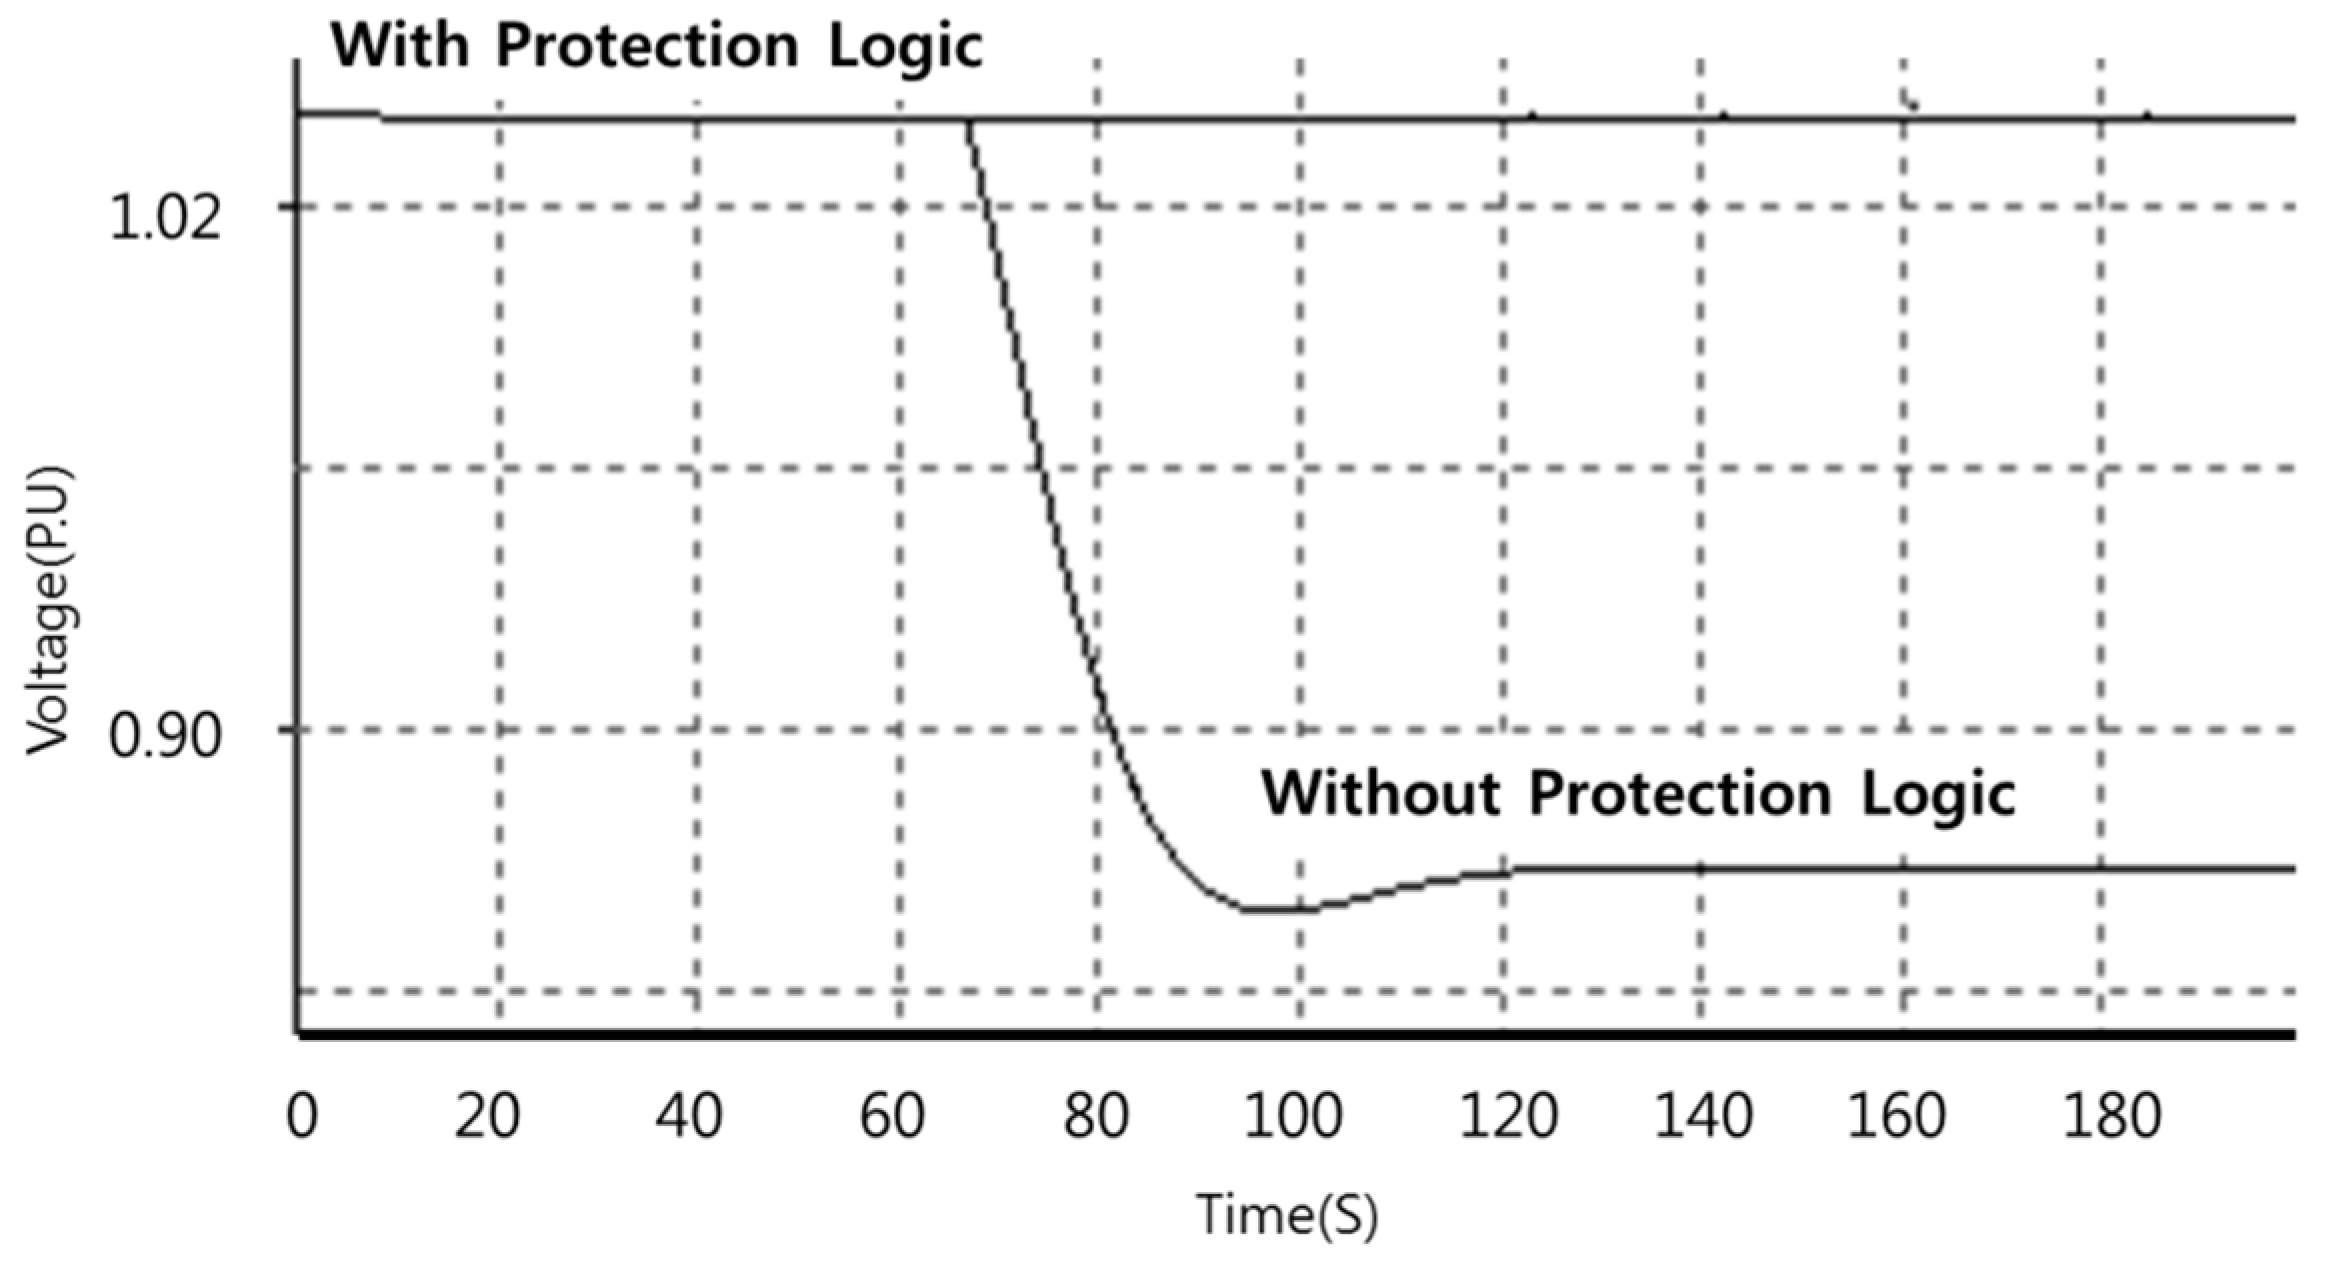
After 60 s, an abnormal signal of very low voltage was inserted to the input data. With the protection logic, the control block made the reactive power level zero, so the voltage of the pilot point was not changed (Figure 12). Without the protection logic, the voltage of the pilot point dropped under 0.90 (p.u.). This means that the protection logic is valuable.
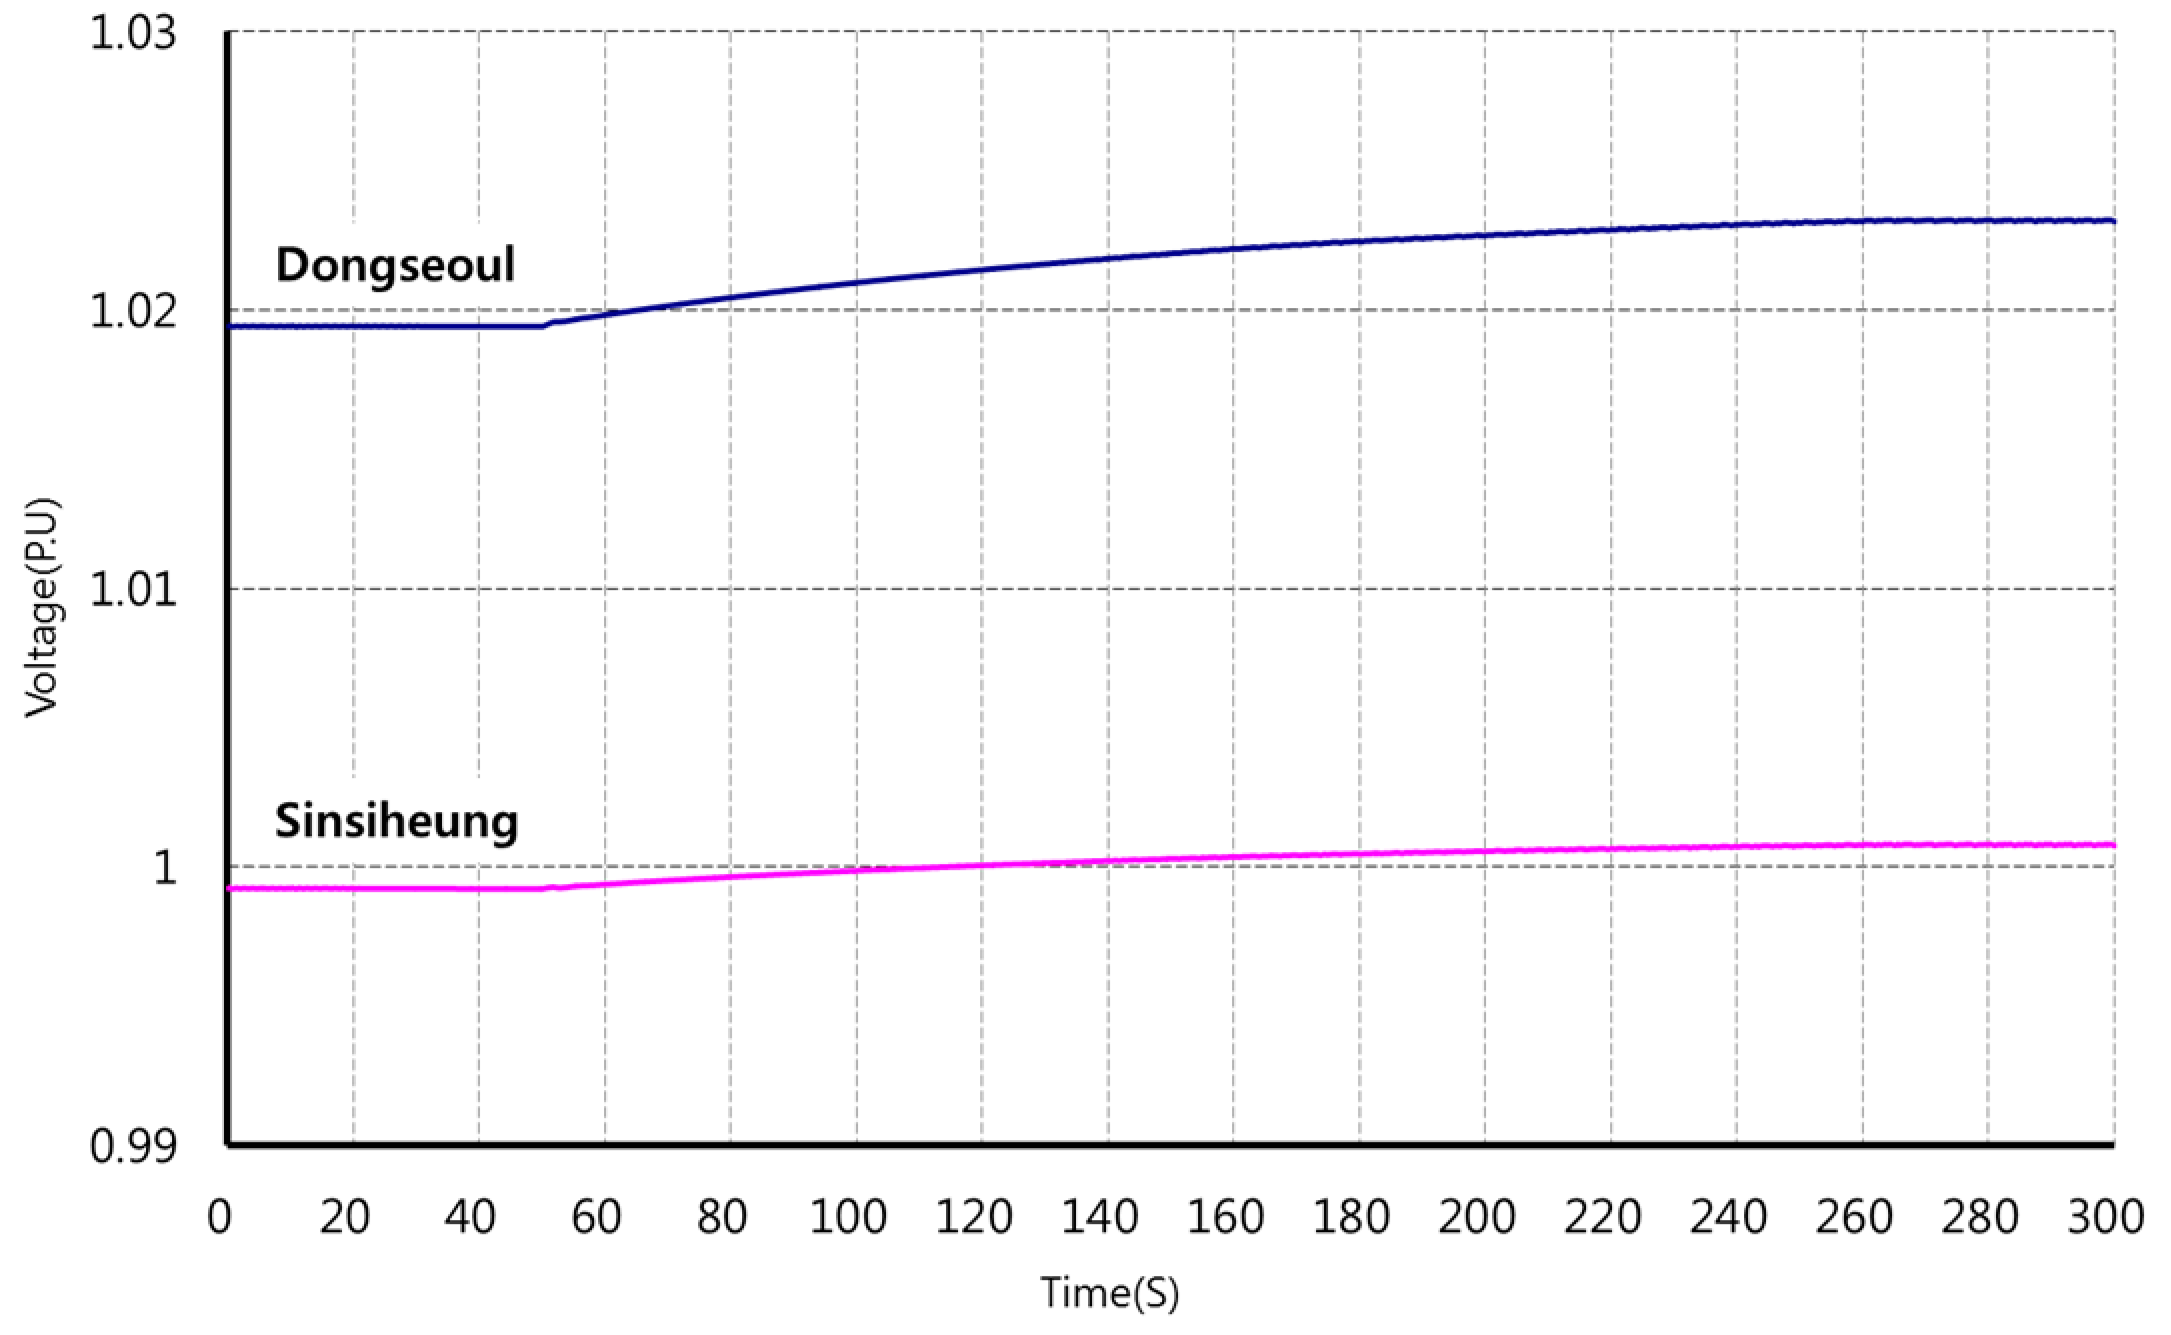
5.2. Case (II) Target Voltage Change of a Pilot Point
As shown in Figure 13, the desired voltage of the pilot point at Dongseoul was successfully increased by RPD operations of the MCVC for about 260 s. The desired voltage change was from 1.02 (p.u.) to 1.025 (p.u.) at 50 s. The voltage of the neighboring Sinsiheung pilot point changed only very slightly, as shown in Figure 13. This result indicates that the MCVC reduces the effect of a voltage change on pilot points in the neighboring area.
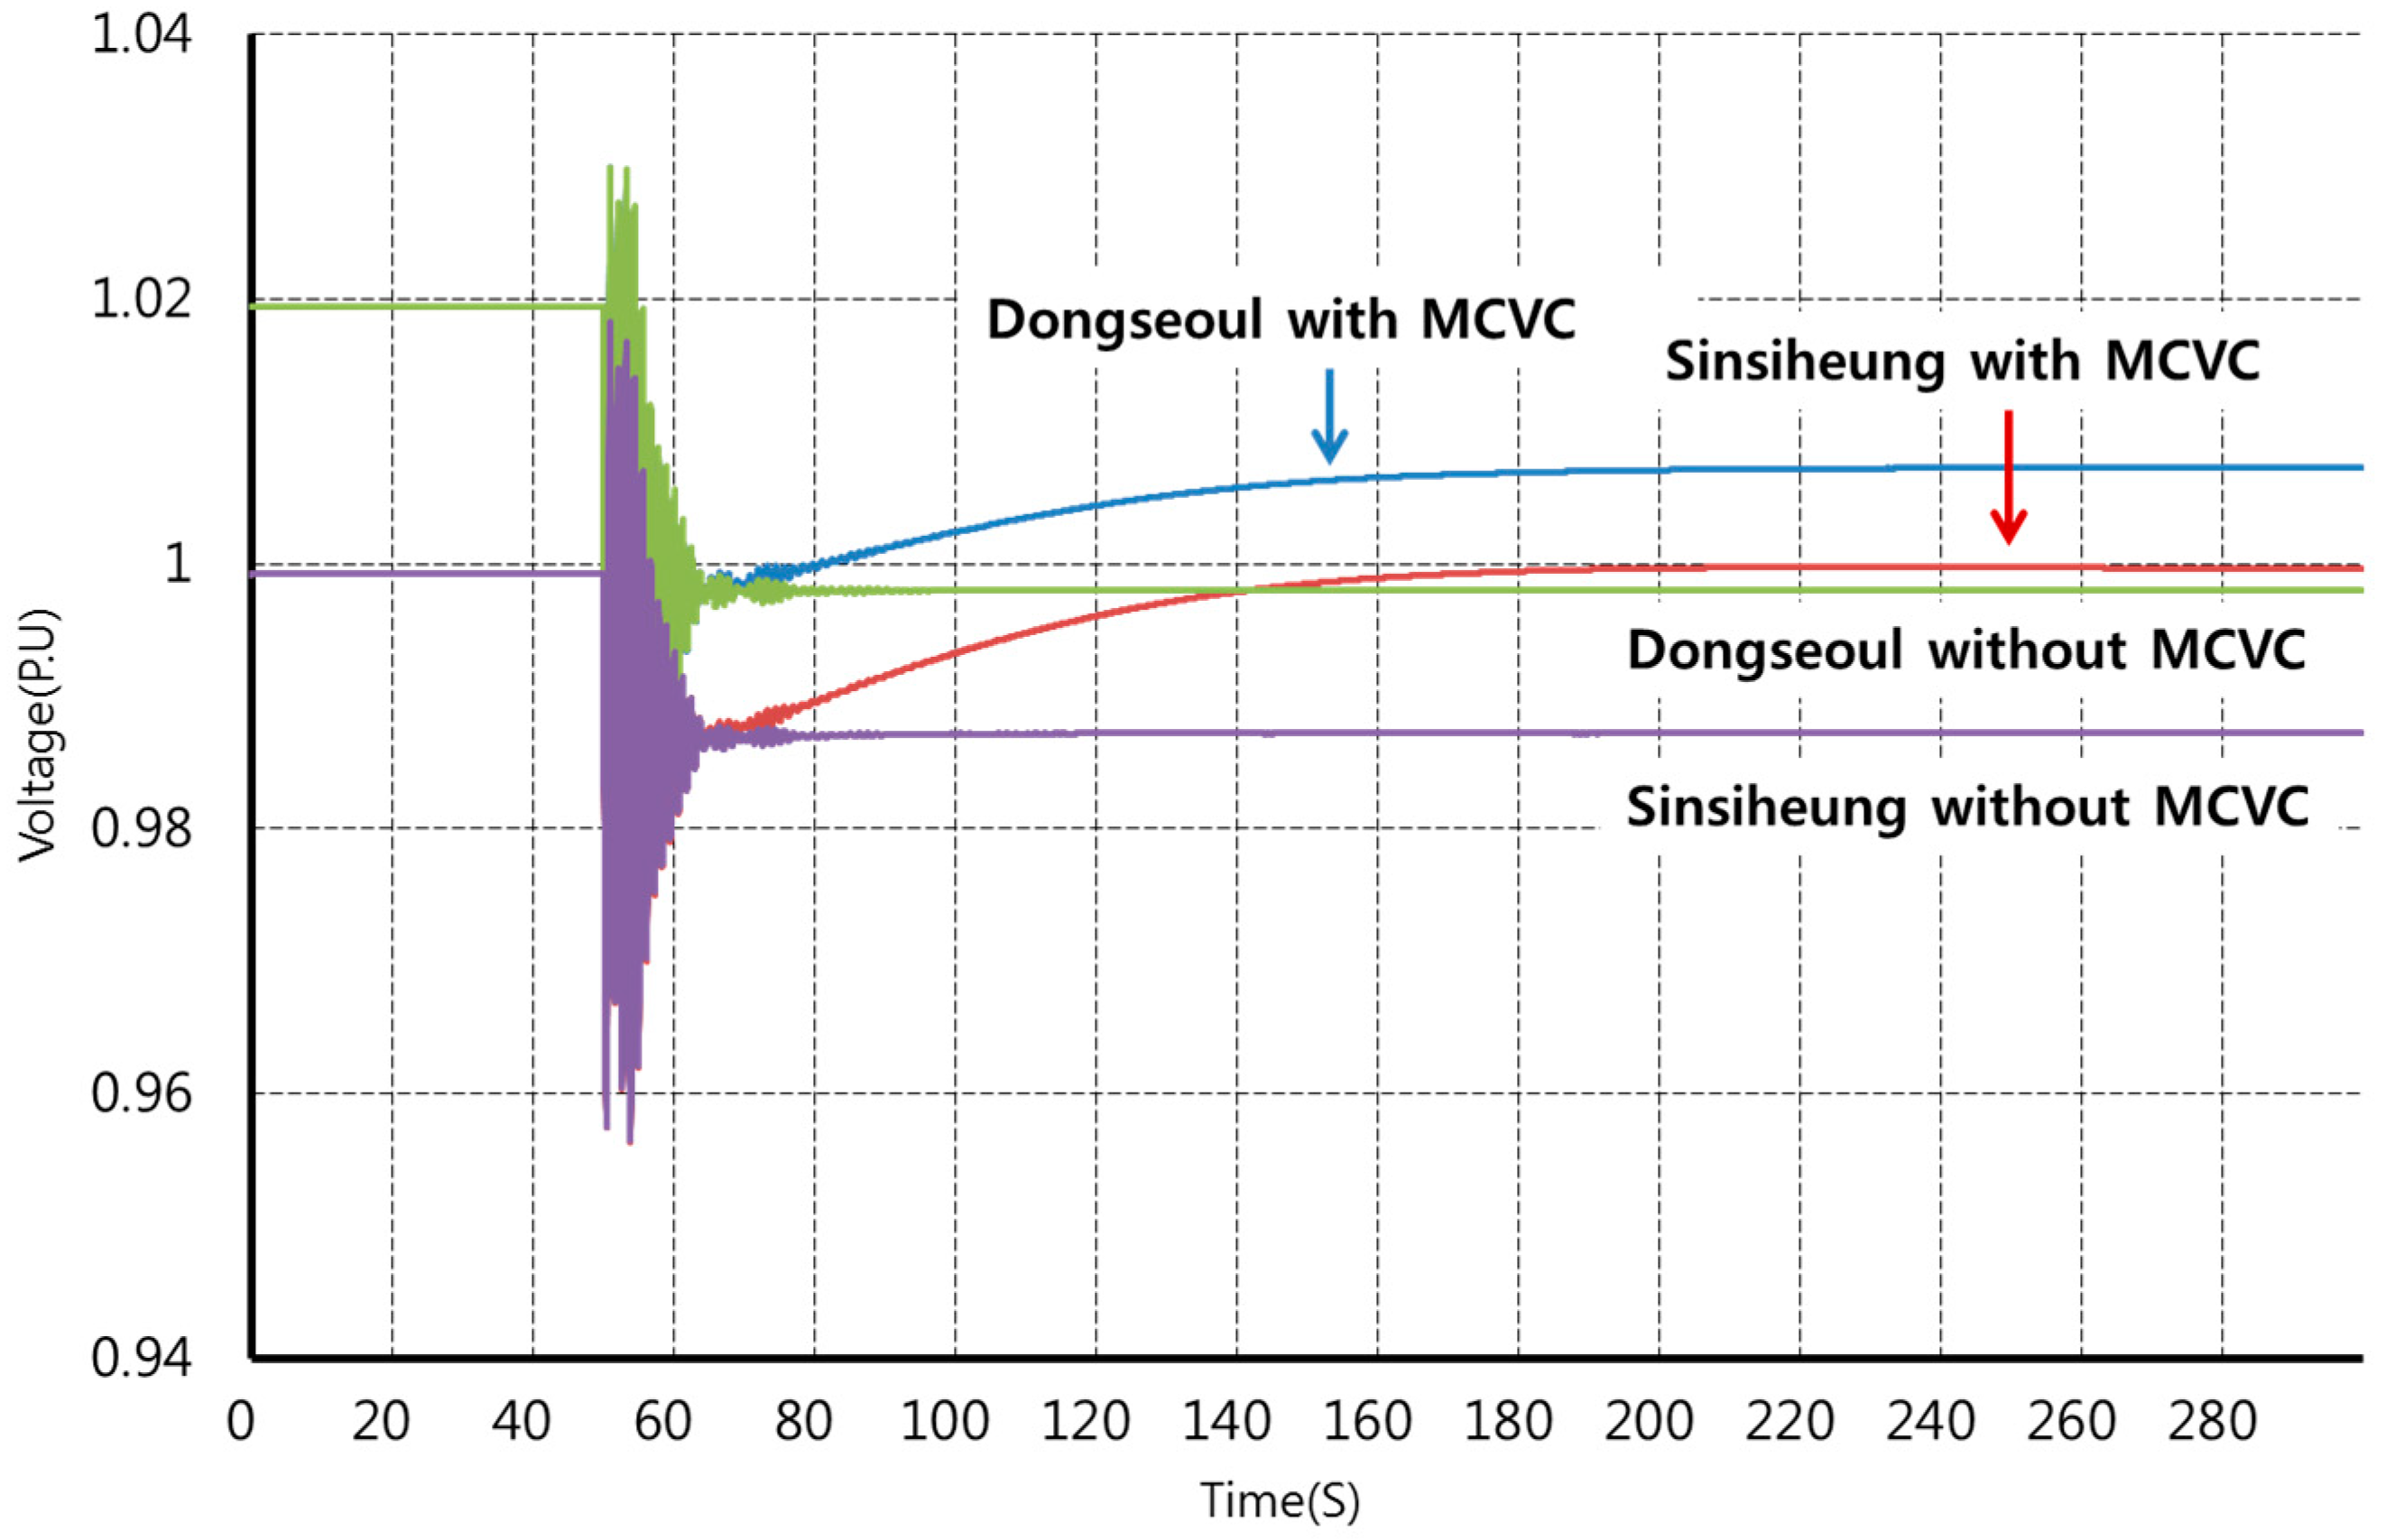
5.3. Case (III) Contingency Scenario of an Interface Root
As already mentioned in Section 2, very important interface lines run from rural areas to Korea’s metropolitan area. Among them, the Hawseong–Asan line suffers the most severe risk of instability because its carries the most interface flow among the six possible line faults. As shown in Table 5, the margin decreased from 2607.5 MW to 776.1 MW. Therefore, it was considered for an additional case study for a three-phase fault at the Hawseong–Asan line.
As the data in Figure 14 shows, a three-phase fault was modeled at 50 s and was cleared after a single cycle. The voltages of the pilot points were returned to the target voltage with the MCVC algorithm applied. The desired voltages of the pilot points are 1.02 (p.u.) at Dongseoul and 1.0 (p.u.) at Sinsiheung. Without the MCVC algorithm, however, the voltages remained lower than their target values after the fault. This means that the proposed control algorithm can effectively handle contingency cases and return the power system to stability within a matter of seconds.
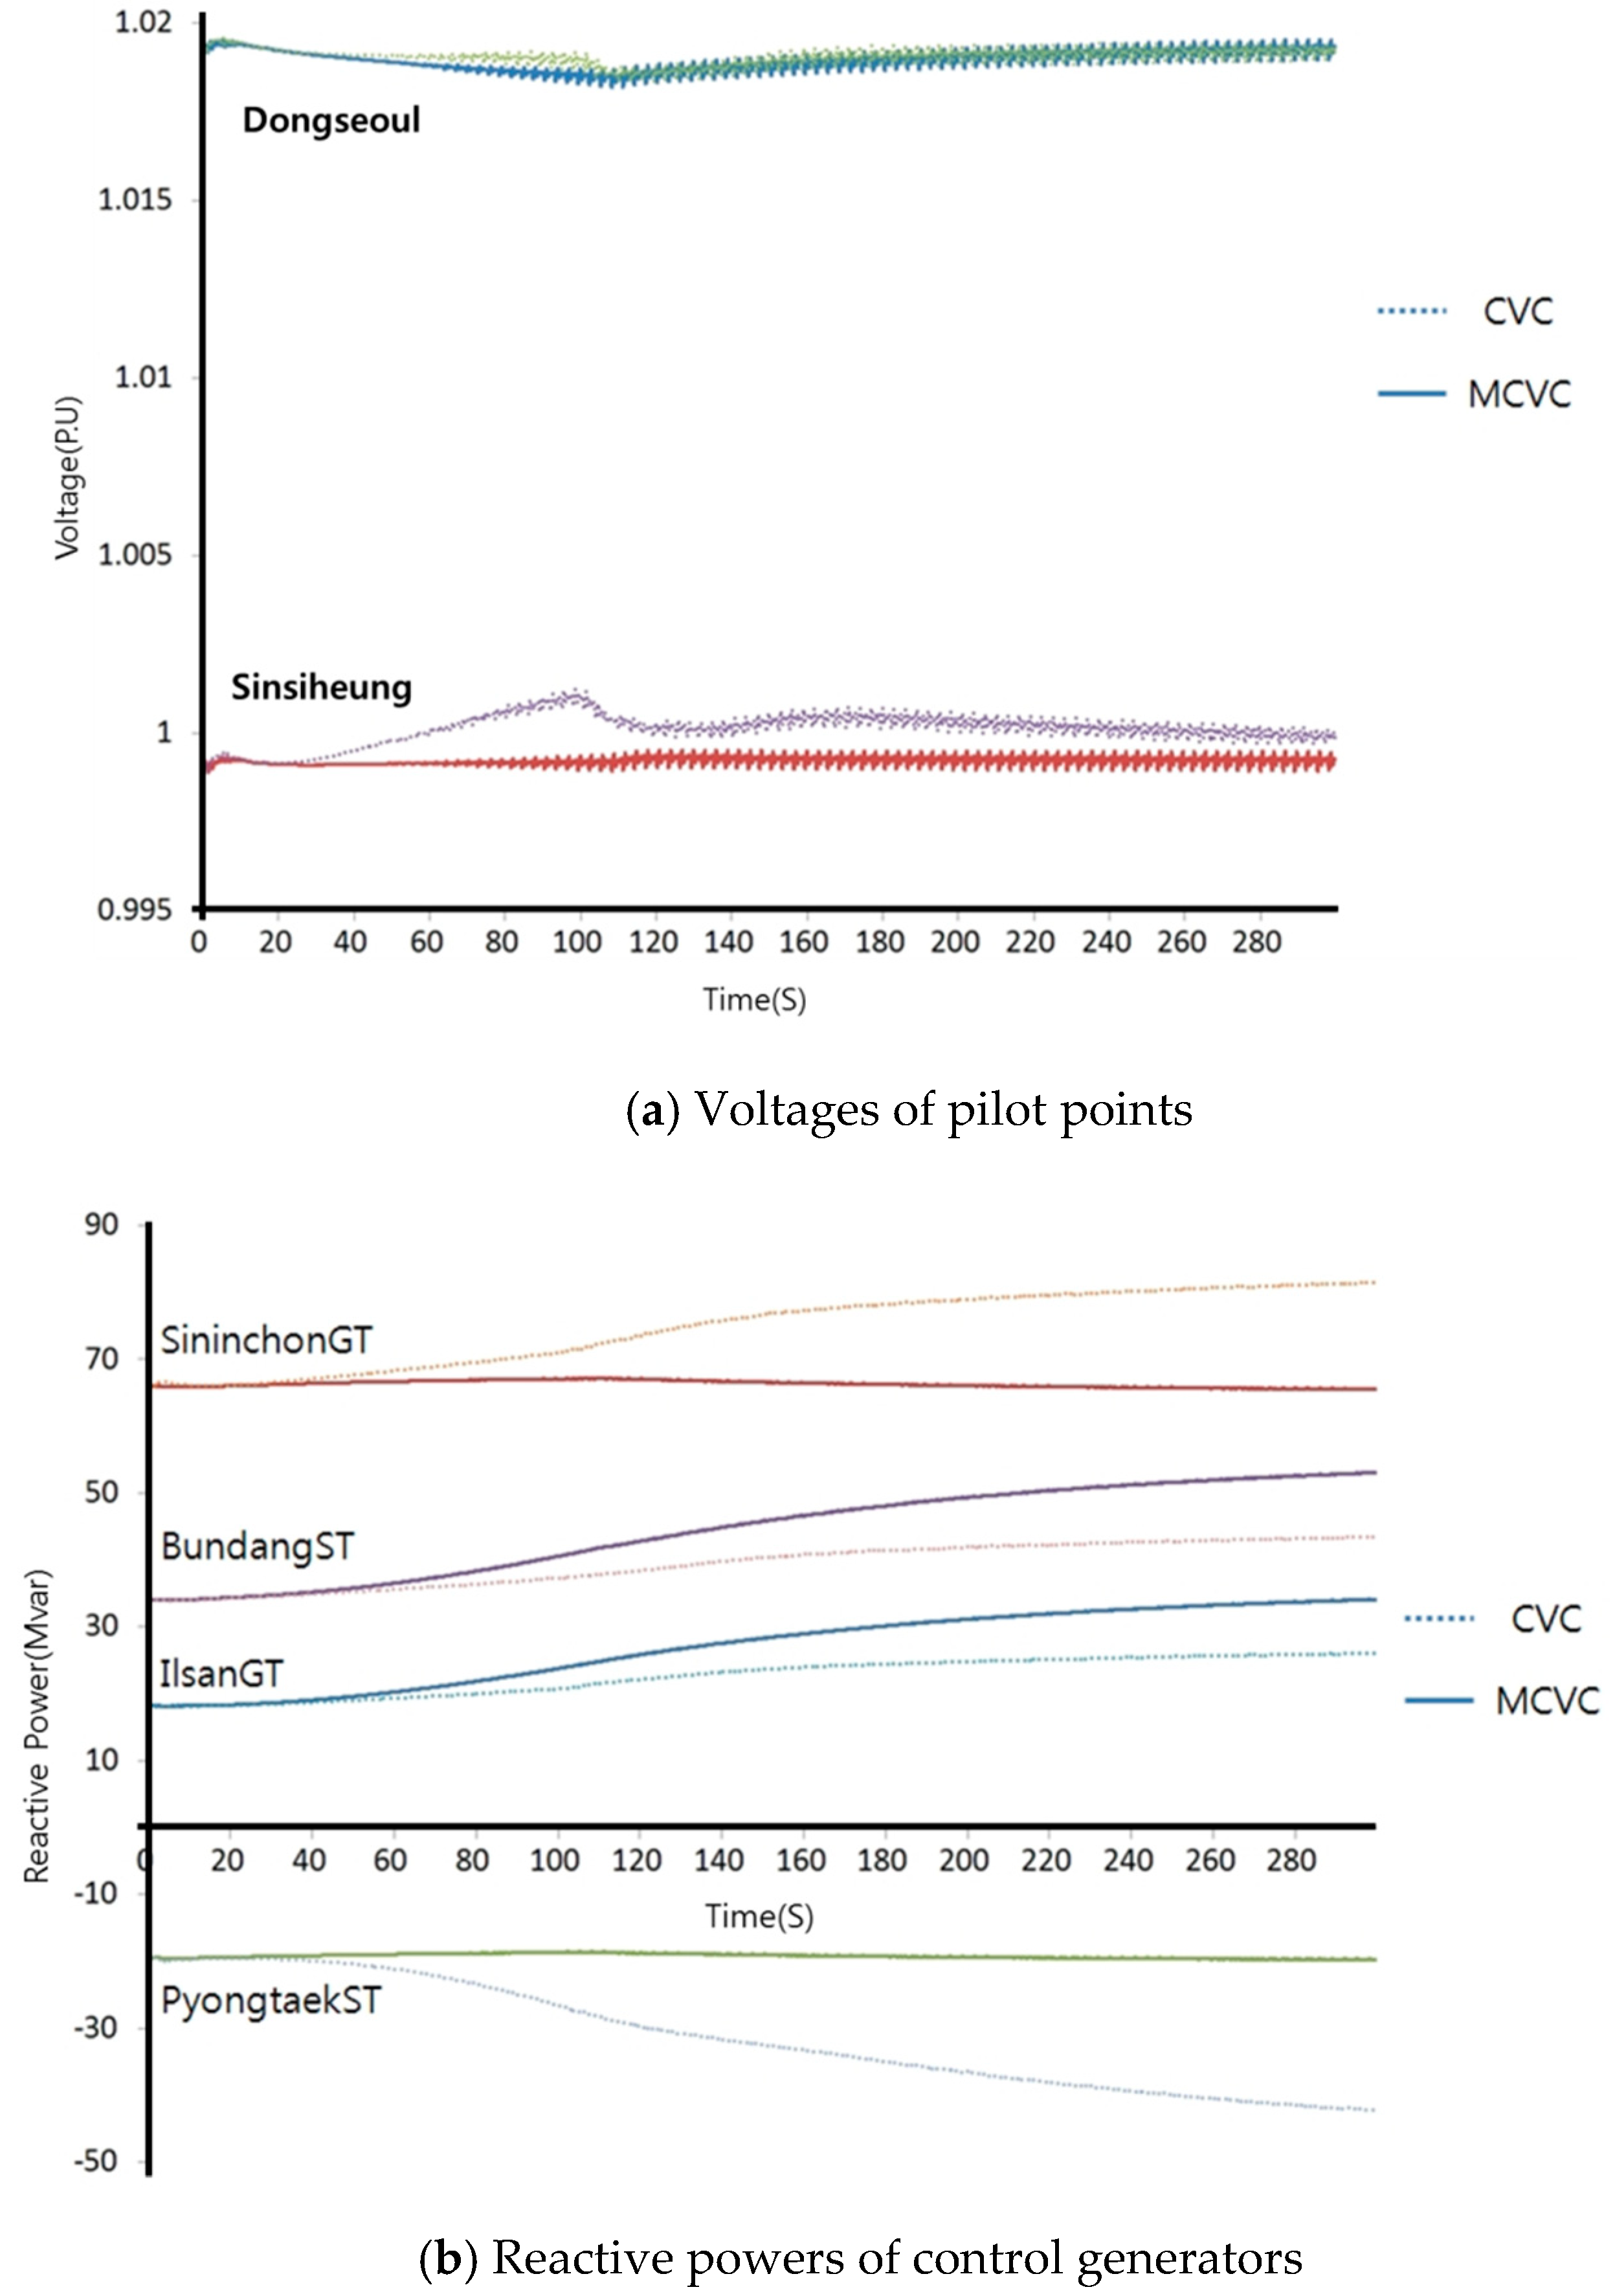
5.4. Case (IV) Load Increase of the Hwasung–Asan Transmission Line
The control results are described in Figure 15. Figure 15a shows that the MCVC regulated the Dongseoul voltage close to the target voltage and regulated the Sinsiheung voltage close to the initial voltage. The voltages of the Dongseoul and Sinsiheung were stabilized by the MCVC control. This means the Sinsiheung was not influenced by the Dongseoul control. The Dongseoul voltage went to the target voltage due to the CVC control. However, the initial voltage of the Sinsiheung oscillated due to the load increase. Therefore, the voltage control of Dongseoul had a negative influence on the Sinsiheung voltage.
The reactive power control of all generators worked nicely owing to the MCVC control, as shown in Figure 15b. On the other hand, the CVC made unnecessary generations to all generators. Although the CVC of the Sinsiheung zone kept the initial voltage of the Sinsiheung, control generator outputs of the Sinsiheung zone moved in the opposite direction. The Sinsiheung voltage oscillated due to this situation.
6. Conclusions
This paper proposes a multiple-point control algorithm for preventing mutual interference in a power transmission network. The main objective of the control system is to regulate the voltage profiles of the power system in case of emergency system conditions. With the voltage control schemes deployed at present, the control of a pilot point can lead to interference in neighboring zones. In the proposed algorithm, voltage variations in each control zone are represented by the variations at representative pilot points. The MCVC algorithm can regulate the voltages at a group of pilot points to remain around set-point values while dealing with the evolution of those voltages separately. This strategy allows operators to make local modifications to generator output, and these local changes can be applied easily by adjusting the set-point voltage of the pilot point. By selectively regulating the set-point voltage, the proposed control scheme can prevent oscillations of the voltage of neighboring pilot points. The controller accounts for the reference voltages of multiple pilot points. First, the target voltage is regulated to maintain voltage stability in its own zone; then, the neighboring target voltages are adjusted to ensure a smooth voltage profile in neighboring zones.
Simulation tests with realistic data sampled from the Korean power system demonstrate the feasibility of this control scheme for reducing the severity of mutual interactions between adjacent zones. These dynamic simulations were also used to study how the MCVC could return the system to stability from more severe conditions. In future work, coordination between continuous and discrete devices will be included in the control scheme to allow the effective voltage control of a large-scale power system.
Author Contributions
Y.-H.C. put forward to the main idea, guided the experiments and wrote the whole of this paper. Y.-S.C. designed the whole structure of this paper and completed data preprocessing. All authors have read and approved the final manuscript.
Funding
This work was supported by the National Research Foundation of Korea (NRF) grant funded by the Korea government (MSIT) (No. NRF-2017R1C1B5018163). This work was also supported by “Human Resources Program in Energy Technology” of the Korea Institute of Energy Technology Evaluation and Planning (KETEP), granted financial resource from the Ministry of Trade, Industry & Energy, Republic of Korea. (No. 20174010201330).
Conflicts of Interest
The authors declare no conflict of interest.
References
- Taylor, C.W. Power System Voltage Stability; McGraw-Hill Inc.: New York, NY, USA, 1994. [Google Scholar]
- Cutsem, T.V.; Vournas, C. Voltage Stability of Electric Power Systems; Kluwer Academic Publishers: Dordrecht, The Netherlands, 1998. [Google Scholar]
- Kundur, P. Power System Stability and Control; McGraw-Hill: New York, NY, USA, 1994. [Google Scholar]
- Ilic, M.; Liu, S. Hierarchical Power System Control; Springer: Berlin, Germany, 1996. [Google Scholar]
- Seo, S.; Choi, Y.H.; Kang, S.; Lee, B.; Shin, J.H.; Kim, T.K. Hybrid control system for managing voltage and reactive power in the JEJU power system. J. Electr. Eng. Technol. 2009, 4, 429–437. [Google Scholar] [CrossRef]
- Corsi, S. Feasibility Study of the Automatic Voltage Control of the KEPCO Transmission Grid; Intermediate Report; CESI: Milan, Italy, 2010. [Google Scholar]
- Ali, E.; Li, J.; Xie, J.; Joshua, D.I. Closed-loop identification for plants under model predictive control. Control Eng. Pract. 2018, 72, 206–218. [Google Scholar]
- Robert, L.C.; John, F.O. Large feedback control design with limited plant information. Control Eng. Pract. 2018, 72, 219–229. [Google Scholar]
- Kim, T.K.; Choi, Y.H.; Seo, S.S.; Lee, B.J. A study on voltage and reactive power control methodology using integer programming and local subsystem. Trans. Korean Inst. Electr. Eng. (KIEE) 2018, 57, 543–550. [Google Scholar]
- Choi, Y.H.; Lee, B.; Kim, T.K. Optimal shunt compensation for improving voltage stability and transfer capability in metropolitan area of the Korean power system. J. Electr. Eng. Technol. 2015, 10, 1502–1507. [Google Scholar] [CrossRef]
- Kvasov, D.E.; Menniti, D.; Pinnarelli, A.; Sergeyev, Y.D.; Sorrentino, N. Tuning fuzzy power-system stabilizers in multi-machine systems by global optimization algorithms based on efficient domain partitions. Electr. Power Syst. Res. 2008, 78, 1217–1229. [Google Scholar] [CrossRef]
- Sheng, G.; Jiang, X.; Duan, D.; Tu, G. Framework and implementation of secondary voltage regulation strategy based on multi-agent technology. Int. J. Electr. Power Energy Syst. 2009, 31, 67–77. [Google Scholar] [CrossRef]
- Choi, Y.H.; Lee, B.; Kang, S.; Kwon, S.H. Coordinated voltage-reactive power control schemes based on PMU measurement at automated substations. J. Electr. Eng. Technol. 2001, 10, 1400–1407. [Google Scholar] [CrossRef]
- Powell, L. Power System Load Flow Analysis; McGraw Hill: New York, NY, USA, 2004; pp. 101–105. [Google Scholar]
- Lee, B.; Song, H.; Kwon, S.H.; Jang, G.; Kim, J.H.; Ajjarapu, V. A study on determination of interface flow limits in the KEPCO system using modified continuation power flow (MCPF). IEEE Trans. Power Syst. 2002, 17, 557–564. [Google Scholar]
- Available online: http://www.kpx.or.kr/english/ (accessed on 12 August 2018).
- Kang, S.G.; Seo, S.; Lee, B.; Chang, B.; Myung, R. Centralized control algorithm for power system performance using FACTS devices in the korean power system. J. Electr. Eng. Technol. 2010, 5, 353–362. [Google Scholar] [CrossRef]
- Capitanescu, F. Assessing reactive power reserves with respect to operating constraints and voltage stability. IEEE Trans. Power Syst. 2011, 26, 2224–2234. [Google Scholar] [CrossRef]
- Choi, Y.H.; Seo, S.; Kang, S.; Lee, B. Justification of Effective Reactive Power Reserves with respect to a Particular Bus using Linear Sensitivity. IEEE Trans. Power Syst. 2011, 26, 2118–2124. [Google Scholar] [CrossRef]
- Choi, Y.H.; Lee, B.; Kim, T.K.; Shin, J.H.; Cho, J.M.; Jung, E.; Kang, B.I. Identification of Voltage Control Areas and Reactive Power Reserves in Power Flow Traceable System for Voltage Stability Assessment. In Proceedings of the System Operation and Control of Electric Power Systems CIGRE Regional Meeting, Recife, Brazil, 3–6 April 2011. [Google Scholar]
Figure 1.
Secondary voltage regulation concept.

Figure 2.
Multiple-point control algorithm concept.

Figure 3.
Architecture of the control algorithm.

Figure 4.
Protection logic rule in the dead-band step.

Figure 5.
Concept underlying the second process in the dead-band step.

Figure 6.
Decision-making principles.

Figure 7.
Control block for the multiple continuous voltage control (MCVC) and the reactive power dispatcher (RPD).
Figure 7.
Control block for the multiple continuous voltage control (MCVC) and the reactive power dispatcher (RPD).

Figure 8.
Control scheme of the MCVC.

Figure 9.
Map of the Korean power system.

Figure 10.
Map of the metropolitan area in the Korean power system.

Figure 11.
Voltages of pilot points in the metropolitan area.

Figure 12.
Result of protection logic at pilot point.

Figure 13.
Result of change of target voltage at a pilot point.

Figure 14.
Result of three-phase fault at an interface line.

Figure 15.
Result of load increase at the interface line.


Table 1.
Control parameters of the control generators in Korean power system.
| Name | QG_MAX [MVAR] | QG_MIN [MVAR] | Xt | Xeq | TCS [s] | TRS [s] | KPC | KIC |
|---|---|---|---|---|---|---|---|---|
| Yonggwang NP | 387.0 | −160.0 | 0.1248 | 0.0010 | 50 | 5 | 26.7094 | 67.2009 |
| Tangjin TP | 270.0 | −164.0 | 0.2636 | 0.0010 | 50 | 5 | 22.2875 | 117.9546 |
| Seoinchon CC | 108.0 | −70.0 | 0.0980 | 2.0175 | 50 | 5 | 25.1953 | 0.5284 |
| Youngheong TP | 384.0 | −262.0 | 0.0980 | 2.0175 | 50 | 5 | 25.1953 | 0.5284 |
| Pyongtaek TP | 150.0 | −89.0 | 0.4870 | 2.0175 | 50 | 5 | 55.4970 | 1.3779 |
Table 2.
Summary of the Korean power system.
| Area | Active Power [MW] | Reactive Power [MVAR] | Number of Installed Generators | ||
|---|---|---|---|---|---|
| Generations | Loads | Generations | Loads | ||
| Metropolitan | 13,779 | 22,034 | 3701 | 10,474 | 113 |
| Nonmetropolitan | 45,089 | 31,435 | 10,112 | 14,222 | 150 |
Table 3.
Comparison of generator reactive power reserves between pilot points in the metropolitan area of the Korean power system.
Table 3.
Comparison of generator reactive power reserves between pilot points in the metropolitan area of the Korean power system.
| Zone | Reactive Power Reserve [Mvar] |
|---|---|
| Dongseoul | 1022 |
| Sinsiheung | 5778 |
Table 4.
Case summary for simulation.
| Case | Description | Purpose of This Case |
|---|---|---|
| I | With and without protection logic | Show the usefulness of the protection logic |
| II | Increase the desired voltage of a pilot point | Test the effectiveness of following a desired voltage at the pilot point |
| III | Three-phase fault at the interface line | Check the effectiveness of the algorithm |
| IV | Load increase at the interface line | Comparison between the existing method and the proposed method |
Table 5.
Interface flow margin of interface line.
| Interface Line | No. of Lines | Interface Flow Margins [MW] |
|---|---|---|
| Base | - | 2607.5 |
| Singapyeong–Sintaebaek | # 2 | 1761.8 |
| Sinansung–Sinseosan | # 2 | 1991.6 |
| Hwasung–Asan | # 2 | 776.1 |
| Seoseoul–Sinonyang | # 2 | 1492.6 |
| Sinyongin–Sinjincheon | # 2 | 2444.6 |
| Konjiam–Sinjechon | # 2 | 1406.8 |
© 2019 by the authors. Licensee MDPI, Basel, Switzerland. This article is an open access article distributed under the terms and conditions of the Creative Commons Attribution (CC BY) license (http://creativecommons.org/licenses/by/4.0/).
Share and Cite
MDPI and ACS Style
Choi, Y.-H.; Cho, Y.-S. Multiple-Point Voltage Control to Minimize Interaction Effects in Power Systems. Energies 2019, 12, 274. https://doi.org/10.3390/en12020274
AMA Style
Choi Y-H, Cho Y-S. Multiple-Point Voltage Control to Minimize Interaction Effects in Power Systems. Energies. 2019; 12(2):274. https://doi.org/10.3390/en12020274
Chicago/Turabian StyleChoi, Yun-Hyuk, and Yoon-Sung Cho. 2019. "Multiple-Point Voltage Control to Minimize Interaction Effects in Power Systems" Energies 12, no. 2: 274. https://doi.org/10.3390/en12020274
Note that from the first issue of 2016, this journal uses article numbers instead of page numbers. See further details here.