Creating an Energy Analysis Concept for Oil and Gas Companies: The Case of the Yakutiya Company in Russia


1
School of Business Administration, China University of Petroleum (Beijing), Beijing 102249, China
2
Stroygazconsulting (SGC) Company, Tashakentskaya Street, St. Petersburg 196084, Russia
3
The Laboratory of Examinations of licenses and license agreements, All-Russia Petroleum Research Exploration Institute (VNIGRI), Saint-Petersburg 191014, Russia
*
Author to whom correspondence should be addressed.
Energies 2019, 12(2), 268; https://doi.org/10.3390/en12020268
Submission received: 15 October 2018
/
Revised: 10 November 2018
/
Accepted: 14 November 2018
/
Published: 16 January 2019
(This article belongs to the Section C: Energy Economics and Policy)
Abstract
:Recently, energy analysis has been added to Russian gas companies’ annual reporting system. This new practice indicates that corporate reports are improving their analyses by addressing energy issue and the financial efficiency of energy production. However, the use of summary energy indicators is limited in these annual reports. In this paper we review the history of energy analysis in Russia from the early USSR period to today. Under the guidance of energy return on investment (EROI), we compare energy efficiency indicators with financial efficiency coefficients. The results show that the value of the return on cost of sales (ROCS) is negative in certain instances, while the value of the energy return on cost of sales (EROCS) is extremely high under the example of the Russian energy company JSC “YATEC.” Money-based indicator values (ROCS and return on fix assets (ROFA)) fluctuate with internal company financial management goals, and from the outside depending on market prices. Meanwhile energy-based values (EROCS) remain stable. Added financial analysis and energy analysis in companies’ annual statements will supplement each other in practice and will present the full picture for company efficiency analysis.
1. Introduction
For oil and gas companies, an important issue is the definition and calculation of efficiency for exploitation, production, transportation, and processing of hydrocarbons. This has been encouraged by the Russian Federal law “concerning energy saving and increasing energy efficiency.” The law requires that Russian oil and gas companies must input measures to improve energy efficiency. The economic analysis used previously is mostly to identify and evaluate the capacity of the company for the production of hydrocarbons. However, what seems to be missed is that energy analysis is an important element of determining the economic efficiency of oil and gas companies.
It should be noted that methods of calculating energy efficiency indicators had not yet been developed or used in Russia. Once the new law was passed, oil and gas companies developed and calculated their own energy efficiency indicators using different names of coefficients and different meanings for each of them. However, energy efficiency indicators should be standardized to facilitate comparisons and time trends. Consequently, the main point of energy analysis in Russia nowadays is to develop more consistent indices. We try to prove that energy analysis is not a substitute, but it is as a supplement for economic analysis in decision making [1].
1.1. Energy Analysis in the USSR and Modern Russia
In Russia the founder of energy analysis is usually considered to be Sergei A. Podolynsky, a Ukrainian precursor of today’s ecological economists, who lived and worked in the pre-revolutionary period. In 1881, he proposed an energy balance of the agricultural production together with a monetary cost analysis [2,3]. During the USSR period, the idea of energy analysis is reflected in the researches of Nikolai M. Fedorovsky, the organizer and the first Director of the all-Union scientific-research Institute of mineral raw materials (1923–1937), who developed a classification of minerals on the energy characteristic and industrial application. Then, after a long period since the end of the 1960s the theme of energy analysis again was considered an important element in the management of industrial production. Special attention was paid to energy-intensive industries, such as metallurgy, and of course towards the production of hydrocarbons. In the 1980s, the practical application of individual elements of the energy analysis was undertaken for the oil and gas industry of the USSR, especially by Vasily I. Luzin and Nataliya I. Aref’eva. The increased interest in the issue of energy efficiency was a special feature of the planned economy. In the 1970s to 1980s, the oil industry in Russia began to use widely enhanced oil recovery methods, which required very high energy costs. The main question was to assess the effectiveness of these activities. During this time, the quantity of energy produced was compared to the oil equivalent energy used for production. The result was a substantial net production. From 1978 to 1982, the production of additional oil via enhanced oil recovery consumed nearly the energy equivalent of the amount produced; however, the analysis showed that enhanced oil recovery yielded positive economic results. Vasily I. Luzin observed that “the comparison of different types and qualities of energy costs in the production and transformation in practice mainly using the financial indicators is deficient, and in some cases it reversely reflects the equivalence of energy costs” [4]. The difference in energy required between the traditional and the enhanced procedures is the additional energy volume used. For the purpose of calculating the efficiency of the industrial sector, Vasily I. Luzin has suggested the following formula:
where Kee is the coefficient of energy efficiency, TP is the commodity production of energy resources, GP is the gross production of energy resources, and AEC is the amount of energy consumed.
The energy efficiency coefficient Kee presents the relation of useful energy delivered to society to the total energy used to get it. The closer the value of the coefficient is to 1, the more energy efficient the enhanced oil recovery. Thus, by using energy indicators for the analysis of efficiency, it was supposed to level the shortcomings of the cost analysis.
In the USSR, the concept of cost accounting and production in energy units was studied, and the energy input-output balance was compiled to supplement solutions to applied problems in oil and gas production. Research in this direction was conducted by the Melentyev Institute of Energy System (ISEM) in Los Angeles, the Siberian Branch of the Russian Academy of Sciences (ISEM SB RAS), and the Energy Research Institute of the Russian Academy of Sciences (ERI RAS). In the ISEM SB RAS, Medvedev in particular was engaged in the development of the method of total energy costs of inter-branch interdisciplinary balance. This method allows additional energy used throughout the chain of production to be calculated. Further development of this method was achieved at the ERI RAS, where Chupyatov Platonovich and Magalimov I. Vilyevich developed an approach based on modeling inter-industry balances. These researchers estimated the energy demand of major energy sources and energy-intensive materials and services [5]. They looked at the “upstream” energy costs of the materials using Leontief input-output(I-O) analyses in 1973 [6,7]. In the early 1990s in Russia, the concept of energy analysis for gas industry companies was further developed in the work of Elena V. Lukina, who stated that: “technical and economic calculations must be supplemented by a cost estimate, expressed in energy units” [8]. Lukina proposed three energy indicators: energy efficiency, the energy coefficient, and energy payback time. Energy efficiency can be determined by the ratio of useful energy consumed in the process of developing energy itself and is similar to the more commonly used concept of energy return on investment (EROI) [9,10,11,12]. The net energy coefficient is the energy delivered to society after subtracting the energy used in its production. The energy payback is the period of time required to deliver to society an amount of energy equivalent to the project’s lifetime energy use. The energy efficiency equation is as follows:
where Ke is the energy efficiency, Eta is the total energy delivered to society over the service life of this project, Eic is the total costs of energy in construction, and Eon is the energy consumption for production.
Yakov M. Shchelokov provided an excellent analysis of this subject in the book “Energy Analysis of Economic Activity (Energy Problems of Energy-consuming Industries)” published in 2010 [13]. In the book, Shchelokov provides the main definitions of energy efficiency, energy efficiency indicators, and the calculation schemes, and special attention is given to the energy analysis of the metallurgical industry companies. Yakov M. Shchelokov introduced into circulation the term “technological fuel number” (TFN), which is an indicator of energy consumption per ton of finished goods. Total energy consumption of production is defined as the sum of the TFN, the human work required, and the energy consumption for environmental protection. The equation is as follows:
where E is the amount of total energy consumption in joules, Et is the amount of technological fuel in joules, El is the amount of energy for required human work in joules, and Ee is the amount of energy consumption in joules used for environmental protection in the production and execution of services.
Shchelokov provided methods for determining Et, El, and Ee. The term Et (TFN) includes different primary and embodied energy, as well as that saved in the production process, which is similar to the notion of full fuel cycle [14]. Research concerning energy analysis is continuing in Russia. In particular, Anton Sokolov and Nataliya Iskritskaya are conducting research concerning the energy efficiency of extraction [15].
Several studies used energy analysis to determine the effectiveness of energy capture and conversion systems in the Soviet Union (USSR) and later in Russia. In the USA, similar diagrams were developed by Charles Hall, who developed the concept of EROI and applied it to migrating fish populations [16]. Modern efforts to standardize energy efficiency analysis have focused on the standardization of EROI, as described in Section 1.2 below.
1.2. The History of EROI in Other Countries
The American efficiency engineer Harrington Emerson was one of pioneers in industrial engineering management and organizational theory. His major contributions were to install his management methods at many industrial firms and to promote the ideas of scientific management and efficiency to a mass audience. In 1911, he calculated the energy indicators in the form of horsepower and gave a universal formula for calculating the energy used to increase labor productivity. In 1912, he published the book “The Twelve Principles of Efficiency” [17]. Leslie A. White claimed that the concept of net energy can be found in anthropology and described the importance for cultural development. People need food and a large amount of external energy [18,19,20,21]. The main event that initiated interest in a subject of the energy analysis was the “energy crisis” from 1973 to 1985 [22,23]. At the beginning of the 1980s, American scientists initiated the idea of calculation of energy efficiency for the extraction of energy resources. This indicator has been called EROI (energy return on investment) and the first who used this indicator were Cutler Cleveland and Charles Hall. EROI is the relation of the energy produced as a result of “energy invested” in extraction of that energy resource. Energy resources with a higher EROI value are usually considered a better energy resource. American scientists have developed many aspects of the factor, including procedures of calculating indirect and auxiliary cost associated with the process [9,10,11,12]. In 2011, the main conceptual questions connected with a calculation procedure include points of calculation, category of expenses, and calculation techniques for energy cost of materials. The “standard” option of calculation EROIstnd is the tool to consider the well head, mine mouth, etc., including direct and indirect material and energy consumption costs on production and primary preparation. Depending on what categories of expenses and at what point it is made, David J. Murphy etc. gives various classifications of EROI (Table 1).
Adam R. Brandt and Michael Carbajales-Dale gave a taxonomy of efficiency indicators (ERRs) for energy analysis, including the following: (1) NER—net energy return is the ratio of net output to society to the total amount of energy consumed in production; (2) NEER—net external energy ratio is computed as the net final energy provided by a process divided by the energy input to the process from only the external energy system; (3) GER—the gross energy return uses the gross output from the final processing stage (before any self-consumption of the final product is removed); and (4) GEER—the gross external energy return computes the same as the indicator GER, but for the gross energy output [22,25,26,27]. Energy analysis is a relatively new approach to determining the efficiency of economic activity. The famous ecologist Howard Odum stated that energy should become a unit of economic measurement instead of money because only in this way would we regard the real source of wealth as the contributions made by nature [28].
In China, professor Feng Lianyong was the first person who undertook research on the energy efficiency of China’s oil and gas fields. The history and the forecast of EROI have been calculated for Daqing, the huge field in China. The EROI was estimated to be 10:1 in 2001 and 6.5:1 in 2009. Based on this trend, the EROI, or the net energy from the field, will be substantially decreased [29,30,31]. Russia’s oil and gas fields have exhibited a similar declining trend [32,33].
1.3. Energy Analysis in the Information System of Company Management
Energy analysis is necessary for the effective assessment and comparison of oil and gas companies’ energy efficiency. Energy analysis must become part of corporate reports. Therefore, it is necessary to define energy analysis in the general structure of corporate reporting, especially in production, accounting, financial, and management accounts. Different researchers determine the interrelation between these accounts differently. However, all authors agree on the following: (1) Management accounting is not regulated by the state; it is an internal affair intended for the managing directors of the company. (2) The financial account is regulated by the state. The report is standardized and is intended for external users. (3) It is possible to conduct the analysis using information from financial or management accounting. Indicators of the financial analysis are standardized, but indicators of the management analysis are not standardized [34,35].
The energy analysis is intended for external users, and therefore, indicators must be standardized. The energy analysis is meant to be an auxiliary indicator for financial analysis. A standardized energy indicator will enable the comparison of energy efficiency among various enterprises. The production activity of any company is reflected in the flow of information that quantitatively reflects activities. All arrays of the considered data can be divided into two main sets [36,37] (Figure 1):
- (1)
- The production (services) cost information;
- (2)
- The production of goods (services) information.
In each of these sets, it is possible to allocate three subsets connected with the units in which the account is kept:
- (1)
- Cost indexes of expenses Xj (Cost) and releases Aj (Cost),
- (2)
- Cost and natural indexes of expenses Yi (Cost, Natural) and production Bi (Cost, Natural),
- (3)
- The natural (without cost assessment) indicators of expenses Zk (Natural) and production Ck (Natural).
X (Cost) is the expenses accrued in the reporting period that are very difficult or impossible to express through energy units. For example, X includes the acquisition of the software, design work, exploration work, and various non-material services. Y (Cost, Natural) is the expenses that have exact expressions in cost and natural indexes (embodied energy belongs to Y) [38,39,40]. For example, Y includes the purchases of fuels and lubricants, pipes, cement, equipment, and electric power expenses. Z (Natural) is the expenses that have natural indicators but do not have costs (the type of energy self-consumption belongs to Z). For example, associated oil and gas can be used to trade as fuel for power generation while not being considered in the financial plan in any way. Whether these expenses can be reflected in management accounting or not depends on the management accounting policy of the enterprise. Hence, information on similar expenses is necessary for conducting the energy analysis.
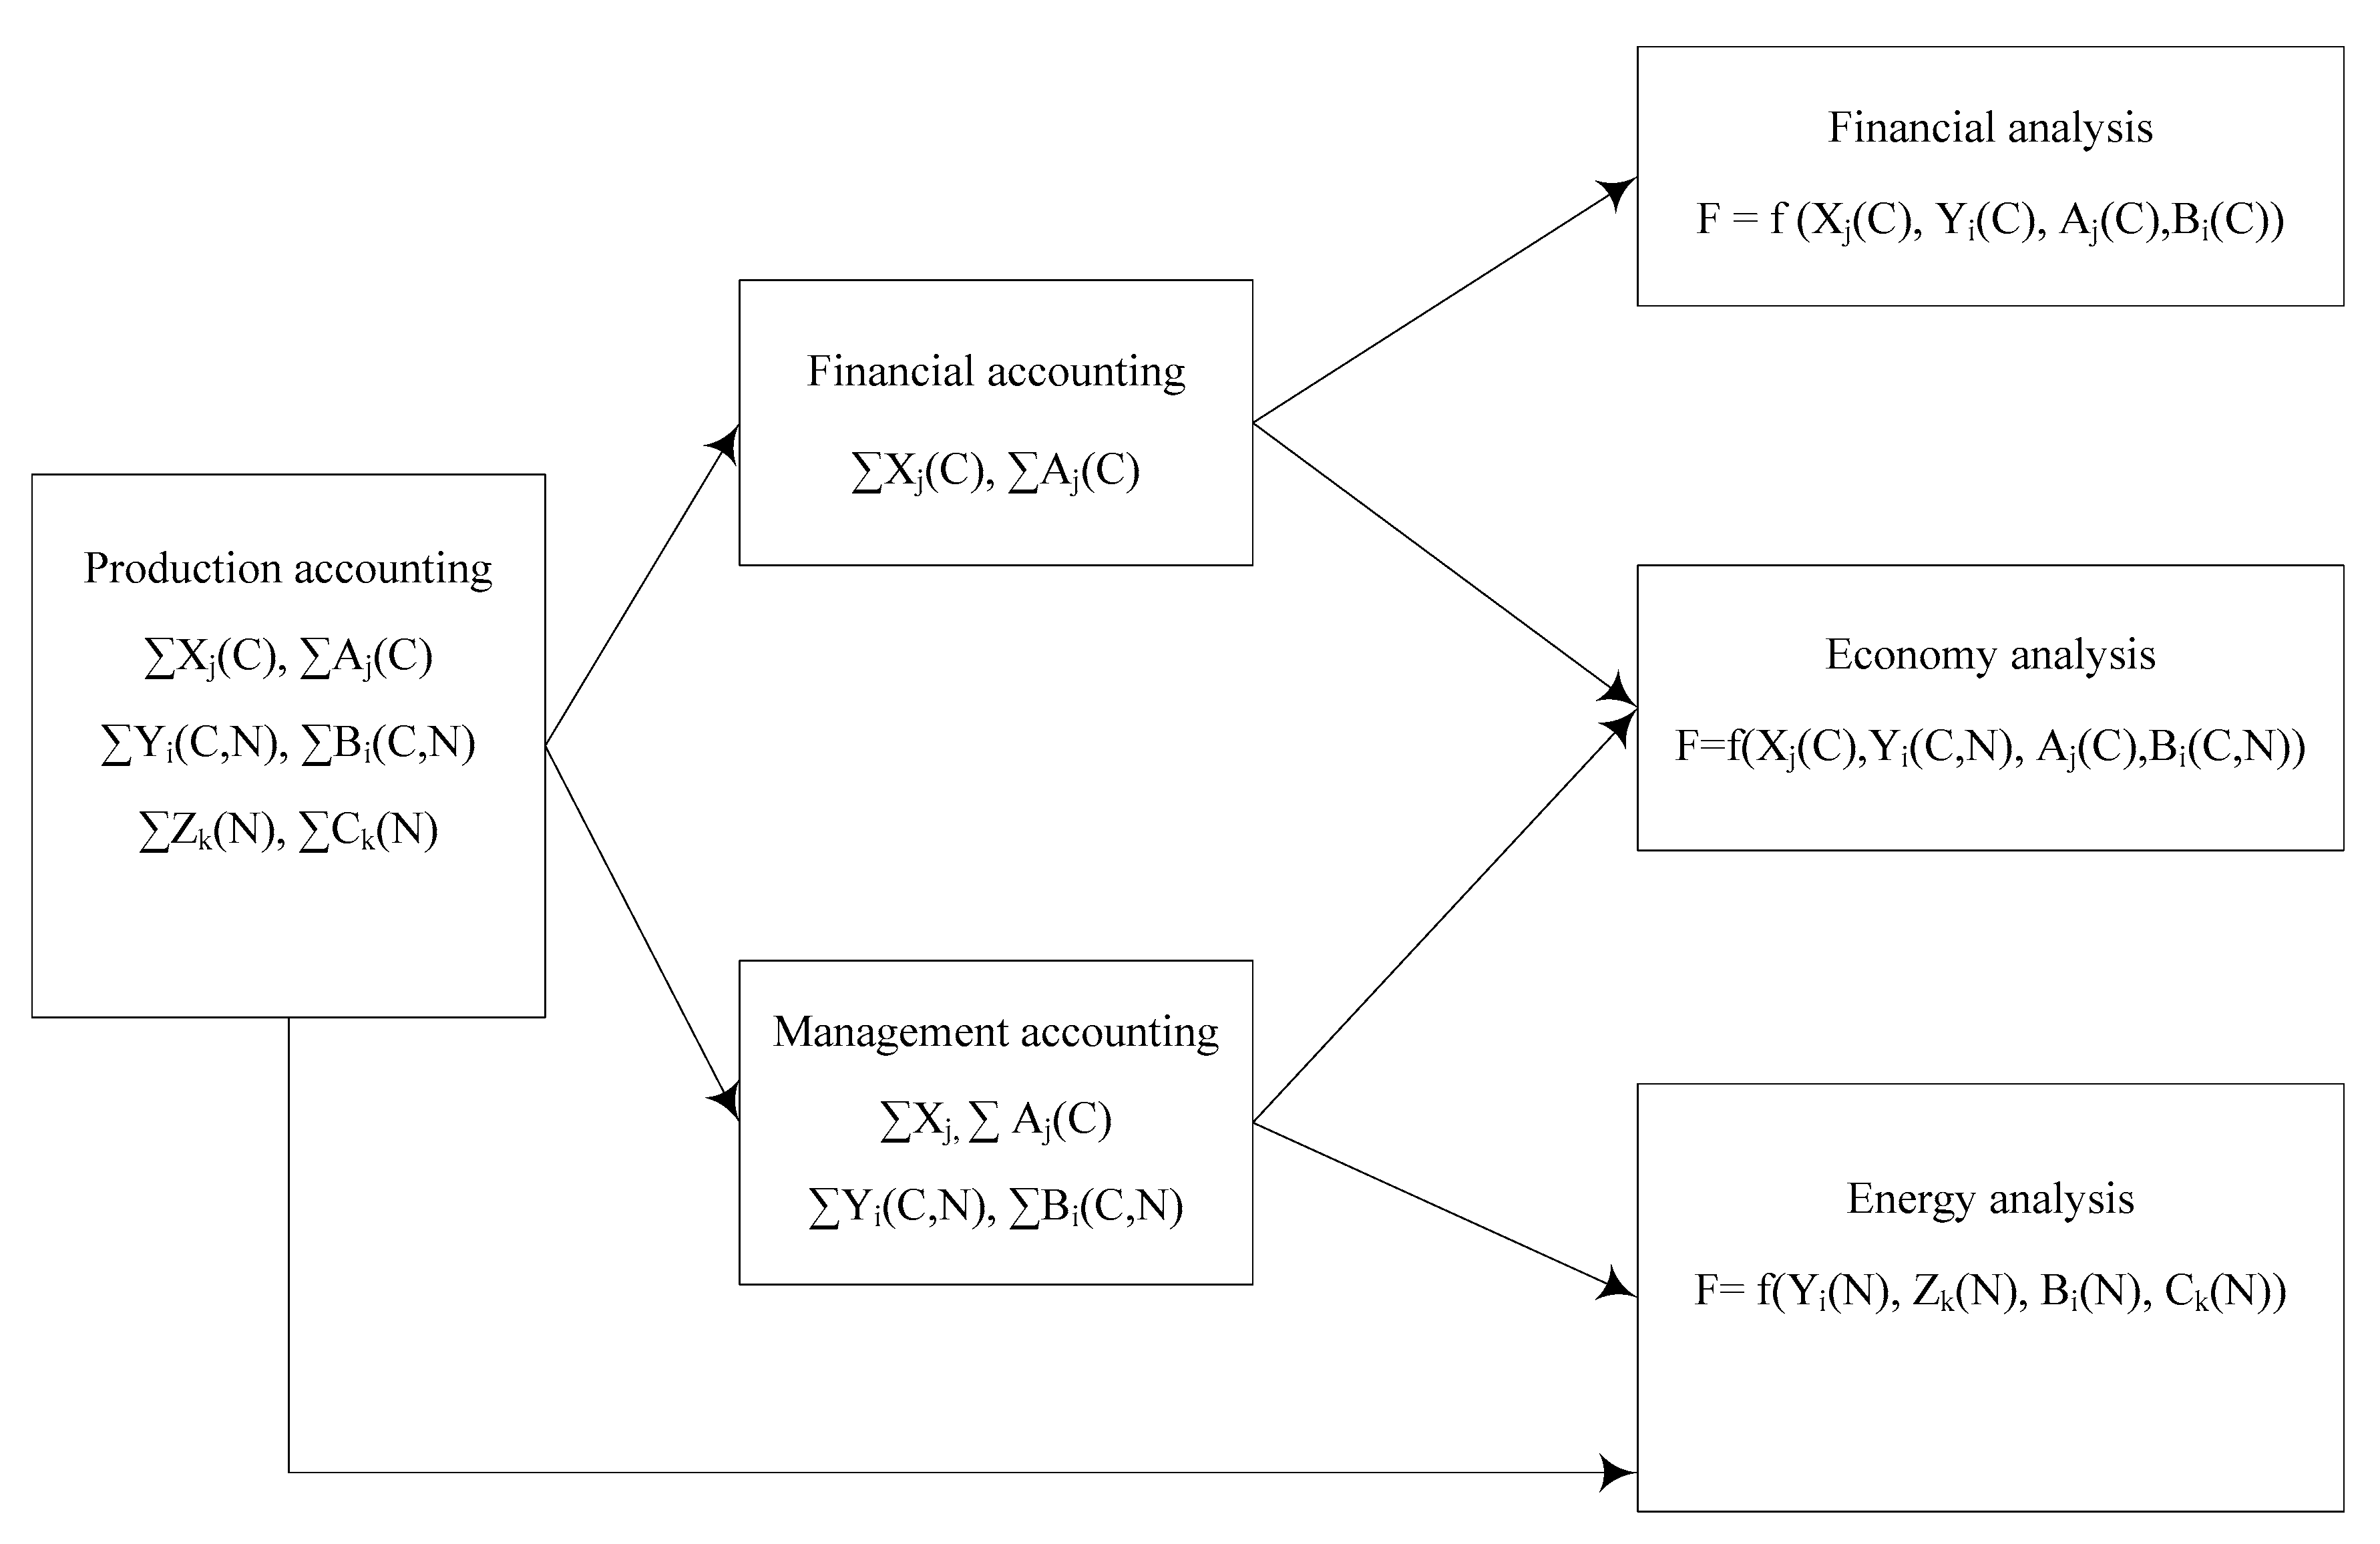
The production account considers all information connected with production (Figure 2). Furthermore, the advising services of the production account follow certain rules from the financial and administrative statements. For financial accounting, only cost information is addressed. Management accounting addresses both cost information and environmental data [41].
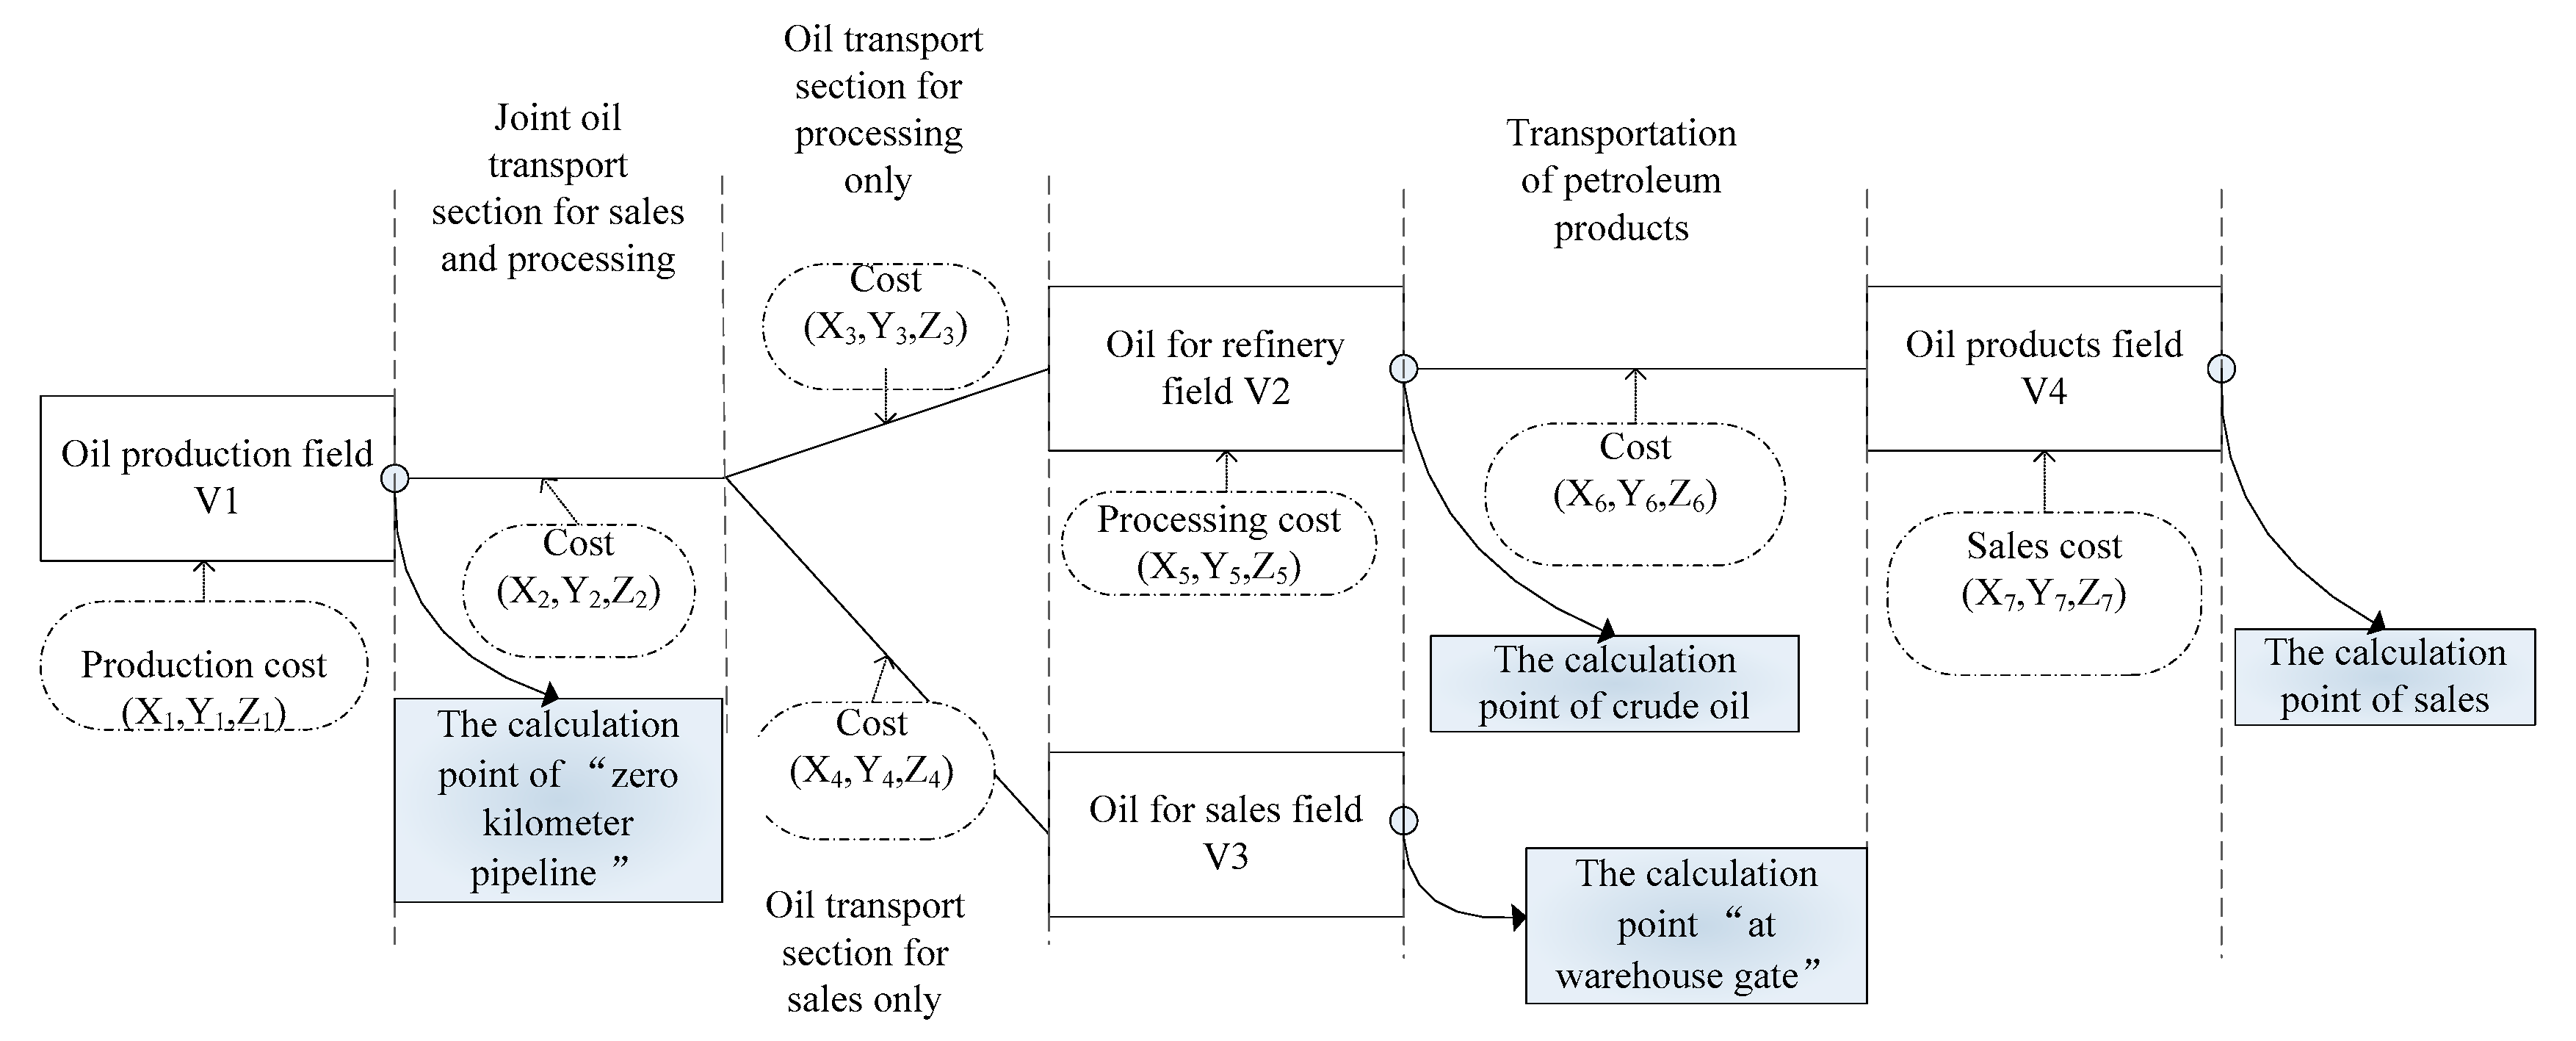
On the basis of financial and administrative statements, financial and economic analyses were conducted. Value terms of expenses and releases were used only to conduct the financial analysis. The economic analysis used both costs and natural values (Figure 2). For energy analysis, it is necessary to calculate the expenses in physical units. According to the authors’ interests, it is important to define the impact of performance on cost efficiency and energy efficiency. For this purpose, the calculation of the compared indicators of the financial and energy analyses must be structurally identical, with the distinction that one calculation is made in cost units, and the other in physical units. However, in the case of the vertically integrated oil and gas company (VIOGC), the financial statement incorporates all production divisions, including production, transportation, and processing. A VIOGC sells raw oil at the stage of extracting oil. At the stage of transporting and processing, oil refineries belong to the company [42]. It is very common that in the first stage, crude oil is also bought from other organizations. Therefore, crude oil and oil products are obtained at different prices in the market. There are differences in production cost, but prime costs consist of all expenses incurred during the reporting period without separating these costs in the financial statement. The revenues and profits are integrally considered on all productions in the same way, and total revenues over all divisions (including prime costs and profits) are part of the financial statement. Therefore, conducting the financial analysis on the basis of total values is possible. However, in conducting energy analysis, the amount of produced oil and the volume of produced oil products have analogous revenues. We can consider the valuation of both oil and oil products as further operations, but we cannot sum the energy equivalents of oil and gas products, and cannot conduct the analysis using this value. When conducting an energy analysis, we should always set the calculation point (sometimes called the boundary), and then operate with the costs and quantities of products under this advising point of the calculation (Figure 3). This process is the main difference between the energy analysis and the financial analysis. If the enterprise is too small, it is engaged only in oil production, and thus, only one point of calculation is available. Therefore, we have an opportunity to conduct a comparison of the dynamics of financial performance and their energy analogs. In a case with a VIOGC, for the comparison of dynamics of financial and energy performance, it is necessary to lead to a given calculation point [24].
2. Methodology and Data
2.1. Oil and Gas Companies’ Indicators of the Energy Analysis
Data on energy consumption are provided in reports of the Russian oil and gas companies from 2005 to 2014. Typically, these data provide limited information. Only several paragraphs of text and several figures related to the consumption of electricity (kWh) and heat (Kcal) in “production” and “transportation and processing” sectors are available. A detailed report of the energy consumption involved in oil processing is not provided. In addition to the absolute values, the specific indicators of electricity consumption in production per ton of oil (kWh/t) are given. Information on energy consumption in reports is complete. The data in physical units (tons of fuels and lubricants, kWh, and tons of steel and cement) on capital investments and operational expenses divided into various production processes are necessary to conduct the energy analysis of oil production. There are three types of capital investments in oil and gas branches: (1) the establishment of newly introduced and the reconstruction of existing production assets, including operations, production, injection, and auxiliary bores; (2) the commercial development of the field, including objects in the environment (field installation and construction of well pads and wellheads); and (3) the equipment for oil and gas, not included in the construction estimates. In oil extracting, branch planning and the accounting of the operational costs of production is conducted at the level of the enterprise and its structural divisions (departments, productions, and sites) on the basis of the existing organizational structure of the enterprise [43]. Different stages of oil and gas production are shown in Table 2.
In each of part of the report, the following expenses must be considered:
- Raw materials and main materials,
- Auxiliary materials,
- Fuel,
- Energy,
- Salary fund and social responsibility funds,
- Depreciation of fixed assets,
- Transportation costs, and
- Other expenses.
There are 13 elements (Appendix A) described in previous articles. The first twelve items of expenditures in the list form production costs of the gross output of oil, and the last item (business expenses) represents the hollow costs of commodity oil production. The definition of the specific indicators of production efficiency is possible on the basis of those considered expenses. Traditionally, these indicators must include the following:
- Costs of oil production, rub/t;
- Costs of the extraction of associated gas, rub/thousand m3;
- Prime costs of the pumping water in layers, rub/m3;
- Costs of the preparation and pumping of oil, rub/t;
- Prime costs of capital and the maintenance of wells, one thousand rub; and
- Costs of the development of thermal energy and others
Therefore, we have all the information necessary for the energy analysis. The most important indicators of the financial and energy analysis in the companies are shown in Table 3.
Before considering the calculation method for each indicator, we should examine the EROI figure and explain why it is not included on this indicators list. In this case, the indicator is an ideological mismatch between financial ROI (rate of investment) and EROI. The calculation of EROI considers the entire spectrum of materials and energy consumption. In calculating ROI, the denominator includes only the equity and long-term liabilities without the short-term liabilities. Short-term obligations, such as purchasing fuel and materials, are not considered. Moreover, the deposit can be used by several investors. Each participant will have a certain amount of investments, profit, and the board’s estimated value of the ROI depending on arrangements. For these two reasons, the assumption that is embedded in the ROI and EROI of the energy is incorrect. Meanwhile, in the financial analysis, there is a measure of the “profitability on the production costs” (while ROCS refer to return on cost of sales, in some cases, we refer to it as variable costs), calculated as the ratio of profits to the cost of goods sold. To be theoretically accurate, we should speak about the energy equivalent of increased ROCS and denote it as EROCS (energy return on cost of sales).
There are two main principles in calculating energy efficiency coefficients. First, the efficiency of extracting the primary energy resources is calculated. It is necessary to correlate the amount of primary energy spent in extracting energy. Thus, the elapsed electricity and thermal energy in the calculation must be considered based on the amount spent on the production of primary energy resources. Second, the costs of materials should also be considered based on how much primary energy has been spent on the production of a particular material. However, the definition of the energy intensity of production materials and equipment itself is a serious academic issue that should be addressed in a separate study. The coefficients of energy intensity of key construction materials (especially steel and cement) should be determined based on the results of existing studies. To compare the energy efficiency in different companies, the coefficients must be the same.
(1) ROCS and EROCS
The profitability of expenses (ROCS—return on cost of sales) refers to payments related to the sum of the pure monetary inflow (consisting of net profits and depreciation during the reporting period) considering the prime costs of the goods sold (the sum of expenses of the products sold). The coefficient ROCS characterizes repayments of production costs and shows the profits for the enterprise per ruble spent for production and product sales.
The formula for the calculation of the indicator profitability of expenses is as follows:
The energy EROCS option is the relationship between the equivalent of commodity and the costs of production:
Provided that the calculation point “on zero kilometer of the main pipeline” is used, the numerator includes a volume of the commodity in energy equivalents, and the denominator includes the total volume of energy and the materials in the energy equivalent spent for production. The coefficient shows how much greater the extracted energy is than that spent for production. If EROCS is greater than 1, production is energetically favorable. If EROCS is equal to 1, production is conducted with zero net result. If EROCS is less than 1, production in the energy plan is unprofitable. Thus, all conditions being equal, a higher EROCS value indicates a more efficient energy resource.
(2) ROFA and EROFA
The profitability of non-current assets (return on fixed assets (ROFA)) is defined as the ratio of net profits to total non-current assets. The profitability of non-current assets is a relative measure of efficiency. The quotient of the net profit generated during the period is divided by the total value of non-current assets during the period. The ratio shows the ability of assets to generate profits. In other words, it measures the profits per ruble invested in fixed assets in the organization:
EROFA is calculated as the ratio of the energy equivalent of the hydrocarbon commodity to the energy equivalent of non-current assets. To calculate the energy equivalent, we must have information about non-current asset materials. Furthermore, we should consider the depreciation according to the same rules as the financial indicators’ ROFA. This figure reflects the growing (or declining because of innovation) needs of fixed assets for extracting energy resources. On the one hand, the development of heavy hydrocarbons reserves requires additional capital expenditures. On the other hand, improved technology leads to lower costs. These two trends will be reflected in the indicator EROFA. We can also conclude that increasing (or decreasing) the capital intensity of the production of hydrocarbons depends on the dynamics:
(3) The unit cost of energy and the efficiency of extraction
The unit costs of extracting hydrocarbons are calculated as the ratio of costs for the extraction of hydrocarbons (item 1) to the commercial volume of hydrocarbons. The dynamics of the indicator reflect the economic efficiency of controlling the well foundation. Energy extraction efficiency is calculated as the ratio of the trade volume of hydrocarbons to the energy expended on extraction. The dynamics of the indicator will influence the quality and the depletion of stocks and the effectiveness of controlling the well foundation. Unlike economic indicators, the energy is independent of inflation and other cost factors. Both measures will provide a more complete picture of the status in which stocks and their management are effective on the borehole foundation.
(4) The unit cost and energy efficiency of extraction and preparation
The unit costs of the extraction and preparations of hydrocarbon are calculated as the ratio of the costs of extraction and the effects on the formation, collection, transportation, and technological training on the commercial volume of hydrocarbons. The energy efficiency of the extraction and preparation of hydrocarbons is calculated as the ratio of the trade volume of hydrocarbons to the energy expended on the extraction of them and the effects on the formation, collection, transportation, and primary preparation. The dynamics of the indicator will influence the quality and degree of the depletion of reserves, the management efficiency on the borehole, the effectiveness of the stimulation, and the efficiency of the industrial infrastructure. These indicators reflect the effectiveness of the control of the main production processes in the extraction of hydrocarbons.
(5) The specific capital costs and the energy efficiency of capital expenditures in exploration and production
Specific capital costs are calculated as the ratio of the total capital costs for exploration and production to the commercial volume of hydrocarbons during the period under review. Similarly, it is possible to calculate the energy efficiency of capital expenditures as the ratio of the trade volume of hydrocarbons to the capital expenses for energy exploration and production. Considering the increasing share of tight oil reserves in the structure of mining companies, the dynamics of these indicators will reflect the growing need for additional capital expenditures.
2.2. Data Collection
JSC Yakutsk Fuel and Energy Company possesses the gas enterprise licenses to develop the place Srednevilyuysky and Mastakhsky gas condensate fields. Both fields are noted for one geological structure area named Hapchagaysky Megashaft. The JSC Yakutsk Energy Company provides the extraction of natural gas and the preparation of gas for delivery to the main gas pipeline. The gas is delivered to end users by the JSC Sakhatransneftegaz Conmpany. The company performs the primary operating activities in the territory of the Republic of Sakha (Yakutia), Russian Federation. The region is characterized by a high degree of isolation from the outside world in view of the increased complexity of transportation availability [44]. In this paper, the influence on external competitors is minimized. We obtained the actual production data from the financial statements and accounting department with the company’s permission. Detailed information on the collected data can be found in the Supplementary Information (SI) for this research.
3. Results and Discussion
We used the conversion rates listed in Appendix B to calculate indicators. The values of ROCS and EROCS are shown in Appendix C and Figure 4. To calculate EROFA, the total quantity of equipment and machinery were taken into account, and the resulting values were converted into energy units. Then, calculations were made with the depreciation and without depreciation. The depreciation of fixed assets according to the 2014 financial report was 14.6%. As shown in Figure 4, the rate of ROCS in the period from 2005 to 2008 was negative due to negative net profits. The company was profitable from 2009 to 2014, and the value of the ROCS was from 50% to 70% from 2013 to 2014. Furthermore, the EROCS had very high values from 90 to 120 throughout the analyzed period. Specifically, the growth of the EROCS values was at levels above 100. If EROCS values are at low value level (below 5), it may be necessary to assess the appropriateness of the use of this type of energy and transition to another. The growth levels of EROCS values were from below 100 to above 110 during the period 2006 to 2009. Values of the ROFA indicator depend on the size of net profits, which were negative in the period from 2005 to 2008. With increases in net profits, the values were established at the level of 20 to 30%.
The value of EROFA shown in Figure 5, calculated at the end of 2014, was 42 excluding amortization and 49 including amortization, shown in Table 4. Based on the fact that the production process did not change, the amount of equipment and technology required was approximately the same. For this type of natural gas field in these climatic conditions, the EROFA indicator was at the level of 40 to 50. It is impossible to calculate EROFA in these dynamics, because necessary data are missing from the statement. The calculation of EROFA will be possible only if fixed assets energy equivalent is assigned to each object (in the simplest case, they are the mass of the main structural materials).
The indicator dynamics of unit costs and energy efficiency on energy extraction and processing used in the converted data are shown in Table 5. The condition of the natural gas deposits in these gas fields is favorable. Thus, the costs of the wellhead are minimal and include only the cost of the injection of methanol to prevent hydrate formation. Therefore, the costs of extracting gas are very low at the level of 30 rubles per thousand cubic meters. Furthermore, the cost rises as the price of methanol increases. Therefore, energy efficiency is high and stable at the level of 1200. In the future, the situation will remain in the same favorable state since the condition of gas production is unlikely to change. Producing natural gas requires the dehydration and separation of methane, condensate and other gas components. Natural gas is processed in special, complex gas facilities, that consume electricity and thermal energy. Because the preparation process is simple and low cost, the unit value is low at the level of 70 rubles per thousand cubic meters, and thus, the value of energy efficiency is high at level of 190 on average.
Due to the impossibility of exporting gas outside the country and the limited market size within the country, there was no need to expand existing production. Therefore, capital expenditures were implemented on the existing production system to replace unserviceable equipment with new and overhauled equipment. Private investment was made to the increase of production capacity in the processing of gas condensate with the production of gasoline, diesel, and furnace fuel. However, the company explored new licensed areas with the purpose of producing gas to meet the needs of the western regions of the Republic. Thus, funded seismic surveys, two drilled exploration wells, and associated major capital expenditures in the period were under review. Because energy and material expenditures for overhaul, exploration, and the drilling of two wells were not as high as the produced gas volume, the costs of the specific capital expenditures were low, but the energy efficiency for the capital expenditure was extremely high, as shown in Table 6.
4. Conclusions and Policy Implications
The main goal of this article is to provide direction for improving Russian oil and gas corporate reporting to address the problem of determining the energy efficiency in different energy production stages. In the example of JSC “YATEC,” we can conclude that public annual reporting did not contain all the necessary data for the calculation of energy efficiency indicators. However, the company had the ability to systematically collect and present all necessary information in its annual reports. Thus, there were no fundamental insurmountable obstacles to the implementation of the energy analysis.
We can conclude the following from this article.
First, the negative profitability of ROCS and ROA is based on both external and internal causes. The external cause is primarily gas prices, which are regulated and gradually increase every year. Gas prices in the Sakha (Yakutiya) Republic were sufficient to profitably maintain the operating and investment activities of the company from 2005 to 2014. The internal cause is the quality of financial management. Profitable ROCS and higher value EROCS suggest that the development of these gas fields is highly profitable. Thus, pore pressure was sufficient to deliver the methane to the end user without using the compressors. As a result, the situation of the financial loss was caused by human error.
Second, the growth of EROCS suggests that the company conducted managerial, financial, and production measures to improve its effectiveness. These measures resulted in an increase of energy production efficiency.
Regarding polices, energy companies as energy systems are characterized by a much higher fraction of fixed costs as compared to variable costs. Higher fixed costs are more favorable in certain and lower growth (with low discount rate) environments whereas lower fixed cost systems are more favorable in uncertain and high growth situations [36]. Single cost-based or single energy-based analysis measures are not as informative as they would be for the development of hydrocarbon reserve production. Both analyses should be used in the report statement to aid in decision making.
Supplementary Materials
The following are available online at https://www.mdpi.com/1996-1073/12/2/268/s1; Figure S1. General information of JSC Yakutsk Fuel and Energy Company. Figure S2. Schematically shows the flows of produced and consumed energy gas. Table S1. Dynamics of net profit and cost of sales of JSC Yakutsk. Table S2. Dynamics of hydrocarbons extraction and energy consumption in JSC Yakutsk Fuel and Energy Company. Table S3. ROFA data given for calculation. Table S4. Assets of JSC “YATEC” at the end of 2014 to calculate EROFA. Table S5. Volumes of realization of gas and expenses on acquisitions and delivery of methanol. Table S6. Material costs, energy consumption, and total capital costs of exploration. And production of JSC Yakutsk fuel and energy company.
Author Contributions
J.Y. designed the study and wrote the paper, A.S. (Alina Steblyanskaya) developed conceptual ideas and translated relevant foreign literature, A.S. (Anton Sokolov) conducted the data analysis of field experiments and wrote the paper, L.F. developed the conceptual ideas and N.I. designed the study.
Funding
This research was supported by the National Natural Science Foundation of China (grant No.71874202/ 71874201/71373285).
Acknowledgments
This research was done by collaboration of two Research centers in Russia—Institute of Oil and Gas Problems Russian Academy of Science (Siberian branch) and All-Russia Petroleum Research Exploration Institute and China University of Petroleum (Beijing) from the other side. Also, we thank Charles A.S Hall for his great support of our research.
Conflicts of Interest
The authors declare no conflict of interest.
List of acronyms
| EROI | Energy Return on Investment |
| EROIstnd | Standard Energy Return on Investment |
| EROCS | Energy Return on the Cost of Sales |
| ROCS | Return on the Cost of Sales |
| EROFA | Energy Return on Fixed Assets |
| ROFA | Return on Fixed Assets |
| USSR | Union of Soviet socialist Republic |
| ISEM | Melentyev Institute of Energy System |
| RAS | Russian Academy of Sciences |
| TFN | Technological Fuel Number |
| NER | Net Energy Return |
| NEER | Net External Energy |
| GER | Gross Energy Return |
| GEER | Gross External Energy |
| VIOGC | Vertically Integrated Oil and Gas Company |
| Rub | Rouble |
| m3 | Cubic Meter |
| JSC | Yakutsk Fuel and Energy Company of the Republic of Sakha (Yakutia) |
| T | Ton |
Appendix A

Table A1.
Output cost of hydrocarbon production.
| No | Cost Accounting Item | Explanation |
|---|---|---|
| 1 | Energy cost of oil extraction | Included the energy costs of mechanized method in oil extraction, the costs of installed power and maintenance of power grids. |
| 2 | Expenses for artificial influence on the plat | Include the expenses associated with conducting operations to maintain reservoir pressure and increase oil recovery. |
| 3 | Expenses for labor | Basic and additional wages of production workers. |
| 4 | Deductions on social needs | |
| 5 | Wells depreciation | Depreciation on the full restoration according to current regulations of the cost of oil, gas, evaluation, regulatory control, and pending abandonment of wells. |
| 6 | Costs of collection and transportation of oil and gas | Included costs associated with the carrying out of works on gathering of oil and gas, preliminary discharge of water and oil pumping. |
| 7 | The costs for the technological preparation of oil | Included costs associated with the work to prepare oil to prescribed standards of quality. |
| 8 | The costs of preparation and mastering of production | Includes the costs for preparation and development of new industries. |
| 9 | Cost of maintenance and operation of equipment | Include expenses of the shops base in production-technical services for a current (underground) and workover rigs, as well as costs associated with the maintenance and operation of ground and underground equipment of wells. |
| 10 | Guild expenses included costs associated with the management and organization of the main production shops | Payroll management personnel of the shop with deductions on social needs, cost of maintenance, and current repair of buildings and structures, depreciation of fixed assets, the costs of labor, and other production costs. |
| 11 | Overhead expenses included costs associated with the management and organization of production | Wage fund of the staff in the office with deductions on social needs, travel expenses, service patrols and maintenance vehicles, depreciation of fixed assets in general purpose, maintenance and repair of buildings, repair and maintenance of roads, training expenses, environmental fees, the costs of protection of the enterprise, and other overhead costs. |
| 12 | Other production expenses | Include expenses and taxes recoverable in the cost oil extraction tax on mining, local taxes, etc. |
| 13 | Commercial expenses | Includes energy costs of oil pumping and depreciation deductions for the renovation of pipelines and other fixed assets. |
Appendix B
Table A2.
Conversion rates.
| No | Name | MJ | Thousand Cube m of Gas |
|---|---|---|---|
| 1 | Methanol, t | 22.700 | 0.63 |
| 2 | Petrol, t | 44.000 | 1.22 |
| 3 | Diesel, t | 42.700 | 1.19 |
| 4 | Condensate, t | 41.500 | 1.15 |
| 5 | Natural gas, thousand cubic meters. | 36.000 | 1.00 |
| 6 | A ton of conditional fuel | 29.300 | 0.81 |
| 7 | Steel, t | 31.300 | 0.87 |
| 8 | Cement, t | 5.100 | 0.14 |
| 9 | Aluminum, t | 157.100 | 4.36 |
Sources: EIA Energy Units and Calculators Explained [45].
Appendix C
Table A3.
Dynamics of indicators of ROCS and EROCS in JSC Yakutsk company.
| NO | The Calculated Data | 2005 | 2006 | 2007 | 2008 | 2009 | 2010 | 2011 | 2012 | 2013 | 2014 |
|---|---|---|---|---|---|---|---|---|---|---|---|
| 1 | Sale of gas, million cubic meters. | 1296 | 1374 | 1381 | 1512 | 1614 | 1607 | 1590 | 1664 | 1685 | 1702 |
| 2 | Sale of condensate, million cubic meters | 85 | 94 | 89 | 92 | 98 | 98 | 102 | 101 | 101 | 99 |
| The electricity consumption of own production, thousand cubic meters of gas | |||||||||||
| 3 | Production of gas and condensate | 2971 | 3169 | 3218 | 3226 | 3967 | 3786 | 3869 | 3856 | 3851 | 3837 |
| 4 | Recycling of condensate | 2283 | 1683 | 1345 | 1502 | 1258 | 1656 | 1708 | 1631 | 1925 | 1752 |
| The heat consumption of own production, thousand cubic meters of gas | |||||||||||
| 5 | Production of gas and condensate | 4080 | 4374 | 4313 | 3621 | 3732 | 3749 | 3511 | 3873 | 3911 | 3883 |
| 6 | Recycling of condensate | 532 | 394 | 344 | 390 | 616 | 487 | 478 | 467 | 448 | 459 |
| Additionally purchased energy: | |||||||||||
| 7 | Electricity, thousand cubic meters of gas | 1474 | 1428 | 1430 | 1464 | 1466 | 1491 | 1507 | 1467 | 1747 | 1835 |
| 8 | Heat energy, thousand cubic meters of gas | 739 | 799 | 674 | 654 | 672 | 678 | 761 | 815 | 1.076 | 677 |
| 9 | Methanol, thousand cubic meters of gas | 1098 | 1150 | 1171 | 1263 | 1322 | 1355 | 1377 | 1359 | 1429 | 1423 |
| 10 | Gasoline, thousand cubic meters of gas | 351 | 549 | 333 | 374 | 442 | 449 | 385 | 508 | 243 | 324 |
| 11 | Diesel, thousand cubic meters of gas | 1289 | 1614 | 1443 | 1301 | 1177 | 1459 | 1256 | 1598 | 1158 | 1204 |
| 12 | EROCS = (1 + 2)/(3 + 4 + 5 + 6 + 7 + 8 + 9 + 10 + 11) | 93 | 97 | 103 | 116 | 117 | 113 | 114 | 113 | 113 | 117 |
| 13 | ROCS | −25% | −8% | −17% | −7% | 18% | 40% | 50% | 49% | 57% | 67% |
References
- Herendeen, R.A. Net Energy Analysis: Concepts and Methods. In Encyclopedia of Energy; Cleveland, C.J., Ed.; Elsevier: New York, NY, USA, 2004; pp. 283–289. [Google Scholar]
- Franco, M.P.V. Searching for a Scientific Paradigm in Ecological Economics: The History of Ecological Economic Thought, 1880s–1930s. Ecol. Econ. 2018, 153, 195–203. [Google Scholar] [CrossRef]
- Burkett, P.; Bellamy Foster, J. The Podolinsky Myth: An Obituary Introduction to ‘Human Labour and Unity of Force’, by Sergei Podolinsky. Hist. Materi. 2008, 16, 115–161. [Google Scholar] [CrossRef]
- Luzin, V.I. Economic Efficiency of Technical Progress in the Oil Industry. Available online: https://search.rsl.ru/ru/record/01001116813 (accessed on 8 January 2019).
- Yu, D.; Kononov, E.V. Methods and Models for Predictive Studies of the Relationship between the Energy Sector and the Economy; Nauka: Novosibirsk, Russia, 2009; p. 178. (In Russian) [Google Scholar]
- Lopes, T.C.; Neder, H.D. Sraffa, Leontief, Lange: The political economy of input–output economics. EconomiA 2017, 18, 192–211. [Google Scholar] [CrossRef] [Green Version]
- Wassily, L. Structure of the world economy—Outline of a simple input-output formulation. Proc. IEEE 1975, 63, 345–351. [Google Scholar]
- Elena, V.L. Estimation of Efficiency of Energy Systems Based on Generalized Energy-Net Input. Ph.D. Thesis, Lomonosov Moscow State University, Moscow, Russia, 1992. (In Russian). [Google Scholar]
- Cleveland, C.J.; Costanza, R.; Hall, C.A.; Kaufmann, R. Energy and the US economy: A biophysical perspective. Science 1984, 225, 890–897. [Google Scholar] [CrossRef] [PubMed]
- Hall, C.A.; Cleveland, C.J. Petroleum drilling and production in the United States: Yield per effort and net energy analysis. Science 1981, 211, 576–579. [Google Scholar] [CrossRef]
- Hall, C.A.S.; Cleveland, C.J.; Kaufmann, R.K. Energy and Resource Quality: The Ecology of the Economic Process; Wiley: Hoboken, NJ, USA, 1986. [Google Scholar]
- Hall, C.A.S. Ecosystem Modeling in Theory and Practice: An Introduction with case Histories; Wiley: Hoboken, NJ, USA, 1977. [Google Scholar]
- Prokhorov, A.M. The Energy problems of energy-intensive industries: study edition. Energy Analysis 2013, 9, 388. (In Russian) [Google Scholar]
- Coughlin, K. A mathematical analysis of full fuel cycle energy use. Energy 2012, 37, 698–708. [Google Scholar] [CrossRef]
- Sokolov A.N., I.N. The idea of power analysis. Background and relevance in our days. Neftegazovaya Geologiya, Theory Practice 2015, 4, 10. (In Russian) [Google Scholar]
- Hall, C.A.S. Migration and metabolism in a temperate stream ecosystem. Ecology 1972, 53, 585–604. [Google Scholar] [CrossRef]
- Emerson, H. Twelve Principles of Efficiency. J. Political Econ. 1912, 7, 764. [Google Scholar]
- Hall, C.A.S.; Lambert, J.G.; Balogh, S.B. EROI of different fuels and the implications for society. Energy Policy 2014, 64, 141–152. [Google Scholar] [CrossRef] [Green Version]
- Lesie, W. The Science of Culture; Grove: New York, NY, USA, 1959. [Google Scholar]
- Lambert, J.G.; Hall, C.A.S.; Balogh, S.; Gupta, A.; Arnold, M. Energy, EROI and quality of life. Energ Policy 2014, 64, 153–167. [Google Scholar] [CrossRef] [Green Version]
- Tainter, J.A. Energy, complexity, and sustainability: A historical perspective. Environ. Innov. Soc. Transit. 2011, 1, 89–95. [Google Scholar] [CrossRef]
- Brandt, A.R.; Dale, M. A General Mathematical Framework for Calculating Systems-Scale Efficiency of Energy Extraction and Conversion: Energy Return on Investment (EROI) and Other Energy Return Ratios. Energies 2011, 4, 1211–1245. [Google Scholar] [CrossRef] [Green Version]
- Murphy, D.; Carbajales-Dale, M.; Moeller, D. Comparing Apples to Apples: Why the Net Energy Analysis Community Needs to Adopt the Life-Cycle Analysis Framework. Energies 2016, 9, 917. [Google Scholar] [CrossRef]
- Murphy, D.J.; Hall, C.A.S.; Dale, M.; Cleveland, C. Order from Chaos: A Preliminary Protocol for Determining the EROI of Fuels. Sustainability 2011, 3, 1888–1907. [Google Scholar] [CrossRef] [Green Version]
- King, C.; Maxwell, J.; Donovan, A. Comparing World Economic and Net Energy Metrics, Part 1: Single Technology and Commodity Perspective. Energies 2015, 8, 12949–12974. [Google Scholar] [CrossRef] [Green Version]
- King, W.C.; Maxwell, P.J.; Donovan, A. Comparing World Economic and Net Energy Metrics, Part 2: Total Economy Expenditure Perspective. Energies 2015, 8, 12975–12996. [Google Scholar] [CrossRef] [Green Version]
- King, W.C. Comparing World Economic and Net Energy Metrics, Part 3: Macroeconomic Historical and Future Perspectives. Energies 2015, 8, 12997–13020. [Google Scholar] [CrossRef] [Green Version]
- Hall, C.; Lindenberger, D.; Kümmel, R.; Kroeger, T.; Eichhorn, W. The Need to Reintegrate the Natural Sciences with EconomicsNeoclassical economics, the dominant form of economics today, has at least three fundamental flaws from the perspective of the natural sciences, but it is possible to develop a different, biophysical basis for economics that can serve as a supplement to, or a replacement for, neoclassical economics. Bioscience 2001, 51, 663–673. [Google Scholar]
- Hu, Y.; Hall, C.A.S.; Wang, J.; Feng, L.; Poisson, A. Energy Return on Investment (EROI) of China’s conventional fossil fuels: Historical and future trends. Energy 2013, 54, 352–364. [Google Scholar] [CrossRef]
- Wang, J.; Feng, L.; Steve, M.; Tang, X.; Gail, T.E.; Mikael, H. China’s unconventional oil: A review of its resources and outlook for long-term production. Energy 2015, 82, 31–42. [Google Scholar] [CrossRef]
- Wang, K.; Feng, L.; Wang, J.; Xiong, Y.; Tverberg, G.E. An oil production forecast for China considering economic limits. Energy 2016, 113, 586–596. [Google Scholar] [CrossRef]
- Safronov, A.; Sokolov, A. Preliminary Calculation of the EROI for the Production of Crude Oil and Light Oil Products in Russia. Sustainability 2014, 6, 5801–5819. [Google Scholar] [CrossRef] [Green Version]
- Nogovitsyn, R.; Sokolov, A. Preliminary Calculation of the EROI for the Production of Gas in Russia. Sustainability 2014, 6, 6751–6765. [Google Scholar] [CrossRef] [Green Version]
- Samuel, S. A conceptual framework for teaching management accounting. J. Acc. Educ. 2018, 44, 25–34. [Google Scholar] [CrossRef]
- Bay, C. Makeover accounting: Investigating the meaning-making practices of financial accounts. Acc. Org. Soc. 2018, 64, 44–54. [Google Scholar] [CrossRef] [Green Version]
- Chen, J. The Unity of Science and Economics; Springer Verlag: New York, NY, USA, 2016. [Google Scholar]
- Chen, J.; Galbraith, J.K. A Biophysical Approach to Production Theory. arXiv, 2009; arXiv:0901.2946. Available online: https://arxiv.org/abs/0901.2946(accessed on 25 November 2018).
- Costanza, R.; Herendeen, R.A. Embodied energy and economic value in the United States economy: 1963, 1967 and 1972. Resour. Energy 1984, 6, 129–163. [Google Scholar] [CrossRef]
- Bullard, C.W.; Herendeen, R.A. The energy cost of goods and services. Energy Policy 1975, 3, 268–278. [Google Scholar] [CrossRef]
- Costanza, R.; D’Arge, R.; de Groot, R.; Farber, S.; Grasso, M.; Hannon, B.; Limburg, K.; Naeem, S.; O’Neill, R.V.; Paruelo, J.; et al. The value of the world’ ecosystem services and natural capital. Nature 1997, 387, 253. [Google Scholar] [CrossRef]
- Liu, G.; Yin, X.; Pengue, W.; Benetto, E.; Huisingh, D.; Schnitzer, H.; Wang, Y.; Casazza, M. Environmental accounting: In between raw data and information use for management practices. J. Clean. Prod. 2018, 197, 1056–1068. [Google Scholar] [CrossRef]
- Barrera-Rey, F. The Effects of Vertical Integration on Oil Company Performance; Oxford Institute for Energy Studies: Oxford, UK, 1995. [Google Scholar]
- Makarov V., A. Economic Design Issues and the Development of Oil Fields; NEDRA: SPb, Russian, 2009; p. 196. (In Russian) [Google Scholar]
- The Website of the Main Gas Producing Enterprise of the Republic of Sakha (Yakutia). Available online: http://www.yatec.ru/en/ (accessed on 9 January 2018).
- Energy Units and Calculators Explained. Available online: https://www.eia.gov/energyexplained/index.php?page=about_energy_conversion_calculator (accessed on 28 December 2018).
Figure 1.
Scheme of information streams at the enterprise.

Figure 2.
Scheme of information streams between different types of accounts and analysis.

Figure 3.
Main production phases of energy resources and point of calculation of energy efficiency.

Figure 4.
Dynamics of indicators of ROCS and EROCS.

Figure 5.
Dynamics of indicators of ROFA.

Table 1.
EROI classification.
| No. | Cost Categories | The Calculation Point | ||
|---|---|---|---|---|
| 1. Field | 2. The Plant Processing | 3. At the Last Point of Use | ||
| 1 | Direct materials and energy costs | EROI1,d | EROI2,d | EROI3,d |
| 2 | Indirect materials and energy costs | EROIstnd | EROI2,i | EROI3,i |
| 3 | Indirect labor costs | EROI1,lab | EROI2,lab | EROI3,lab |
| 4 | Support services | EROI1,aux | EROI2,aux | EROI3,aux |
| 5 | Environmental work | EROI1,env | EROI3,env | EROI3,env |
Source: [24].
Table 2.
Descriptions of different stages of oil and gas production.
| Processing Stage | Projects |
|---|---|
| Department of preparation and pumping of oil | Collection and transportation of oil |
| Collection and transportation of associated oil and gas | |
| Technological preparation of oil | |
| Department of base of production service | Service of production wells |
| Service of delivery wells | |
| Capital repairs of production wells | |
| Capital repairs of delivery wells | |
| A rolling repair shop of the operational equipment and power supply, automation of production, steam and water supply, capital and maintenance of wells, research and production works | |
| Department of the maintenance of reservoir pressure | Pumping water or other agents in a layer for the maintenance of reservoir pressure |
| Department of oil and gas production | Geological and technical activities and methods of increasing in oil recovery of layers |
| Extraction of oil on a surface |
Table 3.
Financial and energy indicators of efficiency.
| No | Financial Analysis | Energy Analysis |
|---|---|---|
| 1 | ROCS (Return on cost of sales) | EROCS (Energy return on energy cost of sales) |
| 2 | ROFA (Return on fixed assets) | EROFA (Energy return on fixed assets) |
| 3 | The unit costs of the extraction of hydrocarbons, rub/t (item 1) | The energy efficiency of extraction of hydrocarbons (item 1) |
| 4 | The unit costs of the extraction and preparation of hydrocarbons, rub/t (items 1, 2, 6, 7) | The energy efficiency of the extraction and preparation of hydrocarbons (items 1, 2, 6, 7) |
| 5 | Capital expenditures on exploration and production, rub/t | The energy efficiency capital expenditures in exploration and production |
Table 4.
The converted data and the EROFA value in 2014.
| Name | Weight | The Energy Equivalent of Thousand m3 of Gas |
|---|---|---|
| Production of gas and condensate in 2014, thousand m3 | - | 1801 |
| The mass of fixed assets: | - | - |
| Steel, t | 42,084 | 36,590 |
| Cement, t | 46,310 | 6561 |
| Aluminium, t | 30 | 131 |
| EROFA excluding amortization | - | 42 |
| EROFA including amortization | - | 49 |
Table 5.
Dynamics of the indicators of unit costs and energy efficiency.
| Year | 2005 | 2006 | 2007 | 2008 | 2009 | 2010 | 2011 | 2012 | 2013 | 2014 |
|---|---|---|---|---|---|---|---|---|---|---|
| The cost of extraction, rubles/thousand m3 | 17.2 | 18.8 | 23.3 | 26.9 | 23.5 | 21.5 | 23.8 | 256 | 30.3 | 31.4 |
| Energy extraction efficiency | 1257 | 1277 | 1256 | 1270 | 1294 | 1258 | 1229 | 1298 | 1250 | 1266 |
| The cost of extraction and preparation, rubles/thousand m3 | 35.1 | 39.2 | 46 | 47.4 | 45.8 | 46.4 | 52.5 | 56.4 | 63.6 | 68.5 |
| The energy efficiency of extraction and processing of gas | 170 | 168 | 170 | 198 | 190 | 192 | 193 | 194 | 194 | 197 |
Table 6.
Unit capital cost and energy efficiency capital costs of JSC “YATEC.”
| Name | 2010 | 2011 | 2012 | 2013 | 2014 |
|---|---|---|---|---|---|
| Gas sales, million m3. | 1 607 | 1 590 | 1 664 | 1 685 | 1 702 |
| The total cost, 106 rub. | 68.8 | 183.3 | 150 | 580 | 497 |
| Costs, thousand m3 gas: | - | - | - | - | - |
| Seismic exploration 2-D | - | 30 | 14 | - | 17 |
| Seismic exploration 3-D | - | - | - | 27 | - |
| Drilling | - | - | - | 731 | 751 |
| Workover | 82 | 103 | 153 | 153 | 124 |
| Unit costs, rub/thousand m3 | 43 | 115 | 90 | 344 | 292 |
| Energy efficiency of capital costs | 19502 | 11977 | 9953 | 1850 | 1909 |
© 2019 by the authors. Licensee MDPI, Basel, Switzerland. This article is an open access article distributed under the terms and conditions of the Creative Commons Attribution (CC BY) license (http://creativecommons.org/licenses/by/4.0/).
Share and Cite
MDPI and ACS Style
Yan, J.; Feng, L.; Steblyanskaya, A.; Sokolov, A.; Iskritskaya, N. Creating an Energy Analysis Concept for Oil and Gas Companies: The Case of the Yakutiya Company in Russia. Energies 2019, 12, 268. https://doi.org/10.3390/en12020268
AMA Style
Yan J, Feng L, Steblyanskaya A, Sokolov A, Iskritskaya N. Creating an Energy Analysis Concept for Oil and Gas Companies: The Case of the Yakutiya Company in Russia. Energies. 2019; 12(2):268. https://doi.org/10.3390/en12020268
Chicago/Turabian StyleYan, Jun, Lianyong Feng, Alina Steblyanskaya, Anton Sokolov, and Nataliya Iskritskaya. 2019. "Creating an Energy Analysis Concept for Oil and Gas Companies: The Case of the Yakutiya Company in Russia" Energies 12, no. 2: 268. https://doi.org/10.3390/en12020268
Note that from the first issue of 2016, this journal uses article numbers instead of page numbers. See further details here.