Non-Contact Measurement and Polarity Discrimination-Based Identification Method for Direct Lightning Strokes


1
State Key Laboratory of Power Transmission Equipment & System Security and New Technology, Chongqing University, Chongqing 400044, China
2
Shenzhen Power Supply Co., Ltd., Shenzhen 518000, China
*
Authors to whom correspondence should be addressed.
Energies 2019, 12(2), 263; https://doi.org/10.3390/en12020263
Submission received: 13 December 2018
/
Revised: 5 January 2019
/
Accepted: 9 January 2019
/
Published: 15 January 2019
(This article belongs to the Section F: Electrical Engineering)
Abstract
:Direct lightning strokes account for a large proportion of line faults. Lightning faults can be classified into several kinds, and the corresponding protection methods differ. The type of these lightning faults should be identified to establish targeted measures against lightning and improve lightning protection design. In this study, a non-contact multi-physical parameter lightning monitoring system is proposed. The voltage of the insulator string and the lightning grounding current of the transmission tower are chosen as two physical parameters to show the characteristic quantities of different lightning stroke types. These physical parameters are captured using a non-contact overvoltage sensor installed at the cross arm of the tower and several parallel Rogowski coils installed at the tower ground supports. An equivalent electromagnetic transient model of a 110 kV transmission line is developed to identify features of the signals under different lightning strokes. Based on time-domain and wavelet transform modulus maxima (WTMM) analyses, the polarity of insulator voltage, the polarity of tower current, and the mutation polarity of tower current when insulators flashover are extracted as characteristic quantities of polarity discrimination. Six kinds of direct lightning strokes can be identified based on the polarity discrimination method considering the lightning stroke point and the lightning current polarity. The identification method is verified by simulation data and application to an actual example.
1. Introduction
Power transmission lines are an important part of a power system. Operating experience and statistical data show that direct strokes account for a large proportion of line faults [1,2,3,4]. Thus, enhancing lightning protection for power transmission lines is highly significant for the safety and stability of a power system. Direct strokes can be classified into two kinds, namely, shielding failure and back flashover. These stroke faults have distinct mechanisms, development rules, and waveform characteristics. Different protection methods should be used according to the type of the lightning stroke fault. These stroke faults should be identified to efficiently adopt targeted measures against lightning and improve lightning protection design [5,6,7,8,9,10].
In engineering, lightning faults are identified mainly through the lightning current amplitude obtained from lightning location systems and the insulator situations observed by engineers. However, location error and misjudgment usually happen owing to the restricted precision of the system and different knowledge of engineers. Many researchers have looked into the identification of different lightning stroke faults. Zhou et al. [11] identified lightning stroke faults through Rogowski coils installed on the brackets of grounding lines and insulator strings. The magnitude of lightning current in the insulator strings and brackets of grounding lines varied under different lightning stroke types. Hence, shielding failure and back flashover were observed. Okabe et al. [12] used a high-speed camera to record the lightning stroke process. The lightning stroke point and situation of insulator string observed by the camera were used to identify different lightning stroke faults. Sima et al. [13,14] used a transformer bushing tap sensor to capture lightning overvoltage signals. Mathematical methods such as the wavelet energy spectrum matrix similarity degree, polarity of maxima modulus, and morphological pattern spectrums were employed to extract the feature parameters of different lightning stroke faults. Hence, different lightning stroke faults can be identified based on their feature parameters. However, for the methods mentioned above, only one physical parameter (i.e., lightning current, lightning voltage, or lightning image) was adopted to extract the feature parameters of a lightning stroke, thereby lacking comprehensiveness in describing the process of lightning stroke and failing to show the relation between lightning overvoltage and lightning current when a lightning stroke occurred. A power system should not be energized when monitoring facilities such as Rogowski coils or high-speed cameras are installed, which reduces the reliability of power supply. The lightning overvoltage data analyzed by Sima were obtained from substations and not from transmission lines. The waveforms were easily affected by the multi-reflection between the busbars and impulse corona and can no longer be adjusted for identification.
To address such limitations, this study proposes a non-contact multi-physical parameter acquisition method to identify different lightning stroke faults. The relation between lightning overvoltage and lightning current can be clearly determined, and the power system can be energized during the installation of the monitoring facilities. The voltage of the insulator string and the grounding current of the transmission tower are chosen as two physical parameters to show the characteristic quantities of different lightning stroke types. These physical parameters are captured using a capacitive coupling overvoltage sensor installed at the cross arm of the tower and four parallel Rogowski coils installed at the tower ground supports. Based on time-domain theory and wavelet transform modulus maxima (WTMM) theory, the polarity of insulator voltage, the polarity of tower current, and the mutation polarity of tower current during the insulators flashover construct the characteristic parameters for polarity discrimination. The proposed method extracts only the polarity characteristics of the signal and does not depend on the detailed features of the lightning surge wave front. The algorithm is simple and intuitive, with the strong anti-interference capability and low misjudgment rate. The identification method is verified by simulation data and is applied to an actual example.
2. Configuration of the Non-Contact Lighting Monitoring System
2.1. Non-Contact Overvoltage Sensor
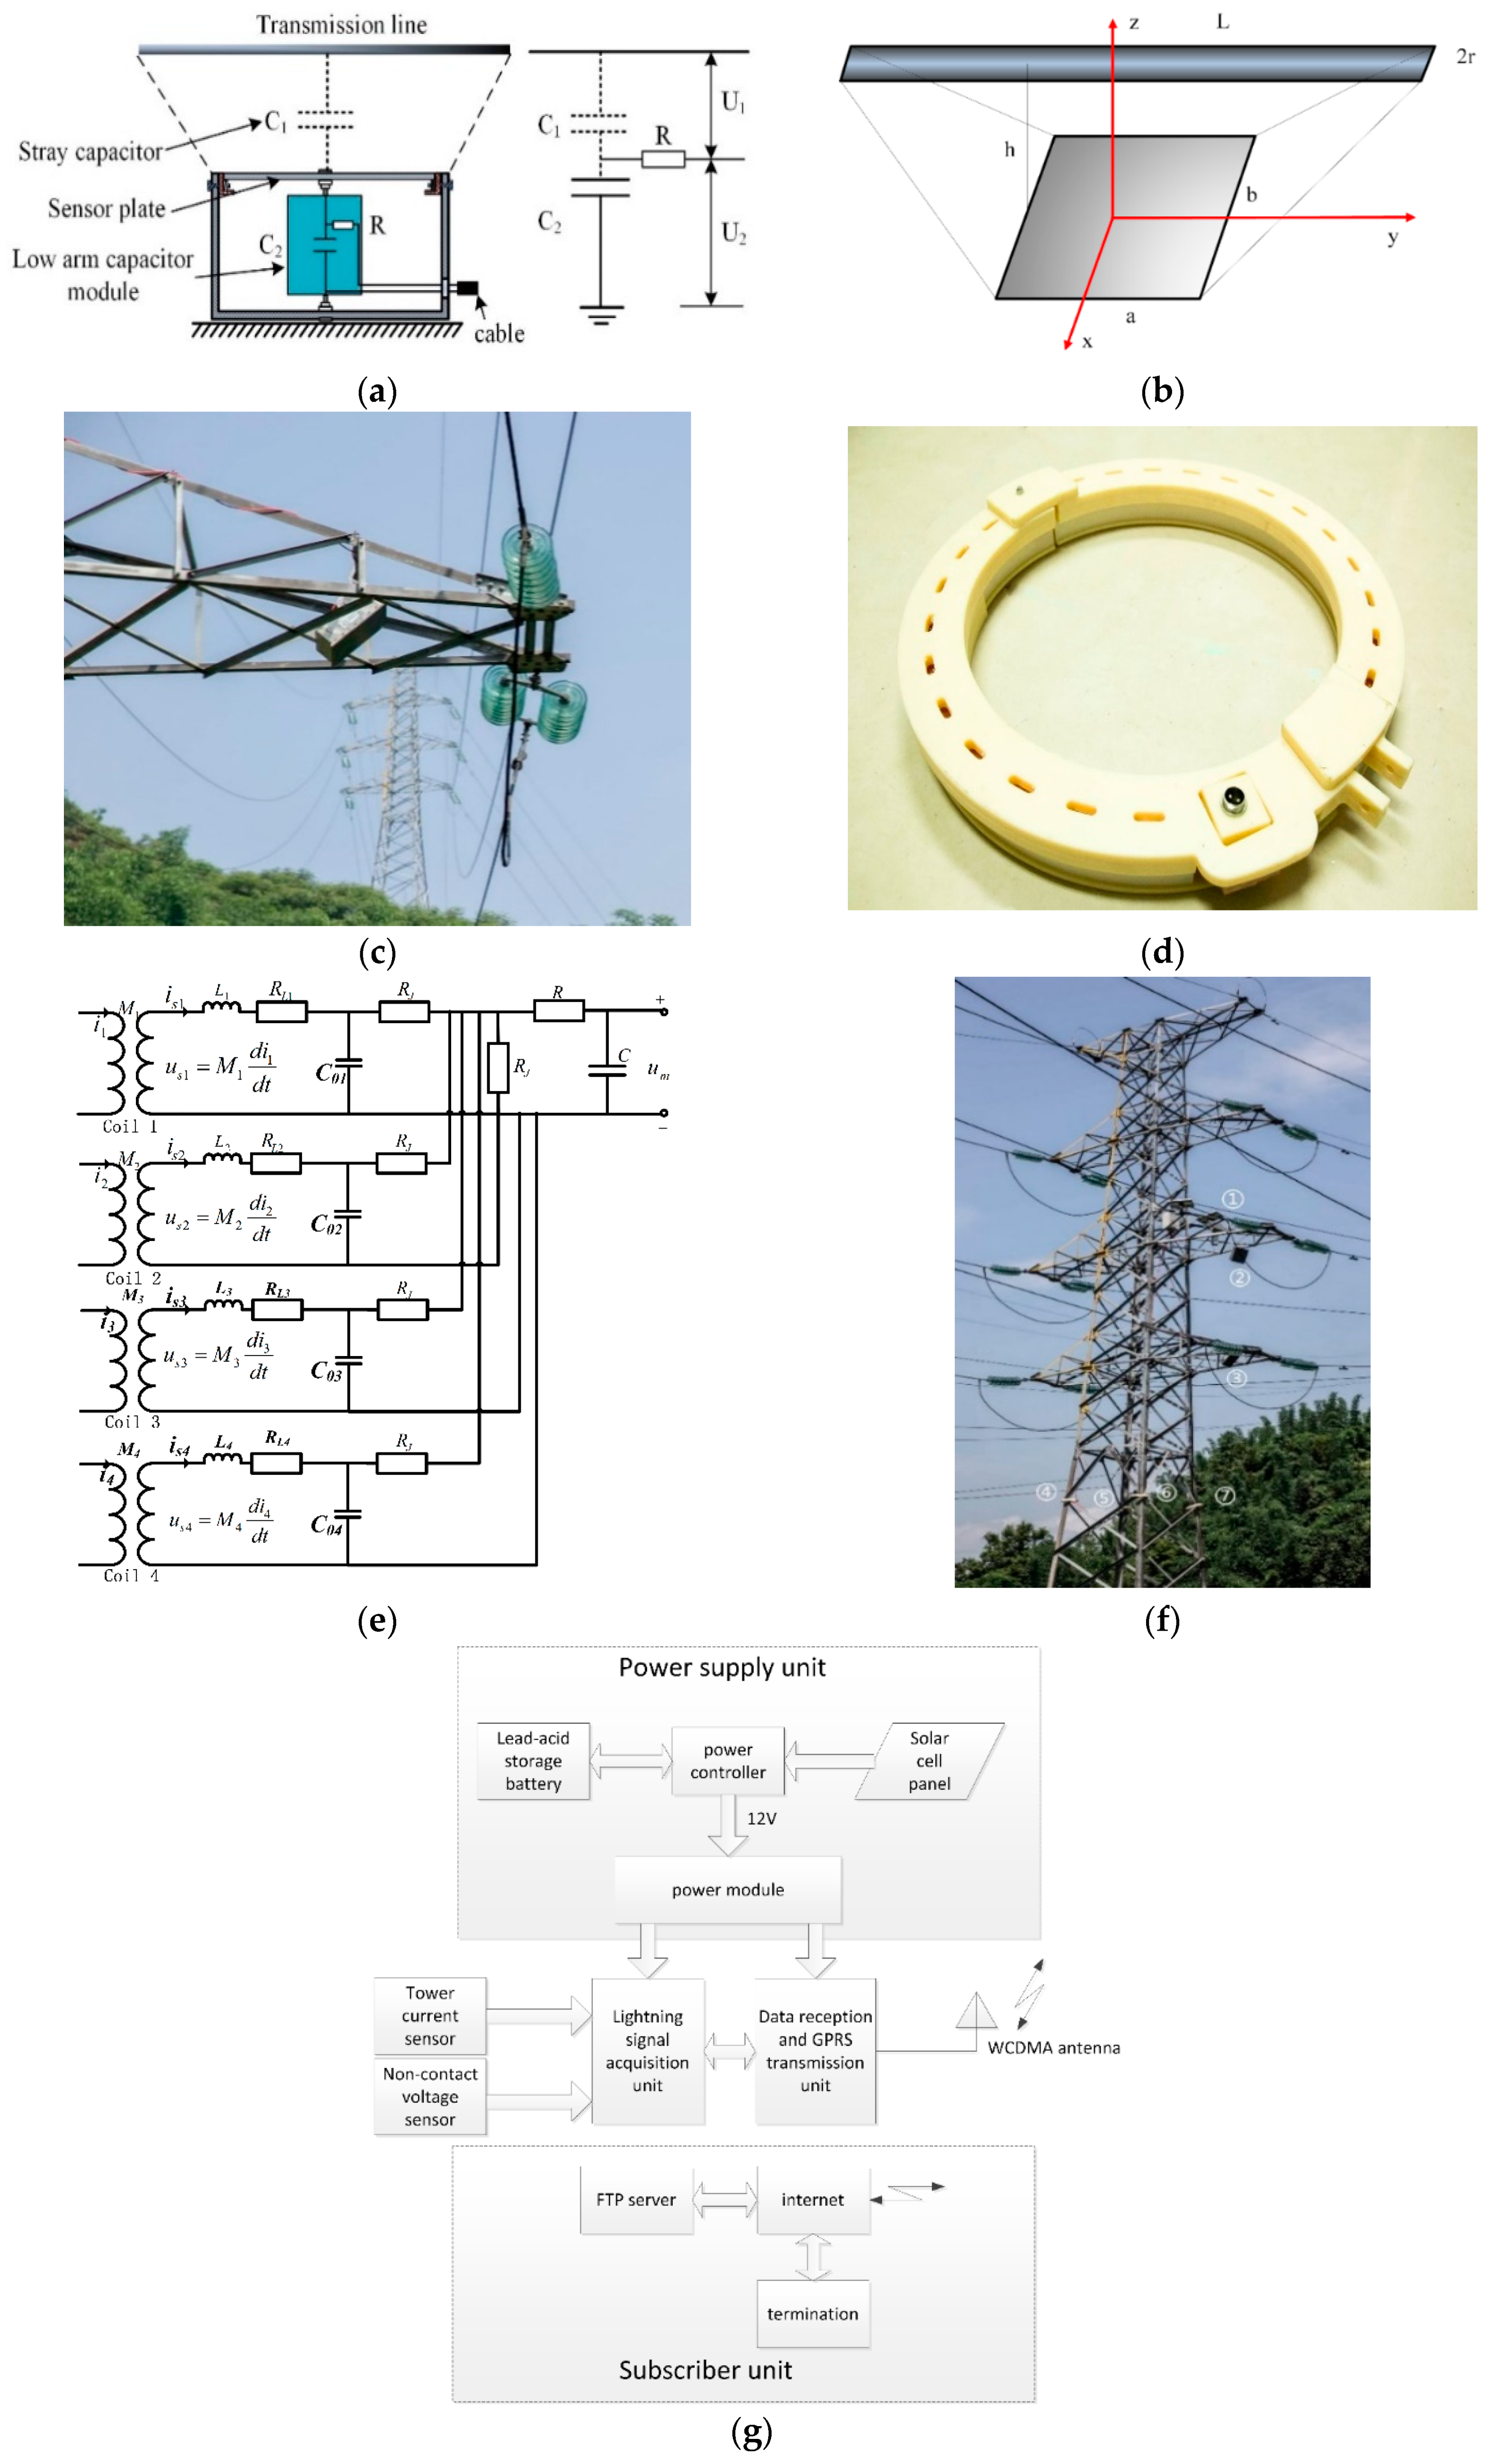
The non-contact overvoltage sensor uses the stray capacitance C1 between the overhead transmission line and the sensor board as a high-voltage arm capacitor [15,16,17,18,19,20]. A capacitor is connected as a low-voltage arm capacitor. The overvoltage signal passes through the matching resistor and is then transmitted along the coaxial cable to the data acquisition system (Figure 1a). The divider ratio is expressed as
where C1 is the high-voltage arm, C2 is the low-voltage arm, and k is the divider ratio. The value of C1 can be estimated by the following equation:
where r is the radius of the transmission line, l is the length of the transmission line, a is the length of the sensor plate, b is the width of the sensor plate, and h is the maximum distance between the sensor plate and the transmission line (Figure 1b). Figure 1c shows the installation of the overvoltage sensor.
2.2. Tower Current Sensor
The tower current sensor consists of four parallel Rogowski coils installed on the tower ground supports to recover the initial tower current. The external-integral way is applied to efficiently reflect the high-frequency transient tower current. Figure 1d shows the structure of the tower current sensor. Figure 1e shows the circuit model of the multi-parallel external integral coils. The upper cutoff frequency fh, lower cutoff frequency fl, and input–output relations of the circuit are shown as follows:
where RJ is the damping resistance, L1 is the self-inductance of coil 1, C01 is the distributed capacitance of coil 1, RL1 is the inner resistance of coil 1 and M1 is the mutual inductance between the tower ground support and coil 1.
The setup shown above indicates that the output of sensor um is linearly related to the input of four tower current i and that compared with a single Rogowski coil, the multi-parallel external integral coils have a wider bandwidth and can measure the lightning current of higher amplitude.
2.3. Field Installation
Figure 1f shows the field installation of the system. ①, ②, and ③ are the non-contact overvoltage sensors of phases A, B, and C, respectively, and ④, ⑤, ⑥, and ⑦ are the four parallel Rogowski coils. Figure 1g illustrates the component of the system. The system contains five parts, namely the sensor unit, the lightning signal acquisition unit, the data reception and general packet radio service (GPRS) transmission unit, the power supply unit and the subscriber unit. The sensor unit contains four current sensors and three voltage sensors to record signals of the insulator string and the tower current. Lightning signal acquisition unit is used to acquire the lightning information and translate them into digital data. Data reception and GPRS transmission unit is used to achieve the function of wireless data communication through the wideband code division multiple access (WCDMA) antenna. Via the internet, termination and the file transfer protocol server (FTP) server can exchange the acquired data wirelessly. Power supply unit consists of three parts: lead-acid storage battery, power controller, and solar-cell panel. Under the strong sunshine, solar-cell panel can translate the solar power into the electrical power. On one hand, it can supply electrical power to the lightning signal acquisition unit, data reception and GPRS transmission unit. On the other hand, it can charge the lead-acid storage battery for lack of sunshine. The whole process is controlled by the power controller based on the selected mode by users.
3. Feature Analysis of Different Lightning Stroke Types
3.1. Simulation Model of a 110 kV Transmission Line
A 110 kV transmission line model is established based on electromagnetic transient program-alternative transient program (EMTP-ATP) software to simulate different direct stroke faults. The simulation model is composed of five parts, namely, the lightning source, the tower, the insulator, the transmission line, and the corona model. According to the field-acquired lightning current data [8], 1.2/50 is a standard lighting voltage impulse (SLVI) as defined by the international electro technical commission (IEC) 60060-1. A surge waveform of 1.2/50 or 2.6/50 can be used to simulate the direct stroke.
Statistical data show that 75%–90% of lightning discharges are negative [21]. Thus, negative lightning current is taken as an example for analysis in this study. The peak of the lightning current source is 15 kA or 6 kA for the situations of direct lightning strokes to a phase conductor with or without flashover, and 60 kA or 30 kA for the situations of direct lightning strokes to the top of the tower or the shield wire with or without back flashover. The wave impedance of the lightning channel is 300 Ω [22]. The insulator uses the leader progression model [23], and its ±U50% is 800 kV.
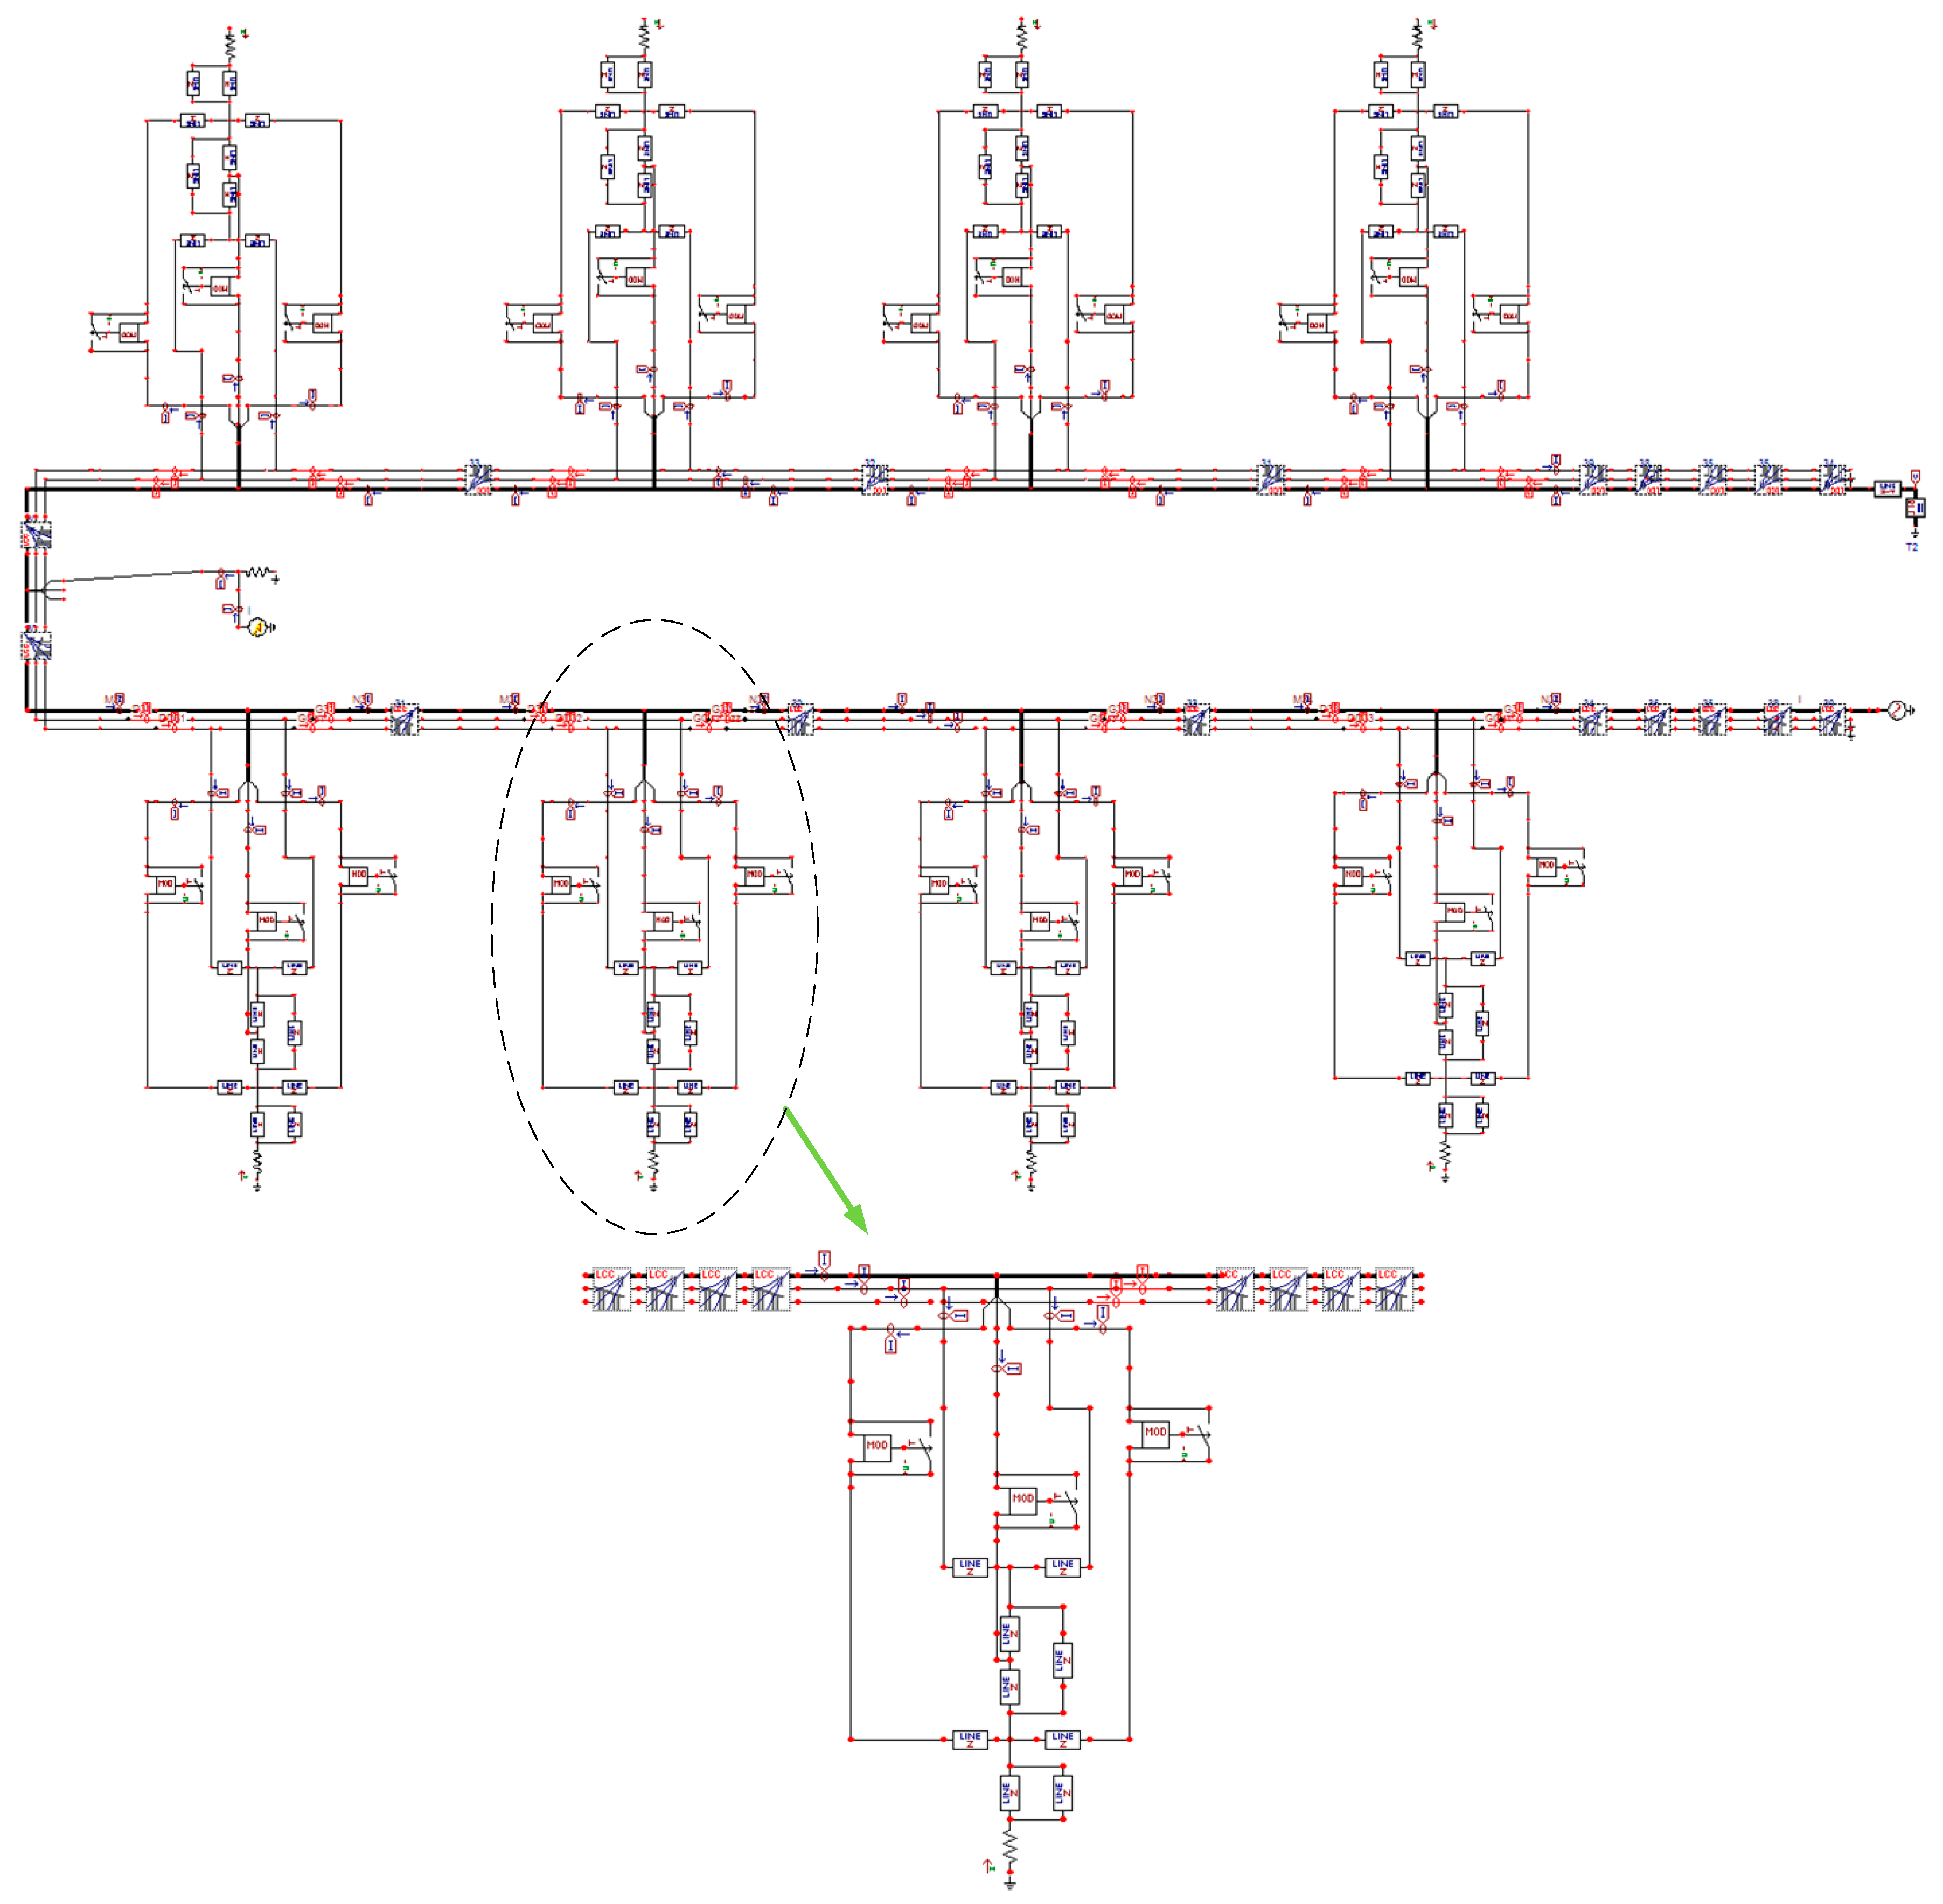
The multi-wave impedance model is constructed to simulate the transmission tower according to the actual size provided by the state grid of China [24,25]. The impulse grounding resistance is set as 5 Ω or 10 Ω when lightning strokes to a phase conductor and 10 Ω or 20 Ω when lightning strokes to the top of the tower or the shield wire. The J. Marti model is used to simulate the transmission line considering the frequency-dependent characteristic [26]. The whole line is 10-km long. A total of 30 110 kV towers are erected, 350 m apart from one another. The whole line (LGJ–240) is protected by two shield wires (GJ–50). The corona model is composed of an additional capacitor, a direct current (DC) voltage source, and a unilateral diode according to the literature [27]. For the positive lightning current, the additional capacitance is 0.65C0, whereas the capacitance is 0.4C0 for negative lightning current, where C0 is the geometric capacitance of the transmission line. The schematic diagram of the EMTP model is shown in Figure 2.
Observation points are set at reference tower A to observe the waveform of the insulator voltage and the tower current under eight different situations: lightning strokes to a phase conductor of the reference tower A or nearby towers B or C with or without flashover; lightning strokes to the top of the reference tower A or nearby towers B or C with or without back flashover (Figure 3a). Figure 3b,c demonstrate the reference direction: the potential difference of insulator strings Uins from the wire to the tower is positive; the tower current Ig from the earth to the tower is positive.
3.2. Simulation for Lightning Strokes to the Top of the Tower
The observation point is located at the reference tower A. The peaks of the lightning current source are 60 and 30 kA for the simulation of lightning strokes to the top of the reference tower A or nearby towers B or C with or without back flashover (Figure 3a ①, ③), respectively. Figure 4, Figure 5, Figure 6 and Figure 7 illustrate the simulation results of insulator voltage Uins and tower current Ig at the observation point.
3.2.1. Lightning Strokes to the Top of the Reference Tower A
Figure 4a shows the situation before back flashover, Uins > 0. Because in the early stage of the main discharge, lightning current is small, and the positively induced voltage Ui on the phase conductor is greater than the negative coupling voltage kUtower. Utower is the potential of the tower top. The phase conductor potential Uconductor = Ui − kUtower is positive. In addition, the absolute value of the cross arm potential Uarm is significantly higher than that of the phase conductor Uconductor because most of the lightning currents pass through the tower to the ground. Uins = Uconductor − Uarm > 0.
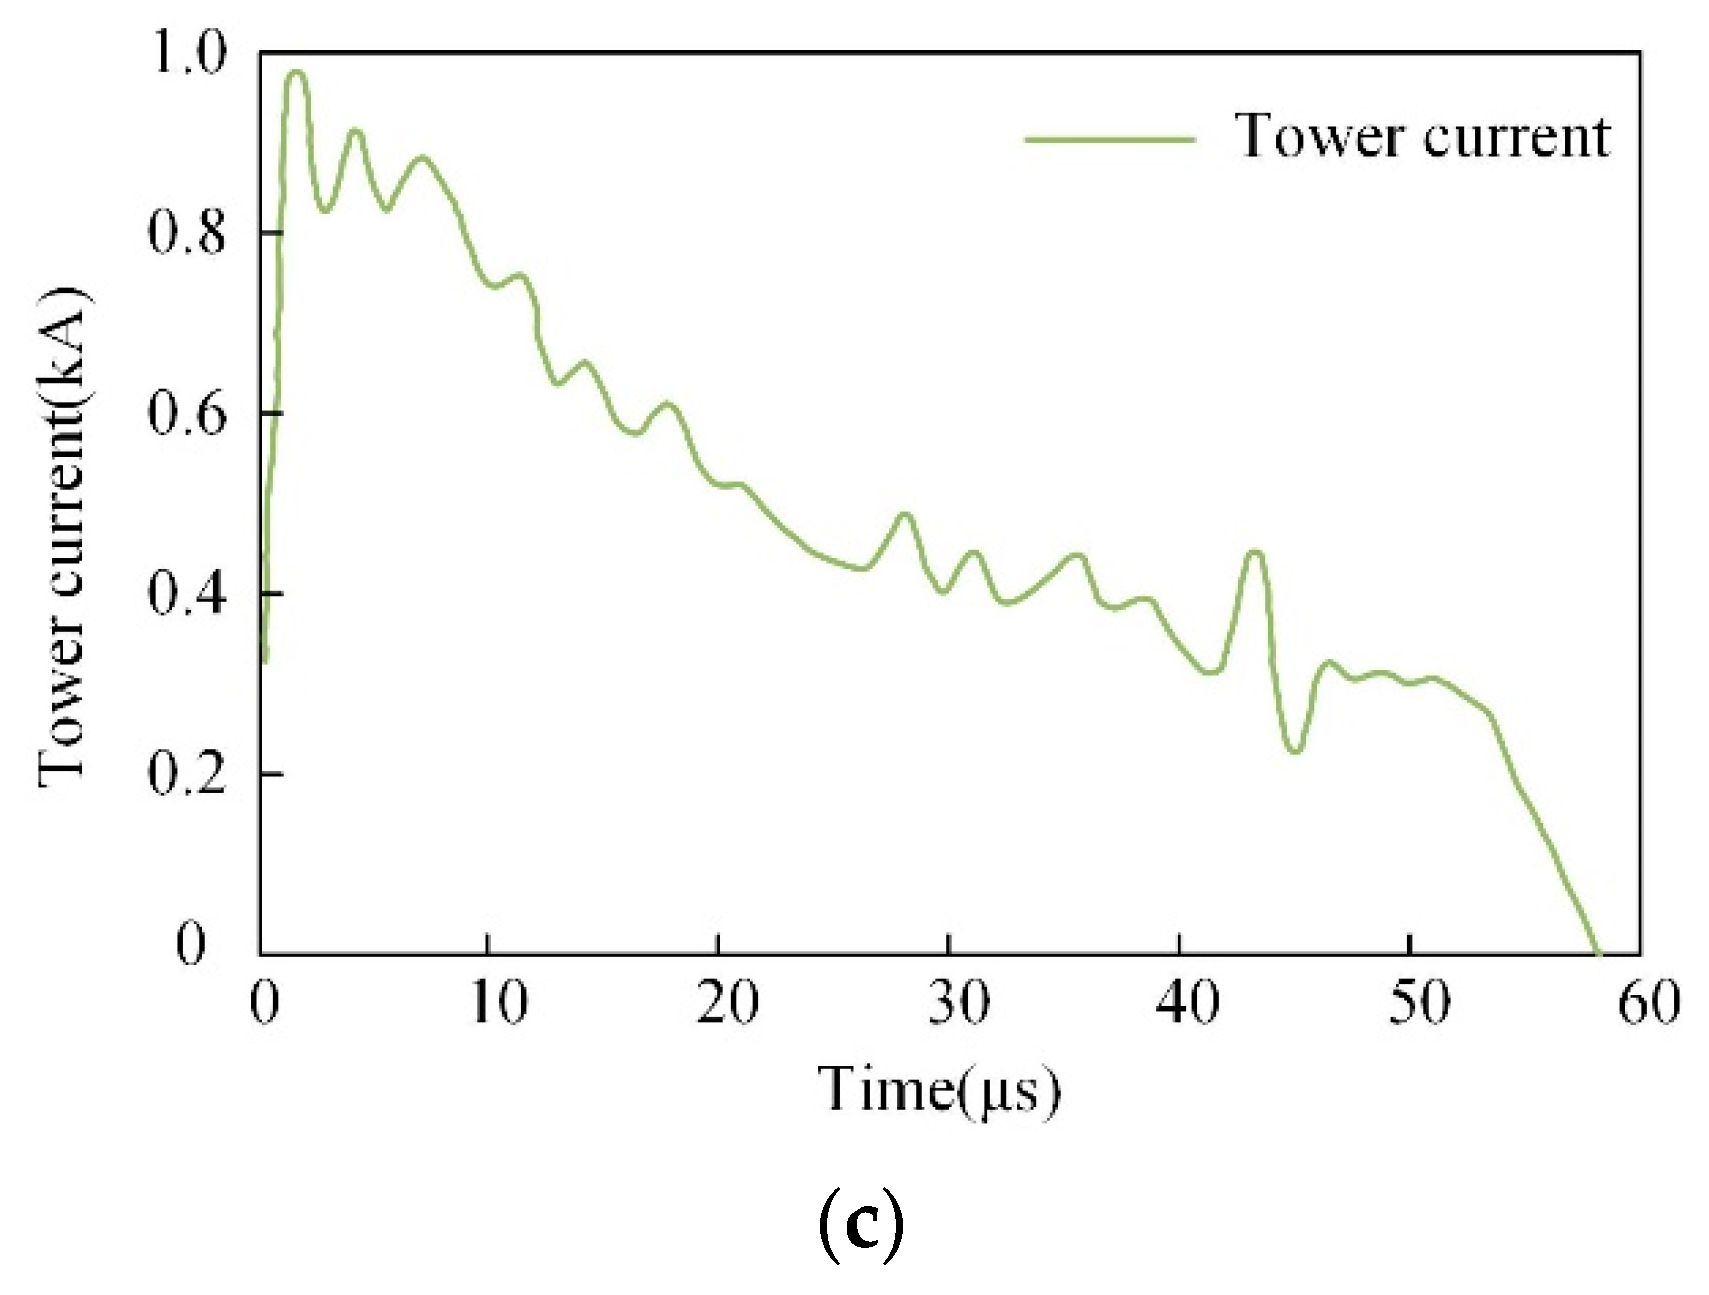
Figure 5a shows the situation when back flashover happens, the potential difference of the insulator string is decreased to 0, whereas the conductor and cross arm potentials remain the same, Uins becomes zero, and Ig has a markedly negative polarity change (Figure 4b) because, after flashover, a part of the lightning current spreads along the phase conductor instead of the tower. Tower current exists from the moment lightning strokes to the top of the tower to the end, and its direction remains the same, that is, Ig > 0. (Figure 4b and Figure 5b).
3.2.2. Lightning Strokes to the Top of Nearby Tower B or C
Figure 6a shows the situation of lightning strokes to the top of nearby tower without back flashover. Before lightning travels to the reference tower, Uins of tower A is the power frequency voltage. When lightning travels to the reference tower, Uins has a slightly positive change because of the increase of the cross arm potential caused by the lightning current flowing through tower A to the ground, that is, Uins > 0. The oscillator in the wave tail is caused by reflection and refraction when traveling along the phase conductor. The tower current remains positive throughout the entire process, and the wave-head time is lengthened because of the travel process from the nearby tower to the reference tower (Figure 6b).
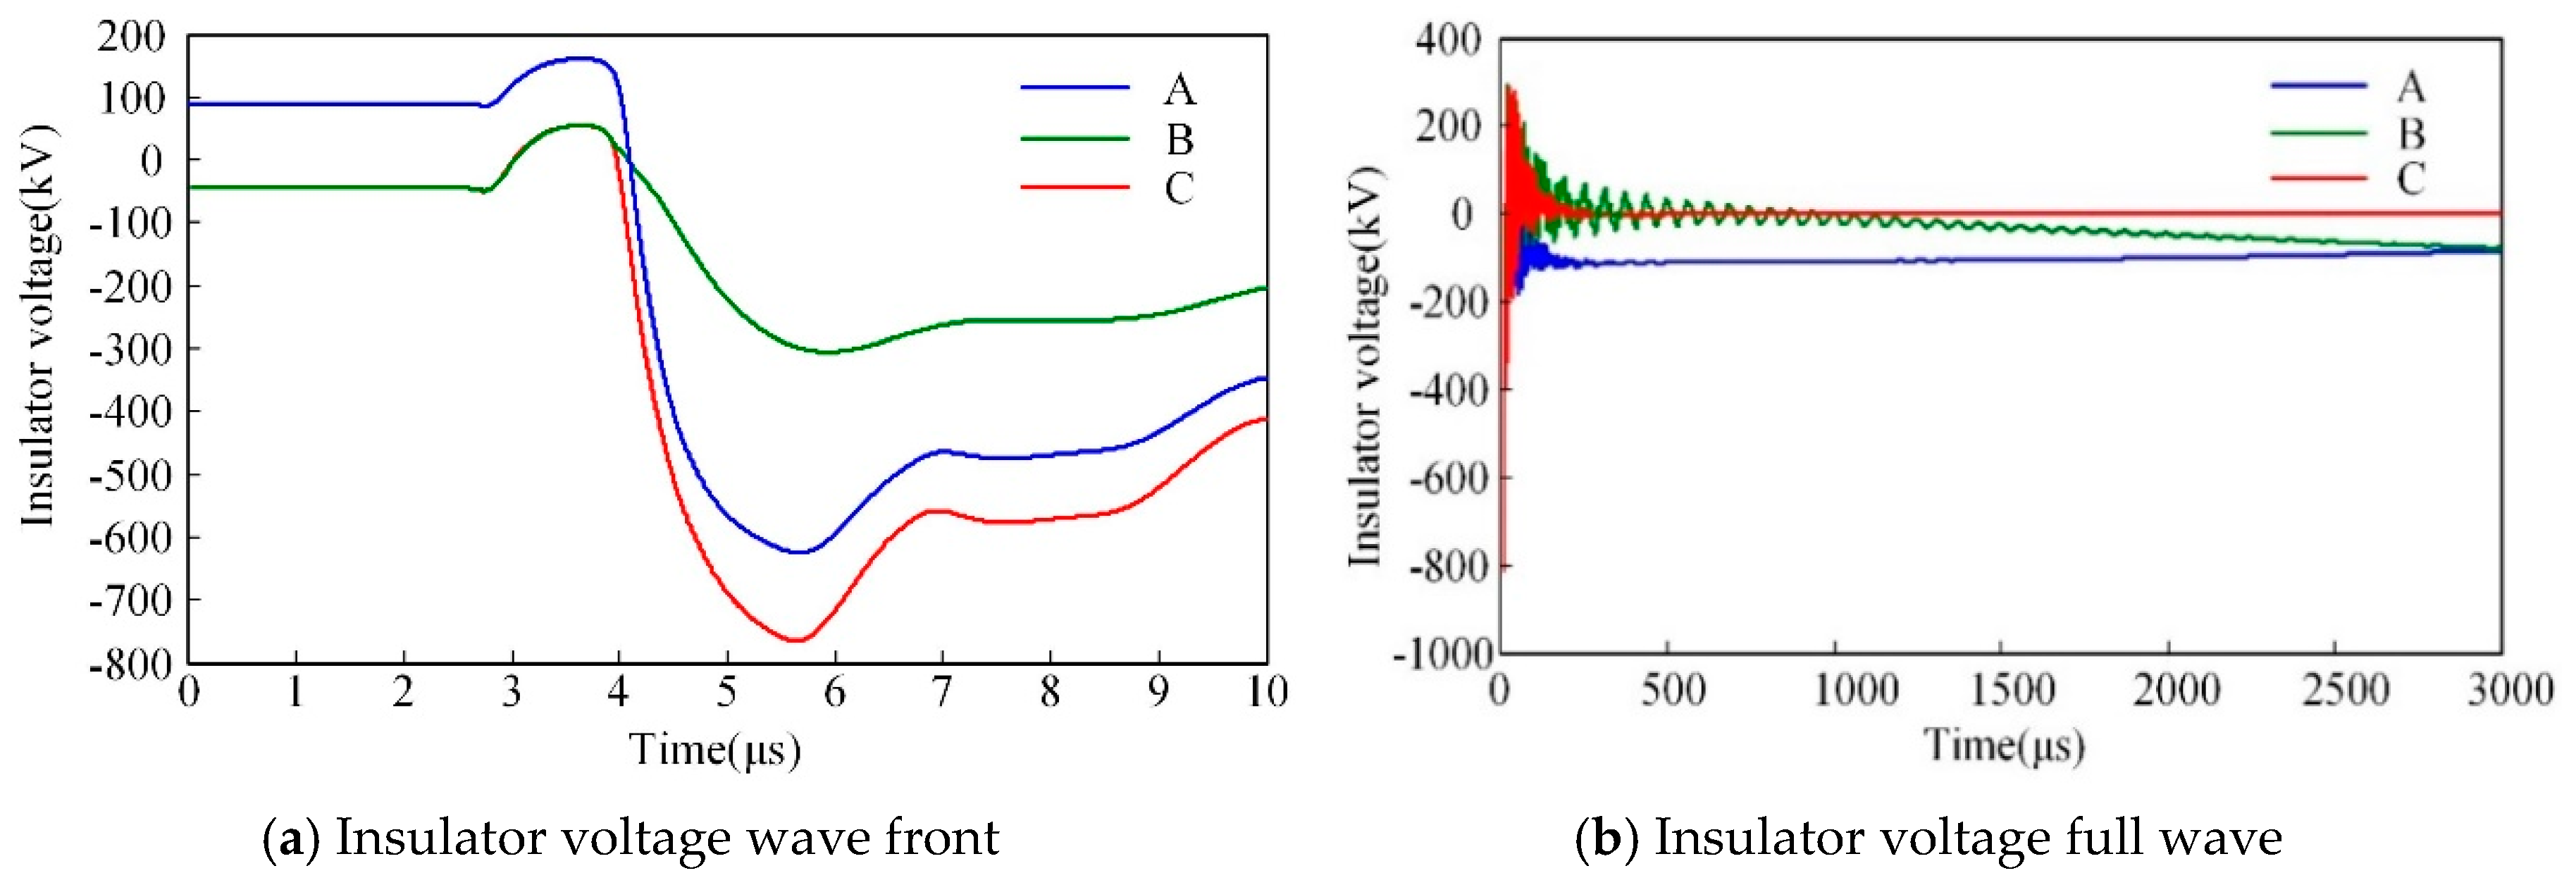
Figure 7a shows the situation of lightning strokes to the top of nearby tower with back flashover. Before back flashover, Uins > 0, whereas after back flashover, Uins < 0 and finally drops to zero when the lightning transient process ends. This phenomenon happens because before back flashover, the lightning current flows through tower A to the ground, increasing the absolute value of cross arm potential. The phase conductor is filled with coupling current, and its amplitude is significantly lower than the current flowing through tower A, that is, Uins > 0. When back flashover happens, lightning current disembogues into the phase conductor directly and flows toward tower A, thereby increasing the absolute value of phase conductor potential and changing the insulator voltage of tower A, that is, Uins < 0. After back flashover, Uins of tower B becomes zero, and the potentials of the phase conductors and shield wires become equal. When the transient process is over (about 1 ms, as shown in Figure 7b), Uins of tower A becomes zero as well because towers A and B are connected to the phase conductors and shield wires. In such conditions, Ig remains positive.
3.3. Simulation for Lightning Strokes to a Phase Conductor
The observation point is located at the reference tower A. The peaks of the lightning current source are 15 and 6 kA for the simulation of lightning strokes to a phase conductor of the reference tower A or nearby towers B or C with or without flashover, respectively (Figure 3a ②, ④). Figure 8, Figure 9, Figure 10 illustrate the simulation results of insulator voltage Uins and tower current Ig at the observation point.
3.3.1. Lightning Strokes to a Phase Conductor of the Reference Tower A
In Figure 8a, lightning strokes to a phase conductor of the reference tower A, and the absolute value of the phase conductor potential Uconductor increases sharply at the striking moment. The coupling current in the shield wire causes a voltage drop when it goes through the tower to the ground; the potential of cross arm Uarm has the same polarity as the lightning current. In general cases, the coupling coefficient between the phase conductor and the shield wire is approximately 0.2, and the coupling current is significantly smaller than the lightning current. In this case, the absolute value of cross arm potential Uarm is significantly smaller than that of phase conductor potential Uconductor, that is, Uins < 0.
Figure 9a shows that before flashover, Uins < 0 but drops to zero when flashover occurs. The tower current increases significantly after flashover because, before this event occurs, the tower current is a coupling current but eventually turns into a lightning current. Regarding a negative lightning stroke, Ig > 0 (Figure 8b and Figure 9b).
3.3.2. Lightning Strokes to the A Phase Conductor of Nearby Towers B or C
Figure 10a,b show that the waveforms of Uins and Ig are similar to those in the case when lightning strokes to the phase conductor of the reference tower, that is Uins < 0 and Ig > 0. After the lightning transient process, the Uins of tower A declines to zero (Figure 10b). It is because, after the lightning transient, the average lightning wavelength is only nearly 50 μs, the relay protection device is not in operation, and the power frequency current still flows through the tower. Power frequency current has a small amplitude and equivalent frequency and therefore produces a small voltage drop when it flows through the tower. Thus, the cross arm and tower top can be considered to have the same potential, indicating that the phase conductor and the shield wire approximately have the same potential. The reference tower is connected to the flashover tower by the phase conductor and shield wire. As such, the potentials of these wires are approximately the same, that is, Uins ≈ 0.
4. Feature Extraction and Identification of Lightning Stroke Types Based on the Polarity Discrimination Method
4.1. Feature Extraction and Identification of Lightning Stroke Types Based on Time-Domain Analysis
According to the analysis explained in the preceding paragraphs, when the negative lightning stroke happens, the following features can be obtained:
- (1)
- When lightning strokes to the top of the tower, Uins > 0 and Ig > 0; when lightning strokes to the phase conductor, Uins < 0 and Ig > 0.
- (2)
- When lightning strokes to the top of the reference tower with back flashover, the tower current has a negative polarity change; when lightning strokes to a phase conductor of the reference tower with flashover, the tower current has a positive polarity change.
- (3)
- When lightning strokes to the top of nearby tower, the Uins of the reference tower is positive before the insulator flashovers, whereas the Uins of the reference tower is negative after the insulator flashovers.
- (4)
- When lightning strokes to the top of reference tower, Uins = 0 when the insulator flashovers. When lightning strokes to the top of nearby tower with back flashover, the Uins of the reference tower becomes zero when the transient process ends.
These features collectively illustrate that lightning faults can be recognized through the polarities of Uins and Ig. Through calculating the r.m.s of Uins of three phase conductors with a 10 μs calculating length of data since lightning strokes occurred, the maximum r.m.s of Uins called Up is chosen as the study object. The polarity of the area constituted by Up and t-axis (time) represents the polarity of Up:
In Label (7), N is the number of sampling points.
The length of Up is 10 μs, which occupies only 0.5‰ of the power frequency period (20 ms). Hence, the power frequency voltage can be considered constant during the time. To eliminate the influence of initial power frequency voltage on the judgment of polarity, the area calculation can be simplified by moving Up along the y-axis until its initial value becomes zero.
To avoid the influence of the reflection of traveling waves, the computation interval chooses the moment after the lightning strokes happen to 1.5 μs. The trapezoidal method is used to compute the area constituted by Uins and t-axis, namely, S1.5. Similarly, in choosing 1.5 μs to 5 μs after lightning strokes happen as the computation interval, the area constituted by Uins and the t-axis can be obtained by the same manner, namely, S5.
Parameter Di is used to reflect the polarity of Uins within the time interval [0, 1.5 μs]. If S1.5 > 0, then Uins > 0 and Di = +1, and, if S1.5 < 0, then Uins < 0 and Di = −1. Parameter Di5 is used to reflect the polarity of Uins within the time interval [1.5 μs, 5 μs]. If S5 > 0, then Uins > 0 and Di5 = +1, and, if S5 < 0, then Uins < 0 and Di5 = −1.
For the tower current, the moment after the lightning strokes happen to 20 μs is selected as the computation interval, and the trapezoidal method is used to compute the area constituted by Ig and the t-axis, namely, S20. Parameter Dt is used to reflect the polarity of Ig. Within the time interval [0, 20 μs], if S20 > 0, then Ig > 0, and Dt = +1; if S20 < 0, then Ig < 0 and Dt = −1. Dt and Di are multiplied together, and parameter D = Di·Dt can be used to identify different lightning stroke types under positive or negative lightning strokes. The values of D and the identification results are shown in Table 1.
Table 1 shows that the value of D can help distinguish the position of the lightning stroke; if lightning strokes to the top of the tower, then D = +1; if lightning strokes to a phase conductor, then D = −1.
The analysis shown in Figure 7a implies that when lightning strokes to the top of a nearby tower with back flashover, the polarity of Uins is altered, and Di·Di5 < 0; hence, this lightning stroke type can be recognized.
When the insulator of the reference tower flashovers, Uins rapidly decreases to zero, that is, Uins = 0. When the insulator of the nearby tower flashovers, the Uins of the reference tower becomes zero as well after the transient process. Before the relay protection device cuts off the fault, the feature showing that Uins of the reference tower becomes zero can still be observed after the transient process because the fastest action time of relay protection device is approximately 20 ms [28], and the wavelength of lightning current is 20–100 μs.
Choosing 5 μs to 100 μs and 1 ms to 1.5 ms after lightning strokes happen as the computation interval, the minimum r.m.s of Uins of each phase is calculated, namely, U5us and U1.5ms, respectively. U5us and U1.5ms are calculated as follows:
The simulation results show that, after the insulator flashovers, U5us < 0.05 and U1.5ms < 0.05. Thus, the threshold value Uthres is set as 0.05, therefore, whether the insulator flashovers can be recognized by these features.
4.2. Feature Extraction and Identification of Lightning Stroke Types Based on WTMM Analysis
Based on the analysis cited in part 3, when the lightning stroke point is located in the reference tower area, the following characteristics can be obtained:
- (1)
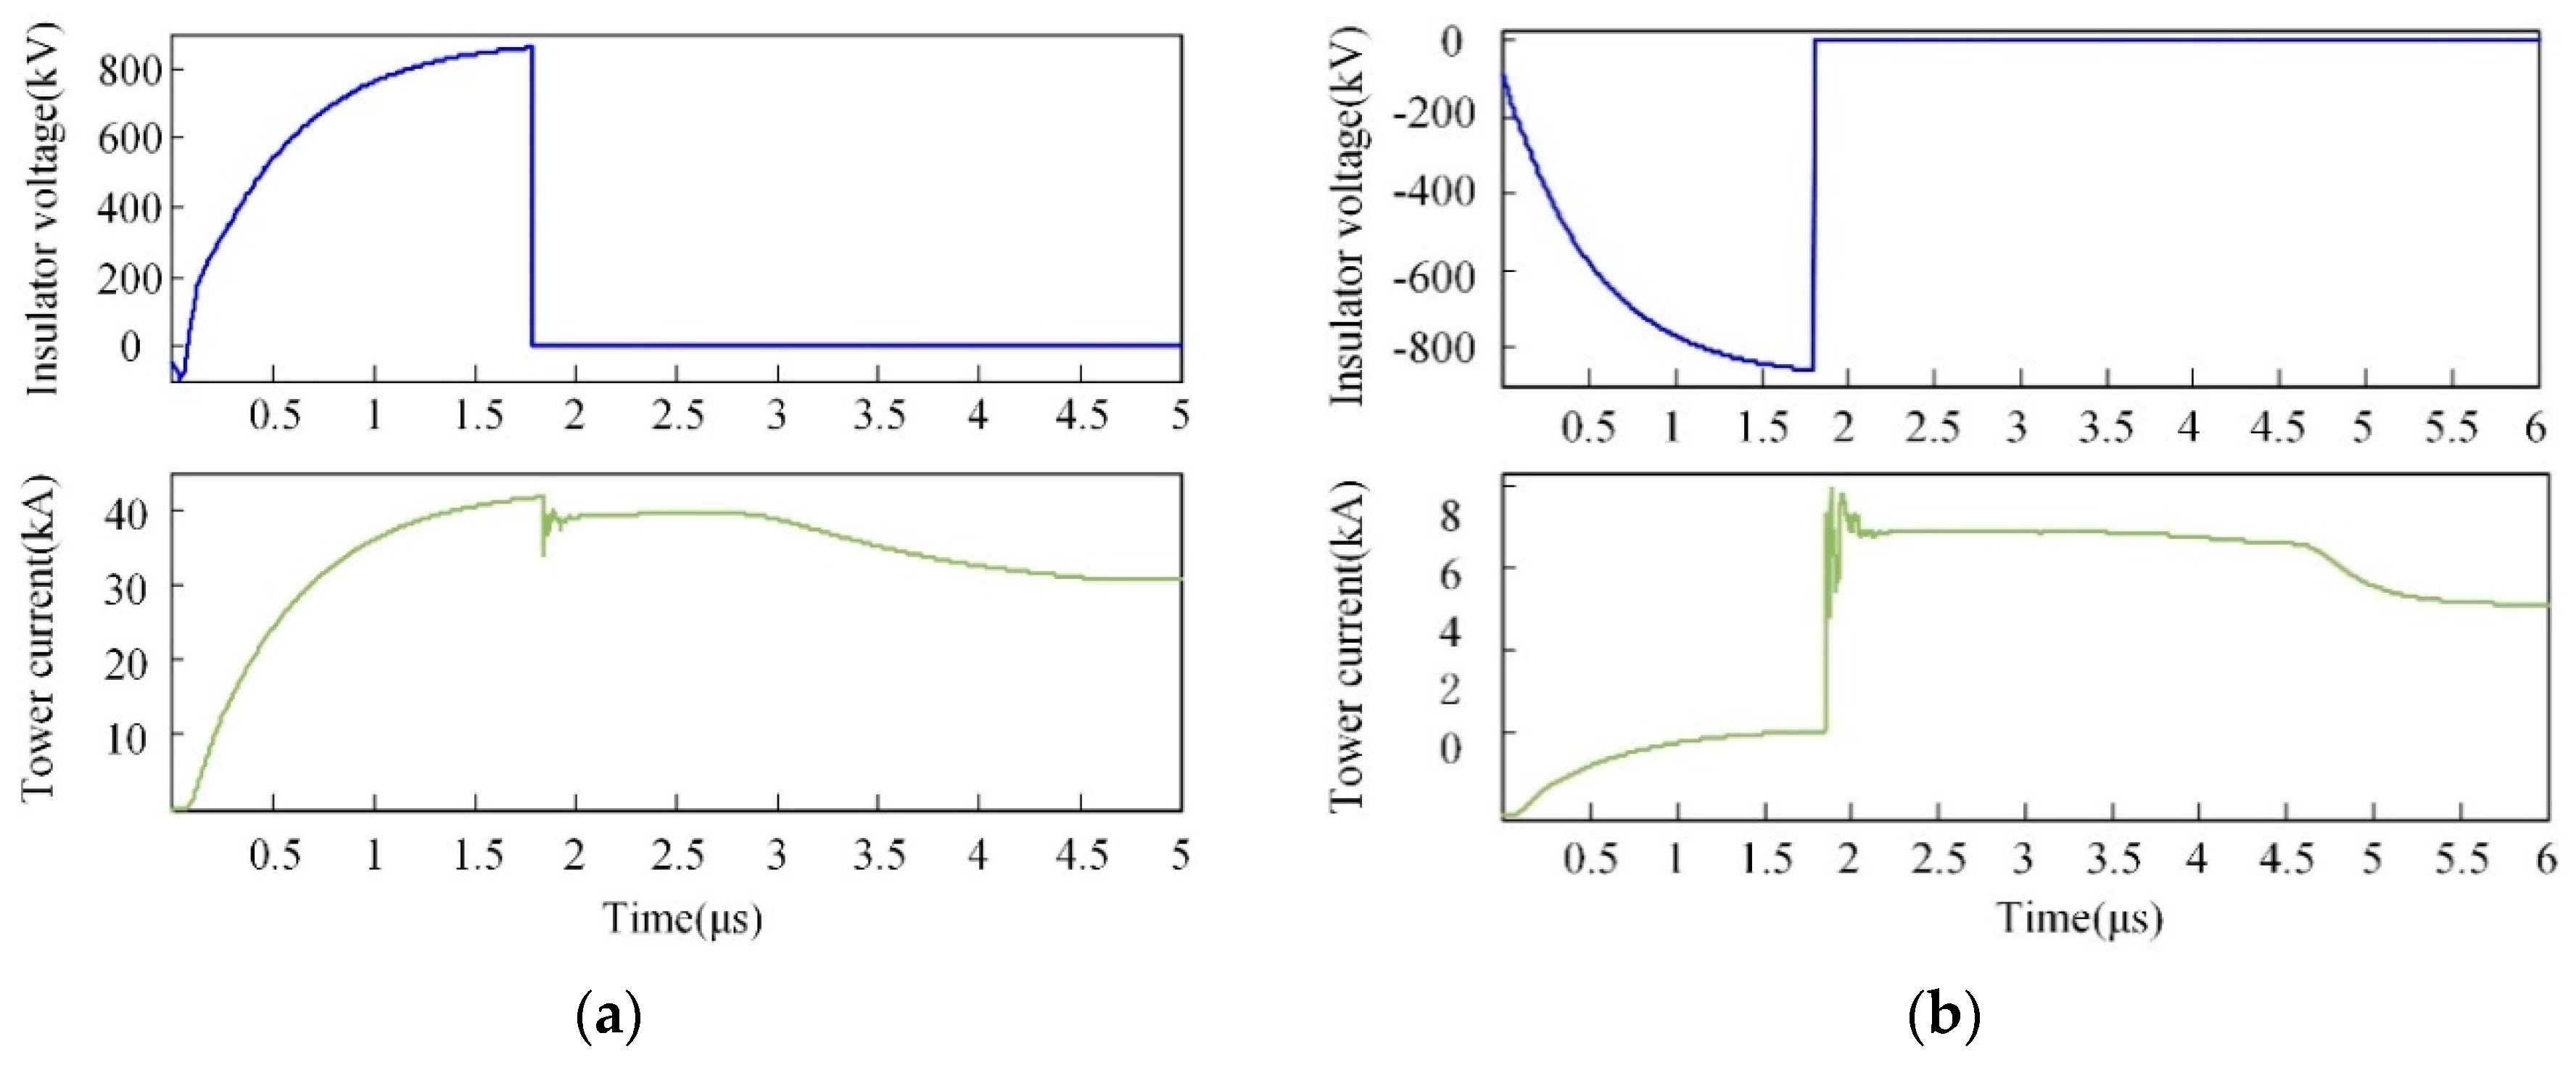
- When lightning strokes to the top of the reference tower with back flashover, lightning current discharges from the tower to the phase conductors, and the tower current sharply declines because of the shunting effect of the phase conductors (Figure 11a).
- (2)
- When lightning strokes to phase conductors of the reference tower with flashover, the lightning current discharges from the phase conductor to the tower, suddenly increasing the tower current, (Figure 11b).
Hence, two lightning stroke types can be identified by the polarity mutation of the tower current when insulator flashovers. The polarity mutation characteristics of the tower current can be extracted through the WTMM analysis [29,30].
Figure 12a shows that the insulator voltage suffers a sharp edge decrease. The wavelet transform (WT) modulus reaches a maximum when the insulator flashovers. The third Gauss wavelet is chosen as the mother wavelet to perform discrete stationary wavelet transform (SWT); WTMM is then obtained. Given that different decomposition scales lead to different distributions of WTMM, the distribution of WTMM under different decomposition scales is analyzed, and scale 1 is chosen as the decomposition scale. The first extreme point k1 corresponds to the insulator voltage collapse point. tflashover is the detected moment when the insulator flashovers, and the tower current mutation breakpoint can be detected at the time interval [−0.1 + tflashover, tflashover + 0.1].
Figure 12b,c show that the tower current rapidly changes at the peak of the signal when the insulator flashovers. The third B-spline wavelet is chosen as the mother wavelet to perform discrete SWT under scale 1 at the time interval [−0.1 + tflashover, tflashover + 0.1], and WTMM is obtained. To eliminate the interference, the threshold of the WTMM is set to 50% of the maximum WTMM in the sequence. Parameter PT is used to reflect the polarity of the first WTMM point. If the polarity of the first WTMM point is positive, then PT = +1; otherwise, PT = −1. In other words, when negative lightning strokes to the top of the reference tower with back flashover, PT = −1. By contrast, when negative lightning strokes to a phase conductor of the reference tower with flashover, PT = +1. Positive lightning strokes have the opposite results. In Table 1, Dt characterizes the polarity of the tower current and reflects the polarity of lightning strokes. Correspondingly, parameter MT, that is, MT = PT·Dt, is used to characterize the polarity mutation of the tower current (Table 2).
Table 2 shows that MT = −1 regardless if positive or negative lightning strokes to the top of the reference tower with back flashover, and MT = +1 regardless if positive or negative lightning strokes to a phase conductor of the reference tower with flashover. Therefore, the occurrence of back flashover and shielding failure at the reference tower can be identified.
Considering the time-domain and WTMM analyses, Figure 13 shows the entire hierarchical identification method. The direct lightning stroke fault types can be identified into six different types.
5. Verification for Recognition
Large numbers of simulation data are conducted to testify the validity of the recognition method. The simulation data are obtained under different conditions. Part of the results are shown in Table 3. It shows that the accuracy rate of this identification method is high.
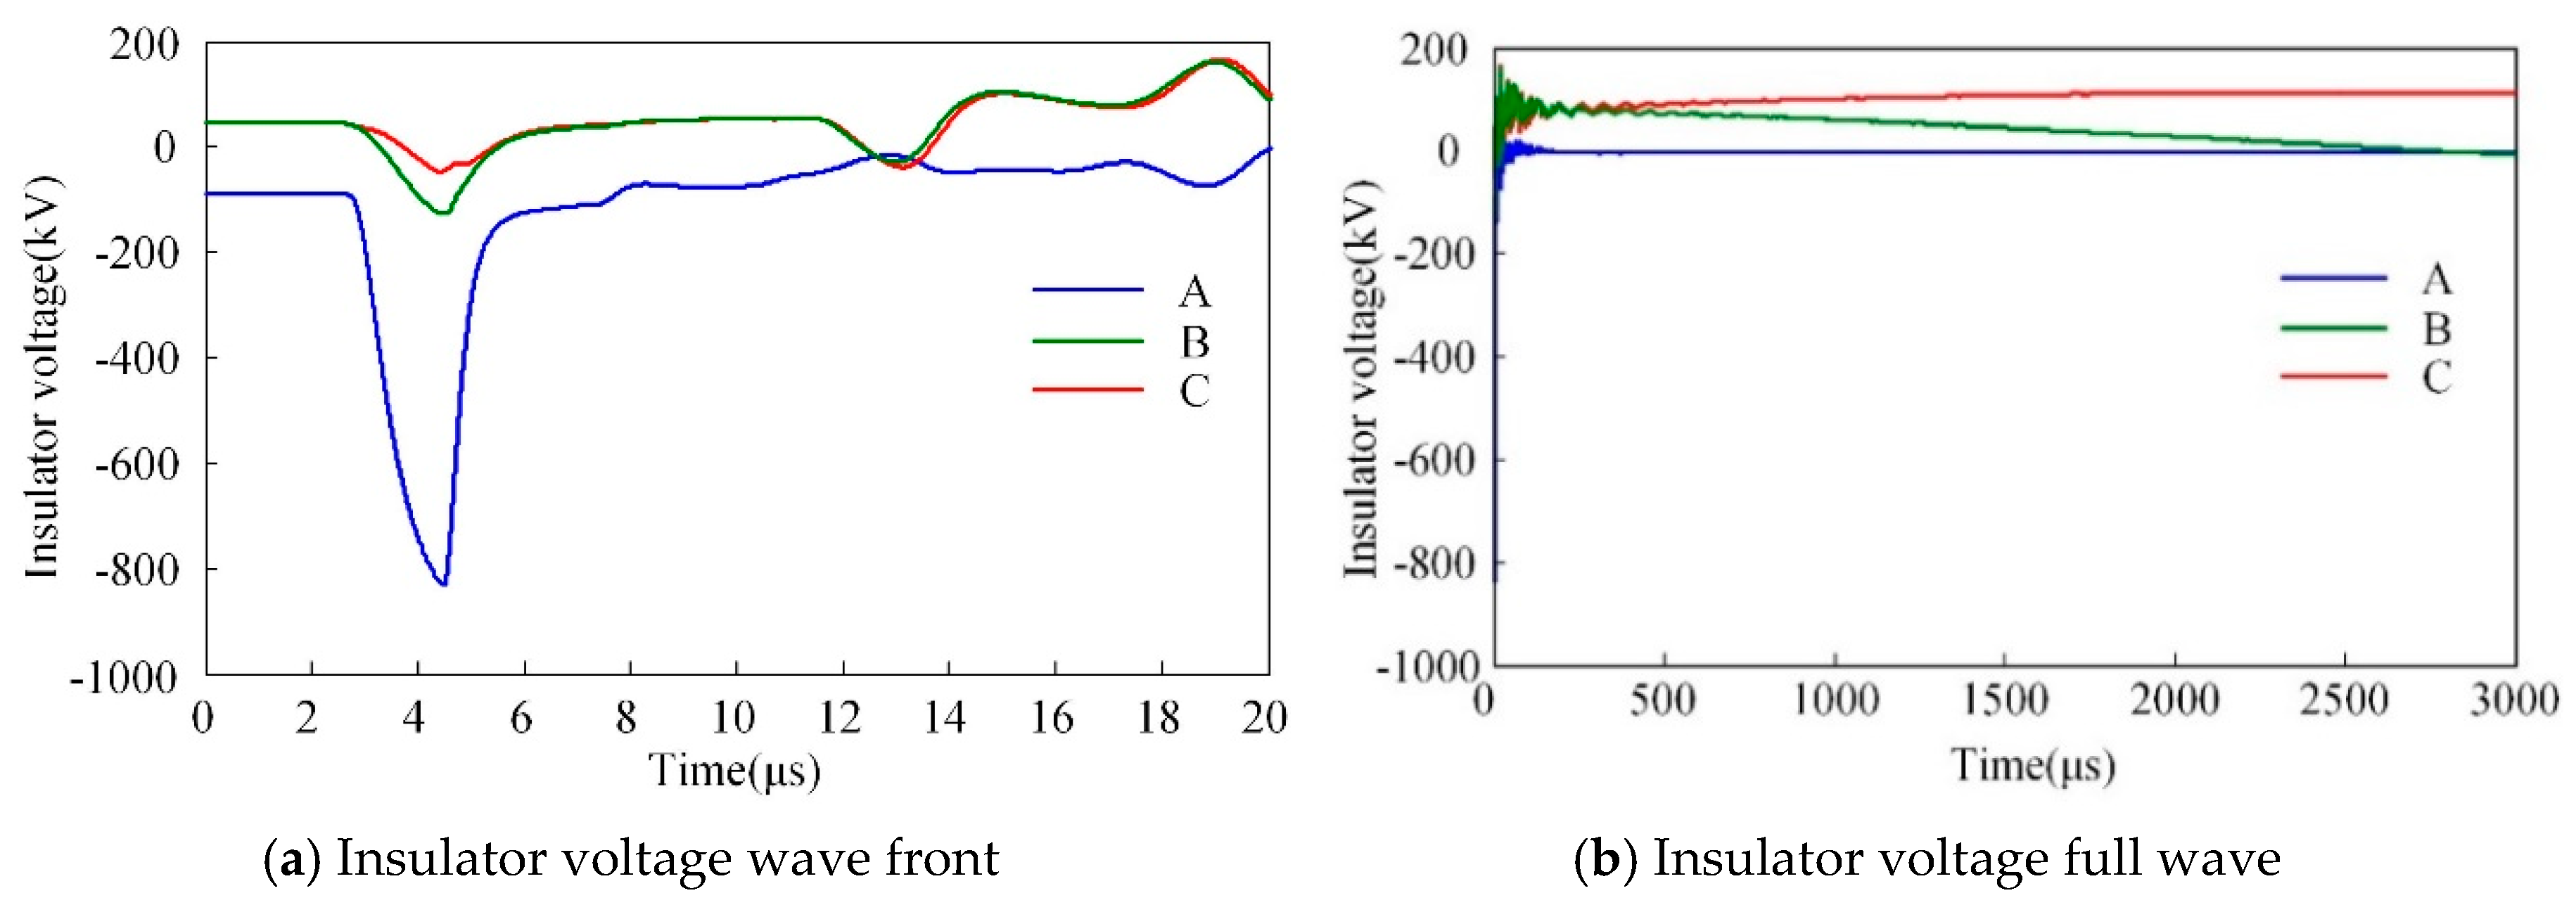
The non-contact lightning monitoring system operated from June 2015, an actual example was acquired at 2:37:25 a.m., 24 July 2015. The sensors are at the 19th transmission tower on the Fanjiawan–Linshui Line. Figure 14 shows the field-acquired waveforms of insulator voltage and tower current. According to the feature parameters calculated in Table 4, it is judged as lightning strokes to a phase conductor without flashover.
The lightning stroke information according to the lightning location system (LLS) record is shown in Table 5. The amplitude of the lightning current is 5.6 kA, which hardly causes flashover. Thus, the identification result of this example is reasonable.
6. Conclusions
In this paper, a non-contact multi-physical parameter lightning monitoring system is proposed. The voltage of the insulator string and the grounding current of the transmission tower are chosen as two physical parameters to show the characteristic quantities of different direct lightning strokes. These physical parameters are captured using a capacitive coupling overvoltage transducer installed at the cross arm of the tower and several parallel Rogowski coils installed at the tower ground supports.
A simulation model based on EMTP-ATP is established to show the features of the insulator voltage and tower current under different direct lightning strokes. Observation points are set at the reference tower to observe the waveform of the insulator voltage and the tower current under eight different situations: lightning strokes to a phase conductor of the reference tower with flashover, lightning strokes to a phase conductor of the reference tower without flashover, lightning strokes to a phase conductor of nearby tower with flashover, lightning strokes to a phase conductor of nearby tower without flashover, lightning strokes to the top of the reference tower with back flashover, lightning strokes to the top of the reference tower without back flashover, lightning strokes to the top of nearby tower with back flashover and lightning strokes to the top of nearby tower without back flashover.
Simulation results show that:
- (1)
- When lightning strokes to the top of the tower, Uins > 0 and Ig > 0; when lightning strokes to the phase conductor, Uins < 0 and Ig > 0.
- (2)
- When lightning strokes to the top of the reference tower with back flashover, the tower current has a negative polarity change; when lightning strokes to a phase conductor of the reference tower with flashover, the tower current has a positive polarity change.
- (3)
- When lightning strokes to the top of nearby tower, the Uins of the reference tower is positive before the insulator flashovers, whereas the Uins of the reference tower is negative after the insulator flashovers.
- (4)
- When lightning strokes to the top of reference tower, Uins = 0 when the insulator flashovers. When lightning strokes to the top of nearby tower with back flashover, the Uins of the reference tower becomes zero when the transient process ends.
Based on time-domain theory and WTMM theory, the polarity of insulator voltage Di, the polarity of tower current Dt, and the mutation polarity of tower current during insulator flashovers MT construct the characteristic parameters for polarity discrimination. Six kinds of direct lightning strokes can be identified based on the polarity discrimination method considering the lightning stroke point and the polarity of the lightning current. The identification method is verified by simulation data and is applied to an actual example.
Author Contributions
Conceptualization, K.J. and L.D.; data curation, K.J.; formal analysis, K.J.; investigation, F.Y.; methodology, L.D. and H.C.; project administration, L.D.; resources, F.Y. and Y.W.; software, K.J. and Y.W.; validation, H.C. and Y.W.; writing—original draft, K.J.; writing—review & editing, L.D.
Funding
This research received no external funding.
Conflicts of Interest
The authors declare no conflict of interest.
References
- Guido, A.; Salvatore, F.; Elisa, F.; Graziella, G.; Gaetano, Z. On the Distribution of Lightning Current among Interconnected Grounding Systems in Medium Voltage Grids. Energies 2018, 11, 771. [Google Scholar]
- Fabio, M.G.; Alberto, G.; Stefano, L.; Marco, M. Monte Carlo Evaluation of the Impact of Subsequent Strokes on Backflashover Rate. Energies 2016, 9, 139. [Google Scholar]
- Chen, J.; Zhu, M. Calculation of Lightning Flashover Rates of Overhead Distribution Lines Considering Direct and Indirect Strokes. IEEE Trans. Electromagn. Compat. 2014, 56, 668–674. [Google Scholar] [CrossRef]
- Takami, J.; Okabe, S. Observational Results of Lightning Current on Transmission Towers. IEEE Trans. Power Deliv. 2007, 22, 547–556. [Google Scholar] [CrossRef]
- Sima, W.; Lan, X.; Yang, Q.; Yuan, T. Statistical Analysis on Measured Lightning Overvoltage Surges in a 110 kV Air-insulated Substation. IET Sci. Meas. Technol. 2015, 9, 28–36. [Google Scholar] [CrossRef]
- Visacro, S.; Silveira, F.H. Lightning Performance of Transmission Lines: Methodology to Design Grounding Electrodes to Ensure an Expected Outage Rate. IEEE Trans. Power Deliv. 2015, 30, 237–245. [Google Scholar] [CrossRef]
- Nur, H.Z.; Mohd, Z.A.K.; Mohd, A.M.R.; Mahdi, I.; Norhafiz, A.; Nor, I.A.; Mohd, S.M.N. Lightning Surge Analysis on a Large Scale Grid-Connected Solar Photovoltaic System. Energies 2017, 10, 2149. [Google Scholar]
- Fang, Z.; Wang, B.; Lu, J.; Jiang, Z. Study on Impulse Breakdown Characteristics of Internal-Gap Lightning Protection Device Applied to 35 kV Distribution Line. Energies 2018, 11, 1758. [Google Scholar] [CrossRef]
- Shah, W.A.; He, H.; He, J.; Yang, Y. Continuous and Discontinuous Streamer Leader Propagation Phenomena under Slow Front Impulse Voltages in a 10-meter Rod-Plane Air Gap. Energies 2018, 11, 2636. [Google Scholar] [CrossRef]
- Zhang, L.; Fang, S.; Wang, G.; Zhao, T.; Zou, L. Studies on an Electromagnetic Transient Model of Offshore Wind Turbines and Lightning Transient Overvoltage Considering Lightning Channel Wave Impedance. Energies 2017, 10, 1995. [Google Scholar] [CrossRef]
- Zhou, W.J.; Wang, T.; Yu, J.H.; Zhang, S.F.; Cao, L.J. Study on Real-time Lightning Current Monitoring Sysmem for Overhead Wire. In Proceedings of the IEEE International Conference on High Voltage Engineering and Application (ICHVE), Chongqing, China, 9–12 November 2008; pp. 629–632. [Google Scholar]
- Takami, J.; Okabe, S. Characteristics of Direct Lightning Strokes to Phase Conductors of UHV Transmission Lines. IEEE Trans. Power Deliv. 2007, 22, 537–546. [Google Scholar] [CrossRef]
- Yang, Q.; Wang, J.; Sima, W.; Chen, L.; Yuan, T. Mixed Over-Voltage Decomposition Using Atomic Decompositions Based on a Damped Sinusoids Atom Dictionary. Energies 2011, 4, 1410–1427. [Google Scholar] [CrossRef] [Green Version]
- Wang, J.; Yang, Q.; Sima, W.; Yuan, T.; Zahn, M. A Smart Online Over-Voltage Monitoring and Identification System. Energies 2011, 4, 599–615. [Google Scholar] [CrossRef] [Green Version]
- Massarini, A.; Kazimierczuk, M.K. Self-capacitance of Inductors. IEEE Trans. Power Electron. 1997, 12, 671–676. [Google Scholar] [CrossRef]
- Jean, G.V.B. Electromagnetic Fields; New York Biswas Hope Press: New York, NY, USA, 2009. [Google Scholar]
- Sima, W.; Han, R.; Yang, Q.; Sun, S.; Liu, T. Dual LiNbO3 Crystal-Based Batteryless and Contactless Optical Transient Overvoltage Sensor for Overhead Transmission Line and Substation Applications. IEEE Trans. Ind. Electron. 2017, 64, 7323–7332. [Google Scholar] [CrossRef]
- Han, R.; Yang, Q.; Sima, W.X.; Zhang, Y.; Sun, S.P.; Liu, T.; Chen, S.Q. Non-contact measurement of lightning and switching transient overvoltage based on capacitive coupling and pockels effects. Electr. Power Syst. Res. 2015, 139, 93–100. [Google Scholar] [CrossRef]
- Chen, S.; Wang, H.; Du, L.; Li, J. Research on Characteristics of Noncontact Capacitive Voltage Divider Monitoring System Under AC and Lightning Overvoltages. IEEE Trans. Appl. Superconduct. 2014, 24, 1203–1205. [Google Scholar]
- Chen, S.; Wang, H.; Du, L.; Li, J. Research on a New Type of Overvoltages Monitoring Sensor and Decoupling Technology. IEEE Trans. Appl. Superconduct. 2014, 24, 1304–1307. [Google Scholar]
- Rakov, V.A.; Rachidi, F. Overview of Recent Progress in Lightning Research and Lightning Protection. IEEE Trans. Electromagn. Compat. 2009, 51, 428–442. [Google Scholar] [CrossRef] [Green Version]
- Yao, C.G.; Wu, H.; Mi, Y.; Ma, Y.; Shen, Y.; Wang, L. Finite Difference Time Domain Simulation of Lightning Transient Electromagnetic Fields on Transmission Lines. IEEE Trans. Dielectr. Electr. Insul. 2013, 20, 1239–1246. [Google Scholar]
- Wang, X.; Yu, Z.; He, J. Breakdown Process Experiments of 110- to 500-kV Insulator Strings under Short tail Lightning Impulse. IEEE Trans. Power Deliv. 2014, 29, 2394–2401. [Google Scholar] [CrossRef]
- Hara, T.; Yamamoto, O. Modeling of a Transmission Tower for Lightning Surge Analysis. IEE Proc. Gener. Trans Distrib. 1996, 143, 283–289. [Google Scholar] [CrossRef]
- Munukutla, K.; Vittal, V.; Heydt, G.T.; Chipman, D.; Keel, B. A Practical Evaluation of Surge Arrester Placement for Transmission Line Lightning Protection. IEEE Trans. Power Deliv. 2010, 25, 1742–1748. [Google Scholar] [CrossRef]
- Ametani, A.; Kawamura, T. A Method of a Lightning Surge Analysis Recommended in Japan Using EMTP. IEEE Trans. Power Deliv. 2005, 20, 867–875. [Google Scholar] [CrossRef]
- Gallagher, T.J.; Dudurych, I.M. Model of Corona for an EMTP Study of Surge Propagation along HV Transmission Lines. IEE Proc. Gener. Trans. Distrib. 2004, 151, 61–66. [Google Scholar] [CrossRef]
- Goran, J.; Juraj, H.; Tomislav, C.; Stjepan, S. Laboratory Test Bed for Analyzing Fault-Detection Reaction Times of Protection Relays in Different Substation Topologies. Energies 2018, 11, 2482. [Google Scholar]
- Nianqiang, L.; Ping, L. A Switching Method Based on FD and WTMM for ECG Signal Real-Time Feature Extraction. In Proceedings of the 2009 International Joint Conference on Computational Sciences and Optimization, Sanya, China, 24–26 April 2009; pp. 828–830. [Google Scholar]
- Wang, Z.; Chang, J.; Zhang, S.; Luo, S.; Jia, C.; Jiang, S.; Sun, B.; Liu, Y.; Liu, X.; Lv, G. An Improved Denoising Method in RDTS Based on Wavelet Transform Modulus Maxima. IEEE Sens. J. 2015, 15, 1061–1067. [Google Scholar] [CrossRef]
Figure 1.
Configuration of the non-contact lighting monitoring system. (a) schematic diagram of the overvoltage sensor; (b) capacitance calculation model; (c) installation of the overvoltage sensor; (d) structure of the tower current sensor; (e) circuit model of the tower current sensor; (f) field installation of the lightning monitoring system; (g) structure of the monitoring system.

Figure 2.
A schematic diagram of the electromagnetic transient program (EMTP) model.

Figure 3.
Simulation model of a 110 kV transmission line. (a) lightning stroke types: ① present lightning strokes to the top of the reference tower A; ② present lightning strokes to a phase conductor of tower A; ③ present lightning strokes to the top of nearby towers B or C; ④ present lightning strokes to a phase conductor of nearby towers B or C; (b) reference direction of Uins and Ig when lightning strokes to the top of the tower; (c) reference direction of Uins and Ig when lightning strokes to a phase conductor.
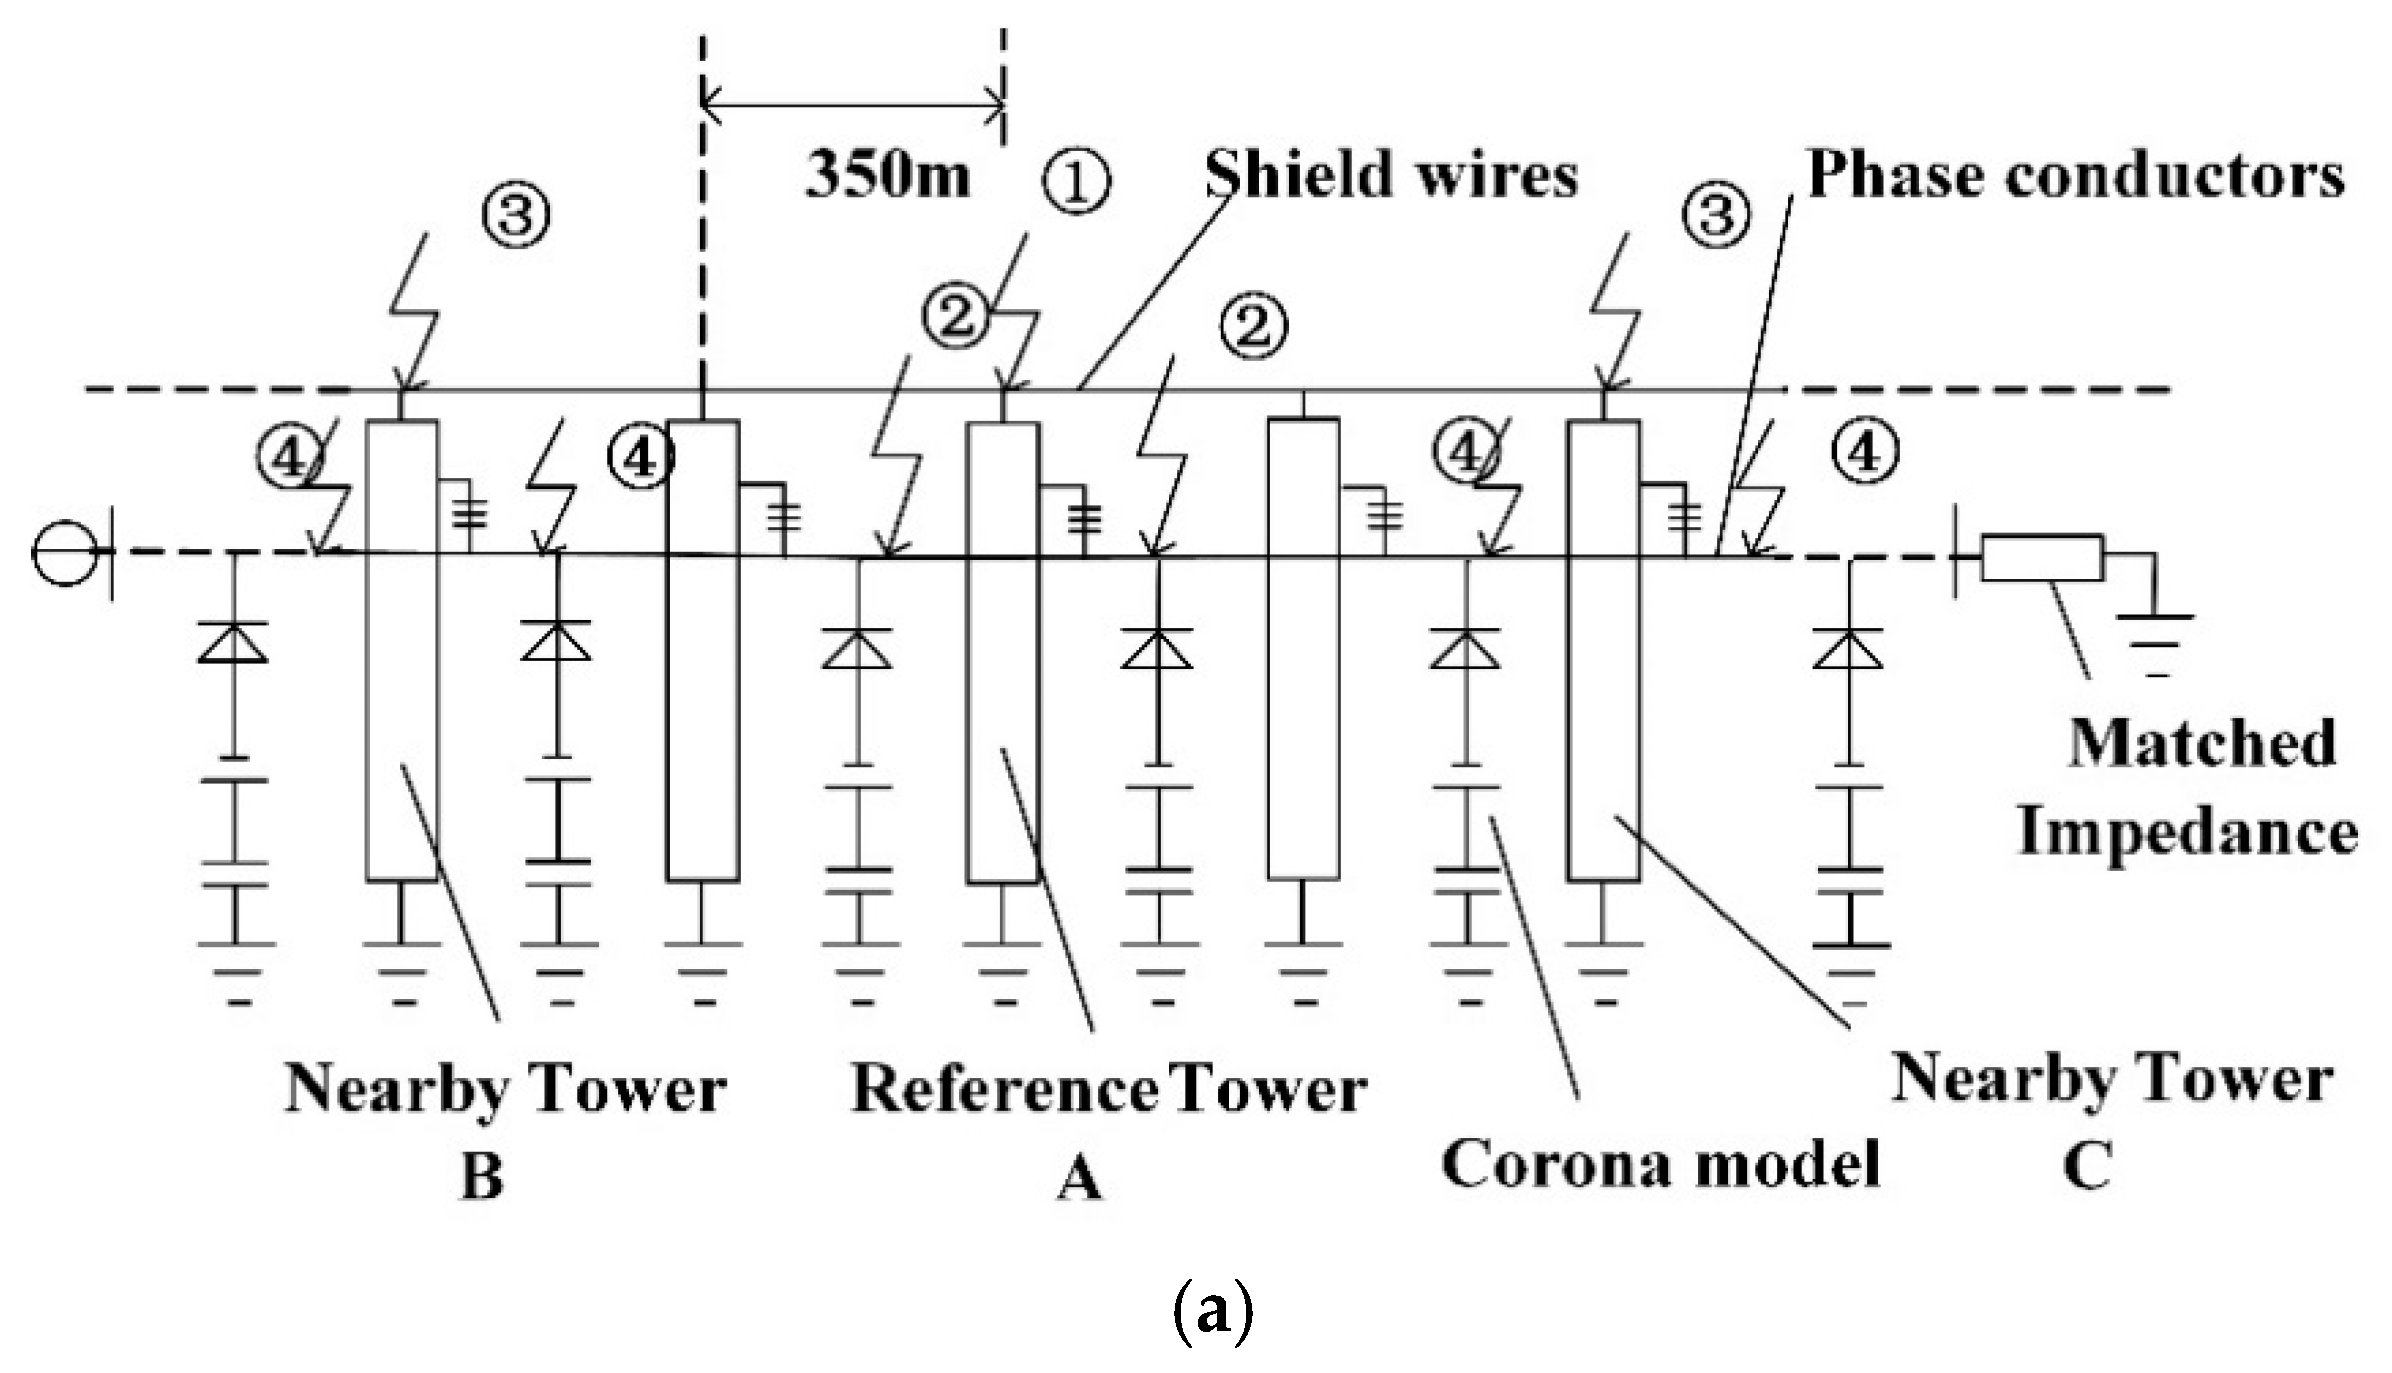
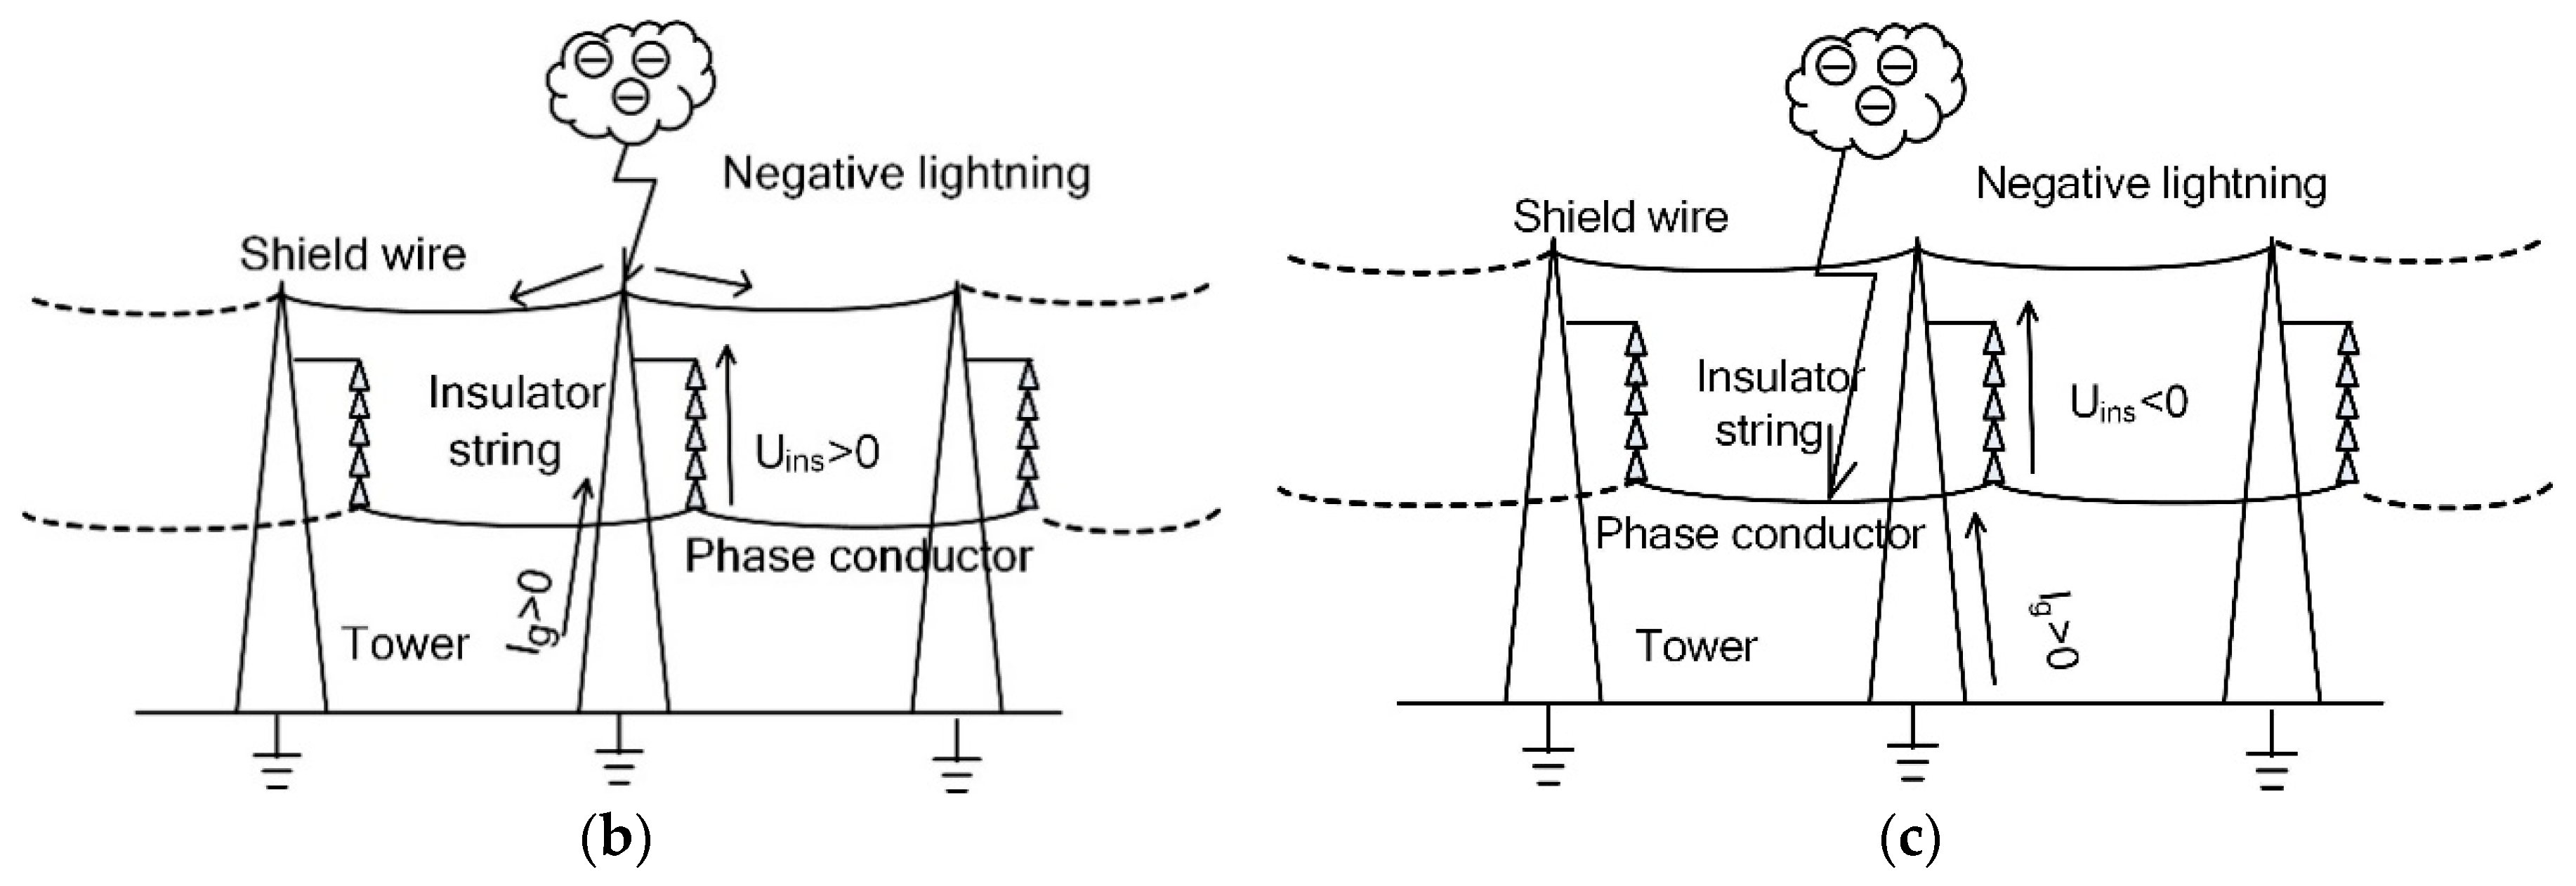
Figure 4.
Simulation for lightning strokes to the top of the reference tower without back flashover.
Figure 4.
Simulation for lightning strokes to the top of the reference tower without back flashover.
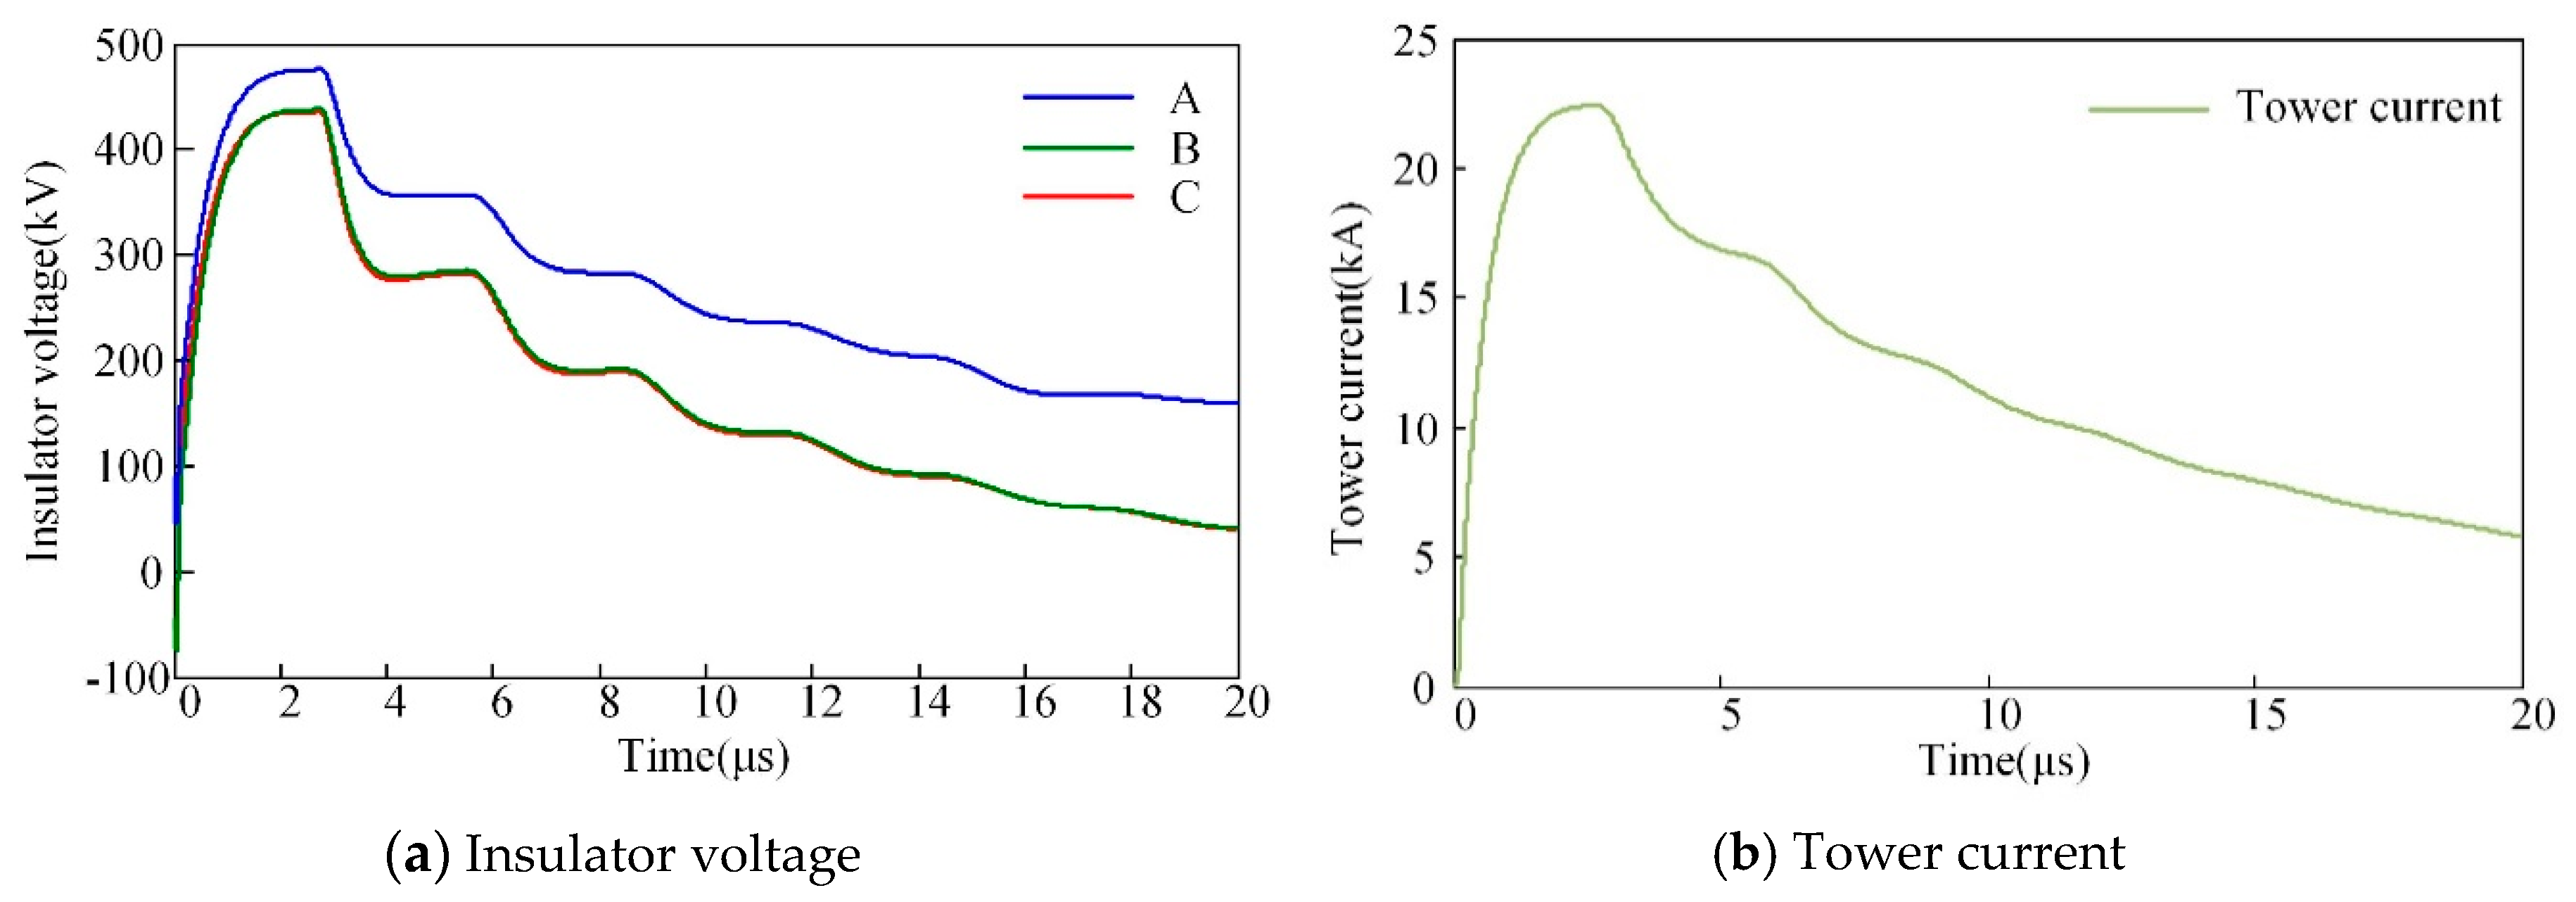
Figure 5.
Simulation for lightning strokes to the top of the reference tower with back flashover.
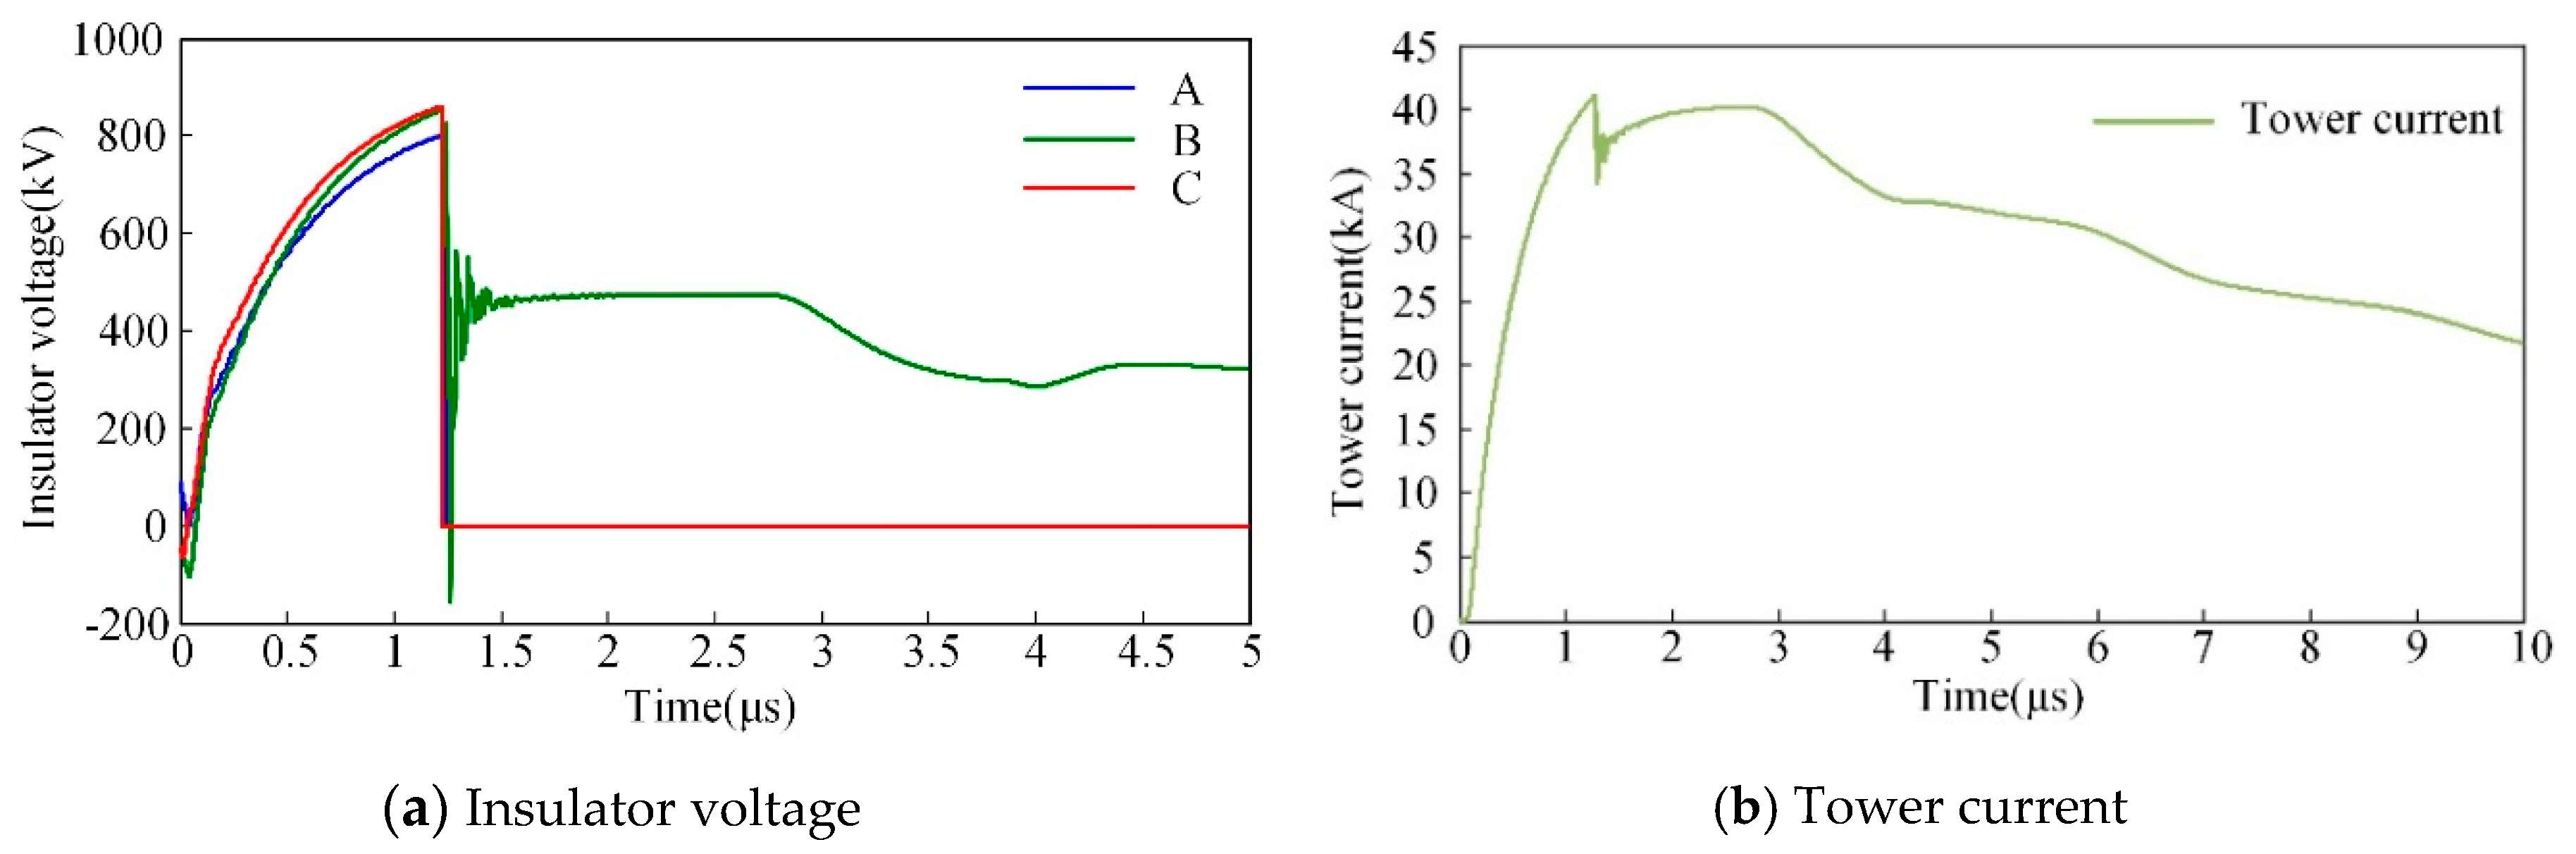
Figure 6.
Simulation for lightning strokes to the top of nearby tower without back flashover.
Figure 7.
Simulation for lightning strokes to the top of nearby tower with back flashover.

Figure 8.
Simulation for lightning strokes to a phase conductor of the reference tower without flashover.
Figure 8.
Simulation for lightning strokes to a phase conductor of the reference tower without flashover.
Figure 9.
Simulation for lightning strokes to a phase conductor of the reference tower with flashover.
Figure 9.
Simulation for lightning strokes to a phase conductor of the reference tower with flashover.

Figure 10.
Simulation for lightning strokes to a phase conductor of nearby tower with flashover.

Figure 11.
Polarity mutation characteristics of the tower current under different lightning stroke types. (a) lightning strokes to the top of the reference tower with back flashover; (b) lightning strokes to a phase conductor of the reference tower with flashover.
Figure 11.
Polarity mutation characteristics of the tower current under different lightning stroke types. (a) lightning strokes to the top of the reference tower with back flashover; (b) lightning strokes to a phase conductor of the reference tower with flashover.

Figure 12.
Wavelet transform modulus maxima (WTMM) of insulator voltage and tower current. (a) insulator voltage and its WTMM when insulator flashovers; (b) tower current and its WTMM when lightning strokes to the top of the reference tower with back flashover; (c) tower current and its WTMM when lightning strokes to a phase conductor of the reference tower with flashover.

Figure 13.
Identification flow chart of lightning stroke types.
Figure 14.
Field-acquired waveform. (a) overvoltage waveforms of phase conductors; (b) overvoltage waveform of phase A; (c) waveform of tower current.
Figure 14.
Field-acquired waveform. (a) overvoltage waveforms of phase conductors; (b) overvoltage waveform of phase A; (c) waveform of tower current.

Table 1.
Identification parameters of different lightning stroke types.
| Lightning Stroke Type | Di | Dt | D = Di·Dt |
|---|---|---|---|
| Negative lightning strokes to the top of the tower | +1 | +1 | +1 |
| Negative lightning strokes to a phase conductor | −1 | +1 | −1 |
| Positive lightning strokes to the top of the tower | −1 | −1 | +1 |
| Positive lightning strokes to a phase conductor | +1 | −1 | −1 |
Table 2.
Identification parameters of shielding failure and back flashover.
| Lightning Current Polarity | Lightning Type | PT | Dt | MT = PT·Dt |
|---|---|---|---|---|
| Negative | Back flashover at the reference tower | −1 | +1 | −1 |
| Shielding failure at the reference tower | +1 | +1 | +1 | |
| Positive | Back flashover at the reference tower | +1 | −1 | −1 |
| Shielding failure at the reference tower | −1 | −1 | +1 |
Table 3.
Identification results of different lightning strokes.
| Fault Type | Position | D | Di·Di5 | U5us | U1.5ms | MT | Identification Results |
|---|---|---|---|---|---|---|---|
| 2.6/50us Lightning strokes to the top of the tower with back flashover | 0 m | +1 | <0 | 0 | 0 | −1 | Lightning strokes to the top of the reference tower with back flashover |
| 700 m | +1 | <0 | 1.177 | 0.002 | / | Lightning strokes to the top of nearby tower with back flashover | |
| 1050 m | +1 | <0 | 1.271 | 0.003 | / | ||
| 2.6/50us lightning strokes to the top of the tower without back flashover | 0 m | +1 | >0 | 0.935 | 0.224 | / | Lightning strokes to the top of the tower without back flashover |
| 700 m | +1 | >0 | 0.769 | 0.225 | / | ||
| 2.6/50us Lightning strokes to a phase conductor with flashover | 0 m | −1 | >0 | 0 | 0 | +1 | Lightning strokes to a phase conductor of the reference tower with flashover |
| 700 m | −1 | >0 | 0.342 | 0.037 | / | Lightning strokes to a phase conductor of nearby tower with flashover | |
| 1050 m | −1 | >0 | 0.816 | 0.044 | / | ||
| 2.6/50us Lightning strokes to a phase conductor without flashover | 0 m | −1 | >0 | 0.633 | 0.234 | / | Lightning strokes to a phase conductor without flashover |
| 700 m | −1 | >0 | 0.606 | 0.225 | / | ||
| 1.2/50us Lightning strokes to the top of the tower with back flashover | 0 m | +1 | <0 | 0 | 0 | −1 | Lightning strokes to the top of the reference tower with back flashover |
| 700 m | +1 | <0 | 1.213 | 0.002 | / | Lightning strokes to the top of nearby tower with back flashover | |
| 1.2/50us Lightning strokes to a phase conductor with flashover | 0 m | −1 | >0 | 0 | 0 | +1 | Lightning strokes to a phase conductor of the reference tower with flashover |
| 700 m | −1 | >0 | 0.298 | 0.031 | / | Lightning strokes to a phase conductor of nearby tower with flashover |
Table 4.
Feature parameters of the field data.
| D | Di·Di5 | U5us | U1.5ms | MT |
|---|---|---|---|---|
| −1 | >0 | 0.612 | 0.211 | / |
Table 5.
Lightning location system (LLS) record of the field data.
| Time | Longitude | Latitude | I (kA) | Number of Towers |
|---|---|---|---|---|
| 02:37:25 | 106:41:30 | 30:33:21 | −5.6 kA | 13, 14 |
© 2019 by the authors. Licensee MDPI, Basel, Switzerland. This article is an open access article distributed under the terms and conditions of the Creative Commons Attribution (CC BY) license (http://creativecommons.org/licenses/by/4.0/).
Share and Cite
MDPI and ACS Style
Jiang, K.; Du, L.; Chen, H.; Yang, F.; Wang, Y. Non-Contact Measurement and Polarity Discrimination-Based Identification Method for Direct Lightning Strokes. Energies 2019, 12, 263. https://doi.org/10.3390/en12020263
AMA Style
Jiang K, Du L, Chen H, Yang F, Wang Y. Non-Contact Measurement and Polarity Discrimination-Based Identification Method for Direct Lightning Strokes. Energies. 2019; 12(2):263. https://doi.org/10.3390/en12020263
Chicago/Turabian StyleJiang, Kaihua, Lin Du, Huan Chen, Feng Yang, and Yubo Wang. 2019. "Non-Contact Measurement and Polarity Discrimination-Based Identification Method for Direct Lightning Strokes" Energies 12, no. 2: 263. https://doi.org/10.3390/en12020263
Note that from the first issue of 2016, this journal uses article numbers instead of page numbers. See further details here.