Examination of Bearing Walls Regarding Their Environmental Performance
by
 , , and
Adriana Estokova
1,* ,
,
Marcela Ondova
1,
Martina Wolfova
1,
Alena Paulikova
2 and
and
Stanislav Toth
3 1
Institute of Environmental Engineering, Faculty of Civil Engineering, Technical University of Kosice, Vysokoskolska 4, 042 00 Kosice, Slovakia
2
Faculty of Materials Science and Technology in Trnava, Slovak University of Technology in Bratislava, Jana Bottu 25, 917 24 Trnava, Slovakia
3
Institute of Architectural Engineering, Faculty of Civil Engineering, Technical University of Kosice, Vysokoskolska 4, 042 00 Kosice, Slovakia
*
Author to whom correspondence should be addressed.
Energies 2019, 12(2), 260; https://doi.org/10.3390/en12020260
Submission received: 19 November 2018
/
Revised: 4 January 2019
/
Accepted: 9 January 2019
/
Published: 15 January 2019
Abstract
:A comprehensive understanding of the environmental impacts of buildings is not possible without knowledge of the technical and environmental properties of the materials that are used for their construction. This paper evaluates the environmental impacts of 156 material variations of conventional compositions of external bearing walls, which represent a significant part of a building’s envelope. Environmental (embodied energy, global warming potential, effects to human health, damage to ecosystems, and resources availability) and technical (surface temperature, number of layers, thickness, and weight) parameters are investigated for structures with similar heat transfer coefficients (U = 0.21–0.22 W/(m2·K)). Based on a multi-criteria analysis, an optimal material composition, consisting of aerated concrete with graphite polystyrene, was identified. By analyzing the costs of the best material compositions, it is observed that constructions with environmental benefits do not result in an increase in the cost of the construction. On the contrary, at present, they represent an approximately 10% cheaper solution.
1. Introduction
Current development trends in construction are increasingly becoming linked to the principles of sustainable development [1,2,3,4]. To reduce the negative impact of buildings, it is no longer feasible to concentrate only on optimizing the energy consumption during the operational phase of buildings. With increasing focus on the construction of low-energy or zero-energy buildings, the importance of the environmental impacts of the building materials themselves also comes to the fore [5]. Efficiently reducing the embodied energy of building materials and the amount of raw materials used, and using materials and ensuring their recyclability, as well as making sustainability-based choices and using environmentally safe building materials must become common practice [6,7]. A qualitative and quantitative assessment of the environmental impacts of building materials and structures is an important approach to achieving these goals.
There are various evaluation methods, but the most comprehensive method is the Life Cycle Assessment (LCA), which evaluates the impacts of products during the selected life cycle phases through predetermined environmental indicators [8,9]. The International Organisation for Standardisation (ISO) has published a set of standards on LCA (ISO14040 and 14044) that describe the general principles and requirements to undertake LCA, and to ensure its quality and consistency. A Life Cycle Assessment is carried out in four distinct phases, including goal and scope definitions, life cycle inventory (LCI), life cycle impact assessment (LCIA), and interpretation. Since LCI involves the creation of an inventory of flows from and to nature for a product system, it requires the collection of input data regarding all the inputs of water, energy, and raw materials, and it releases them to air, land, and water. When the primary data are not available, various LCA databases can be applied. There are many free and commercial LCA databases available, e.g., Ecoinvent, Gabi, Athena, European Life Cycle Database (ELCD), PlasticEurope, Catalan Structured Database for Construction Elements (BEDEC), Building Environmental Assessment Tool (BEAT), (Data for Environmental Analysis and Management (DEAM), Database information manager 1.0 (DIM), and others [10]. However, the LCA data can vary depending on various factors, such as energy sources or different manufacturing characteristics, since particular databases have been developed in specific countries or territories. Ecoinvent and Gabi are widely used in Europe, and Athena is preferred in the United States and Canada [11]. Specifically, in the building LCA results, the differences in databases do not play such a significant role [10]. Peuportier et al. [12] reported a difference of 10% for the CO2 emissions of a single-family house, while Takano et al. found that the final results are consistent with each other, even though they are based on different methodologies [13]. Most LCA databases use a cradle-to-gate model, and they can be successfully used to study the impact of building materials on the environment during the manufacturing process. With the increasing trend in LCA applications, demand for high quality, reliable, transparent, and consistent LCA data also increases [14]. The databases are regularly updated based on scientific knowledge, industry resources, technical literature, and internal patent information [15].
LCIA is strongly dependent on the selection of impact categories, category indicators, and characterization models. The choice of categories and indicators is made on an individual basis, and depends on the scope and objectives of the evaluation. In particular, the following indicators are mostly used to compare the environmental impacts of building materials: The global warming potential (GWP), the acidification potential (AP), and the primary energy (PEI), representing the amount of non-renewable energy for the production of building materials [16,17]. Some authors, instead of the GWP, use the term “embodied carbon dioxide emissions” (ECO2), and instead of the PEI, use the term “embodied energy” (EE), but the nature of these environmental indicators is the same [18]. To assess the building material impacts within the Environmental Product Declaration (EDP), the ISO standard [19] suggests a few more indicators: the ozone layer depletion potential (ODP), the eutrophication potential (EP), the photochemical ozone creation potential (POCP), and the abiotic depletion of raw materials (ADP). Other indicators are being increasingly applied in the construction industry [20,21]. Different software products (e.g., SimaPro, openLCA, Umberto, and GaBi) have been developed, and these are widely used. Some of the LCA methods offer single-scored indicators (energy demand, GWP) or various mid-point indicators. Other methods are aimed at end-point valuation, by using a more sophisticated approach by presenting the results of environmental evaluation in terms of their effects on human health, damage to the ecosystem, and resource scarcity.
Several authors have recently addressed the LCA assessment of environmental impacts on materials that are incorporated in buildings’ structures. Hay and Ostertag reported the environmental evaluation of double-skin façade systems [22], Maxineasa et al. analyzed the environmental impacts of various timber structures for pitched roofs [23], Tumminia et al. investigated the environmental impact of a prefabricated building module [24], Vilčeková et al. examined the wooden house envelopes [25], and Estokova and Porhincak compared the alternation of material bases to minimize the negative environmental effect of building materials [26]. Other authors have focused on whole-building impacts, e.g., Evangelista et al. report on the results of an environmental evaluation of residential buildings in Brazil [27], Vilches et al. provided a literature review on the environmental impacts of building refurbishment [28], and Hafner and Schäfer presented a comparative environmental analysis of various timber and mineral buildings [29]. The identification of the major environmental impacts will help with the environmentally friendly selection of materials [30]. However, as mentioned by Abeysundara et al. [31] and Yin et al. [32], the sustainable selection of materials should consider a combination of all environmental, technical, economic, and social factors. Therefore, in our study, attention is paid to the evaluation of external bearing walls, considering the environmental, technical, and economical points of view. Most authors are concerned, as mentioned above, with single indicators, such as PEI, GWP, or AP. This paper tries to analyze environmental impacts, in addition to the single-scored indicators, through three end-point categories: Damage to human health, damage to ecosystem quality, and damage to resource availability.
The external bearing walls of residential houses represent a considerable portion of a building’s envelope, integrating a wide range of materials of bearing elements (e.g., bricks, concrete blocks), thermal insulation (e.g., polystyrene, mineral wool), or surface finishing (e.g., stucco, facing). According to Porhincak [33], for single-story buildings, the proportion of bearing walls is up to 19.4%, while for double-story buildings, the area of the bearing walls is even larger, and represents up to 25% of the total area of the building. Therefore, it is obvious that the external bearing walls themselves can contribute significantly to the negative environmental impacts of a building, through the impact of the materials that are used in these structures.
The paper presents an evaluation of various conventional material compositions of the external bearing walls, considering the environmental as well as technical parameters. In addition, the costs of the analyses variants are evaluated as well. The article has two specific objectives: (1) To compare the environmental impacts of various material alternatives that are conventionally used for the construction of bearing walls, applying the LCA data, and based on the results, to propose the most environmentally friendly material composition, while also taking into account the technical parameters; and (2) to verify whether the proposed optimal structure would be more expensive compared to structures without any environmental benefits.
2. Materials and Methods
2.1. Material Compositions of Constructions
A total of 156 material variants of the bearing walls were selected for the evaluation. The amount of the material variants was set to cover all the commonly used masonry structures with the most often-used materials. The wall structure was designed as construction, with a contact thermal insulation system, to meet the recommended maximum value of the heat transfer coefficient of U = 0.22 W/(m2·K), which has been valid since 2016 [34]. The heat transfer coefficient (U) is an important criterion in the design of the exterior walls, in terms of building thermal protection. In Central Europe, masonry construction materials are one of the most popular materials that are used in individual construction. This results mainly from the tradition of masonry building procedures in the region, and the efforts to ensure a stable and durable construction [35]. Therefore, in this study, attention is primarily focused on the impact of masonry walls. The main materials that are contained in each structure of the wall were present in the following order, as shown in Figure 1: Interior plaster, solid wall material, adhesive mortar, insulation materials, adhesive, reinforcing mesh, exterior primer, and finish coat.
The solid wall materials included ceramic perforated bricks, aerated concrete blocks, and monolithic reinforced concrete structures. For the ceramic wall materials, bricks of thicknesses of 440, 380, and 300 mm were analyzed. They varied in density (660 and 840 kg/m3, 760 and 830 kg/m3, and 800 and 1000 kg/m3, respectively) and in the type of adhesive mortar used (perlite (P) and cement (C)). Two types of aerated concrete (AC) blocks (300 and 375 mm) with densities of 400 and 500 kg/m3 were used. The masonry structures were compared with a 200 mm thick monolithic reinforced concrete structure (RC).
The chosen interior plasters represented the most commonly used lime-cement plasters. Exterior plasters were designed in two alternatives: Silicate plasters based on inorganic binders (water glass) or silicone plasters based on organic silicone resins. The reinforcing fiberglass mesh was also included.
Two conventionally used insulation materials were selected for the external wall insulation: Polystyrene and mineral wool. Expanded polystyrene (EPS) A, with a bulk density of 28 kg/ m3, and EPS B, with a bulk density of 30 kg/m3, were considered in the calculation. Improved graphite alternatives (EPSg) of polystyrene, with bulk densities of 28 and 30 kg/m3, were analyzed. Mineral fiber insulation based on rock wool (RW) was also used in two types, with bulk densities of 115 and 150 kg/m3. The thickness of the thermal insulation was determined based on the thermal–technical calculation [36], so that the value of the heat transfer coefficient U of the wall was in a close interval from 0.21 to 0.22 W/(m2·K). Thus, the thickness of the thermal insulation ranged between 20 to 200 mm.
Individual material compositions of the bearing walls are briefly described in Table 1, and an example of a detailed description of the material composition for the groups of structures W1–W8 is given in Table 2. Similar combinations of materials and thicknesses were also analyzed for all other groups W9–W156.
2.2. Technical Parameters of Constructions
For all the constructions, these selected physical and technical parameters were considered: Internal surface temperature (θsi), the number of material layers, and the thickness and weight of the wall structures.
The internal surface temperature (θsi) was calculated by Teplo software [36] to estimate the risk of possible condensation or mold growth. The surface temperature of the construction should be above the corresponding critical value, to eliminate the risk of mold formation [35].
The number of material layers in the wall structure indicates the laboriousness of the construction process. Generally, the fewer layers there are, the better. More layers of materials result in more construction work, because in addition to masonry works and plastering, additional activities are required, e.g., embedding of the fiberglass mesh, anchoring of thermal insulation, or bonding and coating.
The thickness of the wall construction was also an important factor to be assessed. The total thickness affects the size of the interior space. By comparing the same spaces with different wall thicknesses, a higher thickness results in a reduction in the interior space, thus decreasing the spatial efficiency. Another reason for analyzing the thicknesses of the walls was the potential issue with window screening in thick wall constructions, resulting in less light entering the buildings. Therefore, we aimed for the smallest wall thicknesses. The thicknesses of the individual layers were designed in accordance with commonly known facts, or based on the recommendations of the manufacturers of individual materials. The thicknesses of heat-insulating materials and heat-insulating plasters were designed so that the structure met the aforementioned requirements of the heat transfer coefficient, and are similar as in Salandin and Soler’s report [37].
The weight of the wall construction was another critical consideration. A higher weight of materials results in an increased load on the foundations. Therefore, in general, efforts are made to reduce the weight of the walls. Conversely, a higher weight of construction acts positively in terms of stabilizing indoor temperatures in winter and summer periods, as they exhibit better heat-storage capacities, and possibly better acoustic-insulating performance [38]. For the purpose of this study, heavyweight constructions were considered as constructions with a more negative impact, because a higher mass of materials usually contributes to an increase in negative environmental impacts.
2.3. Environmental Analysis
The functional unit that was established in all the assessed scenarios was 1 m2 of the structure with the same thermal performance. A lifespan period of 50 years was considered for the wall constructions, while 25 years was considered for both the exterior and interior plasters. Based on the ISO standards [19], the evaluation was performed within the “cradle-to-gate” boundaries, using SimaPro software.
Inventory analysis (LCI), focusing on all the environmental inputs and outputs that are associated with a product, such as the uses of raw materials, energy, and the emission of pollutants, was processed through the Ecoinvent database [14]. Over the past decade, the European database Ecoinvent, developed by the Swiss Life Cycle Inventory, has become the global leader in creating the most transparent life cycle assessment databases. At present, this database is among the most comprehensive and most transparent international databases, with more than 13,300 points of data in many areas, such as energy supply, agriculture, transport, biofuels and biomaterials, bulk and specialty chemicals, building materials, wood, and waste treatment.
The alternative scenarios assessed 156 different alternatives of external walls, based on the LCA data of the following construction materials, as mentioned above: Lime-cement plaster, brick, aerated concrete, and reinforced concrete as solid wall materials; adhesive mortar, EPS polystyrene, graphite polystyrene, and rock wool as insulation materials; and cement mortar, fiberglass mesh, and silicone and silicate plasters as finish coats. The data set representing the “cradle-to-gate” inventory (production phase) began with the extraction phase of raw materials to the final material treatment that was suitable for embedding in the construction, including the required production energy. Transports between the “gate-to-building site”, or any construction works, operational phase, and dismantling were not part of the system. According to Ecoinvent data, the materials’ inputs were specified as follows:
Lime-cement mortar included the following processes: The entire manufacturing process for producing lime-cement mortar (raw material provision, raw material mixing, packing, and storage), transport to the plant, and infrastructure. The lifespan of mortar was assumed to be 20–25 years, according to Aktas and Bilec [39], and therefore it was doubled. Bricks included the processing of the raw materials clay, straw, and water, their transport to the finishing plant, and preparing the bricks, the drying energy in terms of heat from liquid gas, the packaging, and the infrastructure.
Aerated concrete included the raw materials, their transport to the finishing plant, the energy for the autoclaving process, the packaging, the infrastructure, the disposal of wastewater, and some solid household (e.g., packing material) wastes. Reinforced concrete—the life cycle assessment of pre-cast concrete elements—covered the production of concrete types C20/25 and reinforcing steel. The average bulk density amounts were 2.4 t/m3, with a standard minimum reinforcement share of 0.5%. The assessment included the life cycle from energy generation and raw material supply, to the finished product at the plant gate. Adhesive and cement mortars included raw materials provision, raw material mixing, packing, storage, transport to the plant, and infrastructure. Expanded polystyrene included all processes from raw material extraction until its delivery at the plant (production by suspension polymerization out of benzene and ethylene), grinding, and thermoforming processes. Graphite polystyrene included, in addition to ordinary polystyrene, all the processes regarding milled graphite production (raw materials, machineries, and energy consumption). Rock wool included all the manufacturing processes, mechanical packing, and the administration of the rock wool factory. Fiberglass mesh included the production of glass fiber and acrylic acid production (raw materials and chemicals used for production, the transport of materials to the manufacturing plant, emissions to air and water from production, estimations of energy demand, and the infrastructure of the plant). The silicate plaster module contained material and energy inputs, and the production of waste and emissions for the production of sodium phosphate out of phosphoric acid. The transport and infrastructure were then estimated. The lifespan of plaster was assumed similarly as for the lime mortar, to be 20–25 years, and therefore it was doubled. Silicone plaster included raw material inputs and energy to produce average silicon products, and polyester resin, and emission to water by analogy to other processes. Transport and infrastructure were estimated. The lifespan of plaster is assumed to be 20–25 years, and therefore it was doubled.
The electricity included the main processes of electricity production in Slovakia, the transmission network, and direct SF6 emissions to air. Electricity losses during medium-voltage transmission and transformation from high voltage were accounted for. The production volume was 23 TWh. Assumptions for the transmission network, losses, and emissions were based on Swiss data.
The ReCiPe endpoint method was selected to be the life cycle impact assessment (LCIA) of the material alternatives. ReCiPe is the most recent and harmonized indicator approach that is available in LCIA [40]. In ReCiPe, the indicators at two levels were determined: 18 midpoint indicators, and three endpoint indicators. Endpoint indicators show the environmental impacts on three higher aggregation levels, being the effect on human health (unit: DALY—disability-adjusted life years), the damage to ecosystem quality (unit: species/year), and resource scarcity (unit: monetary value, e.g., $). DALY are metrics that express the disability-adjusted life years due to human health damage, as explained by Muray [41]. Within the ReCiPe endpoint method, a hierarchist consensus model, which is often encountered in scientific studies and is considered to be the default one, was applied.
To emphasize the environmental impacts, in addition to the ReCiPe, two separate evaluation methods were selected in the LCIA phase. The cumulative energy demand (CED) was aimed at the calculation of the PEI of materials in the structures, whereas the IPCC (Intergovernmental Panel on Climate Change) method was aimed at the GWP calculation.
The CED method [42] considered the characterization factors that were given for the energy resources in five impact categories: Non-renewable, fossil; non-renewable, nuclear; renewable, biomass; renewable, wind, solar, geothermal; and renewable, water. No normalization or weighting data was included in the calculation. The LCA results for non-renewable, fossil energy were of interest in our study, to evaluate the PEI of the wall alternatives.
Finally, the GWP indicator (kg CO2 eq/m2) was determined by using the IPCC method [43]. IPCC 2001, developed by the Intergovernmental Panel on Climate Change, contains climate change factors with a timeframe of 100 years. IPCC characterization factors take into account the direct global warming potentials of air emissions (except CH4), and do not include the indirect formation of dinitrogen monoxide from nitrogen emissions, emissions of NOx, water, sulfate, or the indirect effects of CO emissions.
2.4. Multi-Criterial Analysis
The multi-criterial analysis was used to determine an order of wall alternatives, based on the analysis of a higher number of varied criteria, including environmental and technical parameters. The applied methodology considered the quantification of qualitative parameters, using multi-dimensional assessment indicators in recommended wall material compositions, according to the evaluation purpose.
A matrix of data values for individual j-indicators served as an input to the problem solution, with the determination of the permissible standards for their values uj, as evaluated from i numbers of sites. The calculation included a triangular matrix of correlation indexes rij, as well as the values of the arithmetic mean yj, a standard deviation sj from a set of individual indicators, and the Student’s t-test values for these indicator values [44].
The indicators were further processed by using an original mathematical and statistical method, based on vector, factor, and discriminant analysis, correlation calculus, and tests of significance, so that a complex of environmental performance value for human health or building wall material application could be determined by a dimensionless criterion, Qi. This approach can be applied as a supplementary tool for management by building developers or state government authorities, providing a complex view of multi-criterial environmental issues [45]. Significance tests also allow for a partial or detailed detection of the critical environmental performance with regard to human health and building applications.
The following individual factors have been selected for the multi-criterial evaluation of the wall material alternatives:
- Surface temperature [°C],
- Thickness [mm],
- Weight [kg],
- Effect on human health [DALY],
- Damage to ecosystem quality [species/year],
- Resource scarcity [$].
The individual six factors have amplifying effects on environmental performance, with a positive polarization of criteria. The same level of importance was assigned for all the individual factors in multi-criterial analysis.
2.5. Cost of the Materials in Construction
The costs of the constructions were calculated based on the materials’ prices, according to documents provided by the manufacturers. The calculation did not include the cost of construction works or “gate-to-building site” transportation. Therefore, the calculated costs of wall constructions, expressed per functional unit (i.e., per 1 m2 of the wall structure), might represent average prices in the European region.
In addition, a simplified life cycle cost analysis (LCC) was performed for three wall material alternatives which have been identified as best options in each material group. The production phase, construction phase, operational phase, and disposal have been considered to calculate the total costs. The production phase involved the prices of materials in the wall as mentioned above, while the construction phase included the unit prices per hour of human and machine labor in the Slovak republic. The costs in the operational phase included the cost of material and labor to renew interior and exterior plasters once in a 50-year life span period. Two scenarios have been under consideration regarding the dismantling phase: Scenario A supposed the disposal of the partially separated wall material (70% separated, 30% mixed waste), and Scenario B considered the mixed waste only. The prices in the disposal phase were based on the assumption that the material will be landfilled, since this is the most common way to treat the waste in the Slovak republic. All the prices of the bulk materials were calculated from the unit prices per cubic meter.
3. Results and Discussion
3.1. Technical Characterization of the Vertical Constructions
The number of layers for the analyzed structures ranged from six (for all brick constructions) to seven (reinforced concrete structures). Salandin and Soler [37], computing the minimum construction cost of a building’s external wall, taking into account its energy efficiency, considered six-layer construction.
As mentioned above, the structures had different thicknesses, in order to meet the required U value (0.21–0.22 W/(m2·K)) and thus keep the same thermal insulation performance. The thicknesses of the individual constructions ranged between 383–553 mm, and their weights were in the range of 153.96–553.09 kg/m2. The surface temperatures ranged from 18.24–18.33 °C, as shown in Figure 2. The selected technical parameters were conventionally assessed, not only for vertical constructions, but also for other constructions, e.g., roofs [46,47].
The minimum and maximum values, as well as the average values, are given in Table 3. All the results of the individual constructions are reported in Appendix A.
The minimum thickness of the wall structures was assigned to the aerated concrete wall equipped with graphite EPS (388 mm), and to the reinforced concrete walls (383 mm). The brick walls with mineral thermal insulation were responsible for a maximum thickness of up to 553 mm.
The lightest constructions were represented by the aerated concrete walls (300 mm) with graphite polystyrene (154 kg/m2). By contrast, the heaviest ones were the walls of reinforced concrete with mineral insulation (553.1 kg/m2). The weights of brick walls ranged from 274 to 426 kg/m2, depending on the thicknesses of the bricks and the insulation.
Surface temperatures that were directly related to the heat transfer coefficient showed opposite extremes. The highest value of θsi = 18.33 °C was associated with the brick walls (300 mm), and with ordinary and graphite EPS, as well as with the aerated concrete blocks (375 mm). The lowest value of θsi = 18.24 °C was calculated for the 380 mm thick brick wall with thermal insulation from mineral wool.
3.2. Environmental Evaluation of the Vertical Structures
A comparison of the calculated environmental loads of all evaluated material alternatives of the wall structures, presented in eco-points (Pt), is given in Figure 3. One Pt represents one-thousandth of the yearly environmental load of one average European inhabitant. The environmental parameters ranged from 4.3 to 10.9 Pt for human health, 2.2 to 5.4 Pt for the ecosystem, and 2.8 to 10.5 Pt for resources.
From analyzing the results, the most important negative effect of the wall structures was identified in the category of Human Health, followed by Resources and Ecosystems. The environmental load found in the Human Health category was almost twice as high as the Ecosystems category. To analyze the environmental impacts of the particular wall constructions in more detail, the results are further presented for the groups of wall structures, according to the wall materials.
3.2.1. Effects on Human Health
The trend in the environmental impacts of the wall constructions with regard to their effects on human health is given in Figure 4.
As seen in Figure 4, the lowest environmental impacts were associated with the structures with aerated concrete as the core wall material. The calculated values ranged from 0.21 to 0.48 × 10⁻³ DALY/m2, having an average value of 0.35 × 10⁻³ DALY/m2. The brick and RC structures proved to have worse environmental performances, reaching higher impacts, with a maximum of up to 0.55 × 10⁻³ DALY/m2, and almost the same average values of 0.40 and 0.41 × 10⁻³ DALY/m2, for RC and brick structures, respectively.
Considering the lowest effects in the Human Health category, the best material alternative was identified for each group of structures, and also for all of the structures as a whole, as shown in Table 4.
3.2.2. Quality of Ecosystems
Figure 5 illustrates the impacts of the wall structures in terms of the damage to ecosystem quality.
Similar to the previous category, the lowest environmental load was found for structures with aerated concrete, where the results ranged from 0.9 to 2.1 × 10⁻⁶ species/year per 1 m2 of construction. The average value for AC was also lower (1.56 × 10⁻⁶ species/year) than those of brick and RC structures (1.85 and 1.79 × 10⁻⁶ species/year, respectively). The results of the particular material compositions with the lowest impacts in damage to ecosystem quality, identified for each material group, are given in Table 4.
3.2.3. Resource Scarcity
The environmental contributions of the wall construction processing to resource scarcity is presented in Figure 6.
Even in the category of Resource Scarcity, the same trend was confirmed as in the construction impacts; as seen from Figure 6, AC structures achieved the lowest environmental scores. The average impacts were calculated as $759, $868, and $954 for the AC, RC, and brick structures, respectively.
A comparison of the material alternatives with the lowest impacts in the particular wall material groups, including their environmental as well as the main technical parameters, is given in Figure 7. The individual values are expressed as percentage shares of the total values.
Based on the above results, it can be stated that the material group with the most environmentally suitable material composition was aerated concrete insulated by graphite polystyrene. The best environmental performance was found for the material alternative W105, which was composed of a total of six layers, including 300 mm thick aerated concrete (with a density of 400 kg/m3), 70 mm thick graphite polystyrene EPSg (with a bulk density of 28 kg/m3), silicate-based external plaster, reinforcing fiberglass mesh, and lime–cement interior plaster. The overall thickness of this structure reached 388 mm, while its overall weight per 1 m2 was 154.11 kg. This composition was associated with the lowest values of all endpoint indicators. In addition, within the analyzed interval of the heat transfer coefficients, this material composition reached the best value of U = 0.207/(m2·K).
3.3. Primary Energy (PEI) of the Vertical Structures
The calculated PEI of the structures ranged from 904.6 to 3362.4 MJ/m2, and corresponded to the results obtained by other authors who analyzed the impacts of building materials in building constructions [48,49,50]. The maximum values were a little higher, which could be caused by our multiplying the effects of the plasters by 2, because of the half-life of the plaster over the other materials. As seen in Figure 8, two separate areas were observed when the correlation between the PEI and thickness was investigated. A significant difference in the PEI values of the structures (630 MJ/m2) was found between the worst structure from the first region, and the best structure from the second region. Surprisingly, the key factor dividing the structures regarding the PEI was the exterior plaster. All the structures in the lower region involved the silicate, while in the higher region, they involved silicone plaster. This could be probably caused by a more complicated process of manufacturing for the organic compounds during siloxane production. Nevertheless, this requires more investigation to confirm the finding. As for the core materials of the wall, the PEI results were in accordance with the results presented before, as the aerated concrete structures reached the lowest PEI score.
When examining the separate correlations for silicate plaster-containing and silicone plaster-containing structures, a medium correlation was found, with the same correlation coefficients for both relations R = 0.73, as shown in Table 5. This points to the expected confirmation of the linear correlation between the thickness of the masonry wall structure and its primary energy demand.
Similar findings were observed for the correlation between PEI and weight, as shown in Figure 9. Two regions with a significant difference in PEI were confirmed. Moreover, in contrast to the investigation of PEI versus thickness, in the dependence of PEI on the weight, two other separated regions belonging to the RC structures were identified. When analyzing all the structures, a linear correlation between the PEI and weight (R = 0.62) could not be clearly stated. However, when excluding the RC structures, a very high correlation (R = 0.91) was found for the brick and AC structures versus their weight.
3.4. Global Warming Potentials of the Vertical Structures
The GWP of the wall structures varied from 110.97 to 183.4 kg CO2 eq/m2 for the silicate plaster structures, and from 209.5 to 281.9 kg CO2 eq/m2 for the silicone plaster structures. The GWP values were in accordance with the results of other authors, who aimed even higher at the impacts of building constructions [45,46,47], likely due to double-calculation of the effects of the plasters. Two separate regions were found, similarly as with PEI, when analyzing the relationship between GWP and thickness, as shown in Figure 10, and between GWP and weight, as shown in Figure 11.
The calculated correlation coefficients for the correlation between GWP and the thickness and weight, respectively, are given in Table 6.
The correlation coefficients reached similar values as in the PEI correlation, and the values for weight were even higher. Based on the results of the correlation, it can be concluded that there was a correlation between the PEI and GWP results, and also for the thickness and weight results of the structures.
3.5. Results of Multi-Criterial Analysis of the Wall Structures
Table 7 shows the calculated level of environmental performance (Qi) for 10 wall compositions, to be identified as the best evaluated alternatives of all, according to the above-mentioned methodologies, and by using the calculation performed by a computer algorithm. The order of the wall structures was determined through its Qi value, where the lower the Qi value, the better the performance of the structure.
By evaluating the results of the multi-criterial analysis, the AC-based wall structures were identified as the most suitable material alternatives. These were walls with relatively low thicknesses, low weights, good thermo-technological parameters, and lower negative impacts on the environment. When taking into account the findings of the correlation analysis, these results were in accordance with those regarding the correlation analysis. The wall (W105), made of 300 mm thick aerated concrete with 70 mm thick graphite polystyrene insulation, was identified as the most appropriate one. This was the same finding as when evaluating only the endpoint indicators’ scores.
3.6. Costs of the Material Alternatives
The calculated costs of materials in the constructions, with similar thermal performances (U = 0.21–0.22 W/(m2·K)), ranged from 56.4 to 97.3€ per 1 m2, as illustrated in Figure 13.
The lowest price of the materials used (56.40 €/m2) was calculated for the construction made of 300 mm brick and polystyrene thermal insulation. The highest construction cost (97.30 €/m2) was found for a reinforced concrete wall with mineral wool. The brick wall (400 mm) with mineral wool thermal insulation was also an expensive option (91.80 €/m2). The average cost per 1 m2 of construction was calculated at 72.40 €/m2 (median = 72 €/m2, min–max = 42%, a variation range of 40.90 €/m2). The cost of the materials of the wall structure that was found to be the most environmentally sound was accounted to be 61.87 €/m2.
Currently, in many cases, cost is a leading factor for material selection, at the expense of other factors. The findings revealed that the cost of the most suitable material composition of the external bearing wall constructions did not exceed the average price per 1 m2 of the composition (72.40 €/m2), but was in fact 14% lower. This also applied to the design that was assessed as being the most environmentally friendly (W105), and that reached the lowest values for all environmental indicators in relation to the environmental impact. Based on the price of the materials, the external bearing wall that was evaluated as the best, from the environmental point of view, did not result in an increase in the material costs.
Table 8 presents the results of the simplified LCC analysis of three wall alternatives to be identified as best options in the particular material groups: W33 (brick), W105 (aerated concrete), and W149 (reinforced concrete). All values in Table 8 are given in €/m2.
As it can be seen in Table 8, the walls with the aerated concrete seem to be less expensive even when the whole life cycle costs are considered.
4. Conclusions
The findings have revealed that the most serious negative impacts of wall structures were in the category of Human Health, followed by the categories of Resources and Ecosystems. This is an important finding, since most of the attention regarding building constructions is focused on environmental impacts such as primary energy, global warming, or acidification. The results point to a need for a deeper investigation in the field, with a special regard to building materials’ effects on human health.
Based on the results of the environmental impact assessment of individual material compositions, the most environmentally sound material composition of external bearing, with a heat transfer coefficient U being within the interval 0.21–0.22 W/(m2·K), was identified as a structure consisting of 300 mm aerated concrete, 70 mm thick graphite polystyrene insulation, an interior of lime–cement plaster, and silicate plaster. This composition corresponded to the lowest values of all endpoint indicators (effects on Human Health, Damage to Ecosystems Quality, and Resource Scarcity). The wall alternatives with aerated concrete proved to have better environmental performances than other wall alternatives containing brick or reinforced concrete. This is probably related to the more energy-intensive production processes in the cases of bricks and steel, which are embedded in reinforced concrete, compared to aerated concrete. Material alternatives with silicate plaster reached lower values of both PEI and GWP indicators than those with silicone plasters. This finding is likely caused by a significant difference in the manufacturing processes of silicone and silicate plasters, since the silicone production is based on organic processes. However, there is a need for further investigation into that result.
A significant correlation was found between the primary energies of the material alternatives and the thickness of the structure, as well as between the PEI and the weights of all the materials built into the wall structure. The same correlation was also found for the GWP dependence on the thickness of the wall structure and its weight.
Multi-criterial analysis confirmed that the wall material composition that achieved the best environmental parameters was an acceptable variant, even after considering the technical perspective. In this composition, a compromise between the technical and environmental parameters has been achieved in terms of relatively good thermal properties, and relatively low thicknesses and weights of materials possessing acceptable values for all endpoint indicators and GWP, as well as relatively low primary energy.
Based on the evaluation of the materials of the selected external bearing walls that we judged to be the best, it can be stated that the analyzed environmental optimal constructions result in no increase in the economic cost of the material. In fact, they are slightly cheaper (by approximately 10%) than the average costs of all other structures.
It can be concluded that an environmentally suitable solution does not necessarily have to be a more expensive alternative, and that attention should also be paid to the environment while choosing the building materials. Relatively little change in the material composition of the structure can reduce the environmental burden, while ensuring the required functional and thermal insulation parameters. The comprehensiveness of our evaluation can help in the decision-making process regarding the suitable selection of materials.
Author Contributions
Conceptualization, A.E. and A.P.; methodology, A.E., A.P., and M.O.; validation, A.P., M.W. and M.O.; technical analysis, S.T.; environmental analysis, M.O. and M.W.; multi-criterial analysis, A.P.; writing—original draft preparation, A.E. and A.P.; writing—review and editing, A.E., A.P., and M.O.
Funding
This research was funded by VEGA—Scientific Grant Agency of the Ministry of Education, Science, Research and Sport of the Slovak Republic and the Slovak Academy of Sciences, grant number 1/0648/17.
Conflicts of Interest
The authors declare no conflict of interest.
Appendix A

Table A1.
Characteristics of the material alternatives of the analysed walls with U = 0.21-0.22 W/(m2·K).
Table A1.
Characteristics of the material alternatives of the analysed walls with U = 0.21-0.22 W/(m2·K).
| Group | Wall | Typology | Interior Plaster | Thickness of the Core Material | Thermal Insulation | Exterior Plaster |
|---|---|---|---|---|---|---|
| W1-W8 Brick + EPS polystyrene | W1 | T.8.168 | lime-cement | 380 A | EPS A, 90 mm | silicate |
| W2 | T.8.169 | lime-cement | 380 A | EPS B, 80 mm | silicate | |
| W3 | T.8.170 | lime-cement | 380 A | EPS A, 90 mm | silicone | |
| W4 | T.8.171 | lime-cement | 380 A | EPS B, 80 mm | silicone | |
| W5 | T.8.172 | lime-cement | 380 B | EPS A, 100 mm | silicate | |
| W6 | T.8.173 | lime-cement | 380 B | EPS B, 90 mm | silicate | |
| W7 | T.8.174 | lime-cement | 380 B | EPS A, 100 mm | silicone | |
| W8 | T.8.175 | lime-cement | 380 B | EPS B, 90 mm | silicone | |
| W9-W16 Brick + EPSg graphite polystyrene | W9 | T.9.176 | lime-cement | 380 A | EPSg A, 80 mm | silicate |
| W10 | T.9.177 | lime-cement | 380 A | EPSg B, 80 mm | silicate | |
| W11 | T.9.178 | lime-cement | 380 A | EPSg A, 80 mm | silicone | |
| W12 | T.9.179 | lime-cement | 380 A | EPSg B, 80 mm | silicone | |
| W13 | T.9.180 | lime-cement | 380 B | EPSg A, 90 mm | silicate | |
| W14 | T.9.181 | lime-cement | 380 B | EPSg B, 90 mm | silicate | |
| W15 | T.9.182 | lime-cement | 380 B | EPSg A, 90 mm | silicone | |
| W16 | T.9.183 | lime-cement | 380 B | EPSg B, 90 mm | silicone | |
| W7-W24 Brick + rock wool | W17 | T.10.184 | lime-cement | 380 A | RW A, 90 mm | silicate |
| W18 | T.10.185 | lime-cement | 380 A | RW B, 90 mm | silicate | |
| W19 | T.10.186 | lime-cement | 380 A | RW A, 90 mm | silicone | |
| W20 | T.10.187 | lime-cement | 380 A | RW B, 90 mm | silicone | |
| W21 | T.10.188 | lime-cement | 380 B | RW A, 100 mm | silicate | |
| W22 | T.10.189 | lime-cement | 380 B | RW B, 110 mm | silicate | |
| W23 | T.1.190 | lime-cement | 380 B | RW A, 100 mm | silicone | |
| W24 | T.10.191 | lime-cement | 380 B | RW B, 110 mm | silicone | |
| W25-W32 Brick + EPS polystyrene | W25 | T.11.192 | lime-cement | 300 A | EPS A, 130 mm | silicate |
| W26 | T.11.193 | lime-cement | 300 A | EPS B, 120 mm | silicate | |
| W27 | T.11.194 | lime-cement | 300 A | EPS A, 130 mm | silicone | |
| W28 | T.11.195 | lime-cement | 300 A | EPS B, 120 mm | silicone | |
| W29 | T.11.196 | lime-cement | 300 B | EPS A, 140 mm | silicate | |
| W30 | T.11.197 | lime-cement | 300 B | EPS B, 130 mm | silicate | |
| W31 | T.11.198 | lime-cement | 300 B | EPS A, 140 mm | silicone | |
| W32 | T.11.199 | lime-cement | 300 B | EPS B, 130 mm | silicone | |
| W33-W40 Brick + EPSg graphite polystyrene | W33 | T.12.200 | lime-cement | 300 A | EPSg A, 120 mm | silicate |
| W34 | T.12.201 | lime-cement | 300 A | EPSg B, 120 mm | silicate | |
| W35 | T.12.202 | lime-cement | 300 A | EPSg A, 120 mm | silicone | |
| W36 | T.12.203 | lime-cement | 300 A | EPSg B, 120 mm | silicone | |
| W37 | T.12.204 | lime-cement | 300 B | EPSg A, 120 mm | silicate | |
| W38 | T.12.205 | lime-cement | 300 B | EPSg B, 120 mm | silicate | |
| W39 | T.12.206 | lime-cement | 300 B | EPSg A, 120 mm | silicone | |
| W40 | T.12.207 | lime-cement | 300 B | EPSg B, 120 mm | silicone | |
| W41-W48 Brick + rock wool | W41 | T.13.208 | lime-cement | 300 A | RW A, 130 mm | silicate |
| W42 | T.13.209 | lime-cement | 300 A | RW B, 140 mm | silicate | |
| W43 | T.13.210 | lime-cement | 300 A | RW A, 130 mm | silicone | |
| W44 | T.13.311 | lime-cement | 300 A | RW B, 140 mm | silicone | |
| W45 | T.13.212 | lime-cement | 300 B | RW A, 140 mm | silicate | |
| W46 | T.13.213 | lime-cement | 300 B | RW B, 150 mm | silicate | |
| W47 | T.13.214 | lime-cement | 300 B | RW A, 140 mm | silicone | |
| W48 | T.13.215 | lime-cement | 300 B | RW B, 150 mm | silicone | |
| W49-W56 Brick + EPS polystyrene | W49 | T.14.216 | lime-cement | 440 A | EPS A, 70 mm | silicate |
| W50 | T.14.217 | lime-cement | 440 A | EPS B, 70 mm | silicate | |
| W51 | T.14.218 | lime-cement | 440 A | EPS A, 70 mm | silicone | |
| W52 | T.14.219 | lime-cement | 440 A | EPS B, 70 mm | silicone | |
| W53 | T.14.220 | lime-cement | 440 B | EPS A, 60 mm | silicate | |
| W54 | T.14.221 | lime-cement | 440 B | EPS B, 60 mm | silicate | |
| W55 | T.14.222 | lime-cement | 440 B | EPS A, 60 mm | silicone | |
| W56 | T.14.223 | lime-cement | 440 B | EPS B, 60 mm | silicone | |
| W57-W64 Brick + EPSg graphite polystyrene | W57 | T.15.224 | lime-cement | 440 A | EPSg A, 60 mm | silicate |
| W58 | T.15.225 | lime-cement | 440 A | EPSg B, 60 mm | silicate | |
| W59 | T.15.226 | lime-cement | 440 A | EPSg A, 60 mm | silicone | |
| W60 | T.15.227 | lime-cement | 440 A | EPSg B, 60 mm | silicone | |
| W61 | T.15.228 | lime-cement | 440 B | EPSg A, 60 mm | silicate | |
| W62 | T.15.229 | lime-cement | 440 B | EPSg B, 60 mm | silicate | |
| W63 | T.15.230 | lime-cement | 440 B | EPSg A, 60 mm | silicone | |
| W64 | T.15.231 | lime-cement | 440 B | EPSg B, 60 mm | silicone | |
| W65-W72 Brick + rock wool | W65 | T.16.232 | lime-cement | 440 A | RW A, 70 mm | silicate |
| W66 | T.16.233 | lime-cement | 440 A | RW B, 80 mm | silicate | |
| W67 | T.16.234 | lime-cement | 440 A | RW A, 70 mm | silicone | |
| W68 | T.16.235 | lime-cement | 440 A | RW B, 80 mm | silicone | |
| W69 | T.16.236 | lime-cement | 440 B | RW A, 60 mm | silicate | |
| W70 | T.16.237 | lime-cement | 440 B | RW B, 70 mm | silicate | |
| W71 | T.16.238 | lime-cement | 440 B | RW A, 60 mm | silicone | |
| W72 | T.16.239 | lime-cement | 440 B | RW B, 70 mm | silicone | |
| W73-W80 Brick + EPS polystyrene | W73 | T.17.240 | lime-cement | 440 A | EPS A, 80 mm | silicate |
| W74 | T.17.241 | lime-cement | 440 A | EPS B, 80 mm | silicate | |
| W75 | T.17.242 | lime-cement | 440 A | EPS A, 80 mm | silicone | |
| W76 | T.17.243 | lime-cement | 440 A | EPS B, 80 mm | silicone | |
| W77 | T.17.244 | lime-cement | 440 B | EPS A, 80 mm | silicate | |
| W78 | T.17.245 | lime-cement | 440 B | EPS B, 80 mm | silicate | |
| W79 | T.17.246 | lime-cement | 440 B | EPS A, 80 mm | silicone | |
| W80 | T.17.247 | lime-cement | 440 B | EPS B, 80 mm | silicone | |
| W81-W88 Brick + EPSg graphite polystyrene | W81 | T.18.248 | lime-cement | 440 A | EPSg A, 70 mm | silicate |
| W82 | T.18.249 | lime-cement | 440 A | EPSg B, 70 mm | silicate | |
| W83 | T.18.250 | lime-cement | 440 A | EPSg A, 70 mm | silicone | |
| W84 | T.18.251 | lime-cement | 440 A | EPSg B, 70 mm | silicone | |
| W85 | T.18.252 | lime-cement | 440 B | EPSg A, 70 mm | silicate | |
| W86 | T.18.253 | lime-cement | 440 B | EPSg B, 70 mm | silicate | |
| W87 | T.18.254 | lime-cement | 440 B | EPSg A, 70 mm | silicone | |
| W88 | T.18.255 | lime-cement | 440 B | EPSg B, 70 mm | silicone | |
| W89-W96 Brick + rock wool | W89 | T.19.256 | lime-cement | 440 A | RW A, 80 mm | silicate |
| W90 | T.19.257 | lime-cement | 440 A | RW B, 90 mm | silicate | |
| W91 | T.19.258 | lime-cement | 440 A | RW A, 80 mm | silicone | |
| W92 | T.19.259 | lime-cement | 440 A | RW B, 90 mm | silicone | |
| W93 | T.19.260 | lime-cement | 440 B | RW A, 80 mm | silicate | |
| W94 | T.19.261 | lime-cement | 440 B | RW B, 90 mm | silicate | |
| W95 | T.19.262 | lime-cement | 440 B | RW A, 80 mm | silicone | |
| W96 | T.19.263 | lime-cement | 440 B | RW B, 90 mm | silicone | |
| W97-104 Aerated concrete + EPS polystyrene | W97 | P.5.264 | lime-cement | 300 A | EPS A, 80 mm | silicate |
| W98 | P.5.265 | lime-cement | 300 A | EPS B, 80 mm | silicate | |
| W99 | P.5.266 | lime-cement | 300 A | EPS A, 80 mm | silicone | |
| W100 | P.5.267 | lime-cement | 300 A | EPS B, 80 mm | silicone | |
| W101 | P.5.268 | lime-cement | 300 B | EPS A, 100 mm | silicate | |
| W102 | P.5.269 | lime-cement | 300 B | EPS B, 100 mm | silicate | |
| W103 | P.5.270 | lime-cement | 300 B | EPS A, 100 mm | silicone | |
| W104 | P.5.271 | lime-cement | 300 B | EPS B, 100 mm | silicone | |
| W105-112 Aerated concrete + EPSg graphite polystyrene | W105 | P.6.272 | lime-cement | 300 A | EPSg A, 70 mm | silicate |
| W106 | P.6.273 | lime-cement | 300 A | EPSg B, 70 mm | silicate | |
| W107 | P.6.274 | lime-cement | 300 A | EPSg A, 70 mm | silicone | |
| W108 | P.6.275 | lime-cement | 300 A | EPSg B, 70 mm | silicone | |
| W109 | P.6.276 | lime-cement | 300 B | EPSg A, 90 mm | silicate | |
| W110 | P.6.277 | lime-cement | 300 B | EPSg B, 90 mm | silicate | |
| W111 | P.6.278 | lime-cement | 300 B | EPSg A, 90 mm | silicone | |
| W112 | P.6.279 | lime-cement | 300 B | EPSg B, 90 mm | silicone | |
| W113-120 Aerated concrete + rock wool | W113 | P.7.280 | lime-cement | 300 A | RW A, 80 mm | silicate |
| W114 | P.7.281 | lime-cement | 300 A | RW B, 90 mm | silicate | |
| W115 | P.7.282 | lime-cement | 300 A | RW A, 80 mm | silicone | |
| W116 | P.7.283 | lime-cement | 300 A | RW B, 90 mm | silicone | |
| W117 | P.7.284 | lime-cement | 300 B | RW A, 100 mm | silicate | |
| W118 | P.7.285 | lime-cement | 300 B | RW B, 110 mm | silicate | |
| W119 | P.7.286 | lime-cement | 300 B | RW A, 100 mm | silicone | |
| W120 | P.7.287 | lime-cement | 300 B | RW B, 110 mm | silicone | |
| W121-128 Aerated concrete + EPS polystyrene | W121 | P.8.288 | lime-cement | 375 A | EPS A, 60 mm | silicate |
| W122 | P.8.289 | lime-cement | 375 A | EPS B, 50 mm | silicate | |
| W123 | P.8.290 | lime-cement | 375 A | EPS A, 60 mm | silicone | |
| W124 | P.8.291 | lime-cement | 375 A | EPS B, 50 mm | silicone | |
| W125 | P.8.292 | lime-cement | 375 B | EPS A, 80 mm | silicate | |
| W126 | P.8.293 | lime-cement | 375 B | EPS B, 80 mm | silicate | |
| W127 | P.8.294 | lime-cement | 375 B | EPS A, 80 mm | silicone | |
| W128 | P.8.295 | lime-cement | 375 B | EPS B, 80 mm | silicone | |
| W129-136 Aerated concrete + EPSg graphite polystyrene | W129 | P.9.296 | lime-cement | 375 A | EPSg A, 50 mm | silicate |
| W130 | P.9.297 | lime-cement | 375 A | EPSg B, 50 mm | silicate | |
| W131 | P.9.298 | lime-cement | 375 A | EPSg A, 50 mm | silicone | |
| W132 | P.9.299 | lime-cement | 375 A | EPSg B, 50 mm | silicone | |
| W133 | P.9.300 | lime-cement | 375 B | EPSg A, 70 mm | silicate | |
| W134 | P.9.301 | lime-cement | 375 B | EPSg B, 70 mm | silicate | |
| W135 | P.9.302 | lime-cement | 375 B | EPSg A, 70 mm | silicone | |
| W136 | P.9.303 | lime-cement | 375 B | EPSg B, 70 mm | silicone | |
| W137-144 Aerated concrete + rock wool | W137 | P.10.304 | lime-cement | 375 A | RW A, 60 mm | silicate |
| W138 | P.10.305 | lime-cement | 375 A | RW B, 60 mm | silicate | |
| W139 | P.10.306 | lime-cement | 375 A | RW A, 60 mm | silicone | |
| W140 | P.10.307 | lime-cement | 375 A | RW B, 60 mm | silicone | |
| W141 | P.10.308 | lime-cement | 375 B | RW A, 80 mm | silicate | |
| W142 | P.10.309 | lime-cement | 375 B | RW B, 90 mm | silicate | |
| W143 | P.10.310 | lime-cement | 375 B | RW A, 80 mm | silicone | |
| W144 | P.10.311 | lime-cement | 375 B | RW B, 90 mm | silicone | |
| W145-W148 Reinforced concrete + EPS | W145 | Z.4.312 | lime-cement | 200 | EPS A, 180 mm | silicate |
| W146 | Z.4.313 | lime-cement | 200 | EPS B, 170 mm | silicate | |
| W147 | Z.4.314 | lime-cement | 200 | EPS A, 180 mm | silicone | |
| W148 | P.4.315 | lime-cement | 200 | EPS B, 170 mm | silicone | |
| W149-W152 Reinforced concrete + EPSg | W149 | Z.5.316 | lime-cement | 200 | EPSg A,160 mm | silicate |
| W150 | Z.5.317 | lime-cement | 200 | EPSg B, 160 mm | silicate | |
| W151 | Z.5.318 | lime-cement | 200 | EPSg A 160 mm | silicone | |
| W152 | P.5.319 | lime-cement | 200 | EPSg B, 160 mm | silicone | |
| W153-W156 Reinforced concrete + rock wool | W153 | Z.6.320 | lime-cement | 200 | RW A, 180 mm | silicate |
| W154 | Z.6.321 | lime-cement | 200 | RW B, 200 mm | silicate | |
| W155 | Z.6.322 | lime-cement | 200 | RW A, 180 mm | silicone | |
| W156 | P.6.323 | lime-cement | 200 | RW B, 200 mm | silicone |
Table A2.
Technical parameters of the individual constructions.
| Wall | Layers | Thickness | Weight | Teta si | Price |
|---|---|---|---|---|---|
| - | mm | kg/m2 | °C | EUR/m2 | |
| W1 | 6 | 493 | 333.21 | 18.31 | 65.02 |
| W2 | 6 | 483 | 333.46 | 18.28 | 65.12 |
| W3 | 6 | 493 | 333.06 | 18.31 | 66.81 |
| W4 | 6 | 483 | 333.31 | 18.28 | 66.91 |
| W5 | 6 | 503 | 359.96 | 18.30 | 64.32 |
| W6 | 6 | 493 | 360.26 | 18.28 | 65.32 |
| W7 | 6 | 503 | 359.81 | 18.30 | 66.11 |
| W8 | 6 | 493 | 360.11 | 18.28 | 66.31 |
| W9 | 6 | 483 | 333.06 | 18.32 | 66.32 |
| W10 | 6 | 483 | 333.46 | 18.32 | 67.52 |
| W11 | 6 | 483 | 332.91 | 18.32 | 68.11 |
| W12 | 6 | 483 | 333.31 | 18.32 | 69.31 |
| W13 | 6 | 493 | 359.81 | 18.32 | 65.87 |
| W14 | 6 | 493 | 360.26 | 18.32 | 67.22 |
| W15 | 6 | 493 | 359.66 | 18.32 | 67.66 |
| W16 | 6 | 493 | 360.11 | 18.32 | 69.01 |
| W17 | 6 | 493 | 342.21 | 18.31 | 75.82 |
| W18 | 6 | 493 | 345.36 | 18.24 | 74.92 |
| W19 | 6 | 493 | 342.06 | 18.31 | 77.61 |
| W20 | 6 | 493 | 345.21 | 18.24 | 76.71 |
| W21 | 6 | 503 | 369.96 | 18.30 | 76.32 |
| W22 | 6 | 513 | 374.96 | 18.31 | 77.12 |
| W23 | 6 | 503 | 369.81 | 18.30 | 78.11 |
| W24 | 6 | 513 | 374.81 | 18.31 | 78.91 |
| W25 | 6 | 453 | 285.01 | 18.28 | 56.42 |
| W26 | 6 | 443 | 285.46 | 18.27 | 56.92 |
| W27 | 6 | 453 | 284.86 | 18.28 | 58.21 |
| W28 | 6 | 443 | 285.31 | 18.27 | 58.71 |
| W29 | 6 | 463 | 345.16 | 18.30 | 58.32 |
| W30 | 6 | 453 | 345.66 | 18.30 | 58.92 |
| W31 | 6 | 463 | 345.01 | 18.30 | 60.11 |
| W32 | 6 | 453 | 345.51 | 18.30 | 60.71 |
| W33 | 6 | 443 | 284.86 | 18.33 | 58.72 |
| W34 | 6 | 443 | 285.46 | 18.33 | 60.52 |
| W35 | 6 | 443 | 284.71 | 18.33 | 60.51 |
| W36 | 6 | 443 | 285.31 | 18.33 | 62.31 |
| W37 | 6 | 443 | 344.86 | 18.27 | 59.92 |
| W38 | 6 | 443 | 345.46 | 18.27 | 61.72 |
| W39 | 6 | 443 | 344.71 | 18.27 | 61.71 |
| W40 | 6 | 443 | 345.31 | 18.27 | 63.51 |
| W41 | 6 | 453 | 298.01 | 18.28 | 72.02 |
| W42 | 6 | 463 | 304.06 | 18.26 | 72.52 |
| W43 | 6 | 453 | 297.86 | 18.28 | 73.81 |
| W44 | 6 | 463 | 303.91 | 18.26 | 74.31 |
| W45 | 6 | 463 | 359.16 | 18.30 | 75.12 |
| W46 | 6 | 473 | 365.56 | 18.27 | 75.52 |
| W47 | 6 | 463 | 359.01 | 18.30 | 76.91 |
| W48 | 6 | 473 | 365.41 | 18.27 | 77.31 |
| W49 | 6 | 533 | 374.11 | 18.27 | 76.22 |
| W50 | 6 | 533 | 374.46 | 18.32 | 76.92 |
| W51 | 6 | 533 | 373.96 | 18.27 | 78.01 |
| W52 | 6 | 533 | 374.31 | 18.32 | 78.71 |
| W53 | 6 | 523 | 334.36 | 18.25 | 81.62 |
| W54 | 6 | 523 | 334.66 | 18.29 | 82.22 |
| W55 | 6 | 523 | 334.21 | 18.25 | 83.41 |
| W56 | 6 | 523 | 334.51 | 18.29 | 84.01 |
| W57 | 6 | 523 | 373.96 | 18.26 | 77.02 |
| W58 | 6 | 523 | 374.26 | 18.26 | 77.92 |
| W59 | 6 | 523 | 373.81 | 18.26 | 78.81 |
| W60 | 6 | 523 | 374.11 | 18.26 | 79.71 |
| W61 | 6 | 523 | 334.36 | 18.32 | 83.12 |
| W62 | 6 | 523 | 334.66 | 18.32 | 84.02 |
| W63 | 6 | 523 | 334.21 | 18.32 | 84.91 |
| W64 | 6 | 523 | 334.51 | 18.32 | 85.81 |
| W65 | 6 | 533 | 381.11 | 18.27 | 84.62 |
| W66 | 6 | 543 | 385.06 | 18.30 | 85.72 |
| W67 | 6 | 533 | 380.96 | 18.27 | 86.41 |
| W68 | 6 | 543 | 384.91 | 18.30 | 87.51 |
| W69 | 6 | 523 | 340.36 | 18.25 | 88.82 |
| W70 | 6 | 533 | 343.96 | 18.28 | 90.02 |
| W71 | 6 | 523 | 340.21 | 18.25 | 90.61 |
| W72 | 6 | 533 | 343.81 | 18.28 | 91.81 |
| W73 | 6 | 543 | 413.86 | 18.25 | 69.22 |
| W74 | 6 | 543 | 414.26 | 18.30 | 70.02 |
| W75 | 6 | 543 | 413.71 | 18.25 | 71.01 |
| W76 | 6 | 543 | 414.11 | 18.30 | 71.81 |
| W77 | 6 | 543 | 396.26 | 18.25 | 70.72 |
| W78 | 6 | 543 | 396.66 | 18.30 | 71.52 |
| W79 | 6 | 543 | 396.11 | 18.25 | 72.51 |
| W80 | 6 | 543 | 396.51 | 18.30 | 73.31 |
| W81 | 6 | 533 | 413.71 | 18.25 | 70.27 |
| W82 | 6 | 533 | 414.06 | 18.25 | 71.32 |
| W83 | 6 | 533 | 413.56 | 18.25 | 72.06 |
| W84 | 6 | 533 | 413.91 | 18.25 | 73.11 |
| W85 | 6 | 533 | 396.11 | 18.25 | 71.77 |
| W86 | 6 | 533 | 396.46 | 18.25 | 72.82 |
| W87 | 6 | 533 | 395.96 | 18.25 | 73.56 |
| W88 | 6 | 533 | 396.31 | 18.25 | 74.61 |
| W89 | 6 | 543 | 421.86 | 18.25 | 78.82 |
| W90 | 6 | 553 | 426.16 | 18.27 | 79.82 |
| W91 | 6 | 543 | 421.71 | 18.25 | 80.61 |
| W92 | 6 | 553 | 426.01 | 18.27 | 81.61 |
| W93 | 6 | 543 | 404.26 | 18.25 | 80.32 |
| W94 | 6 | 553 | 408.56 | 18.27 | 81.32 |
| W95 | 6 | 543 | 404.11 | 18.25 | 82.11 |
| W96 | 6 | 553 | 408.41 | 18.27 | 83.11 |
| W97 | 6 | 398 | 154.26 | 18.28 | 60.82 |
| W98 | 6 | 398 | 154.66 | 18.33 | 61.62 |
| W99 | 6 | 398 | 154.11 | 18.28 | 62.61 |
| W100 | 6 | 398 | 154.51 | 18.33 | 63.41 |
| W101 | 6 | 418 | 184.56 | 18.26 | 63.12 |
| W102 | 6 | 418 | 185.06 | 18.33 | 64.12 |
| W103 | 6 | 418 | 184.41 | 18.26 | 64.91 |
| W104 | 6 | 418 | 184.91 | 18.33 | 65.91 |
| W105 | 6 | 388 | 154.11 | 18.27 | 61.87 |
| W106 | 6 | 388 | 154.46 | 18.27 | 62.92 |
| W107 | 6 | 388 | 153.96 | 18.27 | 63.66 |
| W108 | 6 | 388 | 154.31 | 18.27 | 64.71 |
| W109 | 6 | 408 | 184.41 | 18.29 | 64.67 |
| W110 | 6 | 408 | 184.46 | 18.29 | 66.02 |
| W111 | 6 | 408 | 184.26 | 18.29 | 66.46 |
| W112 | 6 | 408 | 184.71 | 18.29 | 67.81 |
| W113 | 6 | 398 | 162.26 | 18.28 | 70.42 |
| W114 | 6 | 408 | 166.56 | 18.29 | 71.42 |
| W115 | 6 | 398 | 162.11 | 18.28 | 72.21 |
| W116 | 6 | 408 | 166.41 | 18.29 | 73.21 |
| W117 | 6 | 418 | 194.56 | 18.26 | 77.02 |
| W118 | 6 | 428 | 199.56 | 18.27 | 75.92 |
| W119 | 6 | 418 | 194.41 | 18.26 | 76.91 |
| W120 | 6 | 428 | 199.41 | 18.27 | 77.71 |
| W121 | 6 | 453 | 183.96 | 18.33 | 64.02 |
| W122 | 6 | 443 | 184.06 | 18.27 | 63.82 |
| W123 | 6 | 453 | 183.81 | 18.33 | 65.81 |
| W124 | 6 | 443 | 183.91 | 18.27 | 65.61 |
| W125 | 6 | 473 | 221.76 | 18.27 | 66.42 |
| W126 | 6 | 473 | 222.16 | 18.32 | 67.22 |
| W127 | 6 | 473 | 221.61 | 18.27 | 68.21 |
| W128 | 6 | 473 | 222.01 | 18.32 | 69.01 |
| W129 | 6 | 443 | 183.81 | 18.30 | 64.57 |
| W130 | 6 | 443 | 184.06 | 18.30 | 65.32 |
| W131 | 6 | 443 | 183.66 | 18.30 | 66.36 |
| W132 | 6 | 443 | 183.91 | 18.30 | 67.11 |
| W133 | 6 | 463 | 221.61 | 18.27 | 67.47 |
| W134 | 6 | 463 | 221.96 | 18.27 | 68.52 |
| W135 | 6 | 463 | 221.46 | 18.27 | 69.26 |
| W136 | 6 | 463 | 221.81 | 18.27 | 70.31 |
| W137 | 6 | 453 | 189.96 | 18.33 | 71.22 |
| W138 | 6 | 453 | 192.06 | 18.28 | 70.62 |
| W139 | 6 | 453 | 189.81 | 18.33 | 73.01 |
| W140 | 6 | 453 | 191.91 | 18.28 | 72.41 |
| W141 | 6 | 473 | 229.76 | 18.27 | 76.02 |
| W142 | 6 | 483 | 234.06 | 18.29 | 77.02 |
| W143 | 6 | 473 | 229.61 | 18.27 | 77.81 |
| W144 | 6 | 483 | 233.91 | 18.29 | 78.81 |
| W145 | 7 | 403 | 525.76 | 18.29 | 72.12 |
| W146 | 7 | 393 | 526.46 | 18.32 | 73.12 |
| W147 | 7 | 403 | 525.61 | 18.29 | 73.91 |
| W148 | 7 | 393 | 526.31 | 18.32 | 74.91 |
| W149 | 7 | 383 | 525.46 | 18.31 | 74.72 |
| W150 | 7 | 383 | 526.26 | 18.31 | 77.12 |
| W151 | 7 | 383 | 525.31 | 18.31 | 76.51 |
| W152 | 7 | 383 | 526.11 | 18.31 | 78.91 |
| W153 | 7 | 403 | 543.76 | 18.29 | 93.72 |
| W154 | 7 | 423 | 553.06 | 18.31 | 95.52 |
| W155 | 7 | 403 | 543.61 | 18.29 | 95.51 |
| W156 | 7 | 423 | 552.91 | 18.31 | 97.31 |
References
- Baloi, D. Sustainable construction: Challenges and opportunities. In Proceedings of 19th Annual ARCOM Conference, Brighton, UK, 3–5 September 2003; Greenwood, D.J., Ed.; University of Brighton: Brighton, UK, 2003; Volume 1, pp. 289–297. ISBN 0953416186. [Google Scholar]
- Orlitz, O.; Castells, F.; Sonnemann, G. Sustainability in the construction industry: A review of recent developments based on LCA. Constr. Build. Mater. 2009, 23, 28–39. [Google Scholar] [CrossRef]
- Van der Heijden, J. The new governance for low-carbon buildings: Mapping, exploring, interrogating. Build. Res. Inf. 2016, 44, 575–584. [Google Scholar] [CrossRef]
- Chang, R.D.; Zuo, J.; Zhao, Z.Y.; Soebarto, V.; Lu, Y.; Zillante, G.; Gan, X.L. Sustainability attitude and performance of construction enterprises: A China study. J. Clean. Prod. 2018, 172, 1440–1451. [Google Scholar] [CrossRef]
- Sartori, I.; Hestnes, A.G. Energy use in the life cycle of conventional and low-energy buildings: A review article. Energy Build. 2007, 39, 249–257. [Google Scholar] [CrossRef]
- Häkkinen, T.; Belloni, K. Barriers and drivers for sustainable building. Build. Res. Inf. 2011, 39, 239–255. [Google Scholar] [CrossRef]
- Jensen, P.A.; Maslesa, E.; Berg, J.B.; Thuesen, C. 10 questions concerning sustainable building renovation. Build. Environ. 2018, 143, 130–137. [Google Scholar] [CrossRef]
- Asif, M.; Muneer, T.; Kelley, R. Life cycle assessment: A case study of a dwelling home in Scotland. Build. Environ. 2007, 42, 1391–1394. [Google Scholar] [CrossRef]
- May, N.; Guenther, E.; Haller, P. Environmental indicators for the evaluation of wood products in consideration of site-dependent aspects: A review and integrated approach. Sustainability 2017, 9, 1897. [Google Scholar] [CrossRef]
- Lasvaux, S.; Habert, G.; Peuportier, B.; Chevalier, J. Comparison of generic and product-specific Life Cycle Assessment databases: Application to construction materials used in building LCA studies. Int. J. Life Cycle Assess. 2015, 20, 1473–1490. [Google Scholar] [CrossRef]
- Islam, H.; Jollands, M.; Setunge, S. Life cycle assessment and life cycle cost implication of residential buildings—A review. Renew. Sustain. Energy Rev. 2015, 42, 129–140. [Google Scholar] [CrossRef]
- Peuportier, B.; Herfray, G.; Malmqvist, T.; Zalabza, I.; Staller, H.; Tritthart, W.; Wetzel, C.; Szalay, Z. Life cycle assessment methodologies in the construction sector: The contribution of the European LORE-LCA project. In Proceedings of the International Conference of Sustainable Buildings (SB11), Helsinki, Finland, 18–21 October 2011; VTT Technical Research Centre of Finland: Helsinki, Finland, 2011. [Google Scholar]
- Takano, A.; Winter, S.; Hughes, M.; Linkosalmi, L. Comparison of life cycle assessment databases: A case study on building assessment. Build. Environ. 2014, 79, 20–30. [Google Scholar] [CrossRef]
- Eco Invent LCI Database. Available online: https://simapro.com/databases/ecoinvent/ (accessed on 8 January 2019).
- Martínez-Rocamora, A.; Solis-Guzman, J.; Marrero, M. LCA databases focused on construction materials: A review. Renew. Sustain. Energy Rev. 2016, 58, 565–573. [Google Scholar] [CrossRef]
- Nienborg, B.; Helling, T.; Fröhlich, D.; Horn, R.; Munz, G.; Schossig, P. Closed adsorption heat storage—A life cycle assessment on material and component levels. Energies 2018, 11, 3421. [Google Scholar] [CrossRef]
- Mitterpach, J.; Štefko, J. An environmental impact of a wooden and brick house by the LCA Method. Key Eng. Mater. 2016, 688, 204–209. [Google Scholar] [CrossRef]
- Rossi, B.; Marique, A.F.; Glaumann, M.; Reiter, S. Life-cycle assessment of residential buildings in three different European locations, basic tool. Build. Environ. 2012, 51, 395–401. [Google Scholar] [CrossRef]
- ISO EN 15804:2012+A1:2013. Sustainability of Construction Works. Environmental Product Declarations. Core Rules for the Product Category of Construction Products; European Committee for Standardization: Brussels, Belgium, 2013. [Google Scholar]
- Pujadas-Gispert, E.; Sanjuan-Delmás, D.; Josa, A. Environmental analysis of building shallow foundations: The influence of prefabrication, typology, and structural design codes. J. Clean. Prod. 2018, 186, 407–417. [Google Scholar] [CrossRef]
- Long, W.J.; Zheng, D.; Duan, H.; Han, N.; Xing, F. Performance enhancement and environmental impact of cement composites containing graphene oxide with recycled fine aggregates. J. Clean. Prod. 2018, 194, 193–202. [Google Scholar] [CrossRef]
- Hay, R.; Ostertag, C.P. Life cycle assessment (LCA) of double-skin façade (DSF) system with fiber-reinforced concrete for sustainable and energy-efficient buildings in the tropics. Build. Environ. 2018, 142, 327–341. [Google Scholar] [CrossRef]
- Maxineasa, S.B.; Entuc, I.S.; Taranu, N.; Florenta, I.; Secu, A. Environmental performances of different timber structures for pitched roofs. J. Clean. Prod. 2018, 175, 164–175. [Google Scholar] [CrossRef]
- Tumminia, G.; Guarino, F.; Longo, S.; Ferraro, M.; Antonucci, V. Life cycle energy performances and environmental impacts of a prefabricated building module. Renew. Sustain. Energy Rev. 2018, 92, 272–283. [Google Scholar] [CrossRef]
- Vilčeková, S.; Čuláková, M.; Krídlová-Burdová, E.; Katunská, J. Energy and environmental evaluation of non-transparent constructions of building envelope for wooden houses. Energies 2015, 8, 11047–11075. [Google Scholar] [CrossRef]
- Estokova, A.; Porhincak, M. Reduction of primary energy and CO2 emissions through selection and environmental evaluation of building materials. Theor. Found. Chem. Eng. 2012, 46, 704–712. [Google Scholar] [CrossRef]
- Evangelista, P.P.A.; Kiperstok, A.; Torres, E.A.; Gonçalves, J.P. Environmental performance analysis of residential buildings in Brazil using life cycle assessment (LCA). Constr. Build. Mater. 2018, 169, 748–761. [Google Scholar] [CrossRef]
- Vilches, A.; Garcia-Martinez, A.; Sanchez-Montañes, B. Life cycle assessment (LCA) of building refurbishment: A literature review. Energy Build. 2017, 135, 286–301. [Google Scholar] [CrossRef]
- Hafner, A.; Schäfer, S. Comparative LCA study of different timber and mineral buildings and calculation method for substitution factors on building level. J. Clean. Prod. 2017, 167, 630–642. [Google Scholar] [CrossRef]
- Ingrao, C.; Messineo, A.; Beltramo, R.; Yigitcanlar, T.; Ioppolo, G. How can life cycle thinking support sustainability of buildings? Investigating life cycle assessment applications for energy efficiency and environmental performance. J. Clean. Prod. 2018, 201, 556–569. [Google Scholar] [CrossRef]
- Abeysundara, U.G.; Babel, S.; Gheewala, S. A matrix in life cycle perspective for selecting sustainable materials for buildings in Sri Lanka. Build. Environ. 2009, 44, 997–1004. [Google Scholar] [CrossRef]
- Yin, B.C.L.; Laing, R.; Leon, M.; Mabon, L. An evaluation of sustainable construction perceptions and practices in Singapore. Sustain. Cities Soc. 2018, 39, 613–620. [Google Scholar] [CrossRef]
- Porhincak, M. Study of the Selected Building Structures in Terms of the Environmental Performance of Building Materials. Ph.D. Thesis, Technical University of Kosice, Kosice, Slovakia, 2013. [Google Scholar]
- STN 73 0540-2. Thermal Protection of Buildings. Thermal Performance of Buildings and Components. Part 2: Functional Requirements; Slovak Office of Standards, Metrology and Testing: Bratislava, Slovakia, 2012. [Google Scholar]
- Claisse, P.A. Civil Engineering Materials, 1st ed.; Elsevier: Oxford, UK, 2016; ISBN 9780081002759. [Google Scholar]
- Svoboda Software-Teplo 2017. Available online: https://kps.fsv.cvut.cz/index.php?lmut=cz&part=people&id=52&sub=369 (accessed on 10 September 2018).
- Salandin, A.; Soler, D. Computing the minimum construction cost of a building’s external wall taking into account its energy efficiency. J. Comput. Appl. Math. 2018, 338, 199–211. [Google Scholar] [CrossRef]
- Katunsky, D.; Lopusniak, M.; Bagona, M.; Dolníková, E.; Katunska, J.; Vertal, M. Simulations and measurements in industrial building research. J. Theor. Appl. Inf. Technol. 2012, 44, 40–50. [Google Scholar]
- Aktas, C.B.; Bilec, M.M. Impact of lifetime on US residential building LCA results. Int. J. Life Cycle Assess. 2012, 17, 337–349. [Google Scholar] [CrossRef]
- ReCiPe. Available online: https://www.pre-sustainability.com/recipe (accessed on 8 January 2019).
- Murray, C.J. Quantifying the burden of disease: The technical basis for disability-adjusted life years. Bull. World Health Organ. 1994, 72, 429–445. [Google Scholar] [PubMed]
- SimaPro Database Manual. Available online: https://www.pre-sustainability.com/download/manuals/DatabaseManualMethods.pdf (accessed on 8 January 2019).
- IPCC. AR4 Climate Change 2007: Synthesis Report. Available online: https://www.ipcc.ch/report/ar4/syr/ (accessed on 8 January 2019).
- Korviny, P. MCA7, Version 2.6; Software, Manual. 2010. Available online: https://korviny.cz/korviny/homepage/downloads (accessed on 8 January 2019).
- Linkov, I.; Moberg, E. Multi-Criteria Decision Analysis: Environmental Applications and Case Studies, 1st ed.; CRC Press: Boca Raton, FL, USA, 2012; ISBN 9781138072510. [Google Scholar]
- Baláž, R.; Tóth, S. Physical and Technical Parameters of the Roof Construction in the Climate Chamber Module, 1st ed.; TUKE: Kosice, Slovakia, 2017; ISBN 978-80-553-2889-8. [Google Scholar]
- Katunská, J.; Oberleová, J.; Rusnák, A.; Tóth, S. Diagnosis of elected industrial hall object and idea its reconstruction. Adv. Mater. Res. 2014, 1057, 19–26. [Google Scholar] [CrossRef]
- Zabalza, I. Use of LCA as a tool for building ecodesign. A case study of a low energy building in Spain. Energies 2013, 6, 3901–3921. [Google Scholar] [CrossRef]
- Gustavsson, L.; Joelsson, A. Life cycle primary energy analysis of residential buildings. Energy Build. 2010, 42, 210–220. [Google Scholar] [CrossRef]
- Abd Rashid, A.F.; Yusoff, S. A review of life cycle assessment method for building industry. Renew. Sustain. Energy Rev. 2015, 45, 244–248. [Google Scholar] [CrossRef]
Figure 1.
Schema of the external bearing wall.
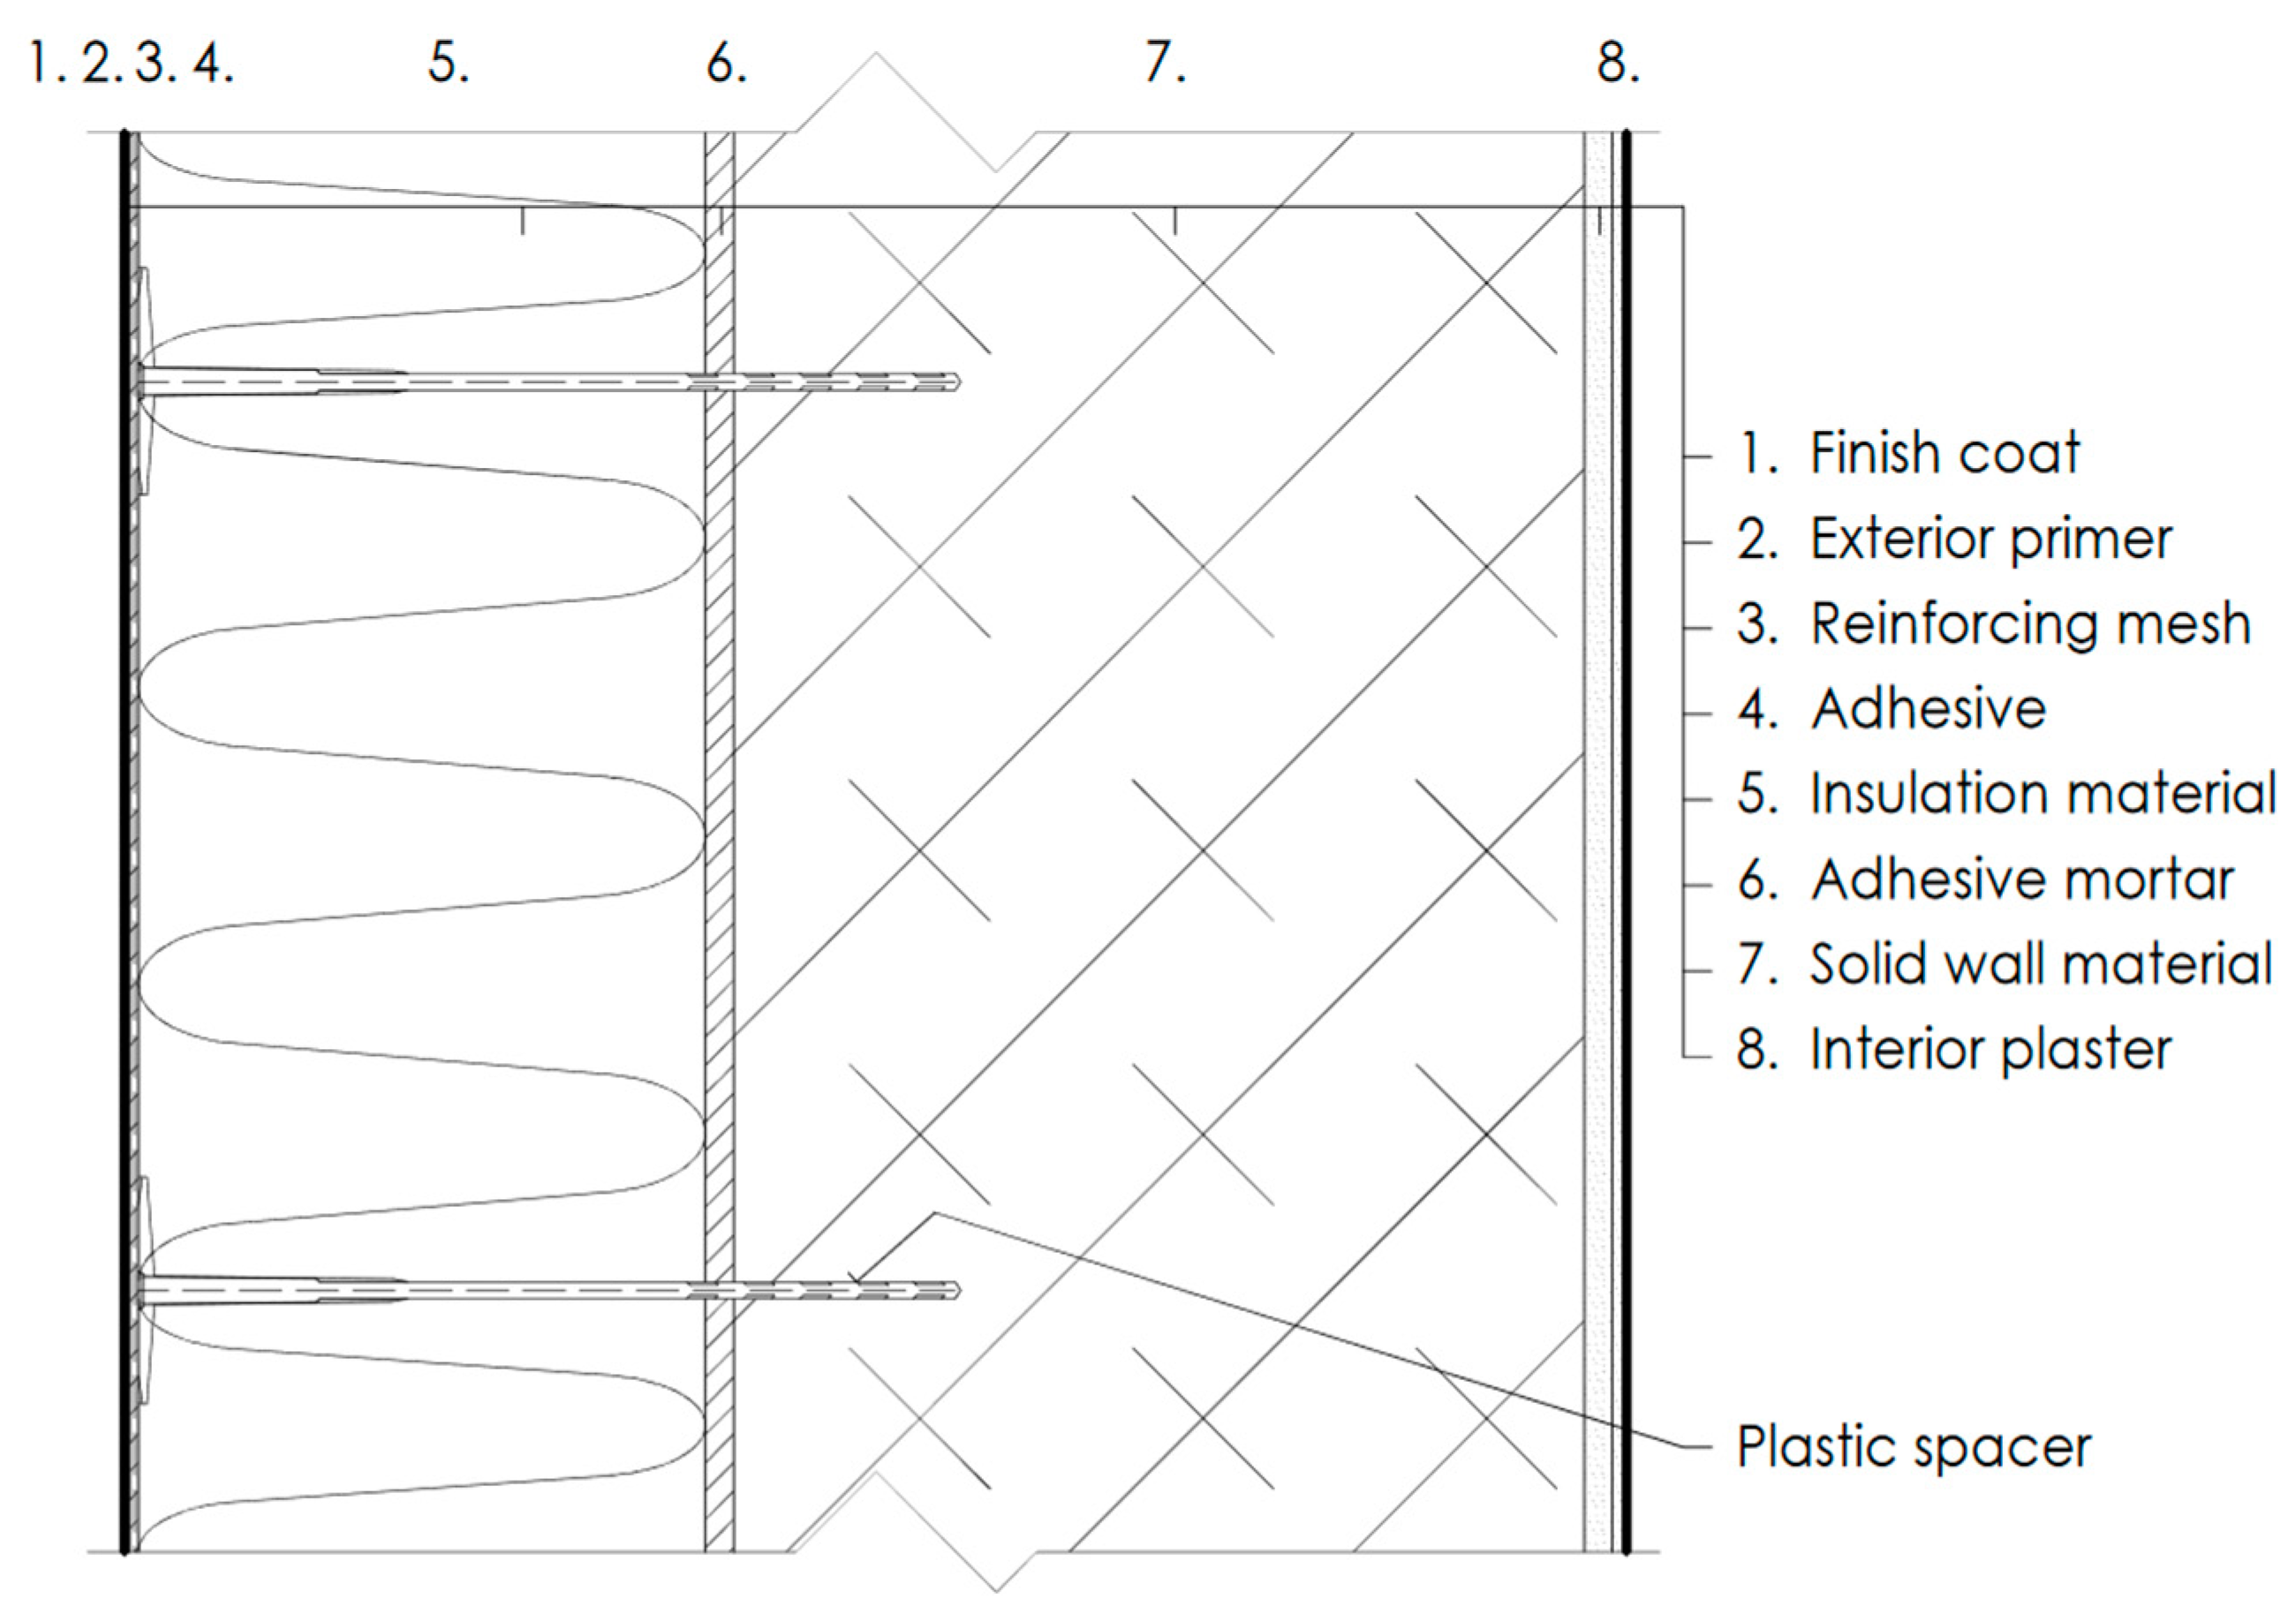
Figure 2.
Technical parameters of the evaluated structures: (a) Thickness, (b) weight, and (c) surface temperature.
Figure 2.
Technical parameters of the evaluated structures: (a) Thickness, (b) weight, and (c) surface temperature.
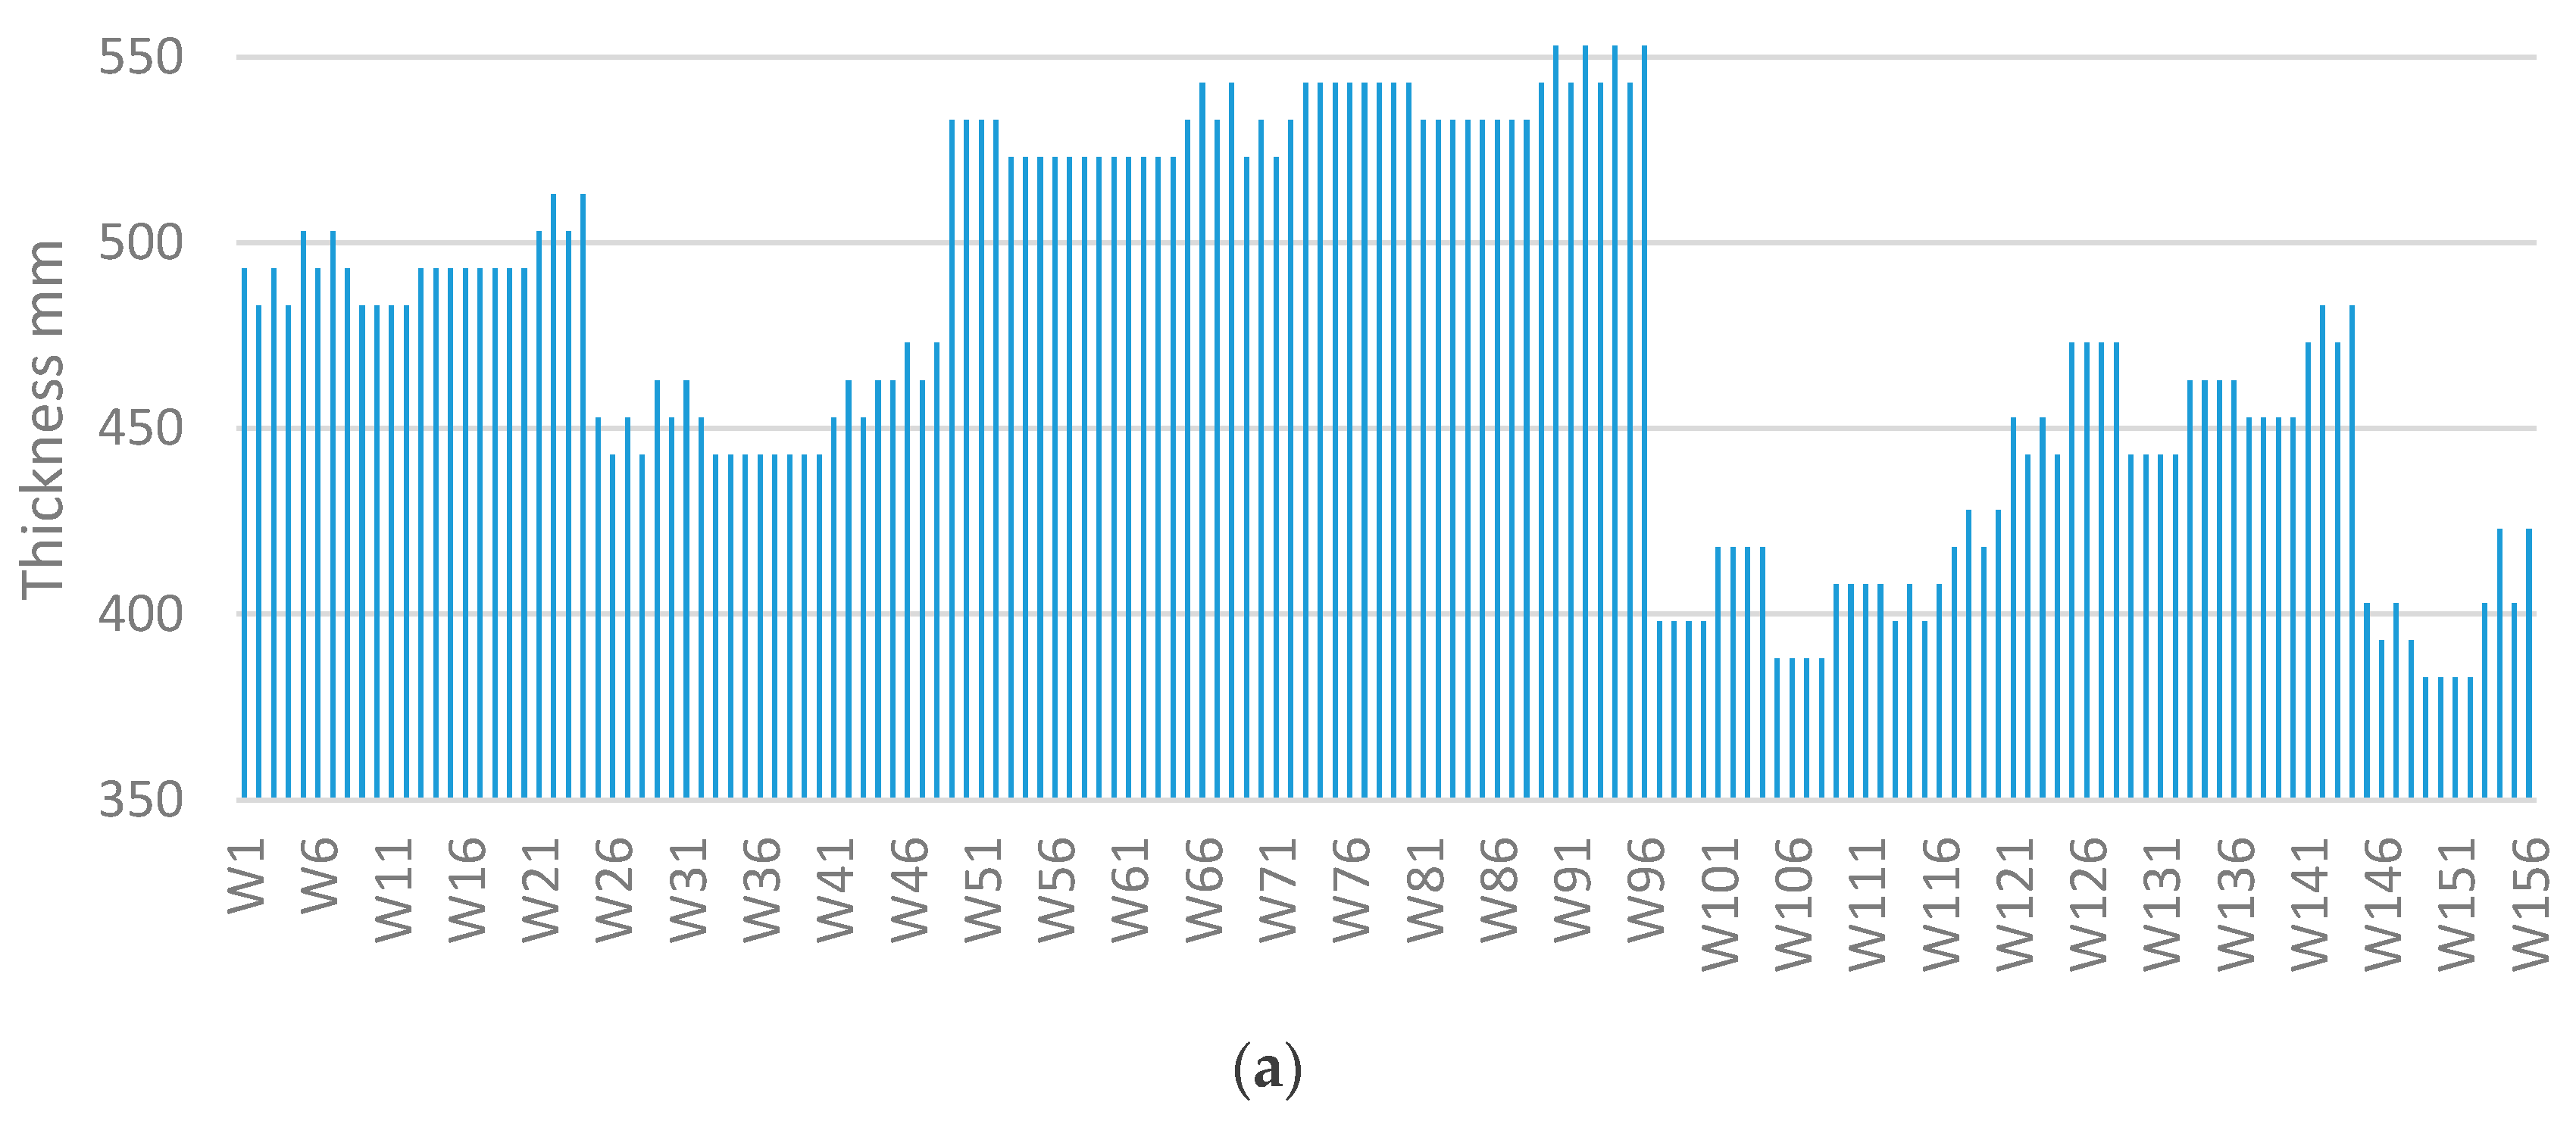
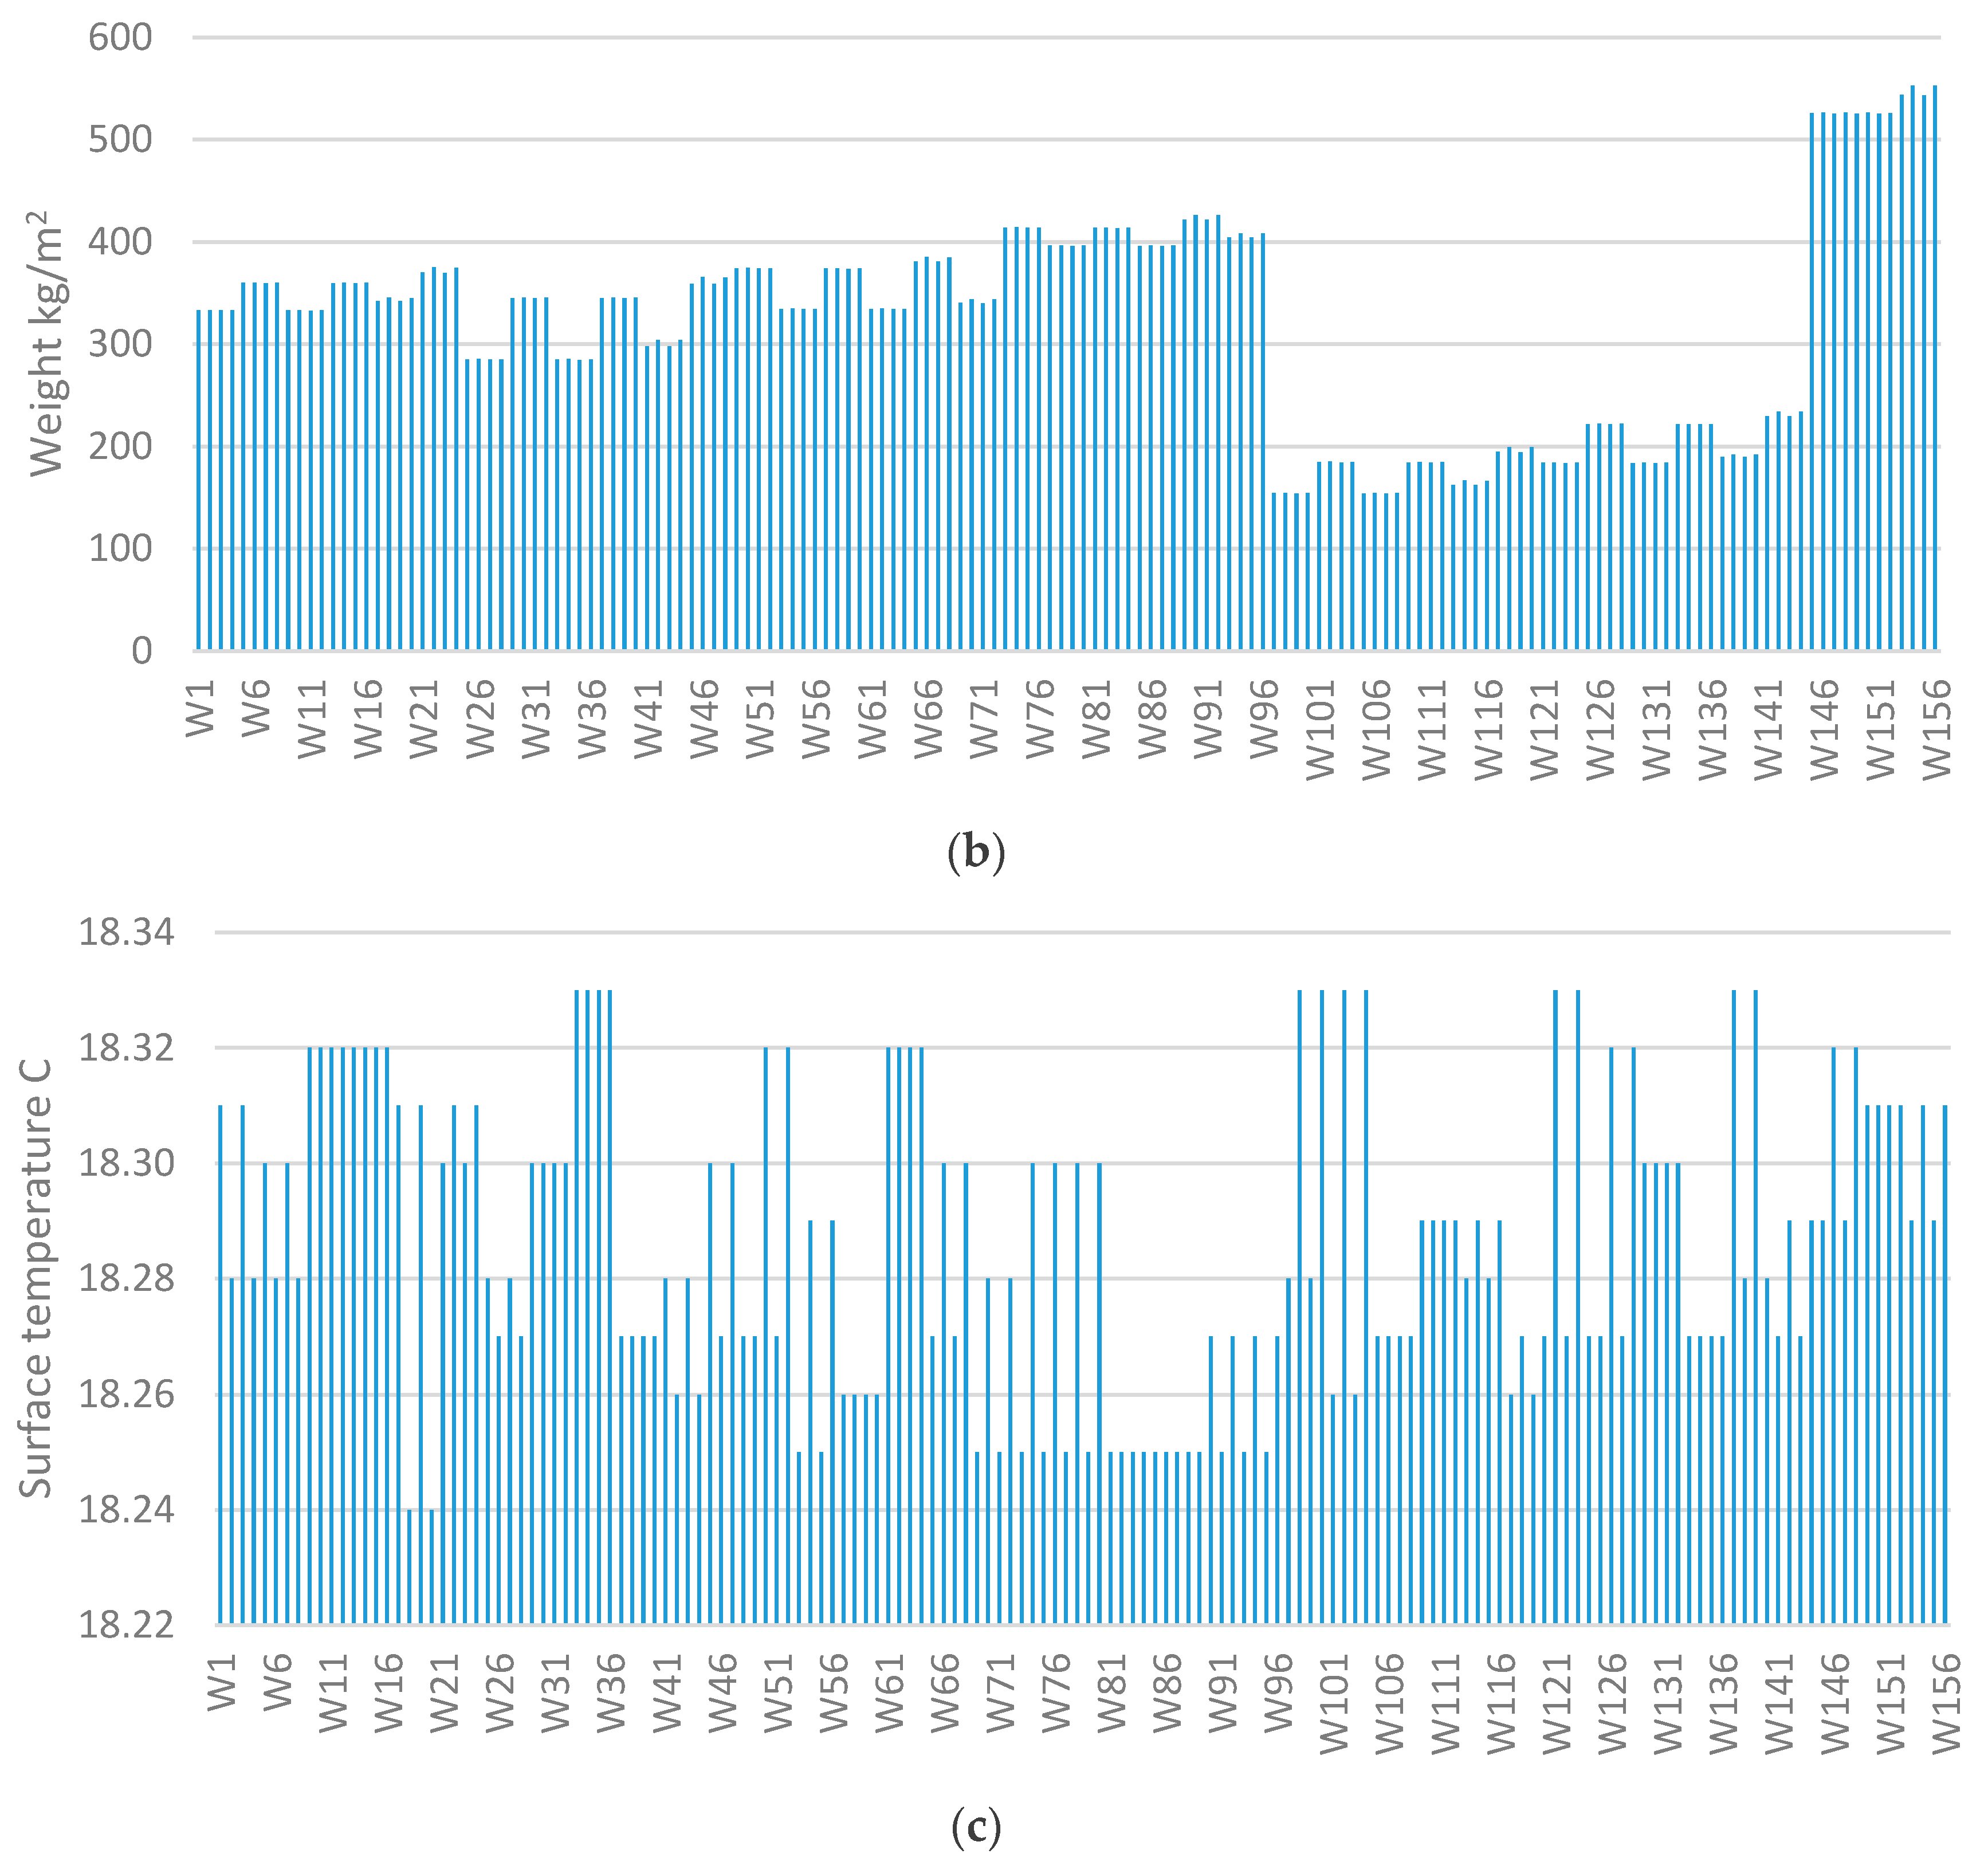
Figure 3.
Environmental loads of the evaluated structures.
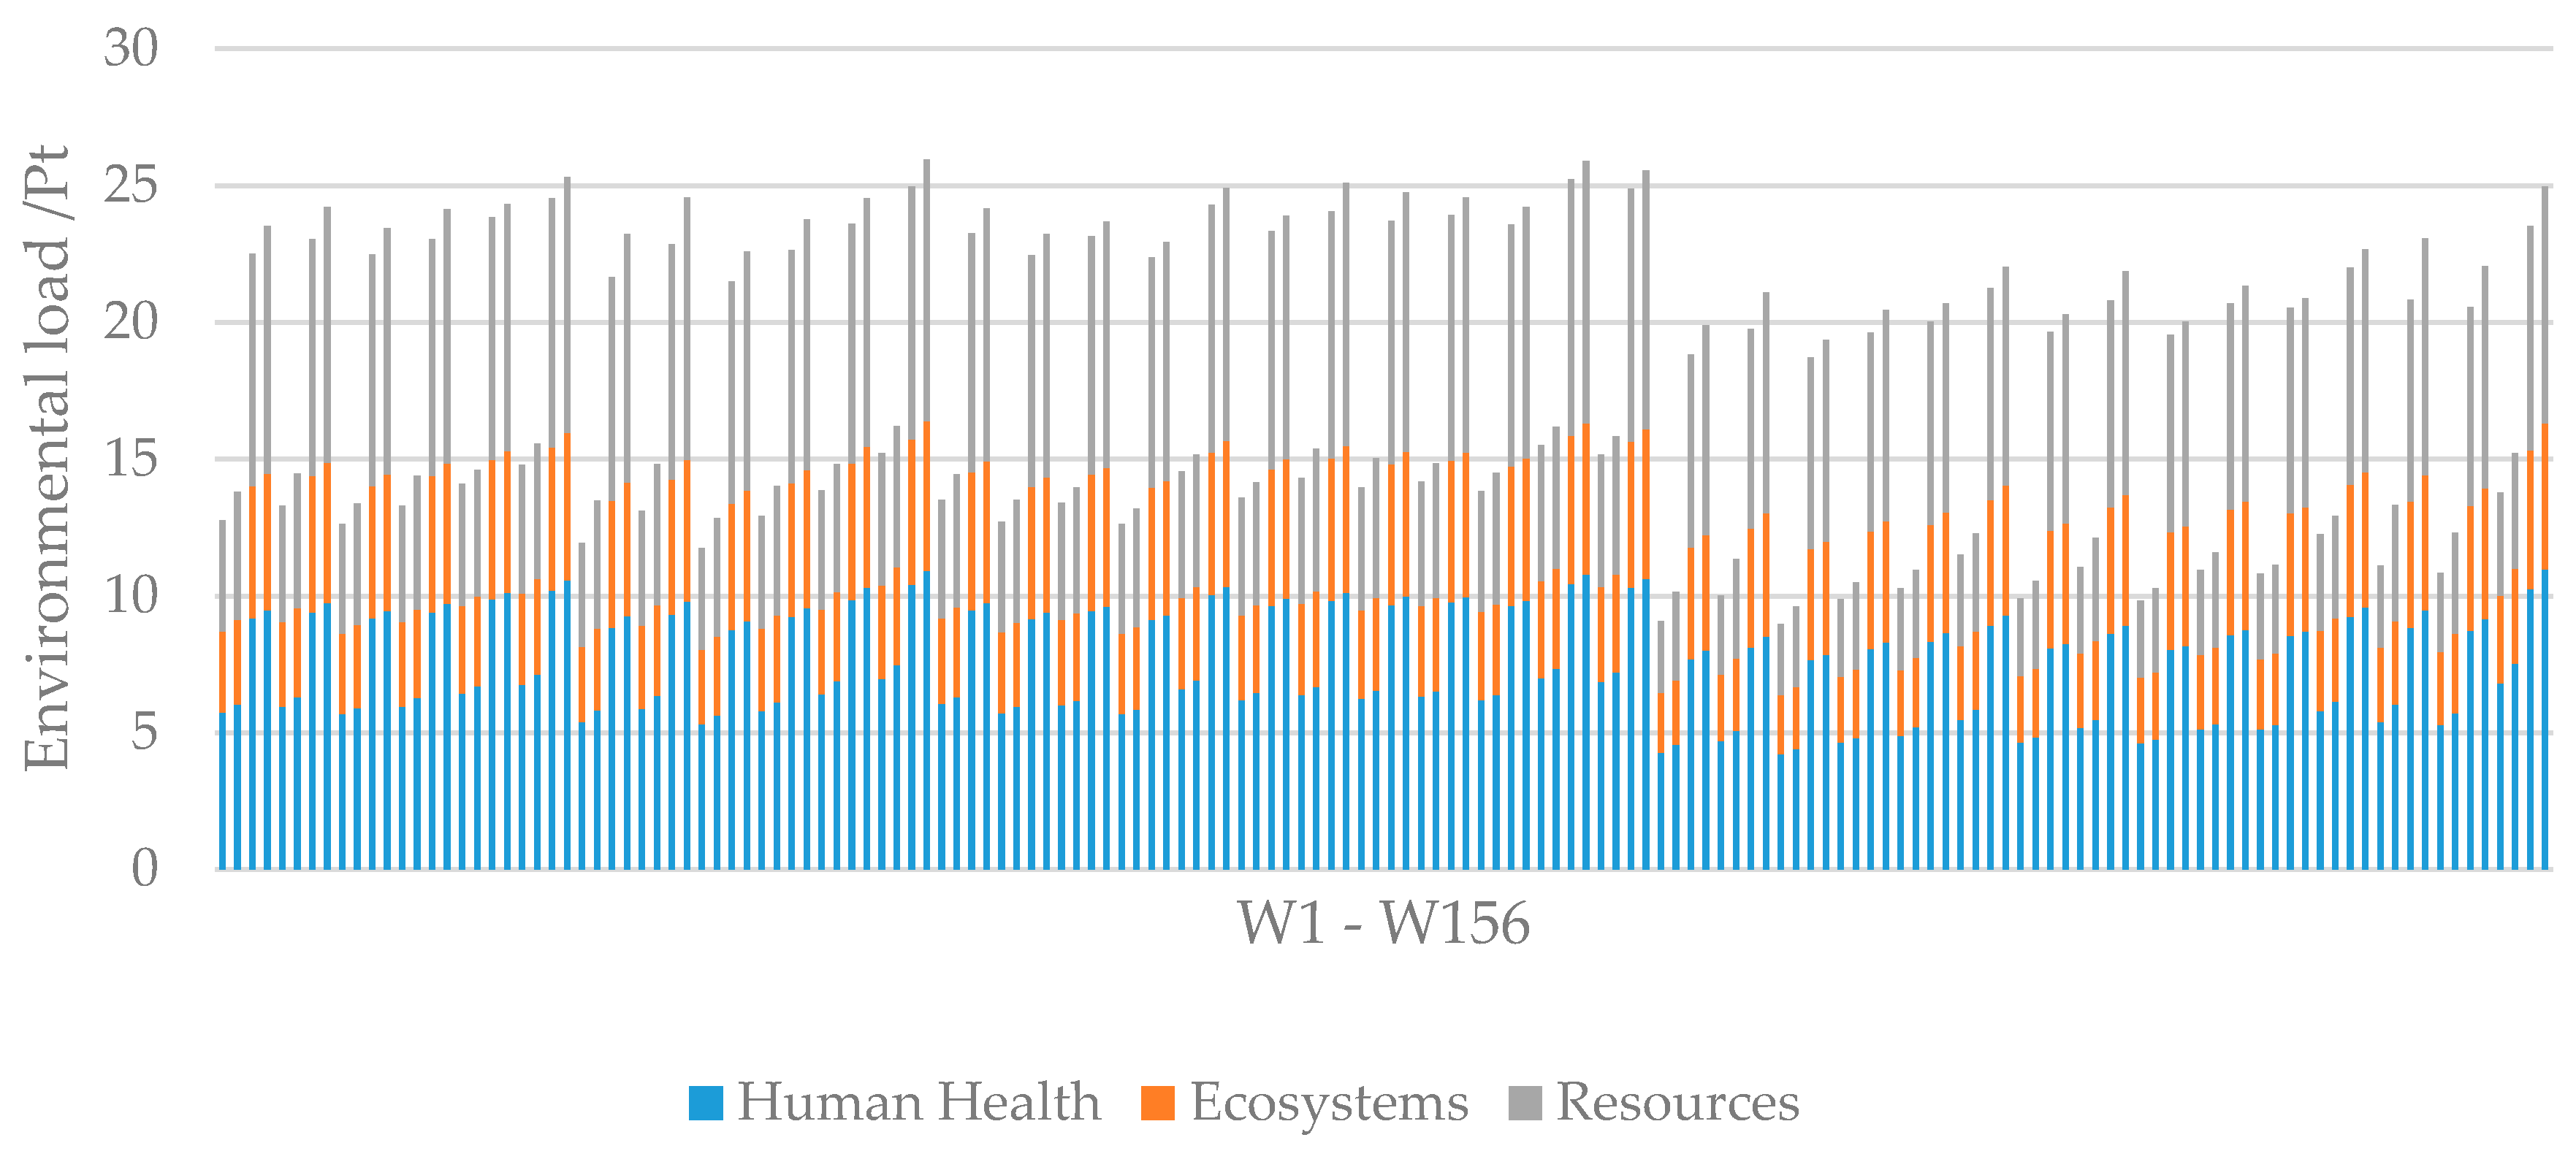
Figure 4.
Effect on human health as calculated for (a) brick structures, (b) aerated concrete (AC) structures, and (c) reinforced concrete (RC) structures.
Figure 4.
Effect on human health as calculated for (a) brick structures, (b) aerated concrete (AC) structures, and (c) reinforced concrete (RC) structures.
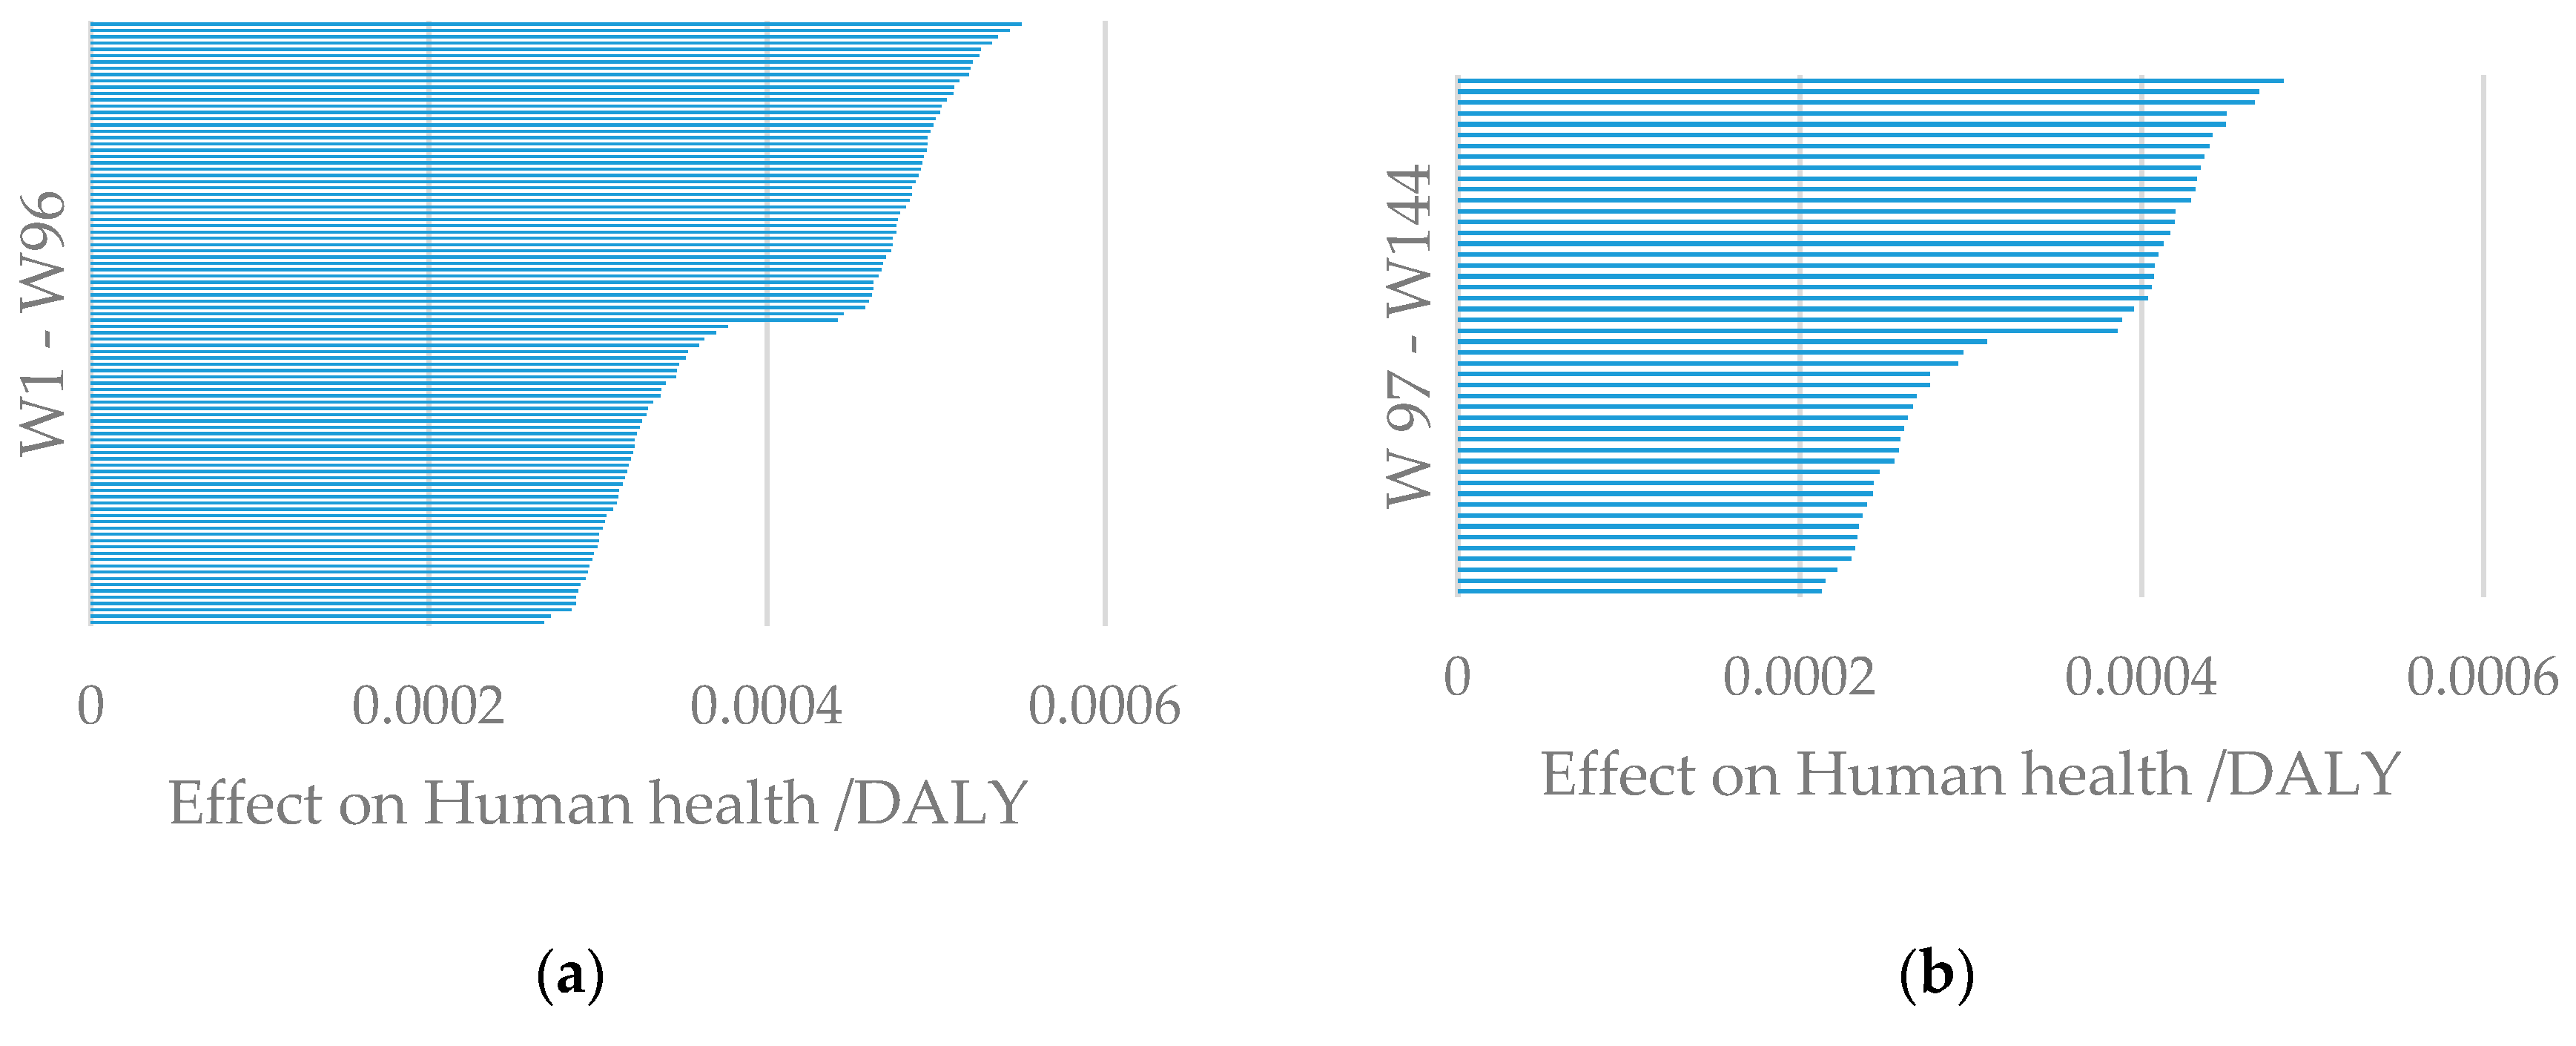
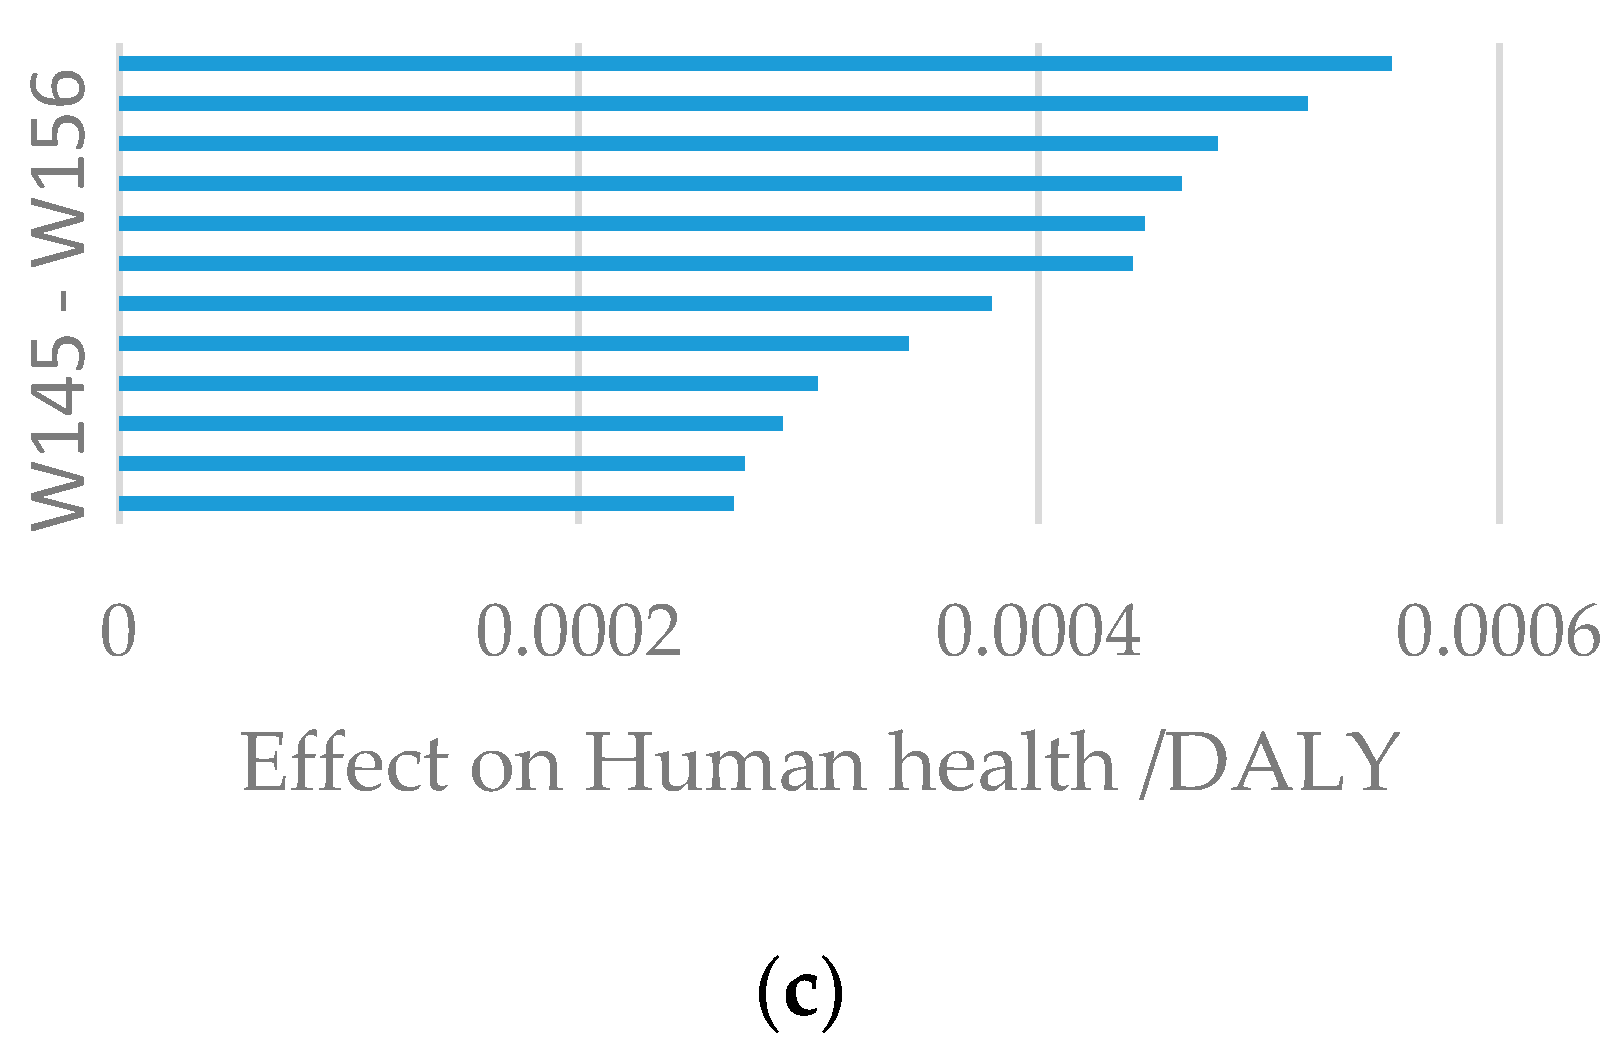
Figure 5.
Damage to ecosystem quality, as calculated for (a) brick structures, (b) AC structures, and (c) RC structures.
Figure 5.
Damage to ecosystem quality, as calculated for (a) brick structures, (b) AC structures, and (c) RC structures.

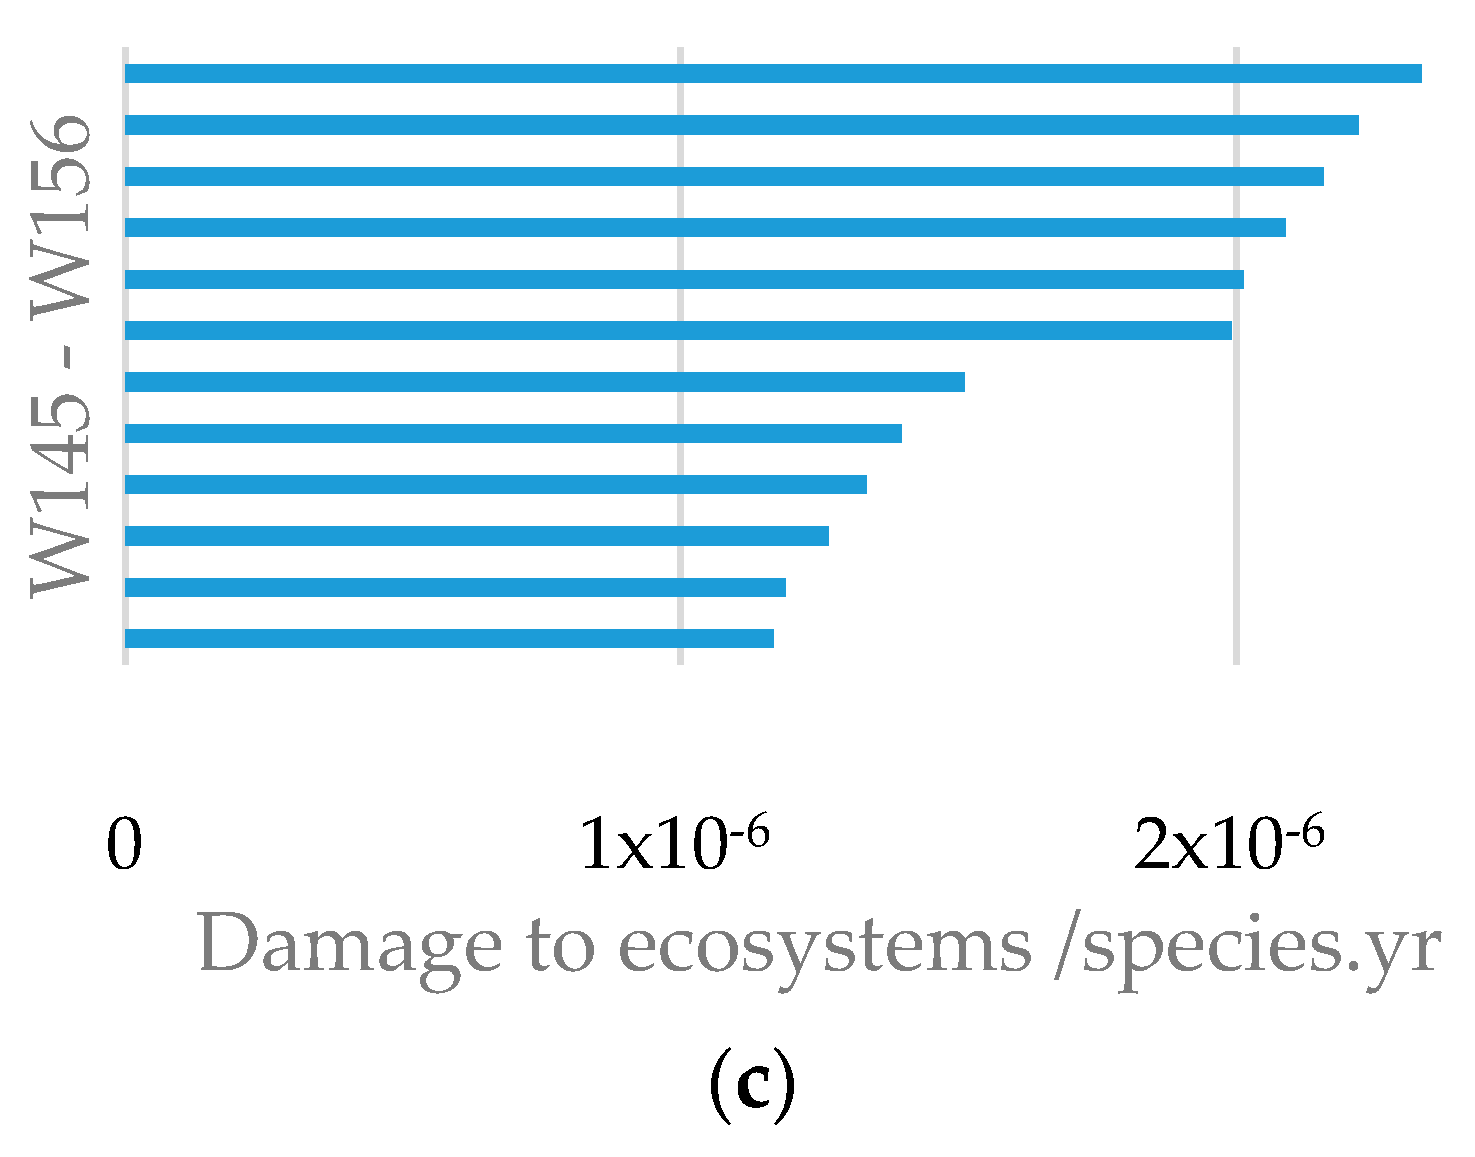
Figure 6.
Resource scarcity linked to the processing of (a) brick structures, (b) AC structures, and (c) RC structures.
Figure 6.
Resource scarcity linked to the processing of (a) brick structures, (b) AC structures, and (c) RC structures.

Figure 7.
Comparison of the best wall alternatives in the particular material groups: W33 (brick), W105 (aerated concrete), and W149 (reinforced concrete).
Figure 7.
Comparison of the best wall alternatives in the particular material groups: W33 (brick), W105 (aerated concrete), and W149 (reinforced concrete).

Figure 8.
Relationship between the PEI (primary energy) and the thickness of the evaluated structures.
Figure 8.
Relationship between the PEI (primary energy) and the thickness of the evaluated structures.

Figure 9.
Relationship between the PEI and the weights of the evaluated structures.
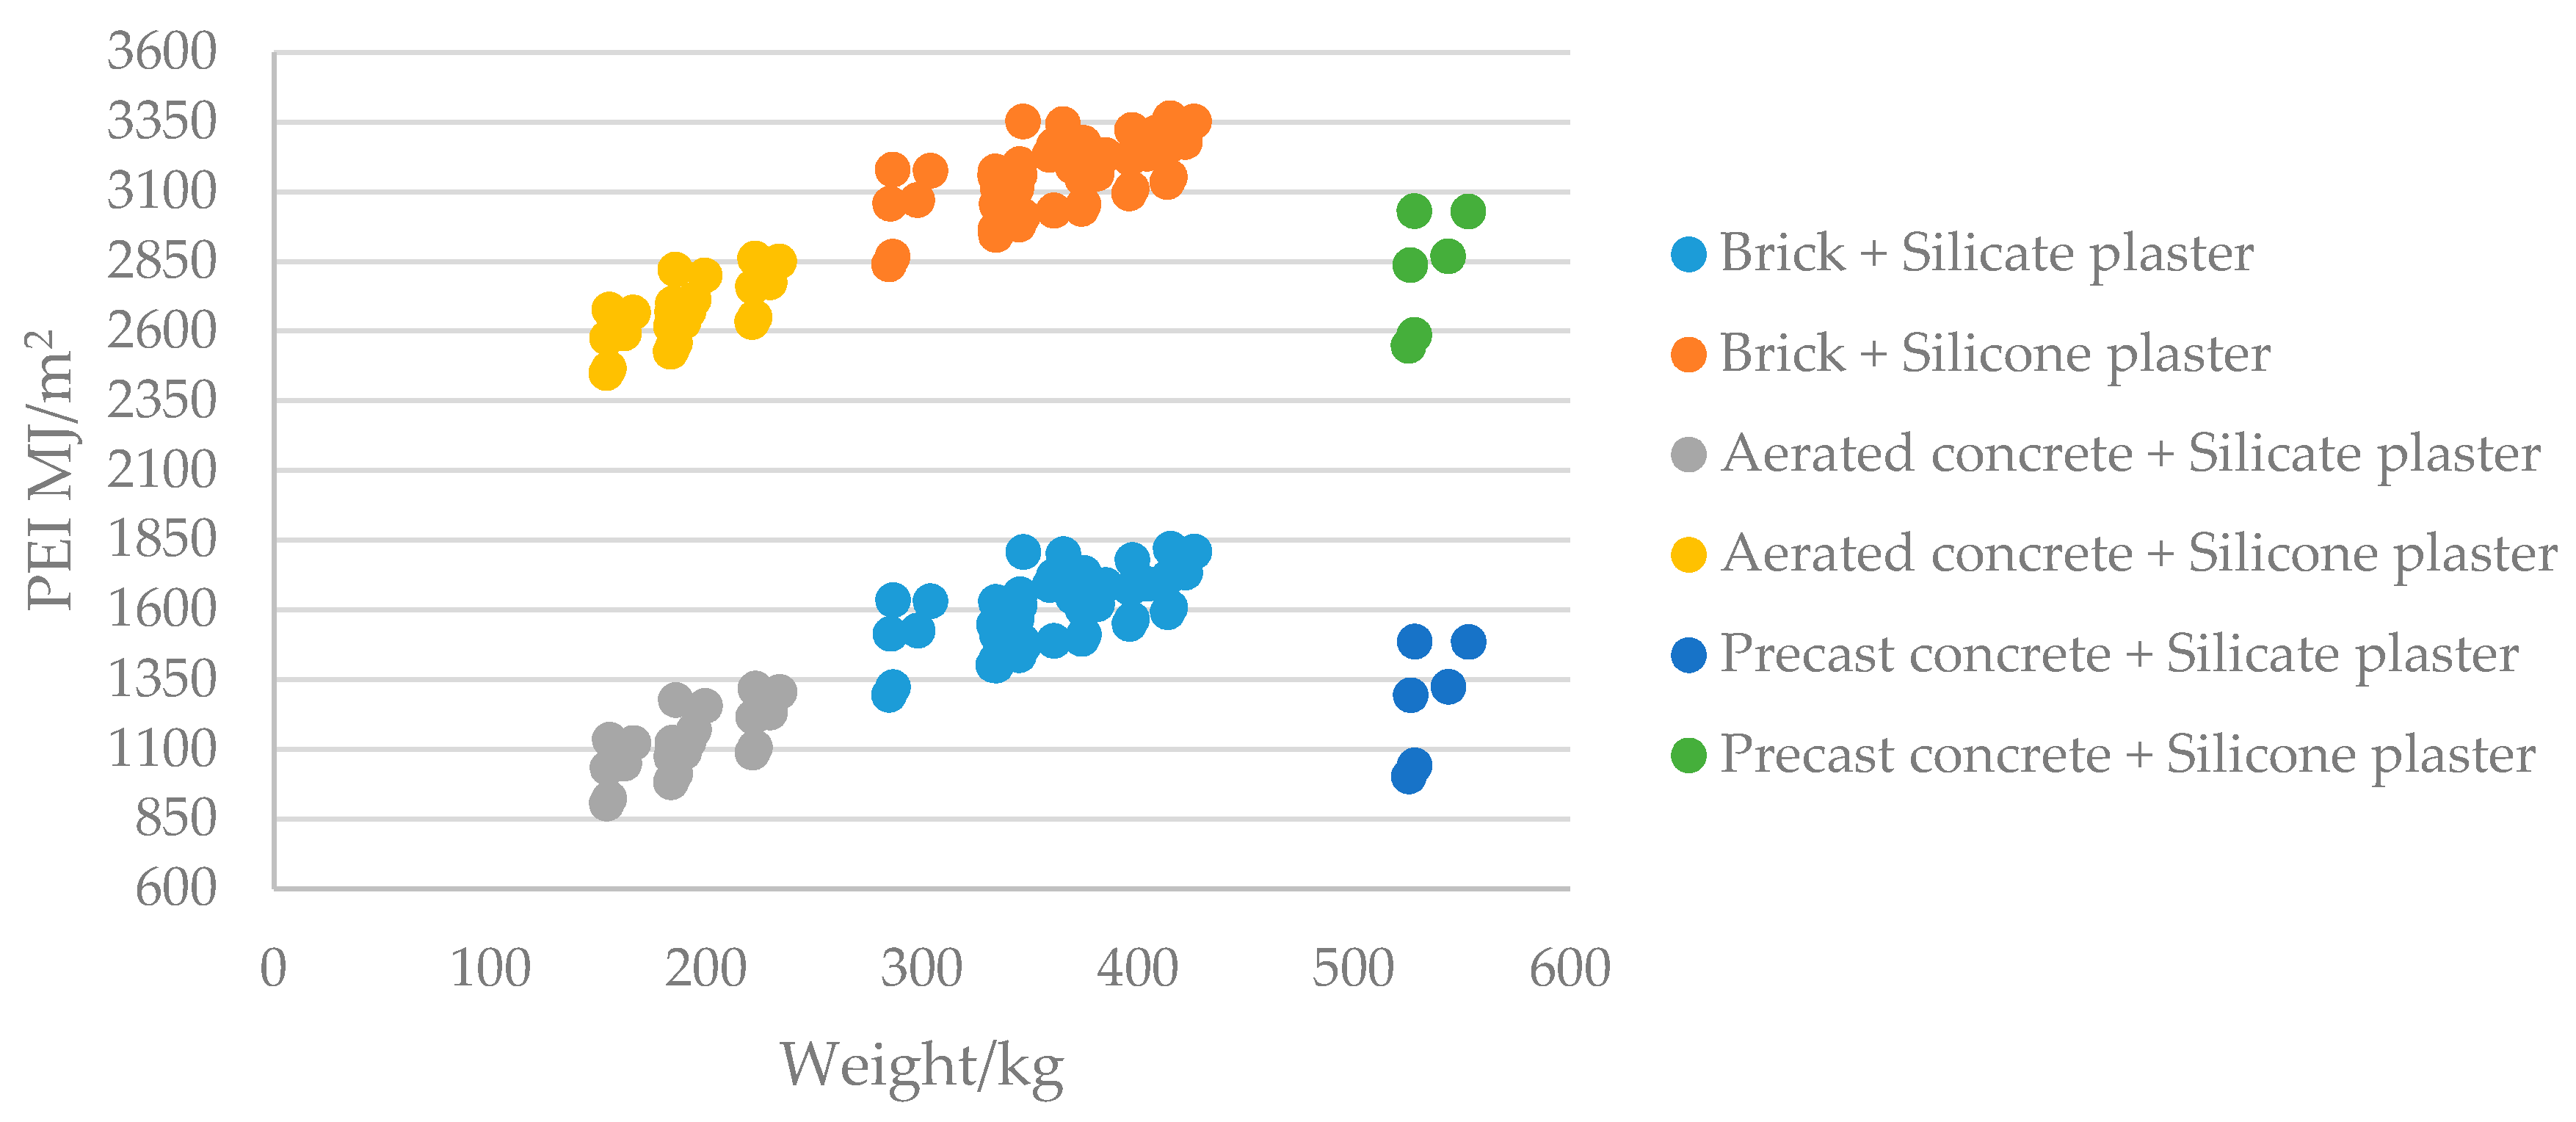
Figure 10.
Relationship between the GWP (global warming potential) and the thicknesses of the evaluated structures.
Figure 10.
Relationship between the GWP (global warming potential) and the thicknesses of the evaluated structures.
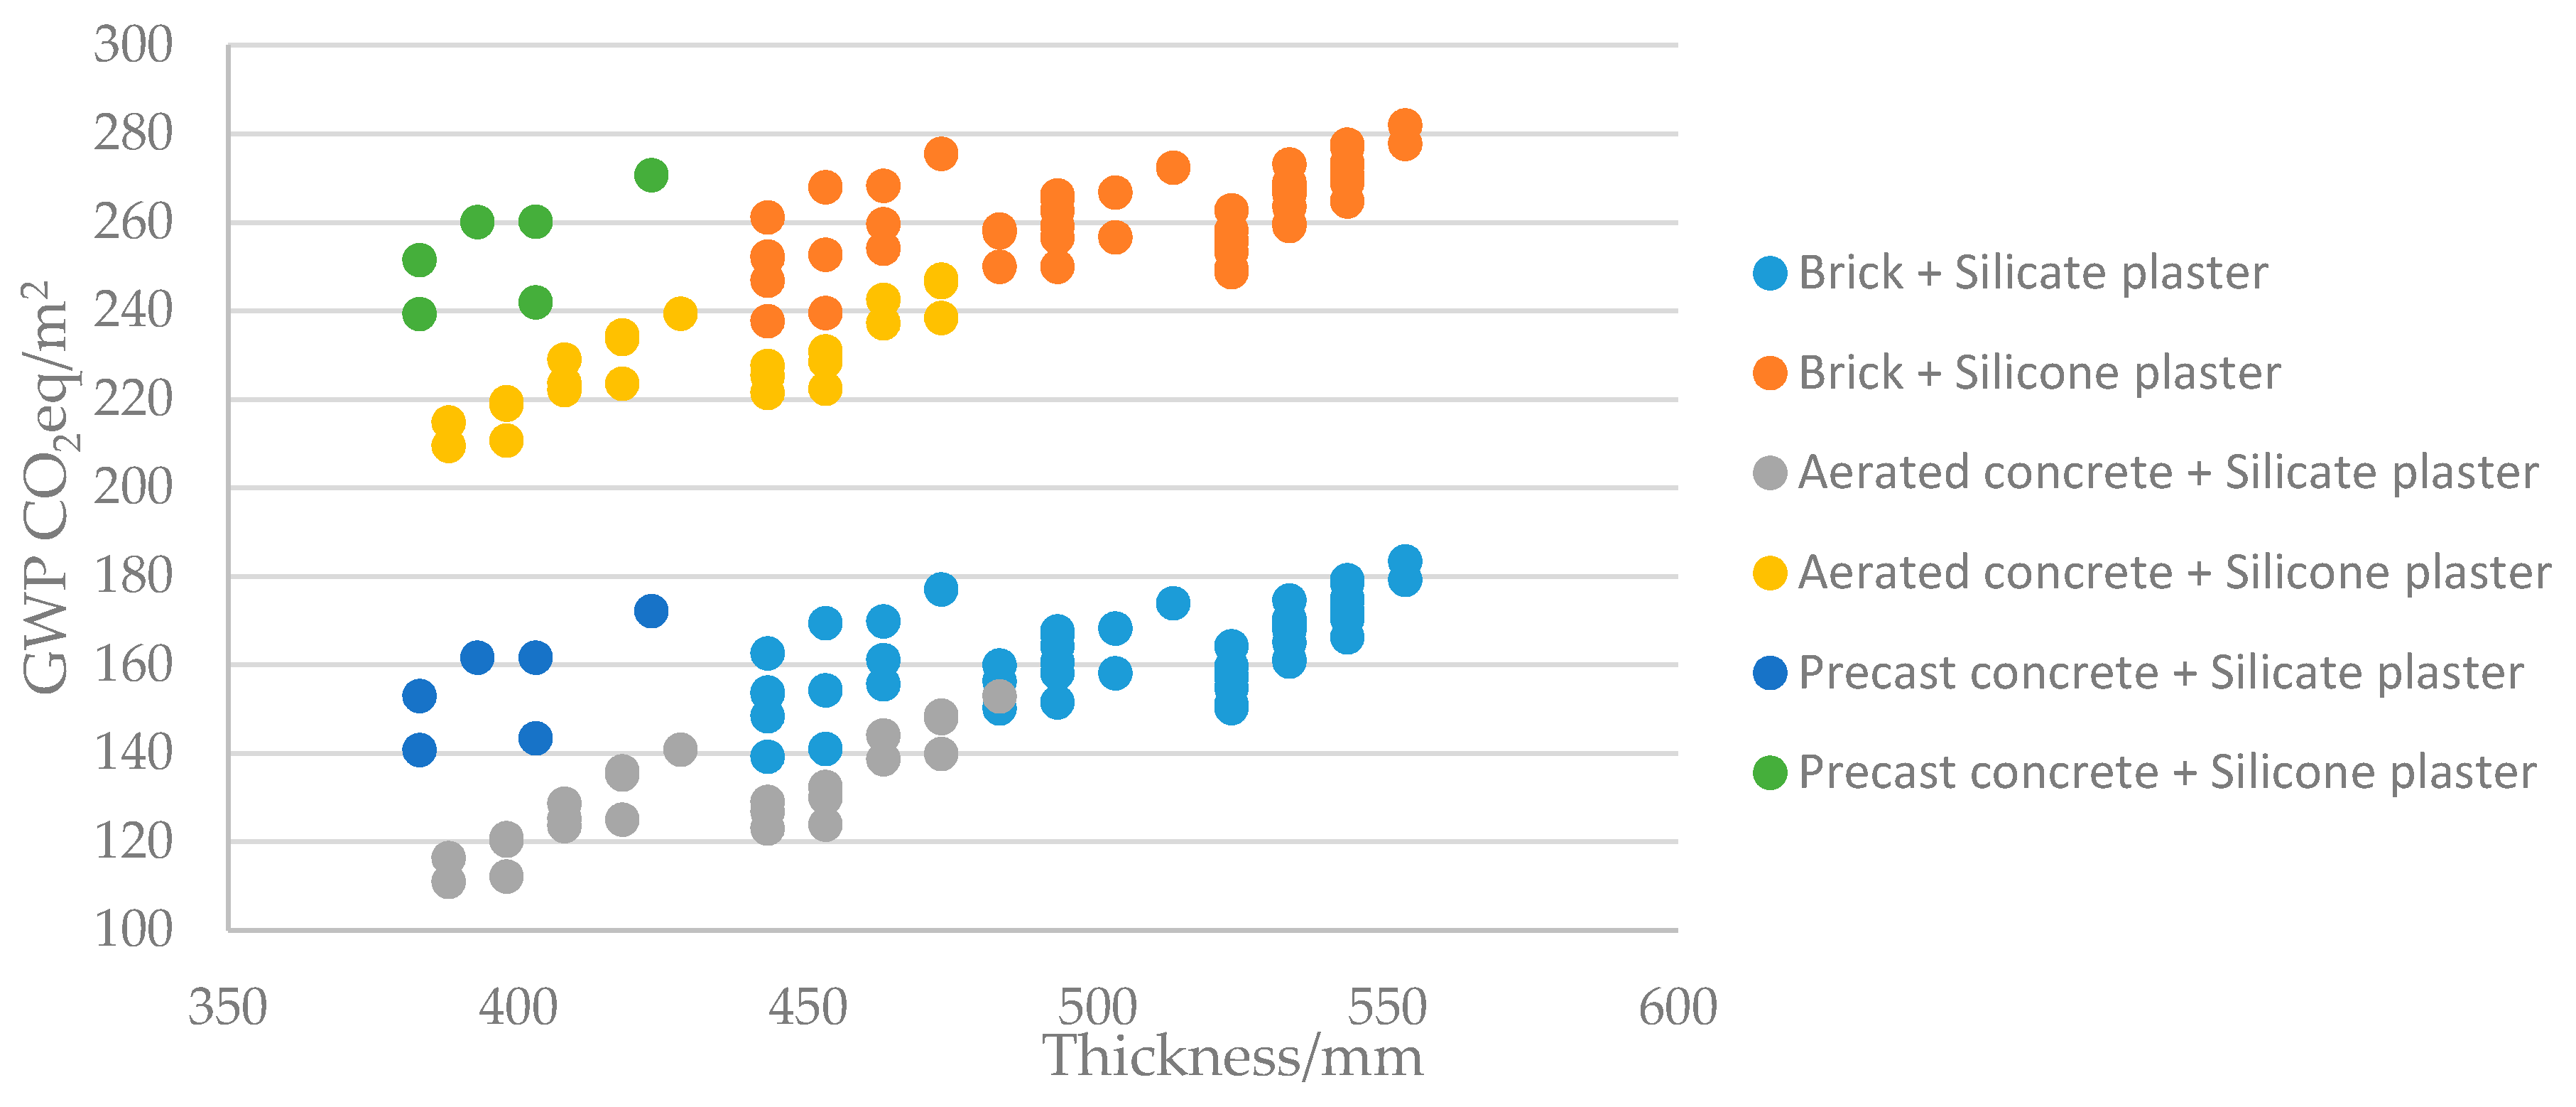
Figure 11.
Relationship between the GWP and the weights of the evaluated structures.
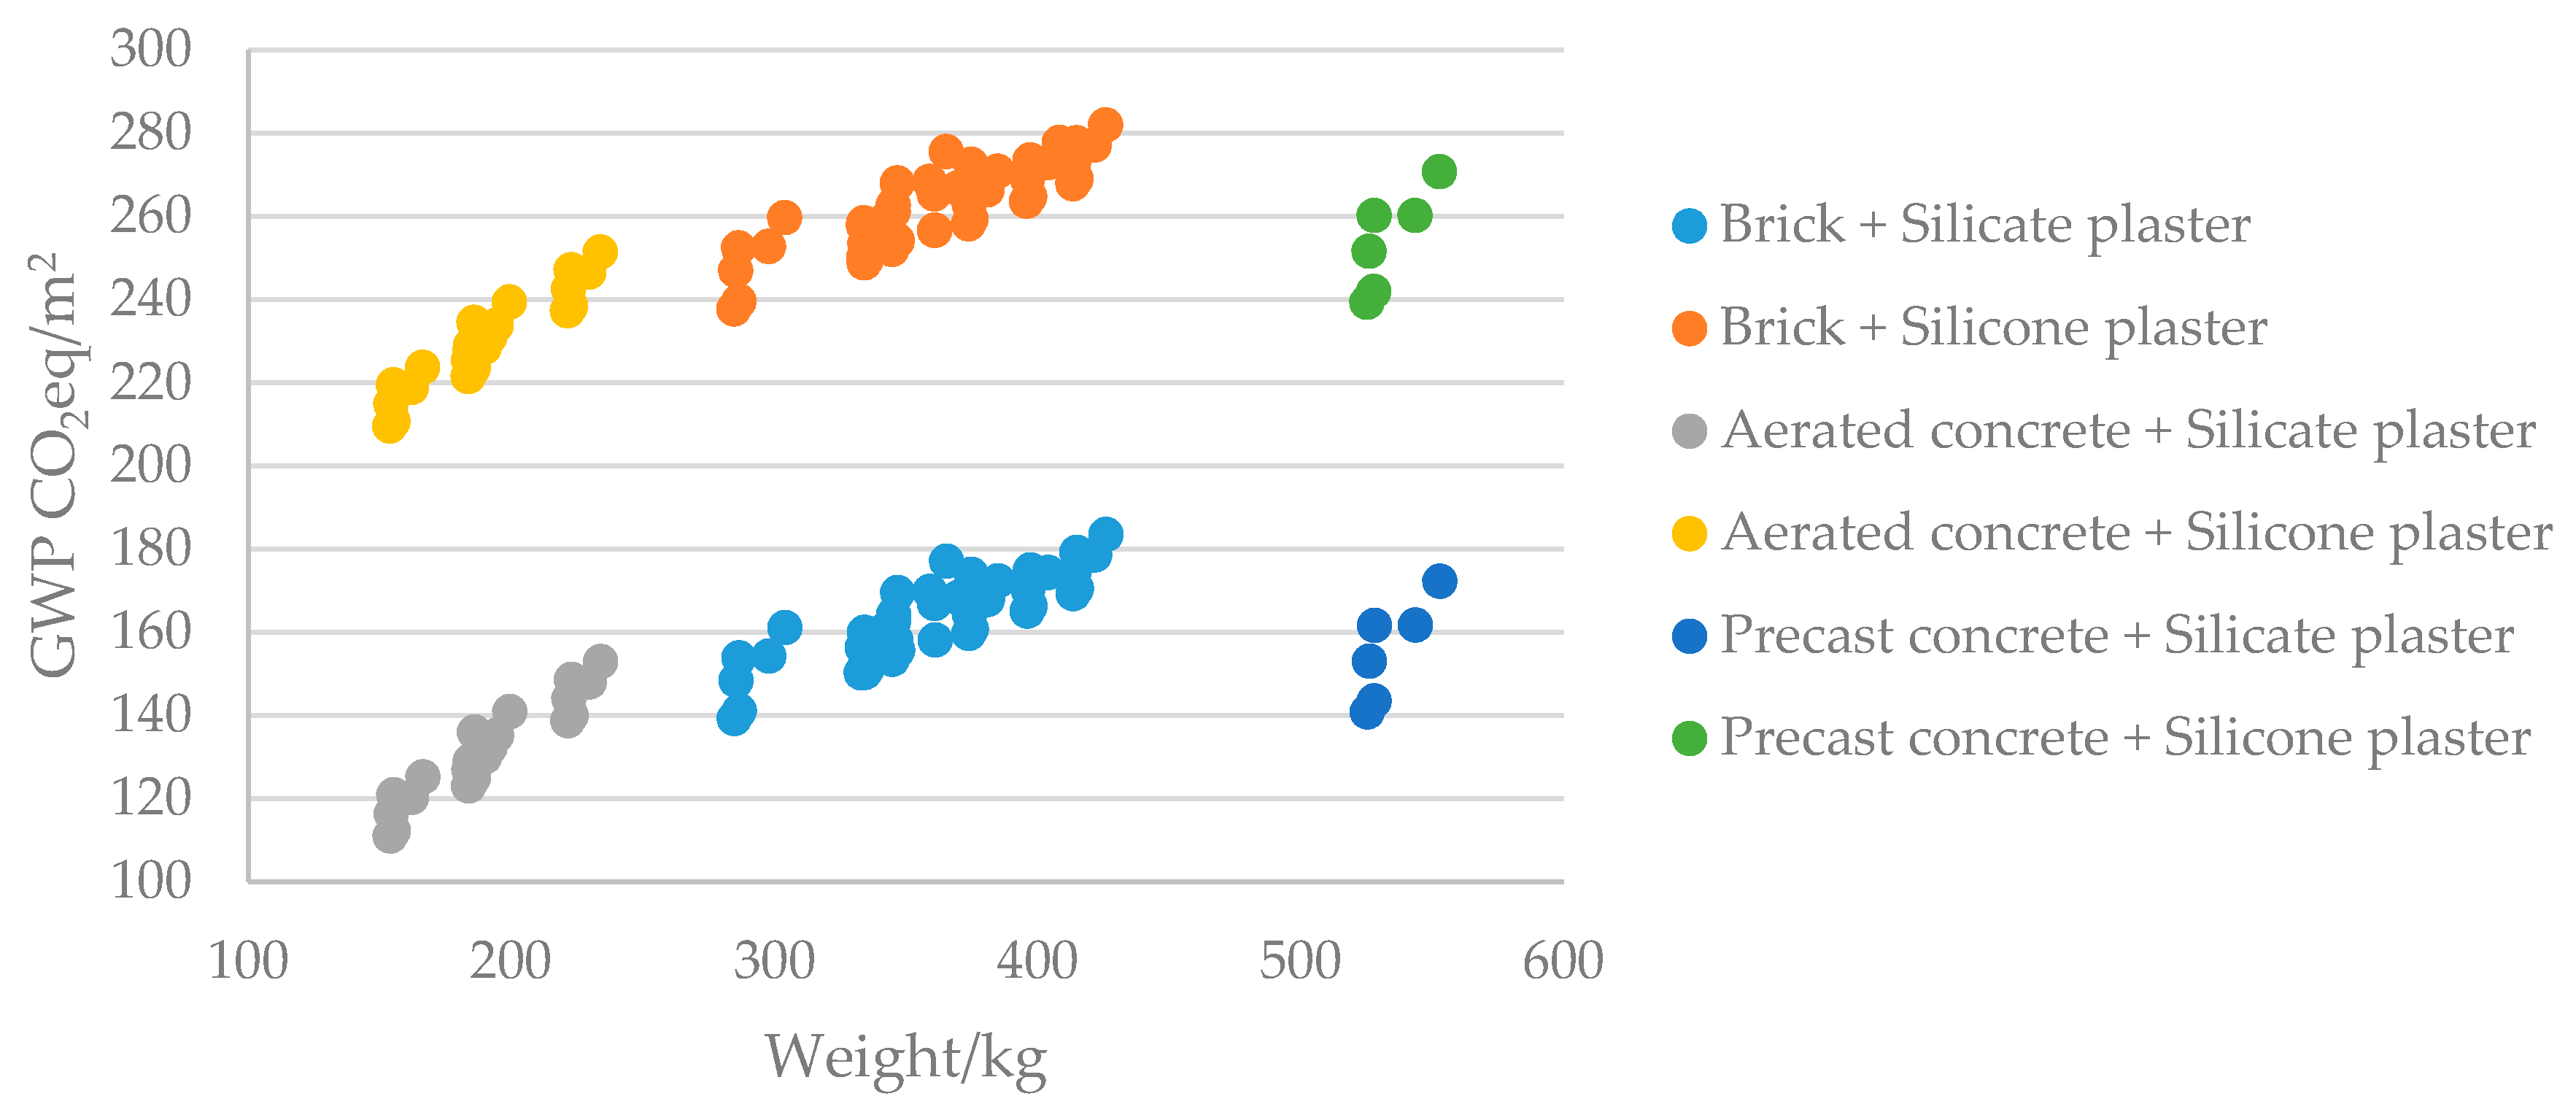
Figure 12.
Comparison of the best wall alternatives in particular material groups: W33 (brick), W105 (aerated concrete), and W149 (reinforced concrete).
Figure 12.
Comparison of the best wall alternatives in particular material groups: W33 (brick), W105 (aerated concrete), and W149 (reinforced concrete).
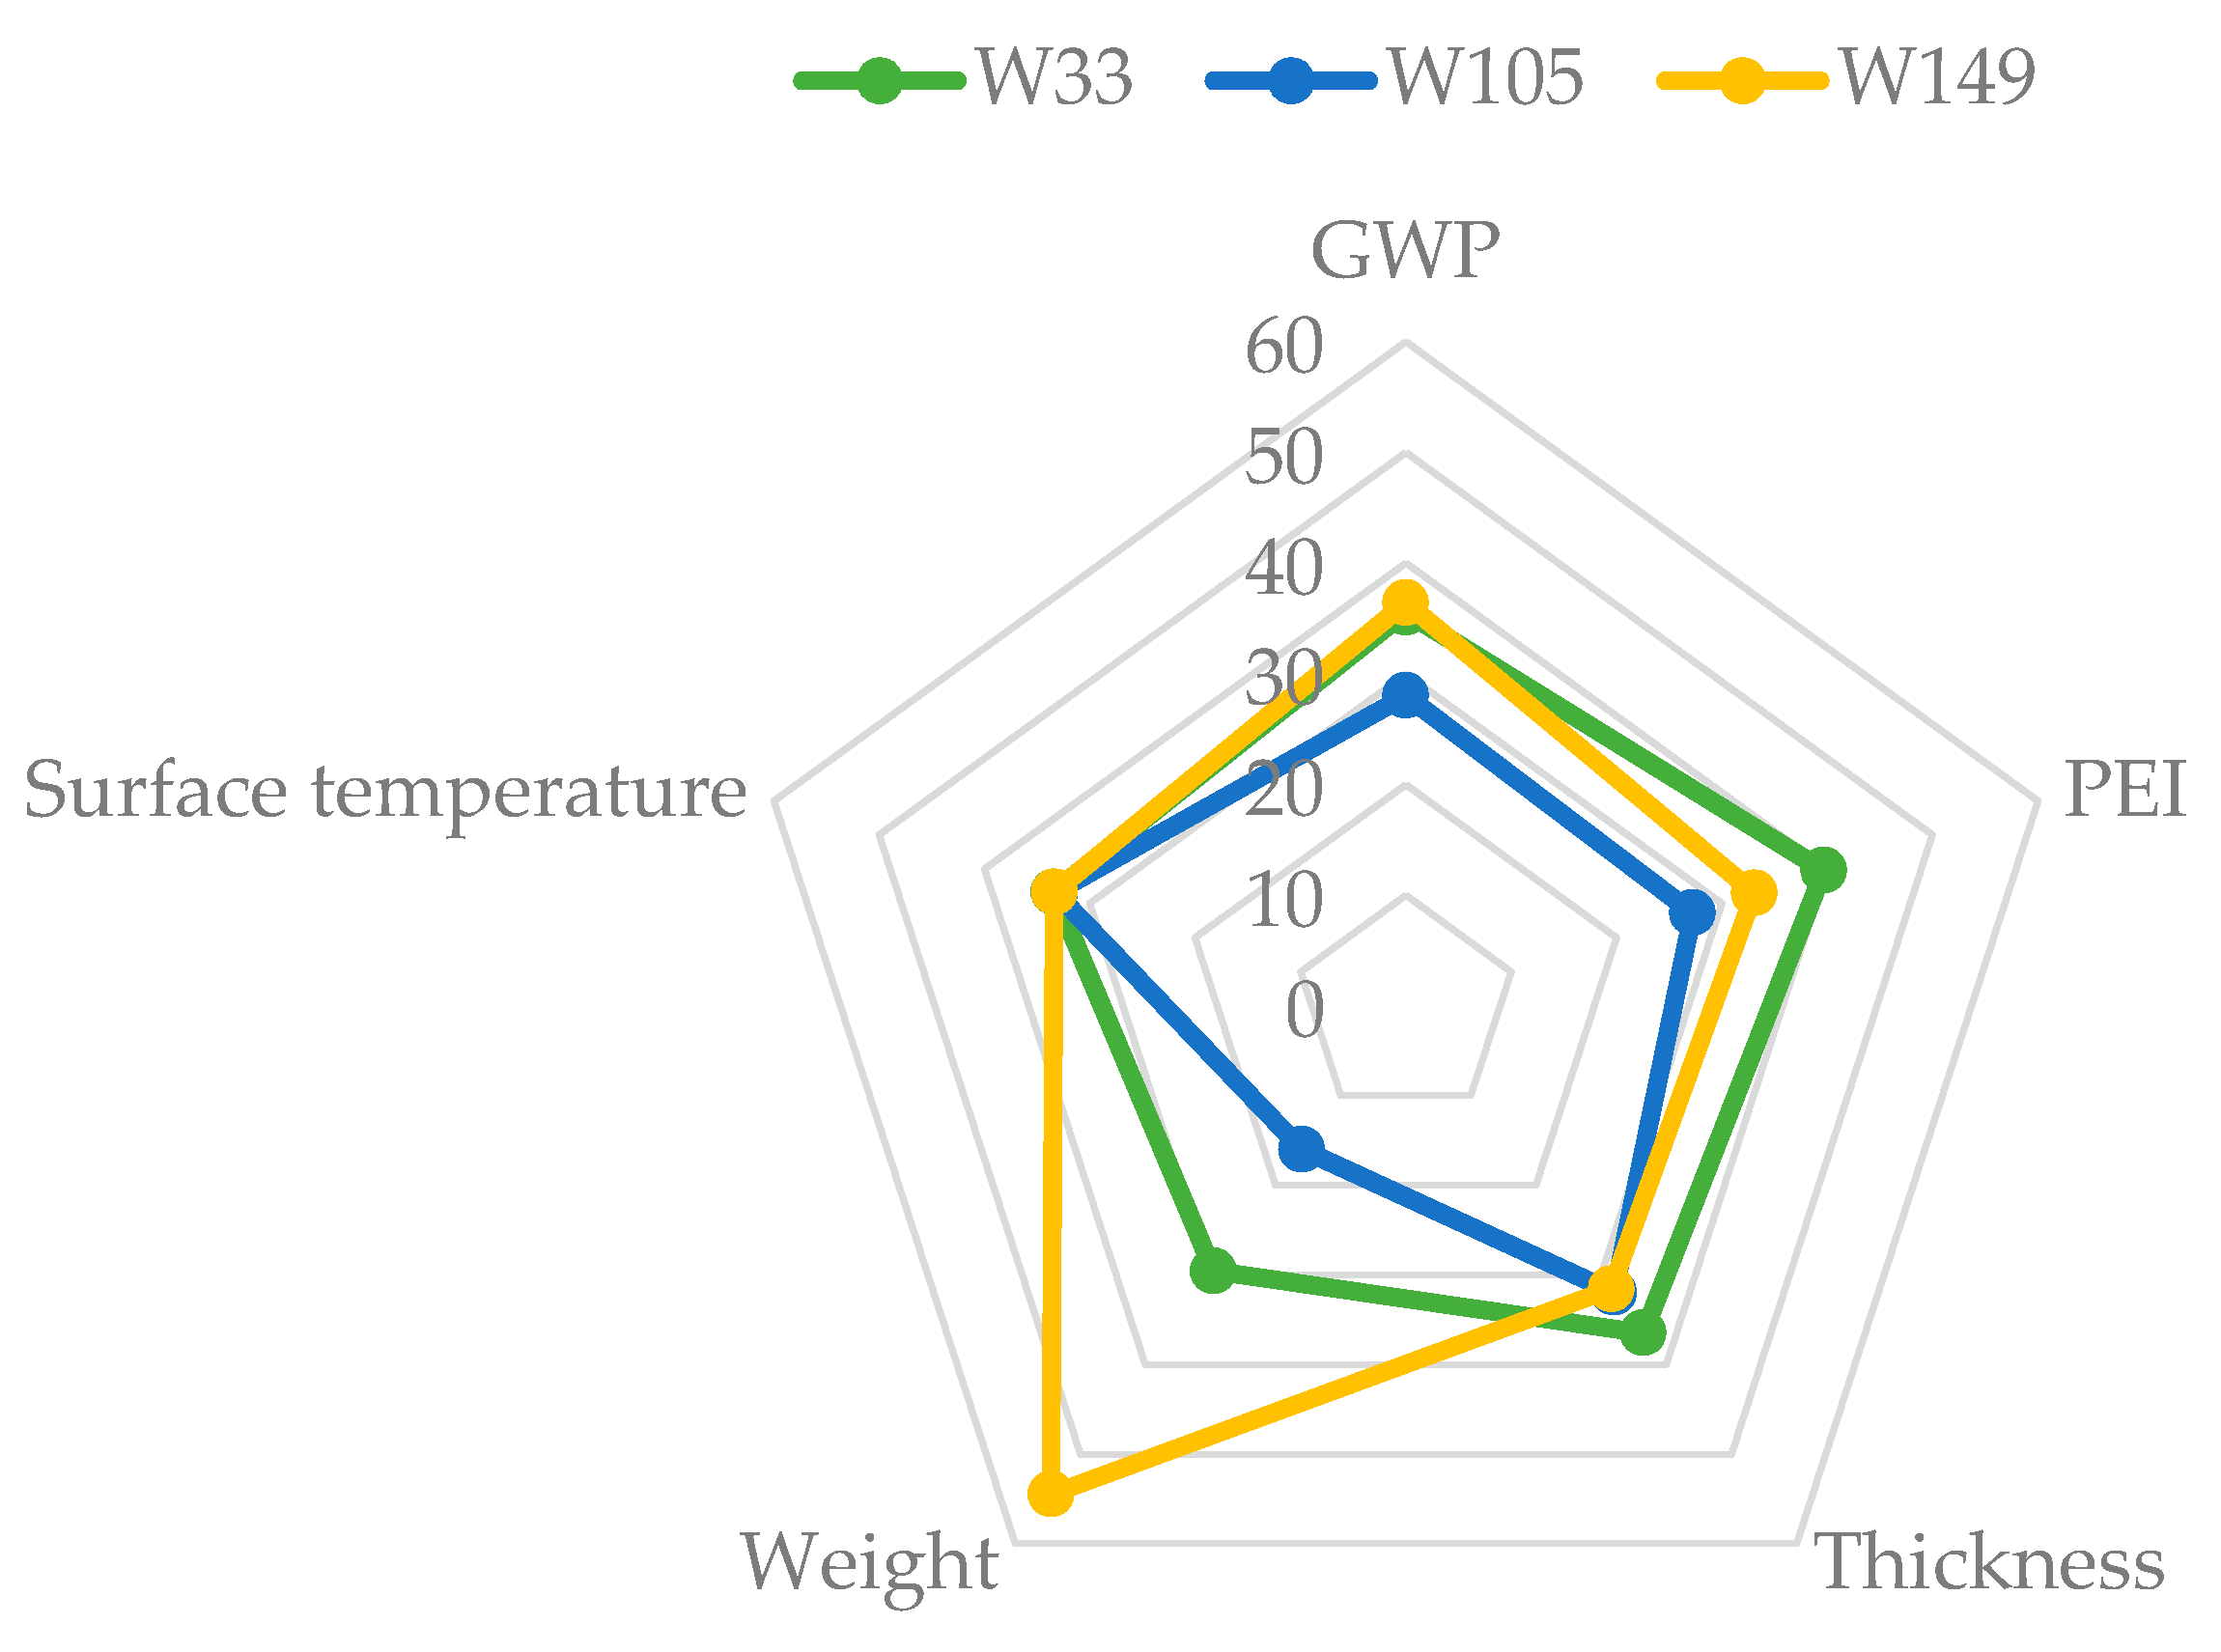
Figure 13.
Costs of the individual constructions.
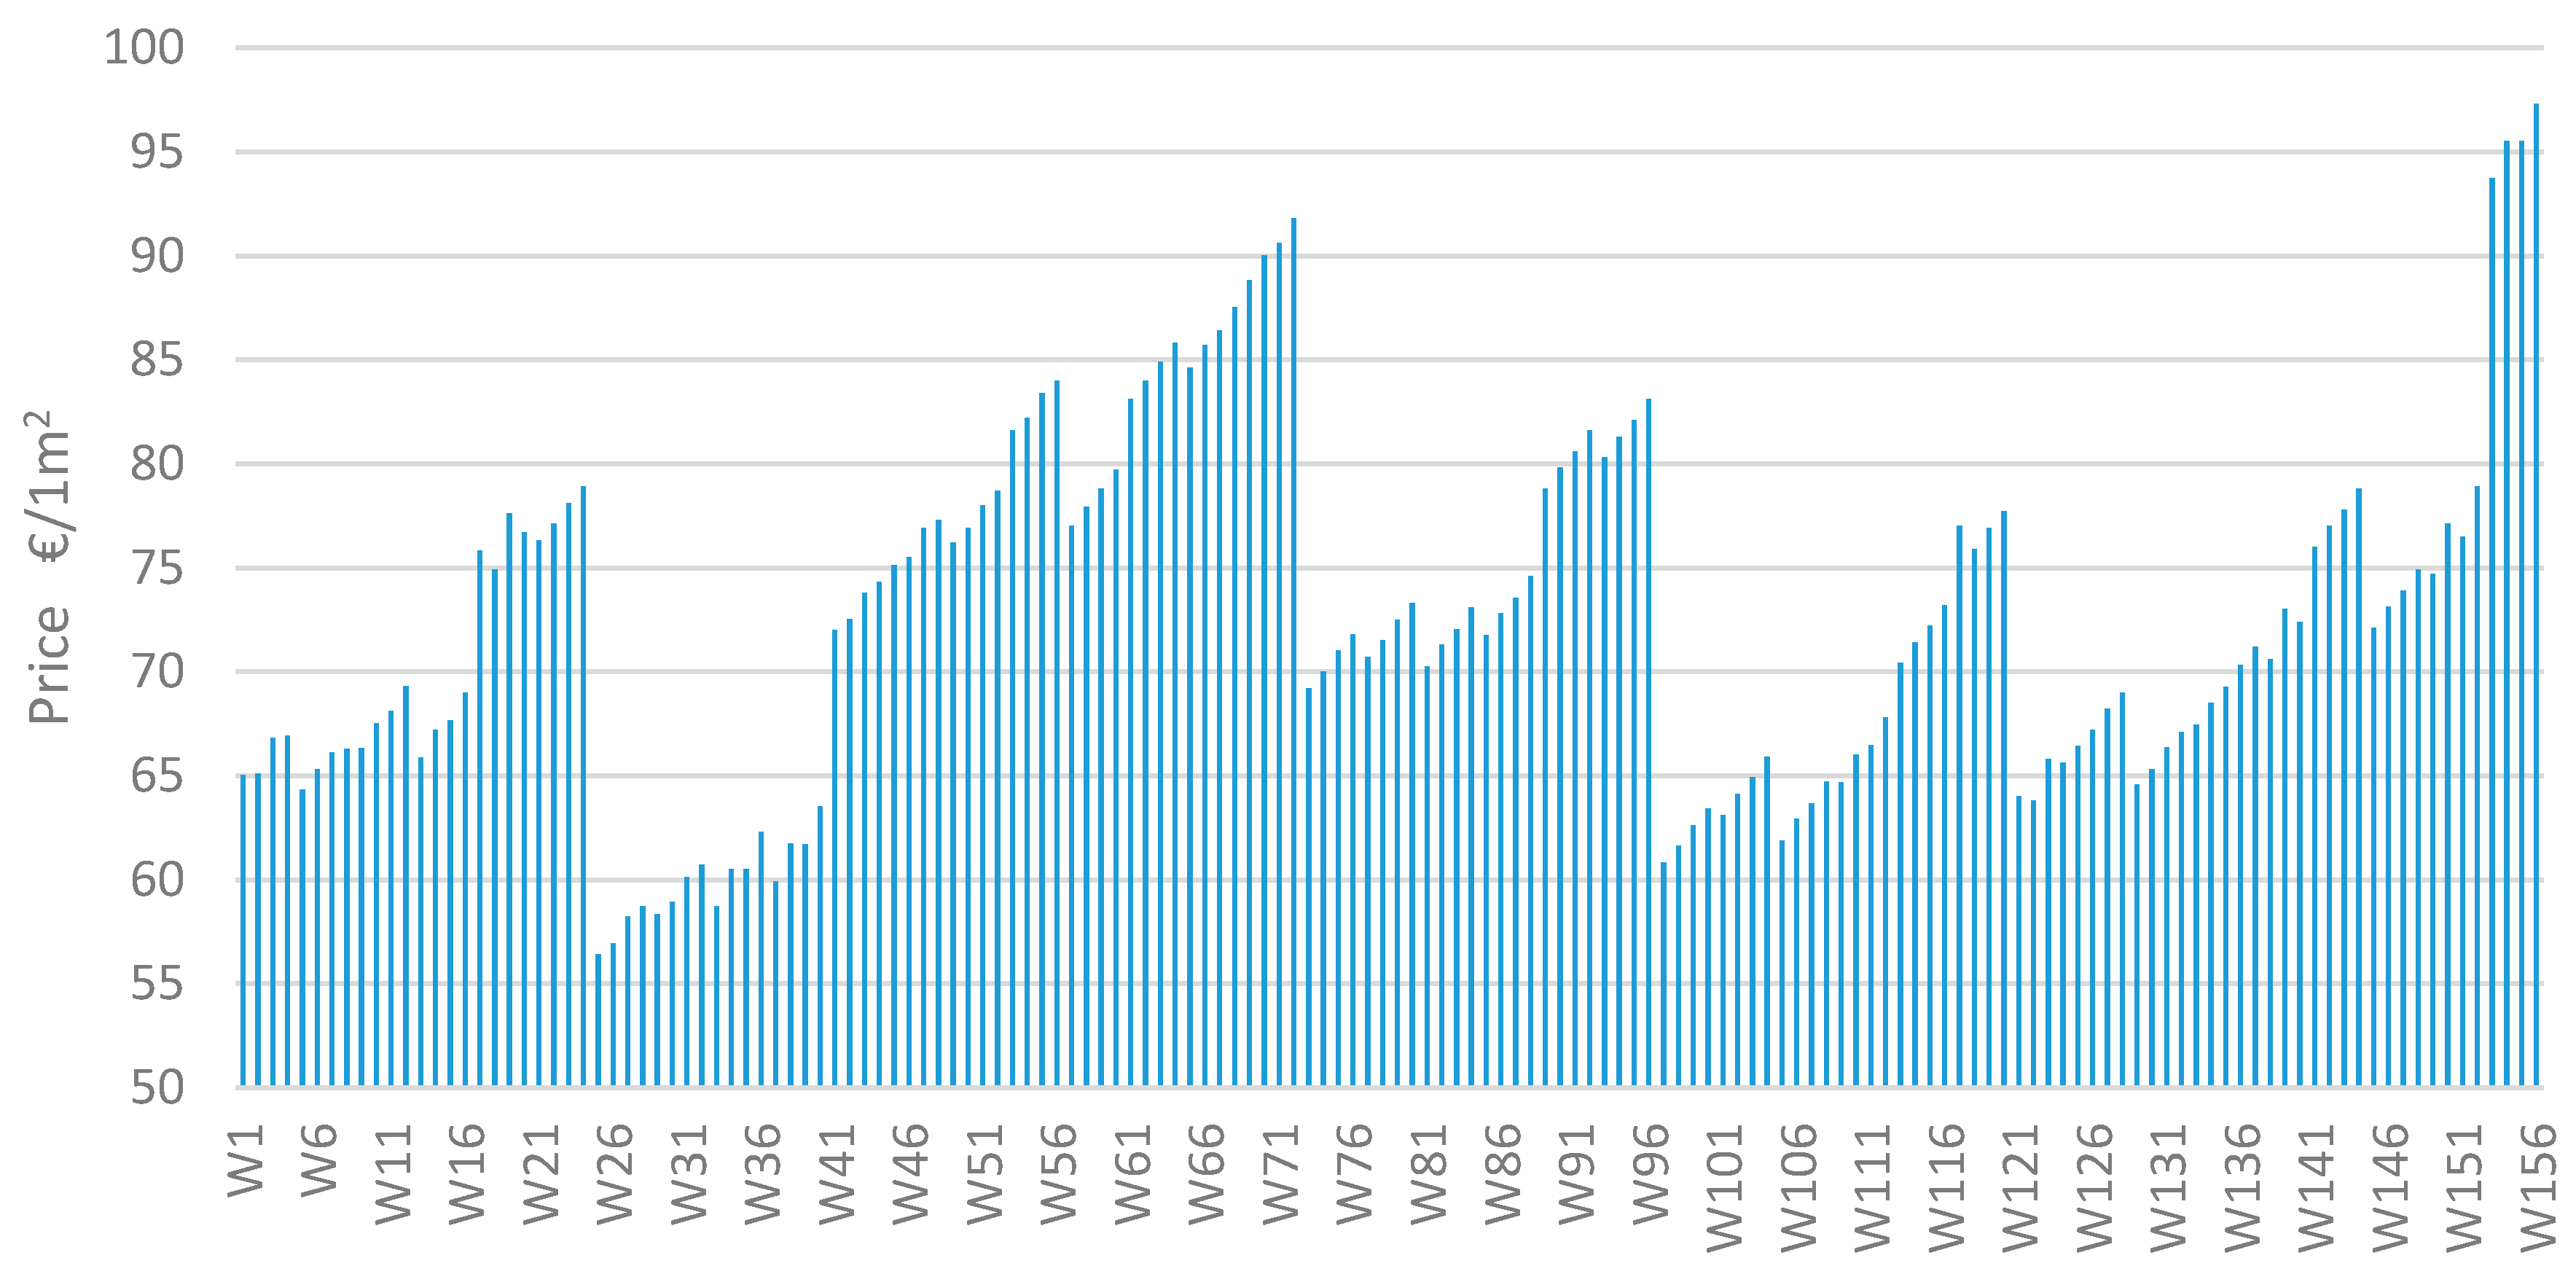
Table 1.
Material composition of the vertical structures.
| Group | Interior Layer | Core | Thermal Insulation | Exterior Layer |
|---|---|---|---|---|
| W1–W8 | Lime–cement plaster | brick 380 mm | EPS, 80–100 mm | |
| W9–W16 | brick 380 mm | EPSg, 80–90 mm | ||
| W17–W24 | brick 380 mm | RW, 90–110 mm | ||
| W25–W32 | brick 300 mm | EPS, 120–140 mm | ||
| W33–W40 | brick 300 mm | EPSg, 120 mm | ||
| W41–W48 | brick 300 mm | RW, 130–150 mm | ||
| W49–W56 | brick 440 mm | EPS, 60–70 mm | ||
| W57–W64 | brick 440 mm | EPSg, 60 mm | ||
| W65–W72 | brick 440 mm | RW, 60–80 mm | ||
| W73–W80 | brick 440 mm | EPS, 80 mm | silicate/silicone | |
| W81–W88 | brick 440 mm | EPSg, 70 mm | plaster | |
| W89–W96 | brick 440 mm | RW, 80–90 mm | ||
| W97–W104 | AC 300 mm | EPS, 80–100 mm | ||
| W105–W112 | AC 300 mm | EPSg, 70–90 mm | ||
| W113–W120 | AC 300 mm | RW, 80–110 mm | ||
| W121–W128 | AC 375 mm | EPS, 50–80 mm | ||
| W129–W136 | AC 375 mm | EPSg, 50–70 mm | ||
| W137–W144 | AC 375 mm | RW, 60–90 mm | ||
| W145–W148 | RC 200 mm | EPS, 170–180 mm | ||
| W149–W152 | RC 200 mm | EPSg, 160 mm | ||
| W153–W156 | RC 200 mm | RW, 180–200 mm |
Table 2.
Example of a detailed characterization of the material variation in a particular group.
| Wall Alternative | Interior Plaster | Core | Thermal Insulation | Exterior Plaster | |
|---|---|---|---|---|---|
| Group W1–W8 | W1 | lime–cement | brick 380 mm | EPS A, 90 mm | silicate |
| W2 | lime–cement | brick 380 mm | EPS B, 80 mm | silicate | |
| W3 | lime–cement | brick 380 mm | EPS A, 90 mm | silicone | |
| W4 | lime–cement | brick 380 mm | EPS B, 80 mm | silicone | |
| W5 | lime–cement | brick 380 mm | EPS A, 100 mm | silicate | |
| W6 | lime–cement | brick 380 mm | EPS B, 90 mm | silicate | |
| W7 | lime–cement | brick 380 mm | EPS A, 100 mm | silicone | |
| W8 | lime–cement | brick 380 mm | EPS B, 90 mm | silicone |
Table 3.
Summary of the technical parameters of the external bearing walls.
| No. of Layers | Thickness | Weight | θsi | |
|---|---|---|---|---|
| - | mm | kg/m2 | °C | |
| Minimum | 6.00 | 383.00 | 153.96 | 18.24 |
| Maximum | 7.00 | 553.00 | 553.06 | 18.33 |
| Variation span | 1.00 | 170.00 | 399.10 | 0.09 |
| Difference (min–max) | 14.3% | 30.7% | 72.2% | 0.5% |
| Mean | 6.08 | 474.03 | 320.33 | 18.29 |
| Median | 6.00 | 473.00 | 341.21 | 18.28 |
Table 4.
The material alternatives with the lowest impacts in the endpoint categories.
| Wall | Material Composition | Human Health DALY × 10−4 | Ecosystems Species/year × 10−6 | Resources $ | |
|---|---|---|---|---|---|
| Brick | W33 | lime–cement, brick 300 mm, EPSg A 120 mm, silicate plaster | 2.78 | 1.24 | 555.1 |
| AC | W105 | lime–cement, AC 300 mm, EPSg A 70 mm, silicate plaster | 2.18 | 0.98 | 380.9 |
| RC | W149 | lime–cement, RC 200 mm, EPSg A 160 mm, silicate plaster | 2.80 | 1.23 | 462.3 |
Table 5.
The relationships between PEI and thickness, and PEI and weight.
| Correlated Parameters | Correlation Coefficient (R) |
|---|---|
| PEI/Thickness | 0.73 |
| PEI/Weight | 0.62 |
Table 6.
The relationships between GWP and thickness, and GWP and weight.
| Correlated Parameters | Correlation Coefficient (R) |
|---|---|
| GWP/Thickness | 0.72 |
| GWP/Weight | 0.78 |
Table 7.
The order of the best wall alternatives.
| Qi | Wall Alternative |
|---|---|
| 1.25 | W105 |
| 1.30 | W106 |
| 1.58 | W101 |
| 1.80 | W97 |
| 1.83 | W117 |
| 2.00 | W113 |
| 2.11 | W107 |
| 2.16 | W108 |
| 2.36 | W122 |
| 2.45 | W103 |
Table 8.
The LCC analysis of the best alternatives in the particular material groups.
| Wall/Phase | W33 | W105 | W149 | |||
|---|---|---|---|---|---|---|
| Production phase | 58.72 | 61.87 | 74.72 | |||
| Construction phase | 29.24 | 16.34 | 92.31 | |||
| Operational phase | 27.30 | 27.30 | 27.30 | |||
| out of which | IP * | EP ** | IP * | EP ** | IP * | EP ** |
| 10.00 | 17.30 | 10.00 | 17.30 | 10.00 | 17.30 | |
| Disposal A *** | 2.65 | 1.53 | 6.35 | |||
| including | BW70% | MCW30% | AW70% | MCW30% | RCW70% | MCW30% |
| 1.45 | 1.20 | 0.76 | 0.77 | 2.57 | 3.68 | |
| Total costs | 117.64 | 106.77 | 200.31 | |||
| Disposal B *** | MCW100% 4.84 | MCW100% 2.62 | MCW100% 8.93 | |||
| Total costs | 119.83 | 107.86 | 202.99 | |||
* Interior plaster (IP) renovation: Removal of an old paint, penetration, plastering, and painting 2 times. ** Exterior plasters (EP) renovation: Penetration 2 times, mesh and glue, plastering, and scaffolding. *** Disposal includes the prices for landfilling the construction waste: Brick waste (BW), mixed construction waste (MCW), aerated concrete waste (ACW), and reinforced concrete waste (RCW).
© 2019 by the authors. Licensee MDPI, Basel, Switzerland. This article is an open access article distributed under the terms and conditions of the Creative Commons Attribution (CC BY) license (http://creativecommons.org/licenses/by/4.0/).
Share and Cite
MDPI and ACS Style
Estokova, A.; Ondova, M.; Wolfova, M.; Paulikova, A.; Toth, S. Examination of Bearing Walls Regarding Their Environmental Performance. Energies 2019, 12, 260. https://doi.org/10.3390/en12020260
AMA Style
Estokova A, Ondova M, Wolfova M, Paulikova A, Toth S. Examination of Bearing Walls Regarding Their Environmental Performance. Energies. 2019; 12(2):260. https://doi.org/10.3390/en12020260
Chicago/Turabian StyleEstokova, Adriana, Marcela Ondova, Martina Wolfova, Alena Paulikova, and Stanislav Toth. 2019. "Examination of Bearing Walls Regarding Their Environmental Performance" Energies 12, no. 2: 260. https://doi.org/10.3390/en12020260
Note that from the first issue of 2016, this journal uses article numbers instead of page numbers. See further details here.