Article

Numerical Calculation Method of Model Predictive Control for Integrated Vehicle Thermal Management Based on Underhood Coupling Thermal Transmission

1
State Key Laboratory of Automotive Simulation and Control, Jilin University, Changchun 130025, China
2
College of Automotive Engineering, Jilin University, Changchun 130025, China
3
College of Telecommunication Engineering, Jilin University, Changchun 130025, China
4
FAW-Volkswagen Automobile Co. LTD, Changchun 130013, China
*
Author to whom correspondence should be addressed.
Energies 2019, 12(2), 259; https://doi.org/10.3390/en12020259
Submission received: 10 December 2018 / Revised: 11 January 2019 / Accepted: 11 January 2019 / Published: 15 January 2019
(This article belongs to the Special Issue Exergy Analysis and Optimization of Energy Systems and Processes)

Abstract

:
The nonlinear model predictive control (NMPC) controller is designed for an engine cooling system and aims to control the pump speed and fan speed according to the thermal load, vehicle speed, and ambient temperature in real time with respect to the coolant temperature and comprehensive energy consumption of the system, which serve as the targets. The system control model is connected to the underhood computational fluid dynamics (CFD) model by the coupling thermal transmission equation. For the intricate thermal management process predictive control and system control performance analysis, a coupling multi-thermodynamic system nonlinear model for integrated vehicle thermal management was established. The concept of coupling factor was proposed to provide the boundary conditions considering the thermal transmission interaction of multiple heat exchangers for the radiator module. Using the coupling factor, the thermal flow influence of the structural characteristics in the engine compartment was described with the lumped parameter method, thereby simplifying the space geometric feature numerical calculation. In this way, the coupling between the multiple thermodynamic systems mathematical model and multidimensional nonlinear CFD model was realized, thereby achieving the simulation and analysis of the integrated thermal management multilevel cooperative control process based on the underhood structure design. The research results indicated an excellent capability of the method for integrated control analysis, which contributed to solving the design, analysis, and optimization problems for vehicle thermal management. Compared to the traditional engine cooling mode, the NMPC thermal management scheme clearly behaved the better temperature controlling effects and the lower system energy consumption. The controller could further improve efficiency with reasonable coordination of the convective thermal transfer intensity between the liquid and air sides. In addition, the thermal transfer structures in the engine compartment could also be optimized.

1. Introduction

Increasingly stringent fuel consumption and emission regulations have generated higher requirements for engine cooling. Previous simple heat dissipation problems have gradually evolved into the use of an intelligent vehicle thermal management system that considers emissions, dynamic performance, economy, and other aspects [1]. As compared to traditional engine cooling, the new-generation vehicle thermal management system, which considers the electronic control as the technical scheme, takes the system simulation and test calibration as the design method, as well as pursuing vehicle performance optimization as the ultimate goal, has achieved the following technological breakthroughs [2].
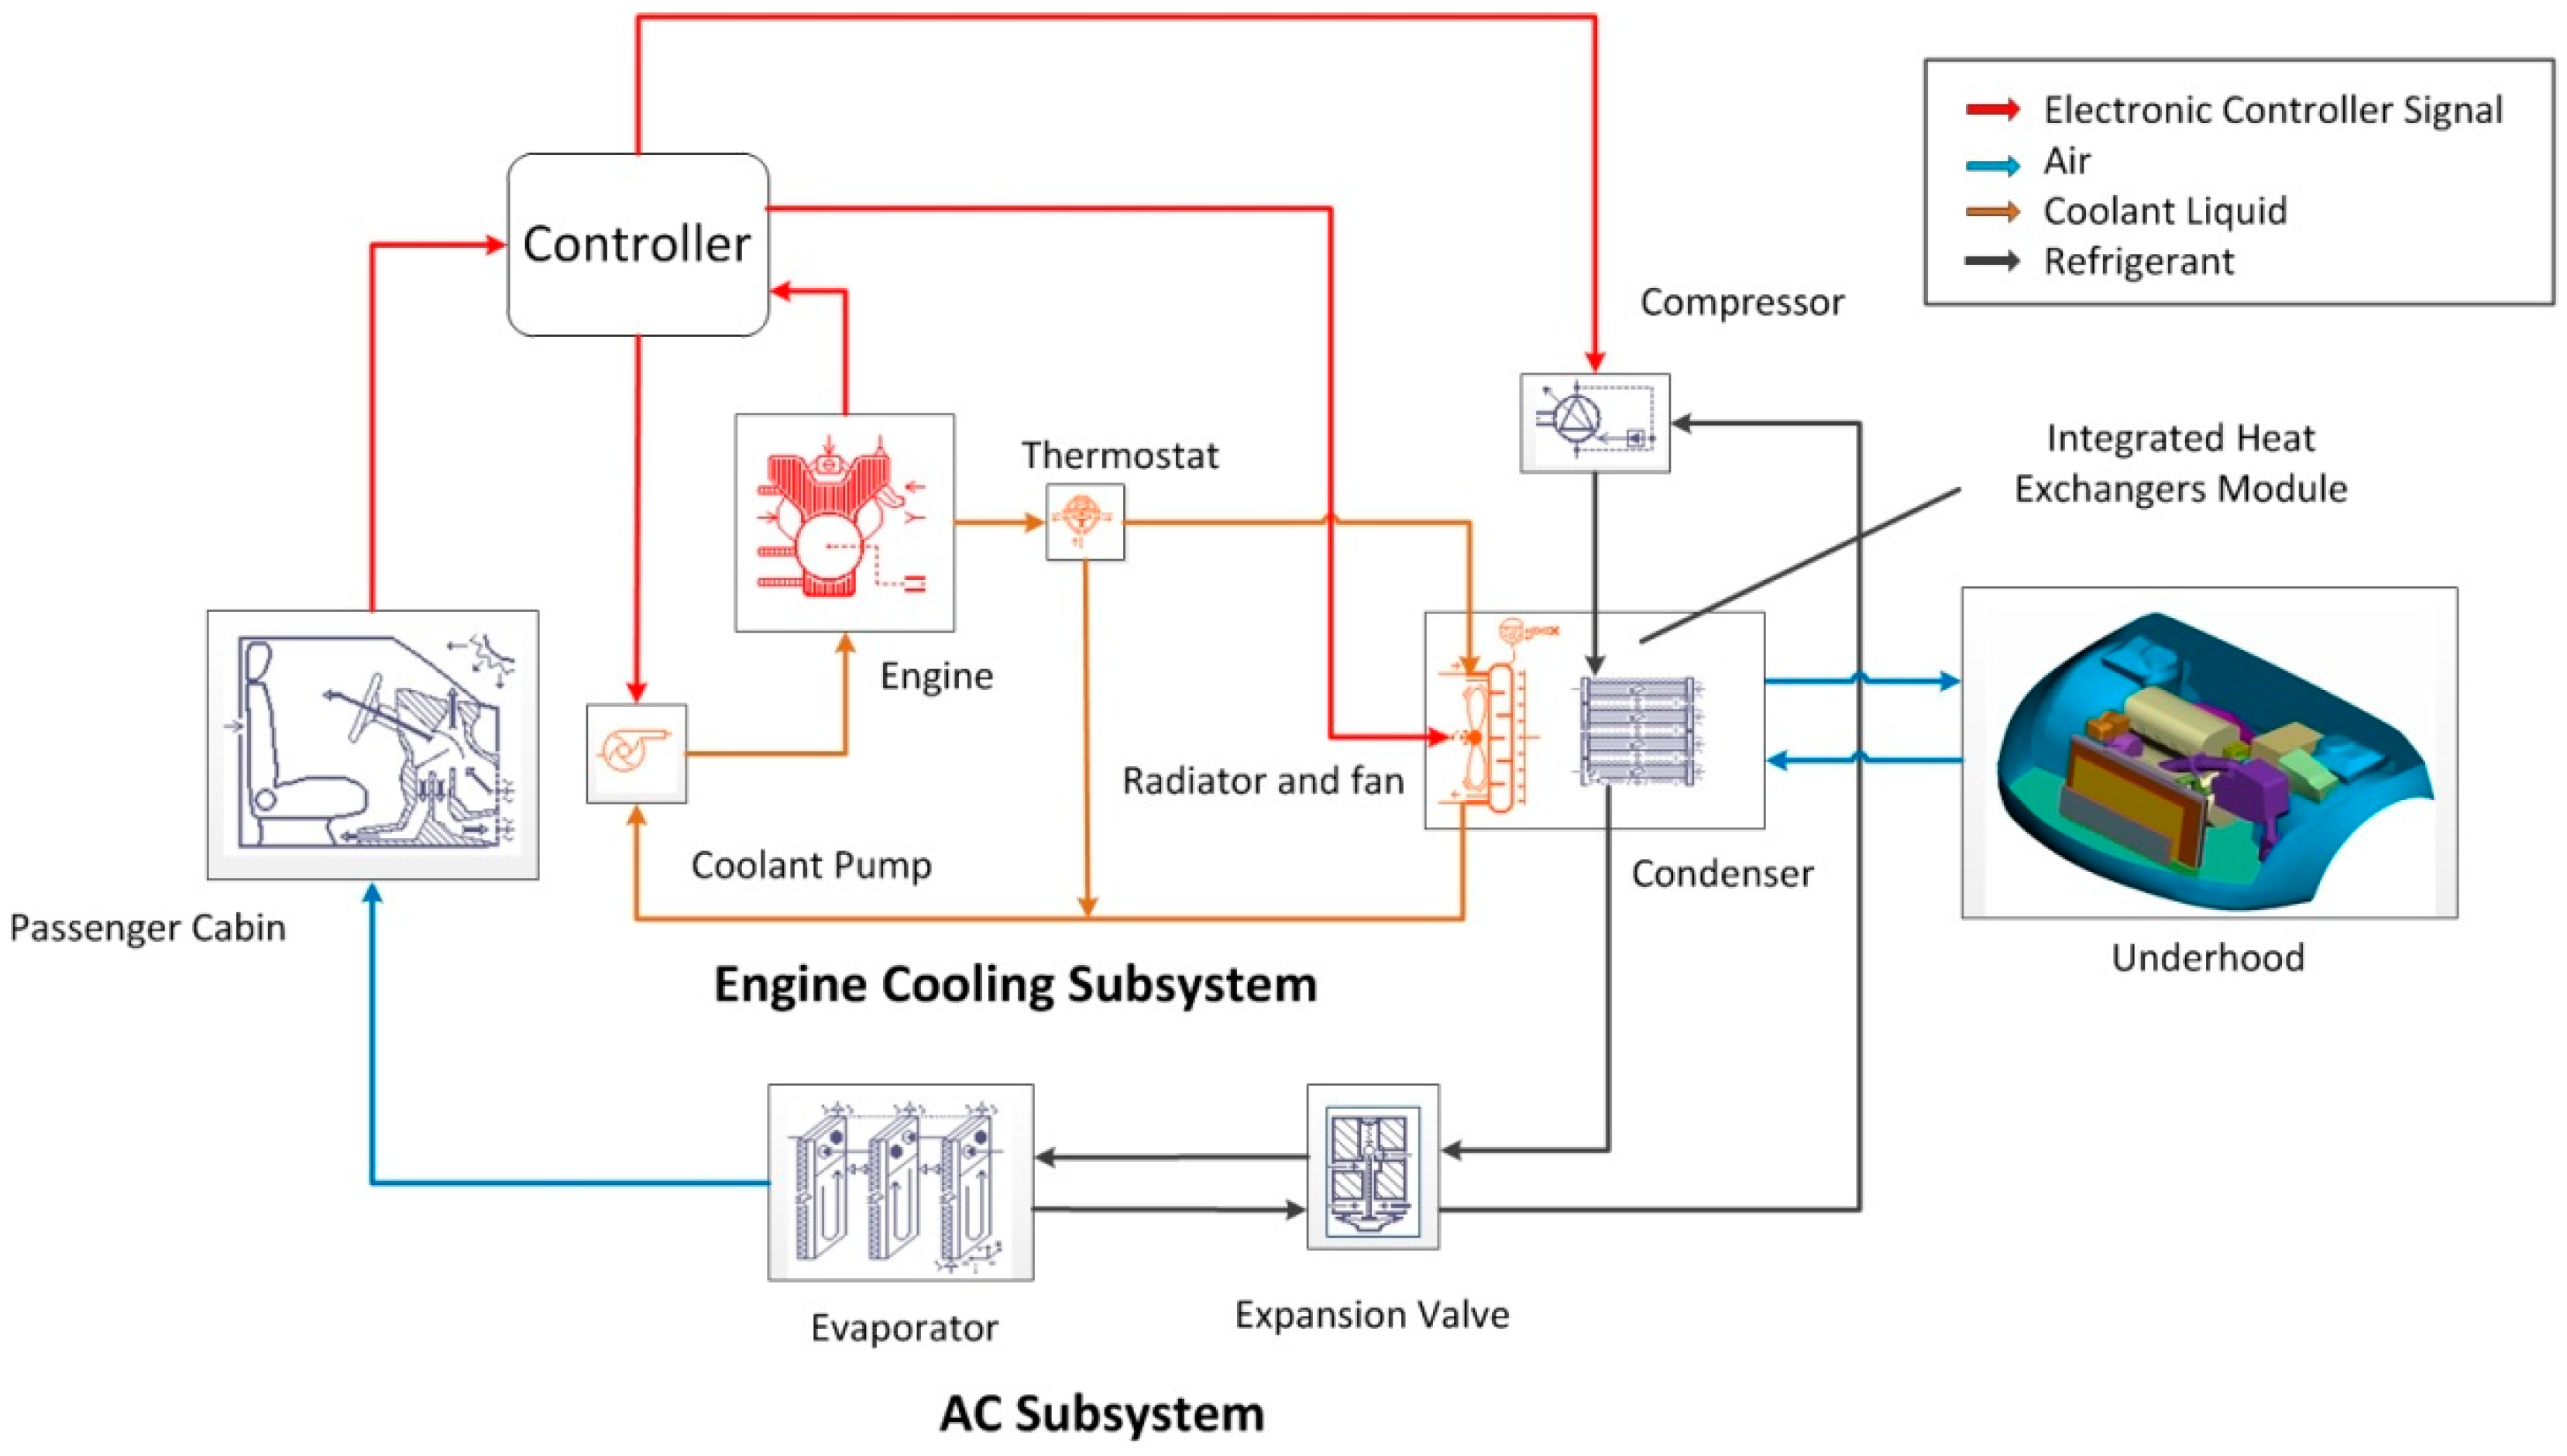
  • The technical scheme of the motor driven pump, intelligent fan, electronic thermostat, and electronic control unit (ECU) controller is adopted to replace the mechanical pump and graded speed fan. Converting the passive control mode into the active control mode improves the engine efficiency, emission, and attachment energy consumption and enhances the comprehensive performance of the cooling system [3].
  • The air conditioning, oil cooling, and turbo charging intercooling systems are extended into the integrated thermal management system [4]. The mechanism of the complex multiple thermodynamic systems coupling transmission can be studied by applying the computer simulation approach and the wind tunnel test analysis. In addition, the single system verification design can be transformed into a multi-system integration optimization design [5].

1.1. Trend towards Electronic Thermal Management

In recent years, the industry has generally accepted the replacement of the traditional cooling mode of engines with electric thermal management technology to significantly improve the temperature stability, dynamic response, energy consumption, and emissions of engines [6]. In these technical solutions, multiple types of controllers have been applied, such as proportional-integral-derivative (PID), robust, and rule-based controllers [7,8]. Khaled designed the controller based on feedback regulation to strengthen the engine cooling capability and concluded that the implementation of a reasonable control strategy is essential to ensuring the outstanding performance of the cooling system [9,10]. Zhou added feed forward control to the engine thermal management control process. As compared to the feedback control system, the feed forward scheme can select lower instantaneous power for the fan, coolant pump, and oil pump while satisfying the engine thermal dissipation requirements, thereby saving 57% of driving accessories consumption [11]. Given the presence of many technological problems in thermal systems, such as multi-input and multi-output (MIMO), high non-linearity, and conflicting control targets, the use of a single feedback controller to achieve the best results is more difficult [12,13]. Model predictive control is capable of system state predictions and control model optimizations to effectively solve multi-objective nonlinear system control problems [14]. The high reliability mathematical model predicts the future system status, the objective function determines the controlled parameters, and the optimal output sequence obtains the control horizon with respect to the state update and the repeated optimization equation solution [15,16]. Mohammad generated a model predictive control scheme for the thermal management of heavy trucks [17]. The comprehensive energy consumption of the system can be reduced by 38% through the implementation of reasonable coordination in the energy distribution of each component and the braking recovery. Lopez designed a double-loop thermal management system for hybrid vehicles [18]. The test results showed that the nonlinear model predictive control (NMPC) thermal management system was improved in terms of the battery warming rate, optimal temperature duration, and energy consumption reduction of the internal resistance as compared to using the non-predictive control scheme.

1.2. Underhood Multi-Thermodynamic System Coupling Thermal Transmission

The NMPC controller has a high requirement for accuracy of system dynamic prediction. However, most cases are more concerned with the reliability of the single system mathematical model and take no such considerations to the multi-system coupling thermal transmission problem. The environmental temperature is generally served as the radiator boundary condition, and the heat transfer interaction between the heat exchangers is ignored, thereby resulting in model prediction inaccuracy [19]. Blago emphasized that high-temperature air reflow and condenser calefaction were important deviation factors between the simulation results and experimental values. Given above, it should not be neglected in the high reliability mathematical modeling [20]. In the engineering and academic community, the bench test [21], computational fluid dynamics (CFD) analysis [22,23], and 1D/3D co-simulation [24,25] are usually adopted to observe the flow field and heat exchange capacity in the engine compartment solving the thermal transmission enhancement problem [26]. Mao carried out the full-scale geometric model of the truck engine compartment. The prototype design reasonableness of the radiator was evaluated by the CFD simulation, including the heat exchange amount, space placement, core size, and pressure drop, all of which were of great reference for heat transfer structure optimization [27]. The 1D/3D co-simulation method is effective for the multi-system coupling heat transfer theoretical analysis. The MATLAB/FLUENT-based co-simulation model quantified the aerodynamic cooling process of multiple heat exchangers, summarized the characteristic rule of the temperature field about the radiator thermal load and vehicle conditions, analyzed the causes and influencing factors of the high-temperature air reflow, and provided an improved targeted scheme for structural optimization [28,29].

1.3. Research Content

The schematic diagram of the integrated vehicle thermal management control system is shown in Figure 1, including the engine cooling system, air conditioning system, passenger cabin, underhood, and vehicle ECU controller. In engineering developments and integrated vehicle thermal management system designs, there exist three key technical problems as follows:
(1)
How to select the reasonable control scheme and control strategy of engine cooling system to improve the temperature control stability of components and the system dynamic responsiveness [30].
(2)
How to optimize the structural arrangement in underhood to restrain the harmful thermal interaction of multiple heat exchangers and improve the radiator thermal efficiency [31].
(3)
How to evaluate the engine cooling performance effectively to strengthen the matching degree between components and increase the energy efficiency of thermal management system [32].
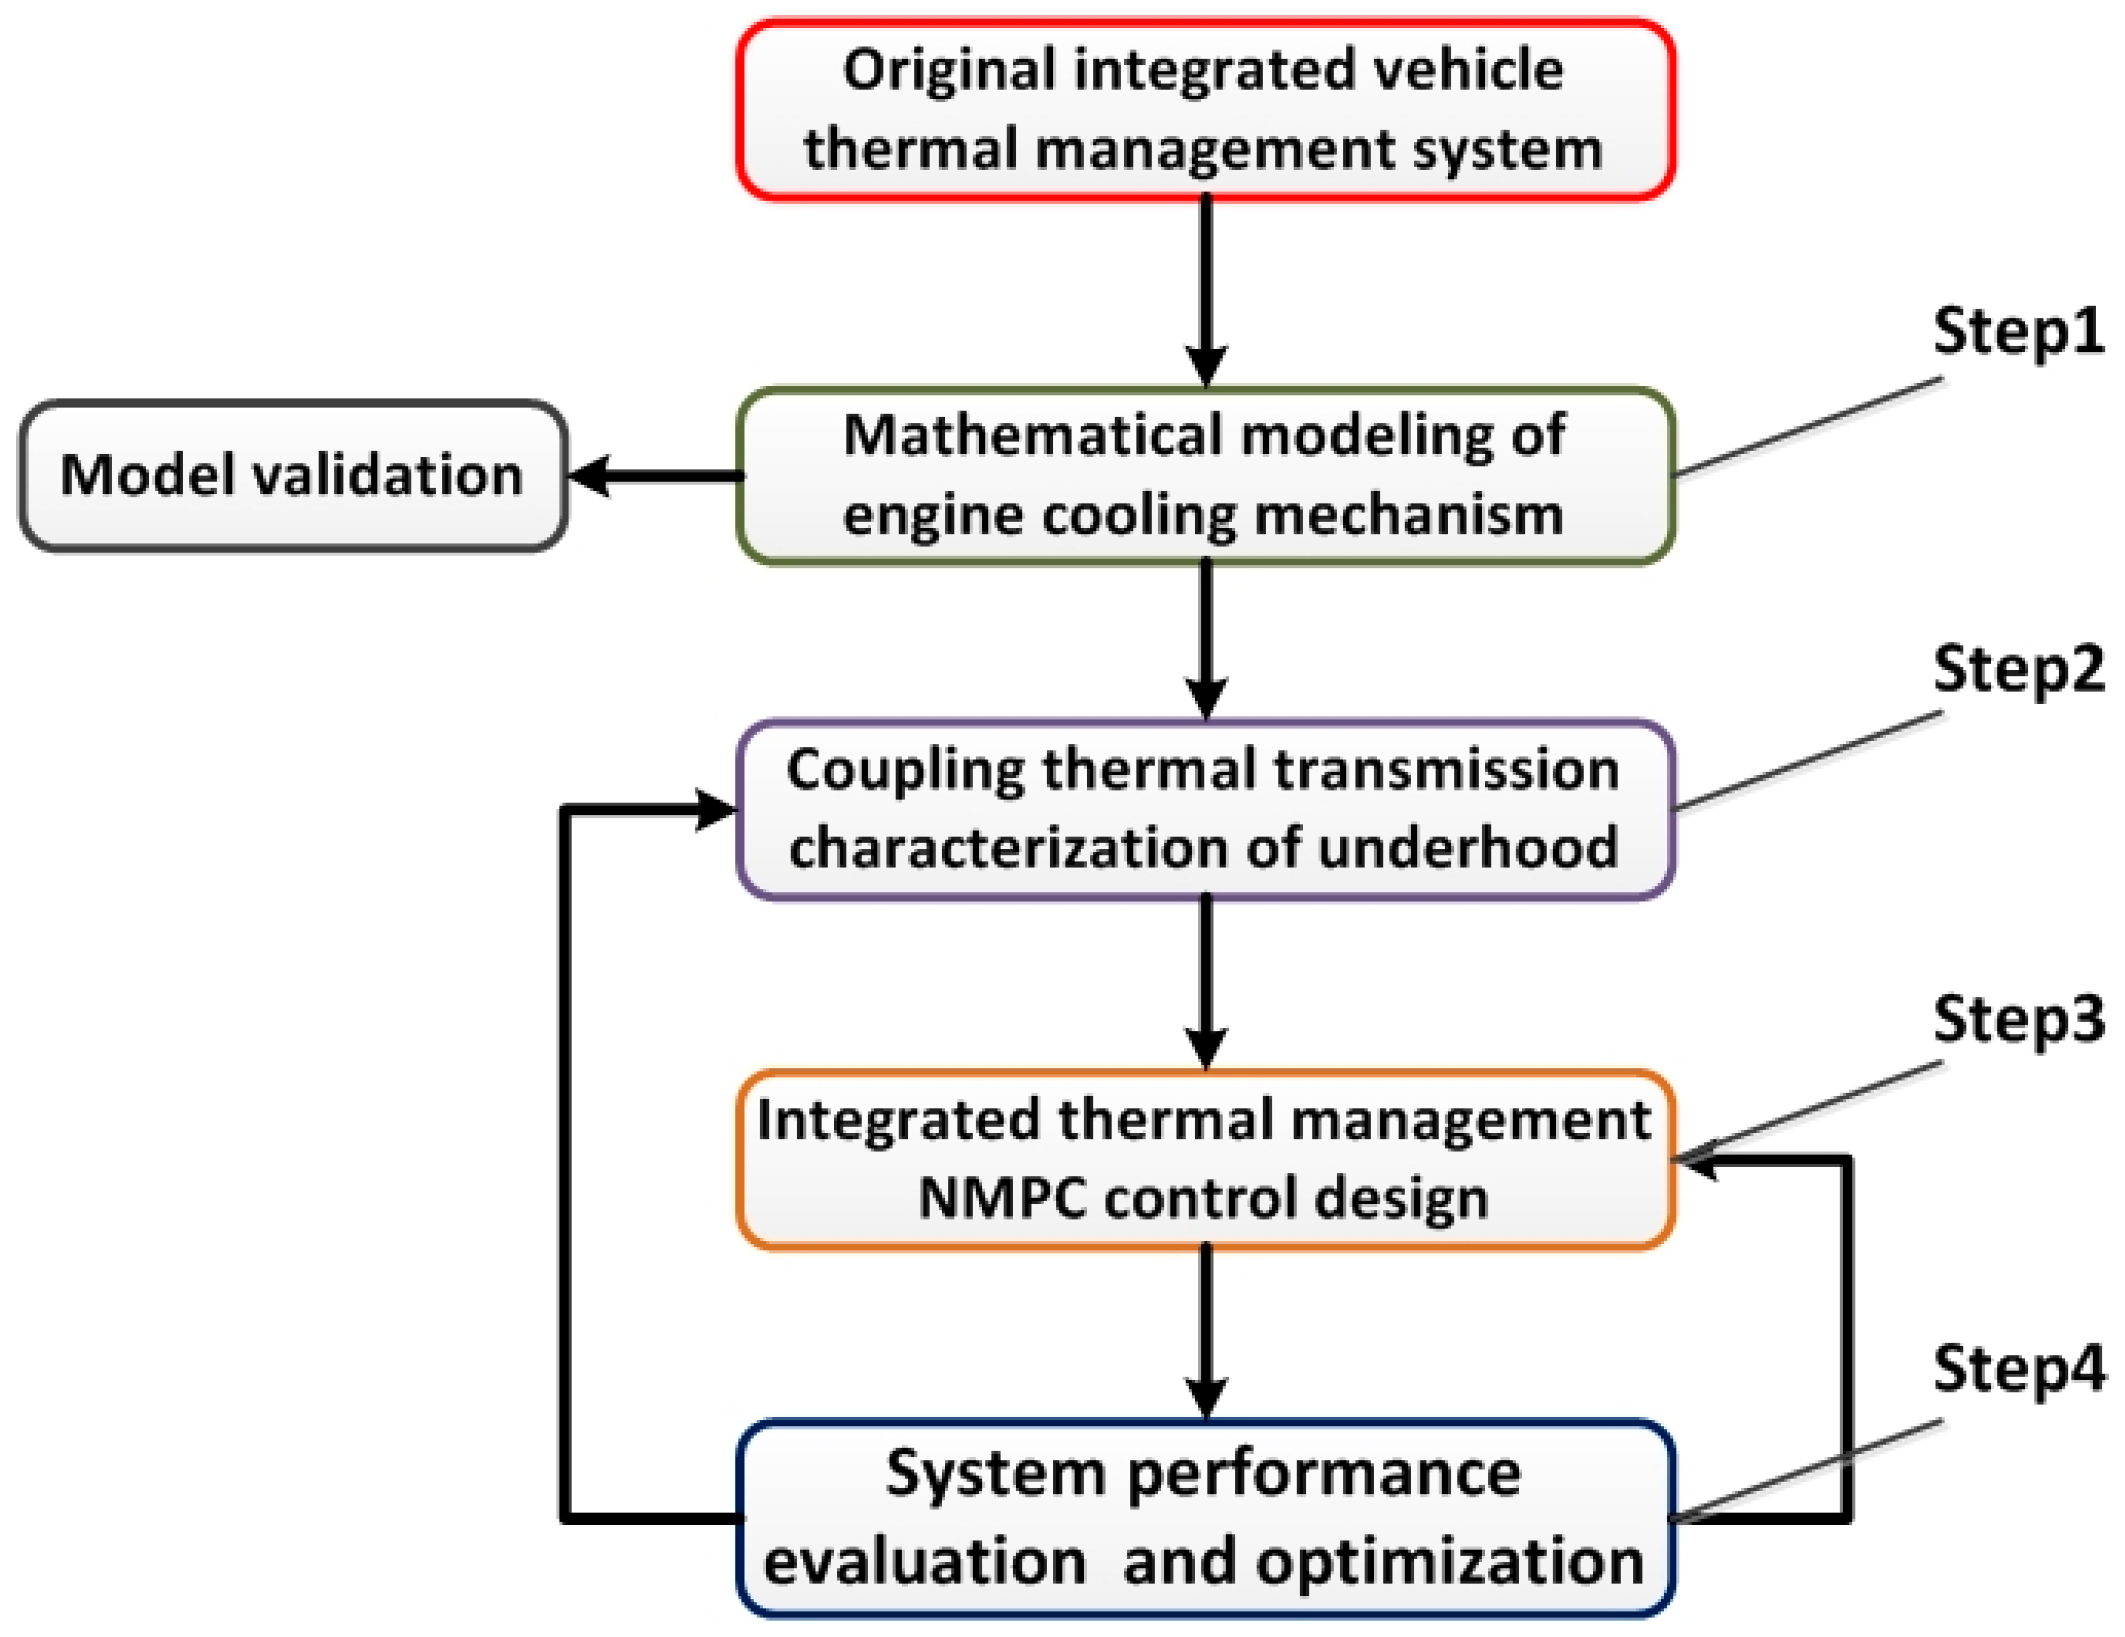
To solve the above technical problems, an optimization control method of integrated vehicle thermal management system based on NMPC was proposed in this paper. This technical route adopted in paper is shown in Figure 2, including four contents of engine cooling mechanism modeling, underhood coupling thermal transfer characteristics characterization, NMPC integrated thermal management controller design, and evaluation and optimization of system thermal control performance.
Step 1:
The mechanism mathematical model of engine cooling process was established to provide system state prediction for NMPC controller, and the simulation results were compared with system bench test to verify the reliability of the prediction model.
Step 2:
By means of CFD numerical calculation, the complex underhood aerodynamic coupling thermal transmission process was analyzed. Then a multi-system thermal transmission characterization method based on coupling factor was provided to be the coupling thermal boundary condition for the model predictive control process.
Step 3:
The NMPC controller of an integrated thermal management system was designed. With determining the controlled parameters, objective function optimization equation and system constraints, the cooperative control of the pump and fan can be realized in the engine cooling process.
Step 4:
The temperature control stability and system energy consumption were chosen to be evaluation indices. The thermal control performance comparison and analysis between control schemes of NMPC and PID were carried out. On the above basis, control strategy optimization scheme and underhood thermal transmission structure optimization scheme had been outlined to improve system energy efficiency.

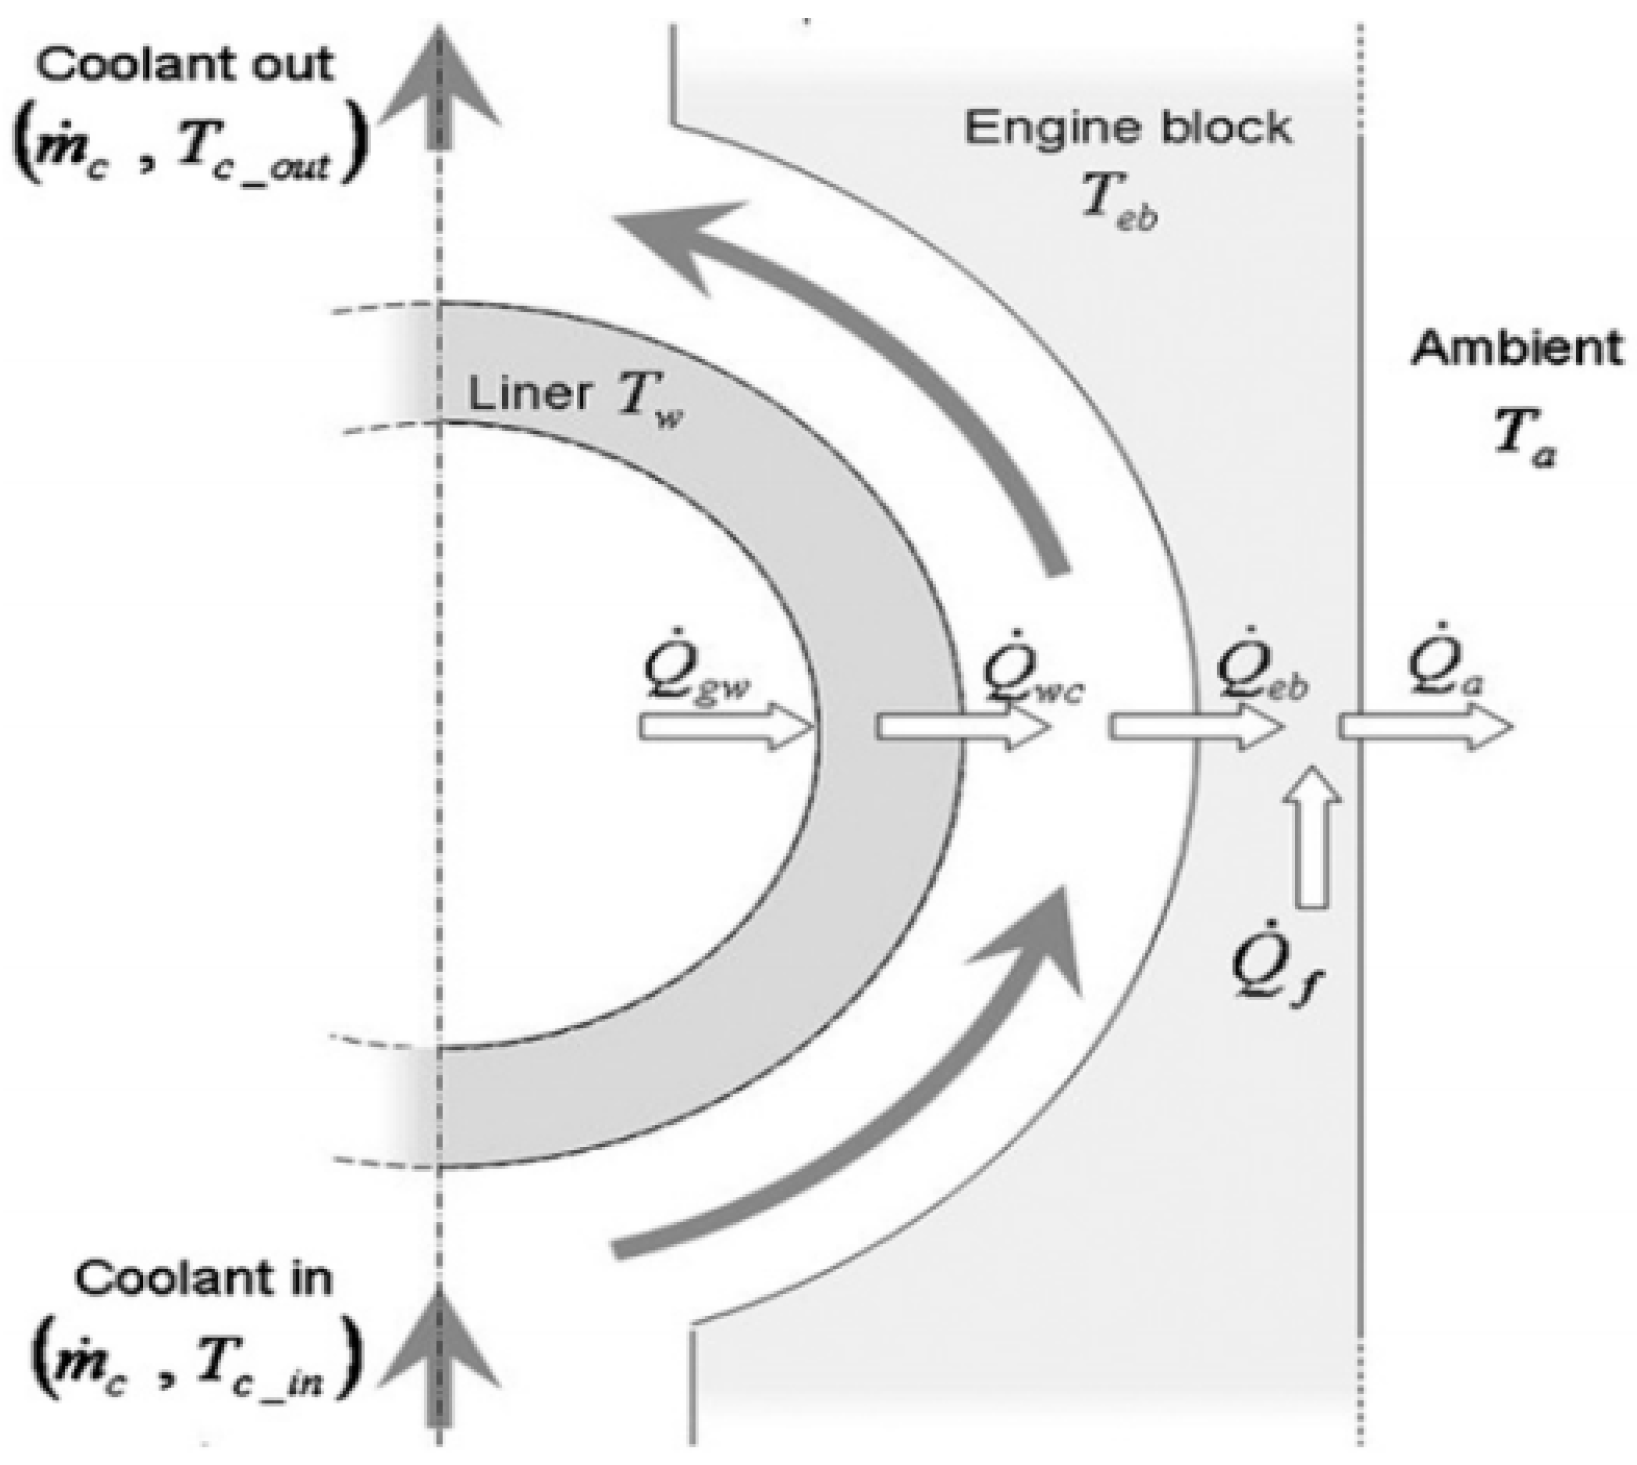
2. Engine Cooling Mechanism Model

In this section, the mathematical model of engine cooling system mechanism was established and verified by the system bench test. There were two main functions of the mathematical model. First, it was used to calculate the cooling process of the engine and evaluate the thermal control performance of different thermal management control schemes as the controlled system. Secondly, it provided the system future state information for the model prediction controller, so as to solve the objective function optimization equation, realizing the coordinated control of the pump and fan. System mechanism mathematical modeling was of great significance in integrated thermal management design, and it was the basis of evaluation, analysis, optimization and control. Therefore, in order to ensure the reliability of numerical model, many classical mathematical description methods and thermal transfer formulas were adopted in this paper to establish the engine cooling system model.

2.1. Engine Internal Thermal Transmission Model

The comprehensive heat transfer rate for the internal convection and radiation received by the cylinder wall Q g w ˙ was calculated with respect to the mixture gas combustion exothermic rate and heat emission coefficient. h e m i s s i o n can be obtained through the system thermal balance test. Figure 3 presents the thermal transmission process between the cylinder, coolant, engine block, and the external environment [33]. The following energy balance equations were established for each component.
The thermal production equation of the engine is defined as
Q g w ˙ = Q c o m ˙ · h e m i s s i o n
The energy balance equation of the cylinder wall is defined as
Q g w ˙ Q w c ˙ = m l · C l · d T w d t
The energy balance equation of the coolant is defined as
Q w c ˙ + m c ˙ · c c · ( T c , e i n T c , e o u t ) Q e b ˙ = m c , e · c c · d T c d t
The energy balance equation of the engine block is defined as
Q e b + ˙ Q f Q a ˙ ˙ = m e b · c e b · d T e b d t
The temperature distribution of the cylinder and the engine block were considered uniform by the lumped parameterization. The coolant temperature gradient in the jacket was assumed constant, and T c was represented by the arithmetic mean value of the engine inlet and outlet temperatures. To establish the convection heat transfer equations, the Hohenberg convection heat transfer model was applied to determine the heat transfer coefficients, specifically α w c and α e b [34].
The convection heat transfer equations of the coolant are defined as
Q w c ˙ = w c · A l ( T w T c o u t + T c i n 2 ) Q e b ˙ = α e b · A e b ( T c o u t + T c i n 2 T e b )
Since the natural convection between the engine surface and ambient air only accounts for 1–2% of the coolant, Q a ˙ can be neglected in the system energy balance equations. Q f ˙ is the friction thermal load generated by the mechanical motion of the piston and is calculated with the engine friction mean effective pressure (FMEP) as [33]
Q f ˙ = F M E P · V ω e ε
The liquid-immersion lubricant cooler was applied in thermal management system, and the lubricant cooler was cooled by the coolant of engine. There were two routes during the thermal transmission of the entire system: a part of the thermal load was directly transmitted to the external environment via the radiator with the heat exchange between the coolant and the cylinder; the other part was carried away by the lubricant, passing through the lubricant cooler, and this the heat was finally transferred to coolant in jacket. These two paths both ultimately exchanged the heat to the coolant in the radiator, thus the cylinder and the lubricant circuit were regarded as a whole in the energy balance equation. In order to simplify the model calculation, it was considered that the total thermal load of the engine was transmitted to the coolant, and the thermal exchange between the cylinder and the lubricant also could be ignored.

2.2. External Cooling Circulation Model

The external circulations include two branches of the radiator and bypass cycles, which are composed of the thermostat, radiator, coolant pump, and cooling fan, as shown in Figure 4. The cooling circulation hydraulic head was provided by a volumetric pump, and the coolant flow rate is a linear relationship with the pump speed. The electronic thermostat adjusts the valve lift according to T c , e o u t , thus determining the flow ratio of the radiator cycle and bypass cycle. Figure 5 presents the temperature characteristic curve of the electronic thermostat valve lift. The flow balance equation of the thermostat and the energy balance equation of the radiator are established as Formulas (8) and (9). The circulation branch flow rate is assumed proportional to the thermostat lift.
The pump coolant flow rate is defined as
m c ˙ = N p u m p · V p u m p · ρ c / 60
The flow balance equation of the thermostat is defined as
m c ˙ = m r ˙ + m b y ˙ = l t ( T c , e o u t ) · m c ˙ + [ 1 l t ( T c , e o u t ) ] · m c ˙
The energy balance equation of the radiator is defined as
m r ˙ · c c · ( T c , e o u t T c , r o u t ) Q r = m c , r ˙ · c c · d T c , r o u t d t
The convection heat transfer coefficient expressions on the liquid and air sides were fitted by the semi-empirical formula through the steady experimental data of the radiator (Figure 6). Coefficients a and b are the exponential fitting coefficients of the internal and external fluids, respectively. The thermal transmission equation of the radiator was established to determine the heat transfer capacity per unit temperature difference, U A , using the number of transfer units (NTU) method to calculate Q r ˙ , which is the heat transfer rate in the radiator [35].
The thermal transmission equation of the radiator is defined as
U A = 1 1 A c · α c + δ t λ t · A t + 1 A a · α a = 1 1 a i n · G c b i n + δ t λ t · A t + 1 a e x t · G a i r b e x t
where N T U = U A m r · c c ˙ , ε = 1 e N T U , Q r ˙ = ε · m r · c c · ( T c , r i n T a i r i n ) .

2.3. System Energy Consumption Model

Formula (11) is the pressure balance equation of the pump head, engine pressure drop, radiator pressure drop, and thermostat pressure drop. The pressure drop of the water jacket and radiator were mainly the flow friction loss, which can be approximately considered as the quadratic polynomial of the coolant flow rate. The thermostat is the resistance pressure drop caused by the orifice throttling, which is related to the flow area and resistance coefficient of the valve body [36].
The pressure balance equation of the cooling circulation is defined as
H p u m p · ρ c · g = P e d r o p + P r d r o p + Δ P t r a d i a t o r = P e d r o p + Δ P t p a s s
The thermostat flow rate is defined as
m r ˙ = A t r · C t r ( 2 · Δ P t r a d i a t o r / ρ c )
The energy consumption of the pump and fan was calculated by the effective power and efficiency of the fluid machinery. The effective power refers to the mechanical power of the medium obtained from the fluid machinery, which is related to the flow rate and hydraulic head. Efficiency is converted between the effective power and the energy consumption of components, wherein factors such as the fluid friction, bearing rotational friction, and motor mechanical efficiency are taken into account [37].
P p u m p e = ρ c · g · V p u m p · H p u m p 1000 , P f a n e = V f a n · Δ P f a n 1000
P p u m p e = P p u m p · η p u m p P f a n e = P f a n · η f a n P f a n e = P f a n · η f a n

2.4. Model Validation

Because the reliability of numerical model directly affects the control performance of thermal management system, the mechanism model of engine cooling established in this paper should be verified the bench test, which is mainly used to provide reasonable system state prediction for NMPC controller. Taking NEDC driving cycle as the test condition, the engine cooling system model was verified by bench test. The vehicle speed information and the gearbox shift strategy in test condition were converted into engine speed signal, which was transmitted to the electromagnetic dynamometer. The dynamometer provided load for the engine according to the controlled engine speed information. The ECU controller adjusted accelerator pedal signal to ensure corresponding engine torque load. The signals of engine speed and brake mean effective pressure (BMEP) were obtained from dynamometer. The heat emission coefficient was determined with the interpolation of engine speed and BMEP in engine MAPs. Finally, the thermal load of the cooling system can be estimated by Formula (1), in which the dynamic fuel consumption rate was measured with fuel consumption meter. Engine speed, fuel consumption rate and BMEP in test condition were present in Figure 7, and the calculated thermal load of the cooling system was shown in Figure 8. Temperature sensors were arranged at the inlet and outlet of the engine jacket and the inlet of the thermostat, respectively reading the coolant temperature inside the engine and the thermostat. The coolant temperature signal could be translated into the information of the valve lift by the thermostat characteristic curve. The radiator was located in a wind tunnel where the velocity was maintained in range of 4.5 ± 0.5 m/s and temperature was controlled within 30 ± 0.2 °C. When the engine coolant temperature reached up to 90 °C, the operating mode was turned on and the fan rotate speed was 4000 rpm. If the coolant temperature was below 80 °C, the mode would switch to stationary. The coolant pump was driven by engine crankshaft through pulley, and the transmission ratio was 1.05. The engine coolant temperature and thermostat lift comparisons between the model calculation and experimental test are presented in Figure 9 and Figure 10, respectively.
The coefficient determination was selected as the evaluation standard for the model’s credibility [19]. In the regression process, R 2 represents the proportion of the explained variation in the total variation, whose value ranges from 0 to 1. When the R 2 value is closer to 1 indicates that the simulation result is consistent with the experimental test.
R 2 = ( X e x p i X s i m i ) 2 ( X e x p i X _ e x p i ) 2
In this article, the coolant temperature determination coefficient was 0.947 and thermostat valve lift was 0.752. The mainly influential factors of the simulation can be deduced as follows:
(1)
At the engine starting stage, the thermostat was closed and some coolant remains idle in the radiator cycle but not in the bypass cycle. As a result, the coolant mass determined by the simulation calculation was higher than the actual test value, thereby resulting in a reduced heating rate.
(2)
The radiator heat transfer rate of simulation model was calculated based on steady radiator data without considering the actual heat transfer inertia. In addition, temperature response velocity was infinity. This hypothesis is more suitable for the condition of a relatively stable coolant temperature, which resulted in the forward movement of the thermostat opening time.
Although deviations were presented in the system prediction model at the engine start stage, the determination coefficients of the system model reached to 0.972 and 0.896 with the radiator cycle opening. The increases indicated that the estimated results of prediction model in the normal operating range had a higher reliability. Furthermore, the present study focused on the collaborative control of the pump and fan as well as the influence of the underhood structure on the system performance without paying any attention to the engine cold start process. Based on these observations, the system prediction model could be fulfilled with the reliability requirements of NMPC controller.

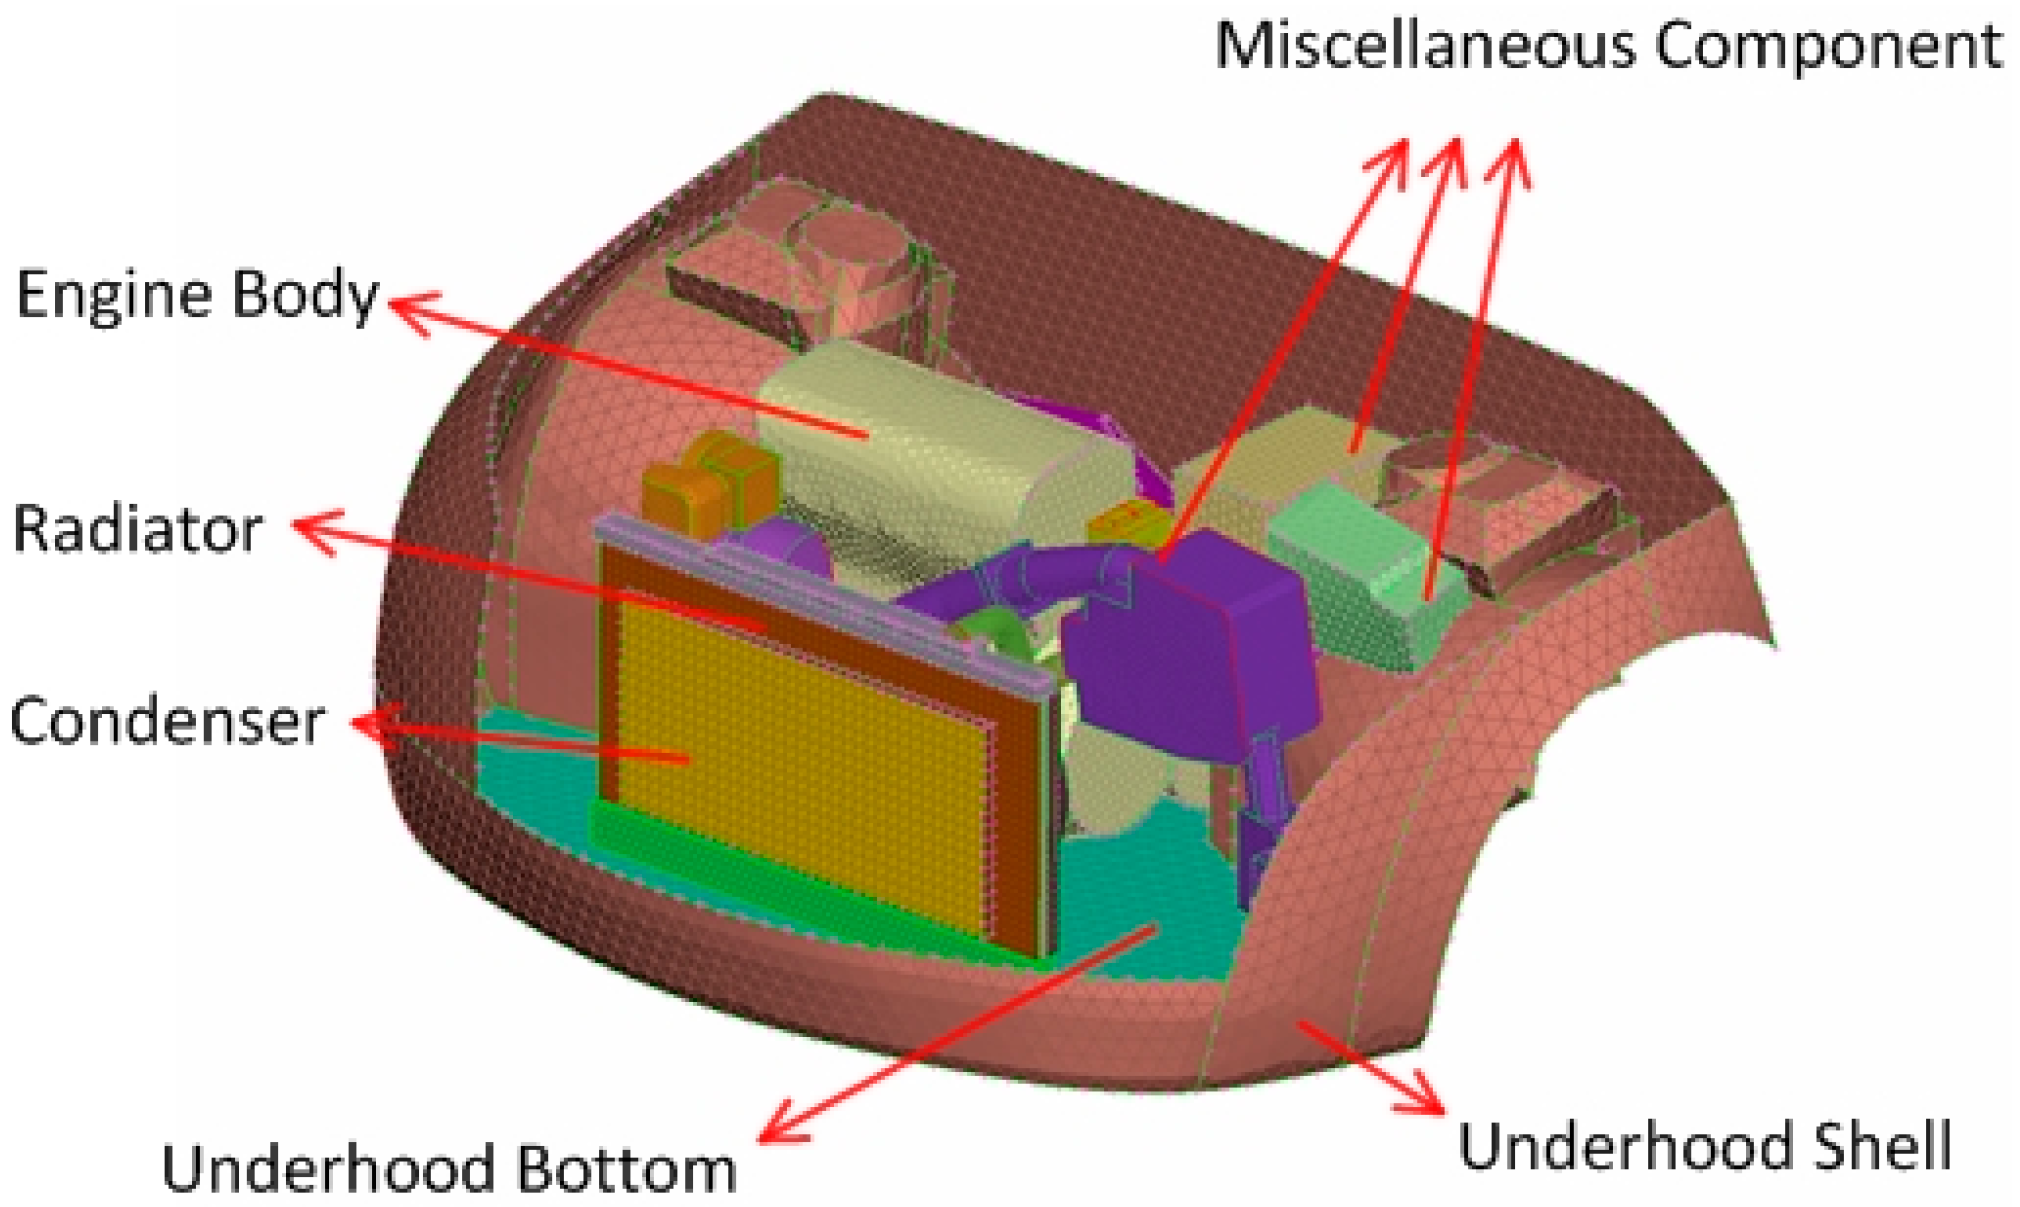
3. Coupling Thermal Transmission Model of the Underhood Structure

In this section, CFD numerical method was adopted to simulate the aerodynamic coupling thermal transmission process in underhood. The multi-system coupling thermal boundary conditions for radiator were provided, and the calculation result of the mathematical model could be closer to the actual vehicle driving situation. In addition, the concept of coupling factor was proposed to characterize the coupling thermal transmission with lumped parameters method, realizing the correlation between CFD simulation and system control model. In this way, the structural characteristics of CFD model were reflected into the performance evaluation of the thermal management system, rather than simply limited to the observation of temperature, pressure, and heat exchange capacity underhood.

3.1. Underhood CFD Simulation

The CFD simulation was applied to observe the flow field, temperature distribution, and heat transfer process in the engine compartment based on the interactive thermal transmission mechanism of multiple heat exchangers. The underhood geometric structure model was displayed in Figure 11 which included the cabin shell, condenser, radiator, engine, and other components.
The intake grille wall was set as the velocity-inlet boundary condition, which imported the ambient temperature and the vehicle windward velocity. The cabin shell wall was sat as the adiabatic boundary ignoring solar radiation and external convection thermal transmission. The underhood bottom wall was defined as the pressure outlet boundary condition, and the background pressure was set as one standard atmospheric pressure (i.e., 1 ATP) [29]. In the process of aerodynamic coupling thermal transmission in the CFD model of engine compartment, the only fluid medium is the air. In addition, the liquid-side convection heat exchange capability of heat exchangers was described in the cooling system mathematical model [38]. The volume thermal generation load in each heat exchanger was defined, such that the convection heat transfer coefficient was deemed uniform and the surface weighted average temperature was used as the observation of the thermal transmission boundary, thus ignoring the inconsistencies on the windward surfaces [39]. The flow pressure drop of the heat exchanger core was characterized by the porous media model, and the inertial and viscous resistance coefficients were fitted by the experimental resistance curves in the porous media transmission equation [40]. The flow characteristics of fan were calculated in two ways: 3D-FAN_ZONE and rotating coordinate system methods. If the detailed geometric grids of fan blades were provided, rotation coordinate system method could be selected to define the normal vector of the rotation axis, the position of the rotation region, and the relative angular velocity were defined, as shown in Figure 12. The 3D-FAN_ZONE was a simplified fan simulation method, which was suitable for the conditions that the flow characteristic curves of fan were known without complex geometric mesh of the fan. In this method, the flow-rate and pressure of the fan rotation domain were calculated in the one-dimensional process.
It was difficult to gather data for CFD simulation verification due to the lack of wind tunnel tests. However, the present study refers to other similar cases and processes for the simulation calculations, specifically for the mesh quality and physical equations, to ensure the credibility of the results [41,42,43]
  • Due to fan rotation motion, the standard turbulence equation covered the influencing factors of vorticity in the air rotation domain. Therefore, a more reasonable RNG k ε turbulence transport equation was adopted to improve the accuracy of the flow calculation. In addition, the second order windward discrete scheme was selected to enhance the precision of the simulation results.
  • Different grid forms were used to discretize the underhood geometry model. Heat exchangers and other important observation components were divided by the high-quality structural mesh. The complex structures—such as the shell, engine, and fan—adopted a more flexible unstructured grid. In addition, local encryption was carried out on the acute angle boundary and the area with a high extension ratio to guarantee the integrity of the geometric features. Considering the boundary effect of air flow, the wall boundary layer mesh were refined in the following regions, the fan blades, air rotation domain, flow scanning surfaces of radiator, condenser, and engine.
  • Based on the test results, the total number of grids was more than 1.5 million. And when the number of iteration steps was exceeded 800, the global calculation precision residuals of CFD model can be controlled within 10−3, and the residuals of the important observation parameters were less than 10−5. Such observation parameters can be temperature, pressure, turbulent dissipation rate, and convection heat transfer coefficient. This simulation also took consideration of grid independence, computational stability, and simulation time. After mesh trials, the model mesh size was finally defined to be 2.5–6.5 mm, the grid number is 1.7 million with a mesh quality of 0.5–0.85. Furthermore, the iterative step number is 900 in the steady simulations.

3.2. Coupling Thermal Transmission Equation

In the cabin, the integrated heat exchangers module was located at the front of engine compartment and was situated in a narrow heat transfer space with other components. During the aerodynamic cooling process, heat exchangers interacted with each other through air flow through two main aspects: (1) an upstream heat exchanger that warmed the downstream heat exchanger air intake; (2) and through fan suction, radiator resistance, and engine obstruction, which generated high-temperature air reflow. The coupling thermal transmission equation was established for the whole engine compartment to determine the mathematical relation of the radiator inlet temperature about the thermal source load and underhood construction. The temperature distribution in the cabin mainly depended on the air flow field and thermal load of the heat sources. The vehicle speed V c a r and fan speed N f a n were the primary factors for the flow field. In addition, underhood heat sources were also observed such as the radiator load Q r ˙ , condenser load Q c ˙ , convective heat transfer of engine block Q a ˙ , and radiation heat transfer of external environment Q e n v ˙ .
T a i r , r i n = f s t r ( V a i r , r i n , Q r ˙ , Q c ˙ , Q a ˙ , Q e n v ˙ , T e n v )
where f s t r is the structural heat transfer function, is established with the CFD model, and represents the mathematical relationship between the intake temperature of the radiator T a i r , r i n and factors. In addition, V a i r , r i n is the air mass flow rate of the radiator and is related to the vehicle and fan speeds. The thermal transmission equation of the radiator was established according to Formula (10) and is expressed as
Q r ˙ = f r a d i a t o r ( V a i r , r i n , T a i r , r i n , m r ˙ , T c , r i n )
where f r a d i a t o r is the radiator thermal transmission function established by the mathematical model of the cooling system and reflects the relationship between Q r ˙ and T a i r , r i n . In the aerodynamic thermal transmission process of the underhood, T a i r , r i n and Q r ˙ should be both satisfied by Formulas (16) and (17). Under different conditions, f s t r and f r a d i a t o r are plotted in the plane coordinate system of Q r ˙ and T a i r , r i n , thereby establishing the simultaneous equation. The construction of a function f c o u p l e ensures that all the coordinates of Q r ˙ and T a i r , r i n both satisfy f s t r and f r a d i a t o r and are located on the function. The constructor function is defined by the coupling thermal transmission function, and Figure 13 is the schematic diagram of the coupling thermal transmission equation.
The coupling thermal transmission function is formulated to establish the mathematical relationship between the intake temperature and thermal load of heat exchangers during the aerodynamic coupling heat transfer process. In this way, T a i r , r i n could be obtained with f c o u p l e and Q r ˙ in the engine cooling system mathematical model. In addition, the structural factors of the underhood are also reflected by the coupling thermal transmission function. To calculate T a i r , r i n , the coupling factor method was proposed based on three theoretical assumptions:
  • The thermal transmission interaction of the heat exchangers is only considered and the heat convection of engine block Q a ˙ and external environment heat transfer rate Q e n v ˙ are ignored.
  • The physical parameters of air were regarded as constant such as the density, specific heat, and thermal conductivity. Therefore, the temperature field in the engine compartment may not affect the air flow and thus may not change the convection heat transfer coefficient of the heat exchanger.
  • Assuming an acceptable response speed of the aerodynamic heat transfer, the system dynamic process can be replaced by multiple steady state conditions.
In Assumption 1, the effects of Q a ˙ and Q e n v ˙ were neglected, and the coupling heat transfer process only considered the thermal interaction of condenser and radiator. Based on Assumption 2, the convection heat transfer coefficients of the heat exchangers under steady state conditions were only related to the vehicle speed and fan speed, which are independent of the underhood temperature distribution. Therefore, f s t r could be simplified as the linear expression
T a i r , r i n = k r · Q r ˙ + k c · Q c ˙ + T e n v
where k r · Q r ˙ and k c · Q c ˙ represent the air intake temperature rise of the radiator, which is caused by the high-temperature air reflow and condenser calefaction; k r is defined as the coupling factor of radiator; and k c is the coupling factor of the condenser. The coupling factors were determined by the CFD model, and the vehicle speed and fan speed were adjusted after the thermal loading of the heat exchangers to observe the radiator inlet temperature, as presented in Formula (19). Figure 14 and Figure 15 are the coupling factor curves under different conditions.
k r i , j = T a i r , r i n i , j T e n v Q r i , j ˙ k c i , j = T a i r , r i n i , j T e n v Q c i , j ˙
where i , j are the mark numbers of the fan speed N f a n i and vehicle speed V c a r j , respectively.
Considering the coupling factors for further mathematical treatment, the flow influencing elements and the structure influencing element were decoupled. In addition, the coupling factor curves were fitted with the form of the exponential function.
k r = f r ( N f a n , V c a r ) = R r , 1 · N f a n · V c a r R r , 2 · N f a n k c = f c ( N f a n , V c a r ) = R c , 1 · N f a n · V c a r R c , 2 · N f a n
where R r and R c are the structural coefficients and represent the effects of the underhood structure on the coupling factors such as the space position of the heat exchangers and the flow resistance characteristics of the radiator core, respectively. Both can determine the necessity to install the flow guide device (baffle plate and heat shield). According to Assumption 3, Formula (18) can be expressed as a differential form:
d T a i r , r i n d t = d ( k r · Q r ˙ ) d t + d ( k c · Q c ˙ ) d t = f r · d Q r ˙ d t + Q r ˙ · d f r d t + f c · d Q c ˙ d t + Q c ˙ · d f c d t
Formula (21) shows the mathematical relationship of the thermal load, fan speed, vehicle speed, and underhood structure. Formula (21) quantitatively describes the effects of the structural characteristics and flow characteristics on the coupling thermal transmission process. The radiator air intake temperature under the action of the underhood aerodynamic coupling thermal transmission was calculated by the coupling factor and coupling thermal transmission equation. The thermal transmission boundary conditions with structural characteristics were provided for the radiator module, and the correlation between the system mathematical model and underhood CFD model was established to achieve the multidimensional coupling simulation for integrated vehicle thermal management.

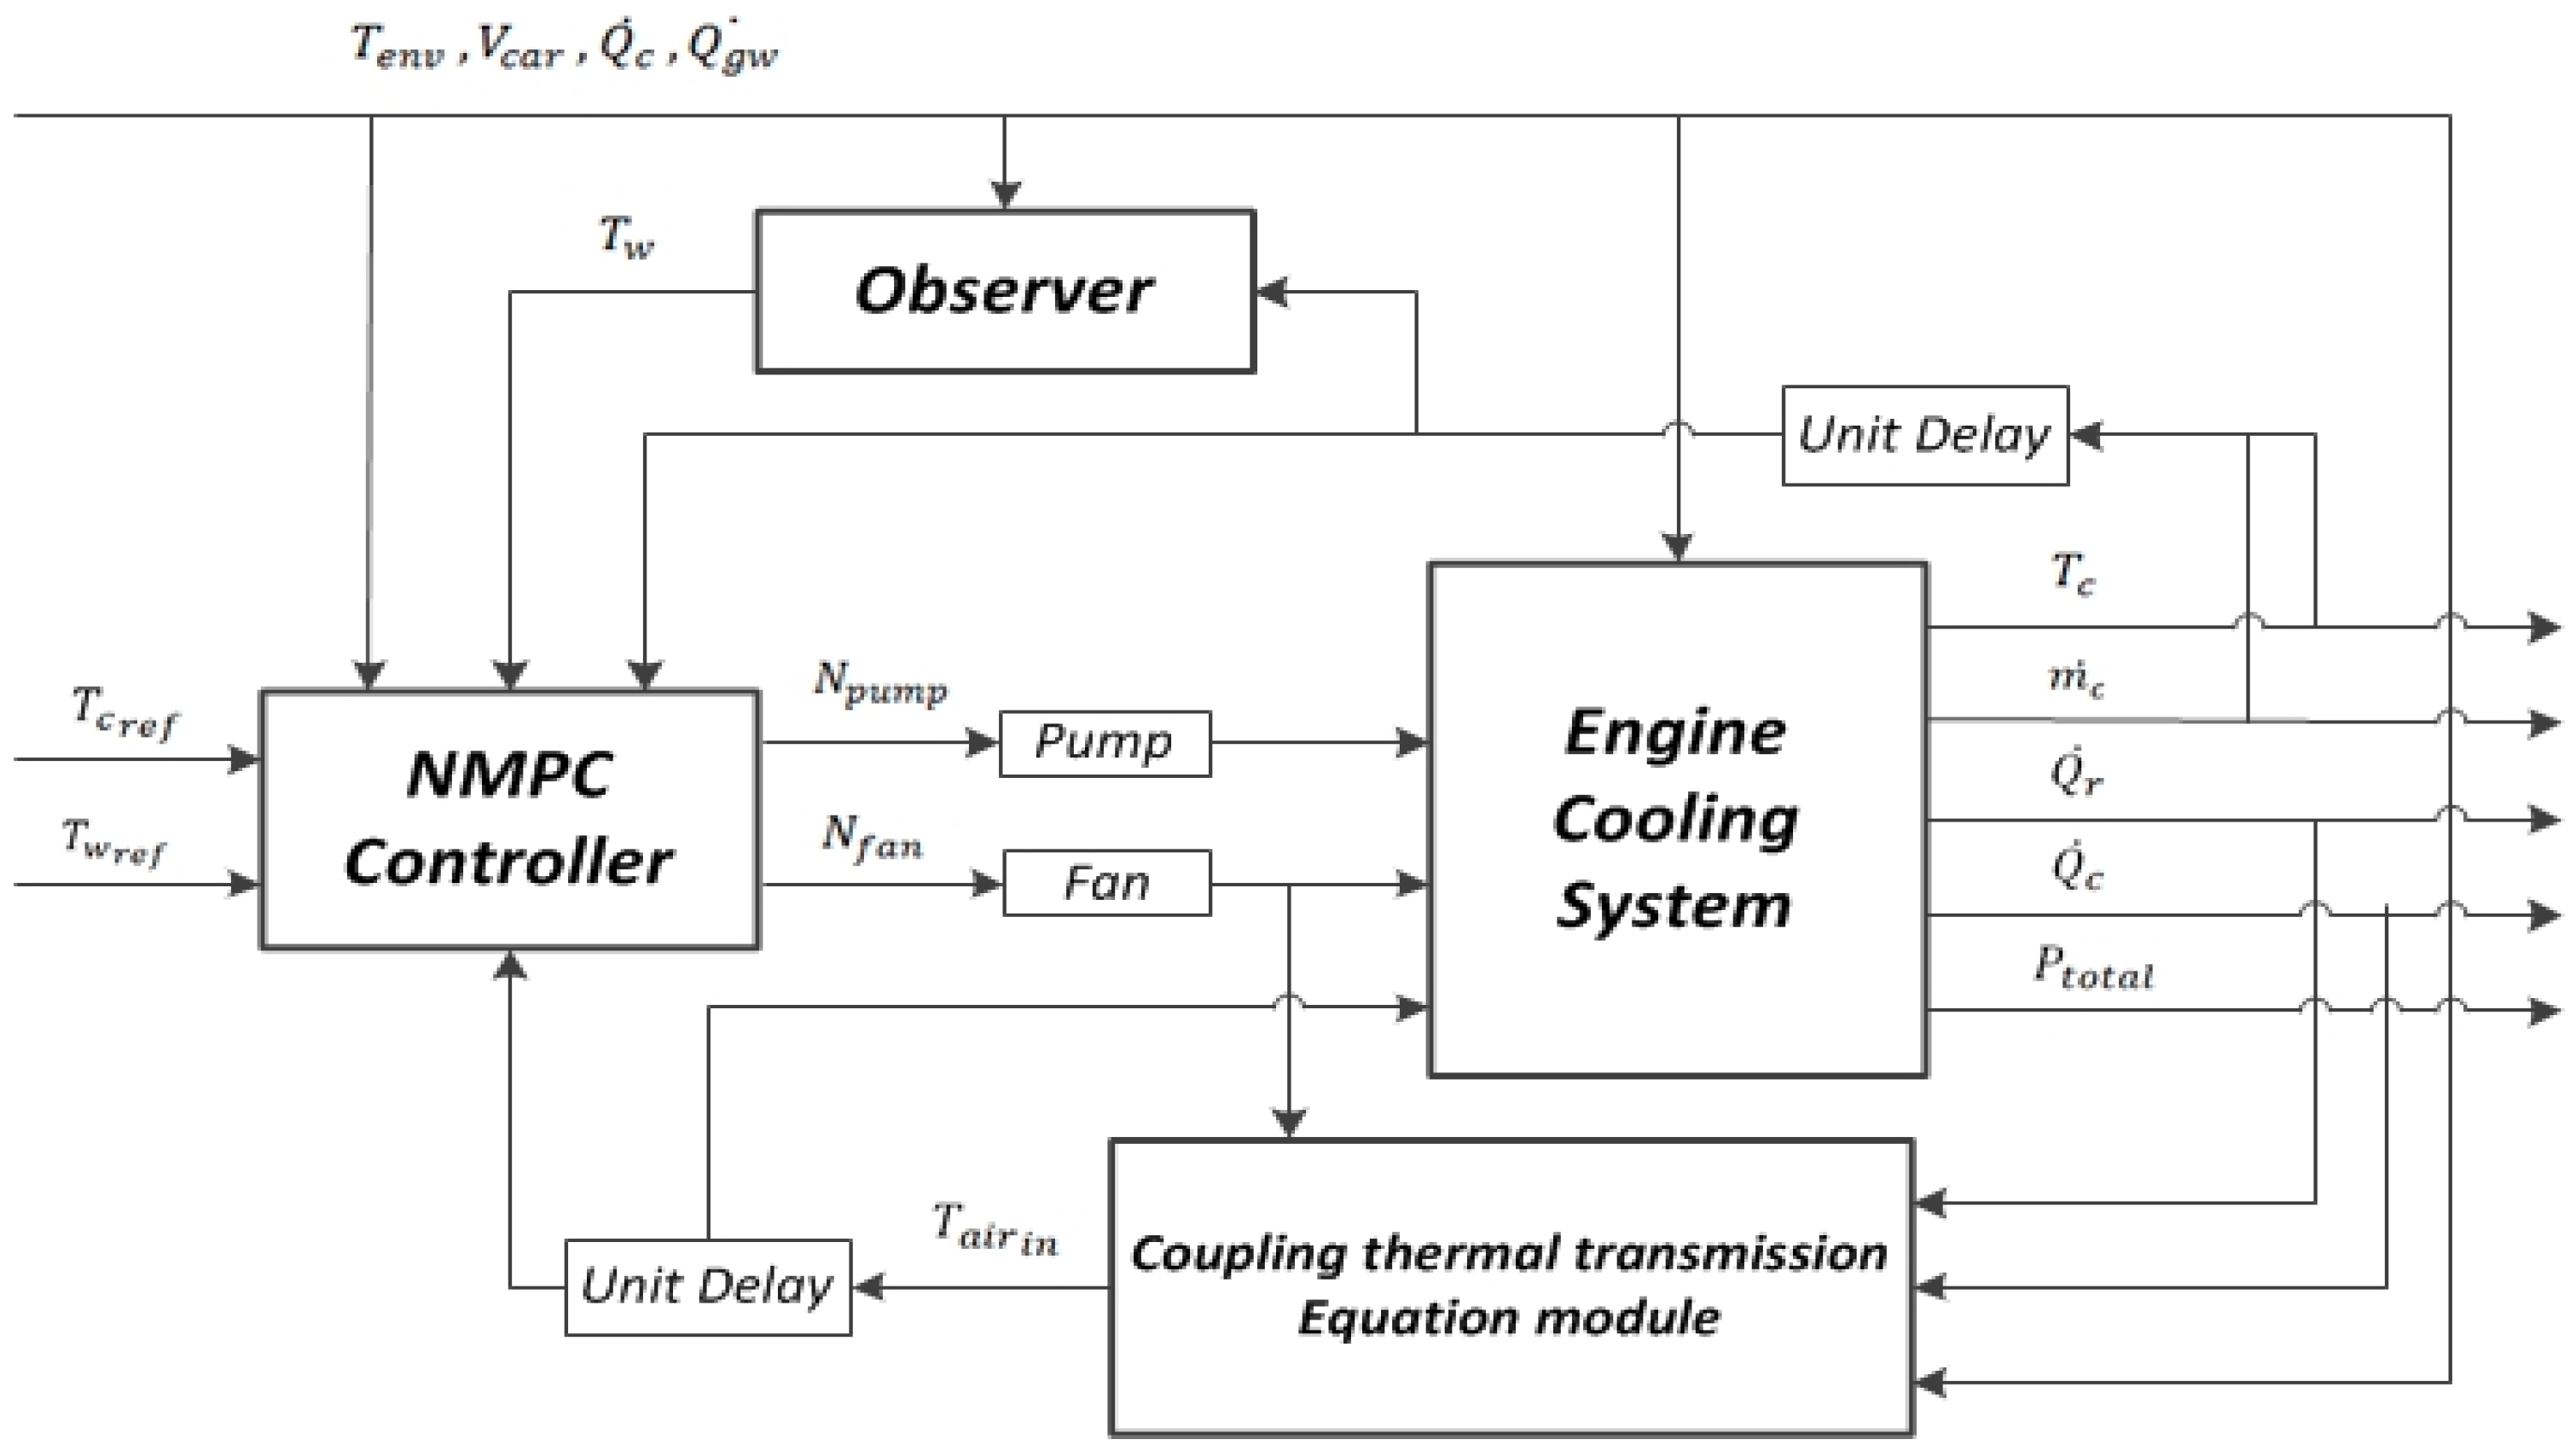
4. Integrated Thermal Management NMPC Control Design

In this section, the nonlinear model prediction controller was designed for the integrated thermal management system. The engine coolant temperature and the average cylinder temperature were taken as the control objectives, and the coordinated control of coolant pump and electronic fan was realized according to the driving condition and environmental temperature of the vehicle.

4.1. NMPC Controller Design

Figure 16 is the schematic diagram of NMPC control process. The controller adjusted the speed of the fans and pumps in real time according to the thermal load of the engine and the vehicle driving condition, and selected the combination of the pump and fan with lower energy consumption while satisfying the coolant temperature control requirements. The actual control objective of the system shall be T c and P t o t a l , though their variation ranges are at different orders of magnitude. The direct adoption of P t o t a l as the objective function may have caused instability in the control of T c . Therefore, T w was closer to the variation range and was selected as the input of the controller. In addition, the comprehensive energy consumption of the system was indirectly optimized by analyzing the function relation of T w with respect to P t o t a l .
It is inconvenient to measure T w under actual operation conditions. Therefore, Tw was determined by the indirect calculation of other physical quantities such as m c ˙ , T c , , and Q ˙ g w . Therefore, an open loop state observer was introduced into the control system to estimate the value of T w for future controls [44]. Information on T c , m c ˙ , Q r , ˙ and Q c ˙ was transmitted to the NMPC controller through the sensors. In addition, the air intake temperature of the radiator at the current time was computed by the coupling thermal transmission equation model with the parameters of V c a r , T e n v , N f a n , Q r ˙ , and Q c ˙ . N f a n and N p u m p were regarded as the control outputs to the engine cooling system.

4.2. Predictive Model Equation

The Euler method was used to discretize the system state equation and variables, which can be expressed in the prediction control horizon as
x ( k + 1 | k ) = f ( x ( k ) , N f a n ( k ) , N p u m p ( k ) ) = F ( x ( k ) , N f a n ( k ) , N p u m p ( k ) ) x ( k + 2 | k ) = f ( x ( k + 1 ) , N f a n ( k + 1 ) , N p u m p ( k + 1 ) ) = f ( f ( x ( k ) , N f a n ( k ) , N p u m p ( k ) ) , N f a n ( k + 1 ) , N p u m p ( k + 1 ) ) x ( k + 1 | k ) = f ( x ( k ) , N f a n ( k ) , N p u m p ( k ) ) = F ( x ( k ) , N f a n ( k ) , N p u m p ( k ) ) x ( k + 2 | k ) = f ( x ( k + 1 ) , N f a n ( k + 1 ) , N p u m p ( k + 1 ) ) = f ( f ( x ( k ) , N f a n ( k ) , N p u m p ( k ) ) , N f a n ( k + 1 ) , N p u m p ( k + 1 ) )
The engine coolant temperature and cylinder wall temperature were defined as the input variables of the controller x = [ T c , T w ] T , and the fan speed and pump speed were the output variables u = [ N f a n , N p u m p ] T . In addition, the coolant temperature and comprehensive energy consumption were the state parameters of the cooling system at N p moment as
T c ( k + N p | k ) = g t ( x ( k + N p | k ) ) P t o t a l ( k + N p | k ) = g p ( x ( k + N p | k ) )

4.3. Objective Functions and System Constraints

The NMPC controller solves the fan and pump speeds by the extremum optimization equation of the objective function. The objective function optimization equation can be constructed in the form
m i n k J = ( Y 1 N p ( k ) , Y 2 N p ( k ) , N u , N p ) J = w 1 Y 1 N p ( k + 1 | k ) R 1 ( k + 1 ) 2 + w 2 Y 2 N p ( k + 1 | k ) R 2 ( k + 1 ) 2
where,
Y 1 N p ( k + 1 | k ) = [ T c ( k + 1 | k ) T c ( k + 2 | k ) T c ( k + N p | k ) ]
Y 2 N p ( k + 1 | k ) = [ T w ( k + 1 | k ) T w ( k + 2 | k ) T w ( k + N p | k ) ]
R 1 ( k + 1 ) = T c r e f
R 2 ( k + 1 ) = T w r e f
where w 1 , w 2 are the weight coefficients of T c and T w , respectively. The fan and pump are limited by the motor load characteristics in the system operation and only operate under the maximum speed. In addition, the speed gradient should also be restrained and should consider the vibration, noise, and fatigue life of components.
Rotational speed constraint
0 N f a n 4500   ( rpm ) 0 N p u m p 4000   ( rpm )
Rotational speed gradient constraints
300 N f a n ˙ 300   ( rpm / s ) 300 N p u m p ˙ 300   ( rpm / s )

5. NMPC Thermal Management System Performance Evaluation and Optimization

Taking the temperature control stability and the system energy consumption as evaluation reference basis, the thermal control performance of engine cooling system with NMPC control scheme and PID scheme were compared using numerical simulation methods. By further analysis of the thermal management system, control strategy optimization scheme, and underhood thermal transmission structure optimization scheme were proposed to improve system energy efficiency in this section.

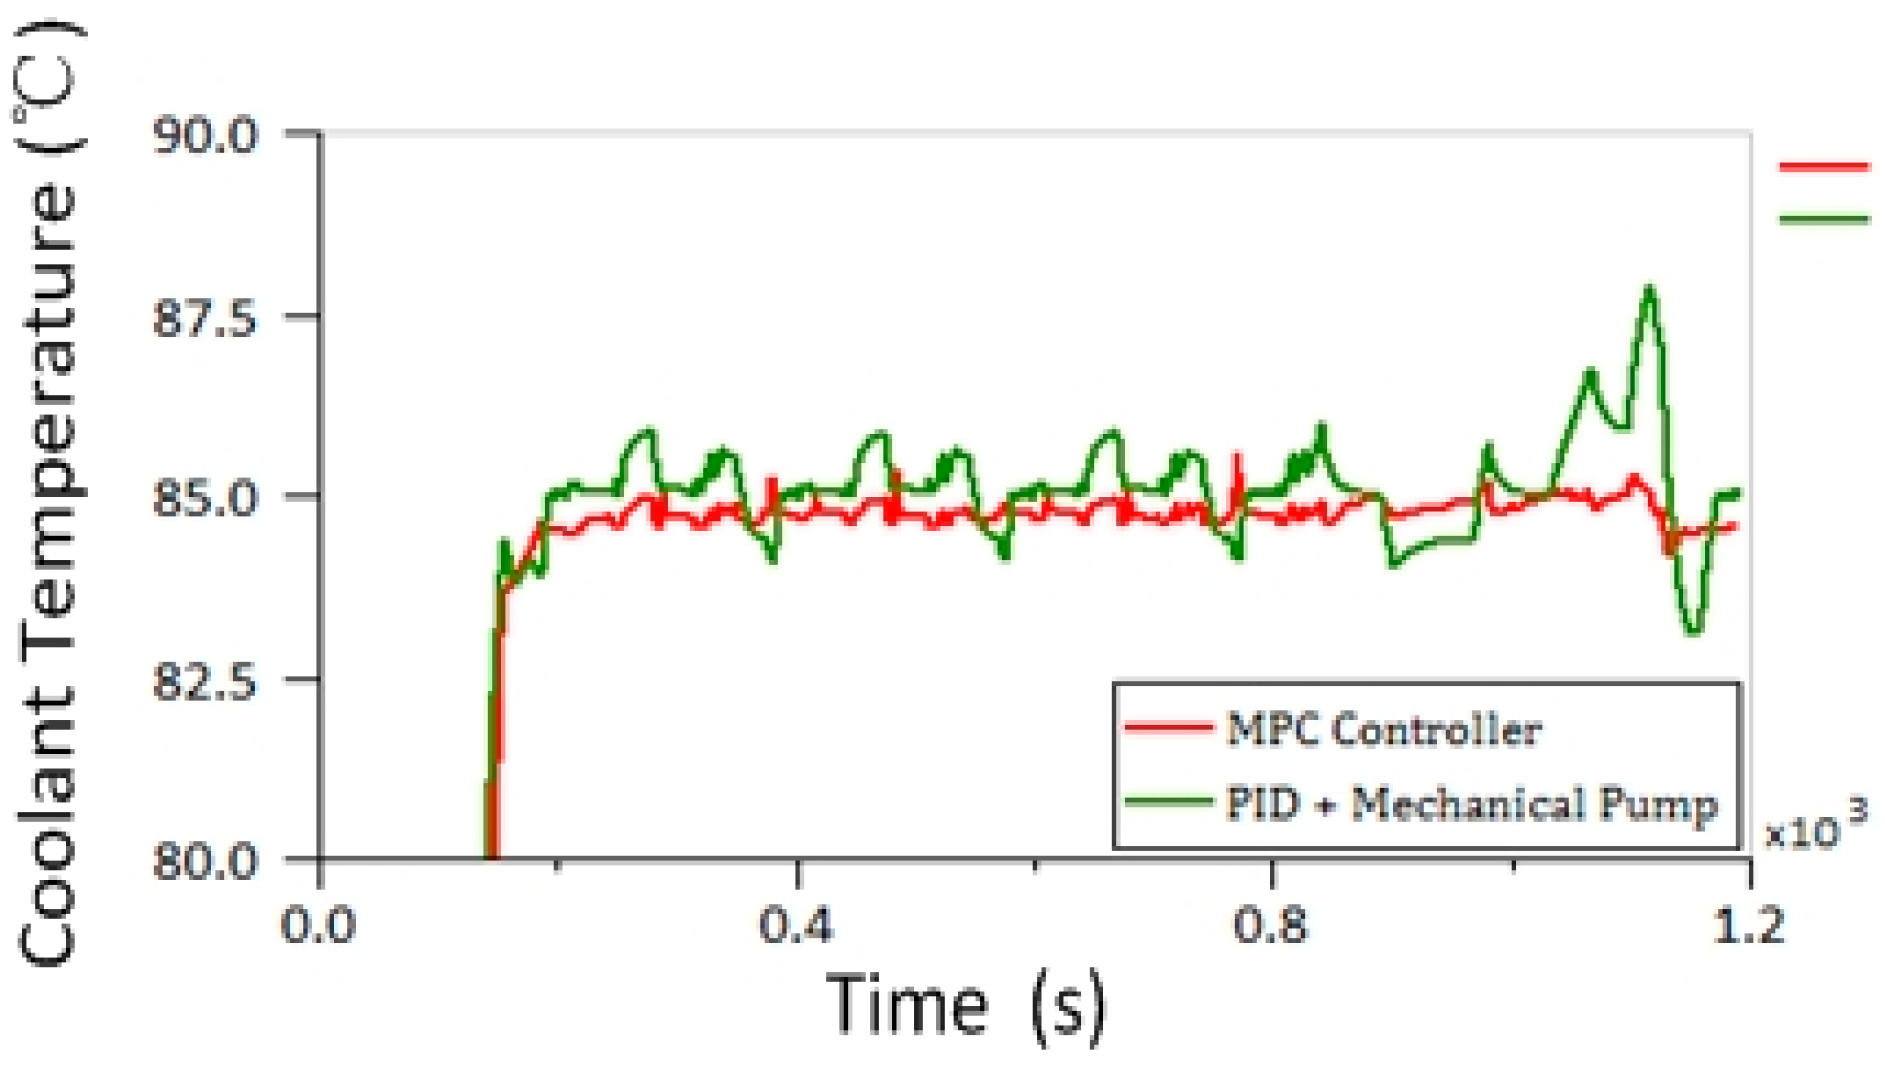
5.1. Performance Comparison of Control Schemes for Integrated Thermal Management System

At present, the industry is more inclined to apply feedback control schemes for engine thermal management because of their high reliability, simple control algorithm and low hardware requirements [45]. Since the feedback schemes control the system through the deviation of the controlled target, there is bound to be more or less time lag in control process. A smaller proportional gain coefficient will delay the system response, but the lager coefficient also leads to system oscillation. In addition, due to the non-minimum phase characteristics of pump flow control process, the feedback control is generally difficult to achieve the optimal coolant flow rate adjustment. So, the control schemes of mechanical pump and fan feedback adjustment are usually chosen in engineering application [46]. These schemes mainly rely on the thermostat to regulate the flow rate of the system, which will result in over-cooling under certain conditions with unnecessary energy waste.
The NMPC thermal management scheme based on feed-forward control mode owns the ability of multi-objective optimization control to realize the cooperative regulation of coolant pump and air fan. The controller could predict the system future state and solve the optimal speed of pump and fan, so the temperature control stability and response speed are better than the feedback control scheme. To demonstrate the technical advantage, the thermal control performance of NMPC thermal management scheme and traditional engine cooling scheme were compared in NEDC conditions. The traditional cooling system adopted PID control scheme of air fan with mechanical coolant pump.
In this case, the ambient temperature was defined as 30 °C, the controller sample interval is 0.5 s, and the engine target reference coolant temperature was set at 85 °C. The initial value of the system state was defined as the ambient temperature, and the controller was activated when the coolant temperature reached the opening temperature of the thermostat. The root mean square error (RMSE) between the engine actual coolant temperature and target reference coolant temperature was applied to evaluate the temperature control stability of the system.
R M S E = 1 N C i = 0 N C ( T c i T c r e f ) 2
The evaluation indicators were calculated based on the data in Figure 17, specifically R M S E N M P C = 0.228 (°C) and R M S E P I D = 1.547 (°C). The PID controller adjusted the fan speed based on the deviation between T c and T c   r e f , such that a time lag was observed in the system dynamic control process. The NMPC controller contained a system state prediction model and objective optimization function, which can solve the optimal speed of fan and pump according to the current feedback signal, so that the system will reach to the target state in the shorter time. The results indicated that the NMPC scheme was superior to the traditional cooling mode in temperature control stability.
In addition to evaluating the stability of temperature control, the comprehensive energy consumption of thermal management system in different control schemes was also analyzed. The energy consumption evaluation was taken the total power consumed by the thermal management system which was equal to the summation of the pump and fan power consumption, as shown in Formula (14). In the NMPC scheme, the actuator adopted motor driven mode, while the pump in the PID scheme was mechanically driven, so there were some measurement differences in energy consumption evaluation. In order to simplify the calculation, in this paper the energy of motors was thought to come from car batteries, which were charged by the engine driven generator, and the charging efficiency was 90%. The mechanical efficiency between motor and actuators (fan and pump) ranged from 85% to 95%, and value was quadratic polynomial about motor speed. The energy consumption of electric pump and electric fan was converted into equivalent engine mechanical power through efficiency conversion. In this way, the energy consumption evaluation standards of different schemes were unified.
In the traditional cooling mode, the pump and engine were connected by the mechanical transmission, the pump speed was proportional to the engine speed, and the transmission ratio satisfied the maximum thermal dissipation demand of the engine. In the partial loading conditions, the pump often provided the over current flow in the design, thereby resulting in excessive engine cooling with unnecessary thermostat throttle loss and water jacket flow friction loss. Taking J min ( T c   N k , T c   r e f , T w   N k , T w   r e f ) as the objective function coolant temperature, the system energy consumption could be reasonably controlled in the NMPC system based on the pump and fan cooperative control. An appropriate value of T w   r e f can weigh the thermal transmission cost in the liquid and air sides of the system. Therefore, it was necessary to choose the smaller pump speed to accurately control the coolant temperature and to avoid the throttle loss and flow friction loss caused by excessive cooling (Figure 18 and Figure 19). Figure 20 presents the energy consumption comparison of the two schemes, P t o t a l   N M P C = 175,744   ( J ) and P t o t a l   P I D = 247,672   ( J ) in the entire NEDC control horizon. As compared to the traditional cooling scheme, the energy consumption of NMPC scheme was reduced by 29%.

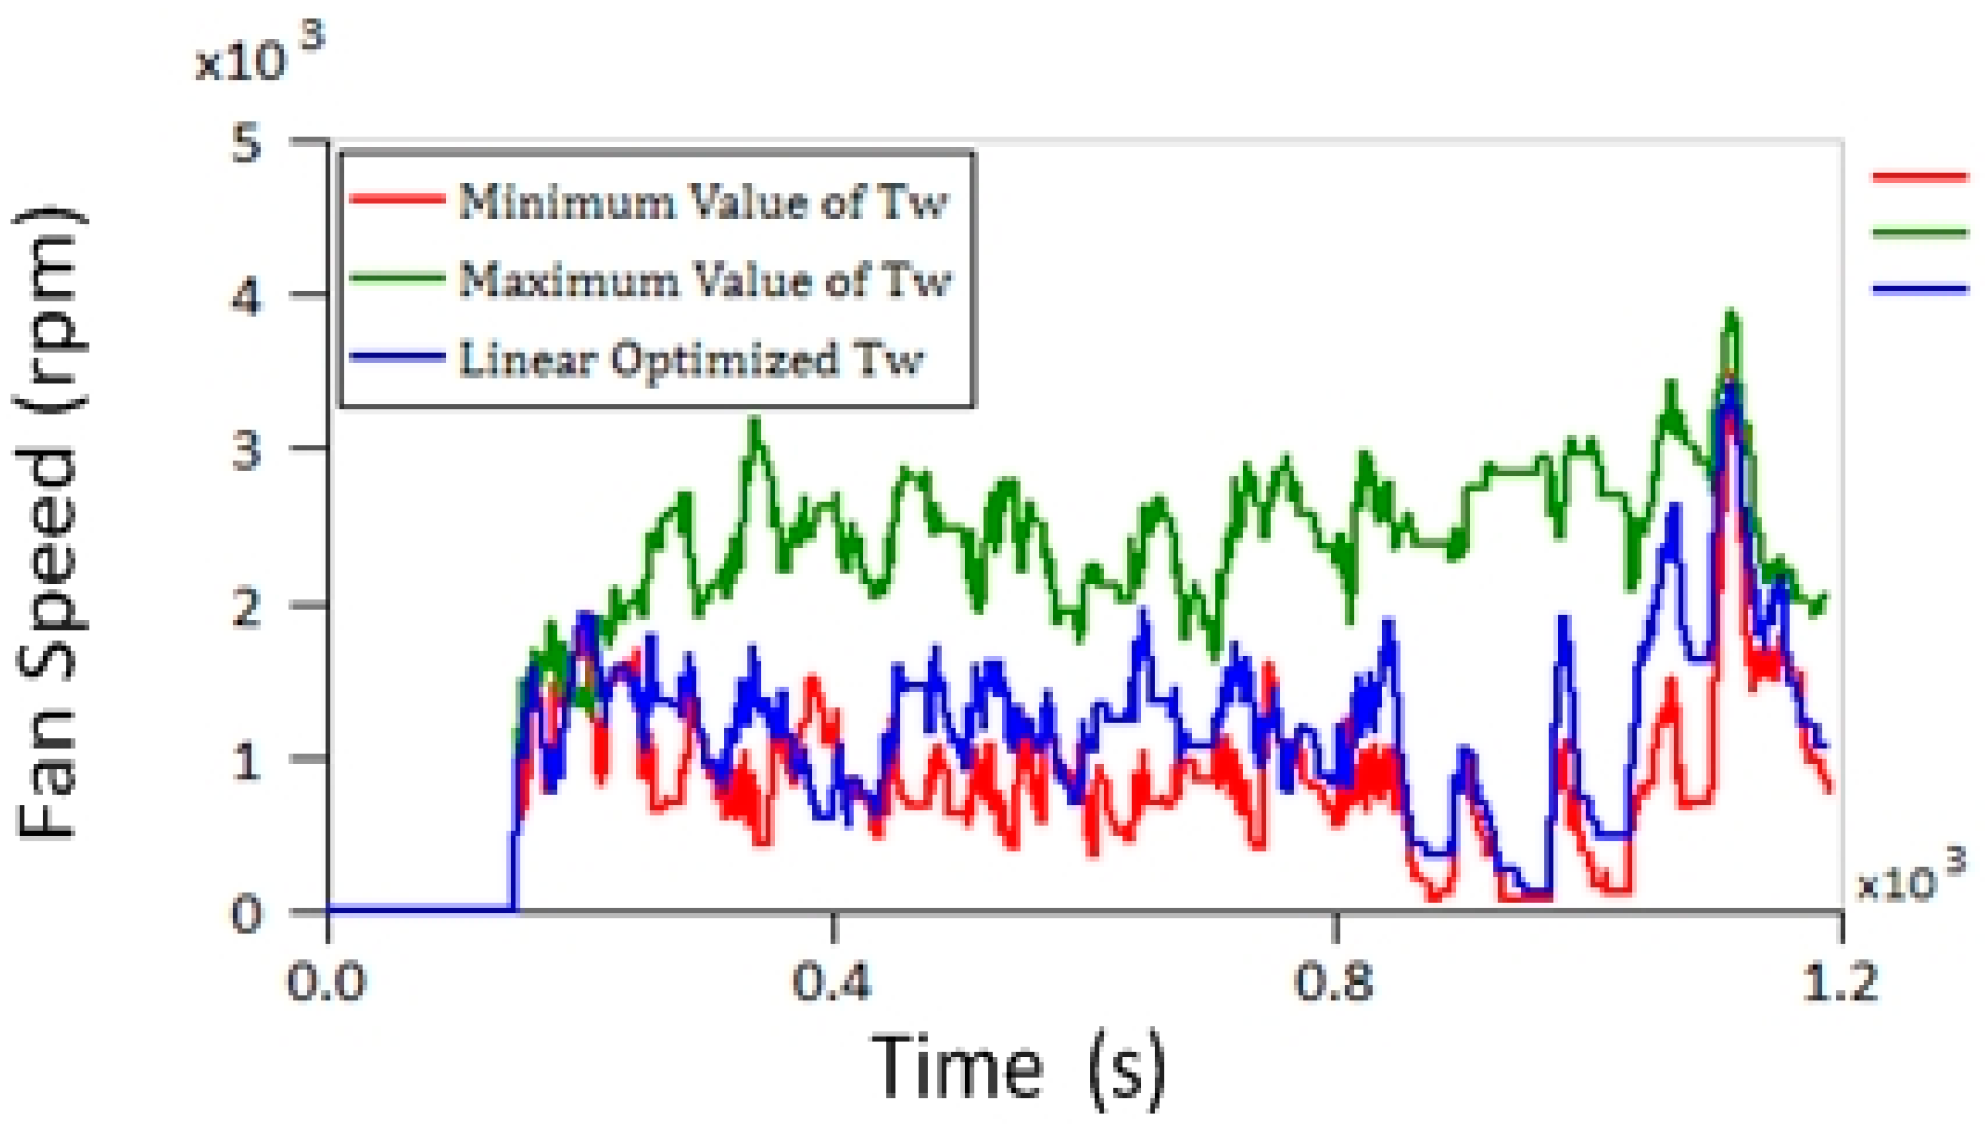
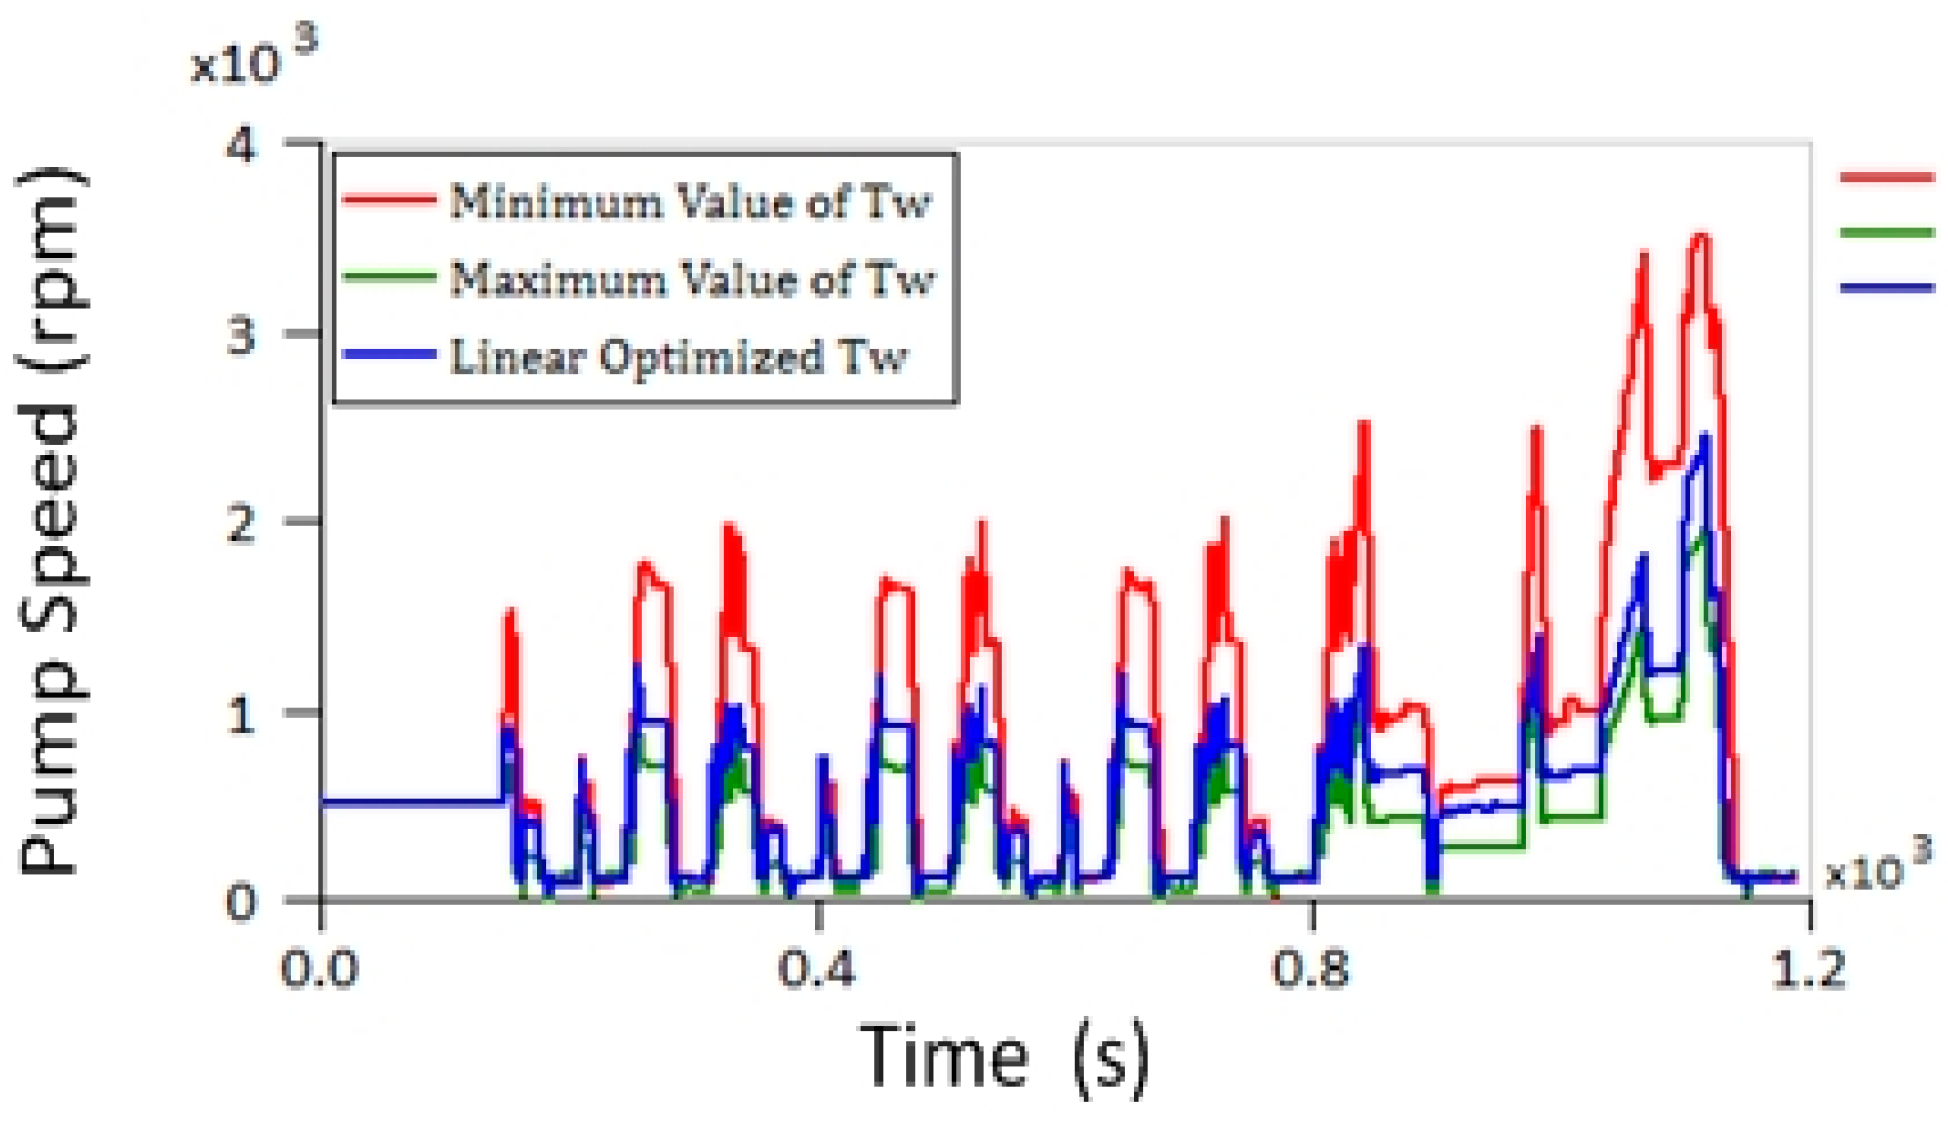
5.2. NMPC Controller Optimization Design

Based on case 1, the influence of the control targets on system energy consumption was examined to propose a variable T w   r e f control strategy to optimize the design of the controller. The convection heat transfer coefficient α w c was increased by adding the coolant flow rate and enhancing the convection heat transfer rate of the cylinder. In the case where T c was basically stable, m c ˙ was a monotone decreasing function of T w . The value of T w   r e f affected the coordination the heat transfer intensity on liquid and air sides of the radiator and determined the weight of the fan and pump speeds, thereby affecting the system comprehensive energy consumption.
As shown in Figure 21 and Figure 22, the high T w , r e f control scheme defined the lower pump speed and energy consumption as the output and did not affect the coolant temperature control effect but did sacrifice the economy of the fan. Conversely, a low T w   r e f control scheme exhibited opposite effects. It can thus be concluded that the extreme value of T w   r e f as the control target was bound to sacrifice the thermal transmission economy of a certain heat transfer side in the system. To solve this problem, a variable T w   r e f control strategy was proposed to optimize the system energy consumption. A high T w , r e f was selected as the control target in the heavy load condition of the engine, and the heat transfer efficiency of the air side was strengthened to ensure the efficiency of the liquid side. A low T w , r e f was adopted as the control target to reduce the fan energy consumption in the small load condition. According to the above analysis constructing the mathematical function of T w , r e f and Q g w ˙ , the linear optimization control objective function with the best energy reduction effect was finally selected based on comparisons of various function forms (linear, polynomial, and arctangent function). The linear control optimization had a system energy consumption of 126,119 (J), and the system economy was improved by 28% as compared to the low T w   r e f control scheme in Figure 23. The results indicated that the system energy efficiency can be improved by reasonable coordination of air side and liquid side thermal transfer capacity based on engine thermal load.
T w r e f = Q g w ˙ Q g w   m i n ˙ Q g w m a x ˙ Q g w m i n ˙ · ( T w m a x T w m i n ) + T w m i n

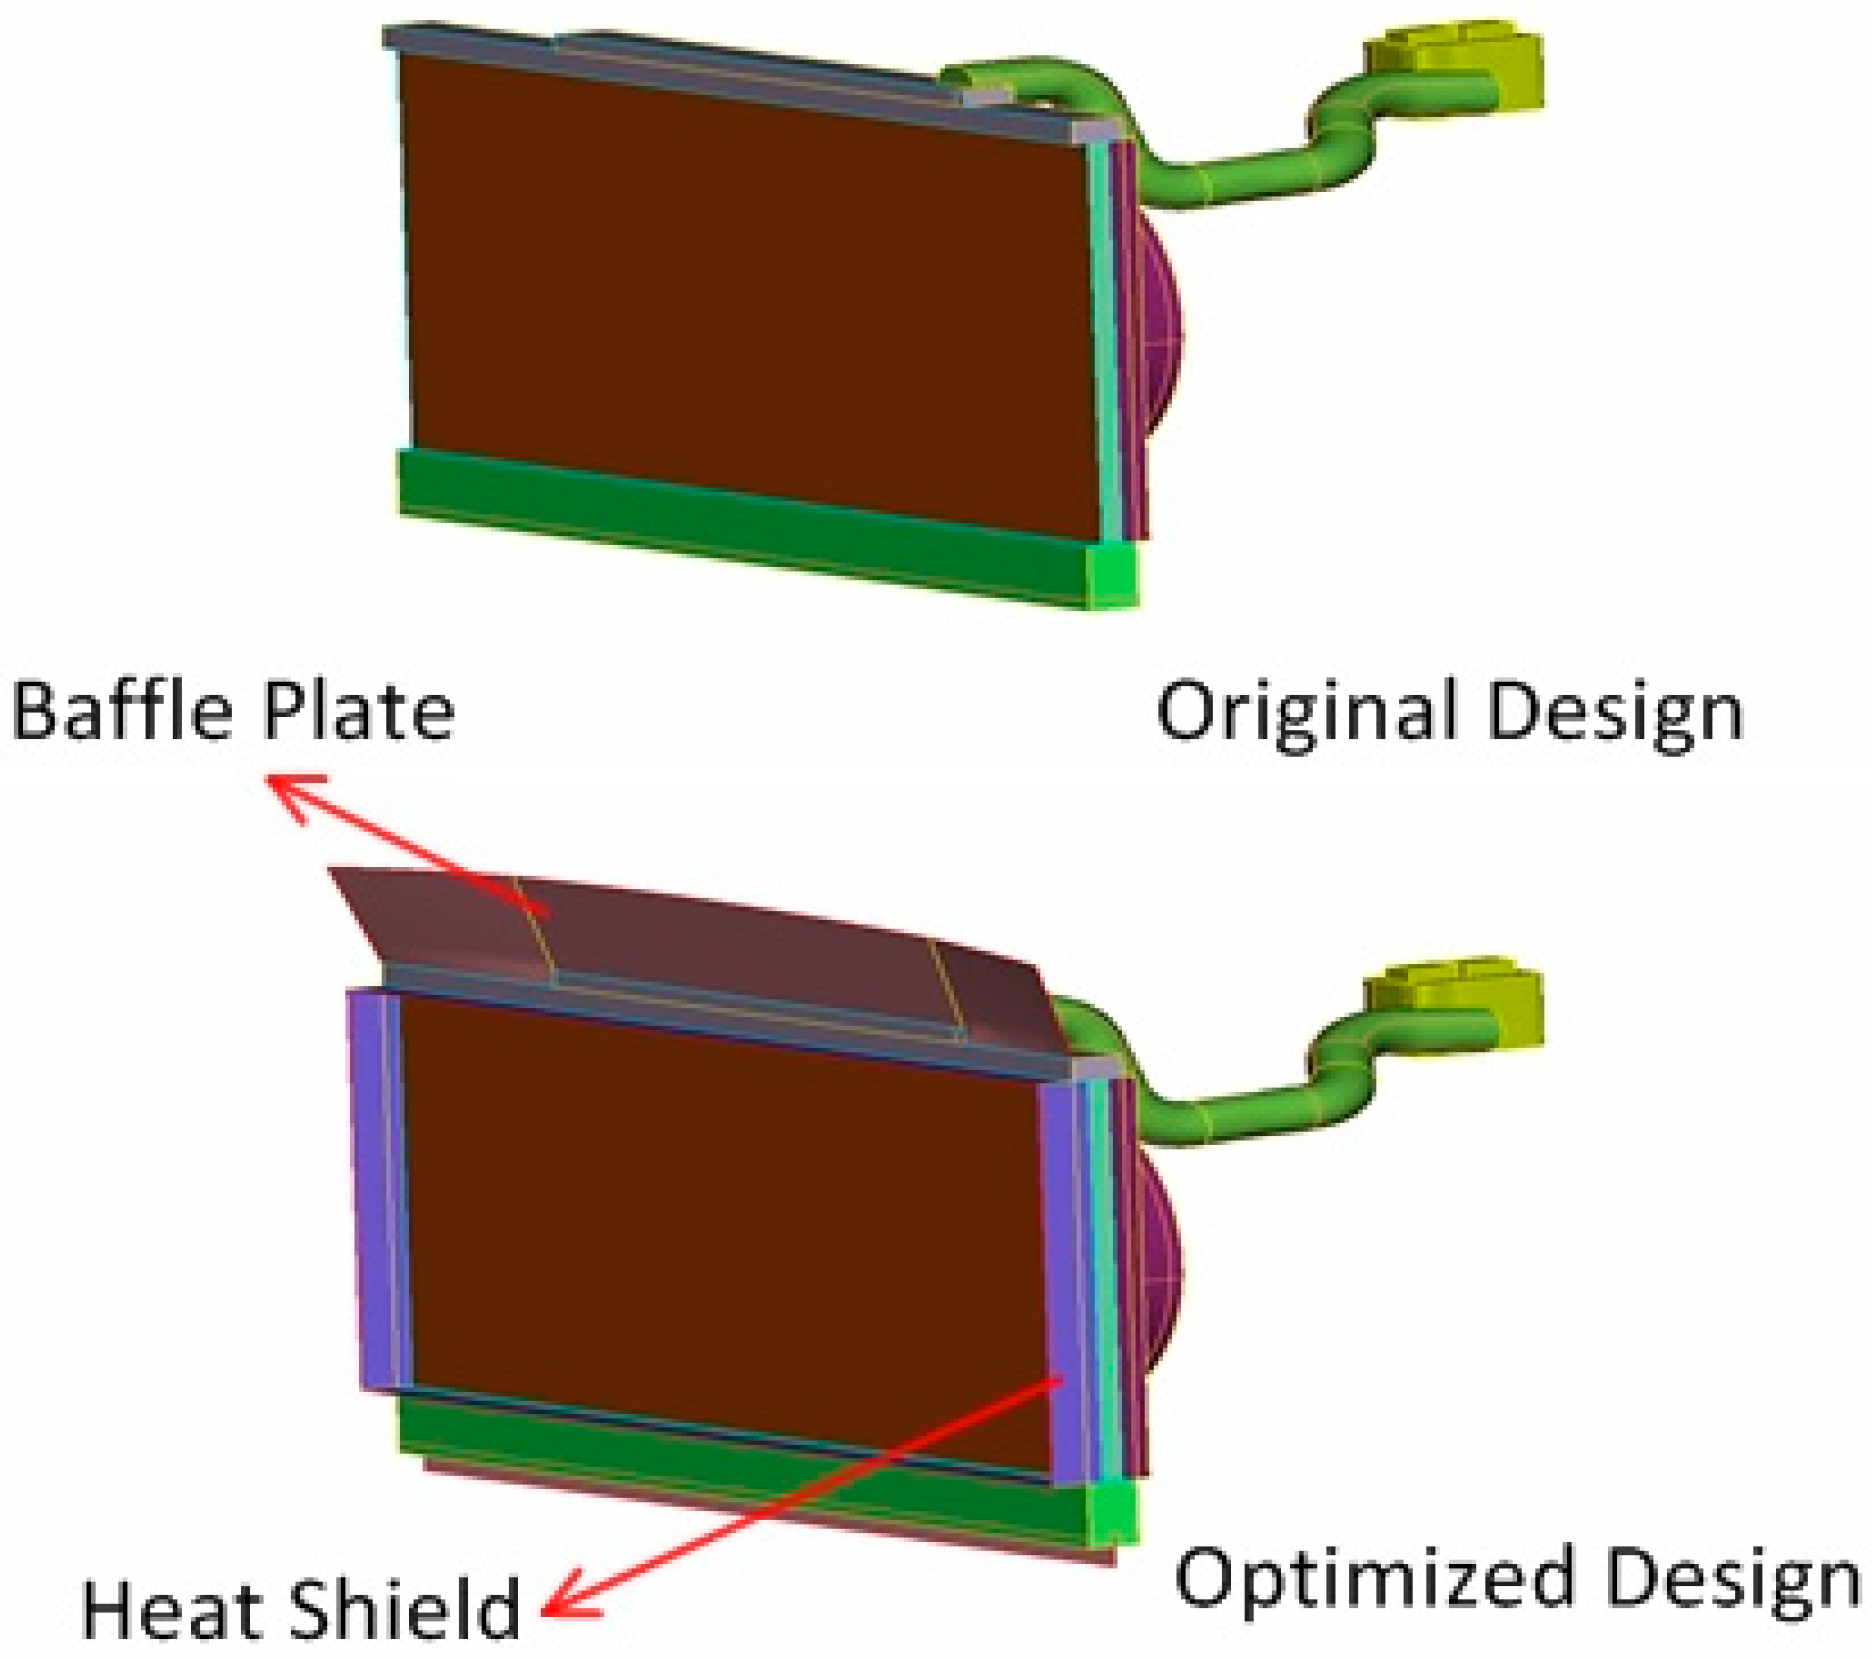
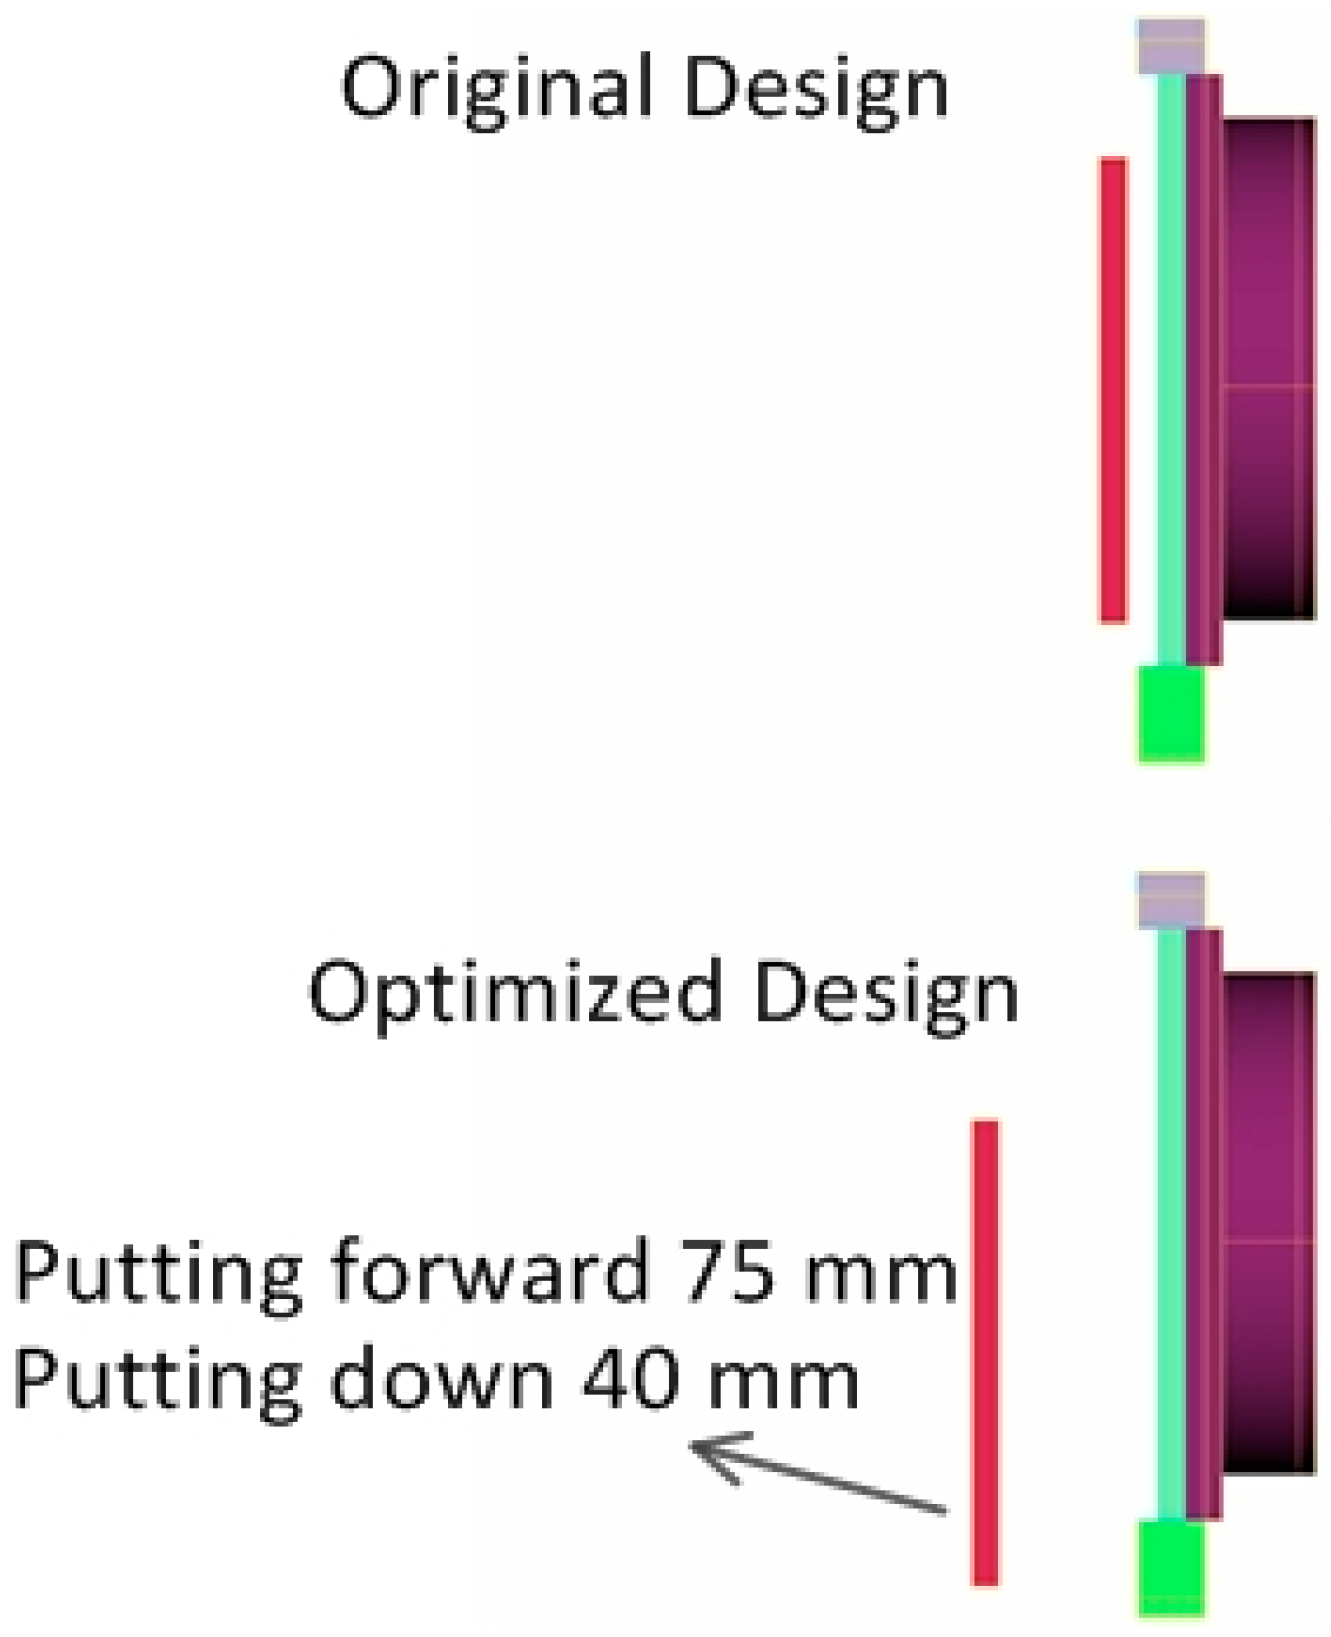
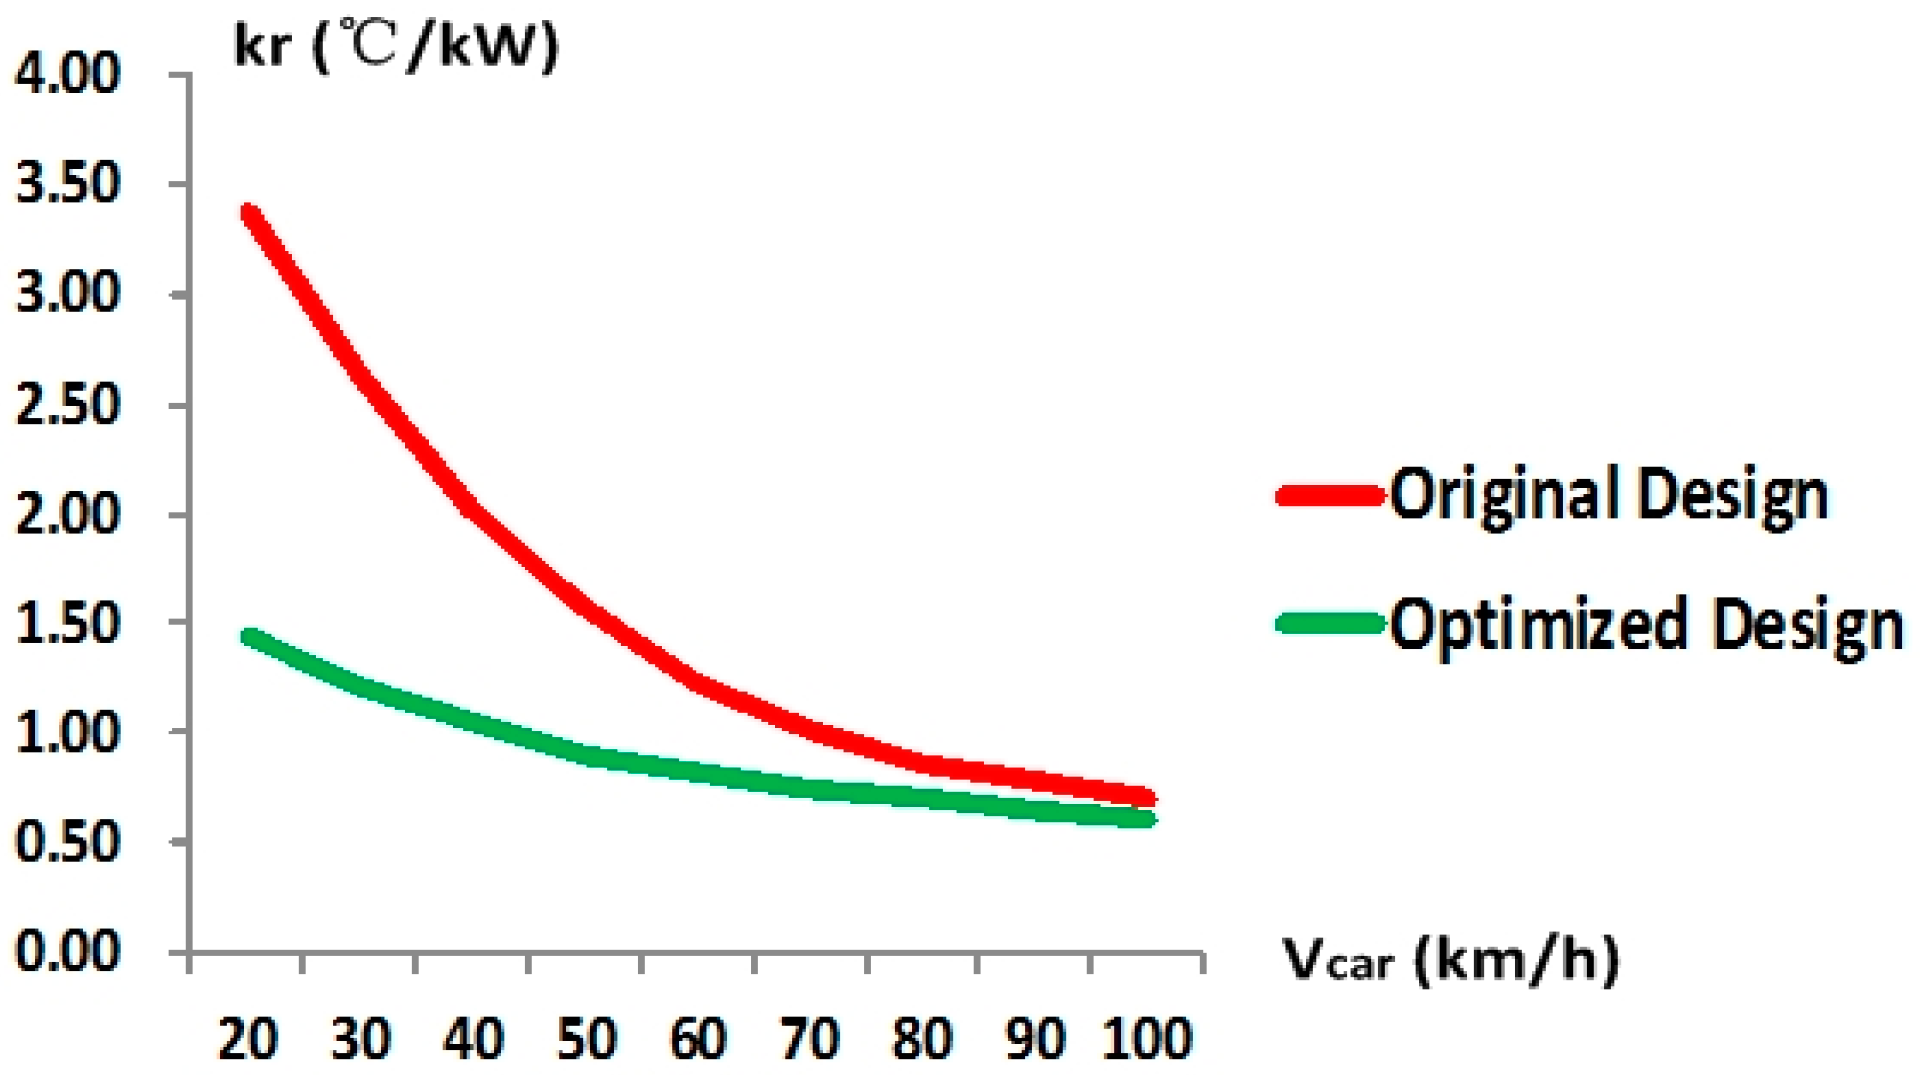
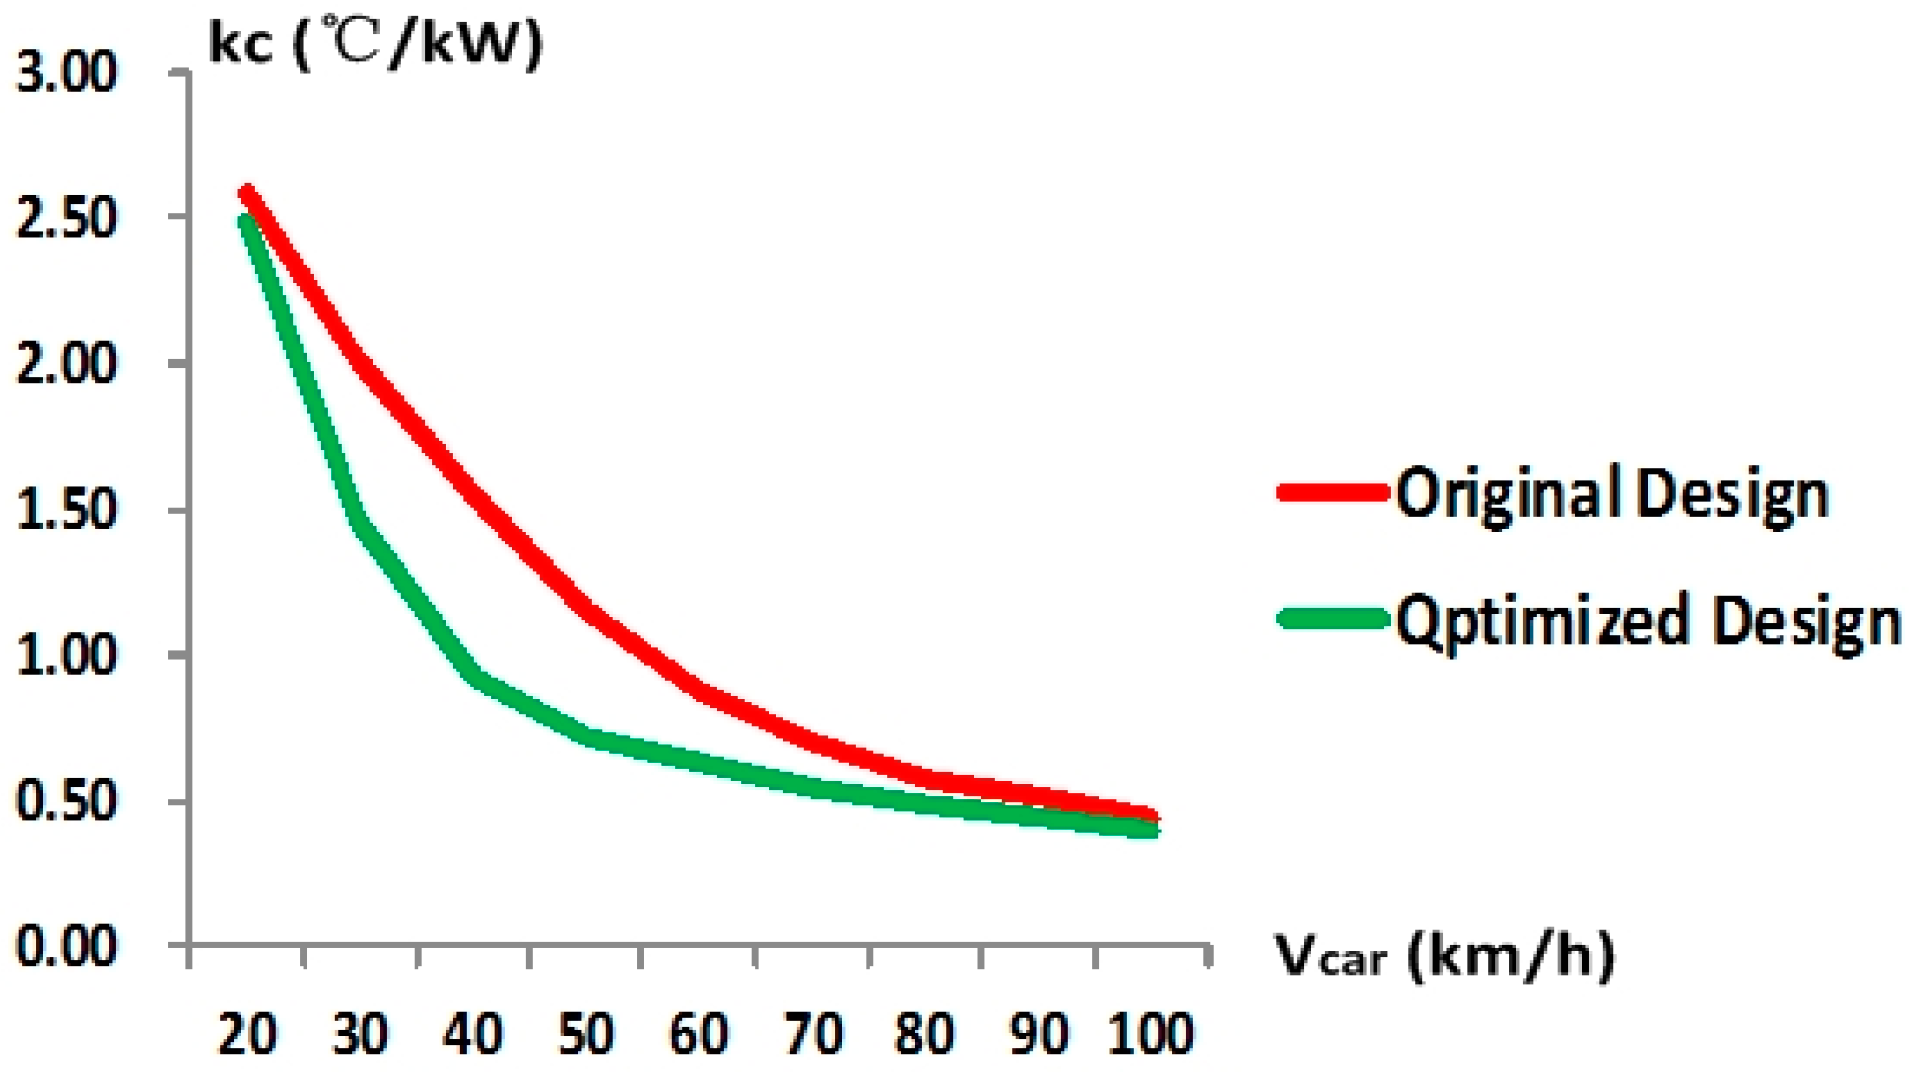
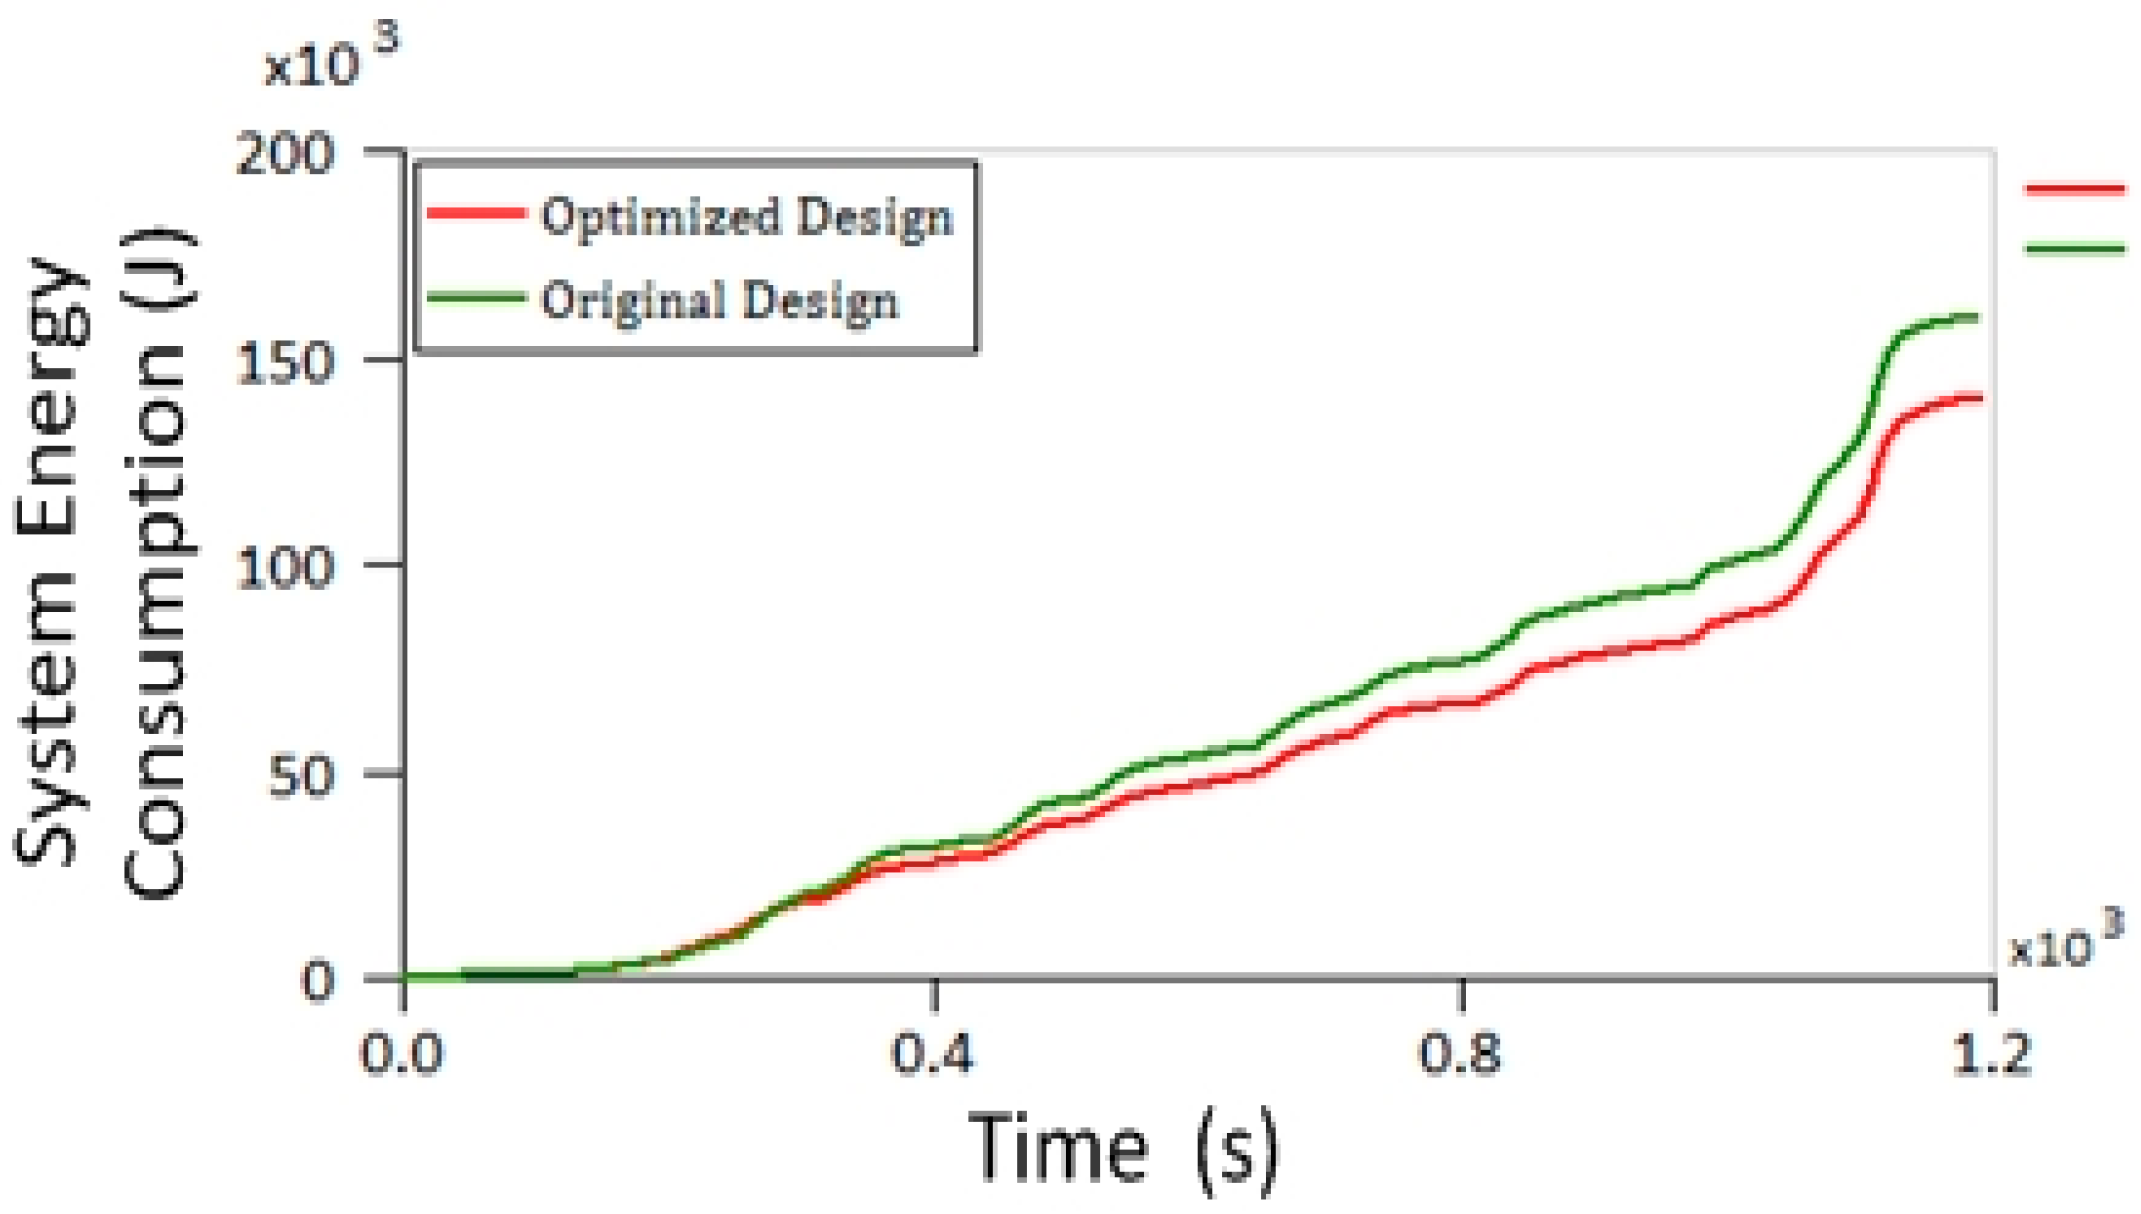
5.3. Underhood Thermal Transmission Structure Optimization

This case focuses on the influence of the coupling heat transfer in underhood on the control effect of the NMPC thermal management system. Figure 24 presents the radiator intake temperature rise caused by condenser calefaction and high-temperature air reflow, thereby representing the system thermal transmission boundary conditions under actual conditions. However, in ideal conditions, the ambient temperature was regarded as the radiator inlet conditions and the design structure of engine compartment exhibited applicability to eliminate the thermal transmission interaction between the heat exchangers.
Figure 25 presents a comparison of the actual and ideal conditions and reflects on the effects of the coupling thermal transmission on the system energy consumption. The condenser calefaction and high temperature air reflow equivalently increased the radiator intake temperature to 7.78 °C, thereby increasing the energy consumption of the system by 20.8%. Qian conducted in-depth research on the enhancement of aerodynamic heat transfer in the underhood [47]. Observations on the air velocity vector, pressure distribution, and temperature cloud map aided in explanations for the mechanism of coupling thermal transmission as well as in proposing a targeted structural improvement design. The present study applied these research results for reference given that the heat transfer enhancement effects in the underhood reflected upon the system performance index based on the optimization design structural characteristics that were represented by the coupling factors.
Air passed through the condenser reduces pressure due to the flow resistance of the core, thereby generating local high temperature due to the fan suction and high pressure behind the radiator. However, some high-temperature air blocked by the engine returned to the low-pressure area behind the condenser, and was termed high-temperature air reflow. According to the mechanism of hot air reflux, the present study proposes an improvement scheme for the heat shield and baffle plate (as shown in Figure 26). The heat shield around the core effectively reduced the backflow air returning into the radiator. The baffle plate may increase the proportion of fresh air to decrease the inlet temperature, but may also improve the convection heat transfer of the radiator, all of which can enhance the heat transfer effects.
The degree of condenser heating action depends on the equivalent radiator windward shielding area, of which the placement position and core size dimension are the key factors. It is difficult to apply large changes to the core size of the condenser due to the limits of refrigeration requirements for the air conditioning system. Therefore, the placement position should be adjusted to reduce the equivalent flow shielding area of the condenser between the inlet grille and radiator to weaken the harmful thermal transmission interaction (as shown in Figure 27).
Figure 28 and Figure 29 present comparisons of the coupling factor curves to optimize the radiator and condenser structures, respectively. The results indicated that the optimized design of the baffle plate and heat shield effectively weakened the high temperature air reflow within the condition of vehicle speed 20–70 km/h. In addition, the arrangement of the condenser’s forward motion mainly reduced the thermal transmission interaction for a vehicle speed range of 35 to 60 km/h. The simulation results in Figure 30 indicate a structure optimized system energy consumption of 140,313 (J), of which the system energy consumption was reduced by 11.8% as compared to the original design. Therefore, the influence of coupling underhood thermal transmission should be considered in the thermal management control system design process and it is important for system energy consumption reduction to restrain the harmful thermal transmission interactions between heat exchangers.

6. Conclusions

In this article, an integrated vehicle thermal management numerical calculation method based on model predictive control is proposed to solve the problems of engine cooling performance evaluation, underhood thermal transfer structure optimization and thermal management system control scheme designing guidance. The main conclusions are as follows:
(1)
As compared to the traditional engine cooling mode (PID scheme), the NMPC thermal management scheme clearly exhibits better temperature control effects and lower system energy consumption.
(2)
The system energy efficiency could be improved by reasonable coordination of air side and liquid side thermal transfer capacity based on engine thermal load.
(3)
The influence of coupling thermal transmission should be considered in system control process and it is of great significance for energy consumption reduction to enhance the aerodynamic thermal transmission in underhood.
To sum up, the integrated vehicle thermal management numerical calculation method proposed in this article is a comprehensive simulation system that embodies system mathematical model establishment, cooling performance evaluation, as well as the control strategy and optimized structural design. As an advanced numerical simulation solution, the presented scheme is beneficial for technology development and engineering applications for vehicle thermal management. Moreover, this method has a wide range of applicability and can be applied to the thermal management of pure electric vehicles (PEVs) and plug-in hybrid electric vehicles (PHEVs), thereby providing a more powerful control analysis approach for the thermal management of new energy vehicles.

Author Contributions

Conceptualization, Q.G.; methodology, P.L., Liang lv; formal analysis, P.L.; resources, X.X.; writing-original draft preparation, P.L.; writing-review and editing, Y.W.; funding acquisition, Q.G.

Funding

This research was funded by the National Science Foundation of China (no. U1864213); “Double Ten” Science & Technology Innovation Project of Jilin Province of China (17SS022); Foundation of Jilin Development and Reform Committee, grant/award Number: 2016C022; Science Foundation for Excellent Youth Scholars of Jilin Province of China, grant/award Number: 20180520066JH.

Conflicts of Interest

The authors declare no conflict of interest.

Nomenclature

Abbreviation
ECUElectronic Control Unit
IVTMIntegrated Vehicle Thermal Management
NEDCNew European Driving Cycle
NMPCNonlinear Model Predictive Control
Symbols
α a Radiator heat transfer coefficient on the air side ( W / ( m 2 · K ) )
α c Radiator heat transfer coefficient on the coolant side ( W / ( m 2 · K ) )
α e b Coolant to engine block heat transfer coefficient ( W / ( m 2 · K ) )
α w c Wall to coolant heat transfer coefficient ( W / ( m 2 · K ) )
A a Radiator heat transfer area on the air side ( m 2 )
A c Radiator heat transfer area on the coolant side ( m 2 )
A e b Heat transfer area between coolant and engine block ( m 2 )
A l Heat transfer area between liner and coolant ( m 2 )
A t Tube wall heat transfer area ( m 2 )
A t r Thermostat flow area ( m 2 )
c c Coolant specific heat capacity ( J / ( kg · K ) )
c e b Engine block specific heat capacity ( J / ( kg · K ) )
c l Liner specific heat capacity ( J / ( kg · K ) )
C t r Thermostat flow coefficient ( )
ε Radiator energy efficiency ( )
ε e Engine revs per cycle ( rad / s )
G a Air equivalent mass flow ( kg / ( s · m 2 ) )
G c Coolant equivalent mass flow ( kg / ( s · m 2 ) )
h e m i s s i o n Heat emission coefficient ( )
H p u m p Pump hydraulic head ( m )
l t Thermostat relative lift (%)
m b y ˙ Coolant mass flow through by-pass circulation ( kg / s )
m c ˙ Coolant mass flow through the engine ( kg / s )
m c , e Mass of coolant in the engine ( kg )
m c , r Mass of coolant in the radiator ( kg )
m e b Engine block mass ( kg )
m l Liner mass ( kg )
m r ˙ Coolant mass flow through the radiator ( kg / s )
N f a n Fan speed ( rpm )
N p u m p Pump speed ( rpm )
P e d r o p Engine flow resistance ( P a )
P f a n Fan energy consumption ( W )
P f a n e Effective fan power ( W )
Δ P f a n Fan pressure increase ( P a )
P p u m p Pump energy consumption ( W )
P p u m p e Effective pump power ( W )
P r d r o p Radiator flow resistance ( P a )
Δ P t p a s s Thermostat throttle resistance in by-pass circulation ( P a )
Δ P t r a d i a t o r Thermostat throttle resistance in radiator circulation ( P a )
P t o t a l Total system energy consumption (W)
Q a ˙ Engine block to air heat transfer rate ( W )
Q c o m ˙ Gas combustion exothermic rate ( W )
Q e b ˙ Coolant to engine block heat transfer rate ( W )
Q f ˙ Heat transfer rate due to friction ( W )
Q g w ˙ Gas to cylinder heat transfer rate ( W )
Q r ˙ Coolant to air heat transfer rate in the radiator ( W )
Q w c ˙ Liner to coolant heat transfer rate ( W )
R 2 Determination coefficient ( )
T a i r i n Radiator intake temperature (°C))
T c , e i n Coolant temperature at engine inlet ( ° C ) )
T c , e o u t Coolant temperature at engine outlet (°C)
T c r e f Coolant reference target temperature (°C))
T c , r o u t Coolant temperature at radiator outlet
T e b Engine block temperature (°C))
T e n v Environment temperature (°C))
T w Mean cylinder temperature ( ° C ) )
T w r e f Cylinder reference target temperature (°C))
V Engine displacement ( L )
V c a r Vehicle speed ( km / h )
V f a n Fan volume flow ( m 3 / s )
V p u m p Pump displacement ( m 3 )
ω e Engine angular speed ( rad / s )
ρ c Coolant density ( kg / m 3 )
λ t Tube wall heat conductivity coefficient ( W / ( m · K ) )
δ t Tube wall thickness ( m )

References

  1. Melzer, F.; Hesse, U.; Rocklage, G.; Schmitt, M. Thermomanagement; SAE International: Detroit, MI, USA, 1999. [Google Scholar]
  2. Wang, Y.; Gao, Q.; Zhang, T.; Wang, G.; Jiang, Z.; Li, Y. Advances in integrated vehicle thermal management and numerical simulation. Energies 2017, 10, 1636. [Google Scholar] [CrossRef]
  3. Salah, M.H.; Mitchell, T.H.; Wagner, J.R.; Dawson, D.M. Nonlinear-control strategy for advanced vehicle thermal-management systems. IEEE Trans. Veh. Technol. 2008, 57, 127–137. [Google Scholar] [CrossRef]
  4. Traussnig, A.; Petutschnig, H.; Ennemoser, A.; Stolz, M.; Tizianel, M. Vehicle thermal Management Simulation Method Integrated in the Development Process from Scratch to Prototype; SAE International: Detroit, MI, USA, 2014. [Google Scholar]
  5. Song, X.; Myers, J.; Sarnia, S. Integrated low temperature cooling system development in turbo charged vehicle application. SAE Int. J. Passeng. Cars Mech. Syst. 2014, 7, 163–173. [Google Scholar] [CrossRef]
  6. Wagner, J.R.; Ghone, M.C.; Dawson, D.W.; Marotta, E.E. Coolant Flow Control Strategies for Automotive Thermal Management Systems; SAE International: Detroit, MI, USA, 2002. [Google Scholar]
  7. Butt, S.S.; Prabe, R.; Aschemann, H. Robust nonlinear control of an innovative engine cooling system. IFAC PapersOnLine 2015, 48, 235–240. [Google Scholar] [CrossRef]
  8. Wang, T.; Wagner, J. Advanced automotive thermal management—Nonlinear radiator fan matrix control. Control Eng. Pract. 2015, 41, 113–123. [Google Scholar] [CrossRef]
  9. Khaled, M.; Harambat, F.; Hage, H.E.; Peerhossaini, H. Spatial optimization of an underhood cooling module—Towards an innovative control approach. Appl. Energy 2011, 88, 3841–3849. [Google Scholar] [CrossRef]
  10. Khaled, M.; Mangi, F.; Hage, H.E.; Harambat, F.; Peerhossaini, H. Fan air flow analysis and heat transfer enhancement of vehicle underhood cooling system—Towards a new control approach for fuel consumption reduction. Appl. Energy 2012, 91, 439–450. [Google Scholar] [CrossRef]
  11. Zhou, B.; Lan, X.D.; Xu, X.H.; Liang, X.G. Numerical model and control strategies for the advanced thermal management system of diesel engine. Appl. Therm. Eng. 2015, 82, 368–379. [Google Scholar] [CrossRef]
  12. Huang, M.; Nakada, H.; Butts, K.; Kolmanovsky, I. Nonlinear model predictive control of a diesel engine air path: A comparison of constraint handling and computational strategies. IFAC PapersOnLine 2015, 48, 372–379. [Google Scholar] [CrossRef]
  13. Sowman, J.; Laila, D.S.; Cruden, A.J.; Fussey, P. Nonlinear model predictive control for cold start selective catalytic reduction. IFAC PapersOnLine 2015, 48, 471–476. [Google Scholar] [CrossRef]
  14. Vermillion, C.; Sun, J.; Butts, K. In Model Predictive Control Allocation—Design and Experimental Results on a Thermal Management System. In Proceedings of the Conference on American Control Conference, St. Louis, MO, USA, 10–12 June 2009; pp. 1365–1370. [Google Scholar]
  15. Vermillion, C.; Sun, J.; Butts, K. Predictive Control allocation for a thermal management system based on an inner loop reference model—Design, analysis, and experimental results. IEEE Trans. Control Syst. Technol. 2011, 19, 772–781. [Google Scholar] [CrossRef]
  16. Vermillion, C.; Sun, J.; Butts, K. Modeling, control design, and experimental validation of an overactuated thermal management system for engine dynamometer applications. IEEE Trans. Control Syst. Technol. 2009, 17, 540–551. [Google Scholar] [CrossRef]
  17. Khodabakhshian, M.; Feng, L.; Börjesson, S.; Lindgärde, O.; Wikander, J.; Khodabakhshian, M.; Feng, L.; Börjesson, S.; Lindgärde, O.; Wikander, J. Reducing auxiliary energy consumption of heavy trucks by onboard prediction and real-time optimization. Appl. Energy 2017, 188, 652–671. [Google Scholar] [CrossRef]
  18. Sanz, J.L.; Eguilaz, M.M.; Alvarez-Florez, J.; Ruiz-Mansilla, R.; Lux, G.; Kalmus, J.; Graber, M.; Ocampo-Martinez, C. Nonlinear model predictive control for thermal management in plug-in hybrid electric vehicles. IEEE Trans. Veh. Technol. 2016, 66, 3632–3644. [Google Scholar]
  19. Minovski, B.B.; Lofdahl, L. Study of Software Integration for Transient Simulation of Future Cooling System for heavy Truck Application; SAE International: Detroit, MI, USA, 2014. [Google Scholar]
  20. Minovski, B. Study of Software System Integration for Transient Simulation of Future Cooling System for Heavy Truck Applications. Bachelor’s Thesis, Chalmers University of Technology, Gothengurg, Sweden, 2013. [Google Scholar]
  21. Eller, J.; Reister, H.; Binner, T.; Widdecke, N.; Wiedemann, J. A New Approach to Predicting Component Temperature Collectives for Vehicle Thermal Management; SAE International: Detroit, MI, USA, 2017. [Google Scholar]
  22. Costa, E.A. CFD Approach on Underhood Thermal Management of Passenger Cars and Trucks; SAE International: São Paulo, Brasil, 2003. [Google Scholar]
  23. Juan, T. Investigation and Assessment of Factors Affecting the Underhood Cooling Air Flow Using CFD; SAE International: Rosemont, IL, USA, 2008. [Google Scholar]
  24. Zhang, Q.; Xu, L.; Li, J.; Ouyang, M. Performance prediction of proton exchange membrane fuel cell engine thermal management system using 1D and 3D integrating numerical simulation. Int. J. Hydrogen Energy 2018, 43, 1736–1748. [Google Scholar] [CrossRef]
  25. Moffat, J. Coupling of 1-D and 3-D CFD Models to Predict Transient Hydraulics in an Engine Cooling Circuit; SAE International: Detroit, MI, USA, 2002. [Google Scholar]
  26. Bayraktar, I. Computational simulation methods for vehicle thermal management. Appl. Therm. Eng. 2012, 36, 325–329. [Google Scholar] [CrossRef]
  27. Mao, S.; Feng, Z.; Michaelides, E.E. Off-highway heavy-duty truck under-hood thermal analysis. Appl. Therm. Eng. 2010, 30, 1726–1733. [Google Scholar] [CrossRef]
  28. Wang, G.; Gao, Q.; Zhang, T.; Wang, Y. A simulation approach of under-hood thermal management. Adv. Eng. Softw. 2016, 100, 43–52. [Google Scholar] [CrossRef]
  29. Lu, P.; Gao, Q.; Wang, Y. The simulation methods based on 1D/3D collaborative computing for the vehicle integrated thermal management. Appl. Therm. Eng. 2016, 104, 42–53. [Google Scholar] [CrossRef]
  30. Karnik, A.Y.; Fuxman, A.; Bonkoski, P.; Jankovic, M.; Pekar, J. Vehicle powertrain thermal management system using model predictive control. SAE Int. J. Mater. Manuf. 2016, 9, 525–533. [Google Scholar] [CrossRef]
  31. Lee, H.S.; Cho, C.W.; Seo, J.H.; Lee, M.Y. Cooling performance characteristics of the stack thermal management system for fuel cell electric vehicles under actual driving conditions. Energies 2016, 9, 320. [Google Scholar] [CrossRef]
  32. Di Battista, D.; Cipollone, R. Improving engine oil warm up through waste heat recovery. Energies 2018, 11, 10. [Google Scholar] [CrossRef]
  33. Caresana, F.; Bilancia, M.; Bartolini, C.M. Numerical method for assessing the potential of smart engine thermal management: Application to a medium-upper segment passenger car. Appl. Therm. Eng. 2011, 31, 3559–3568. [Google Scholar] [CrossRef] [Green Version]
  34. Zhang, J.; Xu, Z.; Lin, J.; Lin, Z.; Wang, J.; Xu, T. Thermal characteristics investigation of the internal combustion engine cooling-combustion system using thermal boundary dynamic coupling method and experimental verification. Energies 2018, 11, 2127. [Google Scholar] [CrossRef]
  35. Pang, L.; Li, S.; Liu, M.; Rong, A.; Li, A.; Meng, F. Influence of the design parameters of a fuel thermal management system on its thermal endurance. Energies 2018, 11, 1677. [Google Scholar] [CrossRef]
  36. Chastain, J.H.; Wagner, J.R. Advanced Thermal Management for Internal Combustion Engines—Valve Design, Component Testing and Block Redesign; SAE International: Detroit, MI, USA, 2006. [Google Scholar]
  37. Guo, L. Pumps and Fans; Water Resources and Electric Power Press Publishing: Chongqing, China, 1986. [Google Scholar]
  38. Saha, R.; Madurai Kumar, M.; Hwang, L.K.; Wang, X.; Zhang, F.; Zhang, X.; Yagui, L.; Sun, W.; Wang, Y.; Cheng, W.; et al. Analysis and Design Validation of Medium Duty Truck Cooling System; SAE International: Detroit, MI, USA, 2016. [Google Scholar]
  39. Minovski, B.B.; Lofdahl, L.; Gullberg, P. A 1D Method for Transient Simulations of Cooling Systems with Non-Uniform Temperature and Flow Boundaries Extracted from a 3D CFD Solution; SAE International: Detroit, MI, USA, 2015. [Google Scholar]
  40. Chang, Y.J.; Hsu, K.C.; Lin, Y.T.; Wang, C.C. A generalized friction correlation for louver fin geometry. Int. J. Heat Mass Transf. 2000, 43, 2237–2243. [Google Scholar] [CrossRef]
  41. Khaled, M.; Ramadan, M.; El-Hage, H.; Elmarakbi, A.; Harambat, F.; Peerhossaini, H. Review of underhood aerothermal management: Towards vehicle simplified models. Appl. Therm. Eng. 2014, 73, 842–858. [Google Scholar] [CrossRef]
  42. Kim, H.J.; Kim, C.J. A numerical analysis for the cooling module related to automobile air-conditioning system. Appl. Therm. Eng. 2008, 28, 1896–1905. [Google Scholar] [CrossRef]
  43. Kumar, V.; Shendge, S.A.; Baskar, S. Underhood Thermal Simulation of a Small Passenger Vehicle with Rear Engine Compartment to Evaluate and Enhance Radiator Performance; SAE International: Detroit, MI, USA, 2010. [Google Scholar]
  44. Lu, Y.H.; Sun, P.; Chen, C. Model Predictive Control for Engine Thermal Management with Electronic Fan. In Proceedings of the International Symposium on Electric Vehicles, Stockholm, Sweden, 26–29 July 2017; pp. 26–29. [Google Scholar]
  45. Setlur, P.; Wagner, J.R.; Dawson, D.M.; Marotta, E. An Advanced Engine Thermal Management System: Nonlinear Control and Test. IEEE/ASME Trans. Mechatron. 2005, 10, 210–220. [Google Scholar] [CrossRef]
  46. Page, R.W.; Hnatczuk, W.J.; Kozierowski, J. Thermal Management for the 21st Century—Improved Thermal Control & Fuel Economy in an Army Medium Tactical Vehicle; SAE International: Toronto, ON, Canada, 2005. [Google Scholar]
  47. Yan, Q. Analysis of Under-Hood Aerodynamic Cooling Process Coupling Air Conditioning System. Bachelor’s Thesis, Jilin University, Changchun, China, 2012. [Google Scholar]
Figure 1. Schematic diagram of the integrated vehicle thermal management control system.
Energies 12 00259 g001
Figure 2. Integrated thermal management system optimization control technology route.
Energies 12 00259 g002
Figure 3. Engine internal thermal transmission process.
Energies 12 00259 g003
Figure 4. External cooling circulation.
Energies 12 00259 g004
Figure 5. Thermostat valve lift characteristic curve.
Energies 12 00259 g005
Figure 6. Radiator experimental data fitting.
Energies 12 00259 g006
Figure 7. Engine speed, fuel consumption rate, and brake mean effective pressure.
Energies 12 00259 g007
Figure 8. Engine thermal load under the test conditions.
Energies 12 00259 g008
Figure 9. Comparison of the coolant temperature.
Energies 12 00259 g009
Figure 10. Comparison of the thermostat lift.
Energies 12 00259 g010
Figure 11. Underhood geometry.
Energies 12 00259 g011
Figure 12. Radiator and cooling fan geometry.
Energies 12 00259 g012
Figure 13. Coupling thermal transmission equation.
Energies 12 00259 g013
Figure 14. Coupling factor curves of the radiator.
Energies 12 00259 g014
Figure 15. Coupling factor curves of the condenser.
Energies 12 00259 g015
Figure 16. Schematic diagram of the NMPC control process for the engine cooling system.
Energies 12 00259 g016
Figure 17. Comparison of the coolant temperature.
Energies 12 00259 g017
Figure 18. Comparison of the fan speed.
Energies 12 00259 g018
Figure 19. Comparison of pump speed.
Energies 12 00259 g019
Figure 20. Comparison of the system energy consumption.
Energies 12 00259 g020
Figure 21. Comparison of the fan speed.
Energies 12 00259 g021
Figure 22. Comparison of the pump speed.
Energies 12 00259 g022
Figure 23. Comparison of the system energy consumption for optimized control strategy.
Energies 12 00259 g023
Figure 24. Radiator intake temperature rise caused by the coupling thermal transmission.
Energies 12 00259 g024
Figure 25. Effects of the coupling thermal transmission on the system energy consumption.
Energies 12 00259 g025
Figure 26. Radiator optimization scheme.
Energies 12 00259 g026
Figure 27. Condenser optimization scheme.
Energies 12 00259 g027
Figure 28. Radiator coupling factor optimization.
Energies 12 00259 g028
Figure 29. Condenser coupling factor optimization.
Energies 12 00259 g029
Figure 30. System energy consumption optimization.
Energies 12 00259 g030

