Evaluating the Potential of Hosting Capacity Enhancement Using Integrated Grid Planning modeling Methods


1
School of Engineering, The University of Edinburgh, Edinburgh EH9 3DW, UK
2
The Alan Turing Institute for Data Science, London NW1 2DB, UK
*
Author to whom correspondence should be addressed.
Energies 2019, 12(19), 3610; https://doi.org/10.3390/en12193610
Submission received: 29 August 2019
/
Revised: 12 September 2019
/
Accepted: 18 September 2019
/
Published: 21 September 2019
(This article belongs to the Special Issue Emerging Challenges in Hosting Capacity Enhancement due to High Penetration of Renewable Energy Resources)
Abstract
:Connection of a significant amount of distributed generation, such as solar photovoltaic (PV) capacity, may lead to problems in distribution networks due to violations of distribution network hosting capacity (HC) limits. HC enhancement techniques, such as energy storage, could increase the allowable PV penetration level in the distribution network, reducing the need for transmission and large-scale generation expansion. However, current approaches for transmission and generation expansion planning do not account for distribution network HC limits. As a consequence, it is hard to quantify the impact and benefits of HC enhancement in the context of long-term grid expansion planning. This paper presents a novel integrated planning approach, combining a two-stage transmission and generation expansion planning model with a distribution network hosting capacity assessment, which allows for inclusion of detailed distribution network constraints We test this method on a stylized representation of the Malaysian grid. Our results show that distribution constraints have a significant impact on optimal transmission expansion plans and significantly increase overall system costs. HC enhancement in the form of battery storage does not significantly mitigate this but does lead to a cost decrease regardless of distribution network constraints. We also show how our approach can identify the key interactions between transmission and distribution networks in systems with high levels of renewable and storage technologies. In particular, HC enhancement with battery storage can act as a substitute or complement to line investment, depending on the renewable energy penetration, the storage location and the level of coordination in the network.
1. Introduction
Renewable generation capacity is growing significantly as a result of technology advancement and policies that aim to reduce the emissions, including carbon prices and renewable targets. Solar photovoltaic (PV) generation capacity has increased particularly quickly and in many places, it is now among the cheapest forms of electricity generation. Solar PV capacity comes in different forms. Large solar photovoltaic (LPV) plants may be connected to transmission networks, as other types of renewable capacity, including wind, tend to be. However, in most markets, a large fraction of solar PV capacity is connected to distribution networks (distributed solar photovoltaic, DPV), beyond the transmission system operator’s control. This DPV capacity can cause significant problems in distribution networks, including reverse power flows, voltage excursions and frequency issues. Distribution networks, therefore, have a limited hosting capacity (HC) for renewable capacity. Hosting capacity (HC) is the network’s capacity to integrate distributed energy resources (DER) without compromising the overall network performance limits [1,2,3].
This presents a challenge to grid planners, operators and investors in other types of generation capacity, which will only increase as the amount of DPV grows. However, current approaches for high-level transmission and generation expansion planning do not generally account for distribution network constraints [4,5,6,7,8,9]. As a consequence, high-level planning results likely overstate the amount of DPV that can be safely integrated into distribution networks without significant infrastructure expansion or underestimate generation expansion costs [10]. Moreover, we do not fully understand how distribution and transmission-level investments interact.
Energy storage presents a similar challenge. Storage can play a vital role in accommodating variable renewable generation into the electricity system [5,11,12,13,14,15] and therefore act as HC enhancement that enables various applications in demand-side management and flexible loads [16]. But, like solar PV, a large fraction of storage capacity will likely be connected to distribution networks and is therefore invisible to transmission system operators and beyond the scope of high-level expansion planning models.
In light of these issues, a new modeling framework for optimizing system expansion is needed, which must be able to jointly model transmission and distribution networks; in the latter, detailed distribution grid operating constraints should be included to accurately model distribution network issues resulting from DPV and storage installations. Such a modeling framework would need to be able to identify how congestion in distribution and transmission networks interacts and how storage or other HC enhancement techniques at different levels affect infrastructure planning.
There is extensive literature on integrated modeling approaches that jointly consider transmission and distribution systems operations. However, applications of these models to grid expansion planning are limited [17,18,19,20]. Joint modeling of transmission and distribution networks for planning purposes is a significant challenge, as it requires a large geographic scale, a long time horizon and a large amount of detail. Distribution network constraints are nonlinear, so the framework proposed above would be a large-scale nonlinear multi-stage optimization problem, which would be extremely computationally expensive for large networks. Inclusion of different technologies at different levels, including storage, in such a non-linear model, would only increase its complexity.
In this paper, we therefore simply the problem by breaking it down into two components—a two-stage optimization transmission and generation expansion model and a detailed distribution network hosting capacity (HC) assessment. Both of these models are already in use and are not highly computationally expensive. We solve these two models iteratively to heuristically find a fixed point. Although this does not guarantee convergence, we find that convergence is achieved in less than ten iterations in all cases we examine and multi-starts do not produce different fixed points. We apply this model to a stylized representation of the Malaysian grid, which is expected to have to integrate a large amount of DPV capacity over the coming decade.
We find that, first of all, the inclusion of distribution network constraints significantly changes optimal transmission and generation capacities, not just in distribution networks but also at the transmission level. We show that interactions between distribution and transmission networks are important and not always straightforward. In particular, at lower solar penetration levels, distributed small-scale storage substitutes for line investment, while at higher solar penetration levels, small-scale storage instead complements line investment. Distribution network hosting capacity enhancement techniques, using distribution connected storage, can significantly reduce the overall costs of meeting a renewable target and increase distributed solar PV (DPV) penetration in the distribution network. However, the correct mix of distribution-connected and transmission-connected storage is crucial. Finally, this paper demonstrates that combined transmission and distribution network modeling is possible and practical to evaluate the potential whole-system benefits of HC enhancement to achieve renewable objectives.
The rest of the paper is organized as follows. In Section 2, we propose an integrated grid expansion planning approach that accounts for distribution network constraints and we discuss the assumptions and data sources used in the case study. Section 3 presents results and analysis. Section 4 discusses limitations, suggestions for future work and conclusions.
2. Materials and Methods
2.1. Model Overview
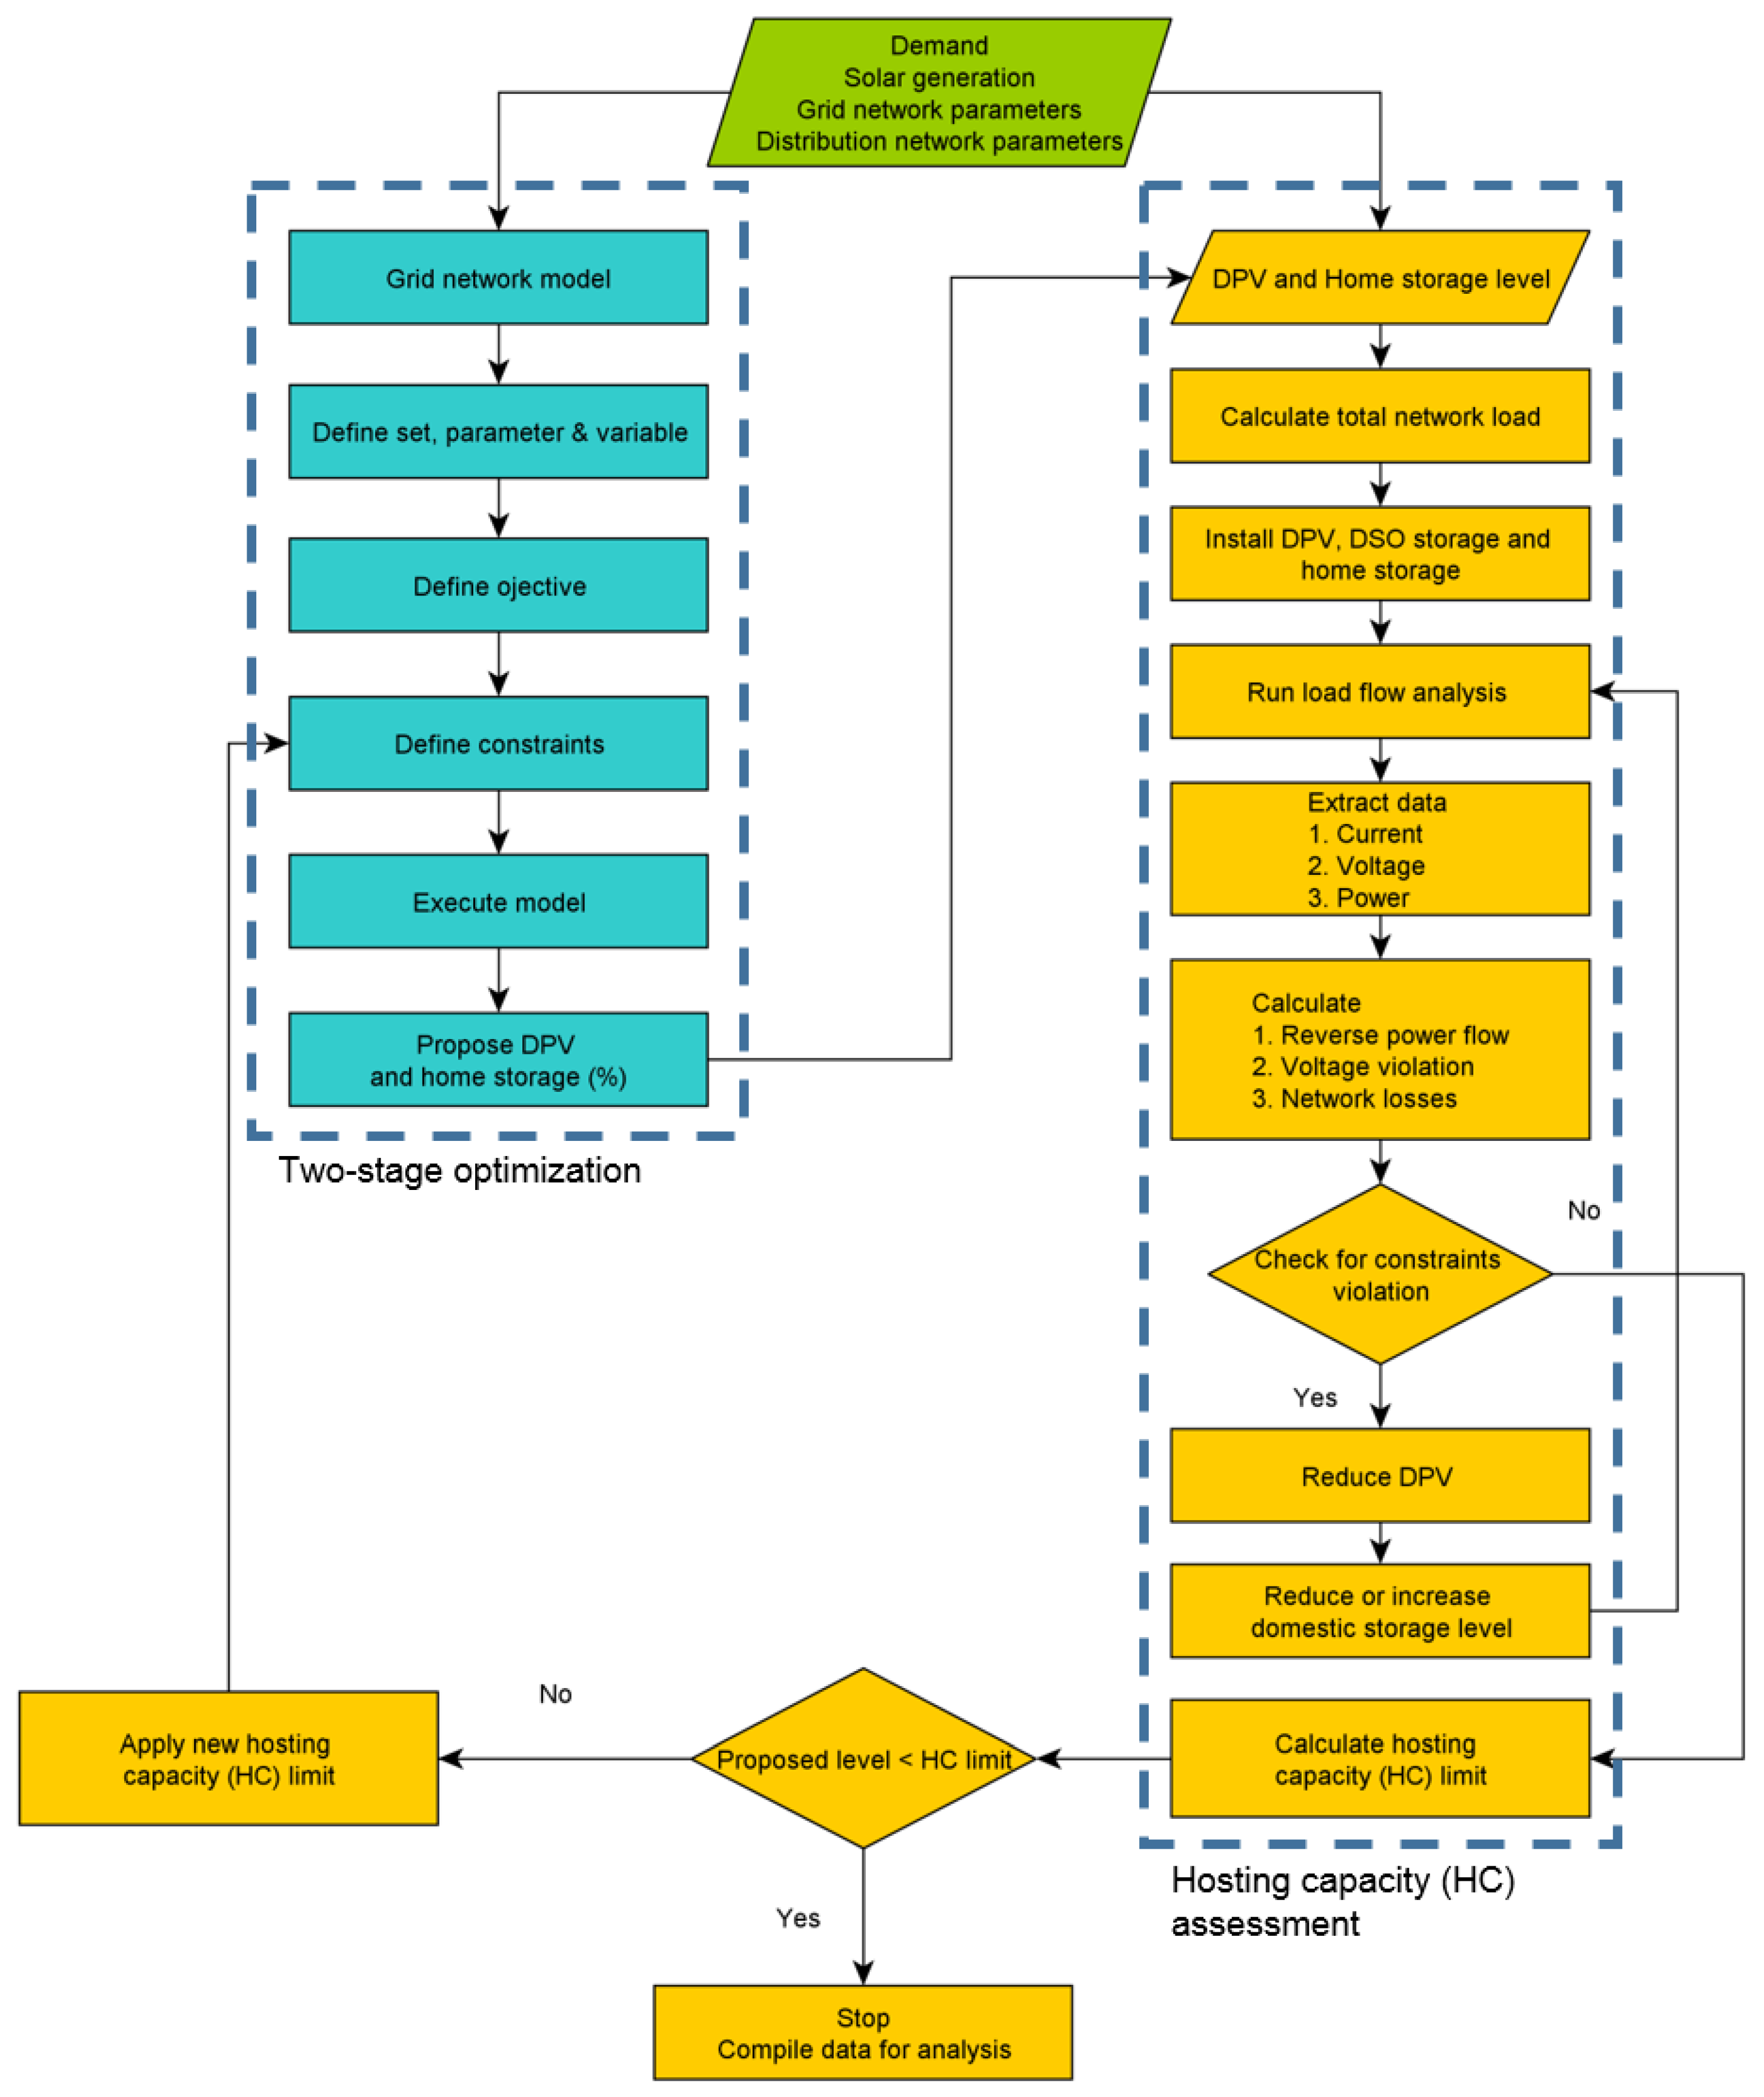
The nomenclature for our model is listed in Table 1. The model combines a high-level two-stage transmission and generation expansion planning model with a distribution network hosting (HC) capacity assessment. First, we determine the optimal level of transmission and generation expansion considering only transmission-level constraints. This optimal solution includes the amount of distributed generation and distribution-connected storage at each bus. We then assess the viability of the proposed distributed solar PV (DPV) capacity, considering detailed distribution network constraints, including reverse power flow and voltage constraints. If these constraints are violated at one or more buses, the upper-level model is re-run with tightened constraints on the allowed maximum DPV capacity in these locations. We iterate between the two models until we find a fixed point where all transmission and distribution network constraints are satisfied, as shown schematically in Figure 1.
The upper-level transmission and generation planning model is an optimization model that uses a linearized DC approximation of power flows, while the distribution network HC assessment is performed using a non-linear steady state power flow model. We introduce a set of corridors between each transmission node and a corresponding distribution network to link the two. To evaluate the effect of an increasing solar PV penetration, we classify solar PV into two technologies: dispatchable large-scale solar (LPV), which is connected to the transmission network and dispatched together with all other power plants and distributed solar (DPV) which is connected to the distribution network. DPV is non-dispatchable and effectively reduces energy demand. In addition, we include three types of battery storage; grid-scale storage which is directly connected to the transmission network, controllable Distribution Service Operator (DSO) operated storage and uncontrollable distribution-connected domestic storage. We conduct a sensitivity analysis for different configurations of battery types in the network.
2.2. Timeline and Model Objective
Our model assumes that investment and operational decisions are taken in two periods, followed by a final set of operational decisions. Figure 2 gives an overview of the model timeline. In 2015, the model decides on transmission and generation capacity investment, which is assumed to become on-line at the start of 2025. (Alternatively, generation investment can be seen as a decision by separate generation investors in a perfectly competitive market). The second set of investment decisions takes place in the year 2025, with new assets coming into operation in the year 2035. Note that, after the second set of decisions in 2025, we assume that there is no further investment. To avoid end-of-timeline effects, we model dispatch decisions for the next 25 years until 2050, such that the total model horizon is 35 years.
The model minimizes the total expected cost of grid investment and operations taking into account flow constraints on all lines, maximum capacity constraints, resource limitations and a solar generation target. In this paper, the total expected cost includes capital expenses for new transmission, generation and battery storage investment, as well as operational costs including generation costs, battery losses and a carbon tax. The overall model objective function is formulated in (1) and consist of total cost for each stage, e, defined in (2)–(4).
where
2.3. Model Constraints
2.3.1. Transmission Network and Generators
Linearized DC power flow constraints are defined in (5) and (6). Each transmission line is represented by a single bi-directional corridor l. The active power flow on each corridor is limited to the total available capacity in (7) and (8). The voltage angle is set to zero for one slack bus such that there is a uniquely defined solution. Transmission and generation investments cannot be negative.
The output of conventional generators is constrained simply to the amount of available capacity, which is derated using the generators’ average availability factor in (9) and (10).
We include a security or reserve margin in (11) and (12) to ensure enough reserve capacity is installed; this is a common approximation of more detailed security constraints which would drastically increase the size of the model without yielding significant additional insight.
In addition, to properly evaluate the effect of intermittent PV generators generation, ramping limits (13), (14) are considered. Energy spillage (15) is allowed and load shedding (16) at each bus, at a high value of lost load, is included to maintain feasibility.
Finally, constraint (17) defines a solar generation target at every stage e.
Generation from solar PV and battery storage are limited by the availability of resources, siting and maximum capacity constraints.
2.3.2. Solar Photovoltaic (PV)
We consider two distinct types of solar PV generation capacity which represent the different technologies that are currently being used. The first is dispatchable large solar PV (LPV), which is treated the same as other large-scale generation with the exception of its variable load factor. The second is distribution-connected PV (DPV). DPV generation is not centrally controlled and therefore indistinguishable from a local reduction in demand. These differences in technology are reflected in (18), (19) for LPV and DPV generation limits are formulated in (20) and (21). In this model, LPV is connected to the transmission grid and DPV is installed only in the distribution network.
2.3.3. Battery Storage
Next, we add battery storage modeling components and for practical reasons, we consider only Li-ion battery storage which is one of the most common technologies currently in use. We consider three types of battery storage to represent grid scale battery, controllable Distribution Service Operator (DSO) owned storage and uncontrollable distribution-connected domestic storage. The controllable grid scale battery is connected to the transmission network and co-optimized with generators at the dispatch stage. The other two types of battery (DSO owned and domestic) are connected to the distribution network. We use a generic mathematical representation of storage, which decouples energy capacity (MWh) and power generation (MW) [5,21,22,23]. In general, storage can provide energy arbitrage to improve load factors of generation technologies with lower variable costs, discharging during peak periods and charging when renewable generation is high or demand is low. The characteristic of storage are modeled in (22)–(27). Note that battery storage is not constrained by ramp rates as it is sufficiently flexible at our temporal resolution.
2.3.4. Distribution Network Hosting Capacity (HC) Assessment
As Figure 1 shows, the proposed DPV and storage capacity at each distribution node of the high-level grid planning model is assessed using a distribution network hosting capacity (HC) assessment. The HC is evaluated using the solar penetration level, and home storage level from the upper-level model subject to reverse power flow and voltage constraints in the distribution network.
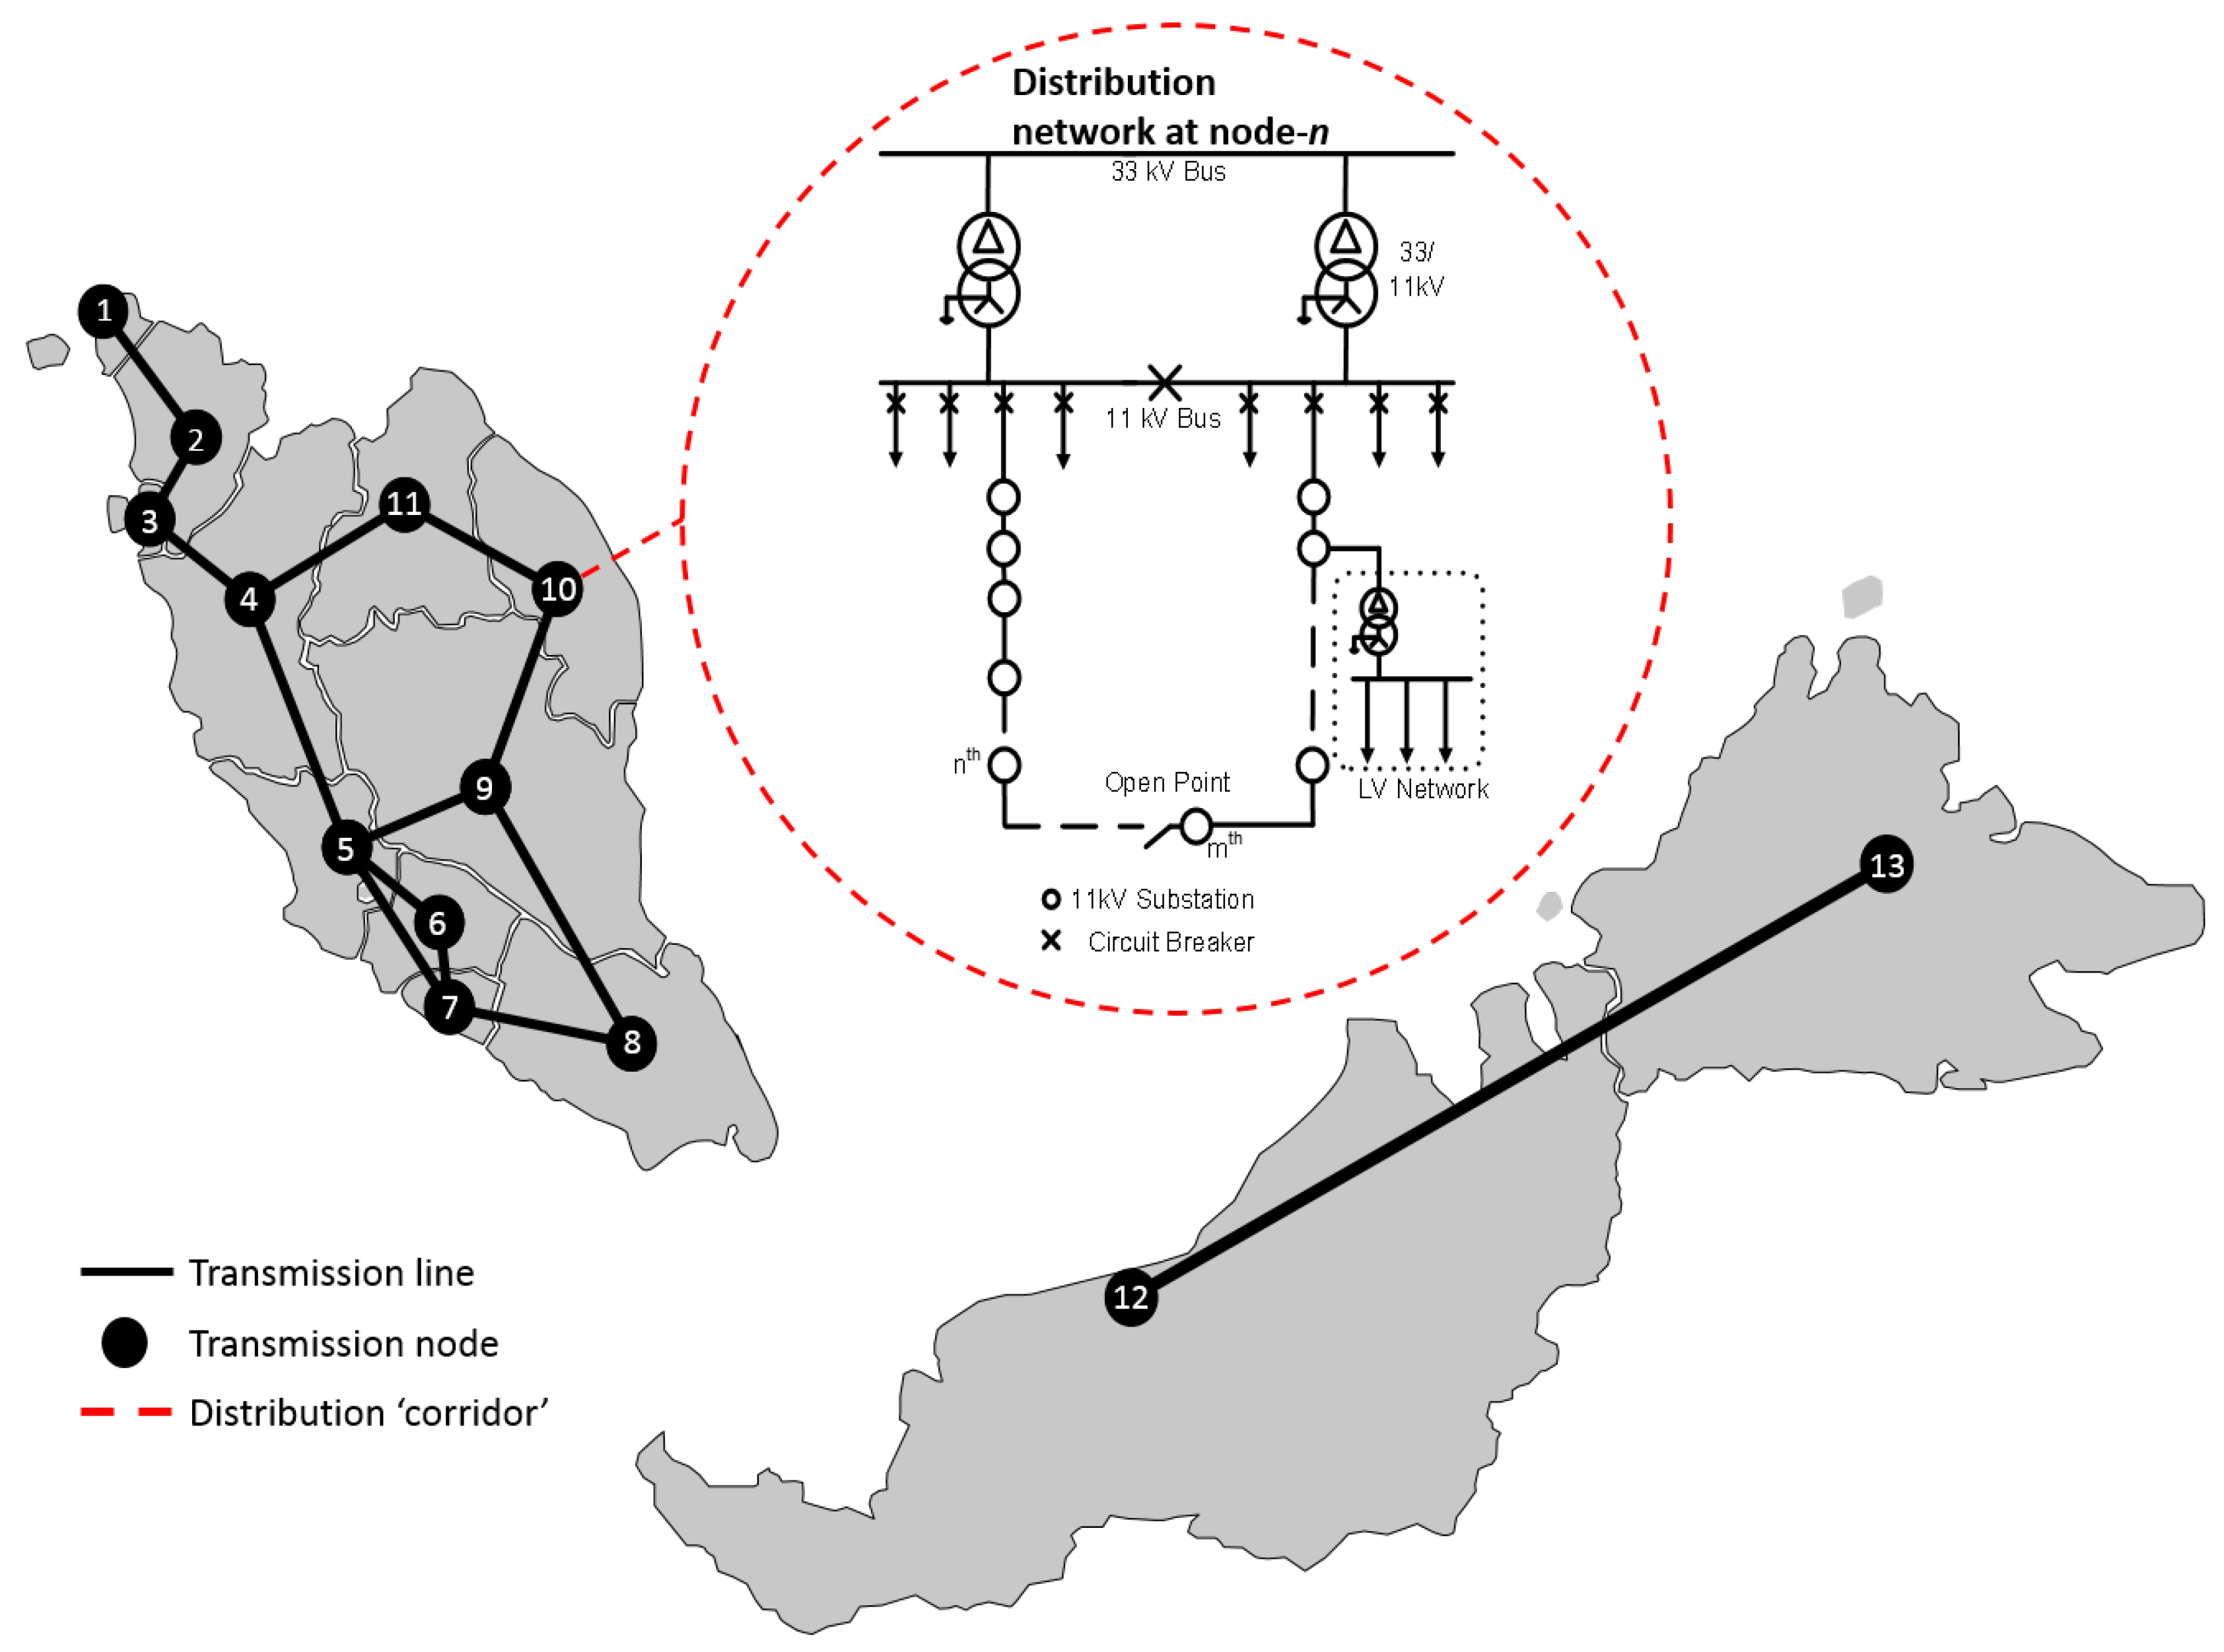
To evaluate the firm level effect of DPV and small scale storage, we introduce an additional corridor that connects each transmission node to a corresponding distribution node as shown in Figure 3. The negative effects caused by solar generation include voltage violations and back-feed to the transmission network, which can cause instability and security problems. Thus, we constrain power flows to the transmission node to be non-negative in (28), while voltage limits are set to typical values of 0.95 pu and 1.05 pu as a minimum and maximum, respectively (29); these are common regulatory constraints in current distribution networks.
In our model, hosting capacity (HC) assessment is performed heuristically until the DPV and home storage levels satisfy distribution network constraints; that is, reverse power flow and voltage limits. However, applying this heuristic approach will likely cause the iteration process to diverge. To solve this and find a fixed point, the model will successively decrease the allowable DPV level and if necessary, will reduce or increase the amount of domestic battery storage to determine a new limit for each distributed PV and domestic storage in the optimization model as shown in Figure 4.
The allowable home storage and distributed solar penetration in distribution nodes are enforced in (30) and (31) respectively. In addition, domestic battery storage capacity is limited by the amount of DPV in the distribution network as in (32). Relevant assumptions and parameters applied to the established distribution network are detailed in the next section.
2.4. Model Outputs
The above model calculates the optimal expansion plan by minimizing the total cost of transmission and generation expansion and operation. We consider two scenarios for battery storage coordination namely ‘grid-size’ and ‘all-storage’. In the former, only transmission-connected storage is available, while in the latter, where all storage type including distributed small-scale storage are incorporated in grid planning. First, we demonstrate the effect of distribution network constraints (HC limits). Then, we analyze the optimal result for solar PV integration with only grid size storage and integration of solar PV with all storage types; grid size, DSO owned and home storage (HC enhancement).
2.4.1. Impact of Hosting Capacity (HC) Limit on Grid Investment
Our model combines a two-stage planning model with a distribution hosting capacity (HC) assessment. To demonstrate the importance of distribution network constraints in grid planning we, first of all, obtain the expected total system cost without HC limit using only a two-stage optimization model. Then, we integrate both the two-stage optimization model and the HC assessment model to determine the optimal solution after HC limit is imposed. The difference in total system costs between the two cases illustrates the effect of HC limits.
2.4.2. Effects of Battery Storage Integration and Hosting Capacity (HC) Enhancement
Storage technology can be utilized as a HC enhancement method, complementing renewable generation and also potentially substituting the transmission line investment [12]. To demonstrate the effect of different levels of storage coordination for different solar penetration levels, we first obtain an optimal solution allowing for only grid-size storage and then add small-scale storage (HC enhancement) into the integrated planning model.
In the real world, there are other options for HC enhancement. Depending on the problem, HC enhancement techniques varies from active network management (ANM), network reinforcement, application of on-load tap changers (OLTC) to energy storage and harmonics mitigation [1,24,25]. In this paper, we only apply hosting capacity (HC) enhancement techniques resulting from the connection of small scale Li-ion battery storage in the distribution network; controllable Distribution Service Operator (DSO) owned storage and uncontrollable distribution-connected domestic storage; however, other methods would likely yield similar results.
2.5. Assumptions and Data
2.5.1. Transmission and Generation Characteristics
The transmission network in Malaysia is operated at 132 kV, 275 kV, and 500 kV. For simplicity, and because the most important constraints are on higher-voltage corridors, we ignore the 132 kV network. We condense the remaining 275 kV and 500 kV network to 13 transmission nodes, one for each of the main cities. This representation is also widely used by the Malaysian regulator and in industry [26,27,28]. Transmission losses would introduce nonlinearities without adding significant insight and are therefore not considered. As explained above, we extend the network with a set of corridors that connect a distribution node to each transmission node. This corridor is a representation of the multiple cables that connect distribution substations and transmission grid supply points. As congestion on these lines is uncommon, they are assumed to have unlimited capacity.
All generators are assigned to the nearest nodes, using their actual generation capacity while distance between nodes is based on the direct distances between the main cities, as shown in Figure 5. Asset retirement is not considered in our model and we assume that new generation capacity built in 2025 and 2035 will continue to be in operation until the end of the timeframe modeled.
Generator efficiency, technical and cost parameters for the power plants are obtained from References [7,29] and own assumptions which are listed in Table 2. Note that the ramping rate of solar PV is assumed to be infinite, as PV generation is driven by renewable resource availability. Capital costs include construction cost and fixed costs discounted to the year construction starts; for batteries, this includes degradation costs. Only solar, hydro and biomass plants are considered to be renewable and both types of solar PV contribute towards solar target. Only solar energy is intermittent.
2.5.2. 11 kV Distribution
To model the distribution network, we formulate a typical 11 kV Malaysian distribution network Open Distribution Simulation Software (OpenDSS) [30]. This network is shown in Figure 5.
Generally, there will be two 33/11 kV power transformers operating in parallel in most 33 kV substations in peninsular Malaysia. For operational reasons, the system planner would plan for peak demand to be capped at 50% to 75% of the network total capacity. The reason for this is to ensure demand is fully or at least partially transferable to another transformer within the same substation in case of a failure in one power transformer. This will ensure fast restorations of supply and prudent asset management by having a longer lifespan of power transformers. However, for simplicity, and because we do not consider outages here, this typical redundant configuration is omitted in the network model used for this paper. We assume instead that only one power transformer is connected to the modeled network.
For the 11 kV outgoing feeder, we model a single radial feeder to further simplify the analysis; actual feeders are usually interconnected in mesh. At each 11 kV substation, voltages will be stepped down from 11 kV to 400 V by distribution transformers. This study covers the 11 kV distribution network, where most power issues occur; low voltage networks are therefore excluded from this network model. The effects of aggregation for each case of reverse power flows, voltage rises and network losses have been validated at the preliminary stage of this research, showing minimal and insignificant differences between the simplified model and a more complex, realistic model, giving confidence that our results are not affected by these simplifications.
The network is modeled based on an 11 kV distribution network in a highly populated area in Malaysia where the average distance between substations is 1 km to 2 km. Therefore, it is assumed that all buses are connected by 300 mmp three-core 11kV armored cables (aluminum conductor) and the distance between buses is 2 km. Due to data limitations, electrical properties of the power transformer and cables are set according to technical specification manuals from major suppliers of those equipment in Malaysia. The final network model is based on the characteristics summarized in Table 4. The same distribution network representation is repeated at each transmission bus.
2.5.3. Demand
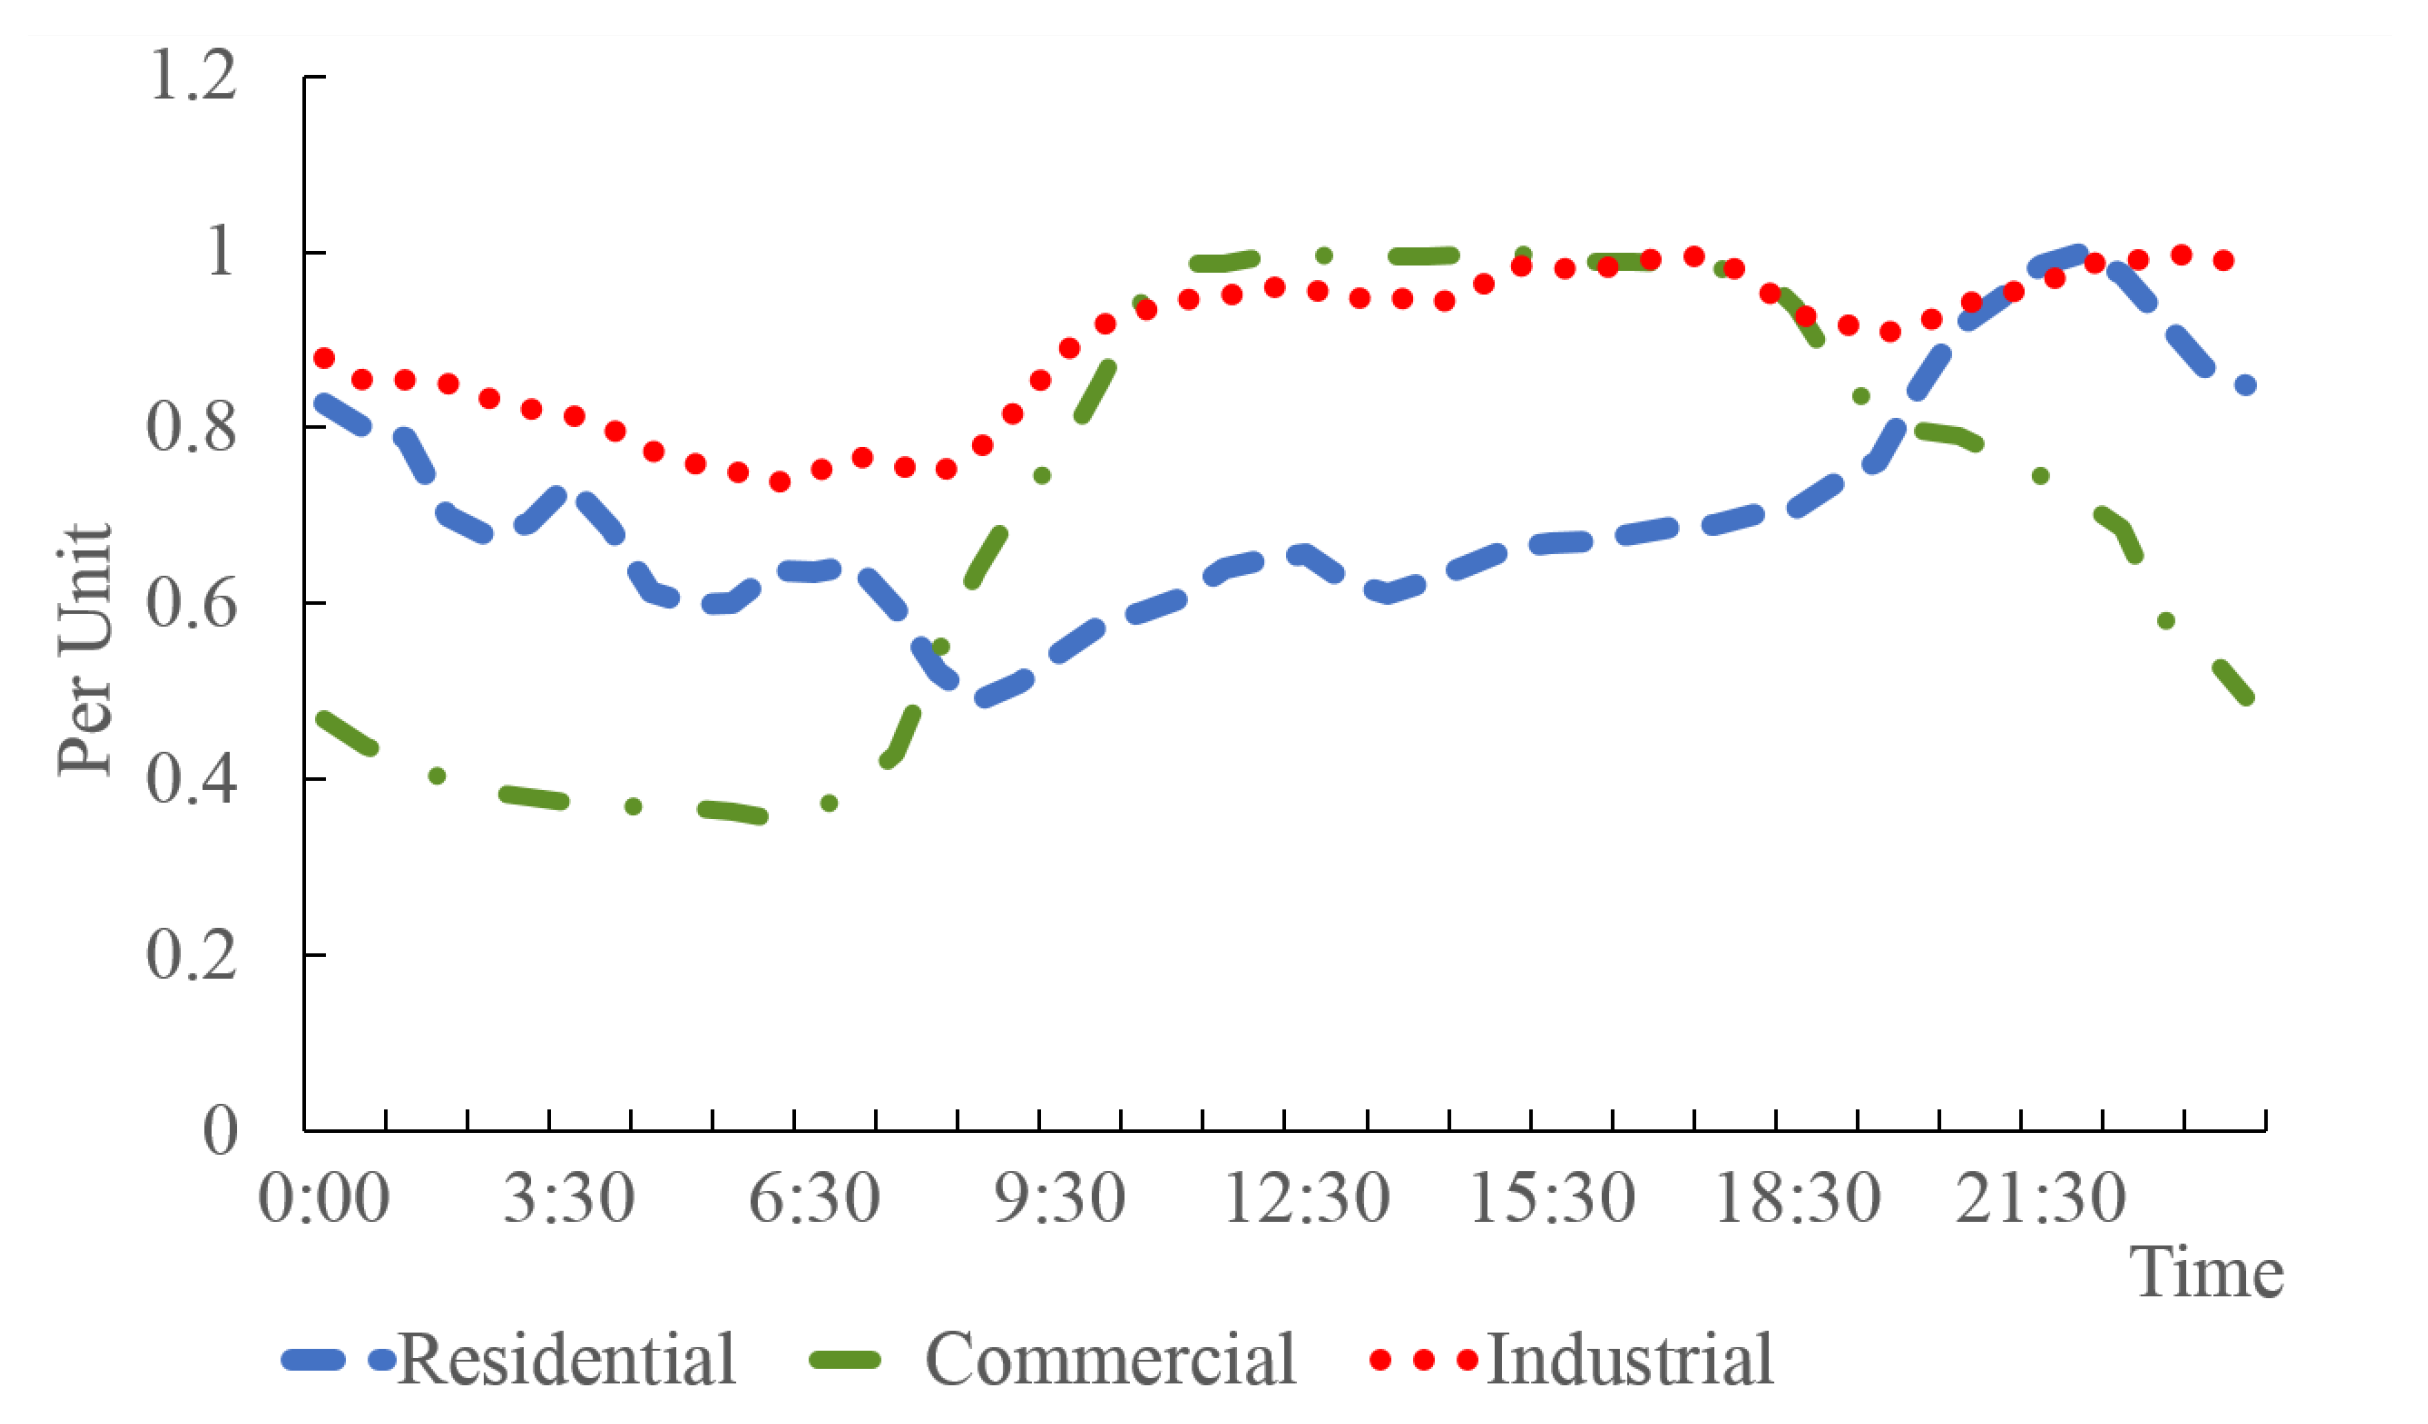
Peak demand for each transmission node is taken from measured data [27] and disaggregated to the distribution nodes in the connected distribution network based on own assumptions. Then, each node is assigned a demand pattern based on three typical demand categories identified in Malaysia. Demand aggregations and classifications are established based on the economic and demographic of each state. We use three sets of actual hourly demand data from the 5th of September 2016, extracted from energy meters installed at the major substations in Klang Valley, Malaysia. Demand is categorized based on the patterns of the extracted data and locations of each substation and defined as residential, commercial and industrial, representing the three typical demand types in Malaysia depicted in Figure 6.
The main characteristic of residential demand in Malaysia is the low energy consumption between 7 am until 6.30 pm during working hours and rush hours. Energy usage starts to increase after 7.00 pm and gradually decreases around 10.30 pm. In contrast, commercial demand patterns will reach their peak consistently for a few hours after 10 am, when most business transactions take place and are subsequently reduced after 6.30 pm. On the other hand, industrial demand patterns appear to be flat with minor fluctuations within 0.75–1 per unit value; this data was extracted from the main substation which supplies an area of heavy industries that operates 24 h a day. It is possible that other industrial areas will have different demand patterns but it is impossible to consider all of those. We therefore, focus on this representative case study.
In the distribution network hosting capacity (HC) assessment model, total peak demand is assumed to be evenly distributed at each phase and node, for lack of more detailed information about the distribution of demand over the network. The total demand is set at 17.1 MW or 60% of the total transformer capacity which, as explained above, is a realistic level. Also, residential demand patterns are assigned to all distribution nodes and buses with an average power factor of 0.97, corresponding to the actual demand data mentioned above. Resource availability and demand parameters for each node are listed in Table 5 are extracted from References [27,28] and aggregated based on own assumptions.
2.5.4. Solar PV and Battery Storage Characteristic
As a result of the current Malaysian Feed-in Tariff (FiT), most solar PV systems are connected within distribution networks and in many cases are rooftop solar installations in residential areas connected to end-users. In this paper, we use modeled solar generation data from a mesoscale weather model [31] for all major cities in Malaysia and normalize this to a per unit value shown in Figure 7. Solar generation starts at sunrise, on average around 7.30 am, peaks in the afternoon between 12 pm and 3 pm. It is similar to generation patterns used in previous research [32,33]. To assess the impact of solar penetration on the network, the built-in OpenDSS solar PV model is used to represent a cluster of solar PV connected within the distribution network. For practical reasons, in both models (transmission and distribution network) we only use a 48-hour solar pattern representing the highest and lowest weekly average in a typical year.
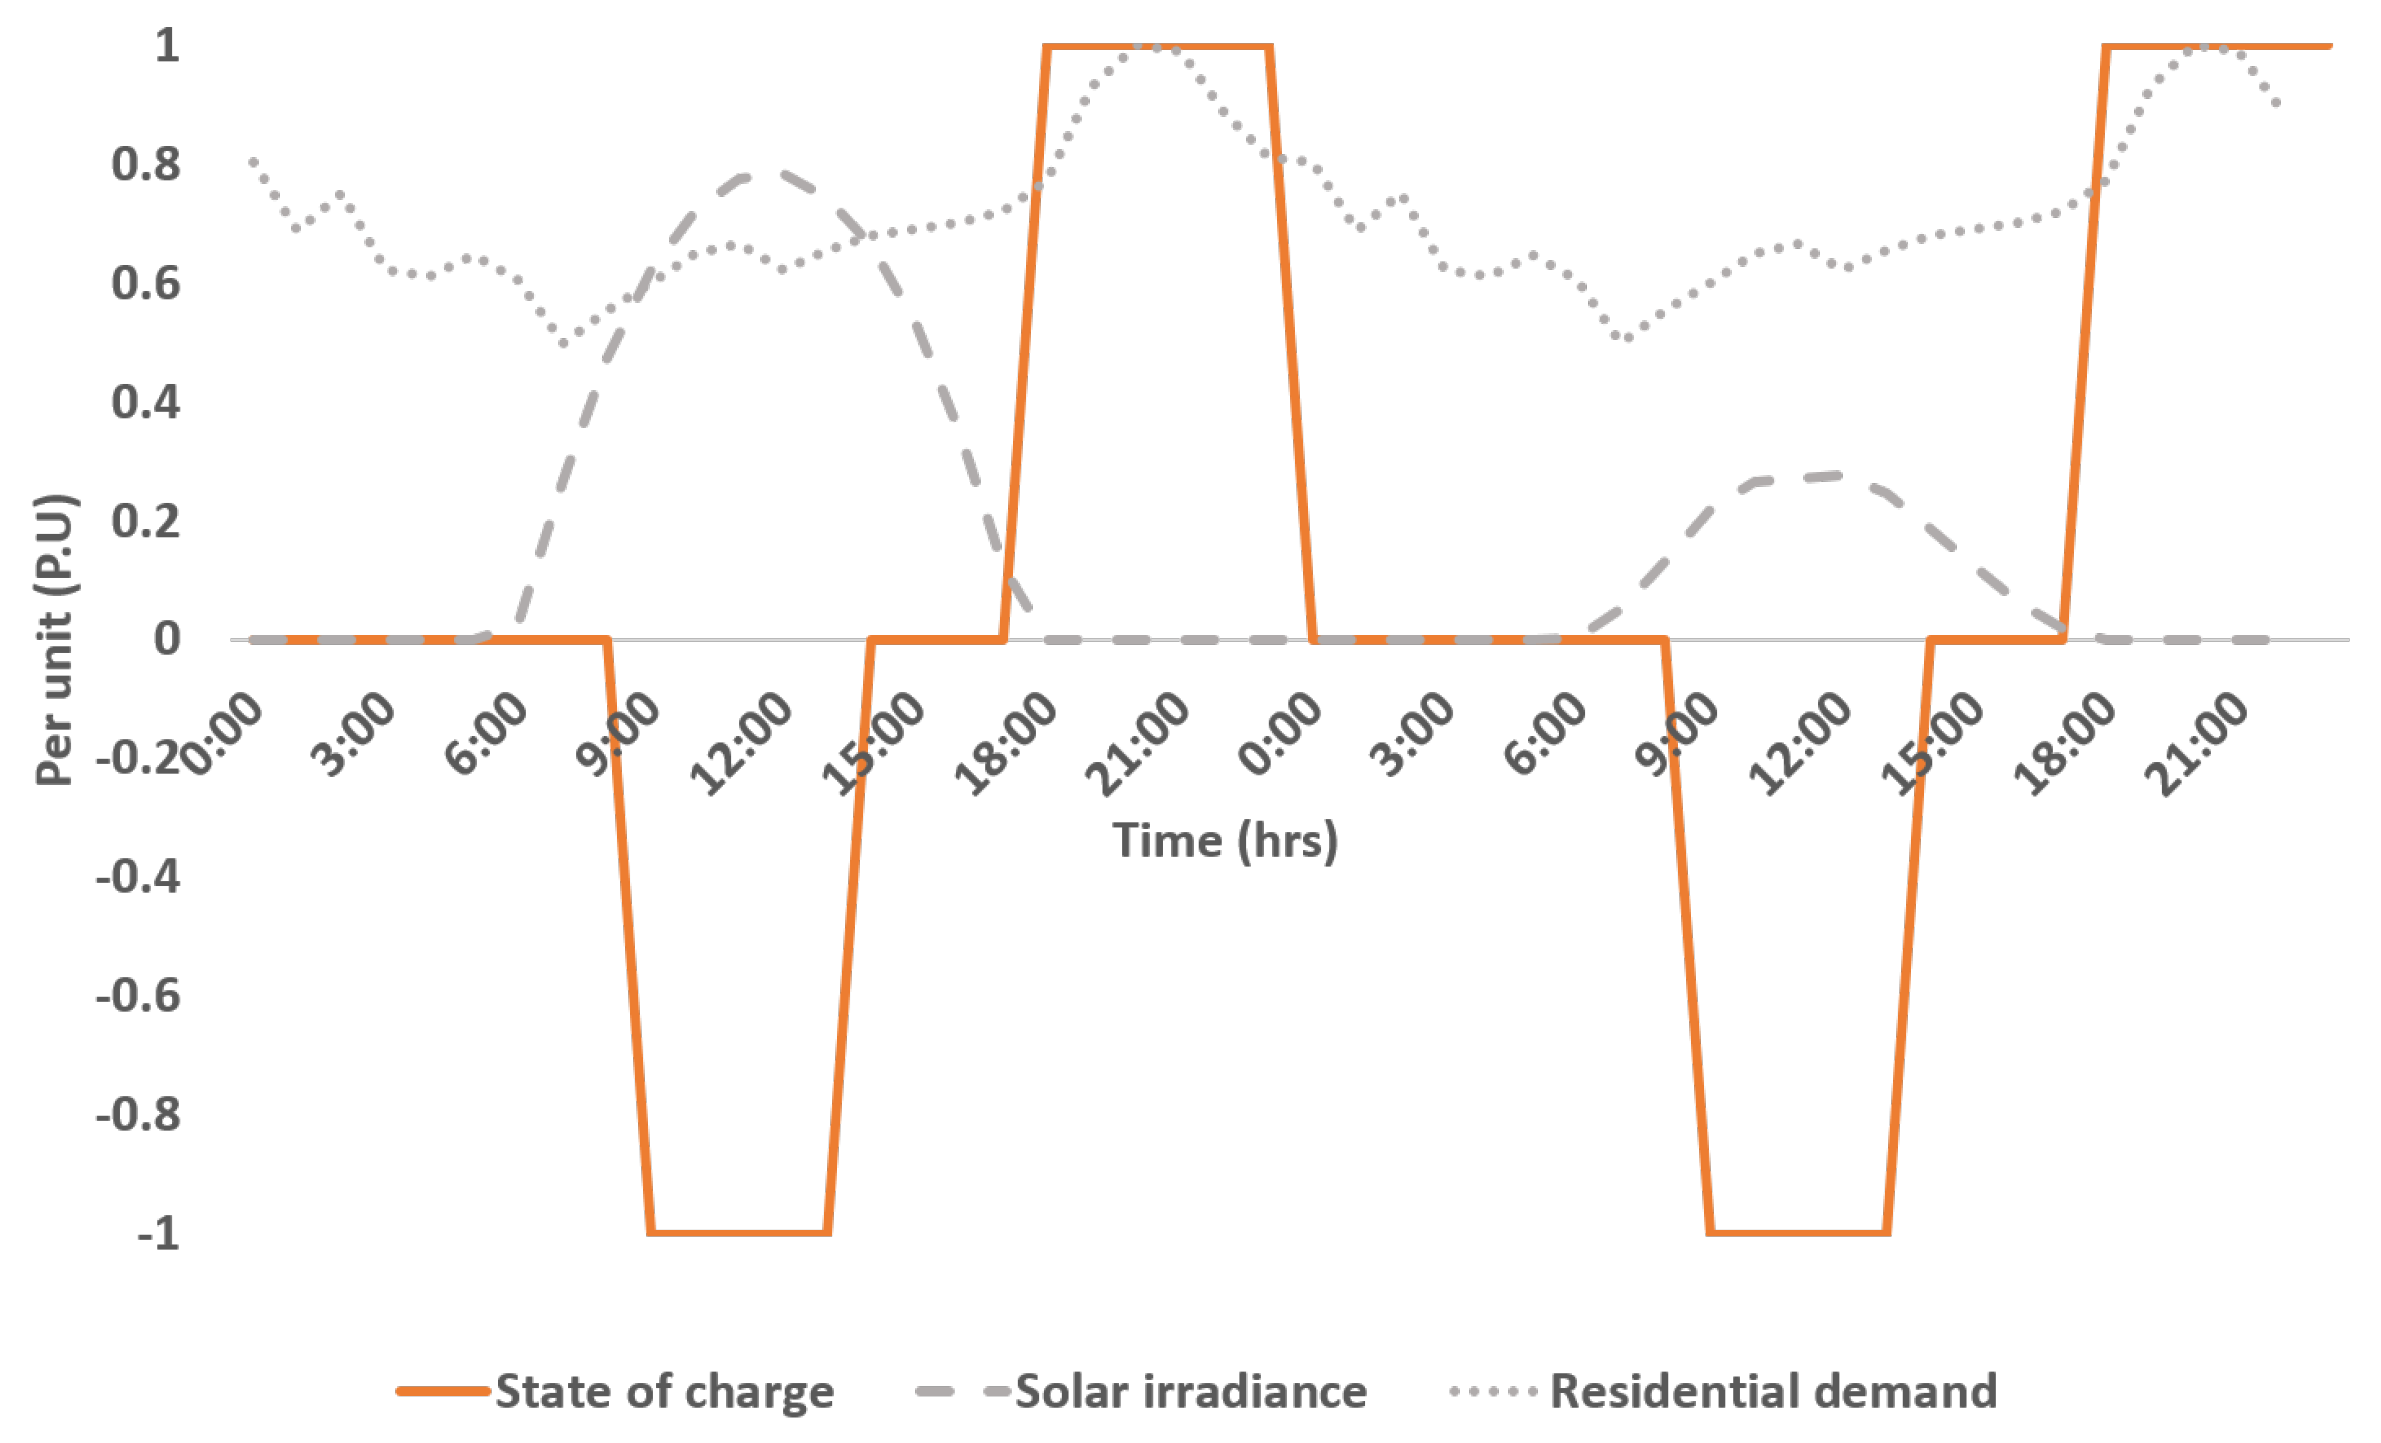
Also, using a built-in OpenDSS storage model, the uncontrolled domestic storage is set to charge between 9 am to 1 pm to match the period of high solar irradiance while in the night-time when the demand starts increasing, the battery will begin to discharge as depicted in Figure 8. Although it is known that battery production contributes significantly to emissions [34,35], we do not account for this in our model. Hence, only emissions from grid operation are considered. Also, similar to generation assets, battery storage is assumed to last until the end of planning period while the effects of state of charge (SOC) on battery life-cycle and calendar aging are not explicitly modeled but included in the capital cost of batteries. However, we suggest that the aging effect of battery and generation assets retirement should be incorporated in future studies.
2.6. Planning Scenario
We consider a planning scenario summarized in Table 7 that emphasizes a decrease in operating and investment costs resulting from technological advancement and industrialization; simultaneously, these factors translate into high demand growth (50–70%) [27,37,38,39]. Consequently, the projected cost for all generating plants and transmission investment are significantly reduced after the first modeling stage. As compared to the conventional generators, new technologies see especially significant decreases in costs, to reflect the fact that, for these technologies, learning curves are still steep [36,40,41,42].
3. Results and Discussion
3.1. Impact of Hosting Capacity (HC) Limits on Grid Investment
Figure 9 shows the total expected system costs (in $ billion) and total line (in GW) investment for two scenarios; one with grid-size storage only and one with all three types of storage. In each case, a high 80% solar target is enforced. As this figure shows, hosting capacity limits impose significant additional costs.
As shown in Figure 9, in the absence of distribution network constraints, the model proposes a significant amount of line investment to fully utilize the cheaper energy generated by both large solar PV (LPV) and distributed solar PV (DPV) located in the buses with the best solar resource. After distribution HC limits (reverse power flow constraints and voltage limits) are imposed, reverse power flows from distribution network are constrained, resulting in a significant reduction in DPV investment at the high-resource distribution nodes that exceed the HC limit. However, due to the fixed solar target, a significant amount of DPV investment has to be shifted to other distribution nodes with lower solar resources as depicted in Figure 10a. This increases costs.
Also, due to the non-dispatchable characteristic of DPV and in absence of small-scale battery storage to mitigate negative distribution network effects, more expensive LPV is proposed instead of DPV, which also increases the overall cost. However, because the solar capacity is now more evenly distributed across the networks, less transmission reinforcement is necessary. The 3.4 GW reduction in transmission capacity somewhat offsets but does not negate, the cost increase due to the decreased average solar capacity factor.
If we include cheaper small-scale storage (DSO owned and distributed domestic storage) into the model, this decreases overall costs substantially, as it increases the allowable solar penetration level in the distribution network. Nevertheless, the additional costs of HC limits do not decrease substantially.
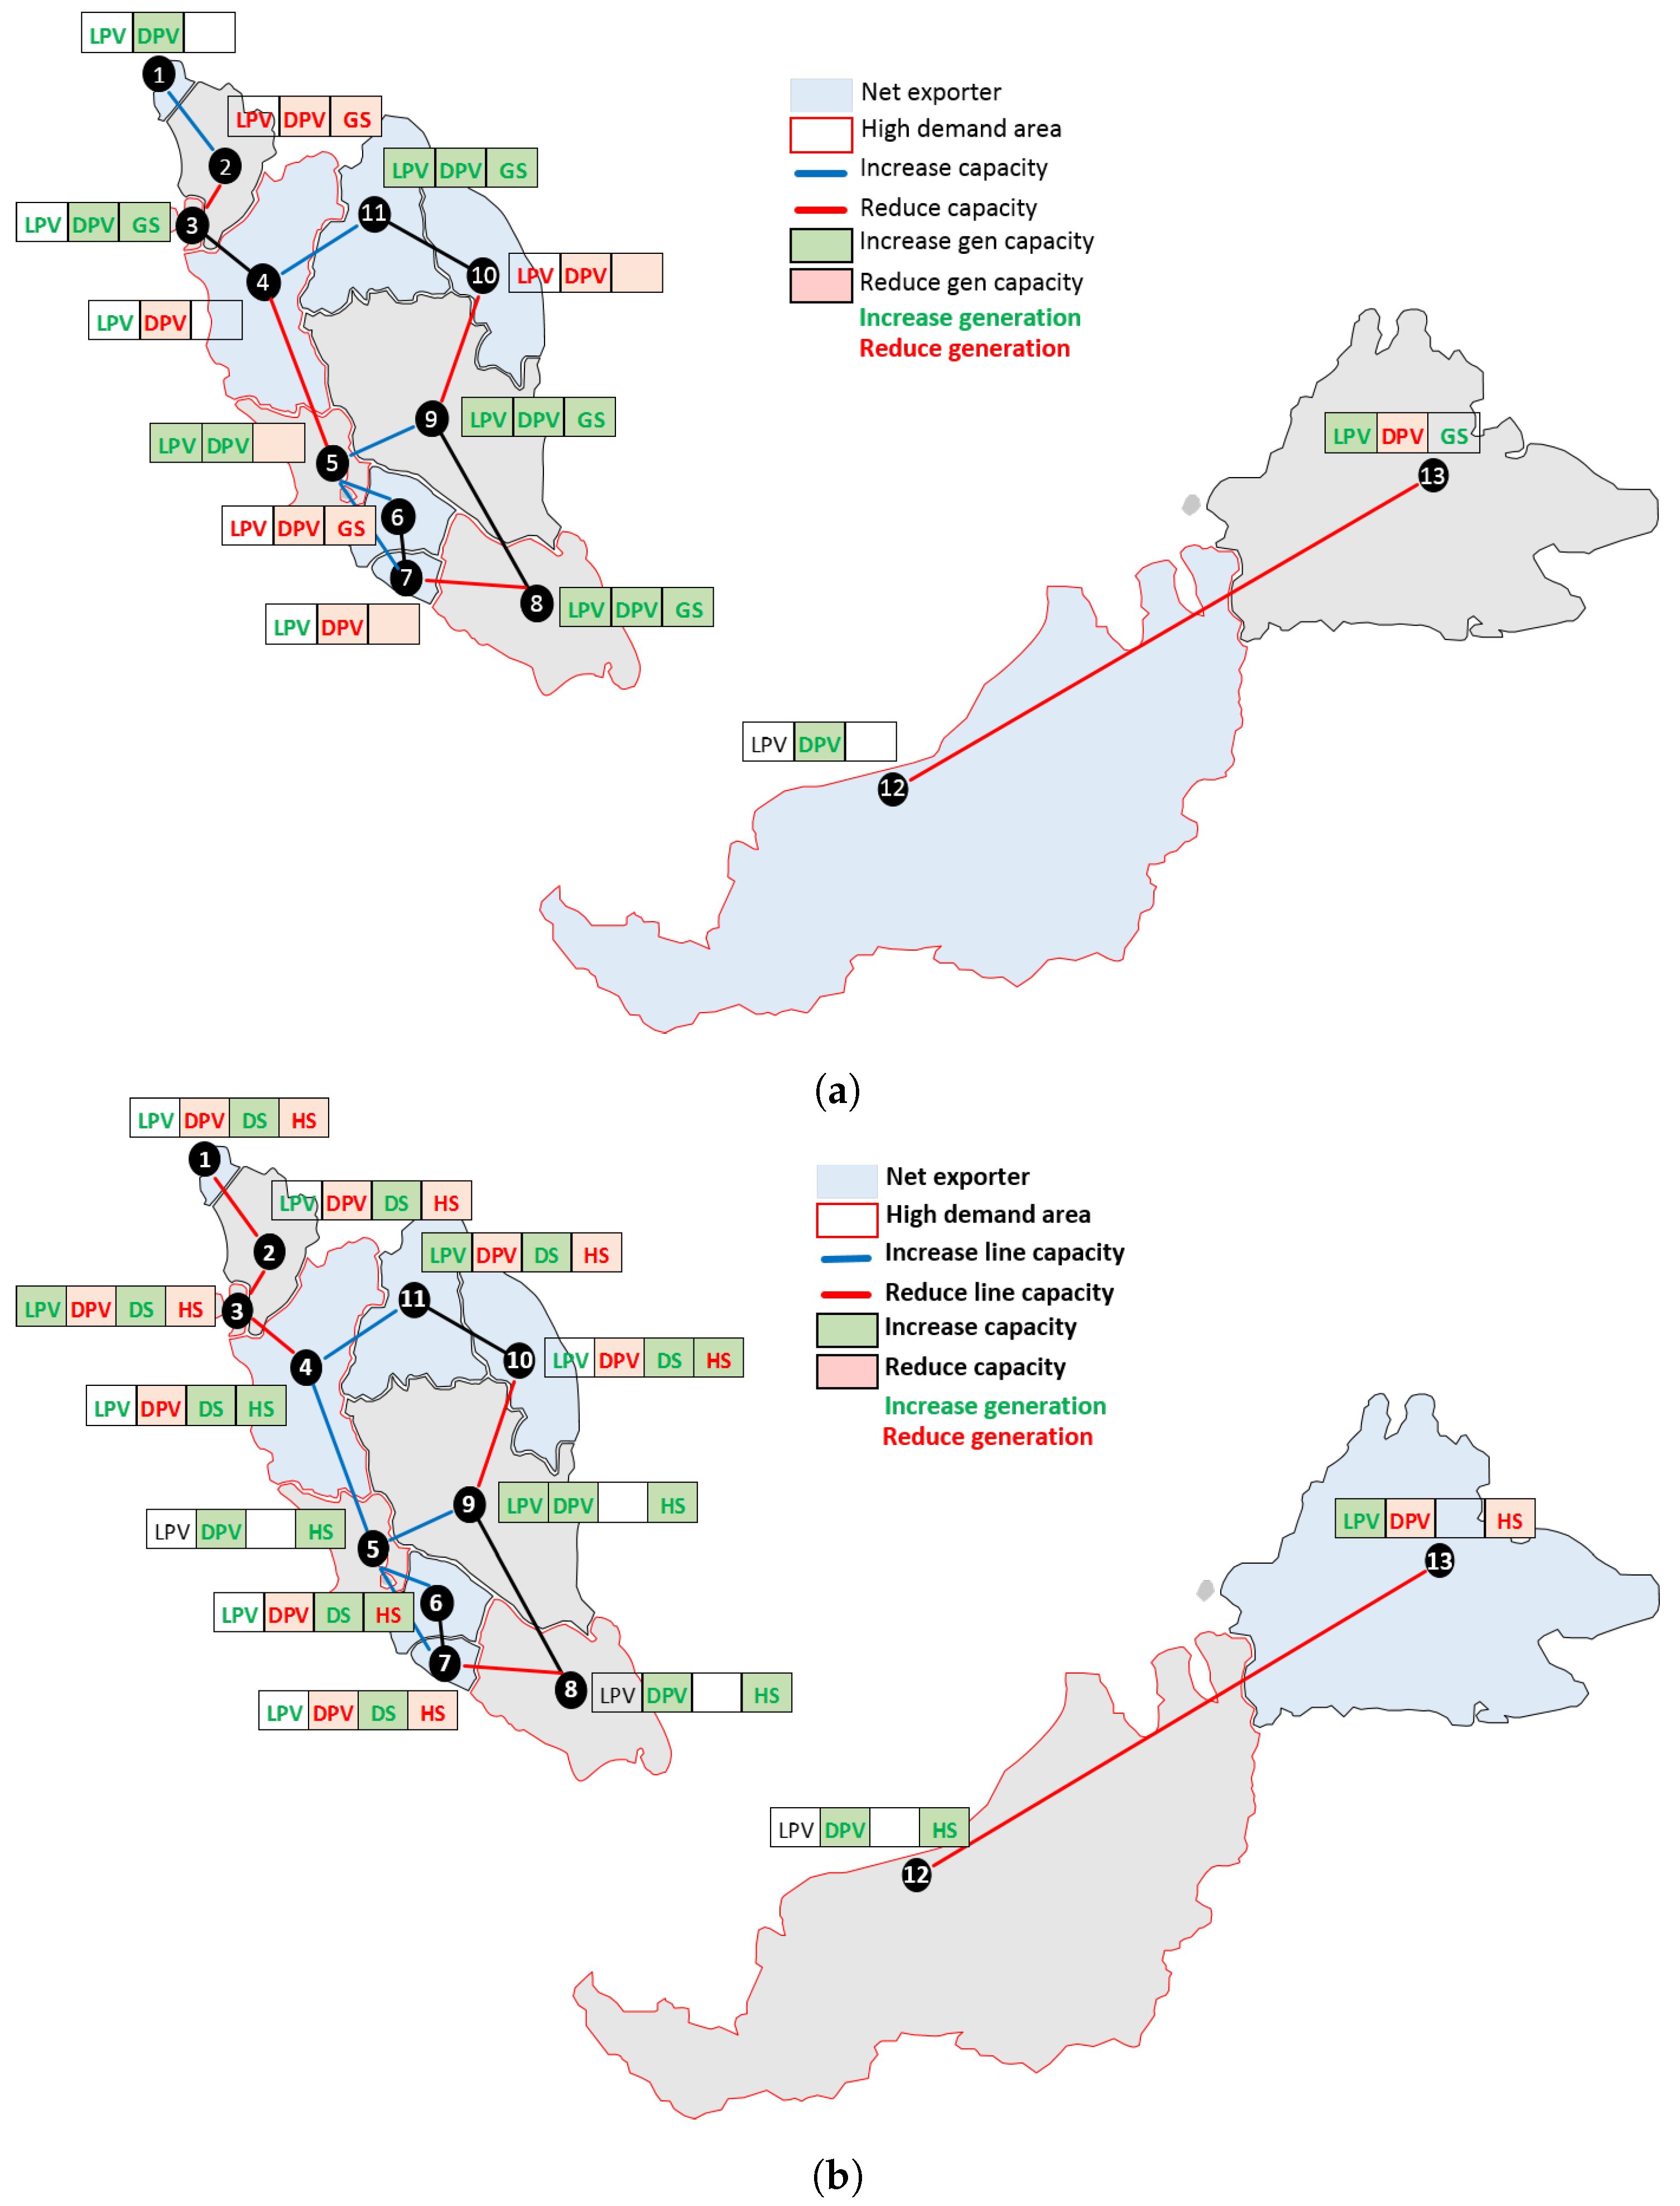
Detailed changes and spatial distributions of solar and storage investment after considering HC limits are shown in Figure 10. The spatial distribution of solar and storage capacities in Figure 10 are different for both cases which at is, to some extent, driven by our cost parameters, solar availability and demand profiles at each node.
In Figure 10a, due to the set solar target, a significant amount of solar PV investment is shifted to the lower-resource nodes (node 5, 8, 9 and 10) and re-allocation of LPV, DPV and grid-size storage takes place regionally. Meanwhile, if small-scale storage technology is included, re-allocation decisions have more flexible and most investment is shifted locally, at the same node, resulting in a different mix of distributed solar and battery storage. In order words, HC limits have limited spatial investment effects if a range of storage technologies is available; on the other hand, if only large-scale storage is available, HC limits require much larger spatial shifts in investment. Note especially that an increase in DSO owned storage in Figure 10b is proposed at many nodes to maintain a high level of DPV penetration after HC limit is imposed.
In addition, changes in transmission investment decisions are affected by the type of storage that is available. This will be discussed further in the next section.
3.2. Effects of Battery Storage Integration and Hosting Capacity (HC) Enhancement
3.2.1. Cost Implication and Emission from Grid Operation
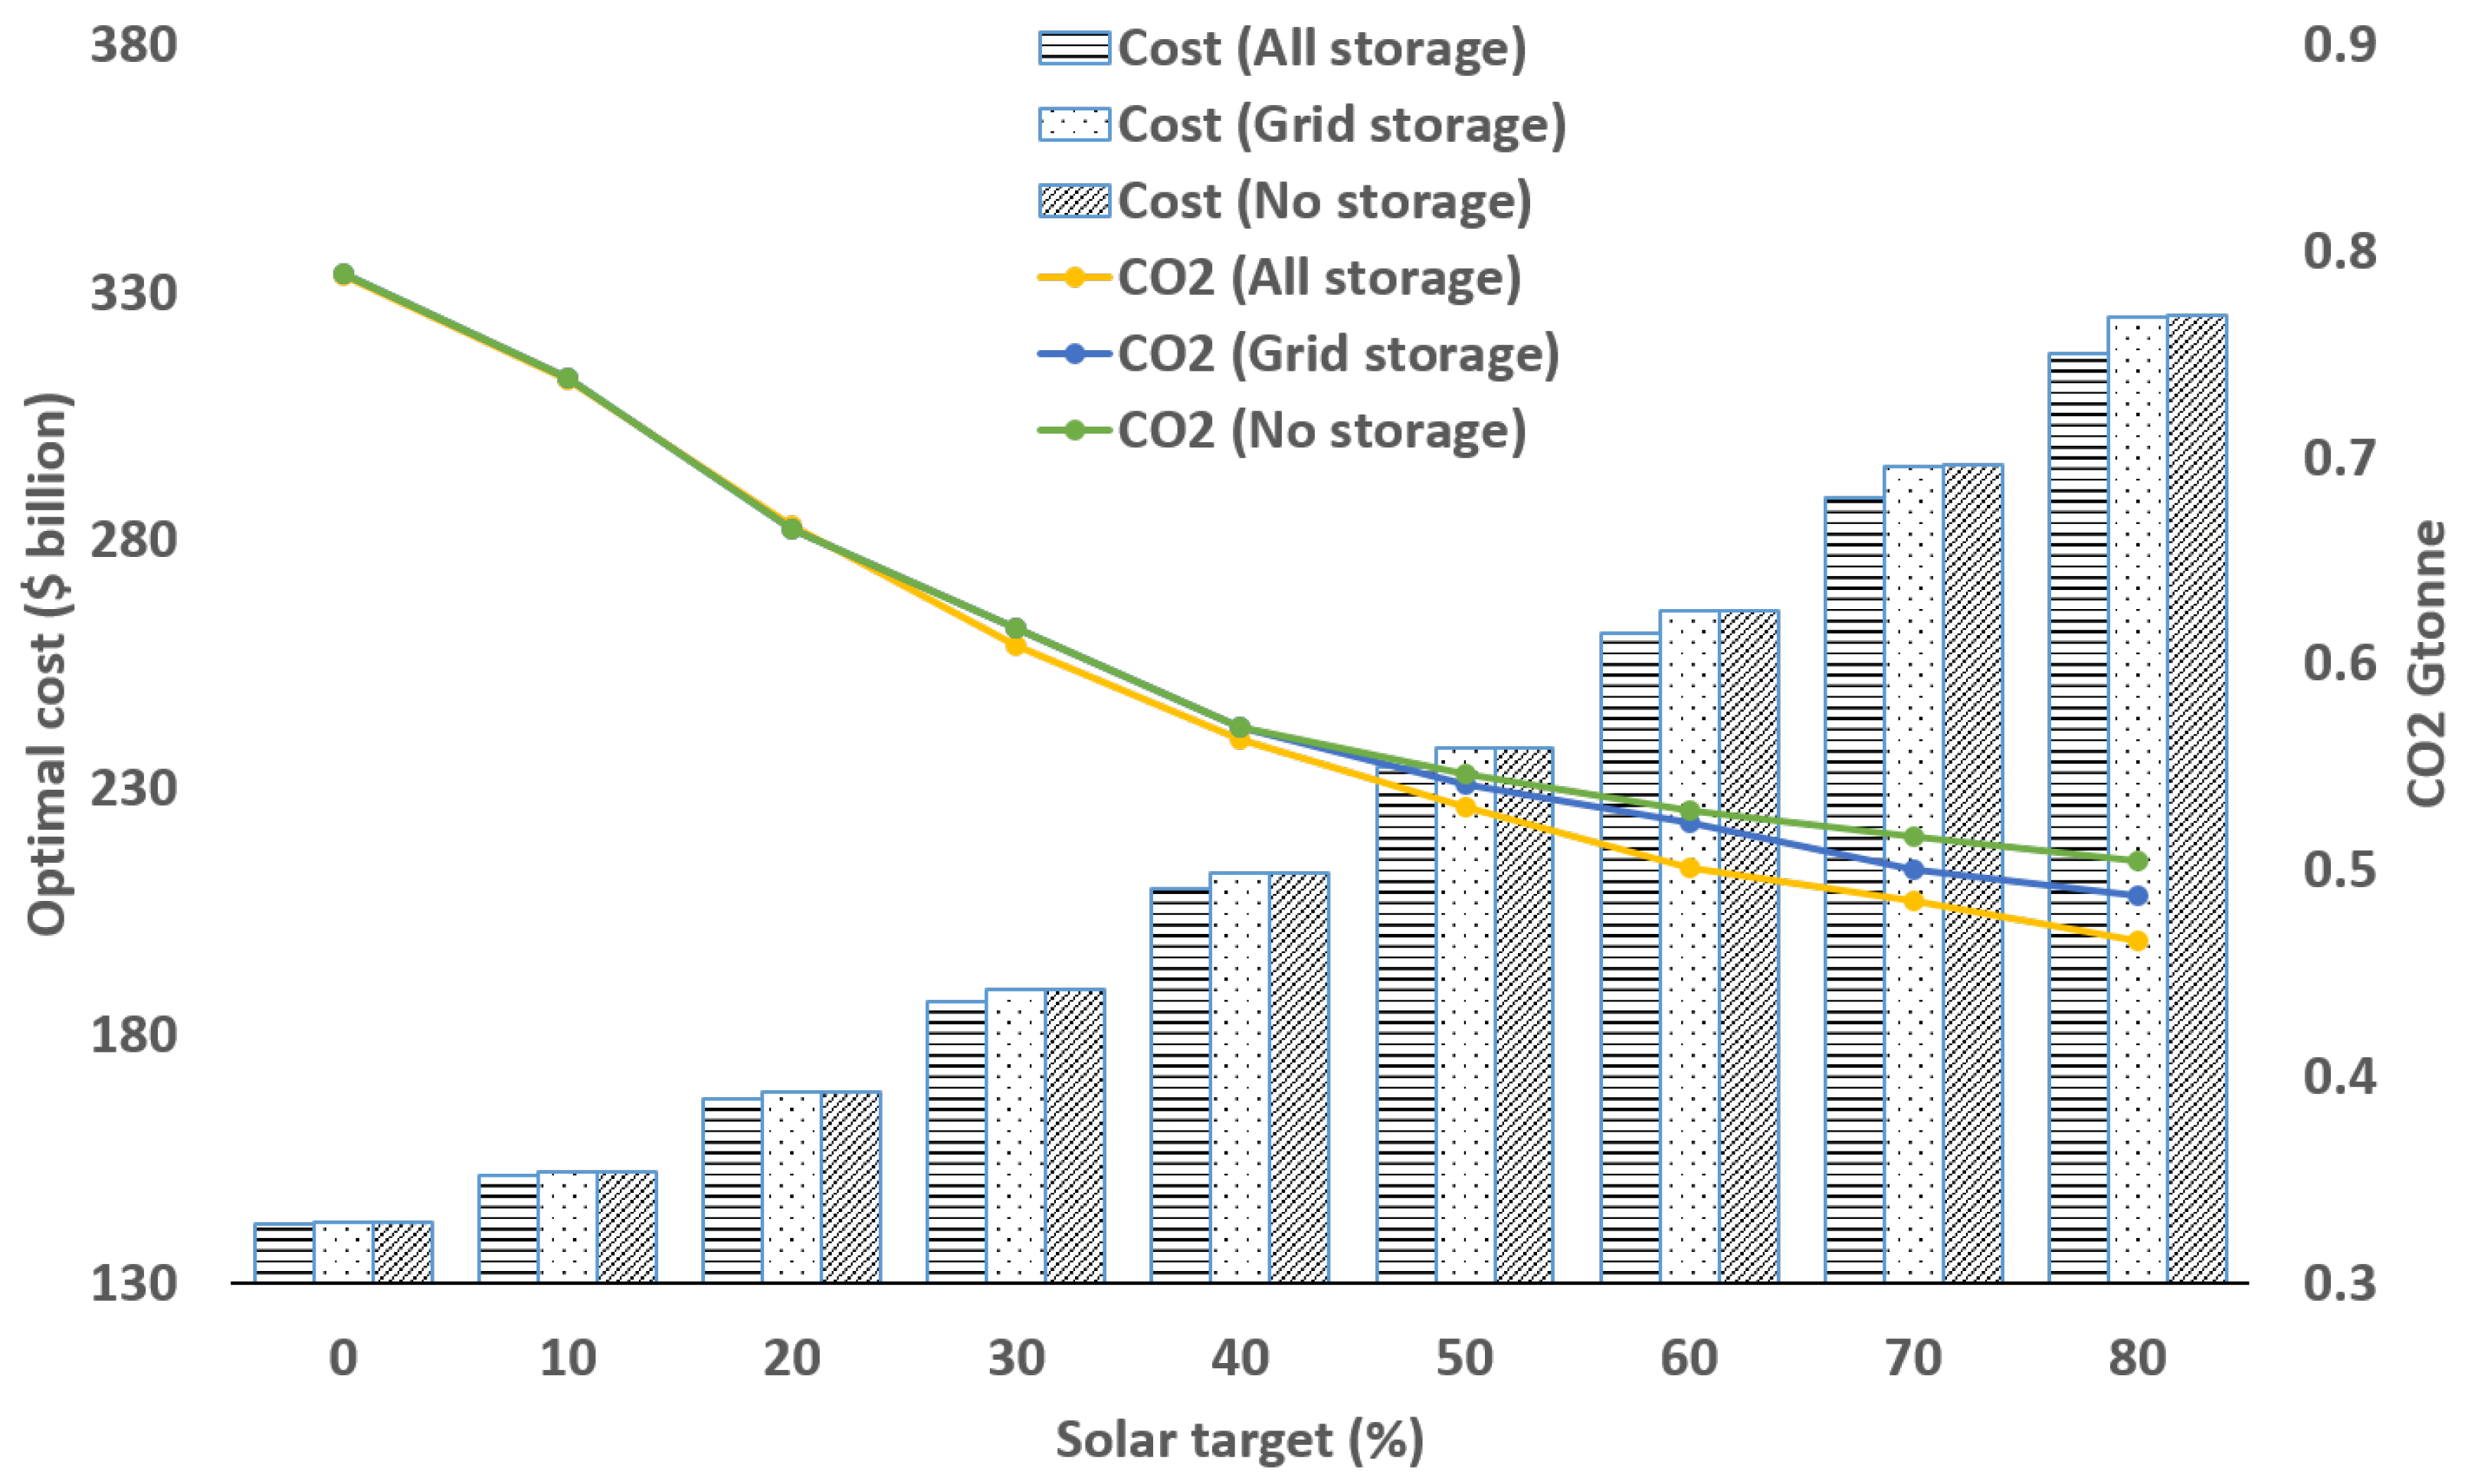
The results above were obtained assuming a very high solar penetration level. In this section, we evaluate the benefit of different types of battery storage at different solar targets. Note that, in this simulation, in contrast to the previous sections, the base case is a setting with solar PV integration without any battery storage and that, for each simulation, battery storage technology is only utilized for load shifting and peak shaving.
As shown in Figure 11, in the ‘no-storage’ and ‘grid-storage’ scenarios, the observed trends in total costs and emission are similar at solar penetration levels below 60%. With a higher solar target, the overall cost gradually increases while emission is significantly reduced, as is expected. The more storage technologies are available, the faster emissions decrease and the lower costs are, as they allow solar capacity to be integrated more efficiently and in locations with a better solar resource.
Table 8 presents the cost savings that result from including distribution-connected storage. This shows a significant cost saving which increases monotonically with the solar target. At an 80% solar target, the cost is reduced by $7.5 billion in the ‘all-storage’ case while much lower savings of around ($0.22 billion) are obtained by integrating only grid-size storage. This observation indicates the benefits of co-locating small-scale battery storage with distributed solar PV (DPV) in the distribution network. Grid-scale storage by itself does not have significant benefits, because without distribution-connected storage the most economical solar capacity is simply not available.
3.2.2. Transmission Investment
Next, we demonstrate the impact of battery storage HC enhancement on line investment, comparing the ‘grid-only’ and ‘all-storage’ scenarios. Figure 12 shows the relationship between transmission line reinforcement and battery storage investment. In both scenarios (‘grid-only’ and ‘all-storage’) we observe a non-linear trend. When the solar target is low, little line investment is necessary, as the current system suffices. As the solar target increases, line investment helps integrate solar energy more efficiently; storage and solar technologies complement each other. However, very high solar penetration levels can only be achieved with a more evenly distributed amount of solar capacity, helped by some investment in storage, in which case the additional value of line investment is lower. Hence, at a solar penetration level exceeding 60% solar penetration battery grid-scale storage becomes a substitute for line investment—storage enables a more local energy system, requiring less large-scale transmission investment.
However, an opposite trend can be observed in the ’all-storage’ scenario. First of all, note that grid-size storage is not invested in here, for two reasons. Firstly, its cost is comparatively higher than the combined cost of small scale storage and DPV. Secondly, small scale battery storage allows higher utilization of cheaper solar energy by increasing the HC limit. As a result, significant DSO owned and home storage are connected to the low-level network. At a low solar target (10–40%), connecting more small-scale battery storage in the network enables deferring line investment but at a higher solar penetration, line investment and battery storage are complementing each other to ensure system flexibility in the transmission and distribution network, respectively.
This opposite effect requires a more detailed explanation. In the ’all-storage’ case, the excess solar energy from DPV is stored either in DSO owned or home storage which reduces the intermittent effect of non-dispatchable solar generation in the network. The stored energy is discharged from these small-scale stores (DSO owned and distributed domestic storage) during the peak demand period. In this scenario, a significant load shifting and demand clipping within the peak period occurs, as is shown in Figure 13.
For this reason, new OCGT generators, which are generally utilized as peaker plant, are not as necessary in this scenario. Table 9 shows the optimal mix for both scenarios at 80% solar penetration; this clearly shows that the OCGT utilization level in ‘all-storage’ scenario is much lower than the other scenario. Also, as shown in Figure 14, investment in OCGT and LPV is significantly reduced as more DPV and distributed small-scale battery storage are connected to the distribution network. Instead, additional line capacity is constructed to fully utilize cheaper energy generated from LPV and non-OCGT conventional (new and existing) generators including hydro, coal and CCGT. This explains why a relatively higher transmission investment is observed in this scenario.
4. Conclusions
In this paper, we have proposed and demonstrated an integrated planning model that allows distribution network hosting capacity (HC) constraints to be included in long term grid planning. This is important especially in countries such as Malaysia where distribution-connected solar PV capacity is expected to play a large role in the energy mix. Current grid planning methods generally do not consider distribution network constraints and, as a result, distribution system operators are facing increasing difficulties managing voltages and reverse power flows. Our model quantifies the effects of these distribution network constraints, their interactions with transmission and distribution level investment. Furthermore, we demonstrate the impact of integrating a large amount of distributed small-scale battery storage for use as hosting capacity enhancement in the distribution network to quantify its benefit in terms of overall system costs. We apply our model to a stylized representation of the Malaysian grid, where solar energy is expected to play a particularly large role.
From our findings, we conclude that distribution network constraints (HC limits) have a significant impact on the overall grid planning outcome and increase the cost by almost $12 billion which does not depend significantly on the level of storage integration. Omitting HC limits would allow reverse power flows from distribution network to the transmission network which does not represent the actual practice in network planning and operation.
Considering distribution network constraints (HC limit), we evaluate the effect of integrating battery storage at different network levels (distribution and transmission) on the optimal solution. Although the benefit of incorporating battery storage in grid planning has been widely covered, our integrated approach provides additional evidence on the substitutability and complementary of storage and line investment. At a higher solar penetration level, incorporating only grid-size battery storage in grid planning results in significant line investment deferral which means that battery storage substitutes for investment. However, the inclusion of small-scale battery storage (DSO owned and distributed domestic storage) in grid planning produces a different result. Like large-scale storage, small-scale battery storage substitutes for investment at a lower solar penetration level (10–40%). However, above 40% solar target, small-scale battery storage acts as a complement the line investment.
Finally, we quantify a cost saving of up to $7.76 billion depending on solar target from using distributed small-scale battery storage (HC enhancement). In this paper, we show that different levels of battery storage in the network have a different impact on the optimal grid planning, and we explicitly quantify the benefit of connecting small-scale battery storage (HC enhancement) in the distribution network.
These results were obtained with a simplified model under a range of restrictive assumptions, and more research is necessary to generalize these. Firstly, we assume the objectives of transmission planners and generators are perfectly aligned which reflects the current setting in Malaysia but not necessarily elsewhere. A full bi-level optimization can address a different setting where both parties (transmission planner and generators) have different objectives. Secondly, future research should incorporate asset retirement including battery life-cycle restrictions, which may have a significant influence on the optimal planning solutions. Thirdly, a larger set of distribution network constraints could be considered, as well as a longer time horizon. Fourthly, as many model parameters are uncertain, a stochastic modeling approach could properly account for this—this would increase the model size but could be realized within our modeling framework. Finally, using the proposed framework, the benefits of integrating solar and storage systems can be further analyzed considering their interaction with demand-side management and load flexibility in smart grid systems.
However, although the results described above were obtained using a simplified representation of real-world networks and decisions, they do show the importance of distribution network constraints (HC limits) in grid planning and explicitly quantify the benefits of integrating distributed battery storage (HC enhancement). We expect our qualitative results to carry over to more complex settings.
Author Contributions
Conceptualization, S.N.M.S. and A.H.v.d.W.; Methodology, S.N.M.S.; Software, S.N.M.S.; Validation, S.N.M.S.; Formal analysis, S.N.M.S.; Investigation, S.N.M.S. and A.H.v.d.W.; Resources, S.N.M.S.; Data curation, S.N.M.S.; Writing—original draft preparation, S.N.M.S.; Writing—review and editing, S.N.M.S. and A.H.v.d.W.; Visualization, S.N.M.S.; Supervision, A.H.v.d.W.; Project administration, A.H.v.d.W.; Funding acquisition, S.N.M.S. and A.H.v.d.W.
Funding
This research was funded by Commonwealth Scholarship Commission in the UK through grant number MYCS-2016-344 and by the UK Engineering and Physical Research Council through grant EP/P001173/1 (Centre for Energy Systems Integration).
Conflicts of Interest
The authors declare no conflict of interest.
Abbreviations
The following abbreviations are used in this manuscript:
| ACF | Average capacity factor |
| ANM | Active network management |
| DER | Distributed energy resource |
| DPV | Distributed solar PV |
| DS | DSO owned storage |
| DSO | Distribution service operator |
| ESS | Energy storage system |
| GS | Grid-size storage |
| HS | Distributed domestic storage |
| HC | Hosting capacity |
| LPV | Large solar PV |
| KCL | Kirchhoff’s current law |
| KVL | Kirchhoff’s voltage law |
| PV | Photovoltaic |
References
- Ismael, S.M.; Abdel Aleem, S.H.; Abdelaziz, A.Y.; Zobaa, A.F. State-of-the-art of hosting capacity in modern power systems with distributed generation. Renew. Energy 2019, 130, 1002–1020. [Google Scholar] [CrossRef]
- Ismael, S.M.; Aleem, S.H.; Abdelaziz, A.Y.; Zobaa, A.F. Probabilistic hosting capacity enhancement in non-sinusoidal power distribution systems using a hybrid PSOGSA optimization algorithm. Energies 2019, 12, 1018. [Google Scholar] [CrossRef]
- Bollen, M.H.; Rönnberg, S.K. Hosting capacity of the power grid for renewable electricity production and new large consumption equipment. Energies 2017, 10, 1325. [Google Scholar] [CrossRef]
- Lumbreras, S.; Ramos, A. The new challenges to transmission expansion planning. Survey of recent practice and literature review. Electr. Power Syst. Res. 2016, 134, 19–29. [Google Scholar] [CrossRef]
- Go, R.S.; Munoz, F.D.; Watson, J.P. Assessing the economic value of co-optimized grid-scale energy storage investments in supporting high renewable portfolio standards. Appl. Energy 2016, 183, 902–913. [Google Scholar] [CrossRef] [Green Version]
- Munoz, F.D.; Sauma, E.E.; Hobbs, B.F. Approximations in power transmission planning: Implications for the cost and performance of renewable portfolio standards. J. Regul. Econ. 2013, 43, 305–338. [Google Scholar] [CrossRef]
- Weijde, A.H.V.D.; Hobbs, B.F. The economics of planning electricity transmission to accommodate renewables: Using two-stage optimisation to evaluate fl exibility and the cost of disregarding uncertainty. Energy Econ. 2012, 34, 2089–2101. [Google Scholar] [CrossRef]
- Burgholzer, B.; Auer, H. Cost/benefit analysis of transmission grid expansion to enable further integration of renewable electricity generation in Austria. Renew. Energy 2016, 97, 189–196. [Google Scholar] [CrossRef]
- Moreno, R.; Street, A.; Arroyo, J.M.; Mancarella, P. Planning low-carbon electricity systems under uncertainty considering operational flexibility and smart grid technologies. Philos. Trans. R. Soc. A Math. Phys. Eng. Sci. 2017, 375, 20160305. [Google Scholar] [CrossRef]
- Saad, S.N. Integrated Grid Planning Model with High Distributed Solar PV. In Proceedings of the 2019 IEEE Milan PowerTech, Milan, Italy, 23–27 June 2019; pp. 1–6. [Google Scholar]
- Schill, W.P.; Zerrahn, A.; Kunz, F. Prosumage of Solar Electricity: Pros, Cons, and the System Perspective. IAEE 2017, 6, 36. [Google Scholar] [CrossRef]
- Bustos, C.; Sauma, E.; Contreras, J. Energy storage and transmission expansion planning: Substitutes or complements ? IET Gener. Transm. Distrib. 2018, 12, 1738–1746. [Google Scholar] [CrossRef]
- Hill, C.A.; Such, M.C.; Chen, D.; Gonzalez, J.; Grady, W.M.K. Battery energy storage for enabling integration of distributed solar power generation. IEEE Trans. Smart Grid 2012, 3, 850–857. [Google Scholar] [CrossRef]
- Zhuo, W.; Savkin, A.V. Profit Maximizing Control of a Microgrid with Renewable Generation and BESS Based on a Battery Cycle Life Model and Energy Price Forecasting. Energies 2019, 12, 2904. [Google Scholar] [CrossRef]
- Bozalakov, D.; Mnati, M.J.; Laveyne, J.; Desmet, J.; Vandevelde, L. Battery storage integration in voltage unbalance and overvoltage mitigation control strategies and its impact on the power quality. Energies 2019, 12, 1501. [Google Scholar] [CrossRef]
- Gercek, C.; Reinders, A. Smart appliances for efficient integration of solar energy: A Dutch case study of a residential smart grid pilot. Appl. Sci. 2019, 9, 581. [Google Scholar] [CrossRef]
- Suh, J.; Hwang, S.; Jang, G. Development of a transmission and distribution integrated monitoring and analysis system for high distributed generation penetration. Energies 2017, 10, 1282. [Google Scholar] [CrossRef]
- Jain, H.; Rahimi, K.; Tbaileh, A.; Broadwater, R.P.; Jain, A.K.; Dilek, M. Integrated transmission & distribution system modeling and analysis: Need & advantages. In Proceedings of the 2016 IEEE Power Energy Society General Meeting, Boston, MA, USA, 17–21 July 2016; pp. 1–5. [Google Scholar] [CrossRef]
- Huang, Q.; Vittal, V. Integrated Transmission and Distribution System Power Flow and Dynamic Simulation Using Mixed Three-Sequence/Three-Phase Modeling. IEEE Trans. Power Syst. 2017, 32, 3704–3714. [Google Scholar] [CrossRef]
- Li, Z.; Guo, Q.; Sun, H.; Wang, J.; Xu, Y.; Fan, M. A Distributed Transmission-Distribution-Coupled Static Voltage Stability Assessment Method Considering Distributed Generation. IEEE Trans. Power Syst. 2018, 33, 2621–2632. [Google Scholar] [CrossRef]
- Mathieu, J.L. Modeling and Optimal Operation of Distributed Battery Storage in Low Voltage Grids. IEEE Trans. Power Syst. 2017, 32, 4340–4350. [Google Scholar] [Green Version]
- Macrae, C.; Ozlen, M.; Ernst, A. Transmission Expansion Planning Considering Energy Storage. In Proceedings of the 2014 IEEE International Autumn Meeting on Power, Electronics and Computing (ROPEC), Ixtapa, Mexico, 5–7 November 2014. [Google Scholar] [CrossRef]
- Nguyen, M.Y.; Nguyen, D.H.; Yoon, Y.T. A new battery energy storage charging/discharging scheme for wind power producers in real-time markets. Energies 2012, 5, 5439–5452. [Google Scholar] [CrossRef]
- Luo, X.; Wang, J.; Dooner, M.; Clarke, J. Overview of current development in electrical energy storage technologies and the application potential in power system operation. Appl. Energy 2015, 137, 511–536. [Google Scholar] [CrossRef] [Green Version]
- Colman, A.; Wilson, D.; Chung, D. Planning the Distributed Energy Future: Emerging Electric Utility Distribution Planning Practices for Distributed Energy Resources; Black & Veatch and Smart Electric Power Alliance (SEPA): Washington, DC, USA, February 2016; pp. 1–26. [Google Scholar]
- Malaysia Energy Commission. Peninsular Malaysia Electricity Supply Industry Outlook 2014; Technical Report; Energy Commission: Putrajaya, Malaysia, 2014.
- Malaysia Energy Commission. Peninsular Malaysia Electricity Supply Industry Outlook 2016; Technical Report; Energy Commission: Putrajaya, Malaysia, 2016.
- Malaysia Energy Commission. Malaysia Energy Statistics Handbook 2015; Technical Report; Energy Commission: Putrajaya, Malaysia, 2015.
- Chang, Y.; Li, Y. Power generation and cross-border grid planning for the integrated ASEAN electricity market: A dynamic linear programming model. Energy Strategy Rev. 2013, 2, 153–160. [Google Scholar] [CrossRef]
- Dugan, R.C.; Institute, E.P.R. OpenDSS Manual. Train. Mater. 2016, Program Revision: 7.6. 1–184. [Google Scholar]
- Pfenninger, S.; Staffell, I. Long-term patterns of European PV output using 30 years of validated hourly reanalysis and satellite data. Energy 2016, 114, 1251–1265. [Google Scholar] [CrossRef] [Green Version]
- Tie, C.H.; Gan, C.K.; Ibrahim, K.A.; Shamshiri, M. Probabilistic evaluation of the impact of residential photovoltaic system on Malaysia low-voltage network using Monte Carlo approach. J. Renew. Sustain. Energy 2015, 7. [Google Scholar] [CrossRef]
- Wong, J.; Lim, Y.S.; Tang, J.H.; Morris, E. Grid-connected photovoltaic system in Malaysia: A review on voltage issues. Renew. Sustain. Energy Rev. 2014, 29, 535–545. [Google Scholar] [CrossRef]
- Hall, D.; Lutsey, N. Effects of Battery Manufacturing on Electric Vehicle Life-Cycle Greenhouse Gas Emissions. ICCT Briefing, Electric Vehicles, 12 February 2018. Available online: https://www.theicct.org/publications/EV-battery-manufacturing-emissions (accessed on 25 August 2019).
- Kawamoto, R.; Mochizuki, H.; Moriguchi, Y.; Nakano, T.; Motohashi, M.; Sakai, Y.; Inaba, A. Estimation of CO2 Emissions of internal combustion engine vehicle and battery electric vehicle using LCA. Sustainability 2019, 11, 2690. [Google Scholar] [CrossRef]
- U.S. Energy Information Administration. U.S. Battery Storage Market Trends; Technical Report; U.S. Department of Energy: Washington, DC, USA, May 2018.
- Department of Statistics Malaysia. Economic Census 2016; Technical Report; The Office of Chief Statistician Malaysia, Department of Statistics Malaysia: Putrajaya, Malaysia, 2017.
- Malaysia Energy Commission. National Energy Balance 2014; Technical Report; Energy Commission: Putrajaya, Malaysia, 2014.
- Malaysia Energy Commission. Malaysia Energy Statistics Handbook 2017; Technical Report; Energy Commission: Putrajaya, Malaysia, 2017.
- International Energy Agency (IEA). World Energy Outlook Special Report: Southeast Asia Energy Outlook Southeast Asia Energy Outlook; Technical Report; International Energy Agency (IEA): Paris, France, 2015. [Google Scholar]
- IRENA (2019). Renewable Power Generation Costs in 2018; Technical Report; International Renewable Energy Agency: Abu Dhabi, UAE, 2018. [Google Scholar]
- IRENA (2017). Electricity Storage and Renewables: Costs and Markets to 2030; Technical Report; International Renewable Energy Agency: Abu Dhabi, UAE, October 2017. [Google Scholar]
Figure 1.
Integrated grid planning model flowchart.

Figure 2.
Model timeline on decision stages.

Figure 3.
Mathematical representation of an example network.

Figure 4.
Hosting capacity assessment model.

Figure 5.
Malaysia transmission & distribution network model.

Figure 6.
Demand patterns.

Figure 7.
Solar profile by nodes.

Figure 8.
Distributed domestic storage state of charge.

Figure 9.
Optimal solution with and without hosting capacity (HC) limit: (a) total cost ($ billion) and (b) proposed line invesment.
Figure 9.
Optimal solution with and without hosting capacity (HC) limit: (a) total cost ($ billion) and (b) proposed line invesment.

Figure 10.
Spatial distribution of solar photovoltaic (PV) and battery storage for: (a) Grid-size storage and (b) All storage types.
Figure 10.
Spatial distribution of solar photovoltaic (PV) and battery storage for: (a) Grid-size storage and (b) All storage types.

Figure 11.
Expected cost ($ billion) and emission at set solar target.

Figure 12.
Line and battery storage investment.

Figure 13.
Energy mix at 80% solar target for: (a) Grid-size storage and (b) All storage types.

Figure 14.
Tranmission investment and generation mix.


Table 1.
Nomenclature.
| Set and indices | Parameters | ||
|---|---|---|---|
| L | Corridor, l | Capital cost of new generation k ($/MW) | |
| Corridor, l connected to distribution node, | Transmission investment cost ($/MW/km) | ||
| N | Nodes, n | Generation cost type k (USD/MWh) | |
| K | Generator types, k | Capital cost of new battery storage b($/MW) | |
| E | Model stages, e | ESS discharge cost type b (USD/MWh) | |
| T | Years, t | Carbon price ($/t) | |
| P | Time block (hour), p | i | Discount rate (1/yr) |
| Distribution nodes | N | Model horizon (hours) | |
| Conventional generator types | Electricity demand at node n (MW) | ||
| Solar PV generator | Susceptance of corridor l | ||
| Distributed solar PV generator | Carbon emission by plant type k (t/MWh) | ||
| B | Battery storage, b | Initial transmission capacity (MW) | |
| Domestic battery storage, b | Initial battery capacity (MW) | ||
| Variables | Initial generators at node n (MW) | ||
| Total cost at stage e ($) | Load factor for each generator type k | ||
| New transmission investment (MW) | Hourly solar pattern (per unit) | ||
| Capacity of new plant stage (MW) | Renewable target (%) | ||
| Generation of plant stage (MW) | Allowed DPV (%) at node | ||
| Generation of Solar plant stage (MW) | Allowed ESS (%) at node | ||
| Reactive power flow stage (MW) | Ramping limit by technology, k (MW/hour) | ||
| Voltage angle between nodes (radian) | Roundtrip efficiency of battery storage type, b | ||
| Energy not supplied (load shed) at node n, period e (MW) | Energy capacity of battery storage b | ||
| Solar energy spillage (MW) | Voltage limits at distribution node |
Table 2.
Power plant cost and technical characteristic—2015.
| Plant Type | Load Factor (%) | Emission (tonne/MWh) | Operation Cost ($/MWh) | Capital Cost ($Million/MW) | Ramping Rate (MW/hr) |
|---|---|---|---|---|---|
| Biomass | 38 | 0.093 | 40.28 | 2.26 | 240 |
| CCGT | 59 | 0.353 | 39.46 | 0.82 | 960 |
| Coal | 46 | 0.748 | 23.15 | 2.08 | 240 |
| Diesel | 55 | 0.54 | 49.7 | 1.14 | 420 |
| Hydro | 64 | 0 | 2.14 | 3.54 | 9000 |
| OCGT | 32 | 0.53 | 72.4 | 0.68 | 3000 |
| LPV | 17 | 0 | 2 | 2.43 | N/A |
| DPV | 17 | 0 | 0 | 2.43 | N/A |
Table 3.
Generator installed capacity (MW).
| Node | Biomass | CCGT | Coal | Diesel | Hydro | OCGT | LPV | DPV |
|---|---|---|---|---|---|---|---|---|
| 1 | 650 | |||||||
| 2 | 5.41 | |||||||
| 3 | 3.95 | |||||||
| 4 | 14.13 | 660 | 3080 | 9.77 | ||||
| 5 | 14.39 | 1943 | 1486 | 900 | 820 | 54.02 | ||
| 6 | 23.4 | 1584 | 1400 | 2.2 | 436.4 | 34.41 | ||
| 7 | 1411 | 434 | 15.57 | |||||
| 8 | 17.85 | 1042 | 2100 | 210 | 10.4 | |||
| 9 | 16.83 | 275 | 7.31 | |||||
| 10 | 6.38 | 20.89 | ||||||
| 11 | 1029 | 650 | 5.62 | |||||
| 12 | 44.3 | 480 | 171.96 | 614.8 | 867.6 | 0.3 | ||
| 13 | 54.19 | 1034.2 | 332.8 | 97.86 | 18.14 |
Table 4.
Distribution network characteristics.
| Characteristic | Quantity |
|---|---|
| Power Transformer Rating | 30 MVA |
| Total Load | 17.1 MW |
| Power Factor | 0.97 |
| Average Cable Length | 1 km–2 km |
Table 5.
Demand and resource availability.
| Node | Peak Demand (MW) | Demand Category | Resource Availability | ||||||||||
|---|---|---|---|---|---|---|---|---|---|---|---|---|---|
| Total | Tx Node | Dx Node | Tx Node | Dx Node | B | Cc | Co | D | H | O | L | D | |
| 1 | 92.29 | 4.61 | 87.67 | I | R | 1 | 1 | 1 | 1 | ||||
| 2 | 1033.18 | 103.32 | 929.86 | I | R | 1 | 1 | ||||||
| 3 | 1633.90 | 490.17 | 1143.73 | I | R | 1 | 1 | ||||||
| 4 | 1464.51 | 366.13 | 1098.38 | I | R | 1 | 1 | 1 | 1 | 1 | 1 | 1 | |
| 5 | 7291.07 | 2916.43 | 4374.64 | C | R | 1 | 1 | 1 | 1 | 1 | 1 | ||
| 6 | 769.92 | 115.49 | 654.43 | I | R | 1 | 1 | 1 | 1 | 1 | 1 | ||
| 7 | 697.09 | 34.85 | 662.24 | I | R | 1 | 1 | 1 | 1 | ||||
| 8 | 2927.71 | 731.93 | 2195.78 | I | R | 1 | 1 | 1 | 1 | 1 | 1 | ||
| 9 | 720.41 | 144.08 | 576.33 | I | R | 1 | 1 | 1 | |||||
| 10 | 402.73 | 60.41 | 342.32 | I | R | 1 | 1 | 1 | 1 | 1 | |||
| 11 | 428.20 | 42.82 | 385.38 | R | R | 1 | 1 | 1 | |||||
| 12 | 2288.00 | 343.20 | 1944.80 | C | R | 1 | 1 | 1 | 1 | 1 | 1 | 1 | 1 |
| 13 | 914 | 91.40 | 822.60 | C | R | 1 | 1 | 1 | 1 | 1 | 1 | 1 | |
| Tx-Transmission | R-Residential | Co-Coal | L-Large PV | ||||||||||
| Dx-Distribution | D-Diesel | D-Distributed PV | |||||||||||
| I-Industrial | 1-Available | H-Hydro | Cc-CCGT | ||||||||||
| C-Commercial | Blank-Not Available | O-OCGT | B-Biomass | ||||||||||
Table 6.
Battery storage characteristics.
| Battery Type | Battery Hour | Roundtrip Efficiency (%) | Operation Cost ($/MWh) | Capital Cost ($Million/MW) |
|---|---|---|---|---|
| Large-scale | 4 | 0.8 | 6 | 2.43 |
| DSO-owned | 2 | 0.8 | 5 | 1.53 |
| Domestic | 3 | 0.8 | 0 | 0.94 |
Table 7.
Summary of planning scenario.
| Year | Operating Cost | Capital Cost | Line Investment Cost | Demand Growth | Carbon Price (USD/tonne) | RE Target (% of Total Electricity Production) |
|---|---|---|---|---|---|---|
| 2025 | Conv & Hydro −15% | Conv & Hydro −10% | −30% | 50% | 15 | 20% |
| Bio −30%, LPV −30% | Bio −20%, LPV −20% | |||||
| DPV −30%, Gs −30% | DPV −30%, Gs −20% | |||||
| Ds −30% | Ds −30%, Hs −35% | |||||
| 2035 | Conv & Hydro −20% | Conv & Hydro −15% | −50% | 70% | 30 | 40% |
| Bio −35%, LPV −35% | Bio −25%, LPV −30% | |||||
| DPV −40%, Gs −35% | DPV −50%, Gs −30% | |||||
| Ds −40% | Ds −50%, Hs −55% | |||||
| Conv-conventional plant | Gs- Grid size battery storage | |||||
| RE-renewable plant | Ds-DSO owned battery storage | |||||
| LPV-Large PV | Hs-Domestic battery storage | |||||
| DPV-Distributed PV | ||||||
Table 8.
Cost savings ($ billion).
| Solar Target (%) | All Storage | Grid Storage |
|---|---|---|
| 0 | 0.29 | 0 |
| 10 | 0.72 | 0 |
| 20 | 1.15 | 0 |
| 30 | 2.3 | 0 |
| 40 | 3.02 | 0 |
| 50 | 3.96 | 0 |
| 60 | 4.72 | 0.02 |
| 70 | 6.37 | 0.22 |
| 80 | 7.76 | 0.22 |
Table 9.
Optimal solution at 80% solar target.
| Technology | Grid Storage | All Storage | ||||||||
|---|---|---|---|---|---|---|---|---|---|---|
| Energy st 3 (GWh) | Energy (%) | New Capacity (GW) | Total Capacity (GW) | ACF | Energy st 3 (GWh) | Energy (%) | New Capacity (GW) | Total Capacity (GW) | ACF | |
| Biomass | 0.00 | 0.00 | 0.00 | 0.19 | 0.00 | 0.00 | 0.00 | 0.00 | 0.19 | 0.00 |
| CCGT | 387.60 | 22.21 | 15.37 | 25.00 | 0.32 | 385.72 | 22.60 | 15.37 | 25.00 | 0.32 |
| Coal | 107.79 | 6.18 | 0.00 | 8.55 | 0.26 | 108.06 | 6.33 | 0.00 | 8.55 | 0.26 |
| Diesel | 3.39 | 0.19 | 0.00 | 0.50 | 0.14 | 3.42 | 0.20 | 0.00 | 0.50 | 0.14 |
| Hydro | 204.14 | 11.70 | 3.27 | 9.00 | 0.47 | 205.61 | 12.05 | 3.27 | 9.00 | 0.48 |
| OCGT | 47.81 | 2.74 | 2.89 | 5.66 | 0.18 | 9.09 | 0.53 | 0.00 | 2.77 | 0.07 |
| LPV | 855.13 | 48.99 | 115.02 | 115.02 | 0.15 | 740.07 | 43.36 | 97.68 | 97.68 | 0.16 |
| DPV | 139.58 | 8.00 | 19.78 | 19.96 | 0.15 | 254.67 | 14.92 | 34.69 | 34.88 | 0.15 |
© 2019 by the authors. Licensee MDPI, Basel, Switzerland. This article is an open access article distributed under the terms and conditions of the Creative Commons Attribution (CC BY) license (http://creativecommons.org/licenses/by/4.0/).
Share and Cite
MDPI and ACS Style
Md Saad, S.N.; van der Weijde, A.H. Evaluating the Potential of Hosting Capacity Enhancement Using Integrated Grid Planning modeling Methods. Energies 2019, 12, 3610. https://doi.org/10.3390/en12193610
AMA Style
Md Saad SN, van der Weijde AH. Evaluating the Potential of Hosting Capacity Enhancement Using Integrated Grid Planning modeling Methods. Energies. 2019; 12(19):3610. https://doi.org/10.3390/en12193610
Chicago/Turabian StyleMd Saad, Syahrul Nizam, and Adriaan Hendrik van der Weijde. 2019. "Evaluating the Potential of Hosting Capacity Enhancement Using Integrated Grid Planning modeling Methods" Energies 12, no. 19: 3610. https://doi.org/10.3390/en12193610
Note that from the first issue of 2016, this journal uses article numbers instead of page numbers. See further details here.