Evaluating the Efficiency of Transit-Oriented Development Using Network Slacks-Based Data Envelopment Analysis


1
Department of Civil and Environmental Engineering, Seoul National University, Seoul 08826, Korea
2
Institute of Engineering Research, Seoul National University, Seoul 08826, Korea
3
Department of Civil and Environmental Engineering and Institute of Construction and Environmental Engineering, Seoul National University, Seoul 08826, Korea
*
Author to whom correspondence should be addressed.
Energies 2019, 12(19), 3609; https://doi.org/10.3390/en12193609
Submission received: 19 June 2019
/
Revised: 16 August 2019
/
Accepted: 15 September 2019
/
Published: 21 September 2019
(This article belongs to the Special Issue Environmental and Energy Efficiency Evaluation Based on Data Envelopment Analysis (DEA))
Abstract
:The purpose of this research is to evaluate transit-oriented development (TOD) efficiency in Seoul using the network slacks-based measure data envelopment analysis (NSBM DEA) model. The smartcard data and socio-economic data are used to evaluate the transit efficiency of 352 subway station areas in Seoul. To measure the TOD efficiency, the two-stage network is designed with the transit design stage and the transit efficiency stage. The overall efficiency score of each station area is estimated through each score of the stage. The results of the efficiency evaluation by station area indicate that the overall efficiency score average is 0.349, with the transit design score and efficiency score estimated to be 0.453 and 0.245, respectively. The results indicate that the balance of each stage is crucial to achieve an efficient station in the concept of transit efficiency. With the efficiency scores of the 352 subway station areas, the TOD efficiency is also evaluated by the administrative units in Seoul. The results of district analysis reveal that the top 10 efficient administrative units are characterized by both residential and commercial land use. The results indicate that efficiency is found to be good in areas having both residential and commercial characteristics.
1. Introduction
Transit-oriented development (TOD) is a strategy of urban development that maximizes the transit accessibility to urban areas within walking distance [1]. The main purpose of TOD is to increase transit user comfort and alleviate automobile use by creating an accessible public transportation environment within the city [2]. Moving towards a transit-oriented approach, personal mobility can be prevented and looking in the long-term, more sustainable cities can be built [3].
TOD is practiced in densely populated areas with high demand for transit system facilities such as subway and bus stations. When planning a new public transportation system, organizers must first contemplate the socio-economic characteristics of the area and plan transportation facilities accordingly to the population density, land use, commercial facilities, and residences in the area [4]. The travel demand for transit systems increases when stations are newly introduced into an urban area. Early TODs focused on increasing the connectivity between urban planning and public transit to address problems such as urban sprawl, traffic congestion, and environmental degradation [5]. The development of the TOD concept was aimed at urban planning with a focus on public transit within the city [6]. Historically, TOD has been recognized as an efficient development strategy in terms of the transit environment and socio-economic characteristics [7]. Calthorpe [1] stated that research on public transit use via high-density, multi-purpose land-use patterns could help shape a culture toward becoming a transit-friendly environment. This concept considered the regional factors, such as population density, complex land use, trip purpose, trip frequency, trip demand, and mode [2]. Also, various studies established the TOD evaluation criteria to achieve a more efficient and sustainable transit environment and solve complex urban problems. Most previous research stated that efficient and sustainable transit must balance the social and economic aspects of the transportation environment [8,9,10]. It means that land use, population density, and residential environment should be closely examined in urban planning [9]. To maximize efficiency at the economic level, transit capacity must be met and maintained to minimize the consumption of resources [11]. The efficiency of TOD also has been explored in previous studies [12,13,14,15,16,17,18]. They established one or more indicator variables to quantify the efficiency of TOD strategies. Renne and Wells [16] identified various useful TOD indicators from monitoring successive TODs. Galelo et al. [17] found that travel volume was one of the most representative indicators for evaluating TOD efficiency. However, Yu et al. [18] suggested that a single indicator had a limitation to effectively measure the performance of TOD efficiency and multi-indicators were required.
The massive data created by the Internet of Things (IoT) in cities now enables data scientists to analyze the objective functions of TOD. With its data-driven approaches, data envelopment analysis (DEA) has been widely used to measure the effectiveness of the operation or management of transportation systems [19]. DEA has a significant advantage compared to parametric models as it does not require weight parameters to measure efficiency [20]. The merit of DEA is its simplicity in estimating efficiency with multiple inputs and outputs [19]. DEA also has merit compared to the parametric model. The parametric model assumes a specific production function for the relationship between input and output [18]. However, DEA does not make assumptions about the production function and the given data are utilized to estimate the production relationship between input and output [21]. Therefore, it is possible to avoid the error of setting the type of distribution according to the arbitrary judgment of the analyst. It is possible for the network DEA model to be designed in the order of stages which is required for the evaluation process [22,23]. It is also used with the slacks-based measure (SBM) model for direct comparisons between the observations [24]. The early DEA models have the disadvantage that the inefficiency cannot be directly compared between different observations [25], but the SBM model allows direct comparison between different observations by measuring efficiency based on the slack ratio [26].
The evaluation of the efficiency of the transit system has been performed in previous studies using DEA model [27,28,29,30,31]. With the introduction of automatic fare collection (AFC) system, the data-driven approach for the transit-related analysis has become possible [32]. Various kinds of data, i.e., smartcard data, socio-economic data, and geographical data, were combined to evaluate the efficiency of TOD [33]. Transit efficiency was defined through the relationship between multiple inputs and outputs [34]. Transit efficiency refers to how well the transit system was introduced and managed with respect to the socio-economics, transit infrastructures, and transit trips of each station area [8]. Regarding the TOD concept, both transit design and efficiency must be considered to determine transit efficiency [16,17].
The purpose of this research is to evaluate transit efficiency in Seoul using the network slacks-based measure (NSBM) DEA model. The smartcard data and socio-economic data were used to evaluate the transit efficiency of 352 subway station areas in Seoul. The evaluation process is developed as a two-stage network with transit design and efficiency stage. In the evaluation process, the two-stage NSBM DEA model was used to measure efficiency. The two-stage network constructed with transit design stage and transit efficiency stage. With the results gathered from each stage, the overall efficiency was measured to evaluate the transit efficiencies of the subway station areas. Each station evaluated were grouped by each Seoul administrative unit and ranked based on its TOD efficiency.
2. Methodology for Evaluating Transit Efficiency
2.1. Concept of Data Envelopment Analysis (DEA)
DEA is a nonparametric method for estimating production frontiers. The DEA model identifies relative efficiencies using a number of input and output variables [20,21]. The purpose of measuring efficiency using the DEA model is to determine the strategy of an enterprise, organization, or industry. The first DEA model was developed to evaluate the efficiency and increase production for farm yield in the UK [25]. With respect to productivity, DEA has been applied to linear programming and has been used in various fields [35]. The relative efficiencies of decision-making units (DMUs) were determined and their performances compared. The original model was known as the Charnes, Cooper & Rhodes (CCR) model, which was employed to achieve constant returns to scale (CRS). Since the CRS condition assumes that the unit of production is kept constant at the optimal scale, the input and output are scaled proportionally. The CCR model is the most important model as it shows the most abbreviated methodological features. The CCR model estimates a ratio that can reduce the input as much as possible while keeping the output constant, and vice-versa. For example, there are some considerations to estimate the efficiency score with the input-oriented CCR model. The efficiency score is estimated by summing the weights of the output variables. The summed weights of output variables are between 0.0 and 1.0 score. With the observed stations ( = 1, …, ), each station produces the outputs using inputs. The ratio of the input value versus output value is the efficiency score and the objective function is to minimize the which is the reduced ratio of the input variables of target station . The input-oriented CCR model, therefore, measures the weights of input and output variables to minimize the , and the efficiency score is estimated by weights of variables. The maximum value of the efficiency score is equal to or less than 1.0 value with the constraints, i.e., and . The efficient stations consist of the production frontier, and the inefficient stations improve efficiency in the near direction of the production frontier. In other words, the efficient stations are the reference group that the inefficient station benchmarks to improve its efficiency. The mathematical expression of the input-oriented CCR model is as follows:
subject to:
where is the efficiency score of the target station area , ( = 1, …, ) is the number of observed station areas, is the output number of each variable ( = 1, …, ) of a station area , is the input variable ( = 1, …, ) of a station area , is the output variable of a station area , is the intensity vector of station area , is the slack vector of the input variable , is the slack vector of the output variable .
2.2. Network Slacks-Based Measure DEA
The NSBM DEA is used to measure the efficiency of the network that consists of two or more stages. In general, measuring the efficiency with DEA model involves two stages, an input stage, and an output stage. However, network DEA has more than two stages that include intermediate processes [22,23]. These intermediate processes are linking activities that occur in stages of production or that occur internally in DMUs. In other words, the output results of the first stage can be applied to the second stage as inputs for the final result [22]. If the network becomes complex, early DEA models had a limitation with only contain one stage while the network DEA solves this problem by having multiple stages [24]. Since the transit system also has a complex network, the network DEA is suitable for measuring transit efficiency.
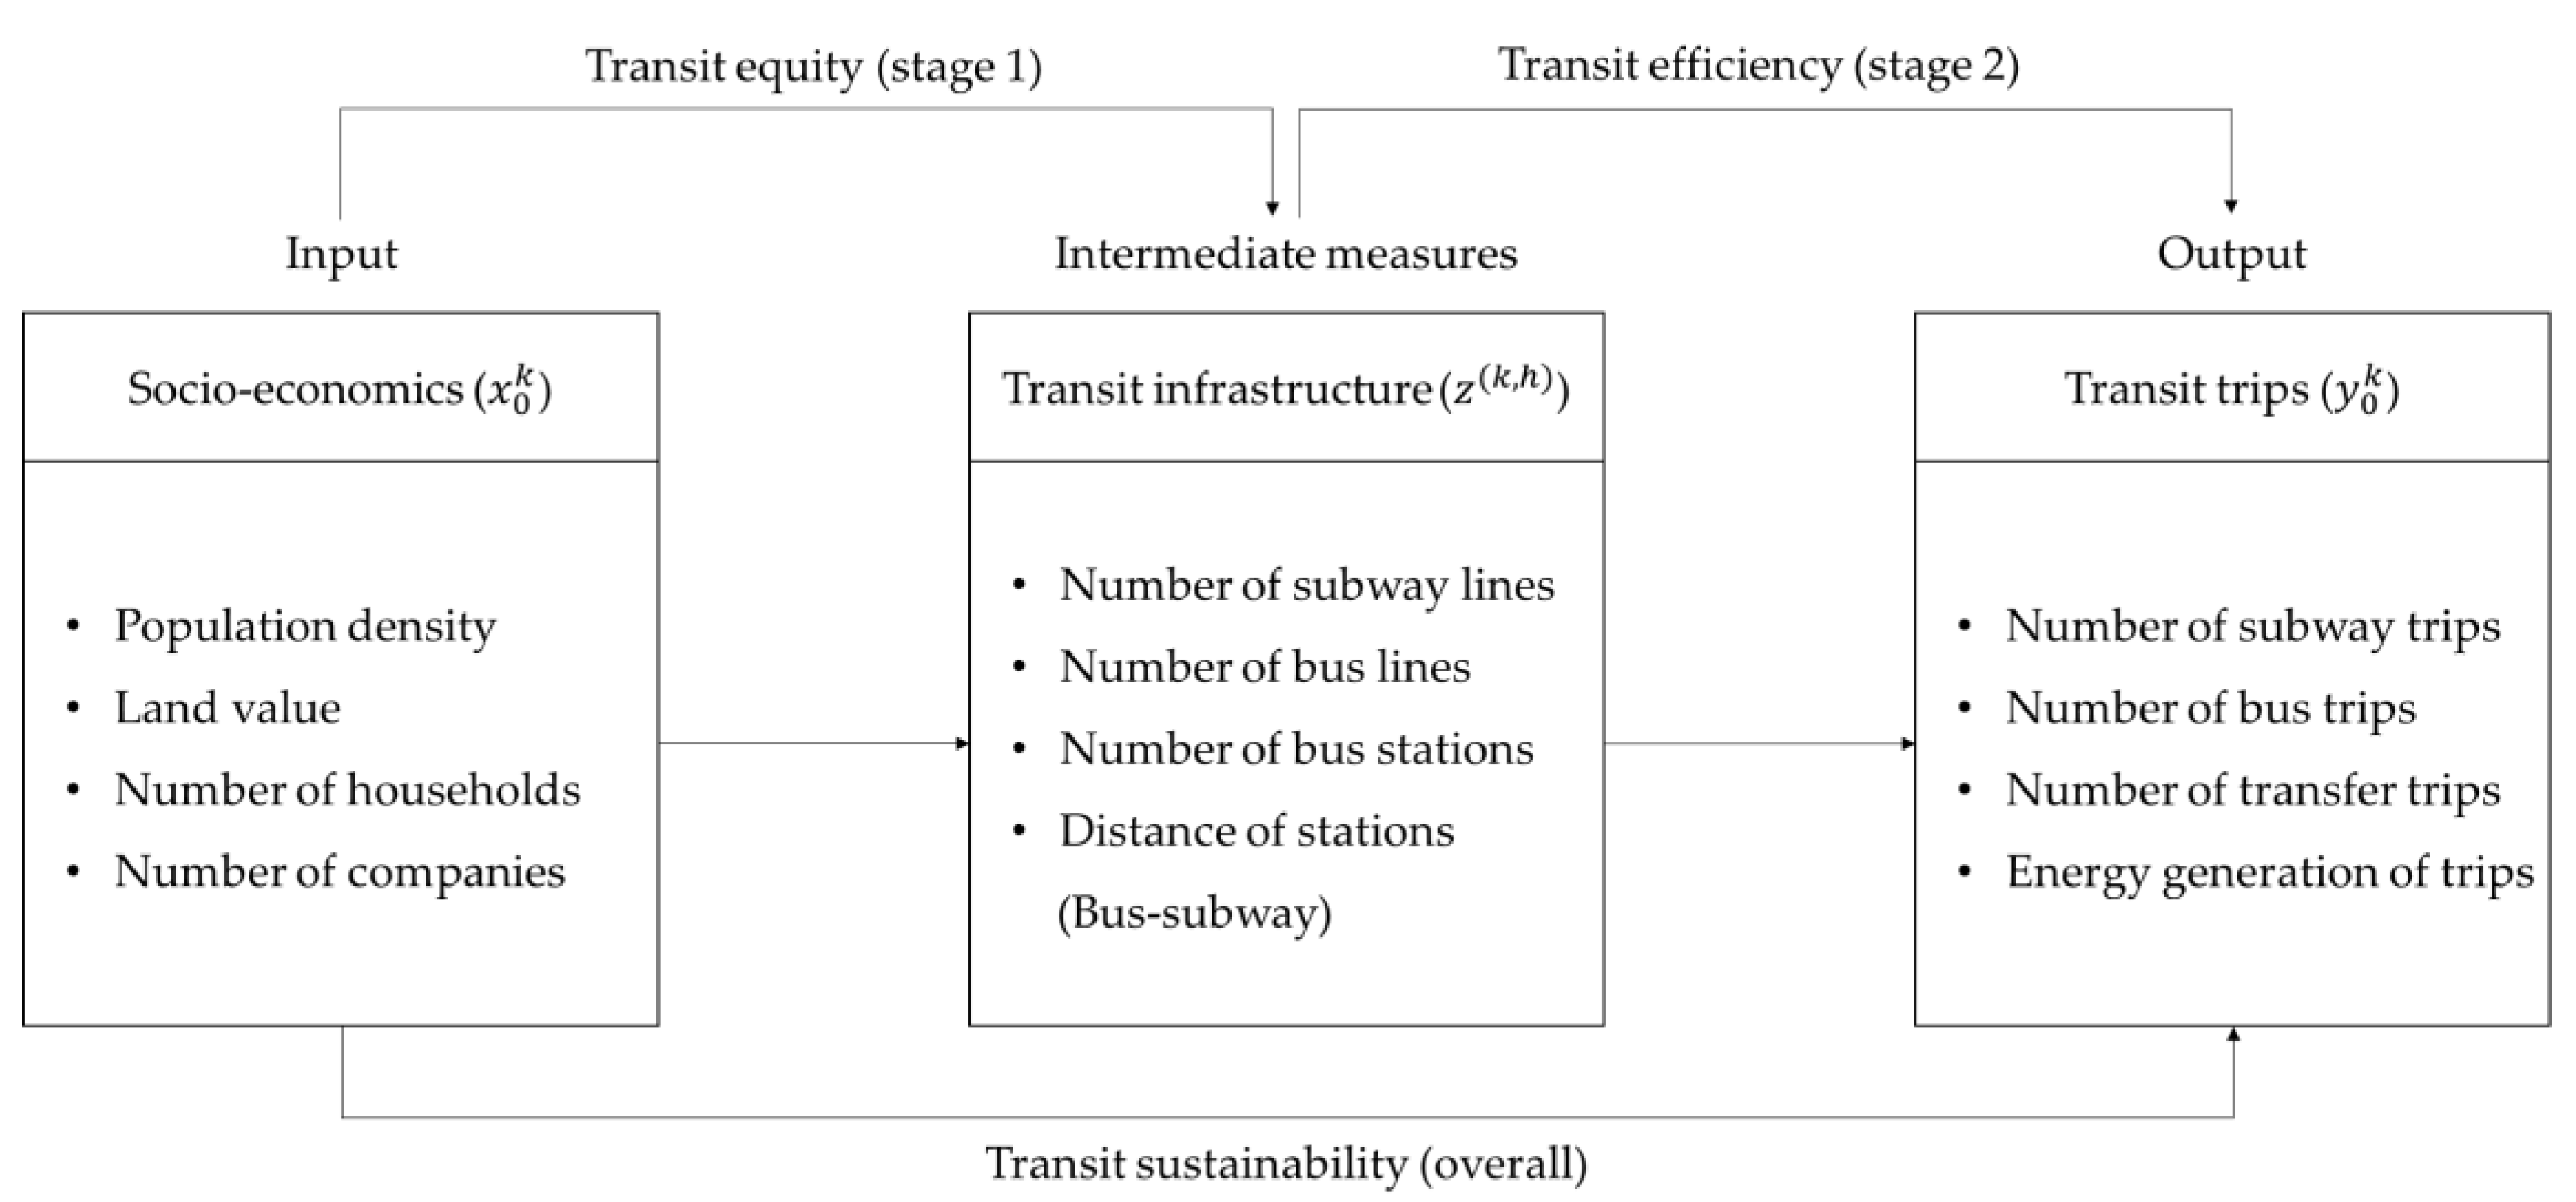
The transit infrastructure relative to the socio-economic is important in terms of the transit design [36]. Transit efficiency is defined as the number of transit trips relative to the infrastructures [37]. In this research, the transit design and transit efficiency stages were designed to measure transit efficiency. The process of TOD proceeds with three factors, i.e., socio-economic, transit infrastructure, and transit trip [11]. First, the socio-economic factors are examined to find the area where the transit is needed. Second, the transit infrastructures are built to the area selected from the socio-economic factors. Finally, the transit trips are derived through the socio-economic and transit infrastructures. These three factors are grouped by two stages which are transit design stage and transit efficiency stage. Figure 1 shows the framework of the process used to evaluate transit efficiency. The first stage, the transit design stage was measured by comparing the transit infrastructures with socio-economic factors. For the second stage, the transit efficiency was estimated by comparing the transit trips with transit infrastructures. The overall efficiency score is obtained by the average sum or weighted multiplication of each stage output from the design and efficiency stage. The weight of each stage can be determined by the purpose of the research or the characteristics of the subject [38]. Regarding the TOD evaluation, a bunch of previous studies considered the transit-related factors at the same level [11,12,13]. Since the concept of TOD considers design and efficiency at the same level, the importance of both stages is considered equal. In this research, identical weights are given at both stages in this research, i.e., and . In other words, the assumption is made that both the transit design and efficiency stages are equal contributors to the overall efficiency score. With this assumption, the comprehensive efficiency of the station area could be obtained with consideration of the transit design and efficiency.
The production possibility set of network DEA is denoted as and its mathematical expression is shown in Equations (2)–(7). The term is an intermediate measure for evaluating transit efficiency, and Equation (5) show their mathematical expressions. The is applied to in this study, since the network framework for measuring the TOD efficiency requires a connection link from the transit design stage to the transit efficiency stage. Equation (5) describes an intermediate measure such as the weights of outputs from the design stage and inputs for the efficiency stage. Equation (6) is used to determine the variable returns to scale (VRS) condition. In the absence of Equation (6), CRS is assumed:
where is the production possibility set, () is the number of stages that = 1 is the transit design stage and = 2 is the transit efficiency stage, ( = 1, …, ) is the number of observed station areas, is the input variable of station area of stage , is the output variable of station area of stage , is the connection link from transit design stage to transit efficiency stage, is an intermediate measure from the transit design stage to transit efficiency stage, is the intensity vector corresponding to stage , is the outputs from the transit design stage, and is the inputs to the transit efficiency stage.
The SBM DEA is a widely used model for evaluating efficiency [23]. Network DEA with a slacks-based approach was first developed by Tone and Tsutsui [22], and this model is called NSBM DEA model. The NSBM DEA model evaluates efficiency using the input and output slack. The slack is the difference value amount from the desired value amount from the actual input and output variables [24]. The two slack values are estimated irrespective of the variable unit and are calculated as an efficiency measure using the average of the reduced inputs and the average of the increased outputs. Since input and output variables have different units, slack values are converted to ratio values by dividing the original observation values. NSBM DEA is performed by calculating the slack between observations and production changes. NSBM DEA is referred to as a SBM because it is calculated based on the slack between the observations and production changes. The most important feature of NSBM DEA is that the measure of efficiency does not change even when the units of the input or output variables change. This is because the input or output slack is calculated as a ratio and is thus independent of the unit. Compared to the early DEA models, SBM model has the advantage of allowing direct comparison between different DMUs [23]. Since the efficiency score of early DEA model is estimated by adding the slacks of variables with different units, the inefficiency cannot be directly compared between different DMUs [28]. The efficiency of SBM model is measured by adding the slack ratio. Since SBM model uses the slack ratio of each variable, the efficiency can be measured regardless of the units of the variables [24].
NSBM DEA has three variations, i.e., the non-, input-, and output-oriented models. These three models can be employed depending on the objective or the features of the variables. In this research, we used the output-oriented SBM, for which the output direction is improving efficiency. The output-oriented SBM measures efficiency by fixed inputs and maximizing outputs. Since the outputs of each stage of transit analysis are required by the given conditions, the use of the output-oriented SBM is reasonable for determining the transit design and efficiency scores. It is difficult to change land use or eliminate existing facilities. Therefore, it is necessary to derive efficiency rankings by maximizing the output variables of each stage. NSBM DEA is widely used for evaluating relative efficiencies because it measures the efficiencies of DMUs. Given the transit system features mentioned above, the NSBM DEA model is suitable for evaluating transit efficiency. The mathematical expression for measuring transit efficiency is shown in Equation (8).
subject to:
where is the overall efficiency score of station area , ( = 1, 2) is the number of the stages that = 1 is the transit design stage and = 2 is the efficiency stage, is the relative weight of stage , is the input variable of station area of stage , is the output variable of the station area of stage , is the intensity vector corresponding to the stage , is the slack vector of the input variable of the stage , and is the slack vector of the output variable of the stage .
3. Data Description
3.1. Description of Smartcard Data
The government of Seoul has been operating the AFC system such as the smartcard system since 2004. The transit fare from the origin to destination is charged based on the total distance traveled by buses, subways, or both. Within the AFC system, travelers can use any combination of transit modes [31]. Since the transit system in Seoul has been operating as a 100% smartcard system, it is possible to extract 99% of the transit trip information. The smartcard data in Seoul records about 20 million individual transit trips per day. Each individual item of information is classified with respect to 36 categories, including card ID, boarding station, alighting station, boarding time, alighting time, etc. With the smartcard data, it is possible to obtain the numbers of subway, bus, bus–bus transfer, and subway–bus transfer trips. Since the smartcard data in Seoul include all transit users’ trips, it can be used to analyze transit efficiency by station area [27]. Among the 36 categories of smartcard data, 11 were used in this research. These 11 categories include the card ID, boarding station ID, alighting station ID, number of transfers, alighting time, alighting date, boarding time, boarding date, line ID, vehicle ID, and zone code. Table 1 shows the 36 categories of smartcard data in Seoul of which 11 were used in this research.
3.2. Description of Socio-Economic Data
The government of Seoul has been operating an open big-data portal since October 2013. This open big-data portal is an integrated data platform and provides the public with data about Seoul. Open big-data portal is available to anyone who has the desire to use it. The portal refers to all the data and information produced by public institutions such as public information. It facilitates communication and cooperation between all those interested. These open data are wide-ranging in scope, with information ranging from weather, geography, transportation, and food to historical documents and records. Open data related to socio-economic and environmental indicators are provided at the administrative and statistical aggregation district level. Seoul consists of 424 neighborhood areas, called dong, and each neighborhood is composed of one or more census areas. In this research, the census area unit is used to aggregate the population density, land value, number of households, and number of companies. There are 103,455 census area units in Seoul with an average area of 0.58 km2.
3.3. Data Preprocessing
The station areas of the 352 subway stations in Seoul were designated as DMUs in order to measure transit efficiency. The Enforcement Rules of the Urban Planning Ordinance of Seoul defines the station area as “an area within a 500 m radius from the center of stations such as subway, national railway, and light rail”. [39]. This standard was employed in several previous research related to the transit in Seoul [40,41]. Data preprocessing involved compiling these data by the station area. Transit and socio-economic data were obtained from both the smartcard and open data, respectively.
Socio-economic data from the open data portal were also compiled by the station area. Among the various open data, the population density, land value, number of households, and the number of companies were obtained for this research. Since all the obtained data were provided within census area units, it was necessary to aggregate the data values by the station area. The population density and land use values were compiled by averaging. The number of households and companies were aggregated by summing. From the result of preprocessing, the socio-economic data, population density, land value, the number of households, and the number of companies were determined to average: 34,249 (person/km2), 5903 (1000 won/m2), 5249 households, and 134 companies, respectively. Table 2 lists the descriptive statistics of the socio-economic data from the open-data portal.
The transit data consist of transit infrastructures and trips per transit stations. The infrastructure variables include the numbers of subway lines, bus lines, and bus stations, and the average distance between a bus stop and subway station. The transit trips data include the numbers of subway trips, bus trips, and transfer trips between subway and bus, and the energy consumption by transit trips.
Since there is an overlapping area between some station areas, the average distance between the bus and the subway stations and the number of transfer trips are included as a variable. The definition of energy consumption is the consumed energy by transit mode per trip [42]. The station area the transit energy consumption of the individual station area can be calculated. Since the transit modes consist of subway and bus, the energy consumption is obtained by the sum of each mode’s trips multiplied by the conversion factor. For the transfer trips, conversion factors of each mode are multiplied by each trip. The energy consumption by each station area was calculated using conversion factors, i.e., 0.7 for a subway trip (Mcal/trip), and 3.2 for a bus trip (Mcal/trip). These factors are provided by the Ministry of Trade, Industry and Energy of the Republic of Korea [42]. Figure 2 shows the heat-map of transfer trips on station area.
The data preprocessing results by station area for the numbers of subway lines, bus lines, and bus stations, and the distance between bus stops and subway stations yielded averages of 1.6 lines, 34 lines, 70 stations and 254 m, respectively. To identify the relationship between transit modes, the numbers of bus lines and stations were counted by types of buses, i.e., main bus, branch bus, or circulation bus. The numbers of subway trips, bus trips, and transfer trips, and energy consumption were 36,640 trips, 96,239 trips, 6164 trips, and 377,910 Mcal/trip, respectively. Table 3 lists the descriptive statistics of the transit data obtained from smartcard data.
4. Application
4.1. Results of Transit Efficiency
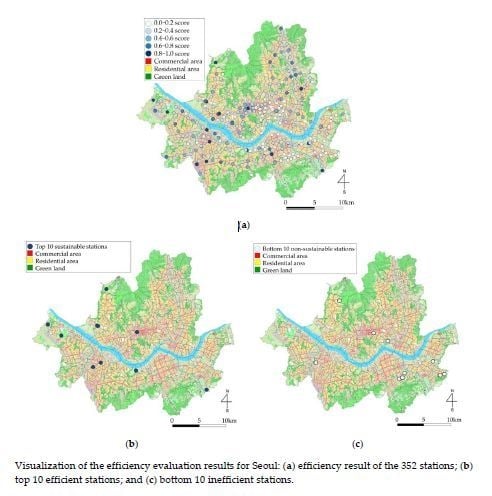
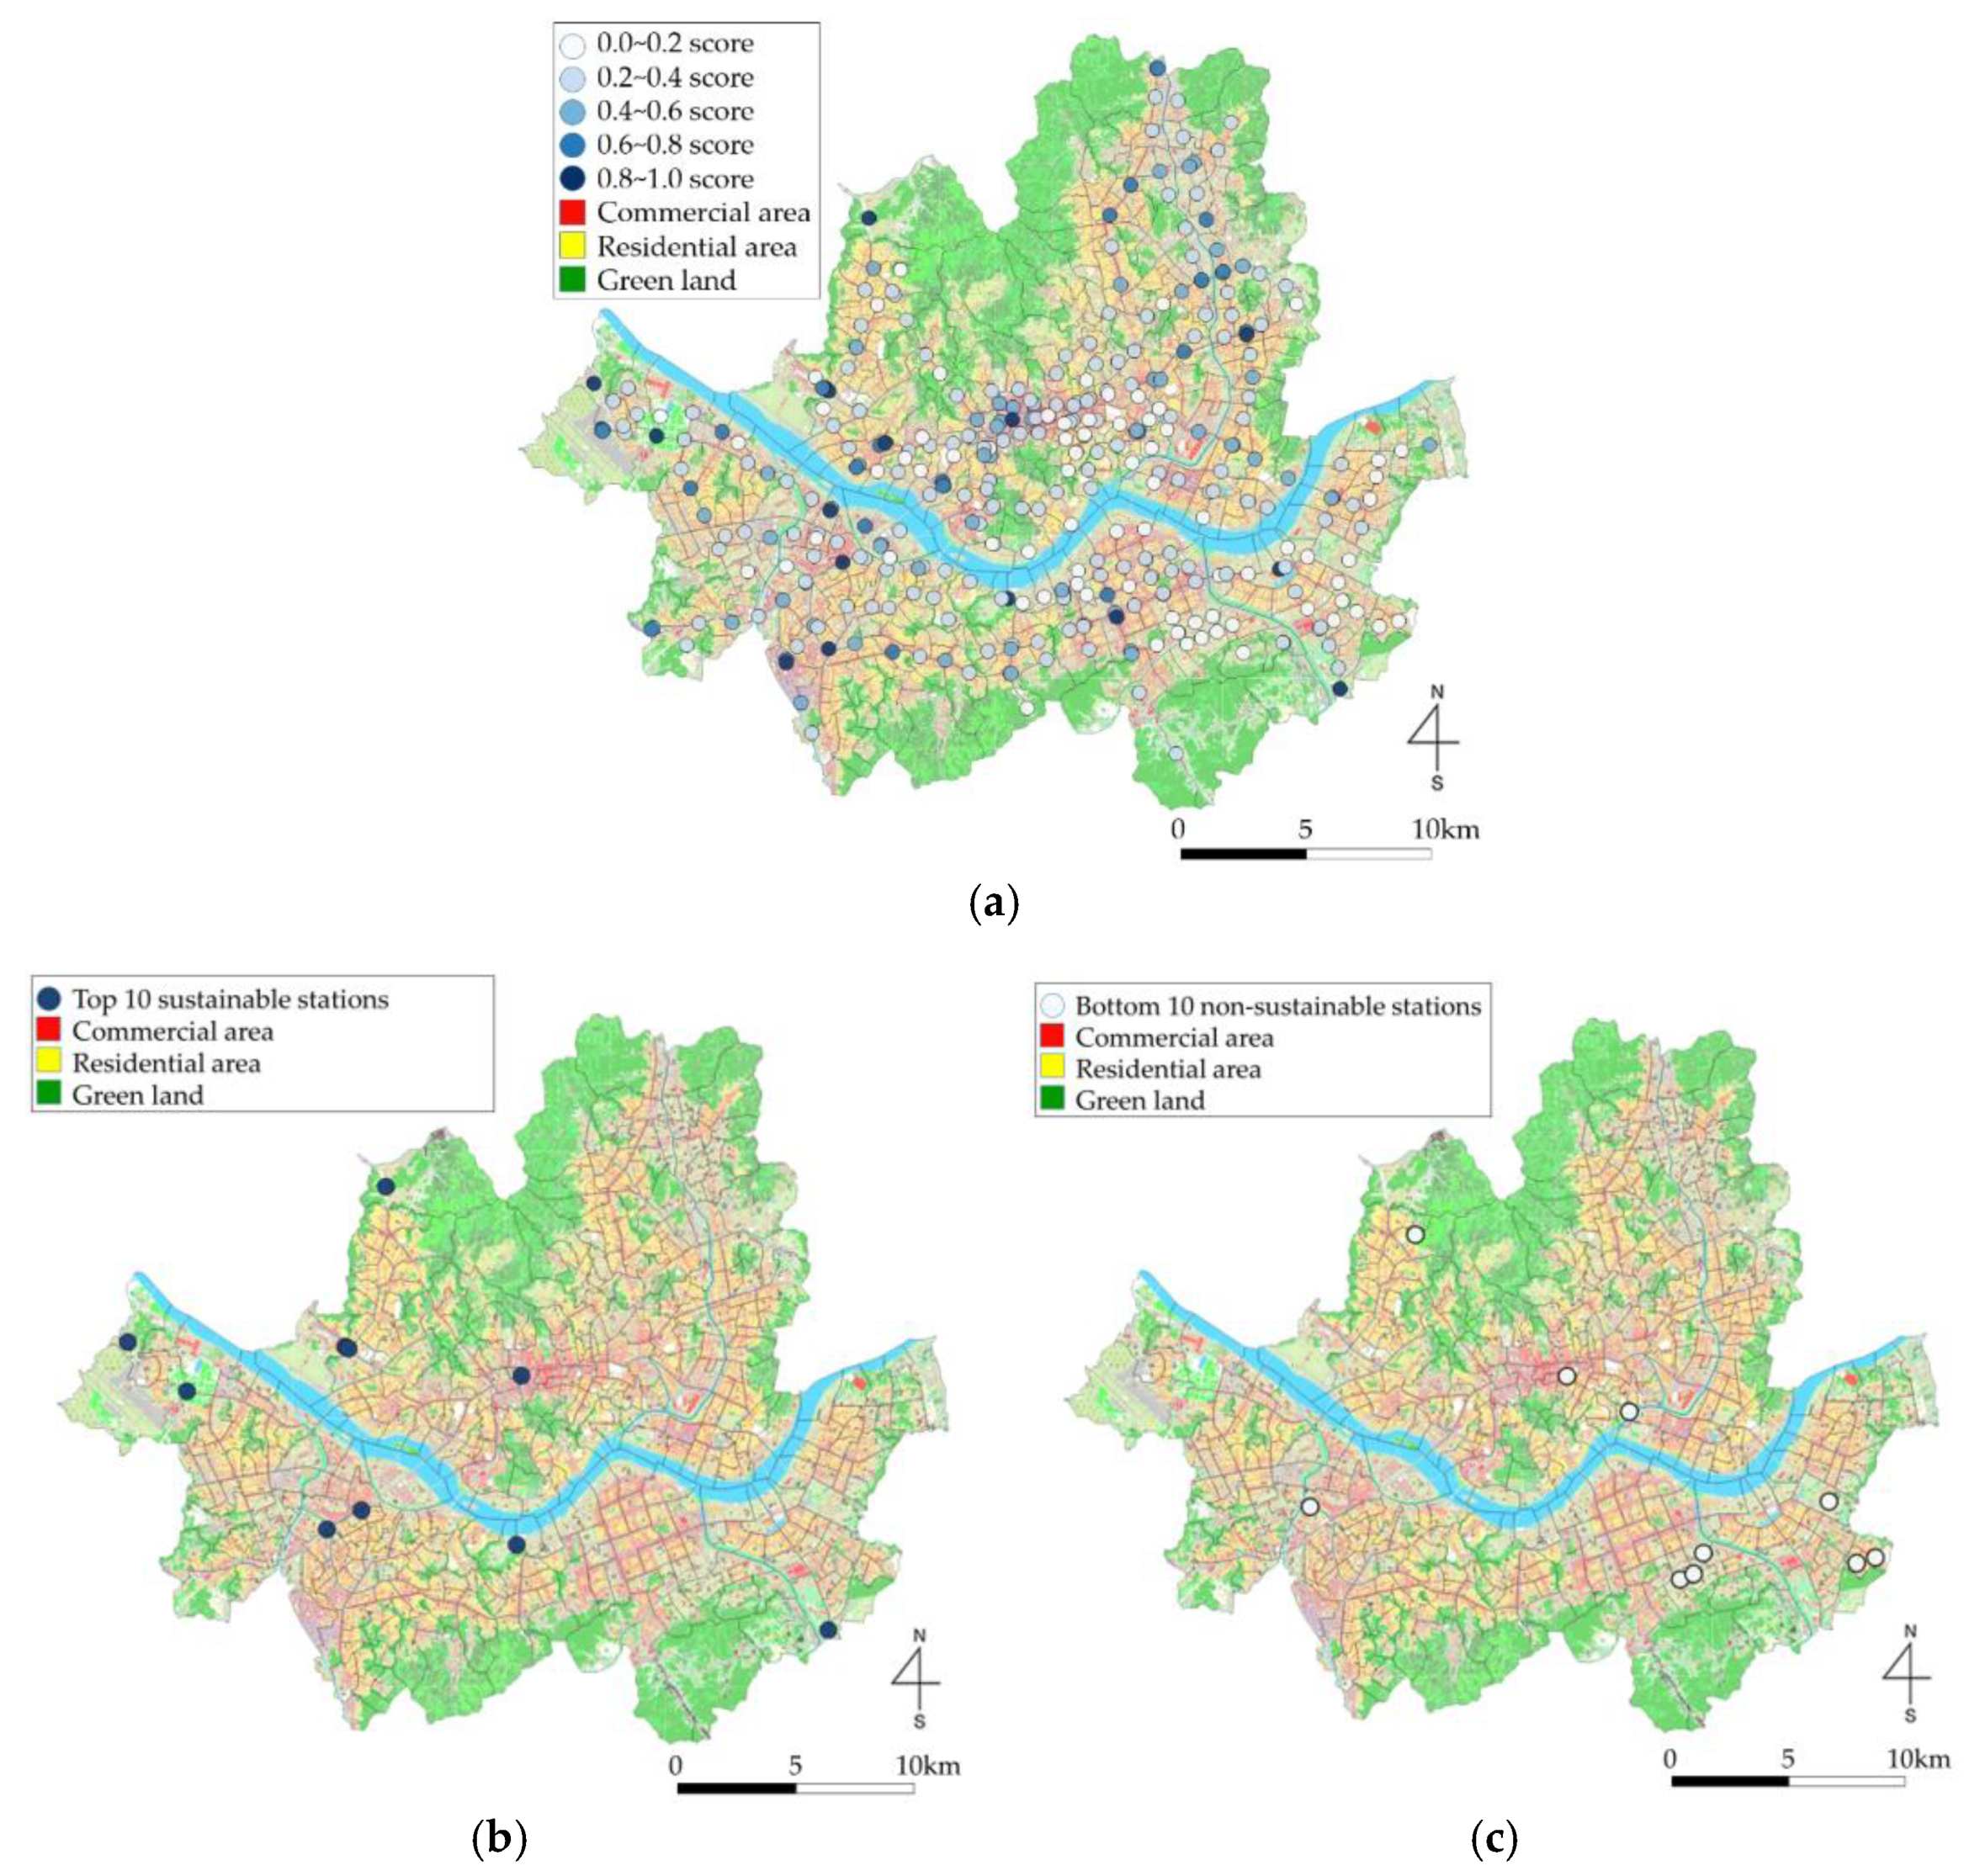
With the results of the NSBM DEA of this research, the overall efficiency score was obtained by the average sum or weighted multiplication of each stage output from the design and efficiency stages. Table 4 and Figure 3 show the efficiency evaluation results for the station areas in Seoul. Based on the efficiency evaluation results in Table 4, the average overall efficiency score is 0.349. The transit design and efficiency evaluation results average 0.453 and 0.245, respectively. Since the overall efficiency score is calculated using the transit design and transit efficiency scores, multiplying by a weight of 0.5 implies that the overall efficiency score is affected more by the design score rather than the efficiency score. Regarding the 0.349 score and 0.207 standard deviation (S.D.), there is clearly a large gap between the efficient and inefficient station areas in Seoul. The 10 station areas were determined to be efficient, i.e., Euljiro 1ga, Shindorim, Gupabal, Dongjak, Yeongdeungpo, Digital media city, Gasan digital, Magok, Bokjung, and Gaehwa station. The top 10 efficient stations are the DMUs with the highest scores of 1.000 in both the transit design and efficiency stages is served as benchmarks for the other 342 inefficient stations. As the means of the input variables for the top 10 efficient station areas, the population density, land value, number of households, and number of companies are 21,581 (person/ km2), 4478 (1000 won/m2), 2450 households, and 110 companies, respectively. The means of the intermediate variables for the top 10 efficient station areas are 1.8 subway lines, 55 bus lines, 91 stations, and 212 m distance between stations, respectively. The means of the output variables for the efficient station areas, i.e., the number of subway trips, bus trips, transfer trips, and energy consumption, are 182,420, 97,491, 11,747 trips and 439,666 Mcal/trip, respectively.
A comparison of the efficient station area scores for the 352 station areas shows that all the input variable scores of the efficient station areas are lower than the mean score of all the station areas. In particular, the population density and number of households in the efficient station areas are about 37% and 16% lower than the average value of all the station areas, respectively. From the statistics for the intermediate variables, the number of subway lines and bus stations are about 66% and 54% of the means for all the station areas, and the number of bus lines is almost the same as the mean for all the station areas. These efficient station areas have relatively low population densities and small household. Although the population densities and number of households are smaller than the average values for all the station areas, the transit infrastructures are also well constructed. This is the main reason that transit design is estimated to be high. From the statistics of the output variables, the number of subway trips, bus trips, and transfer trips, and the energy consumption are about 4.98, 1.01, 1.91, and 1.16 times higher, respectively, than the mean values for all the station areas. The transit efficiency score was estimated to be 1.000, since it has a small population density, number of households, and the number of transit infrastructures compared to the output variables. This is because the inputs are lower and outputs are higher than the means for all the station areas, respectively. Since both the design and efficiency scores were 1.000, the overall efficiency score was also estimated to be 1.000.
The balance of each stage is crucial to achieve an efficient station in the concept of transit efficiency. For instance, if the transit infrastructure is well established with low transit trips, the design stage scores will be high but the efficiency stage scores will be relatively low. On the contrary, if the transit infrastructure is not well established with high transit trips, the design stage scores will be low and the efficiency stage scores will be relatively high. Hence, the overall efficient stations have balance in both design and efficiency stage scores. From the results of the evaluation, overall efficient stations are usually located in areas that have a relatively low population density but have well-built transit infrastructures with high transit trips.
The bottom 10 inefficient station areas include Donrimcheon, Hakyoeul, Eungbong, Guryong, Gaepodong, Dongdaemoon, Olympic Park, Geoyeo, Macheon, and Dokbawi stations. These bottom 10 inefficient station areas are relatively estimated to be the lowest overall efficiency scores among the 352 station areas. These 10 relatively inefficient station areas are DMUs in which the TOD should take top priority in improvement. The overall average score of the bottom 10 inefficient station areas was 0.090, which indicates that an improvement of 99.1% is required. The averages of design and efficiency scores were 0.157 and 0.023, respectively, which means that about 84.3% of these areas are poorly designed and 98.8% are inefficient. When targeting the efficient station, transit infrastructure-related variables should be improved by 84.3% compared to the socio-economic related variables. The transit trip-related variables should also be increased by 98.8% compared to the infrastructure-related variables. For the input variables of the bottom 10 inefficient station areas, the population density, land price, number of households, and number of companies totaled 38,853 (persons/km2), 7300 (1000 won/m2), 5329 households, and 140 companies, respectively. The intermediate variables, which are the outputs of the design stage, i.e., numbers of subways, bus lines, and bus stations and the distance between bus stops and subway stations averaged 1.2 subway lines, 11 bus lines, 20 stations, and 258 m, respectively. For the outputs, the numbers of subway trips, bus trips, and transfer trips, and the energy consumption totaled 37,676, 57,391, and 511 trips, and 210,026 Mcal/trip, respectively.
A comparison of the statistics for the bottom 10 inefficient station areas with all the station areas was conducted. It shows that all the input values of the bottom 10 inefficient station areas are higher than the mean values of all the stations. With respect to the statistics for the intermediate variables, the numbers of subway lines, bus lines, and bus stations are about 1.3, 1.8, and 1.5 times more, respectively. The distance between bus stops and subway stations is about 13% less than the mean distance for all the station areas. However, the output variable values were lower than the mean values of the 352 station areas. Although the number of subway trips was similar to the mean value for all the station areas, the numbers of bus trips and transfer trips and the energy consumption were about 40%, 92%, 44% less, respectively, than the mean values for all the station areas. Since the population and number of households are higher than the mean values for all the station areas, transit infrastructures must be better equipped than the mean required for all 352 station areas. The transit efficiency scores are also very low since the output values do not meet the required number of transit infrastructures.
4.2. Discussion
Figure 4 shows the overall efficiency scores that consider both the design and efficiency stages. As mentioned above, station areas with a score between 0.000 and 0.200 have top priority for TOD improvement due to low design and efficiency scores. Based on the mean score for each stage, i.e., transit design and efficiency analysis, the DMUs were also divided into four groups to indicate the type of improvement needed at these station areas. In Figure 4b, we can see that both the design and efficiency scores of group 1 are lower than the mean value, which mean that station areas in group 1 need to improve both their design and efficiency. The station areas in group 2 need improvements in design more than efficiency. Station areas in group 3 can improve their overall efficiency by improving their efficiency, and stations areas in group 4 qualify as relatively efficient stations. The types of improvement required to achieve overall efficiency can be determined by the scores of each stage or by group analysis.
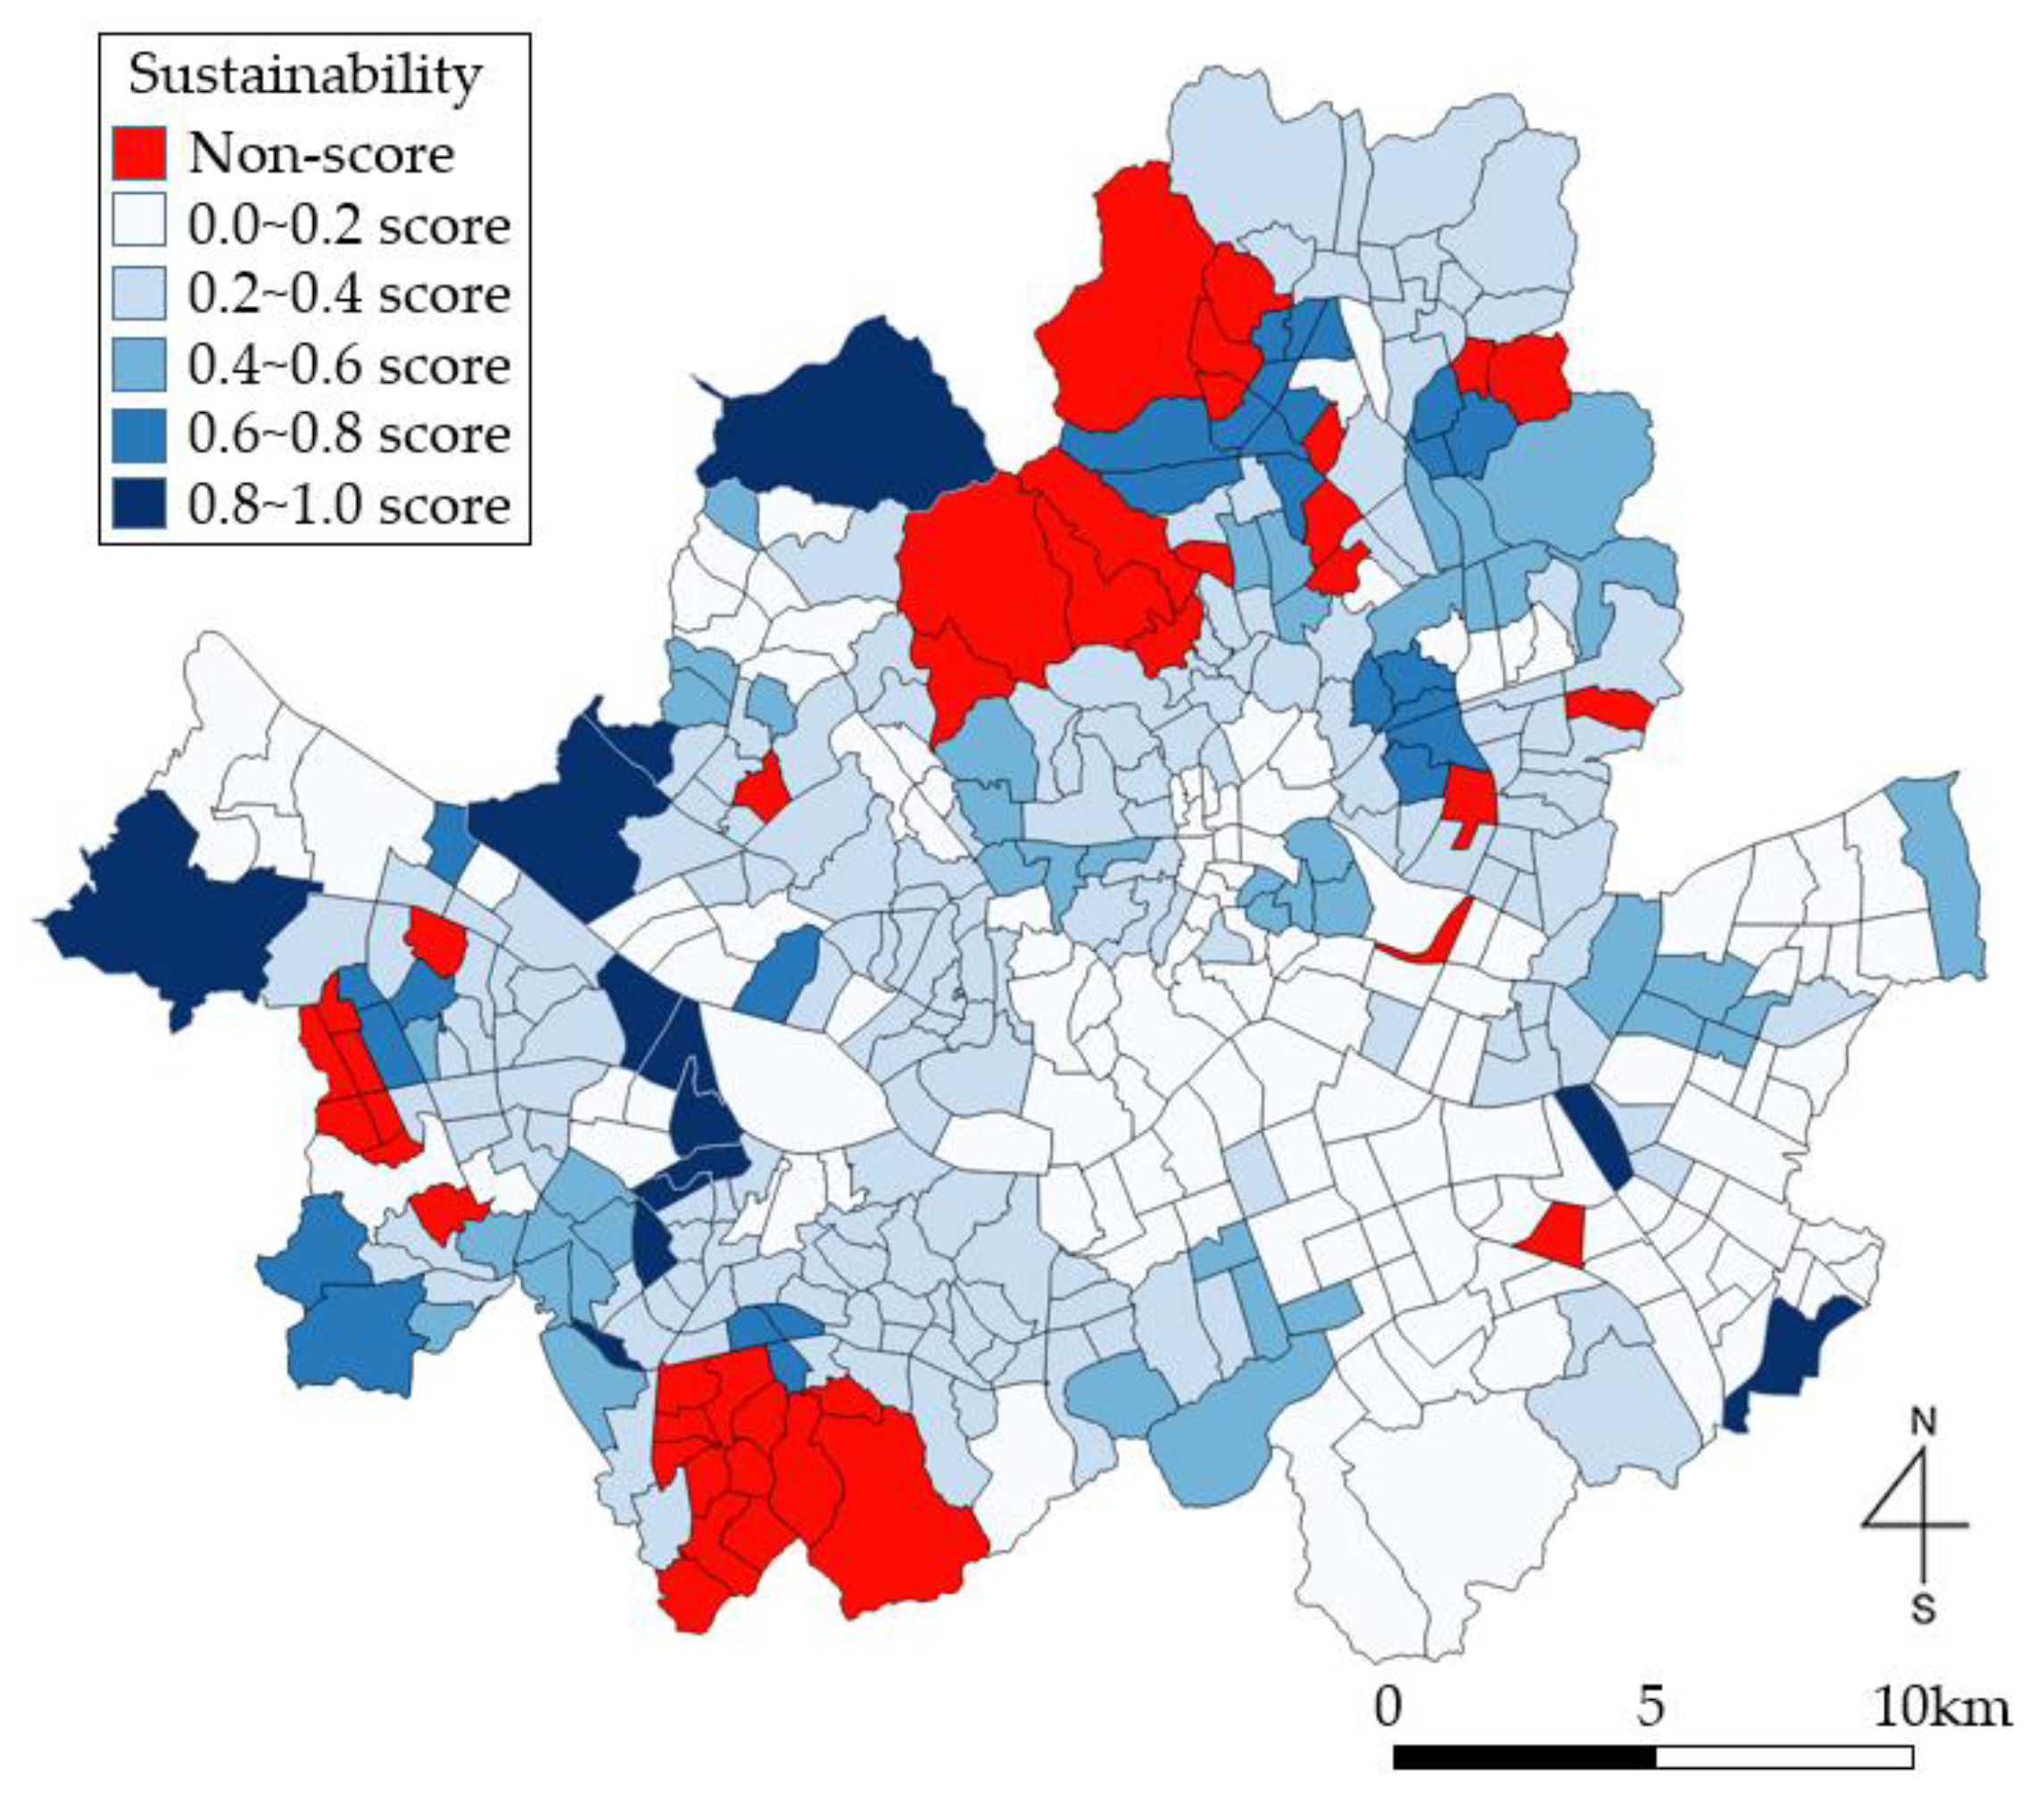
The analysis of an administrative unit is needed to practically evaluate the TOD priorities. Using the efficiency evaluation results of the station areas, it is also possible to analyze transit efficiency by the administrative units in Seoul. The dong unit is the smallest unit among the administrative units. The overall efficiency scores of the dong unit were obtained by averaging the scores of the relevant station areas.
The dongs were classified with respect to four dimensions, i.e., non-scoring, low-scoring, mid-scoring, and efficient, and land-use features of each dimension were identified by the socioeconomic variables of each dong. The overall efficiency scores of the dong unit are shown in Table 5 and Figure 5.
Figure 5 shows the results of the overall transit efficiency of Seoul by the 424 dong administrative units. Since the station areas were set within a 500-m radius, a station area could cover several dongs. Even though the no subway stations reside in the dong, the dong can be affected by the station area radius that spans multiple dongs. The efficiency score of each dong is estimated by calculating the average efficiency values of the station areas that reside or radius spans into the dong.
Eight dongs were estimated to be efficient, having earned a 1.000 overall efficiency score, i.e., Wirye-Dong, Gonghang-Dong, Sangam-Dong, Susek-Dong, Jinkwan-Dong, Daerim (3)-Dong, Dorim-Dong, and Yeongdeungpobon-Dong. These eight dongs can serve as reference DMUs for achieving efficient TOD. Regarding regional characteristics, efficient dongs have both residential and commercial land-use features. The top priority areas for TOD are the red dongs in Figure 5. These 41 dongs were estimated to be non-scoring areas since they contain no station areas. These non-scoring dongs do not have any station areas that reside or spans within the dong despite range being 500 m radius for the station area. Residents of the non-scoring dongs must first take a bus to make transit trips due to the lack of subway stations. Since only bus infrastructures have been established, these areas are at a disadvantage for improving their overall efficiency. With respect to land use characteristics, these top-priority dongs for TOD are mostly residential with a large number of households, i.e., 9478 households. The second-priority areas are the 79 low-scoring dongs, which earned overall efficiency scores in the 0.0 to 0.2 range. Although these 79 dongs were designed for TOD, their transit infrastructures, trips, and energy consumption must be improved to achieve efficient TOD. Regarding land use, these second-priority dongs also have commercial features and host a large number of companies, i.e., 2083 companies.
5. Conclusions
The government of Seoul has been operating the AFC system and open data platform since 2004 and 2013, respectively. These systems provide the opportunity to analyze the efficiency of station areas in terms of TOD. This research was conducted to evaluate the transit efficiency of subway station areas. A total of 352 subway stations within a 500-m radius in Seoul were analyzed. Socioeconomic data were obtained from the open data platform, i.e., population density, land value, number of households, and number of companies. Transit-related data were obtained from Seoul’s smartcard data, i.e., the number of subway lines, the number of bus lines, and the number of bus stations. Given the TOD concept, the transit efficiency evaluation was designed as a two-stage network slacks-based measure data envelopment analysis (NSBM DEA). The first stage was designed as a transit-design evaluation and the second stage was evaluated with respect to transit efficiency.
The results of the evaluation were as follows: the overall efficiency score and S.D. were estimated to be 0.349 and 0.207, respectively, which points to a large gap between the efficient and inefficient station areas in Seoul. The analysis results indicated that the eight efficient dongs were characterized by both residential and commercial land use. In addition, overall efficiency was found to be high in areas that have both residential and commercial characteristics. The non-scoring dongs were identified as having top priority for TOD, and the land-use features of these dongs are residential. Dongs with overall efficiency scores in the 0.0 to 0.2 range were designated as second-priority areas, and these dongs also have commercial features. Based on the results of the transit design and efficiency evaluation, it was possible to determine the TOD-related priorities for stations and dongs.
Considering the regional characteristics, development efforts are also required to improve overall efficiency. This research measured transit overall efficiency based on transit design and efficiency. From the results, recommendations regarding the TOD priorities and development directions were made by station areas. Although various factors were used to evaluate TOD efficiency, a variety of additional socioeconomic and transit factors must also be considered. In this study, we defined the station area as the area within a 500-m radius adjacent to a subway station based on previous literature. The overlapping areas may affect the results of the analysis. The score of a station area that contains multiple stations would be different from the score of a station area that only contains one station. Based on the sensitivity analysis, the effect of the station area should be investigated. The weight of each stage of NSBM DEA model can be also changed according to regional conditions, environment, and culture.
Author Contributions
For The authors confirm the contribution to the paper as follows: Study conception and design: E.H.L., H.S., S.-H.C., S.-Y.K., D.-K.K.; Data collection: E.H.L., H.S., S.-H.C., D.-K.K.; Analysis and interpretation of results: E.H.L., H.S., S.-Y.K., D.-K.K.; Draft manuscript preparation: E.H.L., H.S., S.-H.C., D.-K.K. All authors reviewed the results and approved the final version of the manuscript.
Funding
This research was supported by a grant from R & D Program of the Korea Railroad Research Institute, Korea.
Conflicts of Interest
The authors declare no conflict of interest.
References
- Calthorpe, P. The Next American Metropolis: Ecology, Community, and the American Dream; Princeton Architectural Press: New York, NY, USA, 1993. [Google Scholar]
- Nasri, A.; Zhang, L. The analysis of transit-oriented development (TOD) in Washington, DC and Baltimore metropolitan areas. Transp. Policy 2014, 32, 172–179. [Google Scholar] [CrossRef]
- Ewing, R.; Cervero, R. Travel and the built environment: A synthesis. Transp. Res. Rec. 2001, 1780, 87–114. [Google Scholar] [CrossRef]
- Papa, E.; Bertolini, L. Accessibility and Transit-Oriented Development in European metropolitan areas. J. Transp. Geogr. 2015, 47, 70–83. [Google Scholar] [CrossRef] [Green Version]
- Knowles, R.D. Transit Oriented Development in Copenhagen, Denmark: From the Finger Plan to Ørestad. J. Transp. Geogr. 2012, 22, 251–261. [Google Scholar] [CrossRef]
- Vale, D.S. Transit-oriented development, integration of land use and transport, and pedestrian accessibility: Combining node-place model with pedestrian shed ratio to evaluate and classify station areas in Lisbon. J. Transp. Geogr. 2015, 45, 70–80. [Google Scholar] [CrossRef]
- Sahu, A. A methodology to modify land uses in a transit oriented development scenario. J. Environ. Manag. 2018, 213, 467–477. [Google Scholar] [CrossRef] [PubMed]
- Li, Z.; Han, Z.; Xin, J.; Luo, X.; Su, S.; Weng, M. Transit oriented development among metro station areas in Shanghai, China: Variations, typology, optimization and implications for land use planning. Land Use Policy 2019, 82, 269–282. [Google Scholar] [CrossRef]
- Zhao, P. Sustainable urban expansion and transportation in a growing megacity: Consequences of urban sprawl for mobility on the urban fringe of Beijing. Habitat Int. 2010, 34, 236–243. [Google Scholar] [CrossRef]
- Wey, W.M.; Zhang, H.; Chang, Y.J. Alternative transit-oriented development evaluation in sustainable built environment planning. Habitat Int. 2016, 55, 109–123. [Google Scholar] [CrossRef]
- Cervero, R.; Kockelman, K. Travel demand and the 3Ds: Density, diversity, and design. Transp. Res. Part D Transp. Environ. 1997, 2, 199–219. [Google Scholar] [CrossRef]
- Cervero, R.; Sarmiento, O.L.; Jacoby, E.; Gomez, L.F.; Neiman, A. Influences of built environments on walking and cycling: Lessons from Bogotá. Int. J. Sustain. Transp. 2009, 3, 203–226. [Google Scholar] [CrossRef]
- Singh, Y.J.; Fard, P.; Zuidgeest, M.; Brussel, M.; Van Maarseveen, M. Measuring transit oriented development: A spatial multi criteria assessment approach for the City Region Arnhem and Nijmegen. J. Transp. Geogr. 2014, 35, 130–143. [Google Scholar] [CrossRef]
- Winstead, D.L. Smart growth, smart transportation: A new program to manage growth in Maryland. Urb. Law 1998, 30, 537–545. [Google Scholar]
- Higgins, C.D.; Kanaroglou, P.S. A latent class method for classifying and evaluating the performance of station area transit-oriented development in the Toronto region. J. Transp. Geogr. 2016, 52, 61–72. [Google Scholar] [CrossRef]
- Renne, J.L.; Wells, J. Transit-Oriented Development: Developing a Strategy to Measure Success; Transportation Research Board: Washington, DC, USA, 2005. [Google Scholar]
- Galelo, A.; Ribeiro, A.; Martinez, L.M. Measuring and Evaluating the Impacts of TOD Measures–Searching for Evidence of TOD Characteristics in Azambuja Train Line. Procedia Soc. Behav. Sci. 2014, 111, 899–908. [Google Scholar] [CrossRef]
- Yu, X.; Lang, M.; Gao, Y.; Wang, K.; Su, C.H.; Tsai, S.B.; Huo, M.; Yu, X.; Li, S. An Empirical Study on the Design of China High-Speed Rail Express Train Operation Plan—From a Sustainable Transport Perspective. Sustainability 2018, 10, 2478. [Google Scholar] [CrossRef]
- Barnum, D.T.; McNeil, S.; Hart, J. Comparing the efficiency of public transportation subunits using data envelopment analysis. J. Public Transp. 2007, 10, 1–16. [Google Scholar] [CrossRef]
- Banker, R.D.; Charnes, A.; Cooper, W.W. Some models for estimating technical and scale inefficiencies in data envelopment analysis. Manag. Sci. 1984, 30, 1078–1092. [Google Scholar] [CrossRef]
- Charnes, A.; Cooper, W.W.; Rhodes, E. Measuring the efficiency of decision making units. Eur. J. Oper. Res. 1978, 2, 429–444. [Google Scholar] [CrossRef]
- Tone, K.; Tsutsui, M. Network DEA: A slacks-based measure approach. Eur. J. Oper. Res. 2009, 197, 243–252. [Google Scholar] [CrossRef] [Green Version]
- Tone, K. A slacks-based measure of efficiency in data envelopment analysis. Eur. J. Oper. Res. 2001, 130, 498–509. [Google Scholar] [CrossRef] [Green Version]
- Tone, K.; Tsutsui, M. Dynamic DEA: A slacks-based measure approach. Omega 2010, 38, 145–156. [Google Scholar] [CrossRef] [Green Version]
- Farrell, M.J.; Fieldhouse, M. Estimating efficient production functions under increasing returns to scale. J. R. Stat. Soc. Ser. A 1962, 125, 252–267. [Google Scholar] [CrossRef]
- Li, T.; Yang, W.; Zhang, H.; Cao, X. Evaluating the impact of transport investment on the efficiency of regional integrated transport systems in China. Transp. Policy 2016, 45, 66–76. [Google Scholar] [CrossRef]
- Lee, E.H.; Lee, H.; Kho, S.Y.; Kim, D.K. Evaluation of Transfer Efficiency between Bus and Subway based on Data Envelopment Analysis using Smart Card Data. KSCE J. Civ. Eng. 2019, 23, 788–799. [Google Scholar] [CrossRef]
- Hahn, J.S.; Kho, S.Y.; Choi, K.; Kim, D.K. Sustainability evaluation of rapid routes for buses with a network DEA model. Int. J. Sustain. Transp. 2017, 11, 659–669. [Google Scholar] [CrossRef]
- Hahn, J.S.; Kim, D.K.; Kim, H.C.; Lee, C. Efficiency analysis on bus companies in Seoul city using a network DEA model. KSCE J. Civ. Eng. 2013, 17, 1480–1488. [Google Scholar] [CrossRef]
- Hahn, J.S.; Sung, H.M.; Park, M.C.; Kho, S.Y.; Kim, D.K. Empirical evaluation on the efficiency of the trucking industry in Korea. KSCE J. Civ. Eng. 2015, 19, 1088–1096. [Google Scholar] [CrossRef]
- Lee, E.H.; Lee, I.; Cho, S.H.; Kho, S.Y.; Kim, D.K. A Travel Behavior-Based Skip-Stop Strategy Considering Train Choice Behaviors Based on Smartcard Data. Sustainability 2019, 11, 2791. [Google Scholar] [CrossRef]
- Li, X.; Yu, J.; Shaw, J.; Wang, Y. Route-Level Transit Operational-Efficiency Assessment with a Bootstrap Super-Data-Envelopment Analysis Model. J. Urban Plan. Dev. 2017, 143, 04017007. [Google Scholar] [CrossRef]
- Cavaignac, L.; Petiot, R. A quarter century of Data Envelopment Analysis applied to the transport sector: A bibliometric analysis. Socio Econ. Plan. Sci. 2017, 57, 84–96. [Google Scholar] [CrossRef]
- He, Q.; Han, J.; Guan, D.; Mi, Z.; Zhao, H.; Zhang, Q. The comprehensive environmental efficiency of socioeconomic sectors in China: An analysis based on a non-separable bad output SBM. J. Clean. Prod. 2018, 176, 1091–1110. [Google Scholar] [CrossRef] [Green Version]
- Mandl, U.; Dierx, A.; Ilzkovitz, F. The Effectiveness and Efficiency of Public Spending; (No. 301); Directorate General Economic and Financial Affairs; European Commission: Brussels, Belgium, 2008. [Google Scholar]
- Litman, T.; Burwell, D. Issues in sustainable transportation. Int. J. Glob. Environ. Issues 2006, 6, 331–347. [Google Scholar] [CrossRef]
- Lin, J.J.; Shin, T.Y. Does transit-oriented development affect metro ridership? Evidence from Taipei, Taiwan. Transp. Res. Rec. 2008, 2063, 149–158. [Google Scholar] [CrossRef]
- Cook, W.D.; Liang, L.; Zhu, J. Measuring performance of two-stage network structures by DEA: A review and future perspective. Omega 2010, 38, 423–430. [Google Scholar] [CrossRef]
- Seoul Metropolitan Council. The Enforcement Rules of the Urban Planning Ordinance of Seoul; Seoul Rules No. 4224; Legal Administration Service: Seoul, Korea, 2018. [Google Scholar]
- Sung, H.; Oh, J.T. Transit-oriented development in a high-density city: Identifying its association with transit ridership in Seoul, Korea. Cities 2011, 28, 70–82. [Google Scholar] [CrossRef]
- Sohn, K.; Shim, H. Factors generating boardings at metro stations in the Seoul metropolitan area. Cities 2010, 27, 358–368. [Google Scholar] [CrossRef]
- Korea Energy Economics Institute and Korea Energy Agency. Energy Consumption Survey; Ministry of Trade, Industry and Energy: Sejong, Korea, 2017. [Google Scholar]
Figure 1.
Network framework for measuring transit efficiency.

Figure 2.
Heat-map of transfer trips on station area.

Figure 3.
Visualization of the efficiency evaluation results for Seoul: (a) efficiency result of the 352 stations; (b) top 10 efficient stations; and (c) bottom 10 inefficient stations.
Figure 3.
Visualization of the efficiency evaluation results for Seoul: (a) efficiency result of the 352 stations; (b) top 10 efficient stations; and (c) bottom 10 inefficient stations.

Figure 4.
Efficiency evaluation results with respect to design and efficiency: (a) efficiency results prioritized regarding TOD; and (b) group-wise efficiency results.
Figure 4.
Efficiency evaluation results with respect to design and efficiency: (a) efficiency results prioritized regarding TOD; and (b) group-wise efficiency results.

Figure 5.
Visualization of the efficiency evaluation results by dong unit in Seoul.

Table 1.
Description of the smart card data.
| No. | Categories | No. | Categories |
|---|---|---|---|
| 1 | Card ID * | 19 | Alighting time * |
| 2 | Name of the transit line | 20 | Transaction ID |
| 3 | Vehicle number | 21 | Company name |
| 4 | Boarding station ID * | 22 | Ending run time |
| 5 | Alighting station ID * | 23 | Alighting date * |
| 6 | The number of users | 24 | User division |
| 7 | Alighting violation penalty | 25 | Alighting fare |
| 8 | General user code | 26 | Total travel time |
| 9 | Time code | 27 | Boarding time * |
| 10 | Year | 28 | Boarding date * |
| 11 | Mode code | 29 | Line ID * |
| 12 | Company code | 30 | Vehicle ID * |
| 13 | Starting run time | 31 | Child user code |
| 14 | Name of boarding station | 32 | Name of alighting station |
| 15 | Number of transfer * | 33 | User group |
| 16 | Boarding fare | 34 | Boarding violation penalty |
| 17 | Total travel distance | 35 | Zone code * |
| 18 | Student user code | 36 | Other user code |
* indicates the categories used in this research.
Table 2.
Descriptive statistics of the socio-economic data.
| Socio-Economic Data (Input Variables) | Mean | Max. | Min. | Standard Deviation (S.D.) |
|---|---|---|---|---|
| Population density (person/km2) | 34,249 | 67,074 | 342 | 12,186 |
| Land value (1000 won/m2) | 5903 | 29,275 | 79 | 4133 |
| Number of households | 5249 | 14,914 | 74 | 2648 |
| Number of companies | 134 | 198 | 24 | 23 |
Table 3.
Descriptive statistics of the transit efficiency data.
| Details | Mean | Max. | Min. | S.D. | |
|---|---|---|---|---|---|
| Transit infrastructures (intermediate variables) | Number of subway lines | 1.6 | 5 | 1 | 0.8 |
| Number of bus lines | 34 | 145 | 4 | 22.1 | |
| Number of bus stations | 70 | 321 | 13 | 44 | |
| Distance of bus and subway stations (m) | 254 | 433 | 132 | 59 | |
| Transit trips (output variables) | Number of subway trips | 36,640 | 225,130 | 1860 | 30,805 |
| Number of bus trips | 96,239 | 473,770 | 2090 | 85,324 | |
| Number of transfer trips | 6164 | 62,183 | 26 | 8171 | |
| Energy consumption (Mcal/trip) | 377,910 | 1,603,120 | 24,697 | 268,318 | |
Table 4.
Efficiency evaluation results for station areas in Seoul.
| Details | Total Stations (352 Stations) | Efficient Stations (Top 10 Stations) | Inefficient Stations (Bottom 10 Stations) | ||||
|---|---|---|---|---|---|---|---|
| Mean | S.D. | Mean | S.D. | Mean | S.D. | ||
| Measured score | Overall efficiency score | 0.349 | 0.207 | 1.000 | 0.000 | 0.090 | 0.011 |
| Design (stage 1, ) | 0.453 | 0.209 | 1.000 | 0.000 | 0.157 | 0.016 | |
| Efficiency (stage 2, ) | 0.245 | 0.251 | 1.000 | 0.000 | 0.023 | 0.016 | |
| Input variable | Population density (person/km2) | 34,249 | 12,186 | 21,581 | 15,853 | 38,853 | 11,657 |
| Land coat (1000 won/m2) | 5903 | 4133 | 4478 | 6097 | 7,300 | 4140 | |
| Number of households | 5249 | 2648 | 2450 | 2133 | 5,329 | 1844 | |
| Number of companies | 134 | 23 | 110 | 40 | 140 | 13 | |
| Intermediate variable (output from stage 1) | Number of subway lines | 2.7 | 0.7 | 1.8 | 0.8 | 3.5 | 1.1 |
| Number of bus lines | 52 | 21 | 55 | 33 | 93 | 36 | |
| Number of bus stations | 167 | 81 | 91 | 52 | 242 | 38 | |
| Distance of bus and subway stations (m) | 231 | 46 | 212 | 64 | 202 | 36 | |
| Output variable | Number of subway trips | 36,640 | 30,805 | 182,420 | 205,228 | 37,676 | 58,562 |
| Number of bus trips | 96,239 | 85,324 | 97,491 | 80,063 | 57,391 | 29,638 | |
| Number of transfer trips | 6164 | 8171 | 11,747 | 11,575 | 511 | 620 | |
| Energy consumption (Mcal/trip) | 377,910 | 268,318 | 439,666 | 262,293 | 210,026 | 107,734 | |
Table 5.
Results of overall efficiency by Dong unit in Seoul.
| Details | Total (424 Dongs) | Non-Scoring (41 Dongs) | Inefficient | Efficient (8 Dongs) | ||
|---|---|---|---|---|---|---|
| Low-Scoring (79 Dongs) | Mid-Scoring (296 Dongs) | |||||
| Overall efficiency score | Overall efficiency score | 0.351 | - | 0.153 | 0.387 | 1.000 |
| Design (stage 1, ) | 0.443 | - | 0.249 | 0.480 | 1.000 | |
| Efficiency (stage 2, ) | 0.259 | - | 0.058 | 0.293 | 1.000 | |
| Socio-economics | Population Density (person/km2) | 24,397 | 22,463 | 21,960 | 25,592 | 14,138 |
| Land cost (1000 won/m2) | 4454 | 2410 | 6208 | 4290 | 3682 | |
| Number of households | 10,133 | 9478 | 9815 | 10,280 | 11,232 | |
| Number of companies | 1934 | 1227 | 2083 | 2004 | 1488 | |
© 2019 by the authors. Licensee MDPI, Basel, Switzerland. This article is an open access article distributed under the terms and conditions of the Creative Commons Attribution (CC BY) license (http://creativecommons.org/licenses/by/4.0/).
Share and Cite
MDPI and ACS Style
Lee, E.H.; Shin, H.; Cho, S.-H.; Kho, S.-Y.; Kim, D.-K. Evaluating the Efficiency of Transit-Oriented Development Using Network Slacks-Based Data Envelopment Analysis. Energies 2019, 12, 3609. https://doi.org/10.3390/en12193609
AMA Style
Lee EH, Shin H, Cho S-H, Kho S-Y, Kim D-K. Evaluating the Efficiency of Transit-Oriented Development Using Network Slacks-Based Data Envelopment Analysis. Energies. 2019; 12(19):3609. https://doi.org/10.3390/en12193609
Chicago/Turabian StyleLee, Eun Hak, Hosuk Shin, Shin-Hyung Cho, Seung-Young Kho, and Dong-Kyu Kim. 2019. "Evaluating the Efficiency of Transit-Oriented Development Using Network Slacks-Based Data Envelopment Analysis" Energies 12, no. 19: 3609. https://doi.org/10.3390/en12193609
Note that from the first issue of 2016, this journal uses article numbers instead of page numbers. See further details here.