Fabrication and Performance Evaluation of Six-Cell Two-Dimensional Configuration Solid Oxide Fuel Cell Stack Based on Planar 6 × 6 cm Anode-Supported Cells

Department of Thermal Engineering, Ho Chi Minh City University of Technology and Education, Ho Chi Minh City 700000, Vietnam
Energies 2019, 12(18), 3541; https://doi.org/10.3390/en12183541
Submission received: 5 August 2019
/
Revised: 7 September 2019
/
Accepted: 12 September 2019
/
Published: 16 September 2019
(This article belongs to the Special Issue Solid Oxide Fuel Cell Gas Turbine Hybrid System)
Abstract
:Using energy efficiently and reducing environmental pollution caused by energy consumption are becoming increasingly important. In this study, a two-dimensional (2D) solid oxide fuel cell (SOFC) stack configuration was designed to be operated with six cells. This design could potentially be applied in thermal power plants in developing countries where waste heat is more plentiful; the 2D configuration six-cell stack could be an elementary module, and such modules could be more easily placed in contact with hot walls where waste heat recovery is required. In this report, the design, fabrication, and performance evaluation of the stack are described. The stack, with six 6 × 6 cm2 cells (5 × 5 cm2 effective area), is connected in series and operates successfully. The results show that the maximum potential of the six-cell stack is around 5.5 V (0.92 V per unit cell) at 700 °C. The maximum output power of the stack is 6.0 W at 700 °C, with humidified hydrogen (with 3% H2O) as the fuel. The results show that the six-cell 2D configuration SOFC stack can be innovatively constructed.

1. Introduction
The main advantages of power production through solid oxide fuel cells (SOFCs) are high energy conversion, non-combustion, and the fact that they can use a variety of fuels. It has emerged as a technology capable of producing clean, reliable, and flexible power. The combined advantages of electrical and waste heat makes the study of SOFC more attractive than that of other fuel cells such as proton exchange membrane fuel cell (PEMFC), phosphoric acid fuel cell (PAFC), and molten carbonate fuel cell (MCFC). Therefore, anode-supported SOFCs are a promising technology for energy generation systems [1,2,3]. In a typical planar SOFC, cells are interconnected in series to obtain a higher stack power output. Different systems feed the fuel and oxidant onto the two sides of the cells in the stack. The SOFC stack can be divided into several types: external manifold [4], internal-manifold [5], disk model [6], and envelope model [7]. Performance degradation is caused by the unequal supply of fuel and oxidant, which results in variations in each cell’s flow condition, affecting the isothermal temperature distribution throughout the stack [8].
A fuel cell system is usually a combination of a number of single cells. This combination of single fuel cells is called a fuel cell stack, which supplies higher potential or power. Although a variety of fuel cell stacks have different materials, sizes, shapes, and power ranges, the methods used to connect single cells into a stack can mainly be classified as bipolar and planar models [9]. The conventional configuration of SOFC stacks is the bipolar model, where two adjacent single cells use one bipolar plate that distributes fuel for one cell’s anode and air for the other’s cathode, and also acts as the current collector [10]. The SOFC stack with bipolar design has lower internal resistance and higher power density. However, the conventional design (3D) has a complicated structure and higher material requirements, which restrict its applications. The stack design with a two-dimensional (2D) structure better integrates with applications. Anode-supported planar SOFCs, with a large active area, have been designed by employing various multi-cell arrays and compressive sealing systems. Four- and two-cell array systems, which are equivalent to 10 × 10 cm2 unit cells in an active area, have been operated successfully [11]. Many researchers have been studying and improving the concept and application of the test hardware for this technology [12,13,14].
Higher working temperatures enhance the performance of SOFC systems. The temperature distribution effects their performance [15]. Several researchers have indicated the effects of the inlet fuel and oxidant temperature on the power densities due to electrochemical reactions of carbon monoxide and hydrogen. The results showed that the output power at higher inlet temperaturs is greater than the output power at lower inlet temperatures [16,17]. Currently, SOFCs are the highest-temperature fuel cells and can be efficiently operated at temperatures from 800 to 1100 °C. Many theoretical studies have mentioned SOFC systems and SOFCs combined with gas turbine (SOFC-GT) power cycles [18,19,20,21,22].
In this study, the 2D configuration SOFC stack with six planar anode-supported cells was improved and tested. The stack with six 6 × 6 cm2 cells (5 × 5 cm2 effective area) was operated successfully. Cells are connected in series as a stack so the stack can generate a higher potential. This design has many advantages compared with the traditional design, such as: it is an original idea for SOFC, installation is simple, it is flexible enough to plate to a hard wall surface, and it has the ability to be applied in factories and power plants to reuse heat waste sources.
2. Materials and Methods
2.1. Anode-Supported Cell Fabrication
Commercial anode material (NiO/YSZ = 50 wt%/50 wt%, 42,421), anode functional material (NiO/YSZ = 30 wt%/70 wt%, 42,420), electrolyte material (8 mol% YSZ, 42,400), and LSM (La0.65Sr0.3MnO3) material were used to manufacture SOFC unit cells. The commercial materials were purchased from ESL Electro-Science Co. Ltd., King of Prussia, PA, US. The cell includes three anode layers, each with a thickness of 180 µm, an anode functional layer with a thickness of 20 µm, an electrolyte layer with a thickness of 18 µm, and a cathode paste layer with a thickness of 25 µm. The four kinds of layers were stacked (cathode layer at the top, then the electrolyte layer, then the anode functional layer, and the anode layers at the bottom) [23]. The SOFC cells fabrication procedure is shown schematically in Figure 1.
2.2. Manifold Design
Performance degradation is caused by the unequal distribution of fuel and oxidant, which results in variations in each cell’s flow condition. To allow a fuel cell system to most effectively function, manifold devices must function to uniformly supply process gases to the entire process gas channels in a fuel cell stack. To provide the fuel to each cell in the stack, six pipes were connected to the manifold body, and the fuel was provided through the pipes from the manifold to each cell (Figure 2). The manifold consisted of a 3 × 3 cm2 square tube that was 14 cm long. The six pipes were cylindrical tubes with a diameters of 1 cm and a length of 8 cm. The manifold is not only a fuel provider but also a heat exchanger. The fuel flows into the manifold, which allows heat conversion to increase the temperature of the fuel inlet. Then, the higher temperature fuel moves to the cells through the six pipes. The working principle of the 2D configuration SOFC stack is shown in Figure 3.
2.3. Interconnected Design
Figure 4 shows a schematic of the interconnected construction used for tests on the 2D configuration SOFC stack. As shown in Figure 4, the cells were connected in series by a much less costly current collector mesh in lieu of the traditional interconnect plates. An interconnect couple was fabricated from two different collector meshes and connected using a collector wire. Nickel mesh was connected to the anode surface, and silver mesh was connected to the cathode surface. Two silver wires were used to connect the two meshes.
2.4. Cell Performance Testing
The 2D stack was heated to 700 °C in the heating box with a heating rate of 1.0 °C/min. During the start-up heating, the 2D stack was supplied with mixed gases of nitrogen and hydrogen on the anode side and air on the cathode side. The flow rate of nitrogen and hydrogen were 900 mL/min, and 60 mL/min, respectively. The air flow rate was 1200 mL/min. When the temperature reached 700 °C, the hydrogen flow rate fed into the anode was 1200 mL/min (with 3% H2O), and the air flow rate fed into the cathode was 1500 mL/min. The current and voltage data of the stack were collected and saved by the SOFC testing machine. The assembly of six cells on a 2D configuration SOFC stack is shown in Figure 5. The installation of the stack in the testing system is depicted in Figure 6.
3. Results and Discussion
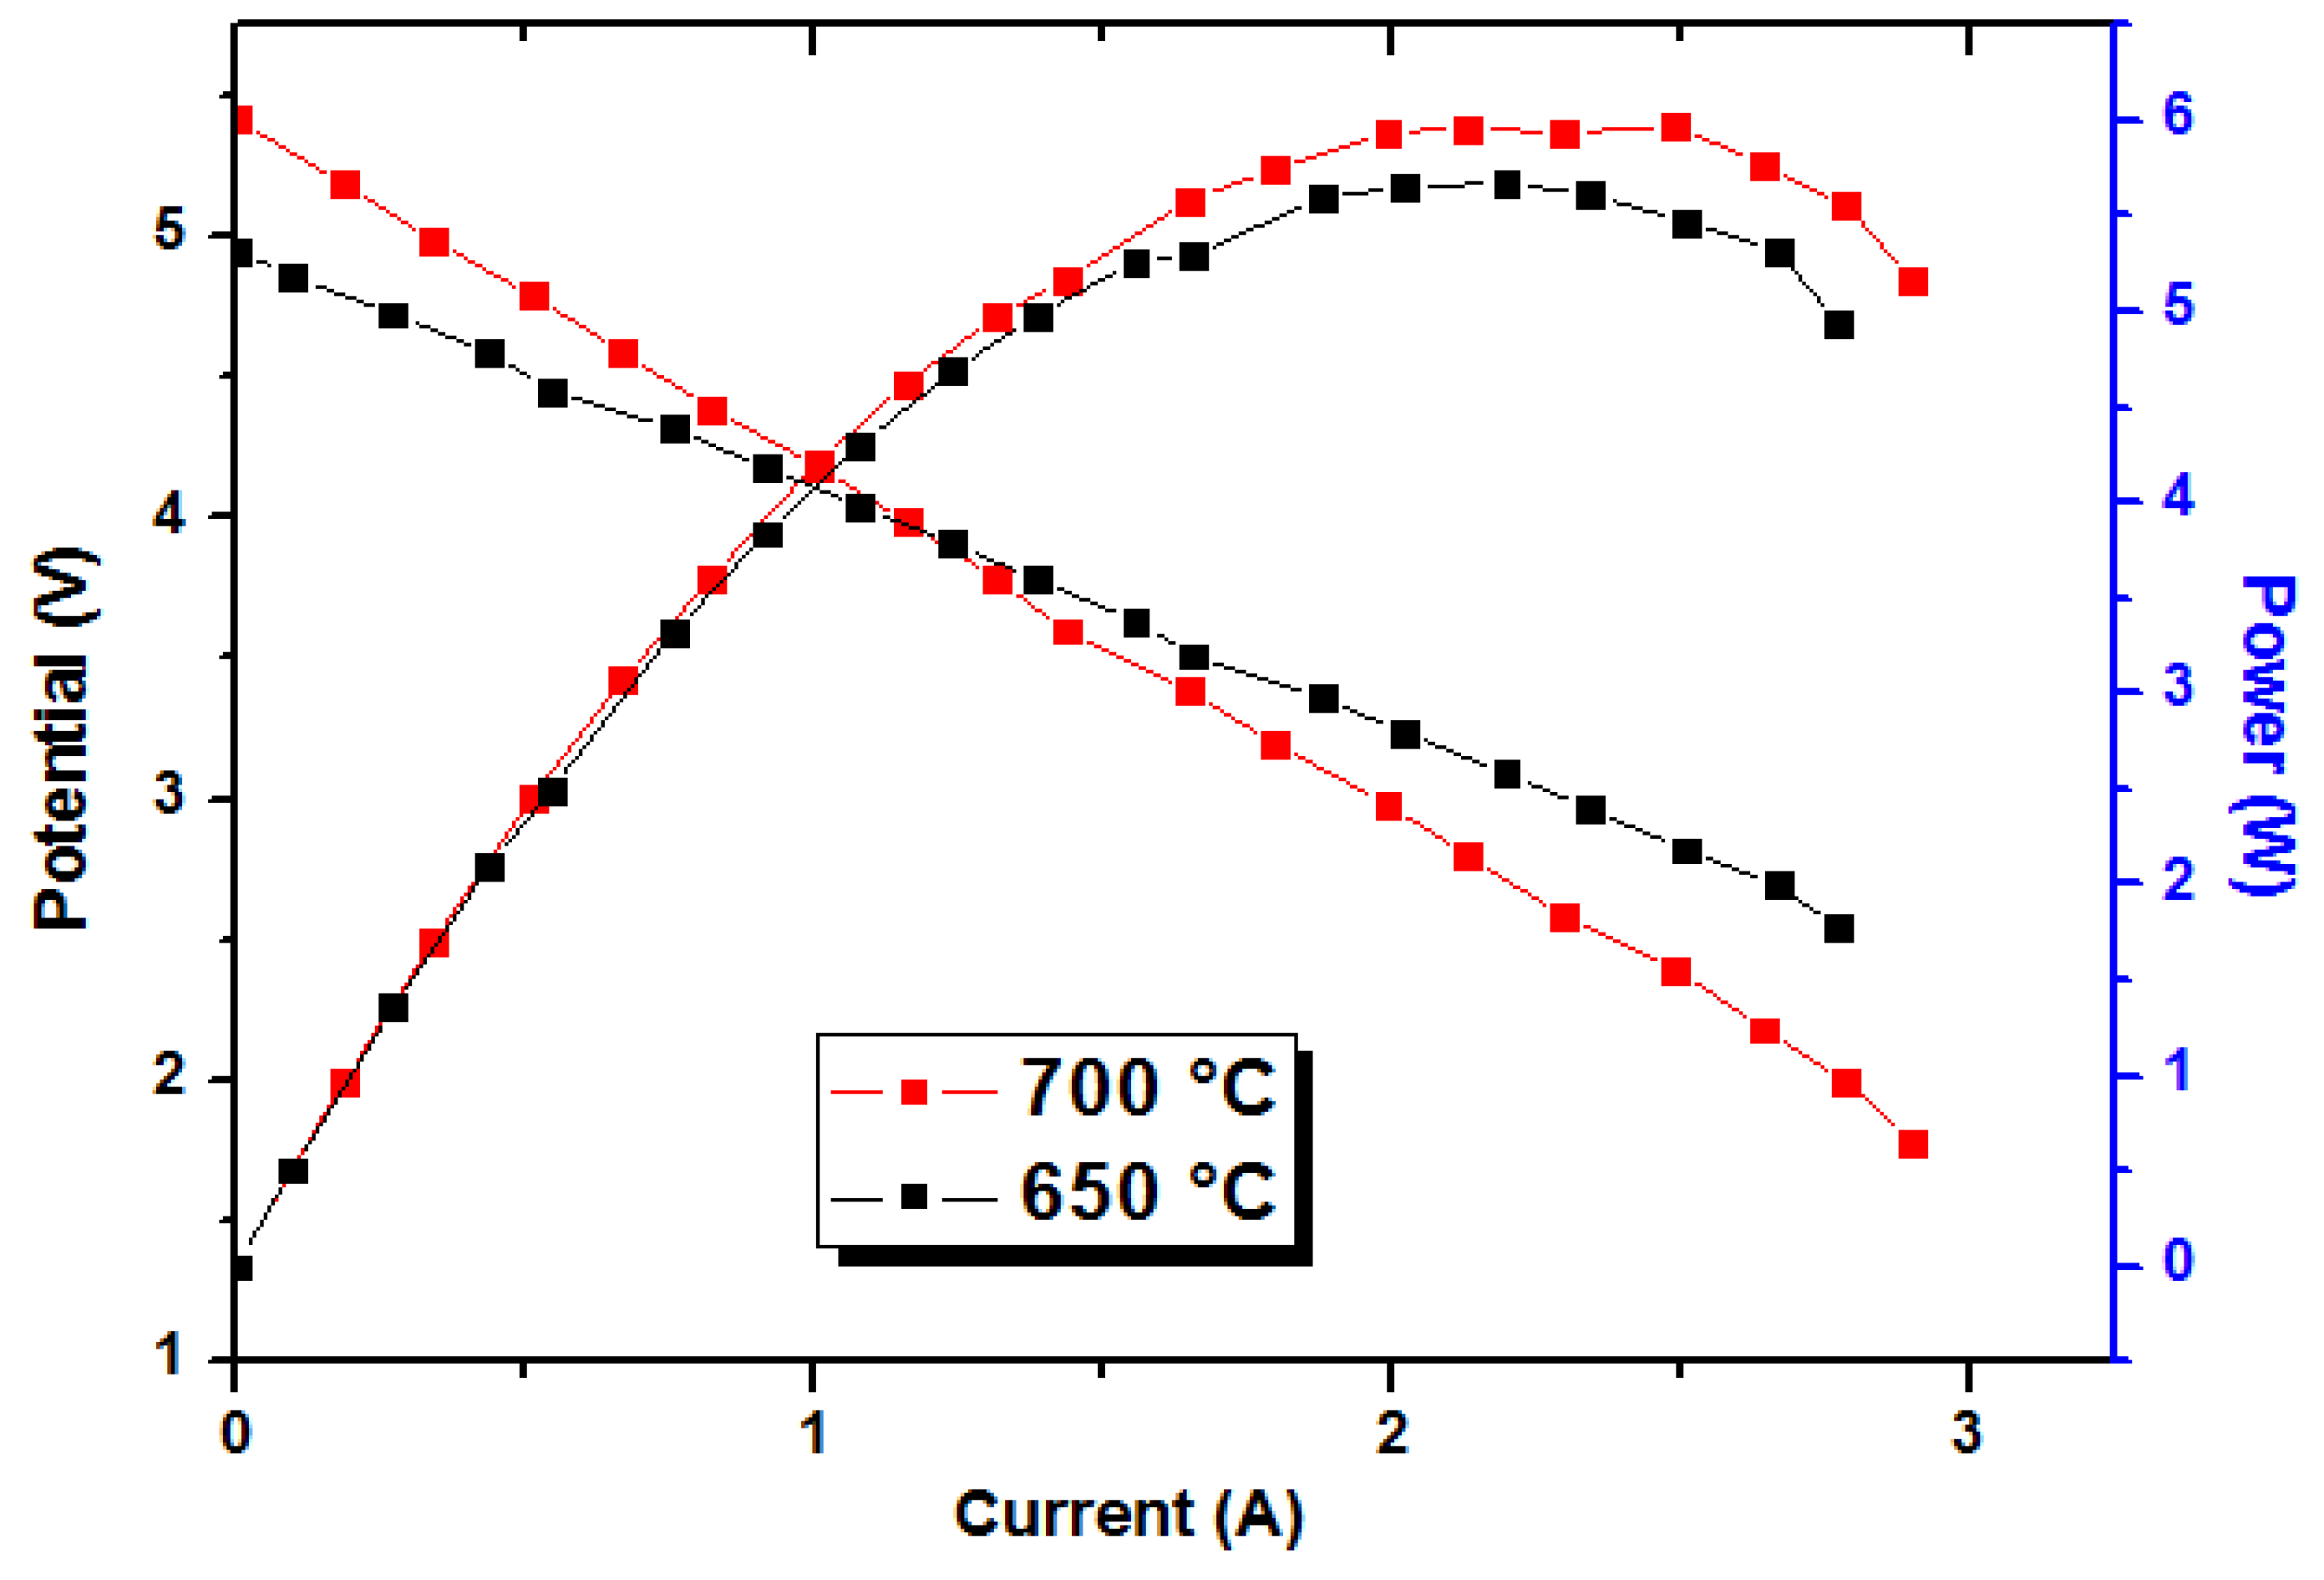
The power generation of the 2D SOFC stack with six 6 × 6 cm2 cells (5 × 5 cm2 effective area) is presented in Figure 7 and Figure 8. The 2D stack was tested at 650 and 700 °C. At a flow rate of 900 mL/min of hydrogen and 1200 mL/min of air, the potentials of the six-cell stack were around 4.3 V and 4.6 V at 650 °C and 700 °C, respectively. This shows that the potentials of each unit cell were about 0.72 V and 0.77 V at 650 °C and 700 °C, respectively. The total output power of the stack was about 3.7 W at 650 °C and about 4.0 W at 700 °C (Figure 7). As shown in Figure 8, at a flow rate of 1200 mL/min of hydrogen and 1500 mL/min of air, the potentials of the six-cell stack were around 5.0 V and 5.5 V at 650 °C and 700 °C, respectively. This indicates that the potentials of each unit cell were about 0.83 V and 0.92 V at 650 °C and 700 °C, respectively, which are comparable with those of the single cell test. The measured potential of the 2D stack is almost equal to the theoretical value. Figure 8 shows that the total output power of the stack was about 5.6 W at 650 °C, whereas the power was 6.0 W at 700 °C. The total power of the stack at 700 °C was higher than that of the test at 650 °C. This means that the SOFC power depends on the operating temperature. Additionally, the SOFC power also depends on the flow rate of hydrogen and air. In this study, the power of the stack is lower than the conventional stack, possibly due to the inconsistency of the cells fabricated manually in the laboratory. The cell manufacture quality effects the cell performance. We used available commercial materials to manually manufacture the cells, so producing consistent cells was a challenge. However, this study presents the feasibility of this 2D configuration SOFC stack design with six anode-supported cells in series connection.
4. Conclusions
In this study, we reported an improvement in the 2D SOFC stack. The stack with six 6 × 6 cm2 cells (5 × 5 cm2 effective area) was successfully operated. The stack design connects six cells in series. The maximum potential of the six-cell stack was around 5.5 V (0.92 V per unit cell) at 700 °C. The maximum output power of the stack was 6.0 W at 700 °C. The results showed that a six-cell 2D SOFC stack can be innovatively constructed. The power of the stack is not high, possibly due to the inconsistency of the cells fabricated manually in the laboratory. The cells were manually fabricated using available commercial materials. This effected the cell performance.
In future work, we will improve the cell fabrication in order to manufacture better quality cells. All the six cells in the current six-cell 2D stack design will also be connected in parallel to form a large single cell, equivalent to a 12 × 18 cm2 unit cell.
Funding
This research was funded by the Vietnam National Foundation for Science and Technology Development (NAFOSTED) under grant number 107.03−2018.332.
Acknowledgments
The author gratefully thanks the HCMC University of Technology and Education and the Fuel Cell Center at Yuan Ze University for their support.
Conflicts of Interest
The author declares no conflict of interest.
References
- Nguyen, Q.M. Ceramic fuel cells. J. Am. Ceram. Soc. 1993, 76, 563–588. [Google Scholar]
- Andu, J.M.; Segura, F. Fuel cells: History and updating. A walk along two centuries. Renew. Sustain. Energy Rev. 2009, 13, 2309–2322. [Google Scholar]
- Nguyen, X.V.; Chang, C.T.; Jung, G.B.; Chan, S.H.; Yeh, C.C.; Yu, J.W.; Lee, C.Y. Improvement on the design and fabrication of planar SOFCs with anode–supported cells based on modified button cells. Renew. Energy 2018, 129, 806–813. [Google Scholar] [CrossRef]
- Chung, B.; Chervin, C.; Haslam, J.; Pham, A.; Glass, R. Development and characterization of a high performance thin-film planar SOFC stack. J. Electrochem. Soc. 2005, 152, 265–269. [Google Scholar] [CrossRef]
- Mizutani, Y.; Hisada, K.; Ukai, K.; Sumi, H.; Yokoyama, M.; Nakamura, Y.; Yamamoto, O. From rare earth doped zirconia to 1 kW solid oxide fuel cell system. J. Alloy. Compd. 2006, 408–412, 518–524. [Google Scholar] [CrossRef]
- Shibata, M.; Murakami, N.; Akbay, T.; Eto, H.; Hosoi, K.; Nakajima, H.; Kano, J.; Nishiwaki, F.; Inagaki, T.; Yamasaki, S. Development of intermediate−temperature SOFC modules and systems. ECS Trans. 2007, 7, 77–83. [Google Scholar]
- Yoshida, H.; Yakabe, H.; Ogasawara, K.; Sakurai, T. Development of envelope-type solid oxide fuel cell stacks. J. Power Sources 2006, 157, 775–781. [Google Scholar] [CrossRef]
- Baschuk, J.J.; Li, X. Modelling of polymer electrolyte membrane fuel cell stacks based on a hydraulic network approach. Int. J. Energy Res. 2004, 28, 697–724. [Google Scholar] [CrossRef]
- Jiang, R.; Chu, D. Stack design and performance of polymer electrolyte membrane fuel cells. J. Power Sources 2001, 93, 25–31. [Google Scholar] [CrossRef]
- Scholta, J.; Rohland, B.; Trapp, V.; Focken, U. Investigations on novel low−cost graphite composite bipolar plates. J. Power Sources 1999, 84, 231–234. [Google Scholar] [CrossRef]
- Kim, H.; Jung, H.Y.; Jung, H.G.; Kim, J.; Lee, J.H.; Lee, H.W.; Song, H. Fabrication and performance evaluation of multi−cell arrayed planar SOFC stack. ECS Trans. 2007, 7, 311–316. [Google Scholar]
- Ferrari, M.L. Solid oxide fuel cell hybrid system: Control strategy for stand−alone configurations. J. Power Sources 2011, 196, 2682–2690. [Google Scholar] [CrossRef]
- Zaccaria, V.; Tucker, D.; Traverso, A. Operating strategies to minimize degradation in fuel cell gas turbine hybrids. Appl. Energy 2017, 192, 437–445. [Google Scholar] [CrossRef] [Green Version]
- Sharifzadeh, M.; Meghdari, M.; Rashtchian, D. Multi−objective design and operation of Solid Oxide Fuel Cell (SOFC) triple−combined−cycle power generation systems: Integrating energy efficiency and operational safety. Appl. Energy 2017, 185, 345–361. [Google Scholar] [CrossRef]
- Vakouftsi, E.; Marnellos, G.E.; Athanasiou, C.; Coutelieris, F. CFD modeling of a biogas fuelled SOFC. Solid State Ion. 2011, 192, 458–463. [Google Scholar] [CrossRef]
- Park, J.; Li, P.; Bae, J. Analysis of chemical, electrochemical reactions and thermo−fluid flow in methane−feed internal reforming SOFCs: Part II−temperature effect. Int. J. Hydrogen Energy 2012, 37, 8532–8555. [Google Scholar] [CrossRef]
- Djamel, H.; Hafsia, A.; Bariza, Z.; Hocine, B.M.; Kafia, O. Thermal field in SOFC fed by hydrogen: Inlet gases temperature effect. Int. J. Hydrogen Energy 2013, 38, 8575–8583. [Google Scholar] [CrossRef]
- Khani, L.; Mehr, A.S.; Yari, M.; Mahmoudi, S.M.S. Multi−objective optimization of an indirectly integrated solid oxide fuel cell−gas turbine cogeneration system. Int. J. Hydrogen Energy 2016, 41, 21470–21488. [Google Scholar] [CrossRef]
- Eveloy, V.; Karunkeyoon, W.; Rodgers, P.; Al Alili, A. Energy, exergy and economic analysis of an integrated solid oxide fuel cell gas turbineeorganic Rankine power generation system. Int. J. Hydrogen Energy 2016, 41, 13843–13858. [Google Scholar] [CrossRef]
- Azizi, M.A.; Brouwer, J. Progress in solid oxide fuel cell−gas turbine hybrid power systems: System design and analysis, transient operation, controls and optimization. Appl. Energy 2018, 215, 237–289. [Google Scholar] [CrossRef]
- Buonomano, A.; Calise, F.; d’Accadia, M.D.; Palombo, A.; Vicidomini, M. Hybrid solid oxide fuel cells–gas turbine systems for combined heat and power: A review. Appl. Energy 2015, 156, 32–85. [Google Scholar] [CrossRef]
- Choudhury, A.; Chandra, H.; Arora, A. Application of solid oxide fuel cell technology for power generation—A review. Renew. Sustain. Energy Rev. 2013, 20, 430–442. [Google Scholar] [CrossRef]
- Nguyen, X.V.; Chang, C.T.; Jung, G.B.; Chan, S.H.; Huang, W.C.W.; Hsiao, K.J.; Lee, W.T.; Chang, S.W.; Kao, I.C. Effect of sintering temperature and applied load on anode-supported electrodes for SOFC application. Energies 2016, 9, 701. [Google Scholar] [CrossRef]
Figure 1.
Diagram of the manufacturing process for a solid oxide fuel cell (SOFC).
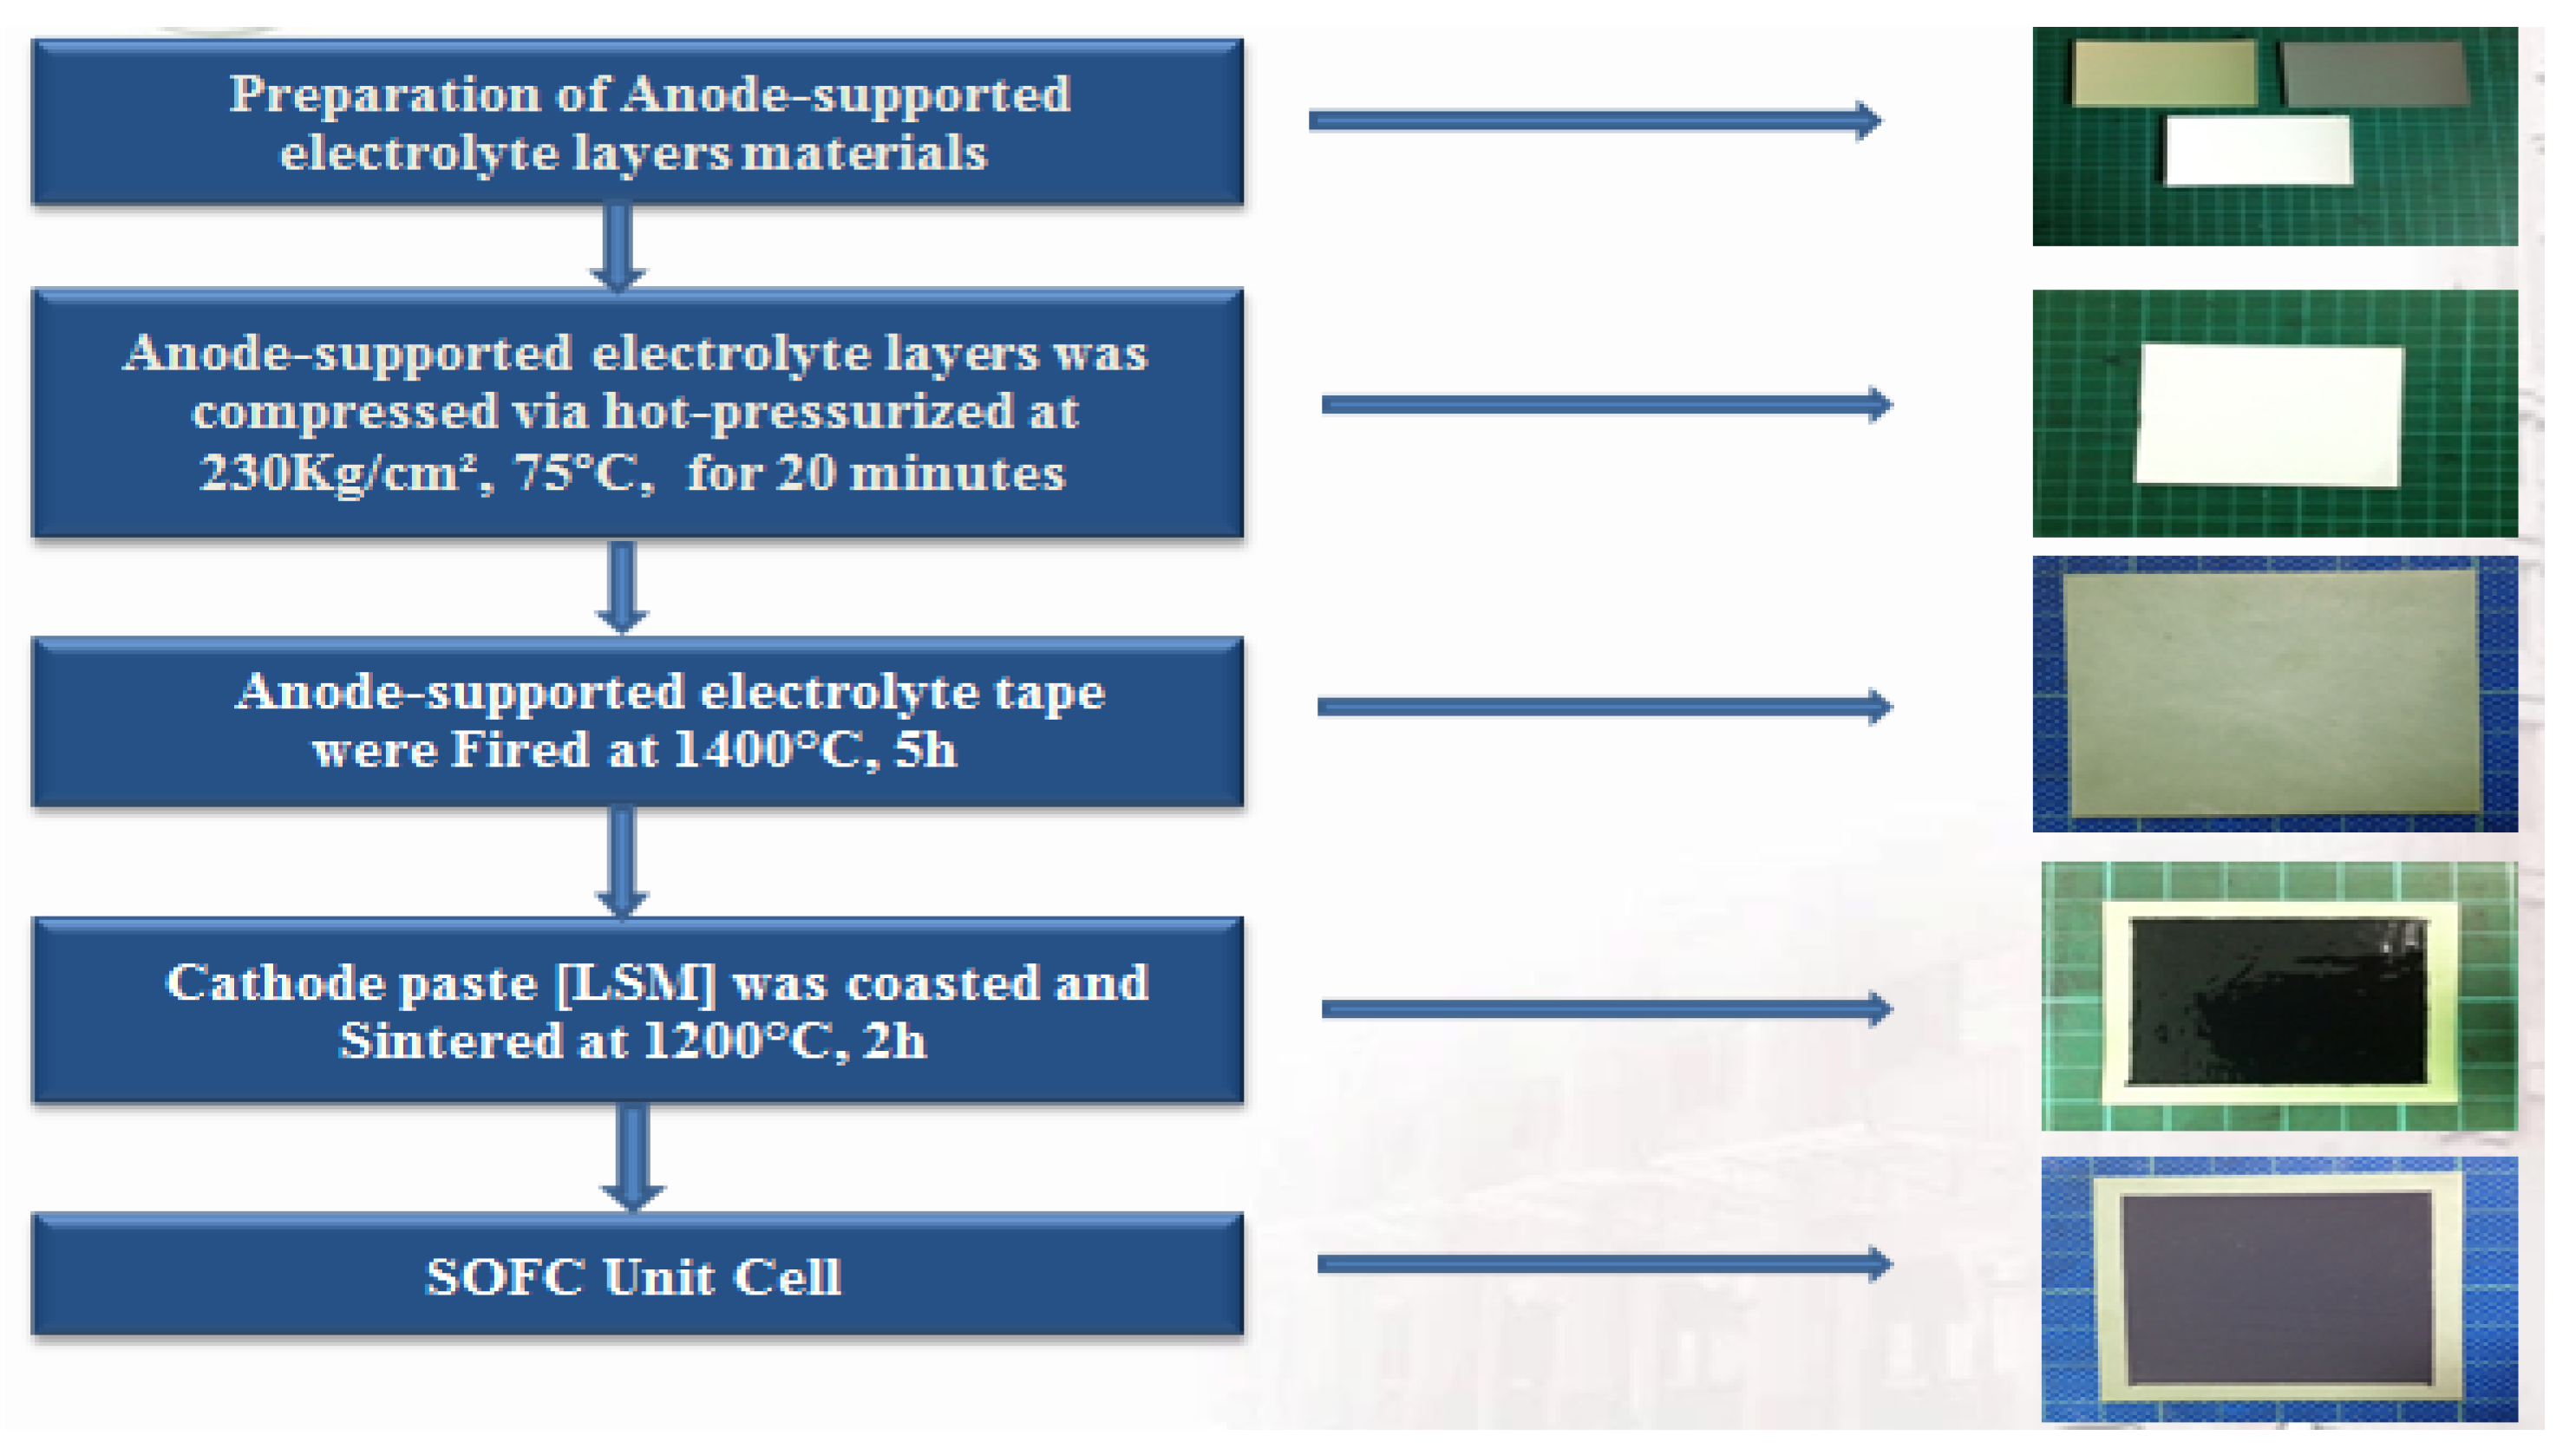
Figure 2.
Schematic of a manifold two-dimensional (2D) configuration solid oxide fuel cell (SOFC) stack.
Figure 2.
Schematic of a manifold two-dimensional (2D) configuration solid oxide fuel cell (SOFC) stack.

Figure 3.
Schematic of the working principles of a 2D configuration SOFC stack.

Figure 4.
Schematic of interconnect construction of a 2D configuration SOFC stack.

Figure 5.
Photograph of the test on the six-cell 2D configuration SOFC stack.

Figure 6.
Schematic of the SOFC stack testing system.

Figure 7.
Current-potential and current-power curves of 2D SOFC stack at a flow rate of 900 mL/min of hydrogen and 1200 mL/min of air.
Figure 7.
Current-potential and current-power curves of 2D SOFC stack at a flow rate of 900 mL/min of hydrogen and 1200 mL/min of air.
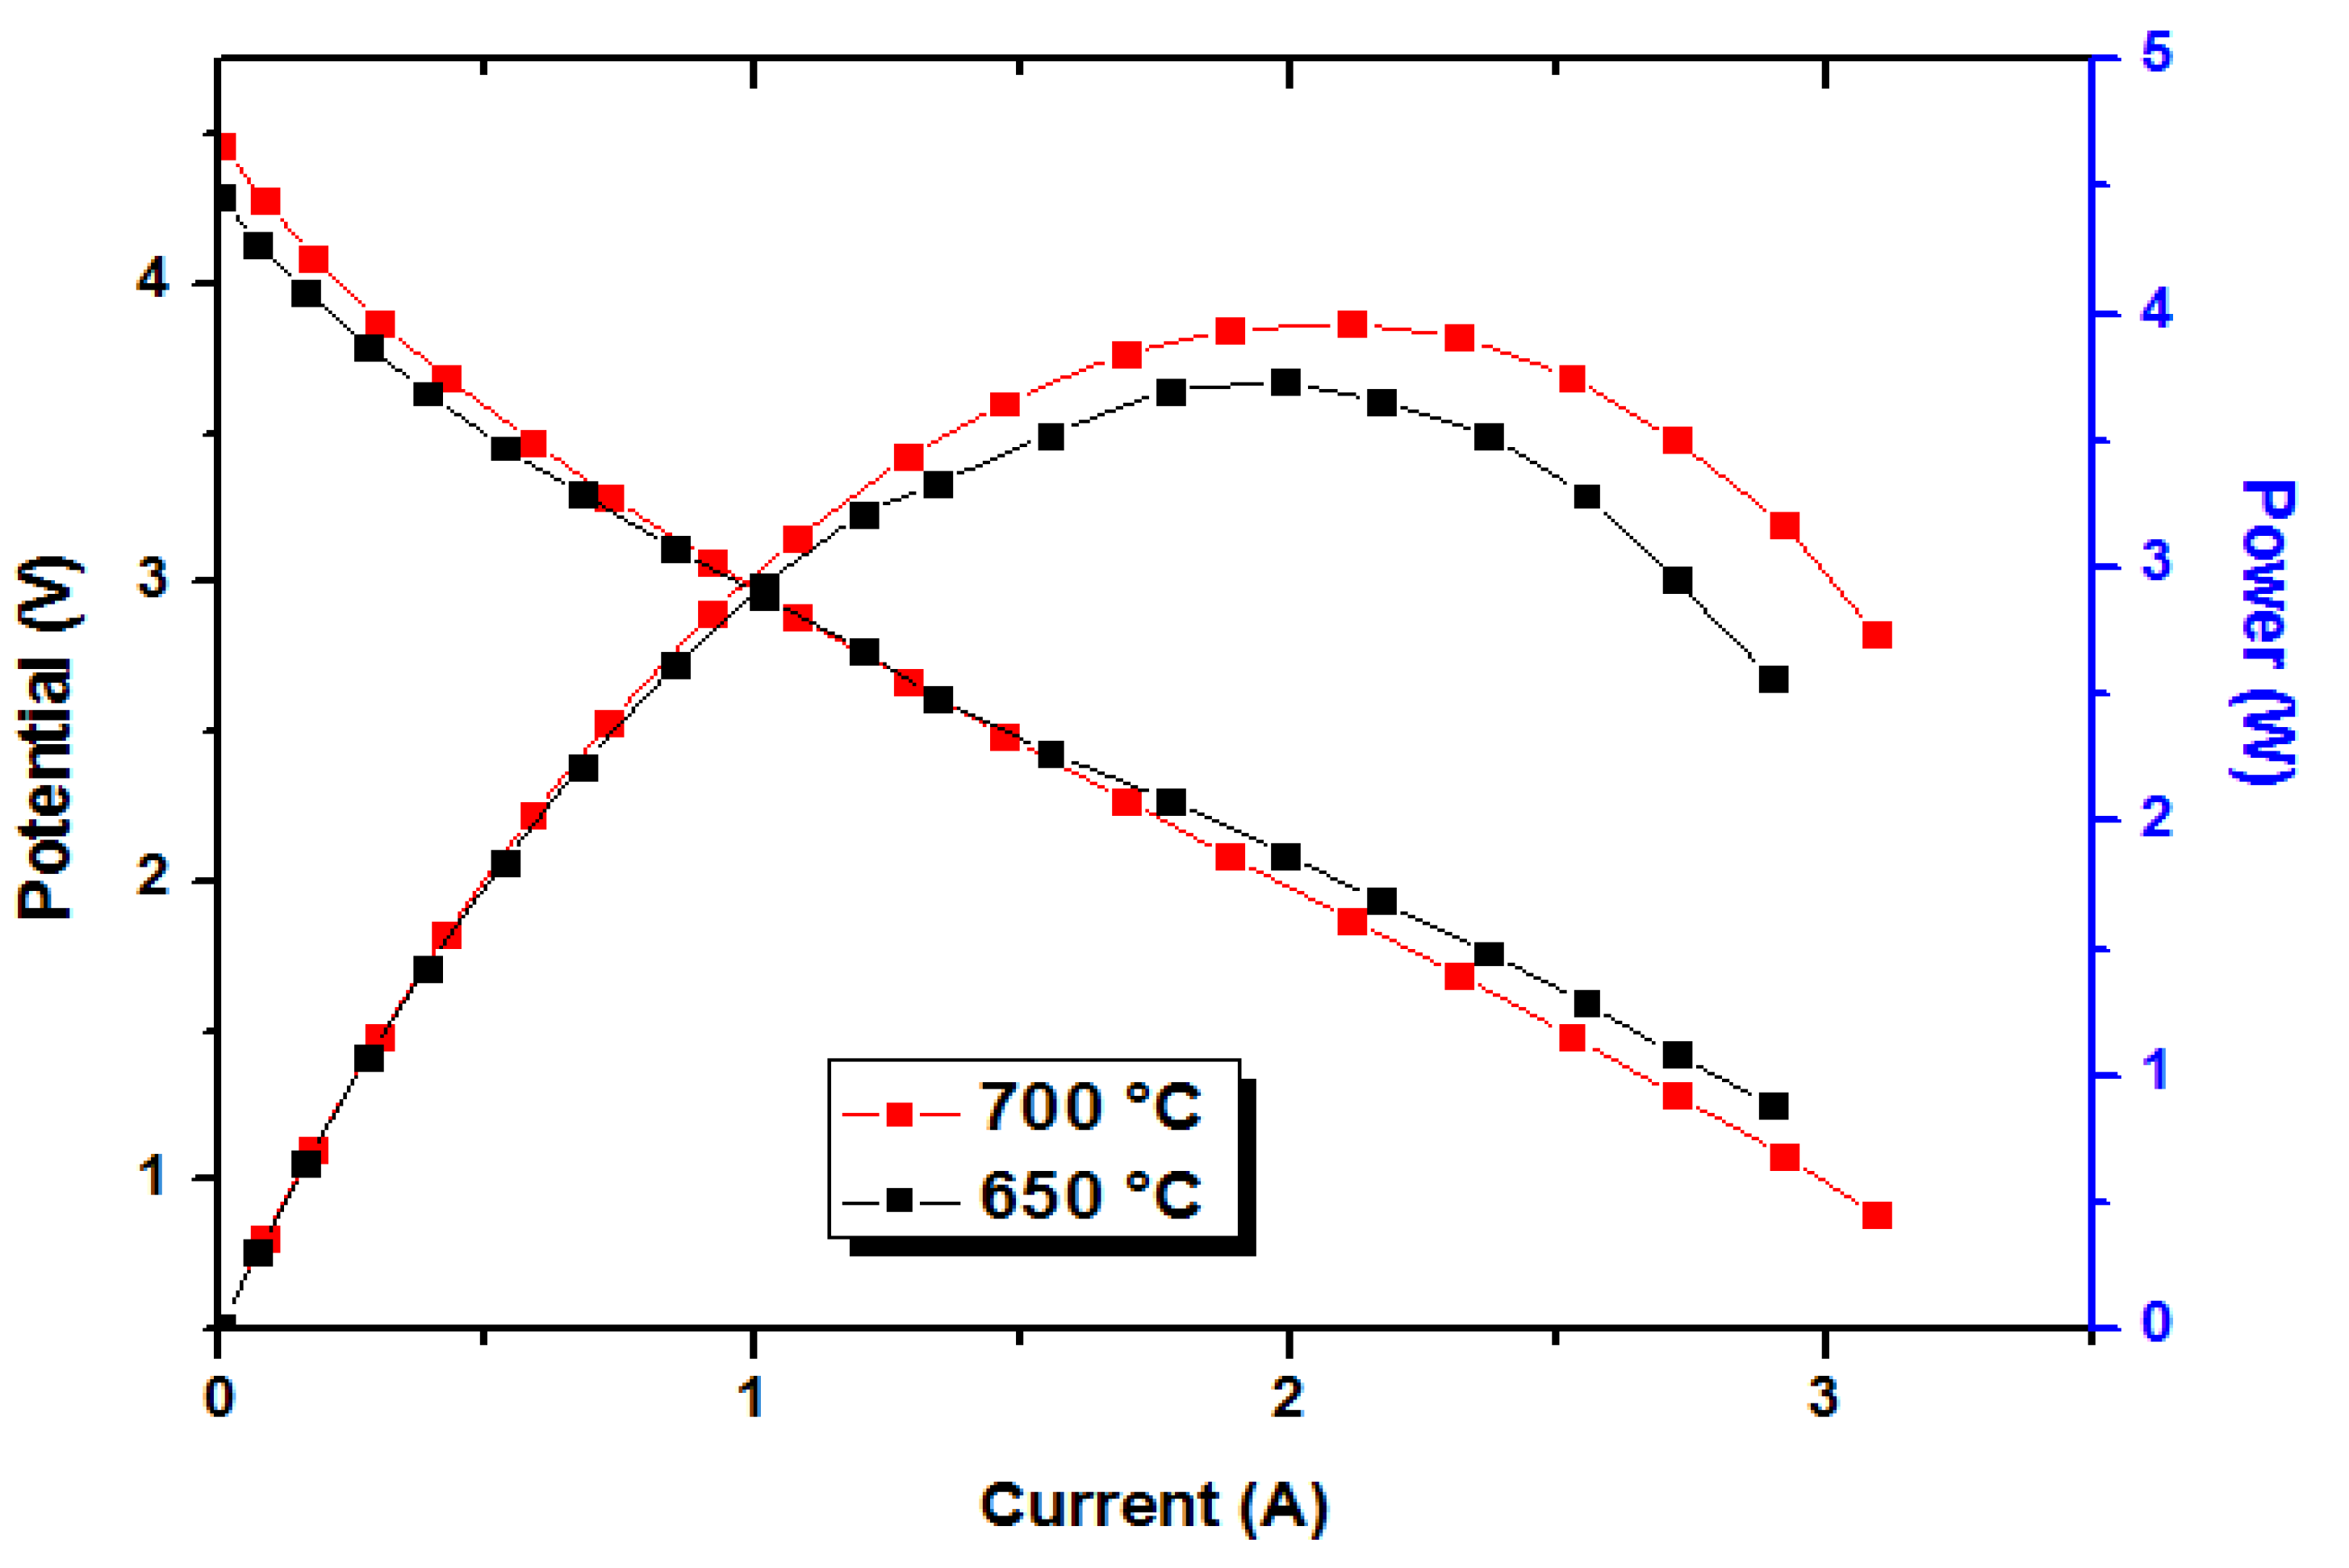
Figure 8.
Current-potential and current-power curves of 2D SOFC stack at a flow rate of 1200 mL/min of hydrogen and 1500 mL/min of air.
Figure 8.
Current-potential and current-power curves of 2D SOFC stack at a flow rate of 1200 mL/min of hydrogen and 1500 mL/min of air.
© 2019 by the author. Licensee MDPI, Basel, Switzerland. This article is an open access article distributed under the terms and conditions of the Creative Commons Attribution (CC BY) license (http://creativecommons.org/licenses/by/4.0/).
Share and Cite
MDPI and ACS Style
Nguyen, X.-V. Fabrication and Performance Evaluation of Six-Cell Two-Dimensional Configuration Solid Oxide Fuel Cell Stack Based on Planar 6 × 6 cm Anode-Supported Cells. Energies 2019, 12, 3541. https://doi.org/10.3390/en12183541
AMA Style
Nguyen X-V. Fabrication and Performance Evaluation of Six-Cell Two-Dimensional Configuration Solid Oxide Fuel Cell Stack Based on Planar 6 × 6 cm Anode-Supported Cells. Energies. 2019; 12(18):3541. https://doi.org/10.3390/en12183541
Chicago/Turabian StyleNguyen, Xuan-Vien. 2019. "Fabrication and Performance Evaluation of Six-Cell Two-Dimensional Configuration Solid Oxide Fuel Cell Stack Based on Planar 6 × 6 cm Anode-Supported Cells" Energies 12, no. 18: 3541. https://doi.org/10.3390/en12183541
Note that from the first issue of 2016, this journal uses article numbers instead of page numbers. See further details here.