PMU’s Behavior with Flicker-Generating Voltage Fluctuations: An Experimental Analysis


Department of Electrical and Electronic Engineering, University of Cagliari, 09123 Cagliari, Italy
*
Author to whom correspondence should be addressed.
Energies 2019, 12(17), 3355; https://doi.org/10.3390/en12173355
Submission received: 9 July 2019
/
Revised: 6 August 2019
/
Accepted: 25 August 2019
/
Published: 30 August 2019
(This article belongs to the Special Issue Analysis for Power Quality Monitoring)
Abstract
:Phasor measurement units (PMUs), which are the key components of a synchrophasor-based wide area monitoring system (WAMS), were historically conceived for transmission networks. The current trend to extend the benefits of the synchrophasor technology to distribution networks requires the PMU to also provide trustworthy information in the presence of signals that can occur in a typical distribution grid, including the presence of severe power quality (PQ) issues. In this framework, this paper experimentally investigates the performance of PMUs in the presence of one of the most important PQ phenomena, namely the presence of voltage fluctuations that generate the disturbance commonly known as flicker. The experimental tests are based on an ad-hoc high-accuracy measurement setup, where the devices under test are considered as “black boxes” to be characterized in the presence of the relevant signals. Two simple indices are introduced for the comparison among the different tested PMUs. The results of the investigation highlight possible critical situations in the interpretation of the measured values and provide a support for both the design of a new generation of PMUs and the possible development of an updated synchrophasor standard targeted to distribution systems.
1. Introduction
Whatever new management/business models can be envisaged for modern power systems, they are based on the availability of suitable information and, consequently, new measurement solutions are required for their practical implementation. In particular, the increasing complexity of the electric distribution grids, with, for example, the growing penetration of distributed generation plants fed by renewable energy sources, as well as the increasing relevance of PQ disturbances, calls for critical changes in network monitoring. The smart grid (SG) paradigm, in its several different declinations, emphasizes the power system as a cyberphysical system, where information quality is critically dependent on coordination among elements composing a distributed system. In this context, the primary involved factors are accuracy, cost-effectiveness, synchronization, communication quality, reliability, and timeliness. The transition toward a smarter network management approach thus implies the need for a new and better performing measurement infrastructure.
To this purpose, the possibility of exploiting at a distribution level the benefits of high-performance measurement devices and systems, currently deployed in the transmission grids, and can be explored. This refers in particular to the synchrophasor technology, which is the key element of modern WAMSs. In WAMSs, synchronized phasors, frequency, and rate of change of frequency (ROCOF) are measured by the PMUs which are sent to the corresponding phasor data concentrator (PDC), where these data are collected, stored, and correlated, using the absolute time reference associated with every measured value [1,2,3]. The main features of PMUs and WAMSs allow them to outperform the classical architectures based on supervisory control and data acquisition (SCADA) in terms of accuracy, synchronization, reporting rate, etc. For this reason, the number of PMUs and PDCs installed is growing quickly in different countries.
Even though the overall performance of a WAMS depends on the behavior of all its components, including the communication infrastructure, the first uncertainty source to be considered arises from its “sensing” element, namely the PMU. Thus, it is of utmost importance to define the metrological performance expected from PMUs under different possible operating conditions.
This goal is currently accomplished mainly by applying the latest standard IEEE/IEC 60255-118-1-2018 [1], as well as the guides [2,3] and standards [4,5,6], representing reference documents for synchronization, calibration, testing, and installation of PMUs. The test conditions and the relevant limits defining the performance classes in these standards clearly reflect the fact that PMUs were originally conceived for the monitoring requirements of transmission systems [7,8,9,10].
Several projects have been already funded worldwide on the possible applications of synchrophasor systems to distribution grids [11]. To assess the practical feasibility of such applications, the fact must be stressed that the characteristics of the electrical quantities in these systems may differ substantially from those considered as reference test conditions in [1] and, consequently, the metrological performance of the PMUs may substantially differ as well. Therefore, to effectively extend the synchrophasor technology to the distribution level, it is necessary to test the PMUs with more realistic signals. In particular, several power quality (PQ) disturbances may affect the voltage in distribution networks, see for example [12,13,14]. They are defined, for example, in the standard describing the main characteristics of the AC voltage in public low, medium, and high voltage networks, under normal operating conditions [15]. It is possible to mention several papers discussing PMU characterization results, obtained considering all or most of the standardized tests (see for instance [16,17,18,19,20]). On the contrary, PMU measurements obtained considering signals that better represent the realistic conditions of distribution systems, and thus are affected by possible PQ issues, are still not appropriately analyzed. Among them, voltage fluctuations, causing the PQ disturbance known as flicker, are assuming an ever-increasing role [21,22]. This is witnessed, among others, by the recent document released by the CIGRE WG C4.111 [23].
Flicker-generating voltage fluctuations can be challenging for PMU characterization, since the frequency ranges considered for the quantification of these signals are spread across quite a wide frequency band. Thus, depending on its specific frequency, a fluctuation can be considered as either a dynamic signal of interest, which PMUs are expected to follow appropriately, or a disturbance to be rejected.
By highlighting the lack of a clear interpretation, in the international standards on synchrophasors of the PMUs behavior during the voltage fluctuations outside the modulation range, this work aims at emphasizing the possible different behaviors of current commercial PMUs in the presence of these signals and, thus, the risk of an incorrect/ambiguous analysis of the electrical phenomena under investigation. In particular, the relationship of the PMU’s behavior with different reporting rates and maximum modulation bandwidth will be discussed.
Unfortunately, most commercial PMUs do not provide clear and comprehensive information on the implemented algorithm, making it necessary, for the user, to have a proper characterization process tailored for the unconventional conditions of interest. A first study about the possible misinterpretations of the data measured by a PMU in the presence of voltage fluctuations was presented in [24]. Starting from the outcomes of [24], this paper presents a systematic and detailed study of the performance of commercial PMUs in the presence of different types of voltage fluctuations. To this purpose, the methodological approach has been changed with respect to [24], moving from a “controlled” situation, where the algorithms used by the measurement devices are known, to a more realistic and practical condition, where all the measurement devices are “black boxes” to be experimentally characterized. Furthermore, the analysis has been extended also by considering, besides the synchrophasors, the frequency and ROCOF, and by introducing and discussing two simple indices, for the sake of a more quantitative and meaningful comparison among the different tested PMUs.
The study is based on an ad-hoc experimental setup and an appropriately designed test suite following the technique recently suggested in the Annex I of [1] to determine the actual measurement bandwidth of the PMUs. The characterization tests have been inspired by [15] and by the latest release of the international standard about flickermeters [25]. The dependence of the PMU behavior on the specific configuration of the device (reporting rate, parameters of the measurement algorithm, etc.) is discussed. The potential practical issues, or even the conceptual incongruences, that can emerge in the interpretations of PMU measurement results obtained in these operating conditions are highlighted.
The structure of the paper is organized as follows: Section 2 discusses the relationship between the models of voltage fluctuations and the modulation and out-of-band signals described in the PMU standards; Section 3 presents the architecture of the test setup and the evaluation process considering two possible interpretation of the results; Section 4 presents the results obtained from three different commercial PMUs, focusing on both total vector error (TVE) performance and frequency measurement results, and Section 5 highlights the conclusions.
2. Voltage Fluctuations and PMU Requirements
2.1. Models of Voltage Fluctuations
In the international electrotechnical vocabulary, the phenomenon known as flicker is defined as “impression of unsteadiness of visual sensation induced by a light stimulus whose luminance or spectral distribution fluctuates with time” and is generated by fluctuations of the voltage root mean square (rms), caused by the varying operating conditions of industrial loads and/or generators.
According to [15,25], the flicker severity, i.e., the intensity of flicker annoyance, is evaluated on both a short term ten-minute period and a long term two-hour interval, estimating the indices “short-term flicker”, Pst, and “long-term flicker”, Plt, respectively, both expressed per unit (see also [26] for further details on Pst). The standard [25] defines the parameters of the reference signals to test the flickermeter.
Nevertheless, the report [23] focused on the effects that voltage fluctuations may have on the behavior of non-lighting equipment, causing possible malfunctions, heating effects, loss of life, and even equipment failure. Thus, this study opened the door to the definition of compatibility level specifications not based solely on lighting products.
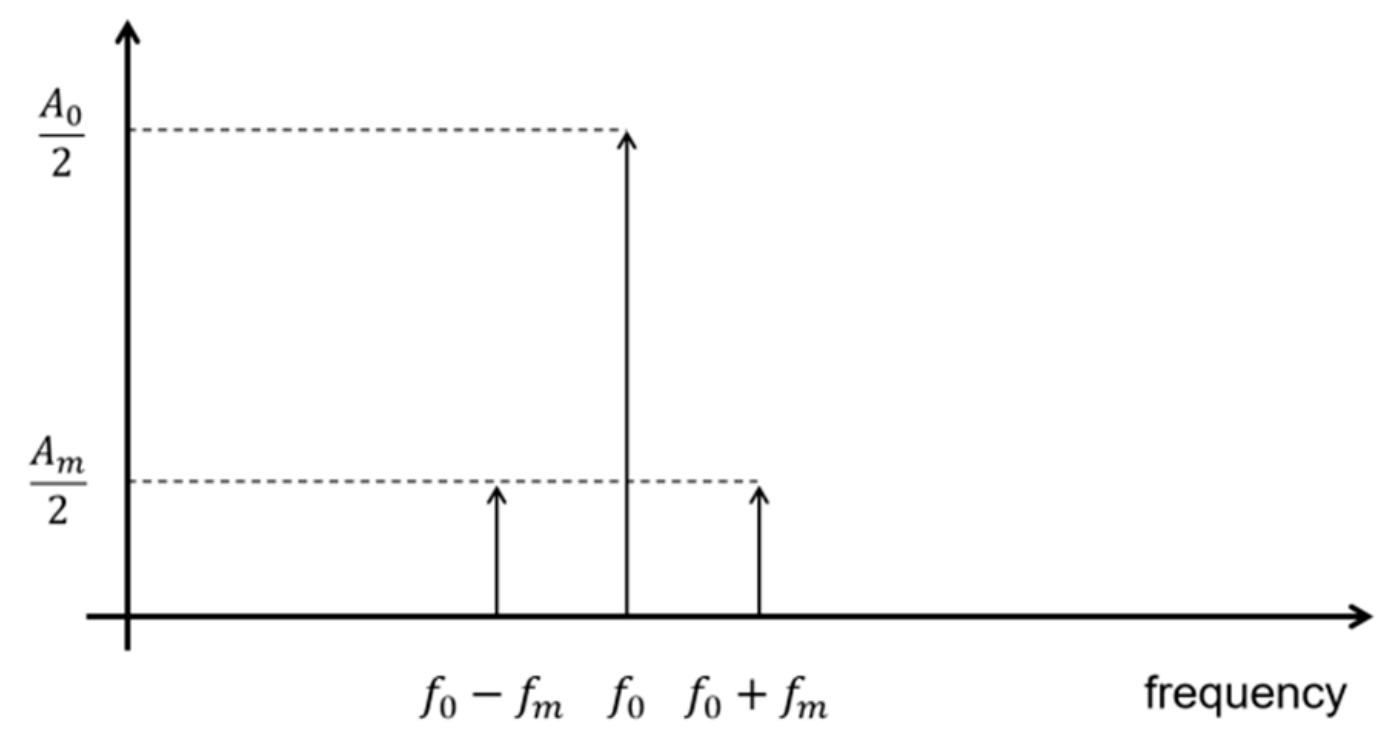
Voltage fluctuations can be modeled using an amplitude modulated signal. As is well known, modulating a sinusoidal signal having fundamental frequency f0 and amplitude A0 by a sinusoidal signal with modulating frequency fm and amplitude Am gives rise to two additional spectral components (f0 ± fm) symmetrically placed around f0 (Figure 1).
According to [25], the frequency range of the modulation signal spans from 0.5 Hz to 33.33 Hz. This applies to 50 Hz systems. Considering 60 Hz systems, the phenomenon is modeled with a modulation frequency that ranges from 0.5 Hz to 40 Hz.
2.2. Modulations and Out-of-Band Signals in Standard PMU Testing
The synchrophasor standard [1] defines two classes of performance: P and M. The P class is suitable for applications that need speed and low latency, while the M class is suitable for applications that require a better rejection of disturbances. An entire test suite is defined for each class and performance specifications are given for each test in terms of TVE, frequency error (FE), and ROCOF error (RFE). The TVE represents the synchrophasor error and is defined as:
that is the relative magnitude of the vector error (difference between the measured and reference synchrophasors) with respect to the magnitude of the reference phasor. TVE is typically expressed as a percent value. As far as FE and RFE are concerned, their absolute values are used as indices. The standard defines limits for these three indices together, with additional limits for latency and step-response parameters.
Focusing on the PMU test conditions reported in the synchrophasor standard, two tests can be considered as related to voltage fluctuations, where the quantities of influence depend on the class of performance:
- The amplitude modulation test, in which the signal at nominal frequency has a time-varying cosinusoidal amplitude. This test signal is introduced to be representative of a dynamic condition that the PMU must be able to measure. Thus, the synchrophasor magnitudes estimated in this condition are expected to follow the signal amplitude evolution. According to [1], to guarantee the interoperability of PMUs from different manufacturers, the device performance must remain within the given TVE, FE, and RFE limits when the modulation frequency is up to 2 Hz, in the case of a p-class device, and 5 Hz for M-class PMUs.
- The out-of-band (OOB) interference test, in which the signal is affected by a single interharmonic component. Interharmonics are considered as disturbances and M class PMUs (the only PMUs for which OOB test specifications are given) must properly filter them out.
Besides these requirements, the guide [4] and the standard [1] define for the PMU an in band range (also indicated as passband in Table 3 of [1], which includes the modulation frequency range) and a stopband region (including the OOB interference frequencies). In a simplified way, the PMU passband range is determined based on both the nominal frequency f0 and the reporting rate Fs as follows:
indicating the Nyquist bandwidth of the PMU with respect to its reporting rate (thus giving an idea of the maximum speed of dynamic phenomena the PMU can follow without aliasing). The complementary region of the spectrum is thus considered as a stopband region that includes disturbances to be rejected.
According to [1], synchronized phasor measurements should be evaluated with a reporting rate submultiple or multiple of f0 (e.g., Fs = 10, 25, 50, and 100 frames/s, fps in the following, for f0 = 50 Hz). PMUs can be also configured with a reporting rate lower than 10 fps, but, in this case, they are not subject to the dynamic requirements. For the special case, where Fs = 100 fps, all the frequencies in the range from 0 to 2 f0 are considered in band. In this case, according to [1], the OOB interferences are considered in the frequency range from second to third harmonic.
A typical reporting rate used in transmission grids is half the system frequency [29], which is a significant improvement compared to traditional monitoring technology based on SCADA. It is worth highlighting that the Fs value should be chosen according to the type of electrical phenomenon that is of interest, but it is also influenced by the constraints imposed by the monitoring and management architecture.
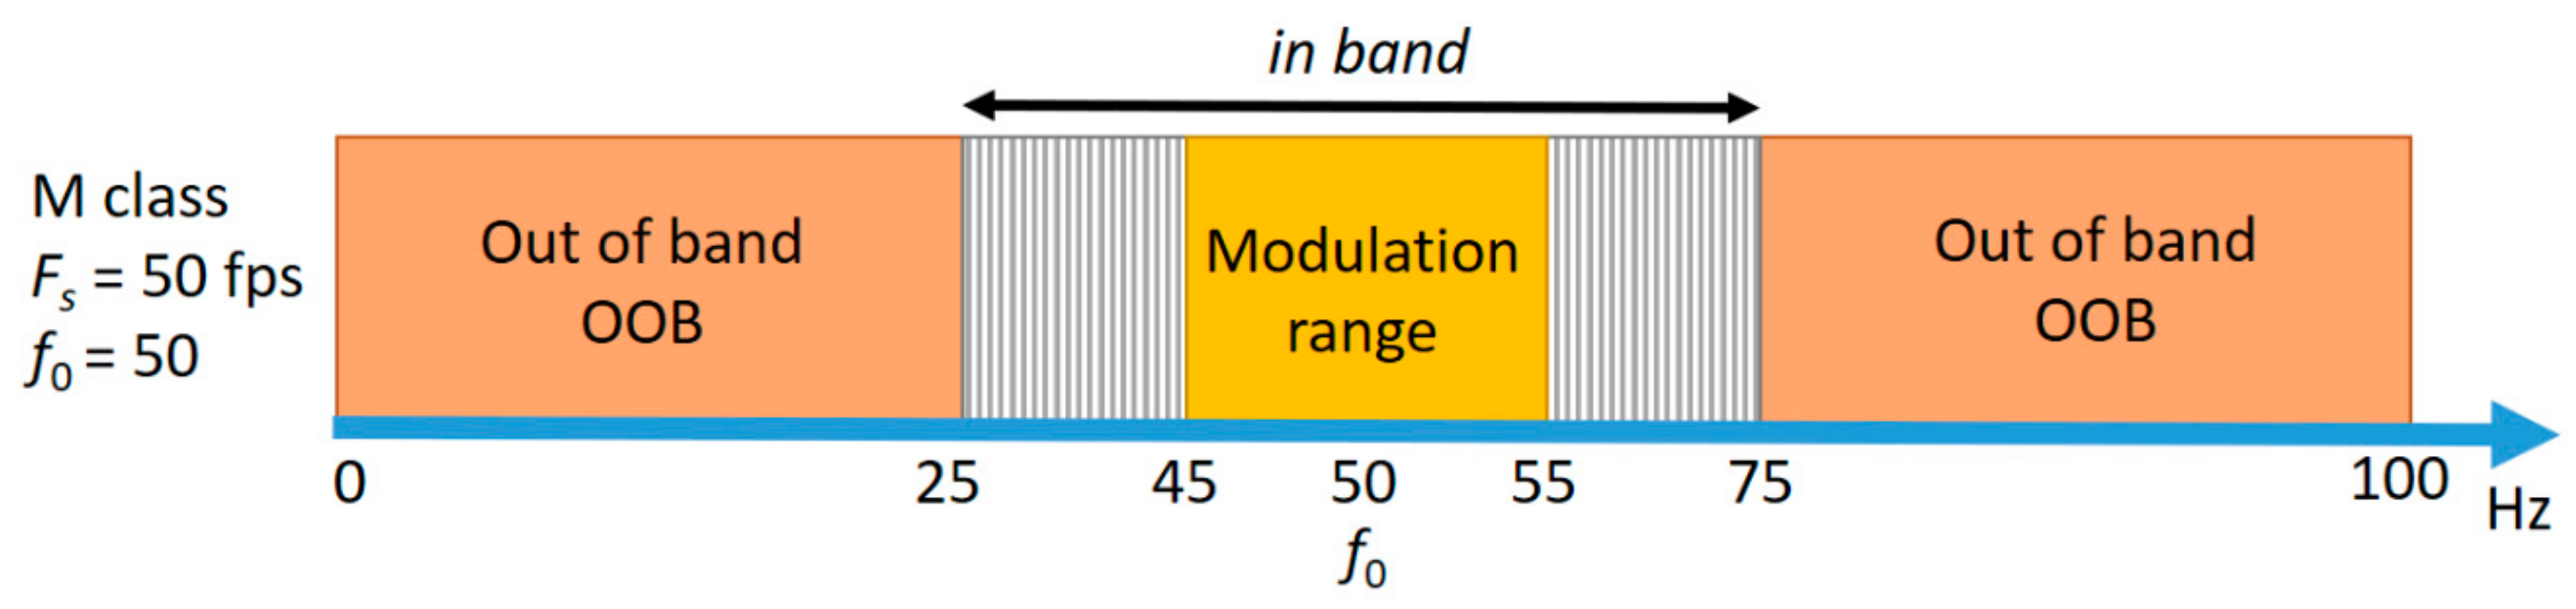
As an example, Figure 2 shows the different frequency bands for the case of an M-class PMU configured with Fs = 50 fps. In particular, the ranges represented with gray stripes in Figure 2, included in the in band range, highlight the large transition regions that are not involved in the tests considered in the current version of the synchrophasor standard [1], since no test signals present frequency components in these ranges.
2.3. Voltage Fluctuations and PMU Specifications
Different situations may arise when voltage fluctuations are present in the PMU input signal, depending on the frequency of the phenomenon. If the fluctuation frequency exceeds the PMU Nyquist frequency, Fs/2 (see [1,30] for details), the two spectral components fm shown in Figure 1 fall within the PMU stopband (OOB regions in Figure 2) and are thus considered as disturbances.
On the other hand, fluctuations up to the modulation frequency limit defined in [1] should be considered as amplitude modulations, i.e., dynamic phenomena that a PMU is requested to follow carefully.
Between these two ranges, there are frequency ranges (grey stripes in Figure 2) that are within the in band region defined in [1,3], but are not explicitly considered by any specific tests in either of the two ways. Therefore, PMU measurements may lead to different interpretations of flicker-generating voltage fluctuations, depending on the considered frequency ranges or on the PMU implementations and configurations, thus giving rise to possible debatable situations [24].
As already recalled, standard [1] suggests testing the PMU with amplitude and phase sinusoidal modulated input signals and sweeping the modulation frequency in a range whose upper limit varies from 2 Hz to 5 Hz, according to the PMU compliance class (which is usually configured in commercial PMUs).
However, the electrical phenomena observed in the real context of modern electric networks could be faster than 5 Hz. In [31], for instance, it is recalled that, during transient stability swings, oscillation frequencies can be in the range of 0.1–10 Hz, while in [32] it is specified that “The spectrum of frequency of interest with potential oscillatory activity goes from 0.1 Hz up to 50 or 60 Hz”.
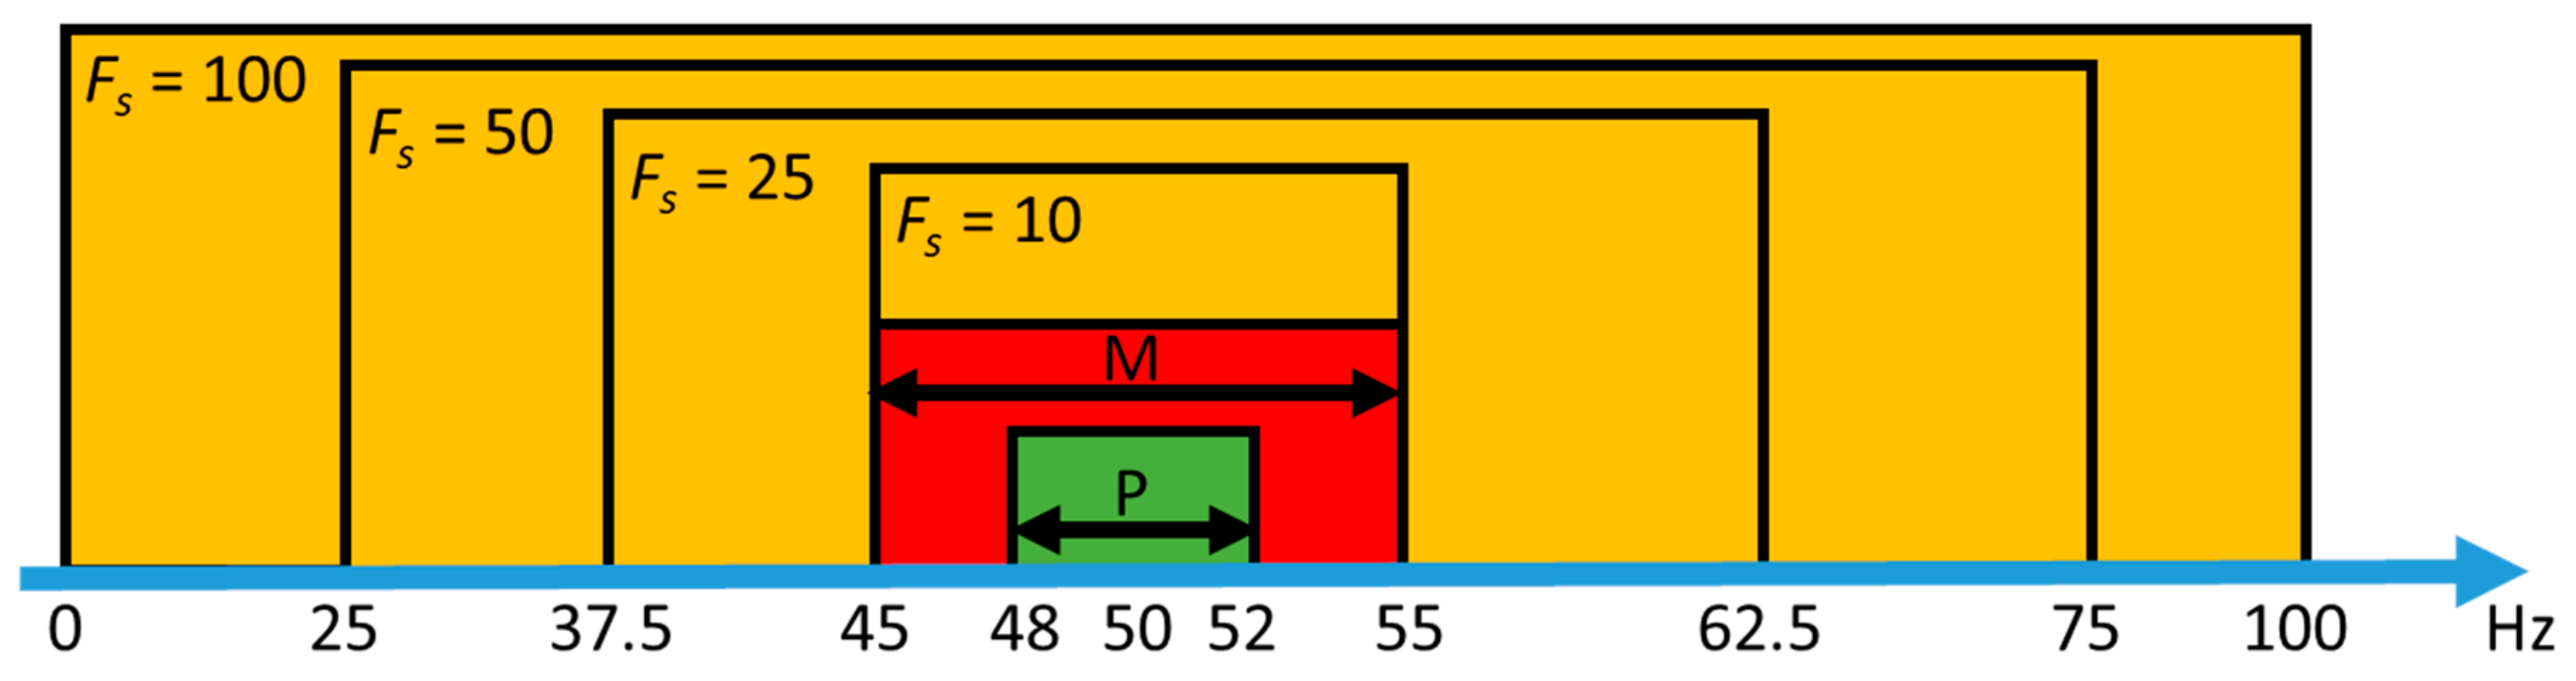
The frequency ranges involved in these phenomena, which can occur in the electric grids at every voltage level, cannot be adequately analyzed even with the maximum reporting rates currently defined for PMUs. For these reasons, [1] permits the use of other reporting rates. Even higher Fs are considered desirable [29] for applications trying to detect subsynchronous resonance. However, the increase of the reporting rate should be accompanied by a suitable increase of the modulation frequencies used for the bandwidth test. If this does not happen, the higher rates might not properly reflect the actual measurement capabilities of the PMU. In order to show this possible incongruence, Figure 3 points out the frequency band fm ± Fs/2 for different Fs values, along with the maximum modulation frequencies considered in the standard tests (compliance with the M class and P class), whose position does not change for different values of Fs.
Finally, it should be taken into account that the behavior of the PMUs in the presence of these kinds of signals may strongly depend on the adopted measurement procedure, but PMUs’ manufacturers usually do not provide enough information on the implemented algorithms. At the same time, PMUs are also specifically targeted to distribution systems which are usually claimed to be compliant with the only standards currently available and thus they are tested under the test conditions defined in those documents (i.e., [1,2,3,4,5,6]), which, as recalled above, were driven by the needs of the transmission systems. Triggered by all the above considerations, in the following section, an appropriate experimental characterization test setup is presented, designed with the aim of analyzing the PMU performance in the presence of possible voltage fluctuations and putting in evidence concerning the risk of misinterpreting the relevant measurement results.
3. Test Setup
To analyze the behavior of PMUs in the presence of voltage fluctuations with different modulation frequencies, three commercial devices with different possible configurations have been tested. The problem is not to evaluate the accuracy of the measurements, but to first understand the reference value with respect to which such accuracy must be evaluated.
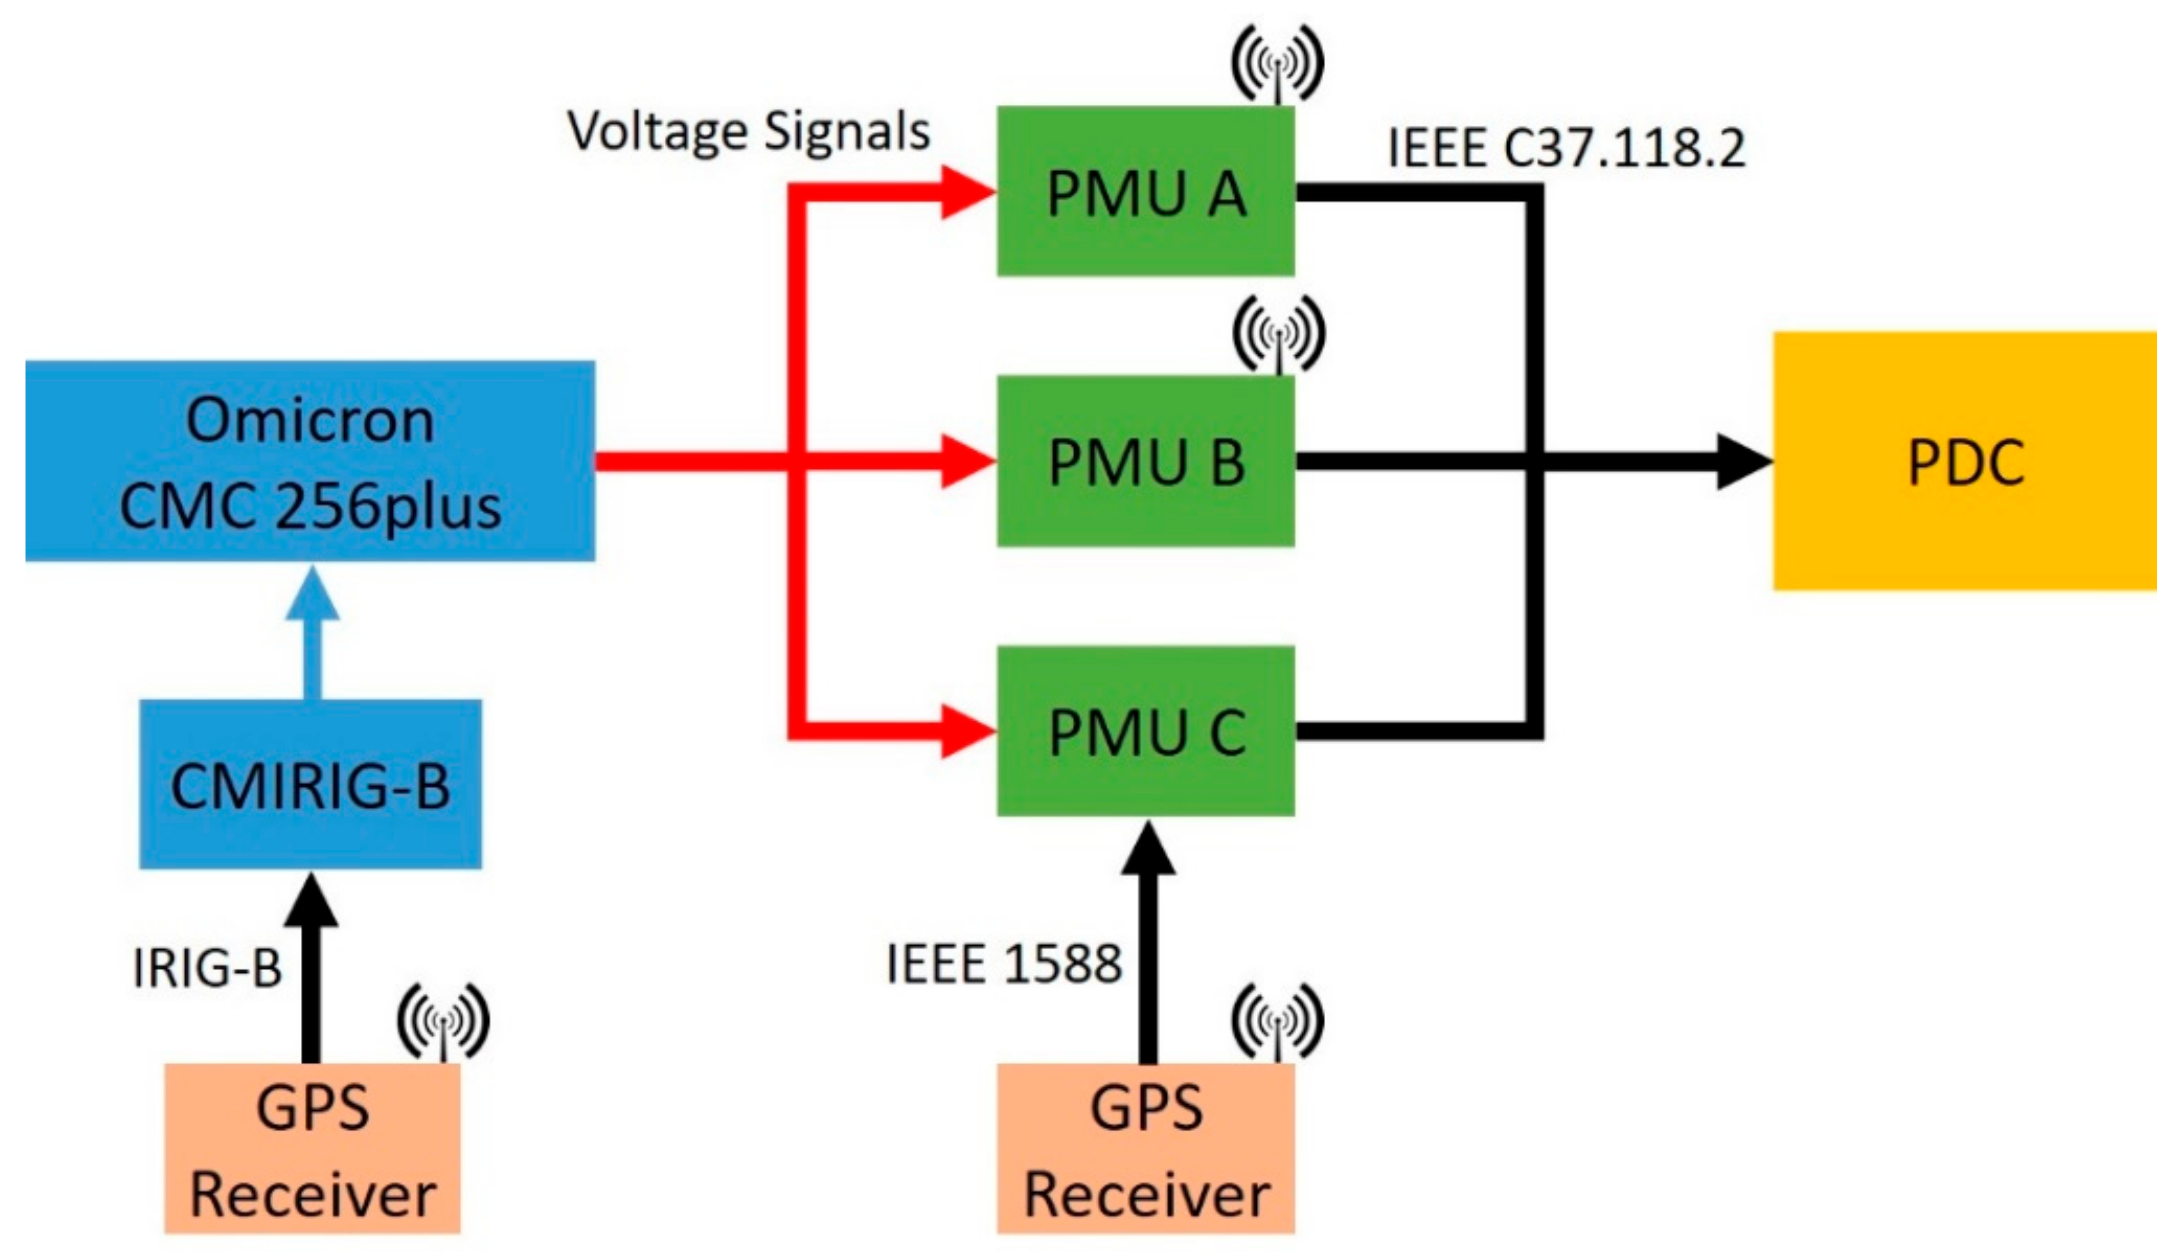
The commercial PMUs have been tested with the highest selectable reporting rate for a 50 Hz system ( or 100 fps) to evaluate fast dynamic events. The schematic representation of the test architecture is described in Figure 4. The chosen PMUs are characterized by several features: in the following, the main characteristics of each device under test (DUT) are reported.
PMU A is a device with a built-in GPS receiver able to measure the synchronised phasor up to 50 fps. The device is compliant with the 2005 version of the standard [4], and offers a wide range of configurations that might help in optimizing the measurement process. The two main selectable characteristics are the window type and window length, which define the characteristics of the weights employed to preprocess each sample record for synchrophasor extraction and thus directly impact on accuracy and latency of the measurement process. Any change or tuning of the parameters in the PMU algorithm can modify the performance of the device and make it suitable for a specific class. In the technical datasheet, a maximum TVE of 0.1% for all the contributions is reported, except for the estimation algorithm error. To underline different performances with the same reporting rate, the device has been tested with two different measurement configurations. For a more exhaustive comparison with the other devices, among the available configurations, the following ones have been used, inspired by those of the two algorithms suggested in the synchrophasor standard for p and M compliance classes:
- P-like configuration: Window type: triangular; window length: two cycles at nominal frequency.
- M-like configuration: Window type: Hanning; window length: seven cycles at nominal frequency.
PMU B is a programmable IED (Intelligent electronic device) characterized by a built-in synchronization provided by a GPS receiver. The device is fully compliant with [5] and presents two different measurement configurations, called P and M, respectively. The technical datasheet does not include any information about the implemented algorithm. The reported measurement accuracy is a maximum TVE less than 1%. The maximum reporting rate available in the device is 50 fps.
PMU C is compliant with [5]. The synchronization is obtained with the IEEE 1588 protocol through an external GPS receiver with the functionality of grand master [33]. The device is characterized by an up to 100 fps for the P configuration and up to 50 fps for the M configuration. The declared maximum TVE% is less than 1%.
The PMUs are tested using reference three-phase voltage signals generated by a power signal generator (OMICRON CMC 256 plus and CMIRIG-B) able to synchronize the phase angle of the generated signal, with respect to the UTC time reference. A GPS receiver Symmetricom with a time accuracy up to ±100 ns has been used to feed the CMIRIG-B module. The CMC 256 plus can also provide the PQ signals based on the tables specified in [25], which can be used for the calibration of a flickermeter. In particular, test signals that can be represented by the following voltage modulation equation are used:
where is the nominal system frequency, while and are the relative voltage change and the frequency modulation, respectively. Despite [25] defining different voltage changes for different test frequencies, a single level of relative voltage change is used in the following, for the sake of a clearer comparison. In particular, as suggested for the bandwidth test in [1], a 10% voltage amplitude modulation factor is used (). The different modulation frequencies adopted in the tests are specified in [25] and reported in Table 1. A maximum modulation frequency of 24 Hz is reported in the results when Fs is equal to 50 fps, according to the Nyquist limit represented by Equation (2).
The data from the PMUs under test are collected by a computer with PDC functionality. Afterwards, all the measurements and their time-tags are evaluated with a software developed in LabVIEW environment.
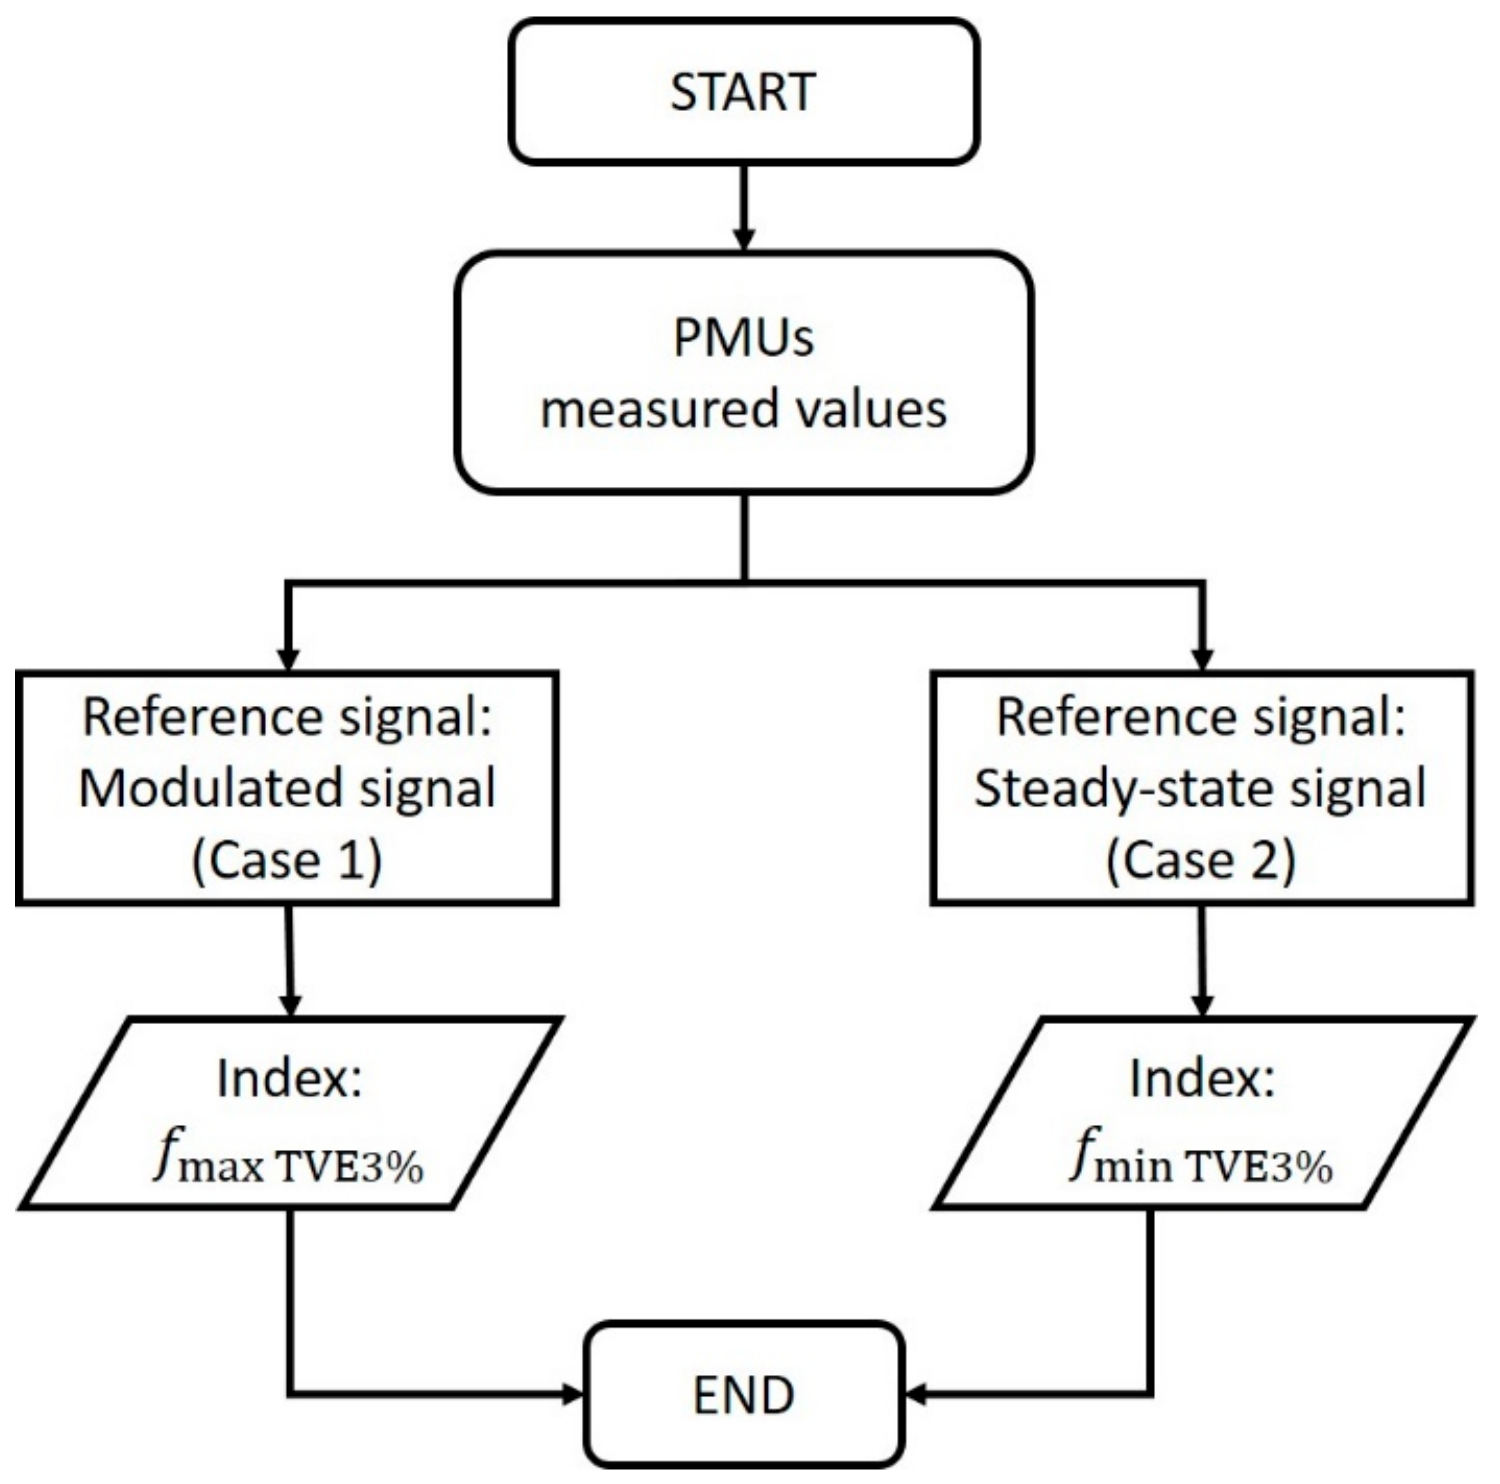
The synchronized phasors obtained from the DUT are evaluated using, as performance index, the maximum TVE% in one-minute measurement tests. The acquired data are evaluated with two different and complementary interpretations following the flowchart in Figure 5:
Case 1: The sinusoidal voltage changes are considered as signals of interest and thus the performance is evaluated as the ability of the PMU to follow the dynamic variations of the voltage amplitude for every modulation frequency.
Case 2: The sinusoidal voltage changes are considered as disturbances and the performance is evaluated as the rejection capability of the PMU.
FE and RFE values are also evaluated, and the outcome can be considered univocal, since all the measurements are compared with the reference values of 50 Hz and 0 Hz/s (for frequency and ROCOF, respectively), without any interpretation problems.
Besides the plots of the above defined errors, in the following, two concise indices will be used. Their definition is based on a threshold TVE% = 3%, which is the maximum error permitted under dynamic conditions in [1]. In particular, among the test modulation frequencies shown in Table 1, the highest value that allows a maximum TVE% < 3% in Case 1, which represents the actual PMU bandwidth, will be indicated as . The minimum frequency value, again among the test modulation frequencies of [25], for which the maximum TVE% < 3% in Case 2, i.e., the minimum frequency of a disturbance the PMU is able to adequately reject, will be indicated as It is important to highlight that these values represent useful parameters for the comparison, but, since the PMU can even implement nonlinear processing routines, they do not fully represent the PMU filtering behavior and only the full test analysis can address the characterization in the presence of fluctuations.
4. Test Results
In the following, the results of the experimental analysis for the aforementioned commercial PMUs are described in detail, focusing on both TVE performance and frequency measurement results.
4.1. TVE Results
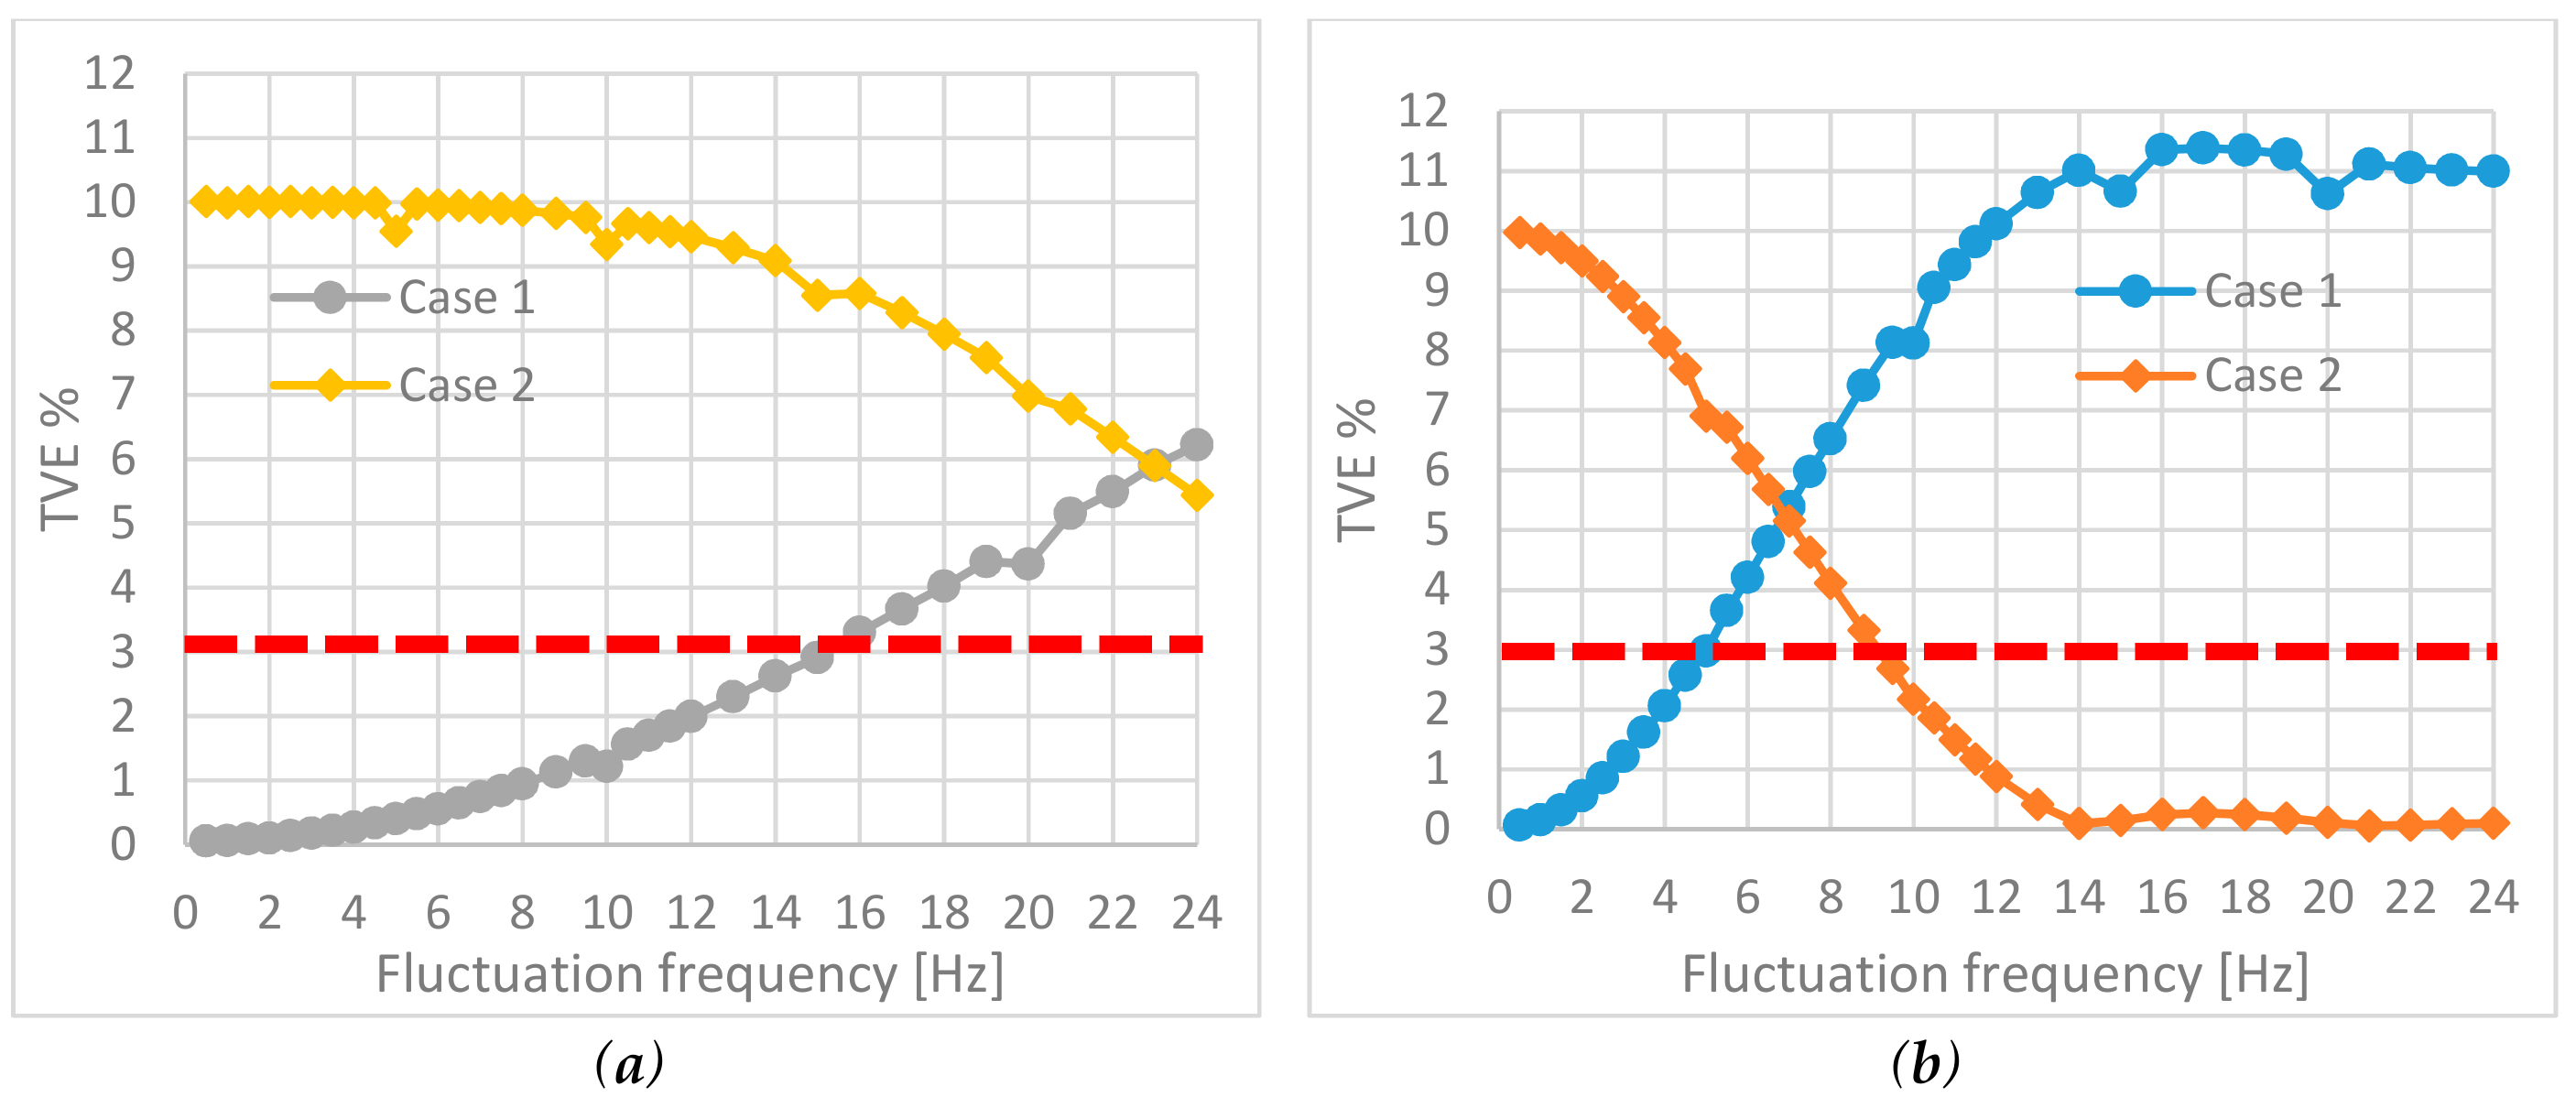
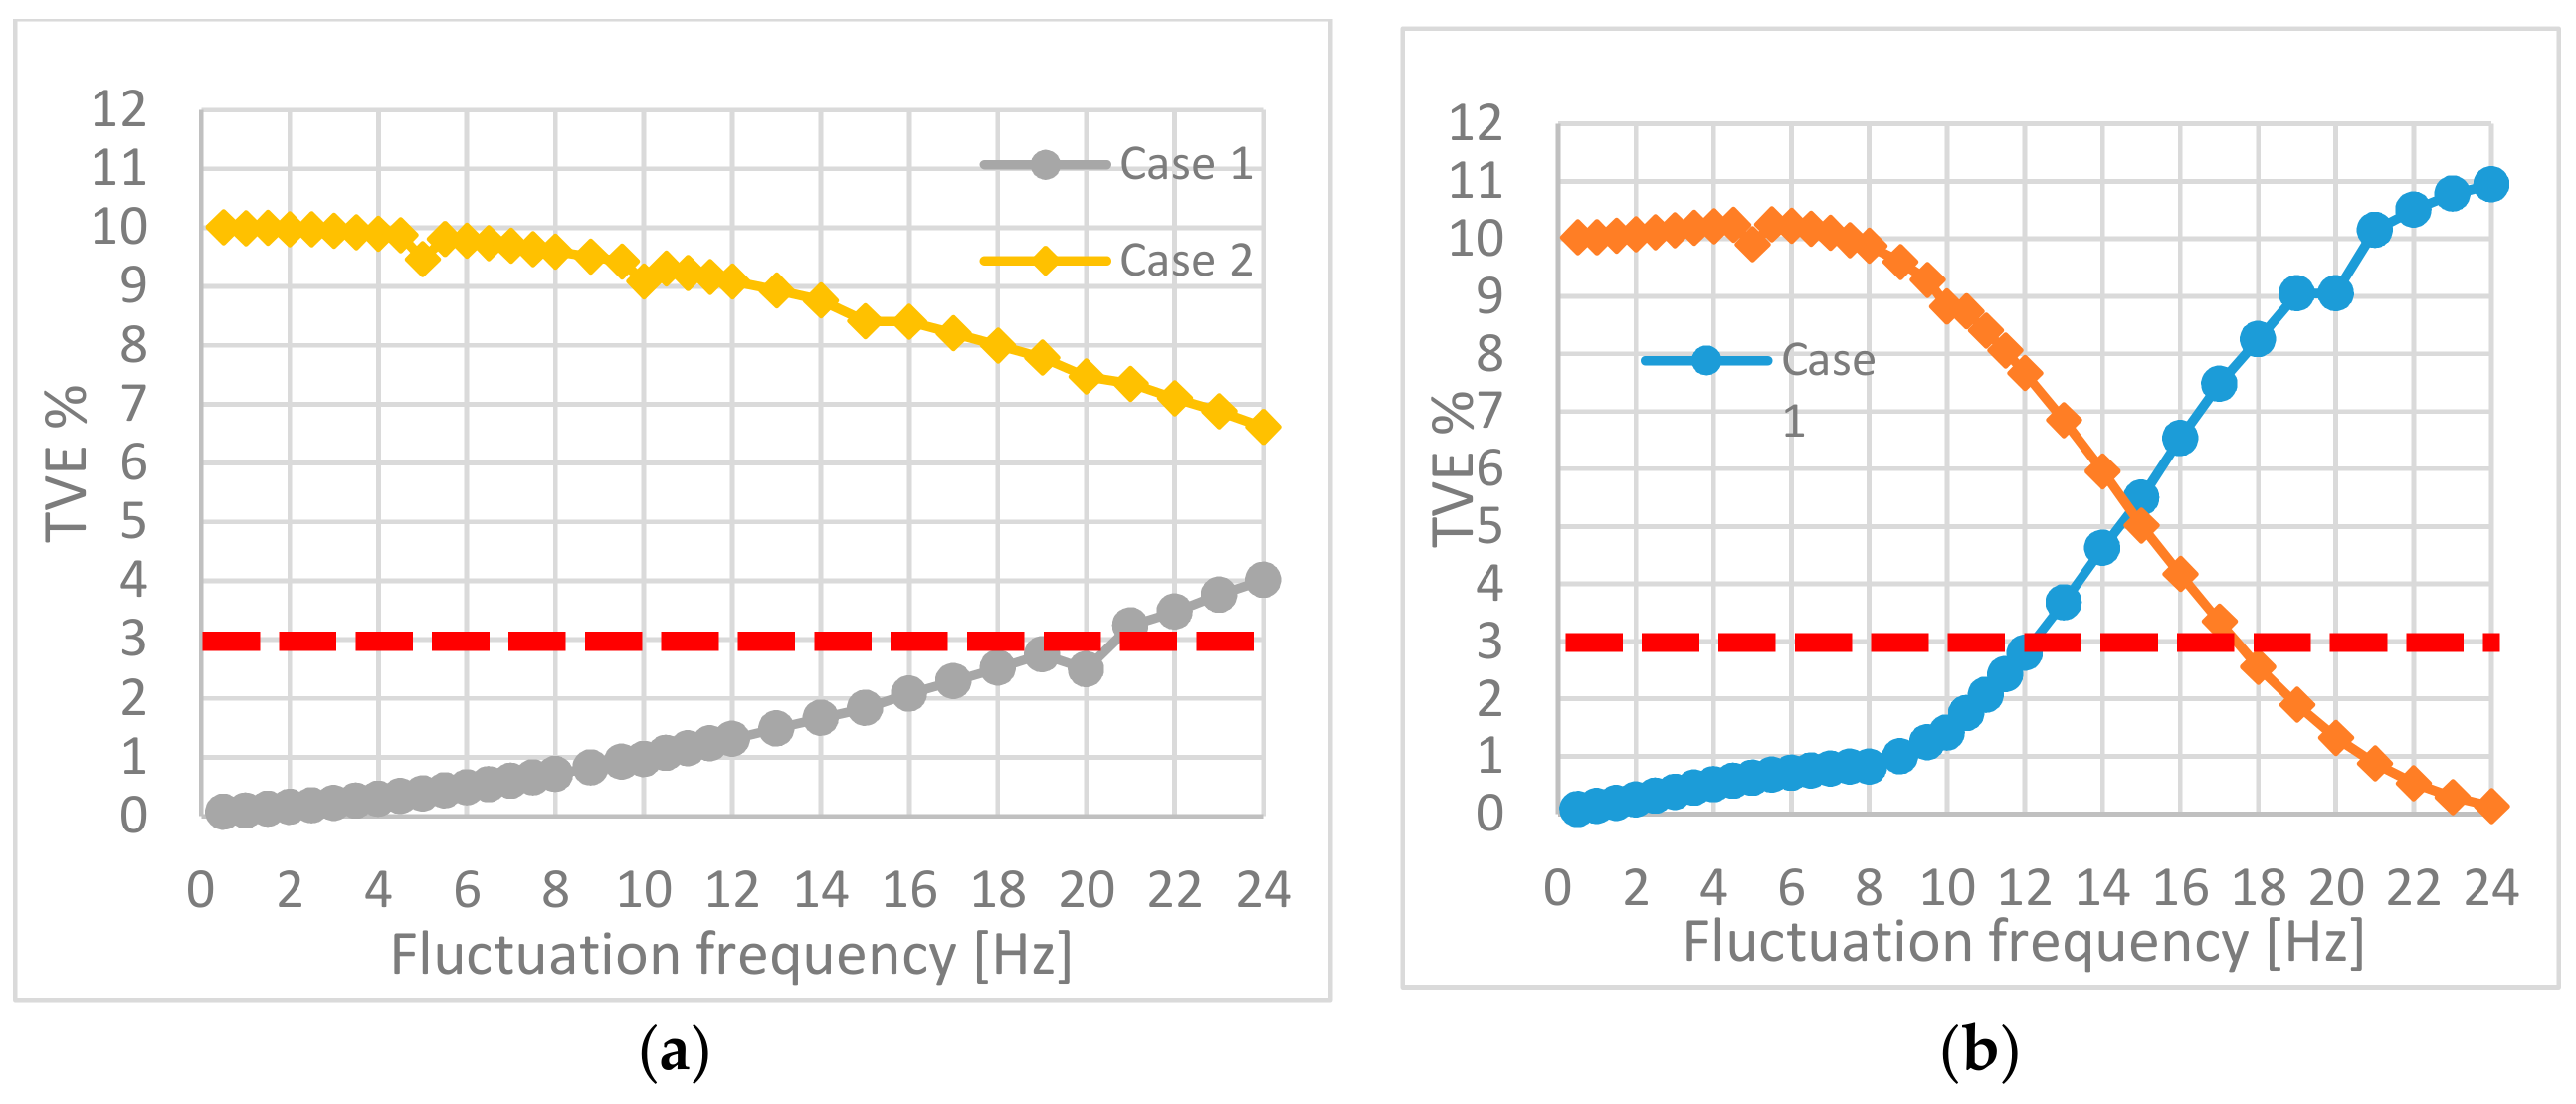
Figure 6a reports the results of TVE% for Case 1 and Case 2 using the “P” configuration of PMU A. As recalled above, with = 50 fps, the maximum frequency that can be tested to avoid aliasing is 24 Hz [34]. A horizontal red line at 3% is reported to allow defining and . In this case, it is Hz, whereas cannot be defined for this test, since PMU A with P-class settings is not designed to cancel interharmonics. This points out how important the definition of the measurement framework is, since the presence of fluctuations in the network is obviously independent of the PMU application context, and thus the behavior of a P-class PMU can become unpredictable if a dedicated characterization is not performed. Figure 6b shows the TVE for PMU A with M configuration. It results in = 5 Hz, while Hz.
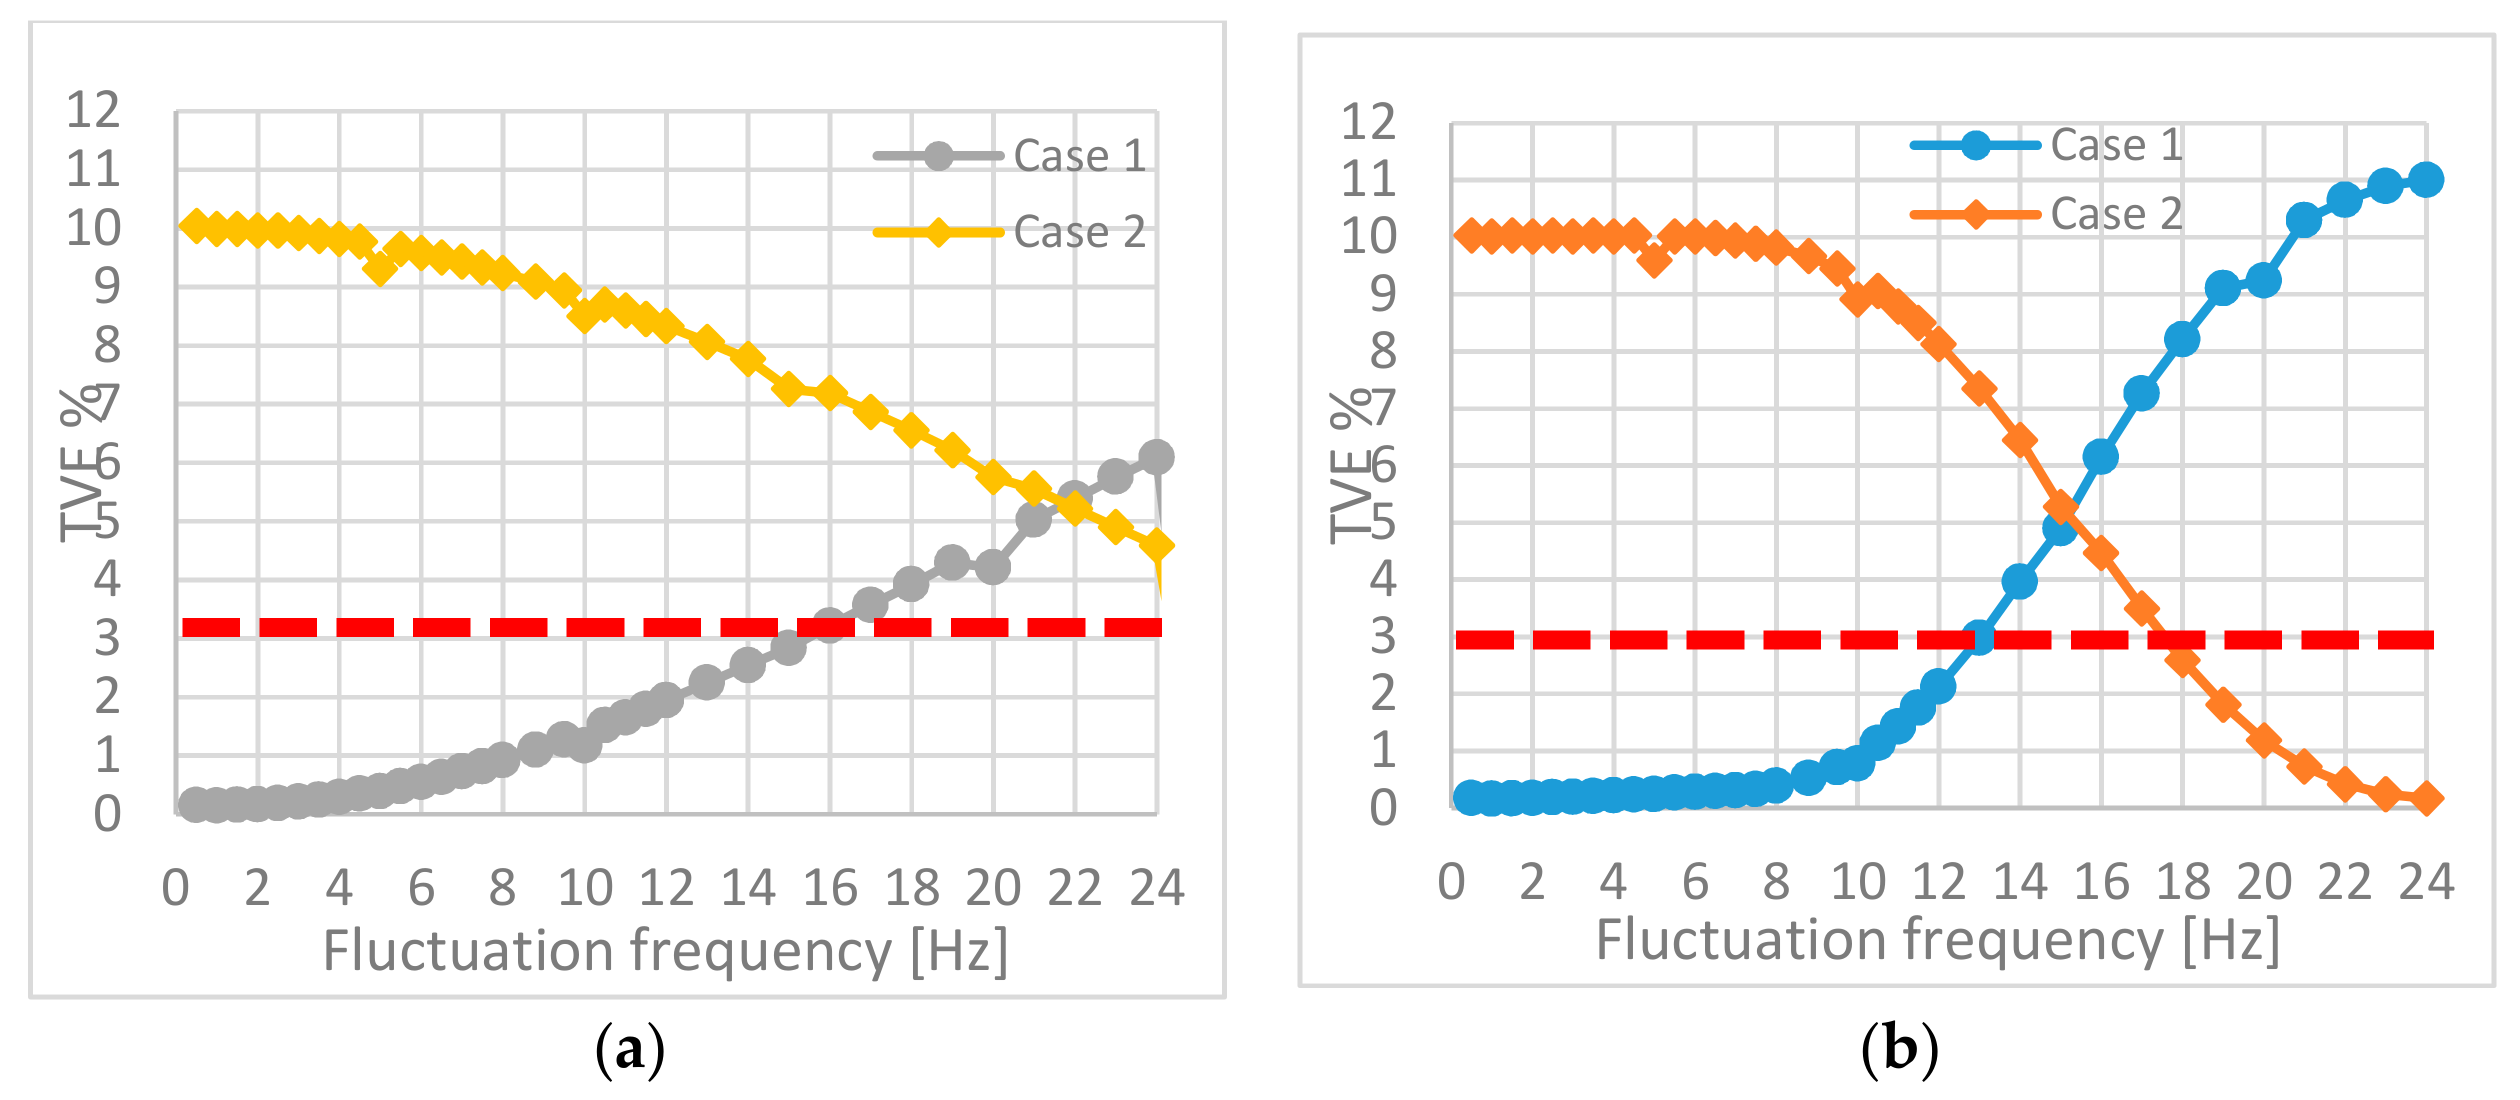
The results of PMU B with P configuration and = 50 fps are shown in Figure 7a. It is clear that PMU B is able to also follow fast amplitude modulation signals up to 20 Hz ( Hz). Again, it is not possible to identify a value for .
Unlike the P class, the M configuration (whose results for PMU B are shown in Figure 7b) is able to reject interharmonic interferences and, for this reason, it shows a much narrower passband. Fluctuations above 12 Hz ( = 12 Hz) cannot be correctly followed and the behavior in Case 2 entails, dually, a significant rejection of fluctuations above 18 Hz.
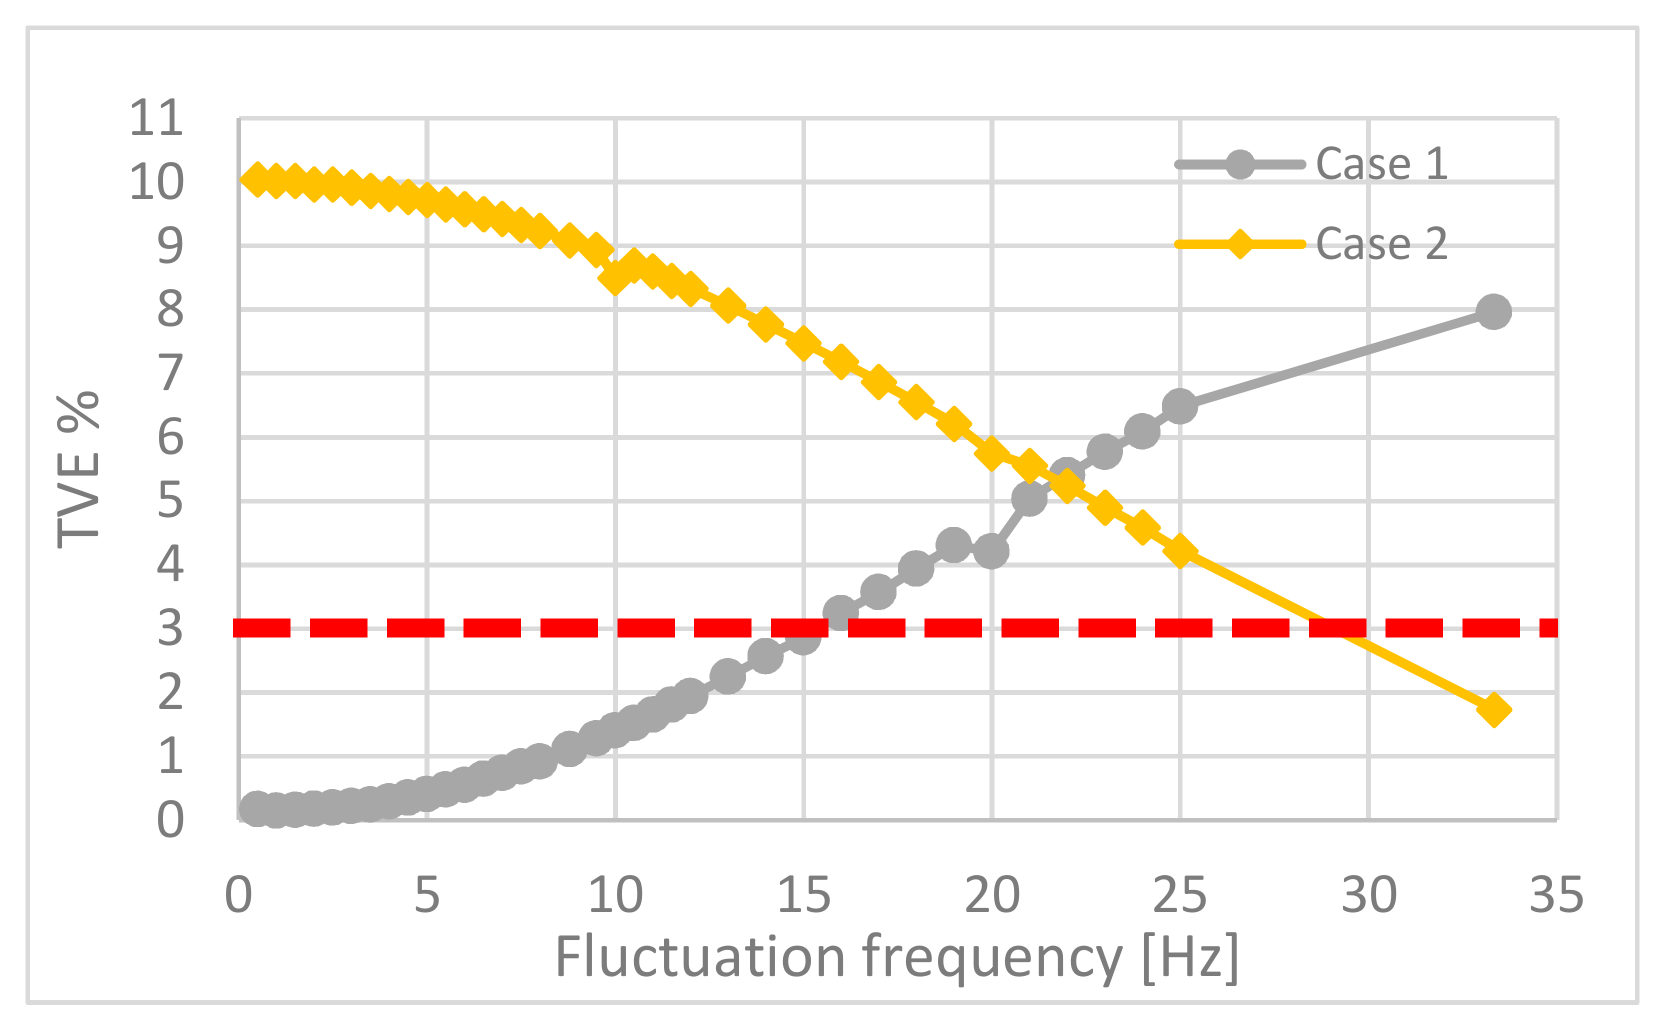
PMU C (Fs = 50 fps) with configuration P shows a behavior (see Figure 8a) like that of PMU A. In fact, it is = 15 Hz, while a value for cannot be defined. With configuration M (Figure 8b), instead, PMU C has a behavior similar to PMU B: reaches a value of 13 Hz, while is equal to 18 Hz.
PMU C is the only DUT with an available up to 100 fps for the P class, and Figure 9 thus shows the TVE for the highest reporting rate suggested in the standard [1]. The test frequency can thus reach 33.33 Hz, which becomes the (the corresponding TVE is 1.74%). For the other test frequencies, the behavior is the same as in Figure 8a, suggesting that the algorithm is the same as in the previous configuration.
Table 2 summarizes the results in terms of and . At = 50 fps values for are obtained only for the M class configurations, while at = 100 fps, the PMU C also reaches this limit when configured as P class. The results of PMU C with configuration P and with the different reporting rates are similar. In this case, an increased value of does not allow the ability to obtain an increased value of .
4.2. Frequency and ROCOF Results
As for FE and RFE computation, the reference values are characterized by constant values of 50 Hz and 0 Hz/s for frequency and ROCOF, respectively. To evaluate the performance, it could be useful to analyze the results by means of the limits suggested by the synchrophasor standard for modulation tests. This can give an indication, but it is important to remember that the fluctuation frequencies can be outside the modulation range. The P-class configuration allows a value of higher than the configuration M, thus meaning the possibility to follow faster fluctuations, but this result is accompanied by higher values of FE and RFE. For instance, during the tests, the maximum value obtained for with a P-class configuration is 20 Hz for PMU B, but in this same case, the values of |FE| and |RFE| are the highest obtained.
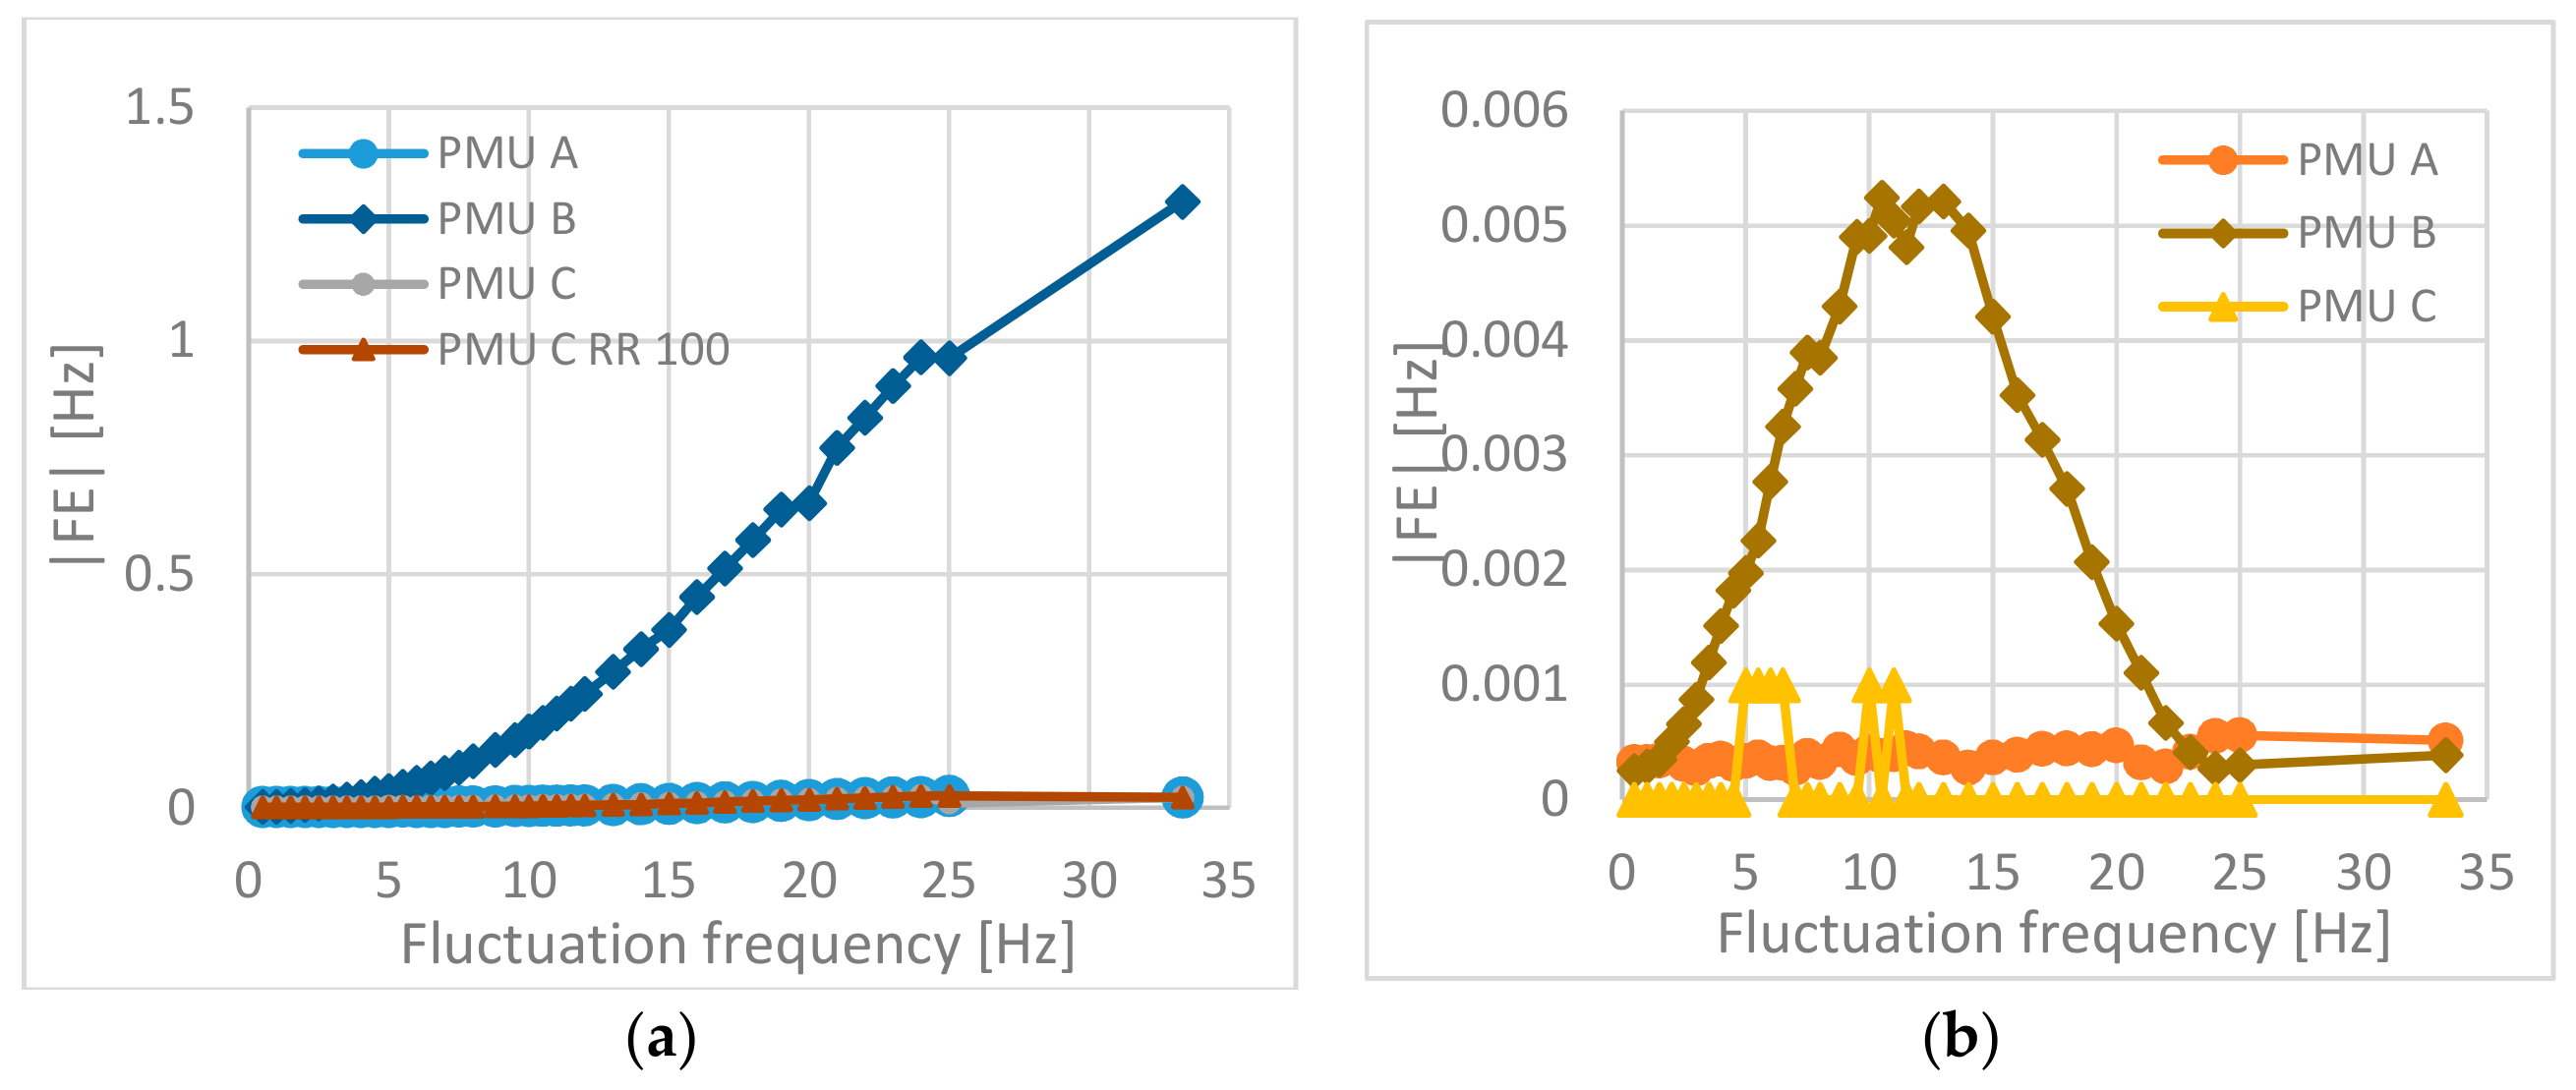
Figure 10a,b report the values of FE for configurations P and M, respectively, of the PMUs under test as a function of the test modulation frequency. The values of errors for PMU A and PMU C are always below the limits imposed for the bandwidth test for = 50 fps (FE limit is 0.06 Hz and 0.3 Hz for P class and M class, respectively). On the contrary, the FE of PMU B with configuration P increases with the increasing modulation frequency. Fluctuations thus have a strong impact on PMU B frequency measurements, which can easily become unacceptable even with much smaller voltage changes. With configuration M, instead, PMU B has lower accuracy for frequency measurements, which varies in a significant way with the fluctuation frequency. Finally, the FE results for PMU C with = 100 fps are very similar to those achieved with = 50 fps, confirming that the same algorithm is probably common to both reporting rates.
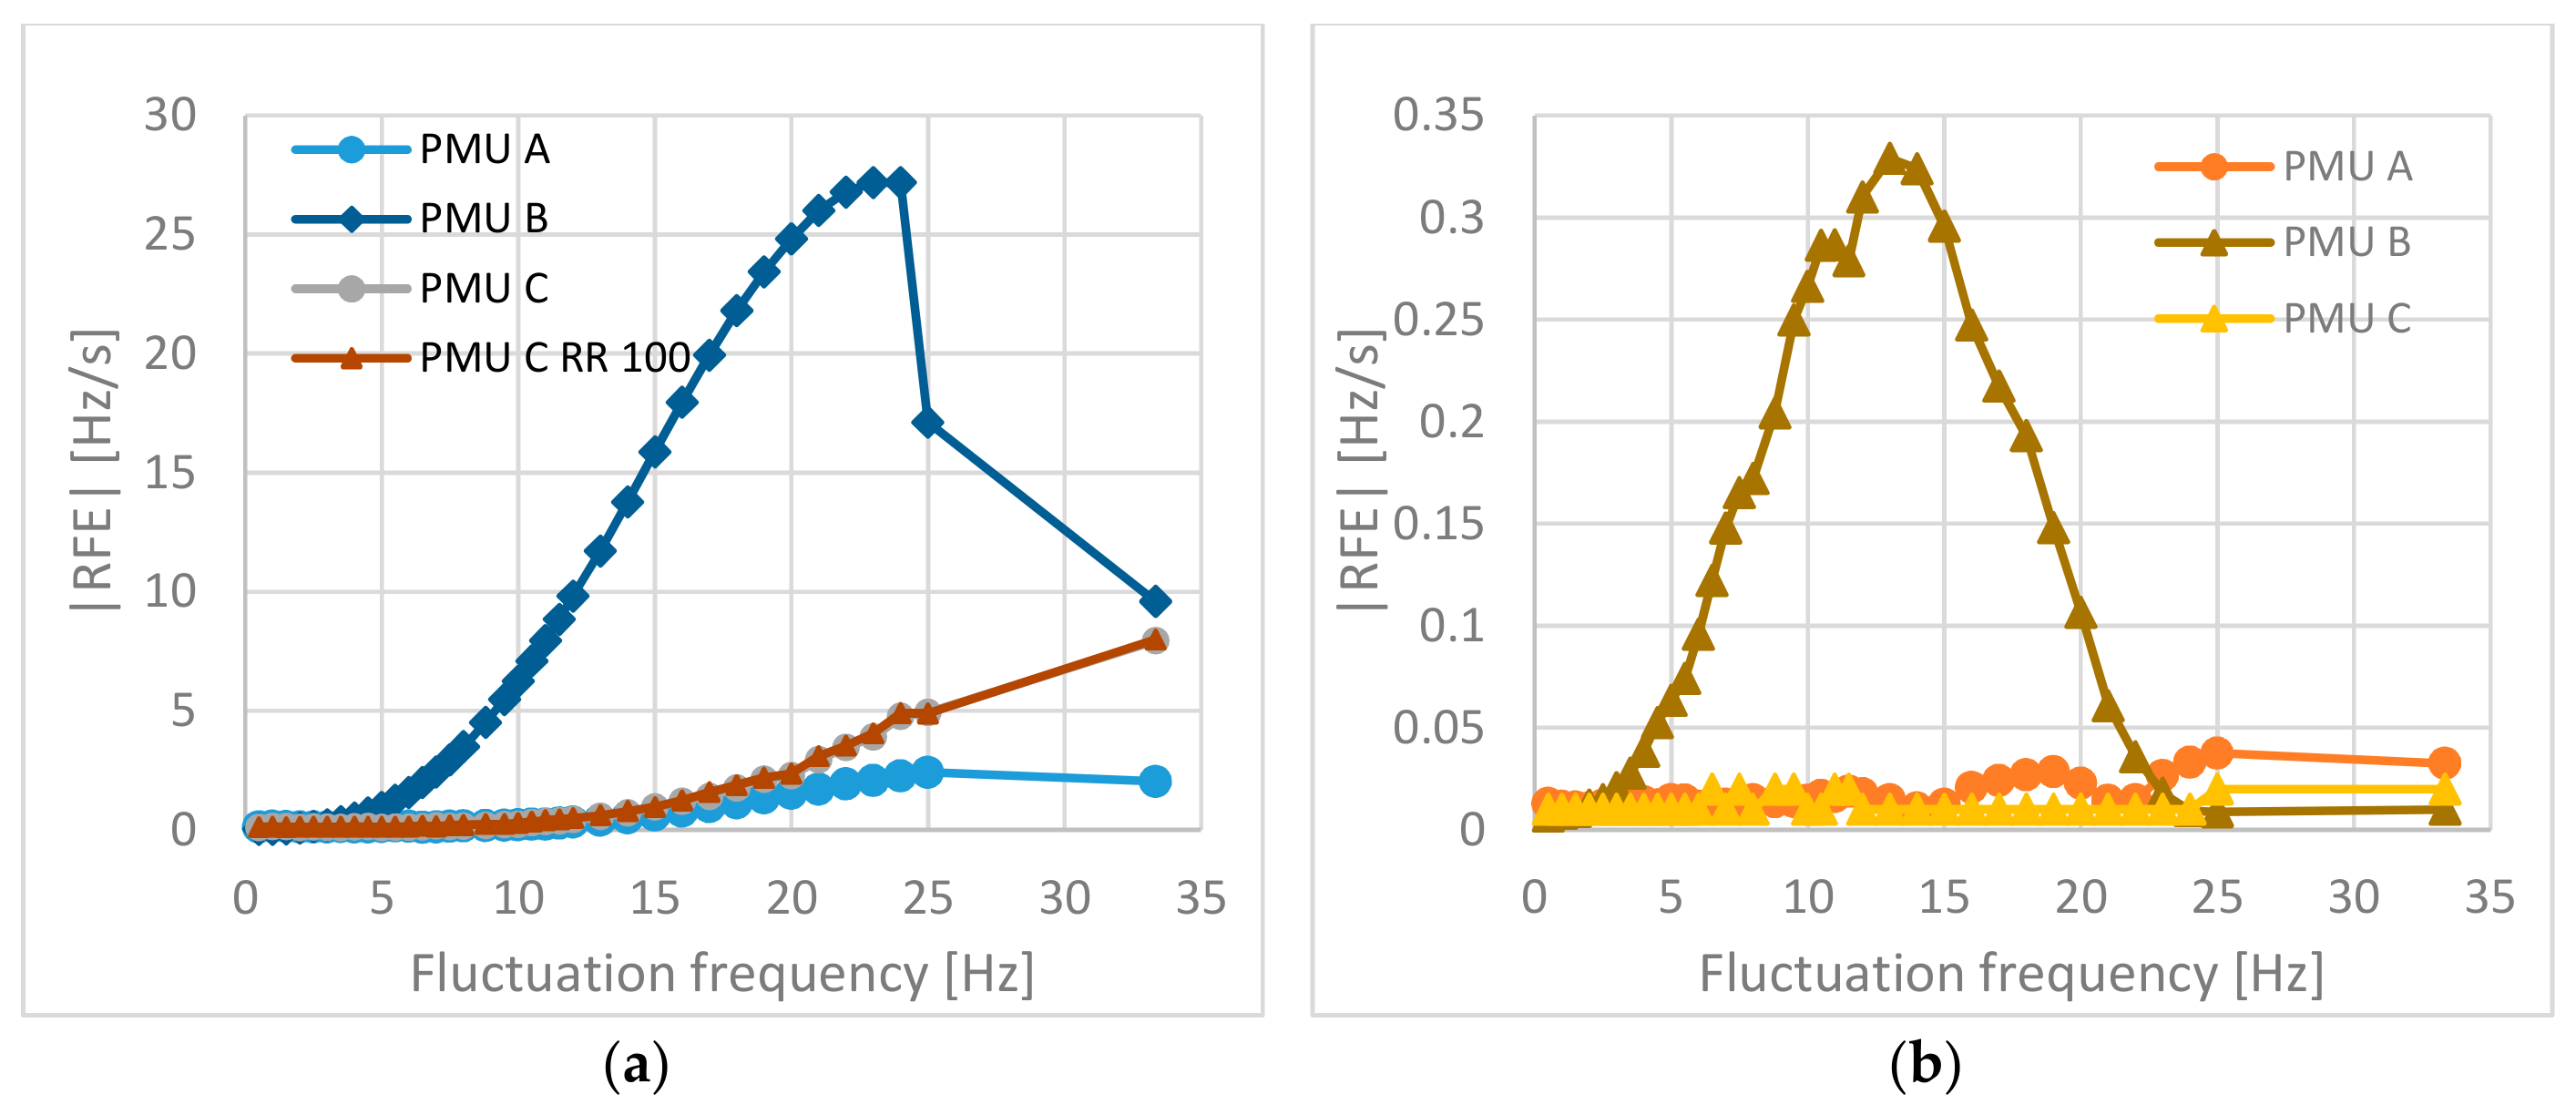
Analogously, Figure 11a,b show the results of the PMUs characterization in terms of RFE. The absolute RFE in Figure 11a increases with increasing modulation frequency for all the PMUs up to the Nyquist frequency, exceeding the P-class limit of 2.3 Hz/s defined in [1] for modulation tests. Moreover, also for RFE, the performance of PMU C (configuration P) remains almost the same when the reporting rate becomes higher than 50 fps. With the M configuration, the RFE is contained below the limit imposed by [1] (14 Hz/s, for fps). Even if the PMUs show different measurement accuracies, the RFE trend in Figure 11b suggests that fluctuations are either followed or cancelled without dramatically affecting ROCOF measurement. This once more highlights how every measured quantity has a different behavior under voltage fluctuations and the device specifications are not sufficient to give a representation of measurement performance in the presence of common PQ events.
5. Conclusions
The possibility of using high-performance measuring instruments, such as the PMUs, in a rapidly evolving context, such as that of electrical distribution networks, is attracting great interest from the operators of such systems. However, an effective use of these instruments requires that their performance be guaranteed in the conditions in which they will actually operate. This means, first of all, checking their behavior in the presence of voltage and current signals affected by significant power quality disturbances.
In this context, this work has presented and discussed the results of experimental tests carried out on some commercial PMUs in the presence of voltage fluctuations that give rise to the flicker. The performed characterization does not aim at highlighting the best or worst performance of the tested commercial devices, but at pointing out how possible different interpretations could be given to the PMU outputs in the same signal, depending on the quantity of interest. It emerged that the first step to solve the possible misinterpretations of the measurement results is to clearly define the objective of the measurement (e.g., to remove all non-fundamental frequency components or to follow the dynamic variation of a signal), which in turn depends on the requirements of the specific application. Only in this way, new and more suitable test conditions and performance evaluation criteria could be defined for PMUs targeted to distribution networks.
The results obtained, therefore, may represent a useful contribution, both for the preparation of a new synchrophasor standard specific for distribution networks, which pays the right attention to the performance of the devices in the presence of electrical phenomena typical of that type of network, and for PMU manufacturers, who will have clearer design criteria available, aimed at dealing with more realistic and often challenging conditions.
Author Contributions
Conceptualization, P.C., C.M., P.A.P. and S.S.; methodology, P.C., C.M., P.A.P. and S.S.; software, P.C.; validation, P.C. and S.S.; formal analysis, P.A.P.; investigation, S.S.; data curation, P.C. and P.A.P.; writing—original draft preparation, P.C.; writing—review and editing, P.C., C.M., P.A.P. and S.S.; supervision, C.M.
Funding
This research received no external funding.
Conflicts of Interest
The authors declare no conflict of interest.
References
- IEEE Standard Association. IEEE/IEC International Standard—Measuring Relays and Protection Equipment—Part 118-1: Synchrophasor for Power Systems—Measurements, in IEC/IEEE 60255-118-1:2018; IEEE Power & Energy Society: Piscataway, NJ, USA, 2018; pp. 1–78. [Google Scholar] [CrossRef]
- IEEE Standard Association. IEEE Guide for Phasor Data Concentrator Requirements for Power System Protection, Control, and Monitoring, IEEE Std C37.244-2013; IEEE Power & Energy Society: Piscataway, NJ, USA, 2013; pp. 1–65. [Google Scholar] [CrossRef]
- IEEE Standard Association. IEEE Guide for Synchronization, Calibration, Testing, and Installation of Phasor Measurement Units (PMUs) for Power System Protection and Control, IEEE Std C37.242-2013; IEEE Power & Energy Society: Piscataway, NJ, USA, 2013; pp. 1–107. [Google Scholar] [CrossRef]
- IEEE Standard Association. IEEE Standard for Synchrophasors for Power Systems, IEEE Std C37.118-2005; Revision of IEEE Std 1344-1995; IEEE Power & Energy Society: Piscataway, NJ, USA, 2006; pp. 1–57. [Google Scholar] [CrossRef]
- IEEE Standard Association. IEEE Standard for Synchrophasor Measurements for Power Systems, in IEEE Std C37.118.1-2011; Revision of IEEE Std C37.118-2005; IEEE Power & Energy Society: Piscataway, NJ, USA, 2011; pp. 1–61. [Google Scholar] [CrossRef]
- IEEE Standard Association. IEEE Standard for Synchrophasor Measurements for Power Systems—Amendment 1: Modification of Selected Performance Requirements, in IEEE Std C37.118.1a-2014; Amendment to IEEE Std C37.118.1-2011; IEEE Power & Energy Society: Piscataway, NJ, USA, 2014; pp. 1–25. [Google Scholar] [CrossRef]
- Monti, A.; Muscas, C.; Ponci, F. Phasor Measurement Units and Wide Area Monitoring Systems, 1st ed.; Elsevier Academic Press: Cambridge, MA, USA, 2016. [Google Scholar] [CrossRef]
- Barchi, G.; Macii, D.; Petri, D. Phasor Measurement Units for Smart Grids: Estimation Algorithms and Performance Issues. In Proceedings of the AEIT Annual Conference 2013, Mondello, Palermo, Italy, 3–5 October 2013; pp. 1–6. [Google Scholar] [CrossRef]
- Castello, P.; Ferrari, P.; Flammini, A.; Muscas, C.; Pegoraro, P.A.; Rinaldi, S. A Distributed PMU for Electrical Substations with Wireless Redundant Process Bus. IEEE Trans. Instrum. Meas. 2015, 64, 1149–1157. [Google Scholar] [CrossRef]
- Robson, S.; Tan, G.; Haddad, A. Low-Cost Monitoring of Synchrophasors Using Frequency Modulation. Energies 2019, 12, 611. [Google Scholar] [CrossRef]
- Distribution Task Team, Synchrophasor Monitoring for Distribution Systems—Technical Foundations and Applications, 2018, NASPI-2018-TR-001. Available online: https://www.naspi.org/node/688 (accessed on 3 April 2019).
- Shen, Y.; Abubakar, M.; Liu, H.; Hussain, F. Power Quality Disturbance Monitoring and Classification Based on Improved PCA and Convolution Neural Network for Wind-Grid Distribution Systems. Energies 2019, 12, 1280. [Google Scholar] [CrossRef]
- Von Meier, A.; Stewart, E.; McEachern, A.; Andersen, M.; Mehrmanesh, L. Precision Micro-Synchrophasors for Distribution Systems: A Summary of Applications. IEEE Trans. Smart Grid. 2017, 8, 2926–2936. [Google Scholar] [CrossRef]
- Cifredo-Chacón, M.-Á.; Perez-Peña, F.; Quirós-Olozábal, Á.; González-de-la-Rosa, J.-J. Implementation of Processing Functions for Autonomous Power Quality Measurement Equipment: A Performance Evaluation of CPU and FPGA-Based Embedded System. Energies 2019, 12, 914. [Google Scholar] [CrossRef]
- European Committee for Electrotechnical Standardization. Voltage Characteristics of Electricity Supplied by Public Distribution Systems; European Standard CENELEC EN 50160; European Committee for Electrotechnical Standardization: Brussels, Belgium, 2010. [Google Scholar]
- Pogliano, U.; Braun, J.P.; Voljč, B.; Lapuh, R. Software platform for PMU algorithm testing. IEEE Trans. Instrum. Meas. 2013, 62, 1400–1406. [Google Scholar] [CrossRef]
- Liu, H.; Bi, T.; Yang, Q. The evaluation of phasor measurement units and their dynamic behavior analysis. IEEE Trans. Instrum. Meas. 2013, 62, 1479–1485. [Google Scholar] [CrossRef]
- Castello, P.; Liu, J.; Muscas, C.; Pegoraro, P.A.; Ponci, F.; Monti, A. A Fast and Accurate PMU Algorithm for P+M Class Measurement of Synchrophasor and Frequency. IEEE Trans. Instrum. Meas. 2014, 63, 2837–2845. [Google Scholar] [CrossRef]
- Toscani, S.; Muscas, C.; Pegoraro, P.A. Design and Performance Prediction of Space Vector-Based PMU Algorithms. IEEE Trans. Instrum. Meas. 2017, 66, 394–404. [Google Scholar] [CrossRef]
- Romano, P.; Paolone, M. Enhanced Interpolated-DFT for Synchrophasor Estimation in FPGAs: Theory, Implementation, and Validation of a PMU Prototype. IEEE Trans. Instrum. Meas. 2014, 63, 2824–2836. [Google Scholar] [CrossRef]
- Hu, W.; Zhang, Y.; Chen, Z.; Hu, Y. Flicker Mitigation by Speed Control of Permanent Magnet Synchronous Generator Variable-Speed Wind Turbines. Energies 2013, 6, 3807–3821. [Google Scholar] [CrossRef]
- Lodetti, S.; Azcarate, I.; Gutiérrez, J.J.; Leturiondo, L.A.; Redondo, K.; Sáiz, P.; Melero, J.J.; Bruna, J. Flicker of Modern Lighting Technologies Due to Rapid Voltage Changes. Energies 2019, 12, 865. [Google Scholar] [CrossRef]
- CIGRE. Review of LV and MV Compatibility Levels for Voltage Fluctuations; Working Group C4.111; CIGRE: Paris, France, 2016. [Google Scholar]
- Castello, P.; Muscas, C.; Pegoraro, P.A.; Sulis, S. Analysis of PMU Response Under Voltage Fluctuations in Distribution Grids. In Proceedings of the IEEE International Workshop on Applied Measurements for Power Systems (AMPS), Aachen, Germany, 28–30 September 2016. [Google Scholar]
- International Electrotechnical Commission. Electromagnetic Compatibility (EMC)—Part 4-15: Testing and Measurement Techniques—Flickermeter—Functional and Design Specifications; IEC Int. Std. 61000-4-15; International Electrotechnical Commission: Geneva, Switzerland, 2011. [Google Scholar]
- Wiczyński, G. Estimation of Pst Indicator Values on the Basis of Voltage Fluctuation Indices. IEEE Trans. Instrum. Meas. 2017, 66, 2046–2055. [Google Scholar] [CrossRef]
- De Rosa, F.; Langella, R.; Sollazzo, A.; Testa, A. On the interharmonic components generated by adjustable speed drives. IEEE Trans. Power Del. 2005, 20, 2535–2543. [Google Scholar] [CrossRef]
- Langella, R.; Testa, A. Amplitude and Phase Modulation Effects of Waveform Distortion in Power Systems. Electr. Power Qual. Util. 2007, 13, 25–32. [Google Scholar]
- Reliability Guideline, PMU Placement and Installation, December 2016. Available online: https://www.nerc.com/comm/PC_Reliability_Guidelines_DL/Reliability%20Guideline%20%20PMU%20Placement.pdf (accessed on 25 June 2019).
- Stenbakken, G.; Nelson, T.; Zhou, M.; Centeno, V. Reference values for dynamic calibration of PMUs. In Proceedings of the 41st Annual Hawaii International Conference on System Sciences, Waikoloa, HI, USA, 7–10 January 2008. [Google Scholar]
- Ma, J.; Zhang, P.; Fu, H.J.; Bo, B.; Dong, Z.Y. Application of Phasor Measurement Unit on Locating Disturbance Source for Low-Frequency Oscillation. IEEE Trans. Smart Grid 2010, 1, 340–346. [Google Scholar] [CrossRef]
- Vanfretti, L.; Baudette, M.; Domínguez-García, J.-L.; Almas, M.S.; White, A.; Gjerde, J.O. A Phasor Measurement Unit Based Fast Real-time Oscillation Detection Application for Monitoring Wind-farm-to-grid Sub–synchronous Dynamics. Electr. Power Compon. Syst. 2016, 44, 123–134. [Google Scholar] [CrossRef]
- IEEE Standard Association. IEEE Standard for a Precision Clock Synchronization Protocol for Networked Measurement and Control Systems, in IEEE Std 1588-2008; Revision of IEEE Std 1588-2002; IEEE Power & Energy Society: Piscataway, NJ, USA, 2008; pp. 1–300. [Google Scholar] [CrossRef]
- Phadke, A.G.; Thorp, J.S. Synchronized Phasor Measurements and Their Applications; Springer: New York, NY, USA, 2017. [Google Scholar] [CrossRef]
Figure 1.
Positive-side amplitude spectrum of a sinusoidal signal amplitude-modulated by a sinusoidal signal.
Figure 1.
Positive-side amplitude spectrum of a sinusoidal signal amplitude-modulated by a sinusoidal signal.
Figure 2.
Out-of-band region, in band range, and modulation range for M Class with reporting rate 50 fps.
Figure 2.
Out-of-band region, in band range, and modulation range for M Class with reporting rate 50 fps.
Figure 3.
In band ranges for different reporting rates Fs and maximum modulation bandwidths required for the P class (green) and M class (red).
Figure 3.
In band ranges for different reporting rates Fs and maximum modulation bandwidths required for the P class (green) and M class (red).
Figure 4.
Test architecture.
Figure 5.
Flow chart of the evaluation process.
Figure 6.
TVE results for PMU A with P (a) and M (b) configuration.

Figure 7.
TVE results for PMU B with P (a) and M (b) configuration.
Figure 8.
TVE results for PMU C with P (a) and M (b) configuration.
Figure 9.
TVE results for PMU C with P configuration and = 100 fps.
Figure 10.
FE results for the PMUs with P (a) and M (b) configuration.
Figure 11.
RFE results for the PMUs with P (a) and M (b) configuration.

Table 1.
Flickermeter mandatory (bold printed) and optional modulation frequencies for sinusoidal fluctuations [25].
Table 1.
Flickermeter mandatory (bold printed) and optional modulation frequencies for sinusoidal fluctuations [25].
| Hz | Hz | Hz | Hz | Hz | Hz |
|---|---|---|---|---|---|
| 0.5 | 4 | 7.5 | 8.8 | 13 | 20 |
| 1 | 4.5 | 8 | 9.5 | 14 | 21 |
| 1.5 | 5 | 8.8 | 10 | 15 | 22 |
| 2 | 5.5 | 9.5 | 10.5 | 16 | 23 |
| 2.5 | 6 | 10 | 11 | 17 | 24 |
| 3 | 6.5 | 7.5 | 11.5 | 18 | 25 |
| 3.5 | 7 | 8 | 12 | 19 | 33 1/3 |
Table 2.
Summarized results for the PMUs under test.
| DUT | Configuration | (Hz) | |
|---|---|---|---|
| PMU A 50 fps | P | 15 | - |
| M | 5 | 9.5 | |
| PMU B 50 fps | P | 20 | - |
| M | 12 | 18 | |
| PMU C 50 fps | P | 15 | - |
| M | 13 | 18 | |
| PMU C 100 fps | P | 15 | 33.33 |
© 2019 by the authors. Licensee MDPI, Basel, Switzerland. This article is an open access article distributed under the terms and conditions of the Creative Commons Attribution (CC BY) license (http://creativecommons.org/licenses/by/4.0/).
Share and Cite
MDPI and ACS Style
Castello, P.; Muscas, C.; Pegoraro, P.A.; Sulis, S. PMU’s Behavior with Flicker-Generating Voltage Fluctuations: An Experimental Analysis. Energies 2019, 12, 3355. https://doi.org/10.3390/en12173355
AMA Style
Castello P, Muscas C, Pegoraro PA, Sulis S. PMU’s Behavior with Flicker-Generating Voltage Fluctuations: An Experimental Analysis. Energies. 2019; 12(17):3355. https://doi.org/10.3390/en12173355
Chicago/Turabian StyleCastello, Paolo, Carlo Muscas, Paolo Attilio Pegoraro, and Sara Sulis. 2019. "PMU’s Behavior with Flicker-Generating Voltage Fluctuations: An Experimental Analysis" Energies 12, no. 17: 3355. https://doi.org/10.3390/en12173355
Note that from the first issue of 2016, this journal uses article numbers instead of page numbers. See further details here.