1. Introduction
Mitigation of climate change according to the Paris Climate Agreement from 2015 will require very strong measures and enforcing policies in the coming decades. The technological change required will be a major challenge as over 80% of all energy is still based on fossil fuels [
1,
2]. The recent report by the UN Intergovernmental Panel on Climate Change (IPCC) [
3] has alerted politicians, businesses, and the public about the urgency of stricter policy measures to cut carbon emissions. In spite of the urgency to reduce CO
2 emissions, the European Union has so far failed to find unanimity to commit to climate neutrality by 2050 [
4].
Reaching carbon neutrality by 2050 will not only require a complete technological change in the ways energy is produced, but this will also encompass major societal changes, turning the clean energy transition into a major socio-technical transition [
5]. The political measures in the transition also have a link to the sustainable development goals, two of which being directly linked to energy (SDG7, SDG13) [
6].
Developing carbon-neutral pathways has received increasing interest as part of the general decarbonization quest ahead. The IPCC along with the International Energy Agency [
1] has presented several deep-decarbonization scenarios, in all of which new and renewable technologies seem to play a central role along with energy efficiency measures to cut CO
2 emissions. In some studies 100%-renewable energy systems have been proposed [
7,
8,
9,
10]. Many cities aim at carbon neutrality before 2050 [
11]. Country analyses on carbon neutrality are numerous [
12]. Eighteen countries in the European Union have announced plans for carbon neutrality by 2050 [
13], including large countries such as Germany and France, and there is growing momentum to decide on this goal at the EU level as previously skeptical countries like Hungary and Bulgaria are turning around [
14].
Northern European countries, and in particular the so-called Nordic block (Denmark, Finland, Iceland, Norway, Sweden) have ambitious CO
2 reduction targets and policies. The Nordic countries have issued a Nordic Carbon Neutrality declaration [
15], which calls for carbon neutrality by 2050, and all Nordic countries have policies in place to reach carbon neutrality by year 2050, some countries even before that. For instance, the Government of Finland has just recently strengthened its climate-change mitigation policies by requiring full net carbon neutrality in the country by 2035 and becoming carbon negative by 2050 [
16]. The Nordic region as a whole forms an interesting case for deep decarbonization pathways based on its present power mix, which is already almost carbon-free [
17]. Over half of all electricity produced in the region is hydropower, which provides a major reserve for balancing power in case of large-scale variable renewable electricity (VRE) use. There is also a strong political will to reduce emissions, but also positive past experience in using energy markets as a tool to reach energy policy goals. Actually, the Nordic region was among the first to liberalize its electricity markets worldwide and to form a unified market region and electricity exchange in the 1990’s, i.e., the Nord Pool power exchange [
18], which has functioned as a pioneering example for many other regions and countries.
The Nordic region has major chances to reach carbon neutrality by 2050. The pathway to this goal has been analyzed in detail in the Nordic Flagship Project Flex4RES (Flexibility for Variable Renewable Energy Integration in the Nordic Energy Systems) [
19], the results of which are discussed here. The aim of this paper is to depict cost-optimal pathways for the Nordic countries, including also the nearby Baltic states (Estonia, Latvia, Lithuania). The uniqueness of the present study is in viewing the energy system, markets, and policies as interlinked and holistically as a unity, contrary to previous analyses on the Nordic region [
20]. Such a “whole-picture” view enables stronger coupling of markets across the sub-regions and sectors. Sector coupling is actually an enabler to a much higher use of variable renewable electricity such as wind power in the energy system because of increased energy system flexibility [
21,
22]. This is mainly because surplus electricity can easily be used in other sectors such as heating or transport, which further helps with the decarbonization quest. In particular, a power-to-heat (P2H) [
21,
22,
23,
24] strategy would be important in the northern context, as most of the final energy use is in the form of heating because of the cold climate.
This paper describes the main results from technical, economic, regulatory, and policy analyses combined with comprehensive energy scenario modelling to build a pathway to carbon neutrality in a cost-efficient and coherent way by year 2050. Actually, for the first time reported, this paper shows a pathway with the necessary policies to reach not only carbon neutrality (carbon sources = carbon sinks), but also zero carbon emissions from the heating and power sectors (carbon sources = 0) in a much shorter time than anticipated before. An important pre-requisite for a fast and deep decarbonization is an increasing CO
2 price. The present work goes beyond the state-of-the-art of traditional energy scenario studies [
20] by placing the pathway into a socio-technical transition framework [
25] analyzing some key social issues resulting from the transition. This kind of setting, in which the emissions drop fast but in a cost-efficient way and considering the societal side as well, is welcome considering the urgency to reverse global CO
2 emissions.
The paper is organized as follows. First, the present energy and emission situation in the region is presented, followed by the method used in the analysis and the scenarios chosen for analysis. Then, the main results are presented followed by the conclusions.
3. Methods
Developing the pathway(s) for deep decarbonization in the Nordic-Baltic region leading to zero-emissions in the energy sectors (electricity, heating) by 2050 is based on the following elements:
- (1)
Defining a market-based scenario framework. In a market-based or market-orientated approach, the energy production volumes and prices are basically determined by the demand and supply of energy aiming at least-cost solutions, as opposed to a government-controlled approach in which public sector interventions could distort prices or lead to preferential solutions [
29];
- (2)
Balmorel energy system model [
30] for comprehensive energy system and energy market simulations to turn the scenarios into necessary energy system changes;
- (3)
Energy system flexibility as key strategy to enable large-scale variable renewable electricity used with emphasis on sector coupling;
- (4)
Identification of socio-technical implications, and defining further policy measures to realize the path to carbon-neutrality;
- (5)
Survey of regulatory and technical barriers against flexibility.
The core of the method and work is around techno-economic optimizations (1,2,3), accompanied by socio-technical considerations (4) and policy analysis (4,5). The multi-step approach is described in more detail below.
3.1. Policy Scenarios
There are several ways to frame the energy transition [
31]. Framing of policies is important as it includes defining the factors against which the priorities are set, which in turn would also influence the solutions. Here, a market-based approach was chosen to identify the least-cost alternatives to decarbonize the energy sectors. It was therefore appropriate to reflect the necessary policies in terms of market-related factors which hamper or accelerate decarbonization. The main strategy to facilitate the zero-carbon energy transition was focusing on large-scale renewable energy schemes accompanied by sector coupling of energy markets across the Nordic-Baltic to increase the flexibility of the energy necessary to adopt variable renewable electricity at large scale.
The differentiation of the policy cases (scenarios) was consequently done along two dimensions, namely regulatory and technical barriers for increasing interconnections (with and without these) which could affect the mobilization of flexibility measures. This yielded four basic scenarios, explained in the following:
(1) BAU: Business-as-usual (BAU) case resembling the Nordic Energy Technology Perspectives case [
20] (2016) with the present regulatory framework in the Nordic-Baltic region;
(2) Connect: As Scenario 1, but introducing more transboundary power transmission capacity to better interconnect the Nordics with the mainland-Europe (Belgium, France, Germany, Poland, The Netherlands) and the United Kingdom, which requires removing technical barriers for extended transmission capacity, but the regulatory barriers would still remain;
(3) Policy: As Scenario 1, but eliminating regulatory barriers that hamper power sector flexibility and sector coupling, the technical barriers would still remain;
(4) Combi: As Scenario 2, but also eliminating regulatory barriers that hamper power sector flexibility and sector coupling, i.e., in this scenario both the technical and regulatory barriers would be eliminated.
The scenarios thus fall in the regulatory-technical barriers matrix as follows:
BAU: high regulatory and high technical barriers;
Connect: high regulatory and low technical barriers;
Policy: low regulatory and high technical barriers;
Combi: low regulatory and low technical barriers.
Connect and Combi scenarios represent the cases in which the Nordic energy market is also stronger coupled to the mainland Europe and to the United Kingdom to enable export of electricity and “flexibility”, whereas in BAU and Policy scenarios the focus is on the intra-market in the Nordic-Baltic region only. Carbon-taxation is also a very important policy instrument to enforce lock-out from fossil fuel generation. It is assumed that the carbon-tax would increase during the 2020’s to 65 €/tCO2 and double to 130 €/tCO2 by 2050, which is along the line of other international studies [
1,
20]. All scenarios lead to a zero-emission (techno-economic) target by 2050, their difference being in how to reach this target and how much it would cost. Importantly, the high CO
2 price used is not enough to secure full carbon neutrality, but will require additional policy push to reach CO
2 neutrality.
3.2. Energy System Modelling
The energy system modelling necessary for the policy analyses is done with the Balmorel energy model, which is a partial equilibrium model supporting modelling and analysis of the energy sectors with emphasis on the electricity and heating sectors [
32]. Balmorel is an open source code employing the GAMS modelling language.
The model has a comprehensive geographical subdivision that allows identification of countries (for description of e.g., taxes, emissions, etc.), regions (for electricity transmission) and areas (for district heating systems, local cost elements, etc.). If considering a 1-year time horizon for the optimization, hourly segmentation would be appropriate, whereas long time-horizons such as here would be done with coarser time segmentation. An arbitrary number of heat and power production units can be included for which technical and economic parameters are given (e.g., rating, costs, efficiencies, etc.). All types of technologies can be modelled, also energy storage. Electricity transmission is modelled in detail, allowing identification of bottlenecks in the transmission system e.g., when introducing large scale VRE, but also to show the differences in electricity prices according to geography.
Balmorel is an optimization model assuming perfect competition. It solves a least-cost problem with boundary conditions and limitations in the same way as if it had been centrally planned [
32,
33]:
where
e = electricity,
h = heat,
C = costs,
g = a set of linear expressions; subscript
i stands for the production units.
The direct emissions from energy production plants are considered in the model, but the in-direct emissions originating e.g., from manufacturing of the energy technologies or their installation and maintenance were not considered.
The model has been documented in detail elsewhere (
http://www.balmorel.com/) and it has been used extensively for country and regional analyses. The input data used in this analysis extends from 2016 to 2050 and is mainly based on data from the Flex4RES project [
19]. The current generation units form the starting point for the model analysis, where each technology has an assumed lifetime varying between 30 and 40 years. The model applies endogenous modelling of investments in new generation technologies, and in two of the four scenarios, transmission line investments are also endogenously determined in the model. All investment costs required to achieve the zero-emission pathway are accounted for in the scenarios. Fuel and carbon price assumptions are in line with the Nordic Energy Technology Perspectives report [
20]. An hourly time resolution is used in the modelling, where 52 seasons with 24 representative hours are used for the optimization. The spatial modelling covers the Nordics (Finland, Sweden, Denmark, Norway) and the Baltics (Estonia, Latvia, Lithuania). In cases of linking the Nordics to the rest of the EU, the spatial scope is extended with mainland Europe countries (Germany, Poland, France, Belgium, The Netherlands) and the United Kingdom.
The resource base and potential of renewable energy sources depend on weather conditions, notably in case of wind power, solar energy, and hydropower. Representative reference data was used in the calculations for renewable energy, but year-to-year statistical variations were not considered. It should also be noticed that the climate change will affect the weather and hence also the renewable energy production, e.g., the wind and solar conditions and precipitation may change [
34,
35,
36], but considering these effects were outside the scope of this paper.
3.3. Flexibility Strategies
Increasing energy system flexibility to allow large-scale integration of VRE in an optimal and cost-effective way is one of the key strategies employed in this study. The strategies to increase flexibility are numerous ranging from upward and downward flexibility to shifting flexibility. The available practical measures for flexibility are likewise numerous, their use often depending on the overall portfolio of flexibility, economics, and complementarity offered. Technology options offering increased energy system flexibility include energy storage [
37], smart grids, flexible power plants, interconnections, P2X, among others. [
38]. Measures leaning on market-mechanisms to increase flexibility include demand side management (DSM) and demand response, balancing agreements, time-based pricing, etc. [
39,
40]. In the Nordic context, the existing hydro-power schemes (53% of all electricity) and the good transboundary connections have already provided a certain flexibility potential, but in addition, the potential of demand side management and response is considerable, or 15–30% of the peak power demand, which can be explained by the rather large share of household heating of all electricity (23%) [
17]. Though the industrial electricity use is high in the region (40%), the potential contribution of industrial DSM is rather low (4–7% of the peak demand) as much of the industries are process industries requiring steady and continuous running [
17]. The potential of increasing supply side flexibility e.g., through expanding existing pumped hydro power schemes or harnessing still free-running rivers in the region (e.g., in Norway and Sweden), is limited because of the strict environmental legislation and local resistance of the population.
Power-to-X (P2X, X stands for final energy forms or services) constitutes a set of strategies in which the (surplus) power is coupled to other sectors such as heating (P2H) or transport (electric vehicle charging P2V) to provide a broader base to increase the system inertia [
38]. Typically, electricity forms around a quarter of the final energy use, but most of the final energy needed in the northern latitudes is actually heat (>50%). In this way e.g., P2H coupling could absorb large amounts of surplus wind energy by using electric resistance heating or heat pump units [
41]. If in this case the heating demand would not be adequate to absorb the surplus power, adding large-scale heat storage, which is much cheaper than electricity storage, would be an easy additional measure [
23].
The main strategies for flexibility chosen here are sector coupling, in particular power-to-heat accompanied with heat storage, power transmission grid expansions, and existing hydro power as a fast-response supply-side measure. The analyses also included flexibility provided via demand response, flexible electric vehicle (EV) battery charging, and power-to-gas (P2G) solutions, but these options appeared to be less important in the Nordic context than the previously mentioned ones.
It is assumed that extensive electrification of vehicles will take place in Europe by 2050, so that one-third to one-half of the car fleet in the Nordic-Baltic region would be electrified (plug-in EV and full EV) while in Norway the share would be 90%. Assuming smart charging of EVs would add to the total pool of flexibility even without active vehicle-to-grid (V2G) use, e.g., when vehicles are charged during less costly or less system-stressed time periods [
42]. If the rest of the car fleet and road transport were based on carbon free fuels such as biofuels, the whole transport sector could also become emission free by the middle of this century. However, as no profound transport system modelling was done, any far-reaching conclusions on the transport side will not be done here.
3.4. Identification of Regulatory Barriers in Front of Flexibility
Improved energy system flexibility is a measure needed to reach high shares of renewable energy. The European Union, which also affects the Nordic-Baltic region policies, promotes flexibility in electricity markets to ensure security of supply and affordability while fulfilling the goal of a high share of renewable energy in the EU Member States. New policy measures mentioned in EU’s “Clean Energy for all Europeans” package from 2016 include obligations for market coupling, enhancing regional cooperation, developing intra-day and cross-border balancing markets, rolling out smart meters, and dynamic pricing [
28].
Though the regulative role of the European and Nordic policies is recognized as central to the development in the energy sector, including energy system flexibility, an in-depth survey was done on regulatory barriers in the Nordic and Baltic market [
43]. The main source for the analysis was four comprehensive reports from the Flex4RES project on framework conditions [
44,
45,
46,
47], EU, Nordic, and the national energy policies and strategies regarding energy systems and flexibility, and 15 in-depth interviews with stakeholders from the Nordic countries and organizations [
48]. The survey highlighted areas which would require special attention from the policy makers, decision-makers, and key stakeholders. There are several barriers with varying importance, also varying by country, but two common barriers stand above all, namely (BA1) insufficient market signals for some stakeholders, and (BA2) uneven frameworks for different renewable energy resources. Several empirical observations support emphasizing these two barriers. First, policy and regulatory measures are largely decoupled from the electricity market prices, which affect different sectors on different levels and in various ways. For instance, some of the current support schemes to specific renewable energy sources (RES) are decoupled from the flexibility needs. Second, fiscal policies such as tax exemptions or subsidies often favour specific energy resources or technologies over others. This results in distortions in the market. For example, if biomass-based district heating (DH) receives a tax exemption, this would likely increase the cost advantage of biomass-based units over power-to-heat (P2H) units. This kind of support could promote biomass heat-only boilers over flexible combined heat and power (CHP) and P2H, which in turn would decrease the sector coupling of heating and electricity.
Based on the barriers identified, we have formulated policy recommendations to unlock the flexibility potential. As the barriers (BA1, BA2) relate to inadequate market signals to some stakeholders, market design, and regulations, the policy recommendations need a strong link to the markets and modifications of the present support schemes. Seven policy recommendations (REC1-REC7) were identified, which positively respond to the barriers:
REC1: Create a level playing field for RES across sectors through consistent fiscal policies (consistency within the countries accounting for combined effects of tariffs, taxes, subsidies, and externalities);
REC2: Implement grid tariffs which allow market signals for flexibility to reach the end-users;
REC3: Dynamic taxation of electricity (e.g., restructuring levies and taxes);
REC4: Encourage VRE operators to act flexibly using short-term market-based incentives;
REC5: Abolish RES support during negative electricity price periods;
REC6: Enhance electrification by removing the limitations on using electricity for heating;
REC7: Tackle investment risks in flexible individual heating through new financing and private ownership models.
Table 4 shows the importance of each recommendation in the countries of the region, for which reason the recommendations need to be applied selectively accounting for the specific conditions of each country. Two recommendations (REC 2 and REC3) are common to the whole region and they clearly convey a policy message to focus on market-based policies. Revising tariffs, taxation schemes, and subsidy structures are of high priority in this context. For example, a more dynamic taxation or tariff system could increase the use of cheap demand side response [
49]. Increasing CO
2 taxes would encourage uptake of flexible renewable sources. Reforming outdated regulation prohibiting electrification of other sectors could enhance coupling of power, heat, transport, and gas, which would leapfrog the flexibility in the energy system as a whole. Improved flexibility opportunities are found across all levels in the energy system from producers, interconnectors (e.g., transmission system operators (TSO) and distribution system operators (DSO)), to consumers. However, capturing the flexibility potential would require providing a common level playing field as defined in the recommendations above to account for the differences among the market actors. Several of the other recommendations relate to this too [
50,
51].
Recommendations 1–7 form a market-based policy sub-framework for decision-makers, which could be used in a strategic context such as updating national climate-energy policies or in reforming policy measures to reflect on changing boundary conditions of the market such as price decrease and market growth of renewable electricity.
It should be observed that resolving the two barriers (BA1, BA2) through the recommendations in
Table 4 does not automatically lead to zero emissions, but rather to unleashing the flexibility potential, which is a key enabler of an energy system change. The techno-economic optimizations with Balmorel model determine here the technical pathway to carbon neutrality.
3.5. Socio-Technical Analysis Frame
The energy system modelling outcomes are also analyzed in a socio-technical frame. The aim here is not to undertake a detailed in-depth analysis, but rather to identify broader issues that might emerge from the transition.
Established methods were used for the analysis including the following steps [
5]: (1) Identification of socio-technical (ST) factors with potentially high effects on energy transition pathways; (2) qualitative assessment of these effects on the energy system; (3) quantitative assessment of selected ST factors using the Balmorel model; (4) analysis of implications for transition pathways (in terms of regulation, best practices, planning processes, etc.). One of the key social questions that needs attention is the social acceptance of large-scale energy schemes, e.g., the “NIMBY”-effects, but also possible distributional effects when markets change.
5. Formulating a Pathway toward Carbon-Free Energy Sector
Energy is a complex system, which constitutes of networks, interactions, many actors, self-organized elements, etc. [
55]. Describing changes in such a intertwined environment is highly challenging. The energy transition could be framed in different ways, leading to different prioritizations and different solutions [
31].
The four scenarios showed the techno-economic changes in the Nordic energy sector to reach a carbon-free energy sector. However, such profound changes also need to be embedded in the social and political systems. Therefore, the pathway to zero-carbon was also placed in a socio-technical transition framework, meaning that the final energy transition will be influenced by the co-evolution of the techno-economic system, socio-technical issues, and policy actions [
5]. All three “layers” need to match to ensure the required change.
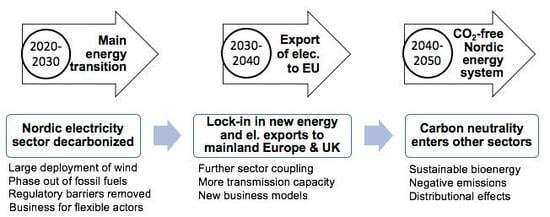
The Flex4RES scenarios represent the techno-economic system, but they also include consideration of market design and policy actions. In addition, a socio-technical analysis was undertaken to analyze the role of non-technical factors such as social acceptance. These together constitute the Nordic pathway to zero-carbon, as depicted in
Figure 5.
The zero-carbon pathway in
Figure 5 has three distinctive phases up to 2050. The first phase called “energy transition” takes place in the 2020’s featuring a sharp turn to clean energy requiring massive investments in new energy and infrastructure motivated by the steep increase in carbon price. The 2020’s will be of critical importance for the whole zero-carbon transition in the Nordics as most of the changes required need to be put into place then to reach the goals in 2050. Basically, the regulatory and political framework must also to be reformed to remove key market and technical barriers in front of the new investments.
In particular, enabling a level playing field and technology neutrality in the investments, and proper signals such as dynamic tariffs or taxes to encourage flexibility measures are needed. Because of the high intensity of new technology investments such as on-shore wind power, important social acceptance, and behavioural consequences that could hamper the development may occur. This would require e.g., more careful siting and planning guidelines and R&D efforts to develop alternative technologies further such as off-shore wind power, which may intervene less with the population. Similar social issues may later occur with new transmission lines or large solar PV production fields. The role of heat storage, which already now is applied extensively in distributed heating system and to some extent also in district heating (CHP) systems, will significantly grow as a balancing technology linked to P2H and may need further R&D efforts to enable successful scaling-up.
The second phase in the 2030’s called “export of electricity to EU” is characterized by a distinctive lock-in into renewable energy and flexibility technologies in the energy sector. Exports from the Nordics to the rest of the EU would increase once regulatory barriers for this are removed and new transboundary transmission line investments take place (scenarios Connect and Combi). This would generate much higher revenues to the Nordic power producers, but would also increase the consumer prices of electricity before settling back closer to the middle of the century. The consequent distributional effects will need consideration in the policies. The strong electrification of the energy sector through sector coupling may also raise new challenges on its resilience against different wicked problems such as cyber-security [
12].
Basically all key elements for a carbon-free energy sector would need to have been put place in the 2020’s and 2030’s. The policies need to move even faster to enable optimal framework conditions: The Nordic-Baltic region has to focus already in the 2020’s on sector coupling and market approaches, remove regulatory barriers, and allow business cases for flexibility actors.
The last period in the 2040’s called “CO2-free Nordic energy system” would take the final steps to ensure a fully sustainable energy sector. The sector coupling has further been strengthened to enable high shares of renewable energy leading to higher electrification of the heating sector through P2H and less biomass use, which could instead be used for biofuels in the transport sector and other green chemicals. The adoption of the “new technologies” reaches its maximum by 2050. There are indications that after year 2050 negative emissions may be necessary to limit the global temperature rise to 1.5 °C, which may need introduction of a range of other measures such as electrification of industrial processes, power-to-gas, CCS, among others, not considered in the timeframe 2020–2050. The export of electricity from the Nordic countries to the mainland-Europe and the United Kingdom will also start to fade as the price differences even out in this period. Though not analyzed in detail here, energy efficiency and utilization of waste heat may deserve future attention because of the large potential involved.
6. Discussion and Conclusions
From the above analyses, a set of important observations, conclusions, and recommendations can be drawn.
Table 4 and the scenario results in
Section 4 indicate the need for regulatory changes to remove barriers to enhance flexibility. Coherent changes to market designs, regulatory framework conditions, and coupling of markets are needed. For example, improvements to the regulatory frameworks of heat, gas, transport, and electricity sectors that can supply flexibility are needed along with the growth of VRE in the electricity supply in order to develop coherent Nordic energy markets. This will require smart market designs and framework conditions implemented in a timely fashion. Otherwise, integrating energy markets with very different framework conditions (e.g., heat vs. electricity) may prevent the transition towards integrated energy systems and increased flexibility.
So far, the energy policies in most Nordic and Baltic countries have been too focused on the traditional policy framework dominated not only by environmental issues, but also by considerations of security and cost of supply, while lacking awareness of energy system flexibility. However, flexibility has recently received more attention in the Nordic area. In a high-level report from the Nordic Council [
56], the need for greater flexibility is emphasized as a necessary aspect of increasing the share of VRE in the region. This paper adds to this report by reviewing some of the challenges involved and by drawing up possible scenarios for what this future might look like and where Nordic energy co-operation should be targeted.
The common electricity market (Nord-Pool) is an example of successful Nordic energy co-operation, whereas in the heat, gas, and transport sectors national policies and regulations have dominated. This has created differentiated and more complex policy arrangements that challenge the future coordination of the decarbonization and electrification of these sectors.
There are many good reasons to strengthen energy co-operation through the introduction of focused and coherent policies. The main questions are where to set the focus and how much effort is needed? Should the focus be on cooperation in the existing electricity market, trusting that the market can cope with the flexibility challenges indicated by the future energy system with a large share of variable renewable energy? Should the Nordic co-operation be strengthened over electricity by reforming the existing market design and adding more transmission capacity between the Nordic countries? Or should one explore flexibility options that can be realized by introducing stronger connections between sectors through enhanced electrification of the heat, transport, and gas sectors? These different policy areas require different regulatory changes and the removal of barriers in order to be realized.
Table 4 highlighted the Nordic-Baltic differences. Setting up policy recommendations for a region of different countries therefore implies a more complex, but also a more robust policy focus, based on cooperation. The approach and scenarios analysis in this paper fits this purpose.
In line with the above discussion and the pathway depicted in
Section 5, the following policy-related conclusions can be drawn:
1. CO2-free energy sector is possible, but Nordic and Baltic countries need to act fast in decarbonization:
The results unambiguously indicate that a CO2-free, least-cost, and reliable energy sector can be reached in the Nordic-Baltic region. Deep decarbonization of both the electricity and heating sectors are possible. Postponing investments in clean energy would require even steeper and costlier emissions cuts in the coming years and it would mean losing a unique window of opportunities which is opening up in terms of new investments and revenue creation in the coming decade. In practice, the main energy transition must be geared up already in the 2020’s.
2. Nordics may play an important role in decarbonizing the EU and beyond:
The Nordic-Baltic region would benefit from acquiring a first mover and pioneering position worldwide.
The Flex4RES scenarios in
Section 4 linking the Nordic-Baltic region and the mainland-European and UK energy systems indicate that exporting CO
2-free electricity could be good business to the Nordic utilities. The Nordics could through a flexible energy system also provide more flexibility to the rest of the EU helping in the European energy transition. The expected revenues of electricity exports could be in the range of €5–10 billion a year in the period 2030–2040 (
Figure 3).
3. Nordic cooperation enables more efficient solutions allowing differences:
The results clearly show the benefits for regional collaboration and acting together for finding solutions. The Nordic solutions shown are inclusive drawing upon national characteristics. For example the Norwegian/Swedish hydropower and Danish/Finnish/Baltic district heating provides much flexibility, and the Danish/Swedish wind power build-up cheap renewable energy, of which the whole region benefits. Therefore, a harmonized policy set-up is not a pre-requisite to reach zero-emissions, though coherence is required.
4. A market-based approach enables market coupling for higher flexibility:
The advantages of combining different energy markets in the Nordic-Baltic region are evident. Emphasizing a market-based approach with the right coupling of the power market to the underlying national and local markets for heat, gas, and transport could generate enough cheap flexibility to successfully integrate large amounts of wind (and solar) power. Together with the removal of regulatory barriers it creates the necessary signals to the market actors to invest in and operate flexibility and go for smart sector coupling of energy systems (e.g., P2H). The flexibility opportunities are ample once the right incentives are in place and these could even cross national borders.
5. Technologies are mature for the energy transition:
The transition to a zero-carbon energy sector in the Nordics can be based on already well-proven and cost-efficient energy technologies, which minimizes risks and uncertainties associated with the energy change. This could therefore represent a more realistic future option for decision-makers in the region. The depicted transition leans strongly on the electrification of energy sectors (sector coupling), notably heating (power-to-heat, P2H), but also to some extent the transport sector. P2H means in practice electric boilers and heat pumps, which are already in large-scale use in the Nordic countries. Heat storage, which is a cheap and proven way to store energy, would be utilized on a much larger scale than presently and linked to P2H. Long-term storage solutions would gradually be needed, which may need R&D efforts to reduce technology uncertainties. Fossil-fuel power and heat supply would fade off by 2050, also supported by present national energy and climate policy targets. The focus of the power and heat supply would shift to existing hydro and wind power, supplemented by bioenergy-based combined heat and power.
6. Socio-technical questions deserve early attention:
A socio-technical analysis of the techno-economic energy transition pathway identified large-scale wind power, transmission grids, and distributional effects as areas in which complementary policy actions may be necessary to account for the social side of the transition. For example, if construction of wind power on-shore were less acceptable for local population this may require moving to more costly off-shore conditions which in turn may affect the cost-optimal energy system solutions shown in the scenarios. Similarly, other socio-technical transition factors such as lock-in, path dependencies or jobs, which were beyond the present study, may need more consideration in energy transition policies [
5]. Policy measures necessary to overcome these barriers may include taxation, income transfers, increased R&D, regional transitional support schemes, consideration of behavioral aspects, among others. These measures need to be fitted locally case by case, as the local conditions vary much across the region. But an important conclusion is that a zero-emission energy transition requires concurrent coevolution of techno-economic and socio-technical systems, and policies [
3].
Though this study was limited to one major region in Europe only, many of the findings and conclusions may also apply to other regions as well. Importantly, a market-based integrative approach to deep decarbonization could play an important role in this context.

 ,
, 


