Article

Influence of Different Biofuels on the Efficiency of Gas Turbine Cycles for Prosumer and Distributed Energy Power Plants

1
Faculty of Mechanical Engineering, Gdansk University of Technology, Gabriela Narutowicza Street 11/12, 80-233 Gdansk, Poland
2
Department of Organization and Production Engineering, Warsaw University of Life Sciences, Nowoursynowska Street 164, 02-787 Warsaw, Poland
3
Department of Production Management, Bialystok University of Technology, Wiejska Street 45A, 15-351 Bialystok, Poland
*
Authors to whom correspondence should be addressed.
Energies 2019, 12(16), 3173; https://doi.org/10.3390/en12163173
Submission received: 27 July 2019 / Revised: 14 August 2019 / Accepted: 16 August 2019 / Published: 19 August 2019
(This article belongs to the Special Issue Assessment of Energy–Environment–Economy Interrelations)

Abstract

:
The efficiency of a gas turbine can be affected by the use of different biofuels usually with a relatively Lower Heating Value (LHV). The paper evaluates the impact of calorific value of fuel on turbine performance and analyzes the possibilities of optimizing turbine construction from the point of view of maximum efficiency for a particular fuel. The several variants of design of small power microturbines dedicated to various biofuels are analyzed. The calculations were carried out for: gas from biomass gasification (LHV = 4.4 MJ/kg), biogas (LHV = 17.5 MJ/kg) and methane (LHV = 50 MJ/kg). It is demonstrated that analyzed solution enables construction of several kW power microturbines that might be used on a local scale. Careful design of such devices allows for achieving high efficiency with appropriate choice of the turbine construction for specific fuel locally available. Such individually created generation systems might be applied in distributed generation systems assuring environmental profits.

Graphical Abstract

1. Introduction

The condition of the energy sector determines the state of the national economy and the level of economic growth [1,2]. The power sector is currently experiencing a dynamic transformation, resulting not only from EU conditions, but also from current problems, mainly related to ensuring energy security to consumers [3,4,5]. In many European Union countries, it was decided to change the model of the electricity market [6,7,8]. There is a gradual retreat from the energy economy based on the central distribution of oil and other fossil fuels [9,10,11]. Achieving the synergy effect between the energy sector’s potential and its customers is now the overriding goal. As a result, dynamic development on the client side is observed related to photovoltaic panel installations, energy storage, electric vehicles and broadly understood Smart Homes [12,13,14]. The concept of smart cities (Smart City) is constantly evolving, which is a response to the needs of implementing innovative concepts of city functioning through modern technological solutions and a comprehensive management service, e.g., in the context of sustainable energy. New technologies in the power industry are becoming the driving force of the economy, and an important criterion for their development is the impact on the natural environment [15,16,17].
The continuous increase in the demand for energy and its carriers as well as the growing normative requirements in the ecological aspects including reduction of CO2 emissions cause the necessity of systematically increasing the share of energy from renewable sources [18,19,20]. The level of public awareness along with the increasingly restrictive legal requirements of the European Union in matters of environmental protection affect the attractiveness of activities and technologies that lead to the reduction of adverse human impact on the environment [21,22,23]. Energy operators, faced with the need to spend large sums on modernization of the power plants and at the same time being aware of the fact that the existing pollutant emission standards will be further tightened, must opt for investments in modern technologies that will produce clean energy without harming human health and the environment [24,25,26]. The choice of technology is more and more often supported by the Life Cycle Assessment (LCA), which, due to its comprehensive nature, allows for a full assessment of the environmental impact of the entire production process, from obtaining raw materials to final management of waste generated as a result of use of the product [27,28,29].
Large corporations producing electricity and selling it using international and national distribution networks due to the large installed capacity are not very flexible [30,31]. Currently, the government’s actions are aimed at supporting both improving the efficiency of electricity generation and supporting distributed energy based on local and renewable energy sources [32]. As a rule, this eliminates the problem of network losses. Energy is produced in the same place where it is used [33,34]. This also involves the development of smart grids and smart metering [35,36].
Although a constant increase in electricity prices is unavoidable, its freedom of trade and independent production together with storage can be a tool to control its rising costs [37]. Countries where political power is based on the export of raw materials lose their ability to exert pressure, which is a very important element from the point of view of energy security [38]. From the point of view of the challenges facing each national electricity system, such as the energy security of the state, reduction of emission and efficiency, only the coexistence of professional and civic energy is right.
The growing prosumer energetics is a chance for a new shape of the energy system, in which the recipient will be not only a user, but also an active participant. This leads to a visible increase in the number of prosumer polygeneration centers built [39,40]. In these types of units, most often turbines, much attention is paid to durability, reliability, low price and efficiency of components and the entire generator [41,42]. The disadvantage of the domestic power generation sector is the relatively low efficiency of energy production from coal, and in the case of dispersed power engineering, the efficiency of small power plants is even lower [43,44], and thermal power plants based on circuits with organic agents reach efficiency of just a dozen or so percent [45,46]. In the field of prosumer energy, there are no solutions on the market that allow highly efficient energy production around the clock. As part of the development of micro electric generators, it is possible to indicate micro-turbines and bladeless adhesive turbines [47,48,49].
The search for alternative energy from renewable sources is becoming more and more fashionable and recommended by, among others, the European Union. At present, this group of energy sources includes: tides, sea currents, waves, temperature difference of ocean waters, wind power, solar energy, geothermal energy and energy from biomass. In the case of prosumers, the most popular are solar collectors, wind turbines and biogas plants.
Currently, such popular solar collectors work only during the day [50]. Other solutions, in turn, apart from those using solar energy, have relatively low efficiency, hence their installation and operation is rather unprofitable [51].
An interesting energy source is biogas [52,53]. Its greatest advantage is universality. It can be used both for the production of electricity and heat, and as motor fuel, whereas wind, water or solar power plants only provide electricity.
Biogas is an energy vector formed from the microbiological decomposition of organic raw materials (e.g., of agricultural, industrial or food origin) during the methane fermentation process [54,55]. The composition of biogas depends on its origin (the type of substrate subjected to the fermentation process) [56,57]. A large amount of waste generated by the agri-food industry may contribute to the construction of many biogas installations located at the source of their use (production plant). This solution due to the lack of costs of obtaining the substrate and the possibility of using the produced electricity and heat for technological purposes of the plant is beneficial. The biogas produced can be used to generate thermal or electrical energy or for combined energy production in CHP (Combined Heat and Power) systems. The use of biogas for the production of electricity or heat requires the removal of hydrogen sulphide and water vapor (responsible for the corrosion of equipment) [58,59].
An important place among alternative sources of energy is the wood gas obtained in the gasification process, which, by supplying the CHP system, can be a competitive source of electricity and heat generated in cogeneration. This is of particular importance in the generation of energy in distributed systems, independent of large, centralized energy suppliers [60,61]. Energy is produced directly at the point of demand, and the system is based on clean and environmentally friendly fuel. In addition, the ash produced during the gasification process can be used in the chemical industry or as a natural fertilizer.
The aim of the present work is to estimate the efficiency of several variants of microturbines operating with a number of biofuels in order to evaluate the effect of the fuel calorific value on turbine performance as well as to investigate the possibility of optimization of turbine construction in order to achieve maximum efficiency for a particular fuel. Such optimization should ensure a possibility of fitting the turbine to local needs for distributed energy generation.
Particular biofuels can differ depending on their chemical composition and the heating values which play an important role when thermodynamical cycles are considered. Heating values influence energy balance equations of gas turbine combustion chambers and, as a result, the relations between the temperatures and the mass (and volume) flow rates of the working media (air, gases) are altered. This, in turn, shows some impact on the power plant overall efficiency and the design of turbomachinery flow parts. The paper aims at highlighting this problem, as it has not been discussed thoroughly in the bibliography. It is so because the micro gas turbines (gas turbines of small and very small output) operating on biofuels are only at the beginning of their applications in prosumer and distributed energy power plants. In a typical arrangement of gas turbine engines, the combustion chamber is placed just in front of the turbine, usually high-quality gas or liquid fuels are used and the hot gases flow through the turbine flow part. In the case of various biofuels (especially pellets) so-called “external combustion systems” may be used, which allows the burning of different sorts of fuel (liquid, gas or solid), even of poor quality, because in these units clean air flows through the compressor and the turbine.

2. Materials and Methods

The Computation Algorithm

In the case of small power plants (from several kW to several hundred kW), the maximum temperature 850–900 °C was assumed before the turbine, and the low efficiency of the components was assumed, e.g., turbine efficiency equal to 82%, compressor efficiency—80%, efficiency of the electric generator—90%, efficiency of the combustion chamber—95%. Assumptions adopted for the analysis are presented in Table 1.
Currently, it is possible to obtain a stable flame during the combustion of low calorific fuels in a wide range of operating parameters, such as the molar composition of the fuel and the excess air coefficient. However, the biogas must be properly cleaned and dried so that it does not damage the turbine. Depending on the origin, the biogas composition is variable. The calorific value depends primarily on the methane content. Currently, biogas that is combusted in gas turbines has a methane content from 35% to 100%. As a result of continuous combustion with excess air and low pressures in the combustion chamber, turbines as well as microturbines have a significantly lower value of exhaust emissions as compared to the reciprocating engines. The combustion of low calorific gases has a significant impact on the natural environment by reducing the emission of nitrogen oxides [64].
The analyzed variants compare the possibility of using highly efficient exchangers and considered 5 different configurations of gas turbosets (Figure 1):
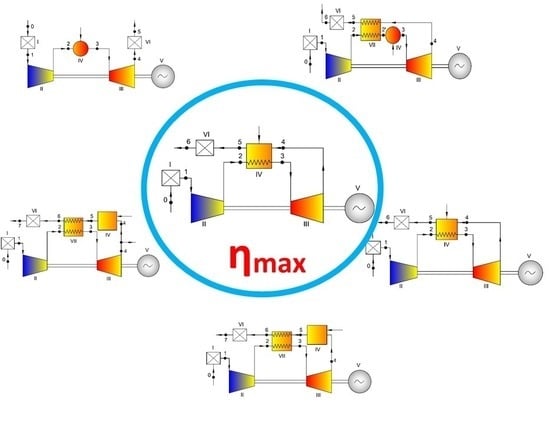
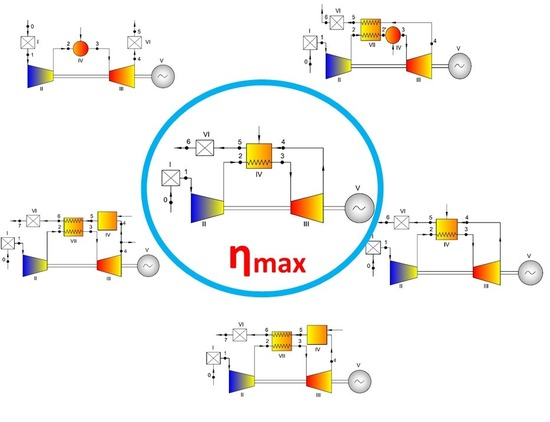
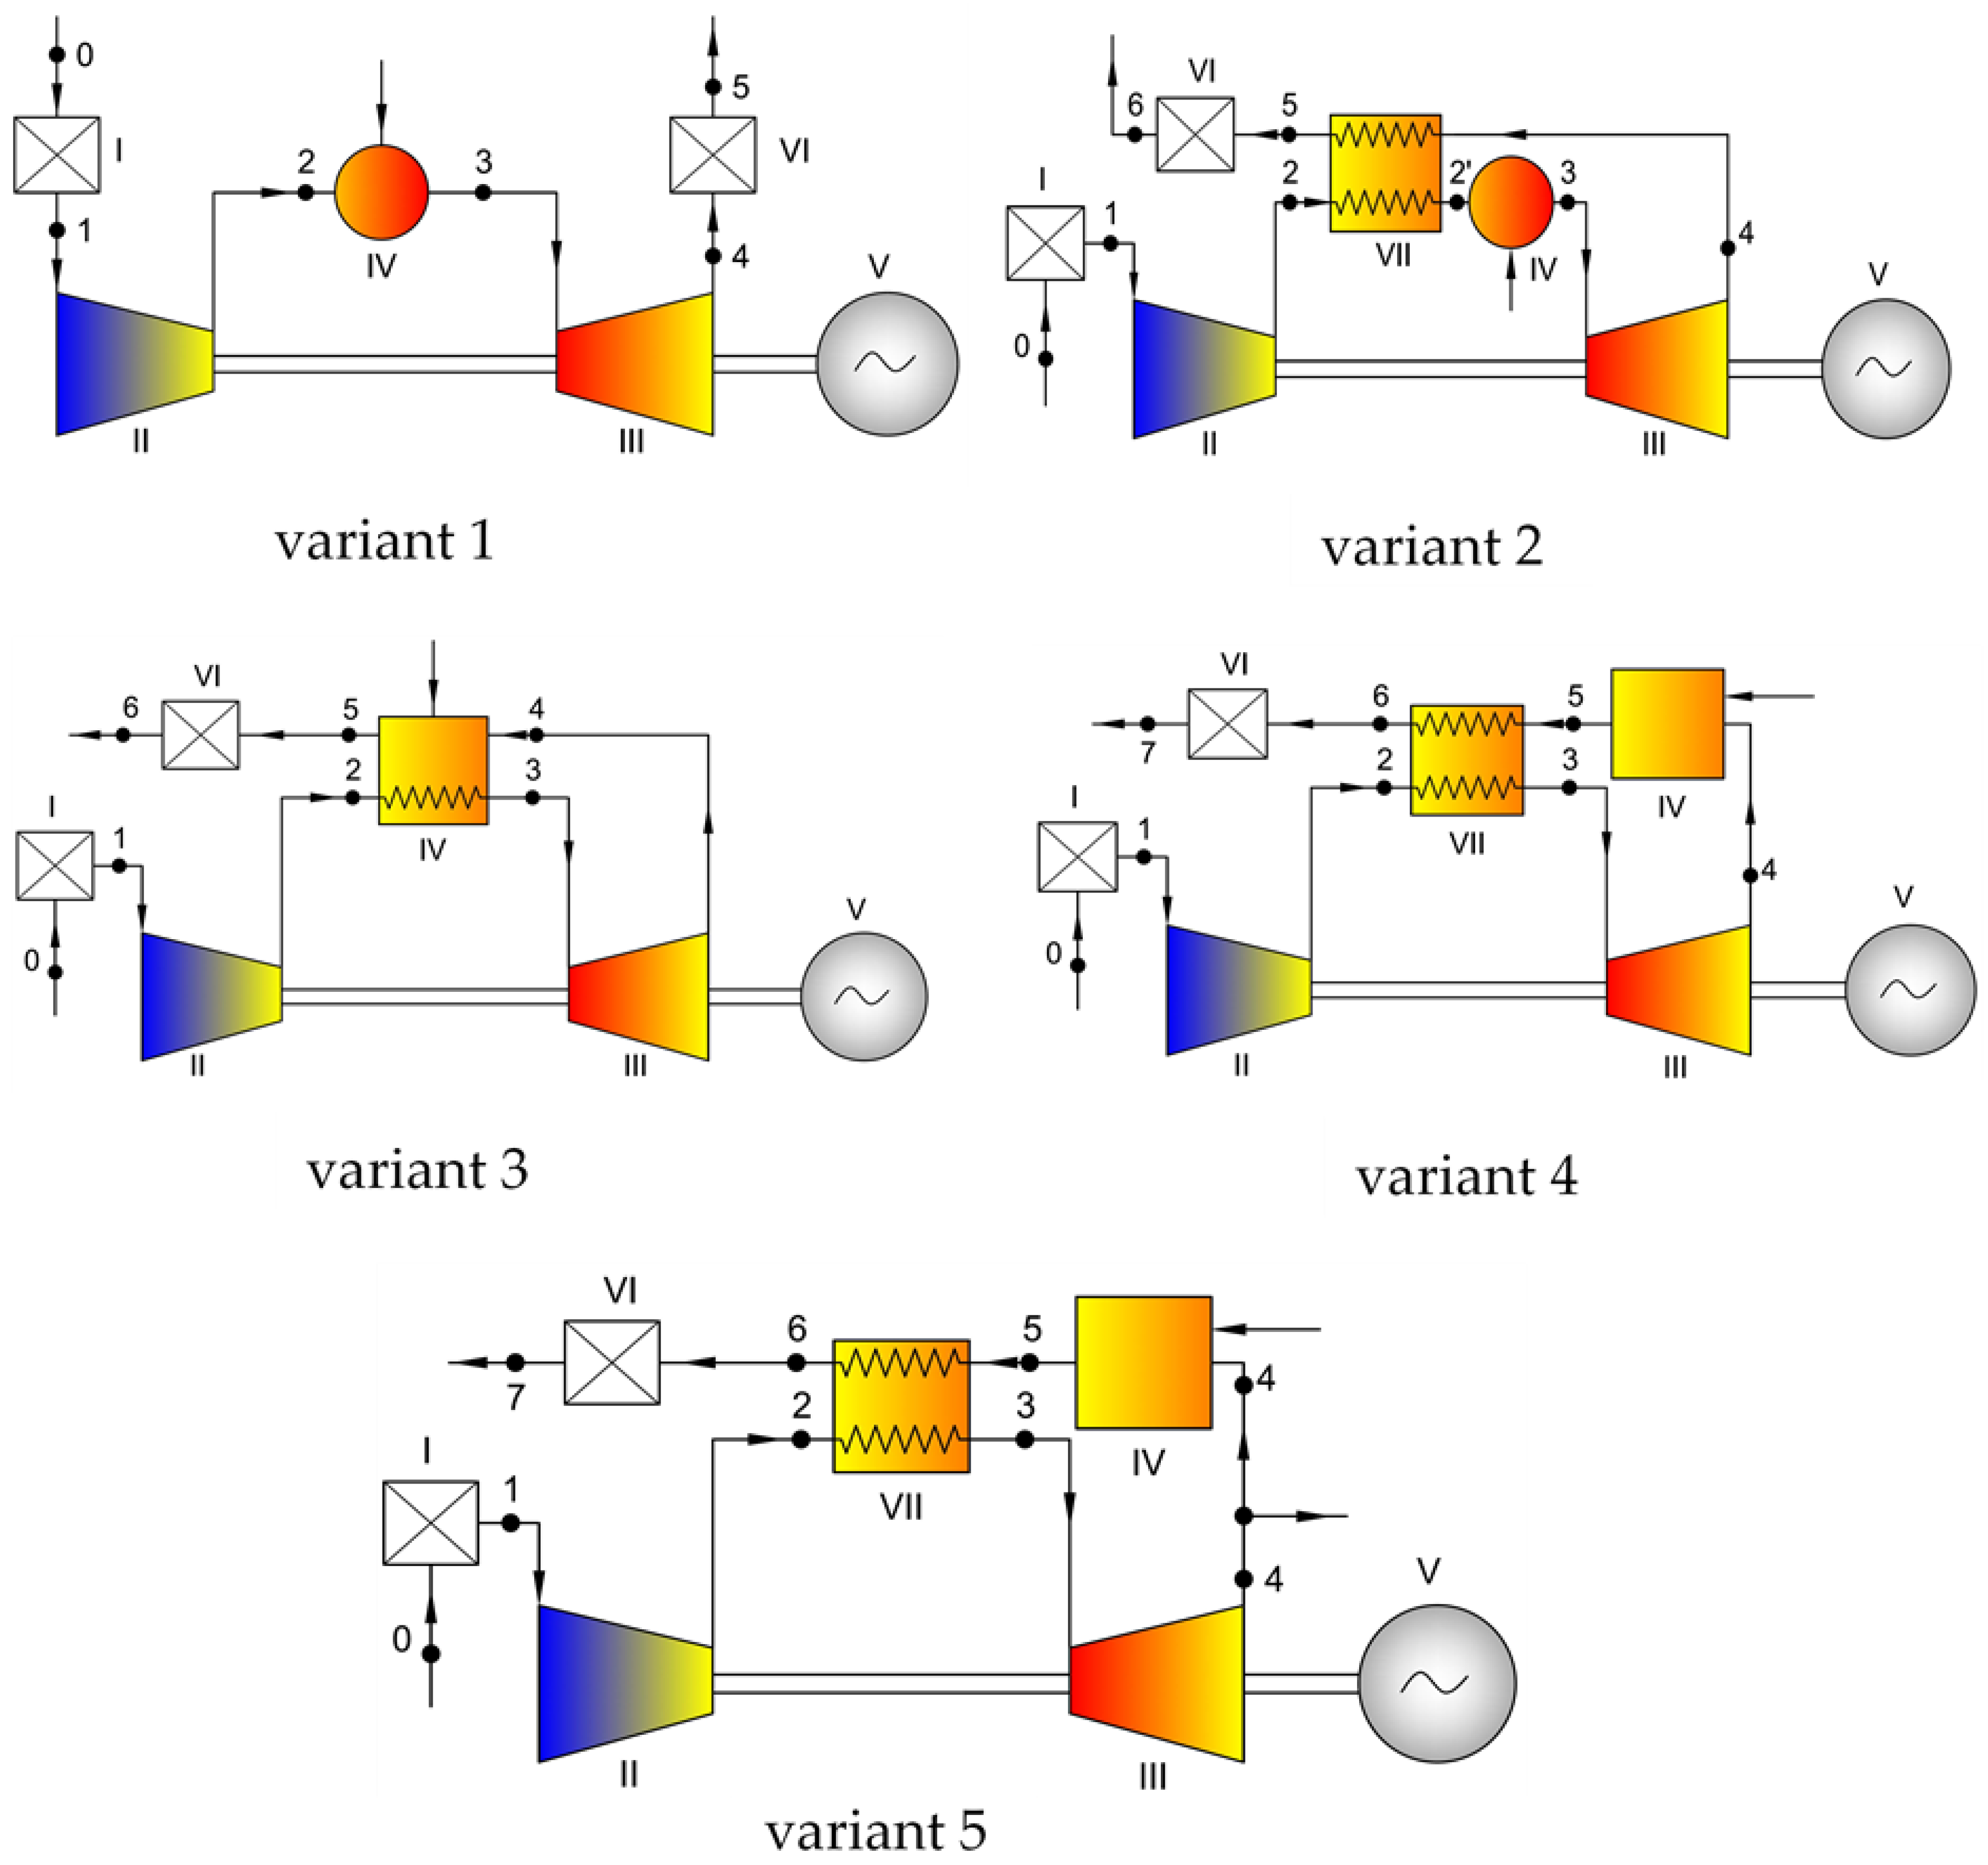
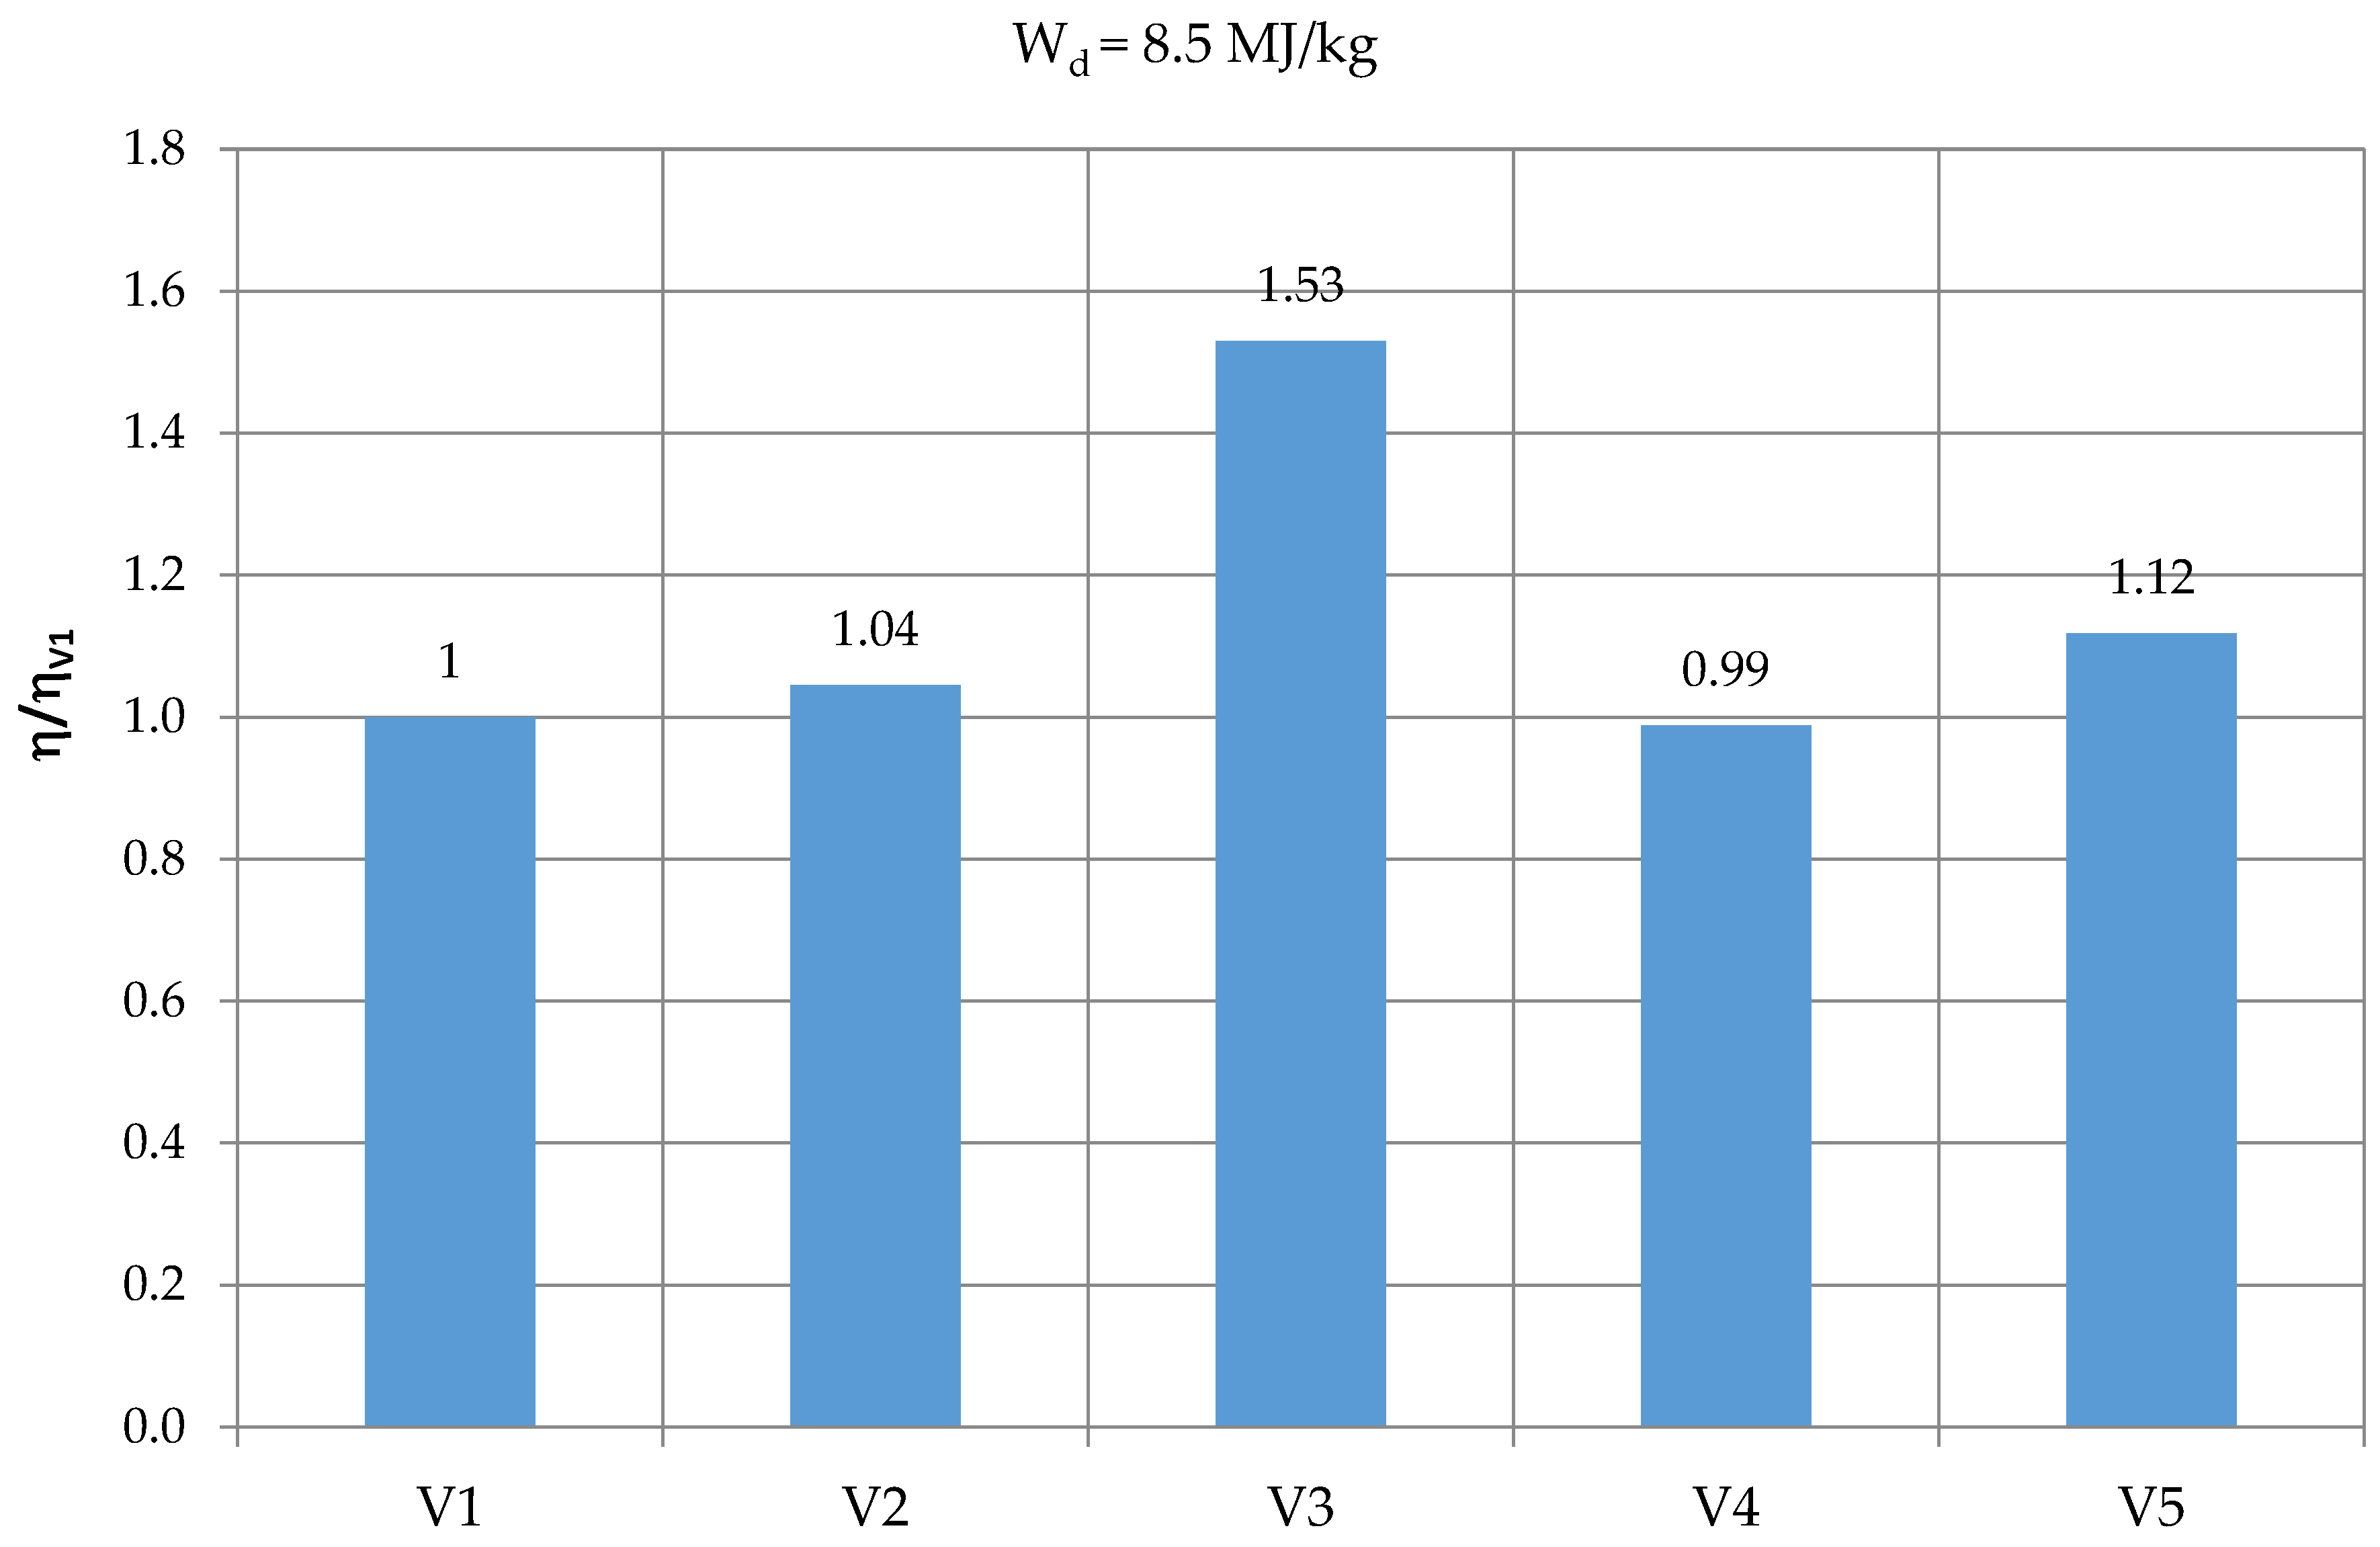
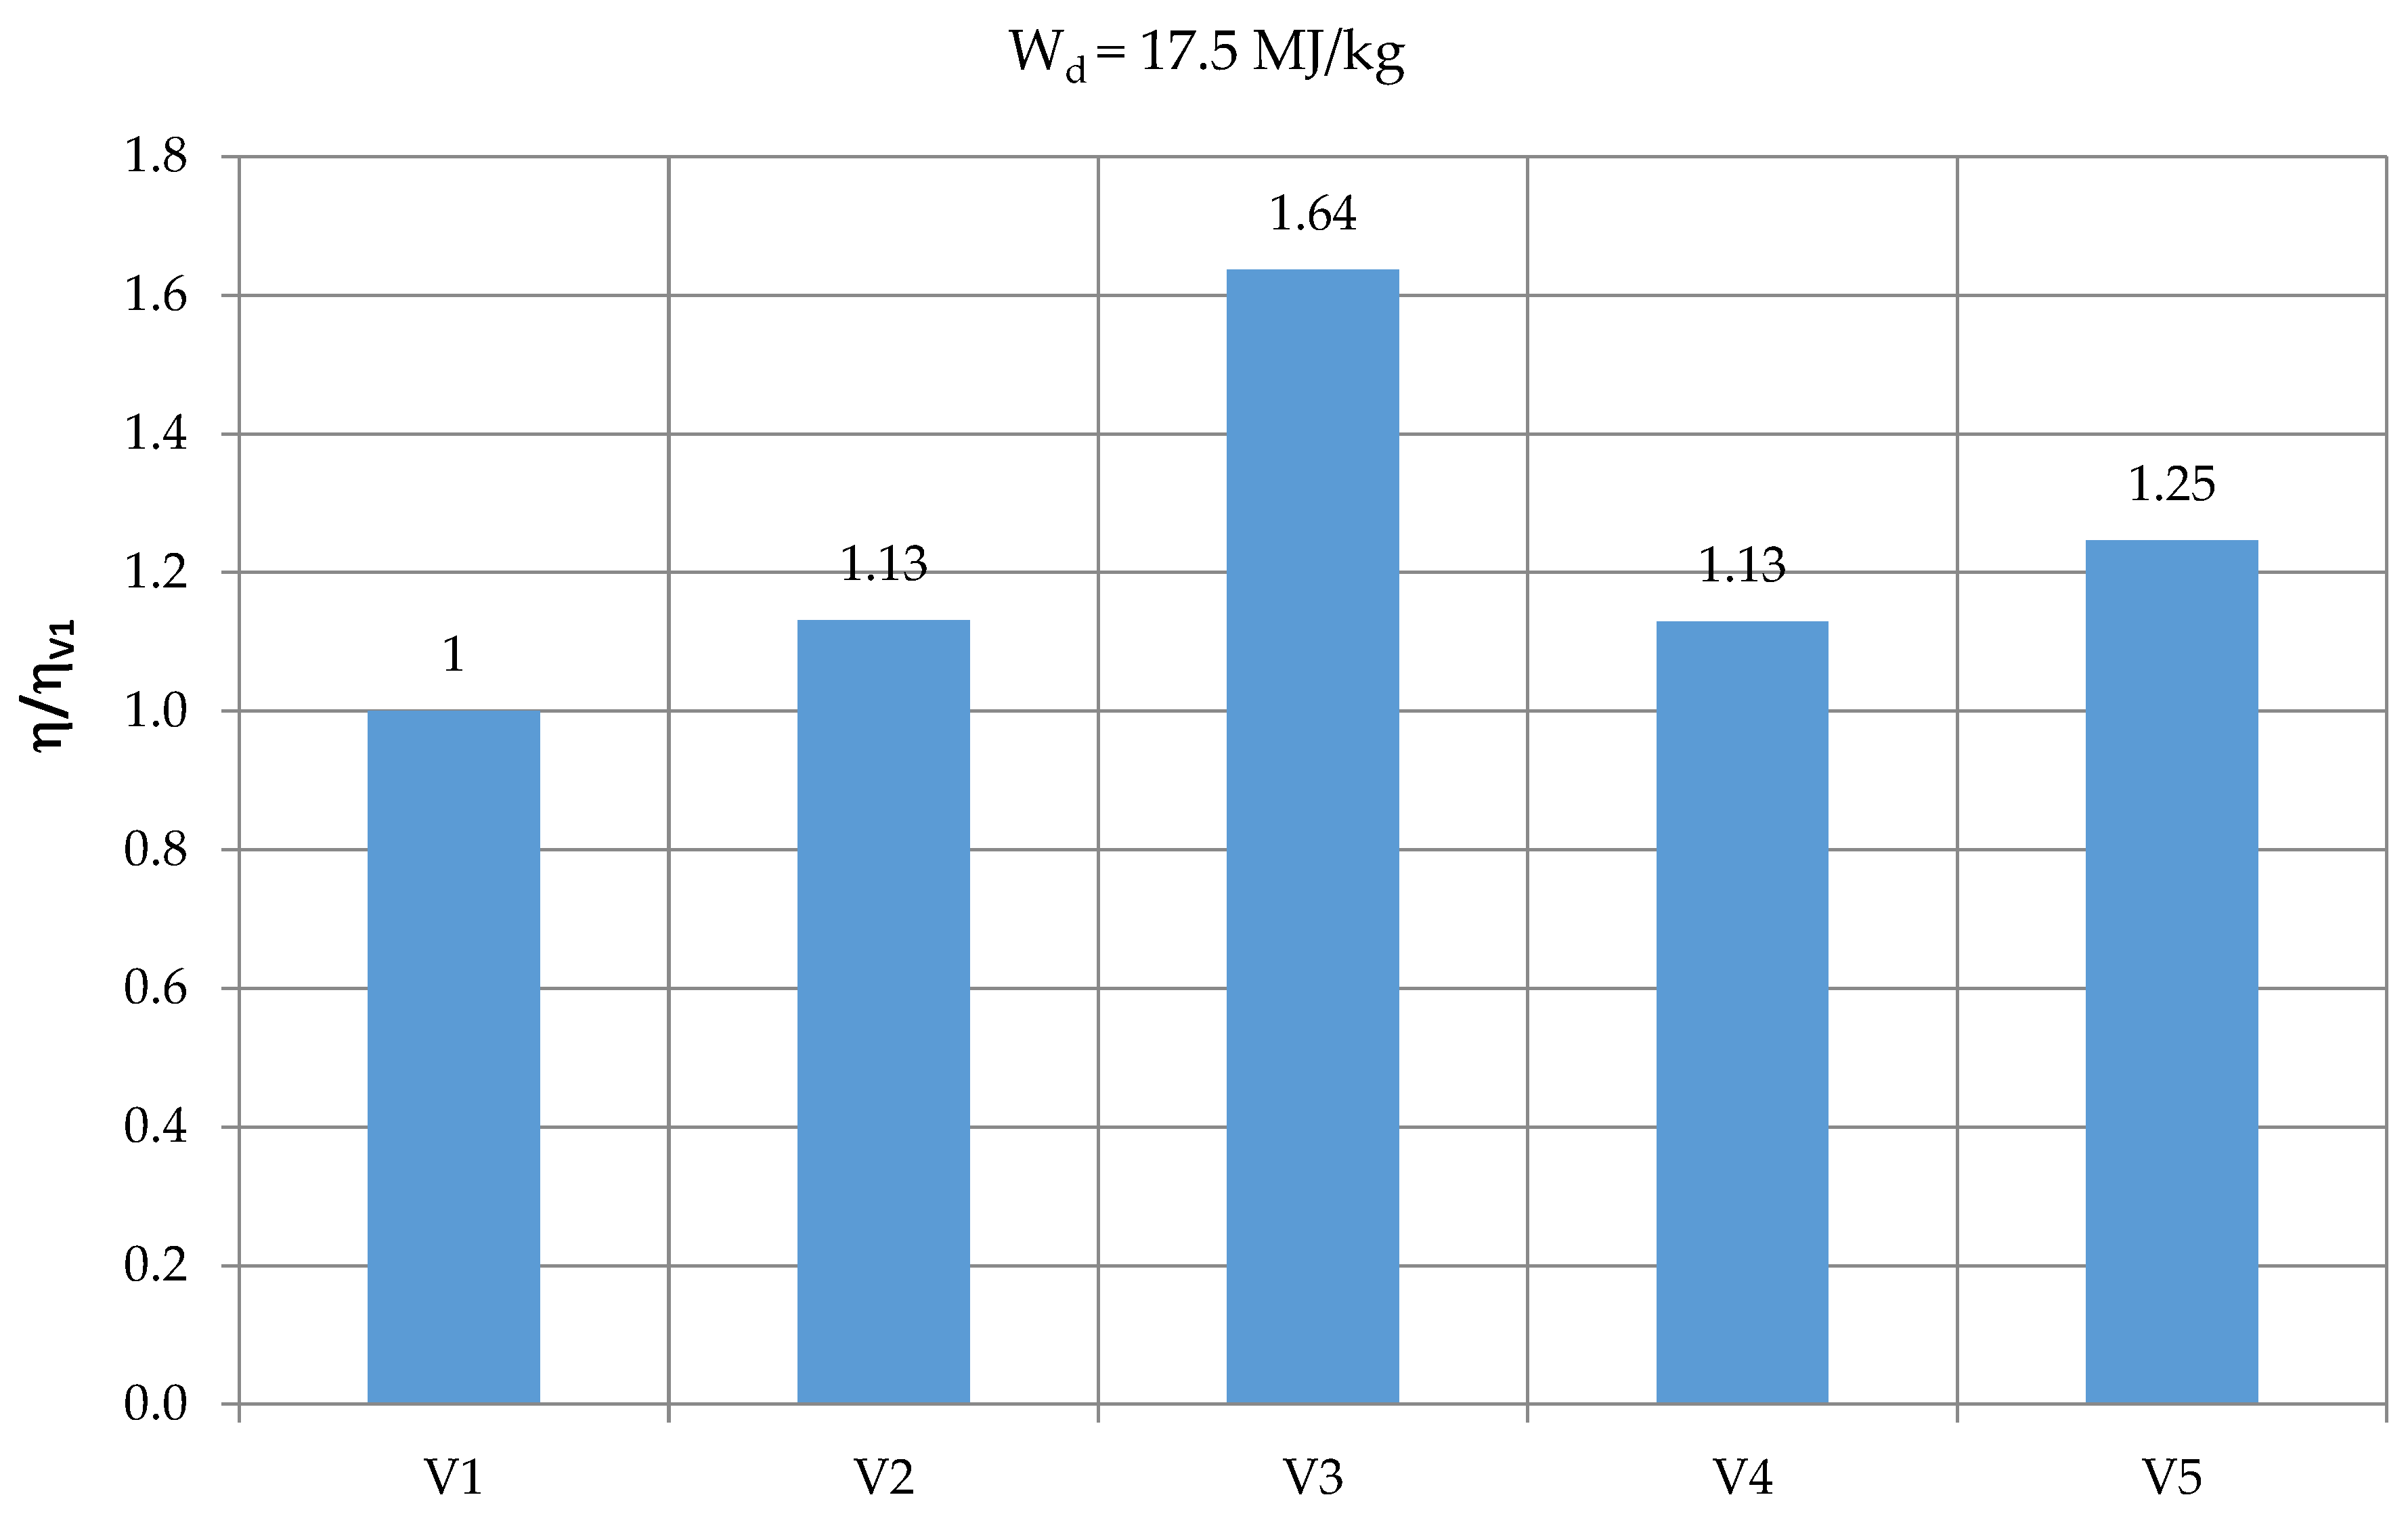
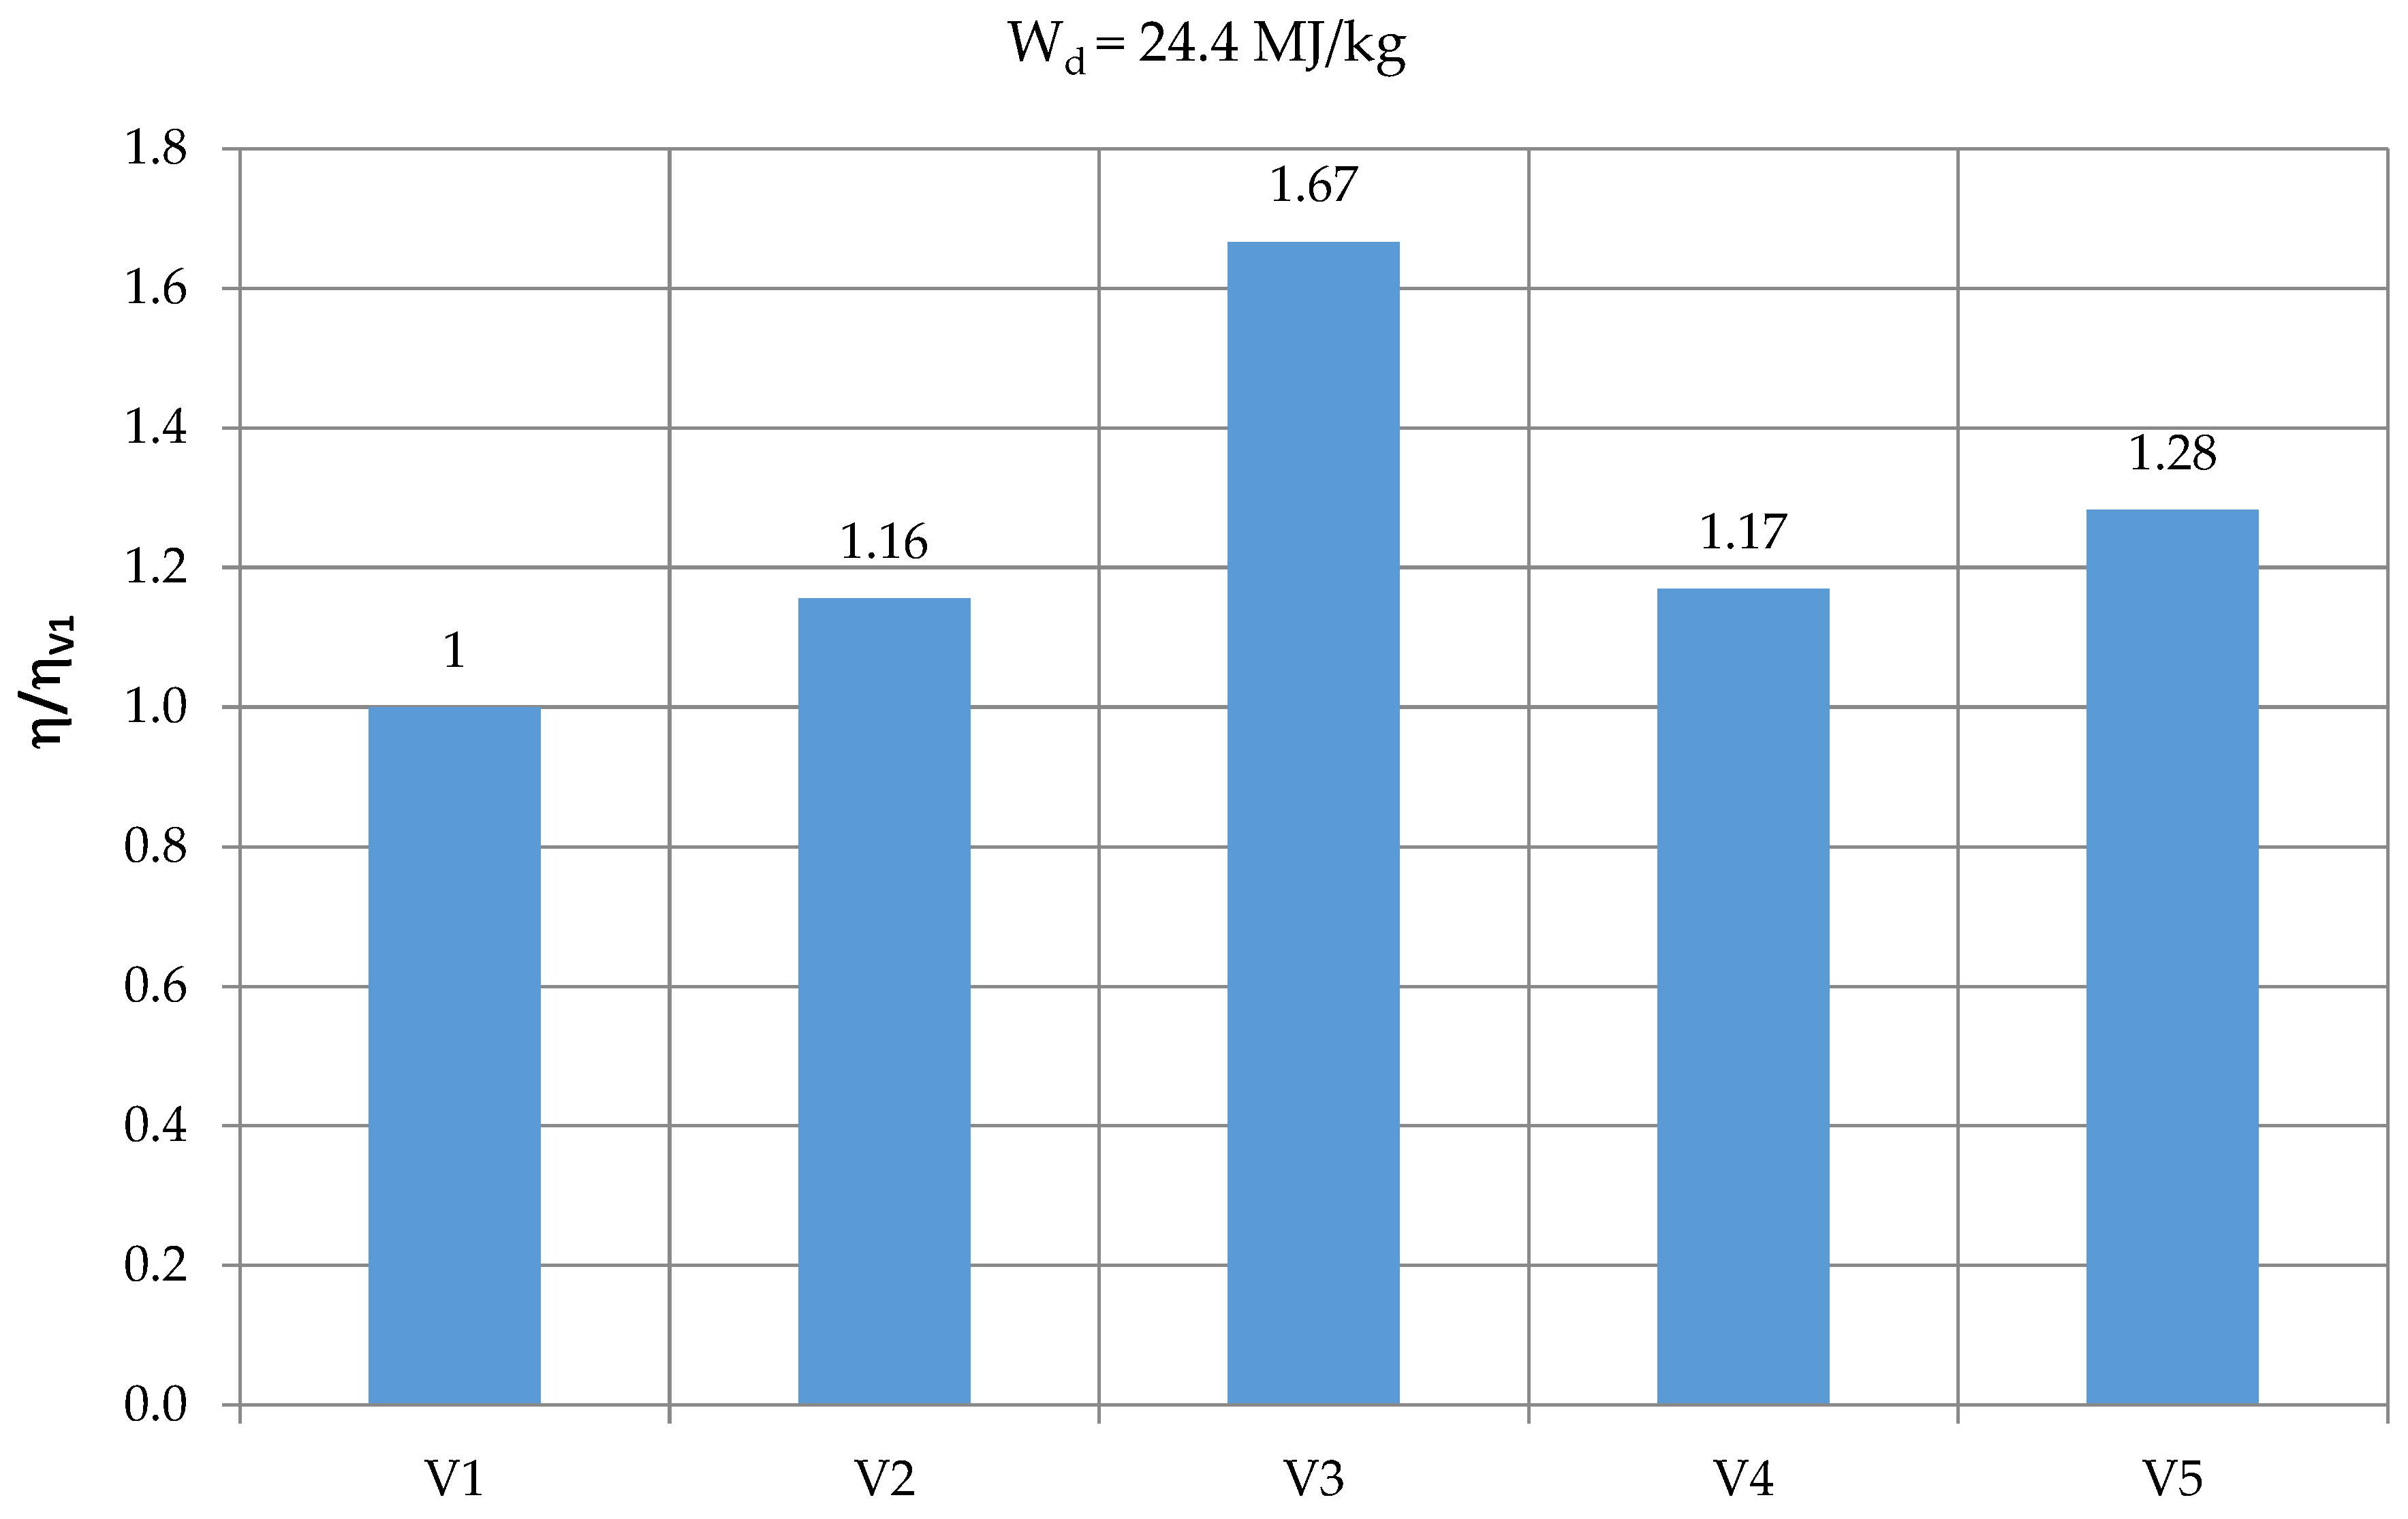
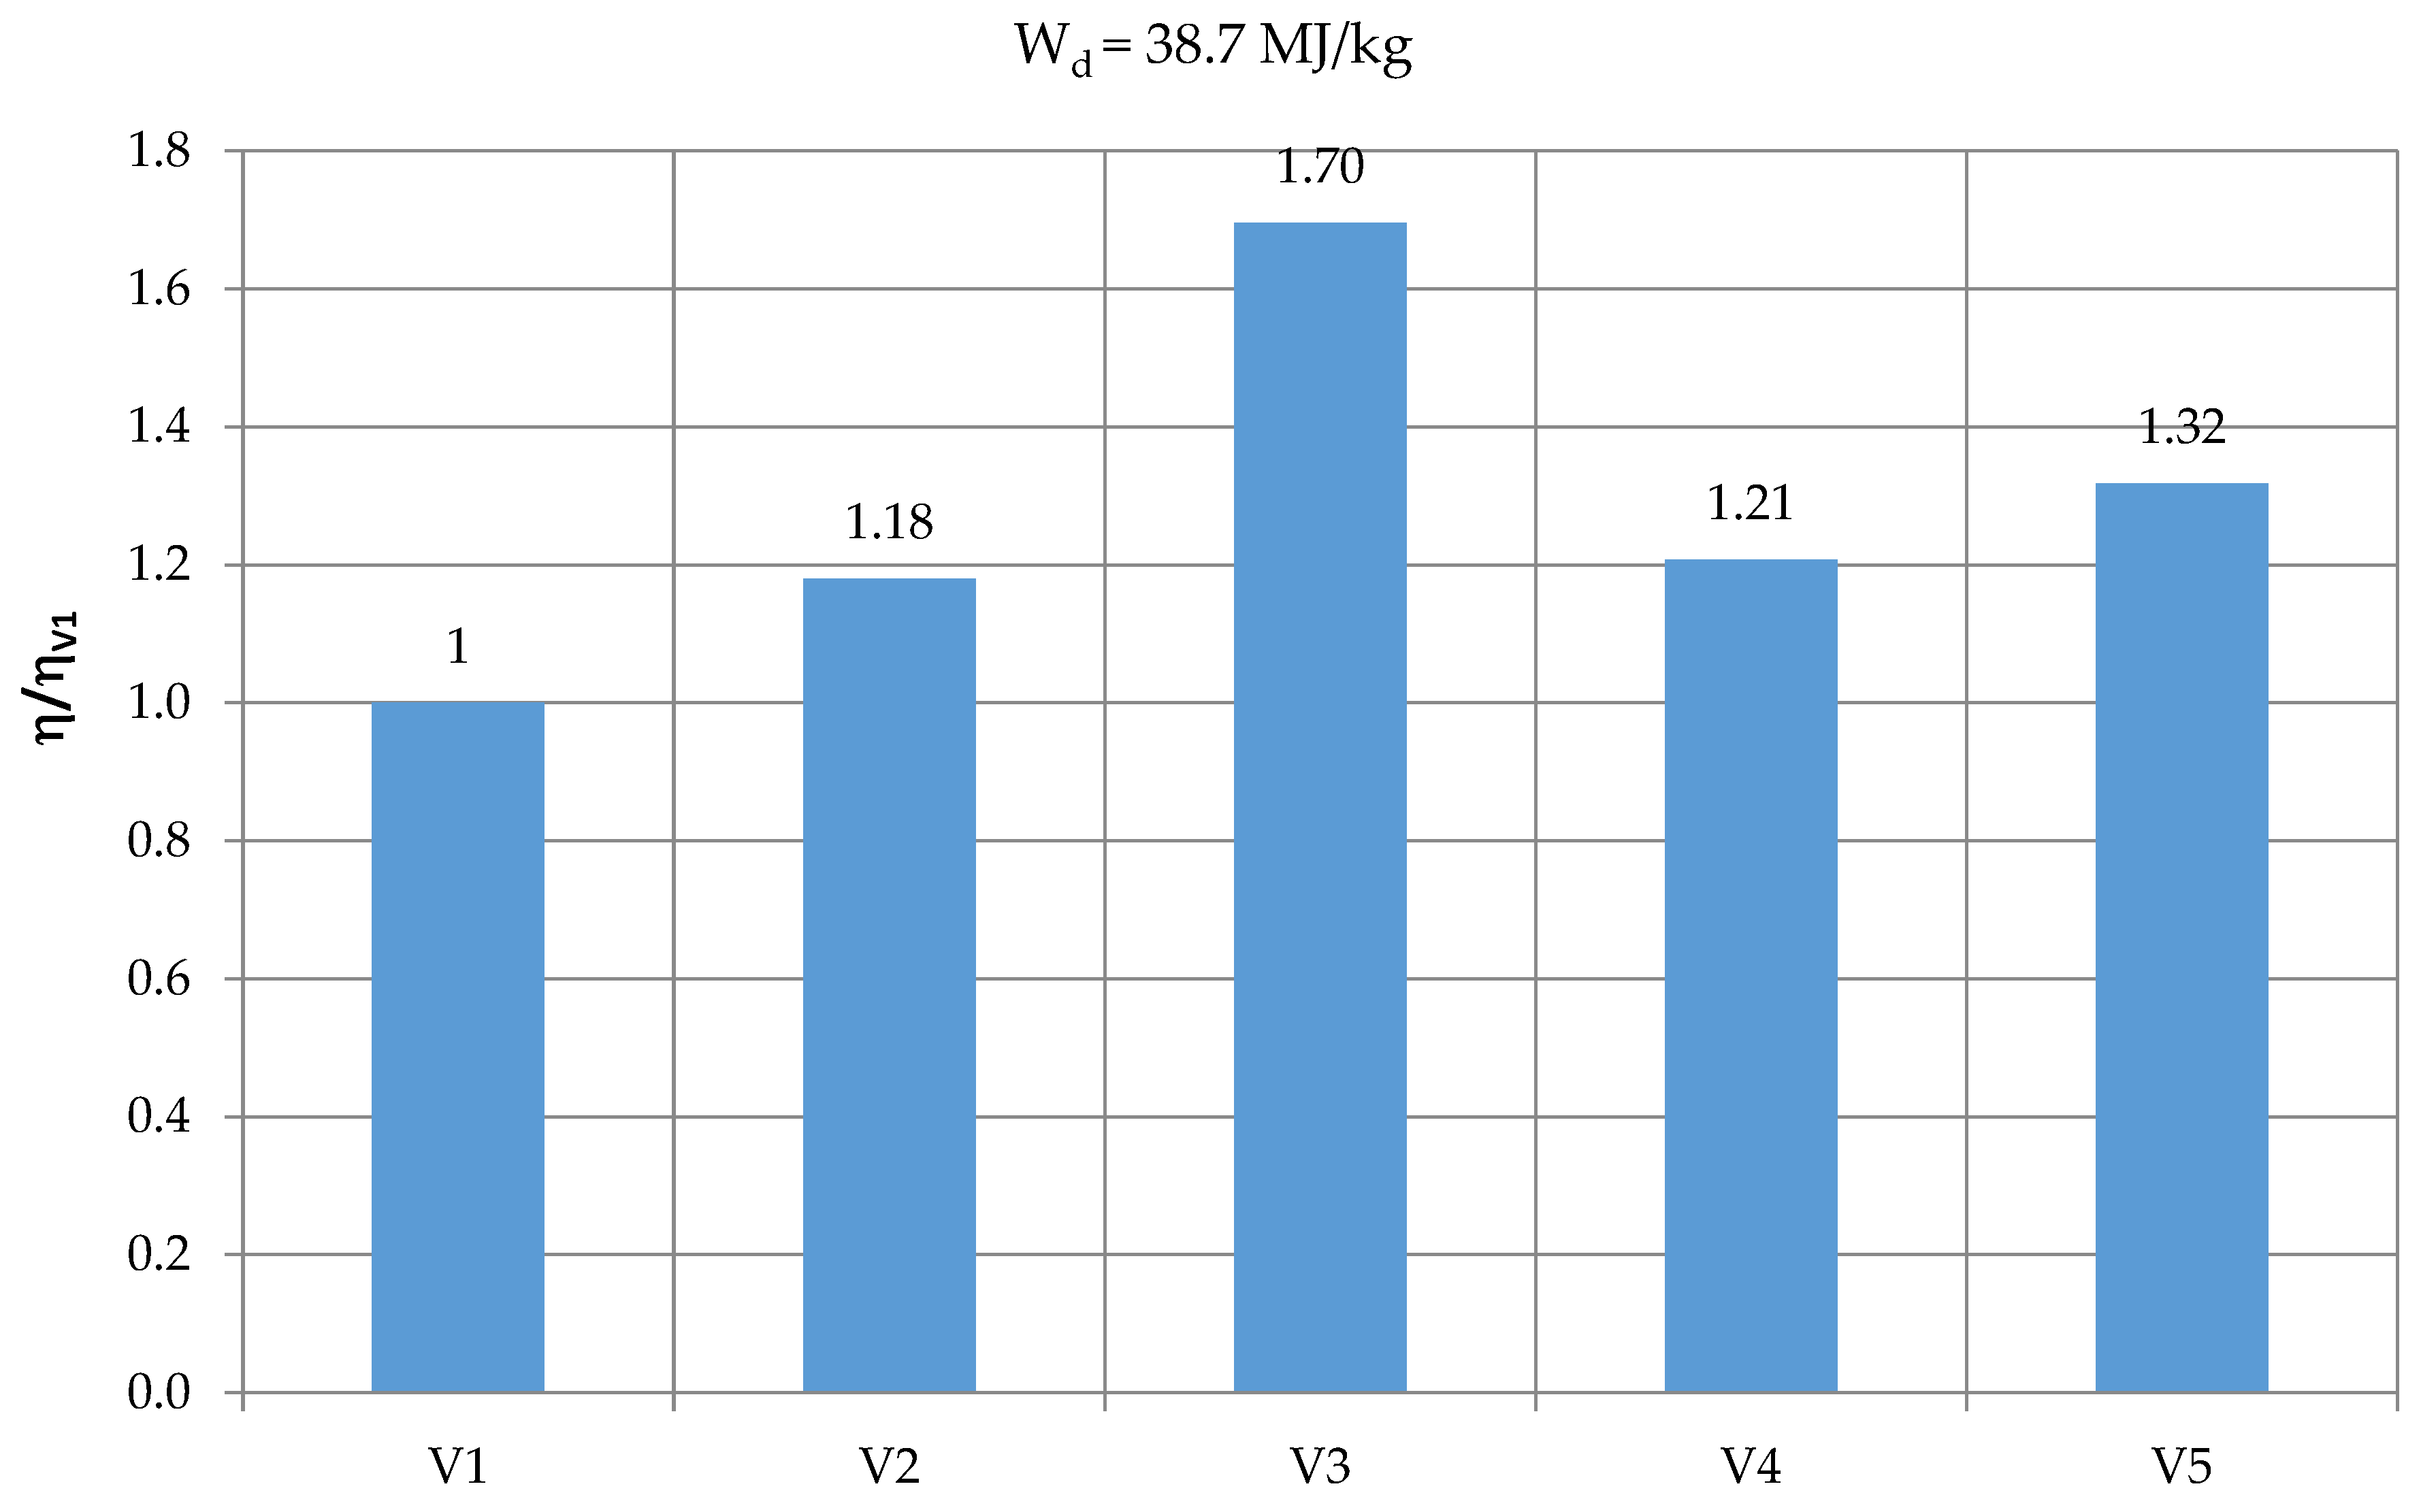
  • Variant 1: turbine set operating according to the simple open cycle,
  • Variant 2: turbine set operating according to the open cycle with regenerator,
  • Variant 3: turbine set operating according to the open cycle with combustion chamber at turbine exit,
  • Variant 4: turbine set operating according to the open cycle with external combustion chamber at turbine exit and high-temperature heat exchanger,
  • Variant 5: turbine set operating according to the open cycle with partial bypassing of external combustion chamber at turbine exit and with high-temperature heat exchanger.
Analyses for gases with very different calorific value were carried out in the presented paper. The list of combusted gases analyzed is presented in Table 2. For comparison, the analysis was also carried out for methane (the main component of LNG or natural gas), and hydrogen being an ecological fuel with very high calorific value.

3. Results

Computations for five variants of the cycles (Figure 1) with seven heating values for each cycle (Table 2) were performed. The thermodynamical calculations were performed following the classical approach well known from the bibliography [62,69,70,71]. First, the parameters in all the characteristic points of the schemas (turbine cycles) were determined, then the relation between the mass flow rates in particular elements were estimated, and, finally, the overall efficiencies of the cycles were calculated. The calculations were performed in the following order: calculations of the compression process in the compressor, calculations of the expansion line in the turbine, calculations of the regenerator and the combustion chamber energy balance equations. The following main relationships were used in the calculations.
The power and specific work of the gas turbine set:
W GT = η m · m ˙ T · l T m ˙ C · l C
l GT = W GT m ˙ C = η m · ( m ˙ T m ˙ C ) · l T ( m ˙ C m ˙ C ) · l C = η m · ( m ˙ T m ˙ C ) · l T l C
The specific work of the compressor and turbine:
l C = 1 η C · c pC · T 1 · ( ( p 2 p 1 ) K C 1 K C 1 )
l T = η T · c pT · T 3 ( 1 ( p 4 p 3 ) K T 1 K T )
The efficiency of the gas turbine cycle:
η GT = W GT Q ˙ 1
where the heat flux brought to combustion chamber:
Q ˙ 1 = ( m ˙ T · h 3 m ˙ C · h 2 ) 1 η CC = m ˙ f · LHV
The overall efficiency of the gas turbine unit:
η GT = η m · m ˙ T · l T m ˙ C · l C ( m ˙ T · i 3 m ˙ C · i 2 ) · 1 η CC
and:
η TG = η CC · η m · η C · c pT · T 3 T 1 [ 1 ( 1 T ) K T 1 K T ] · m ˙ T m ˙ C 1 η C · c pC · [ ( C ) K C 1 K C 1 ] m ˙ T m ˙ C · c pCC · T 3 T 1 1 η C · c pC · [ ( C ) K C 1 K C 1 ]
The heat flux transferred from the exhaust fumes in the regenerator is that:
Q ˙ VII ,   T = m ˙ T · ( h 4 h 5 )
The heat flux received by the air in the regenerator is that:
Q ˙ VII ,   C = m ˙ C · ( h 2 h 2 )
The values of specific heat at constant pressure for particular states of working media were determined on the basis of their chemical composition and thermodynamical parameters using REFPROP software.
The most significant results of the calculations are presented in Table 3. The results referred to methane as fuel (row 6 in Table 2), whereas a reference also showed the results of calculations for hydrogen fuel (row 7 in Table 2). Variant 1 (Figure 1) is a basic cycle in the power plants with a gas turbine; therefore, some of the results were related to it. For each of the analyzed variants, the compression was optimized to maximize efficiency. The effect of the compression on the value of the efficiency referring to the value of the maximum efficiency of variant 1 for two exemplary fuels is shown in Figure 2. In this case, the effect of the calorific value of fuel is very clear. For a calorific value equal to 4 MJ/kg, the compression amounts to approximately 17, and for a calorific value of 54 MJ/kg, it amounts to approximately 13, which evidently affects the design of the flow part of the turbine and compressor. As can be easily observed, the calorific value affects the optimum compression value (maximum efficiency) only for variant 1, but in other cases the type of fuel has a small influence on the value of the compression (Figure 3). Therefore, when designing the flow part of a gas turbine, operated in accordance with an open simple cycle (variant 1, often used in low power turbosets), we should pay special attention to the correct selection of compressor pressure depending on the type of fuel expected.
The subsequent drawings (Figure 4, Figure 5, Figure 6, Figure 7, Figure 8, Figure 9 and Figure 10) show the influence of the cycle’s structure and of calorific value on maximum efficiency related to the maximum efficiency of variant 1. Only for the smallest calorific value considered (4 MJ/kg) variant V1 proved itself to be better than variants V2, V4, V5. As far as effectiveness is concerned, the most advantageous is the variant 3. The disproportion of this one as compared to variant 1 increases with an increase of the calorific value of the fuel combusted (collective plot Figure 11). The graph (Figure 12) shows the influence of the structure of the cycle and calorific value of fuel on the efficiency of the system in relation to the variants using methane as a fuel. Only for small heating value of the fuel its effect on the efficiency of turbine sets can be noticed.
The drawings (Figure 13, Figure 14 and Figure 15) show the influence of the fuel cycle structure and its calorific value on the mass flux of the fuel burned in the combustion chamber as related to the methane mass flux (Figure 13), and on the exhaust gas mass flux again compared to the variants with methane as a fuel (Figure 14), and on the effective power in relation to similar variants with methane as a fuel (Figure 15).
In the case of fuel consumption, the conclusions are obvious: an increase in calorific value is accompanied by a decrease of fuel consumption. This effect is the most visible for variant 2. As a consequence, the exhaust flux also decreases with an increase in fuel’s calorific value, but in this case the impact is most pronounced for variant 2. It can also be concluded that in the case of turbine sets with an external combustion chamber (variants 3, 4, and 5), the change in calorific value does not affect the unit power of the turbine set.
Cogeneration systems working with organic media are already for many years [72] available in a wide range of electrical and thermal power. However, only a few examples of ORC (Organic Rankin Cycle) cogeneration installations with an electric power below 5 kW [73] can be found.
Previous research has shown that it is possible to build a set of microturbines with a capacity of about 2 kW with higher efficiency than in existing machines [74]. It is worth noting that the relatively high efficiency of microturbines can be achieved due to a very careful and advanced design process.

4. Discussion

Variants with external combustion chambers demand particular attention. In fact, this solution has been known for dozens of years and it has, for example, been considered for nuclear power plants with High-Temperature Gas-cooled Reactors (HTGR) but only recently has it appeared in turbomachinery practice, in small output gas turbines for prosumer and distributed energy systems. It is hardly possibly to find any information in the literature about the design problems and the results of technical analysis. However, there are a few companies [75,76,77,78,79] which offer small output power plants for different fuels with external combustion systems. They are characterized by a relatively small compressor ratio which corresponds well to the results shown in the paper. However, the efficiency of these units is rather unimpressive (up to about 24% for sets with regenerators). In spite of that they arouse particular interest due to the fact that they can use various types of fuel, including different biofuels. They can still be treated as pioneer solutions but it is highly likely that they will become quite popular in the near future.

5. Final Conclusions

The analysis carried out allowed for the following conclusions:
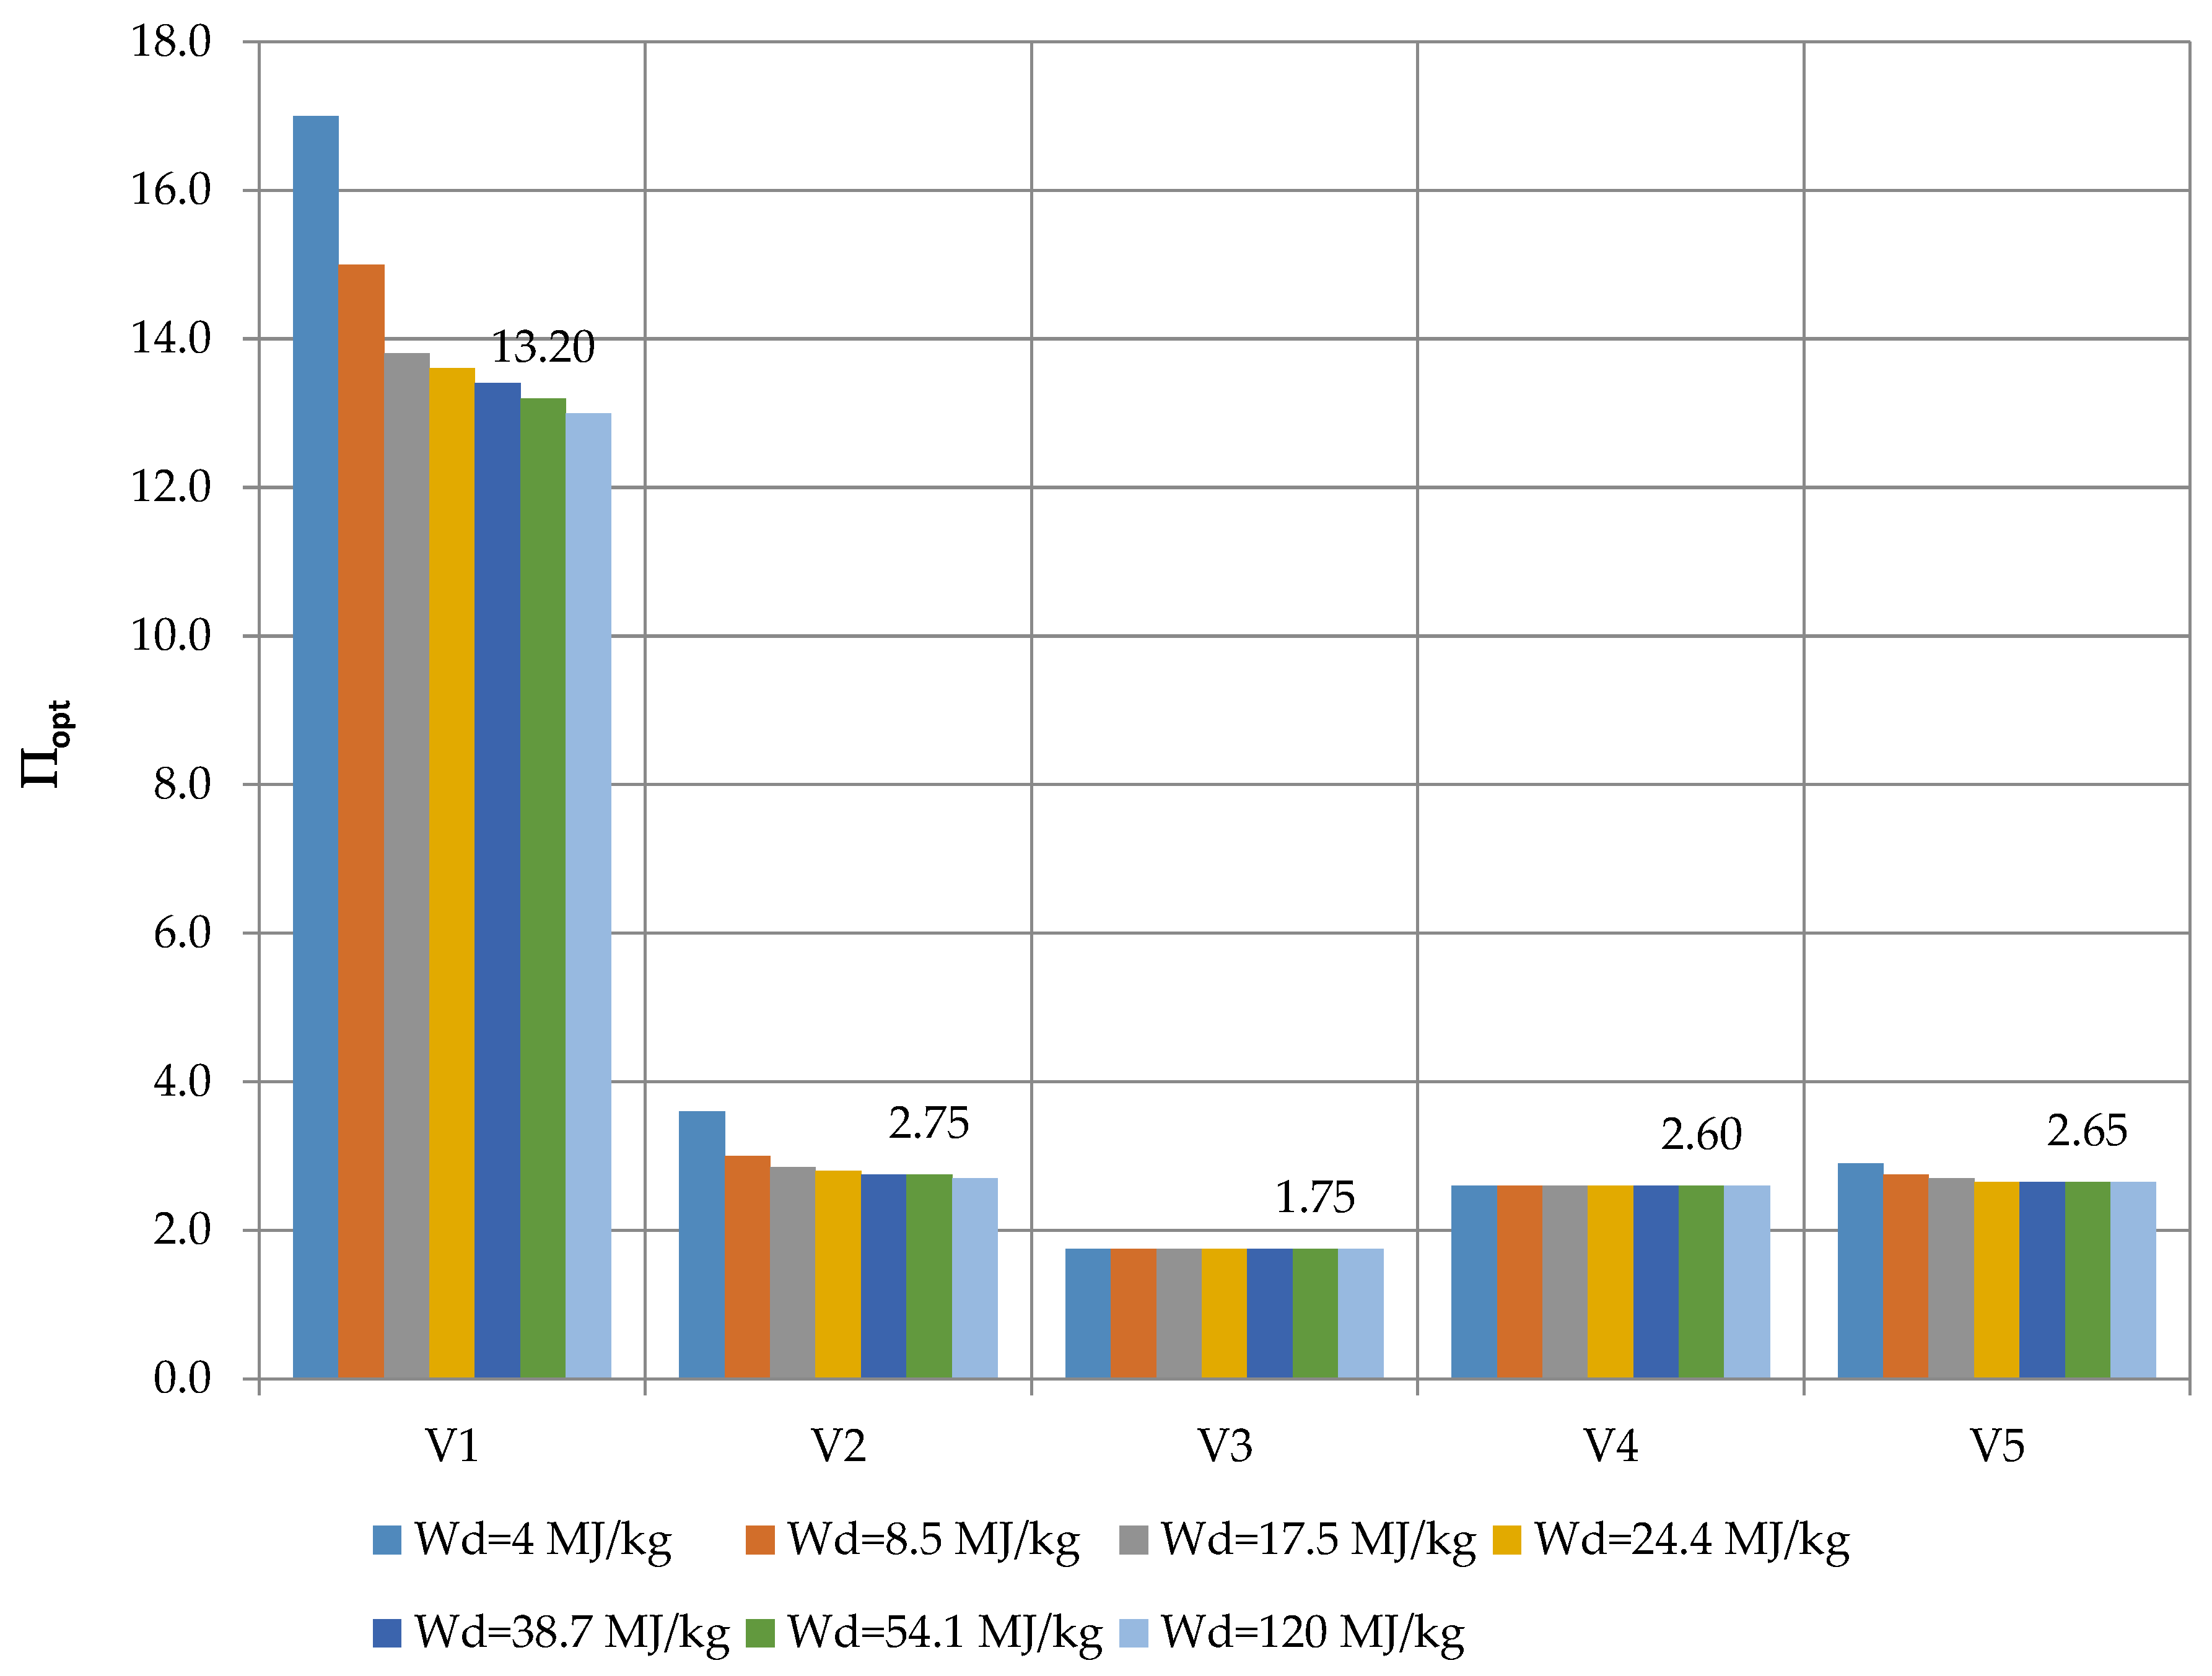
  • In the design of the flow part of gas turbines that burn biofuel (mainly low power ones, dedicated for distributed energetics), not only the structure of the turbine set, but also the calorific value and type of fuel should be taken into account.
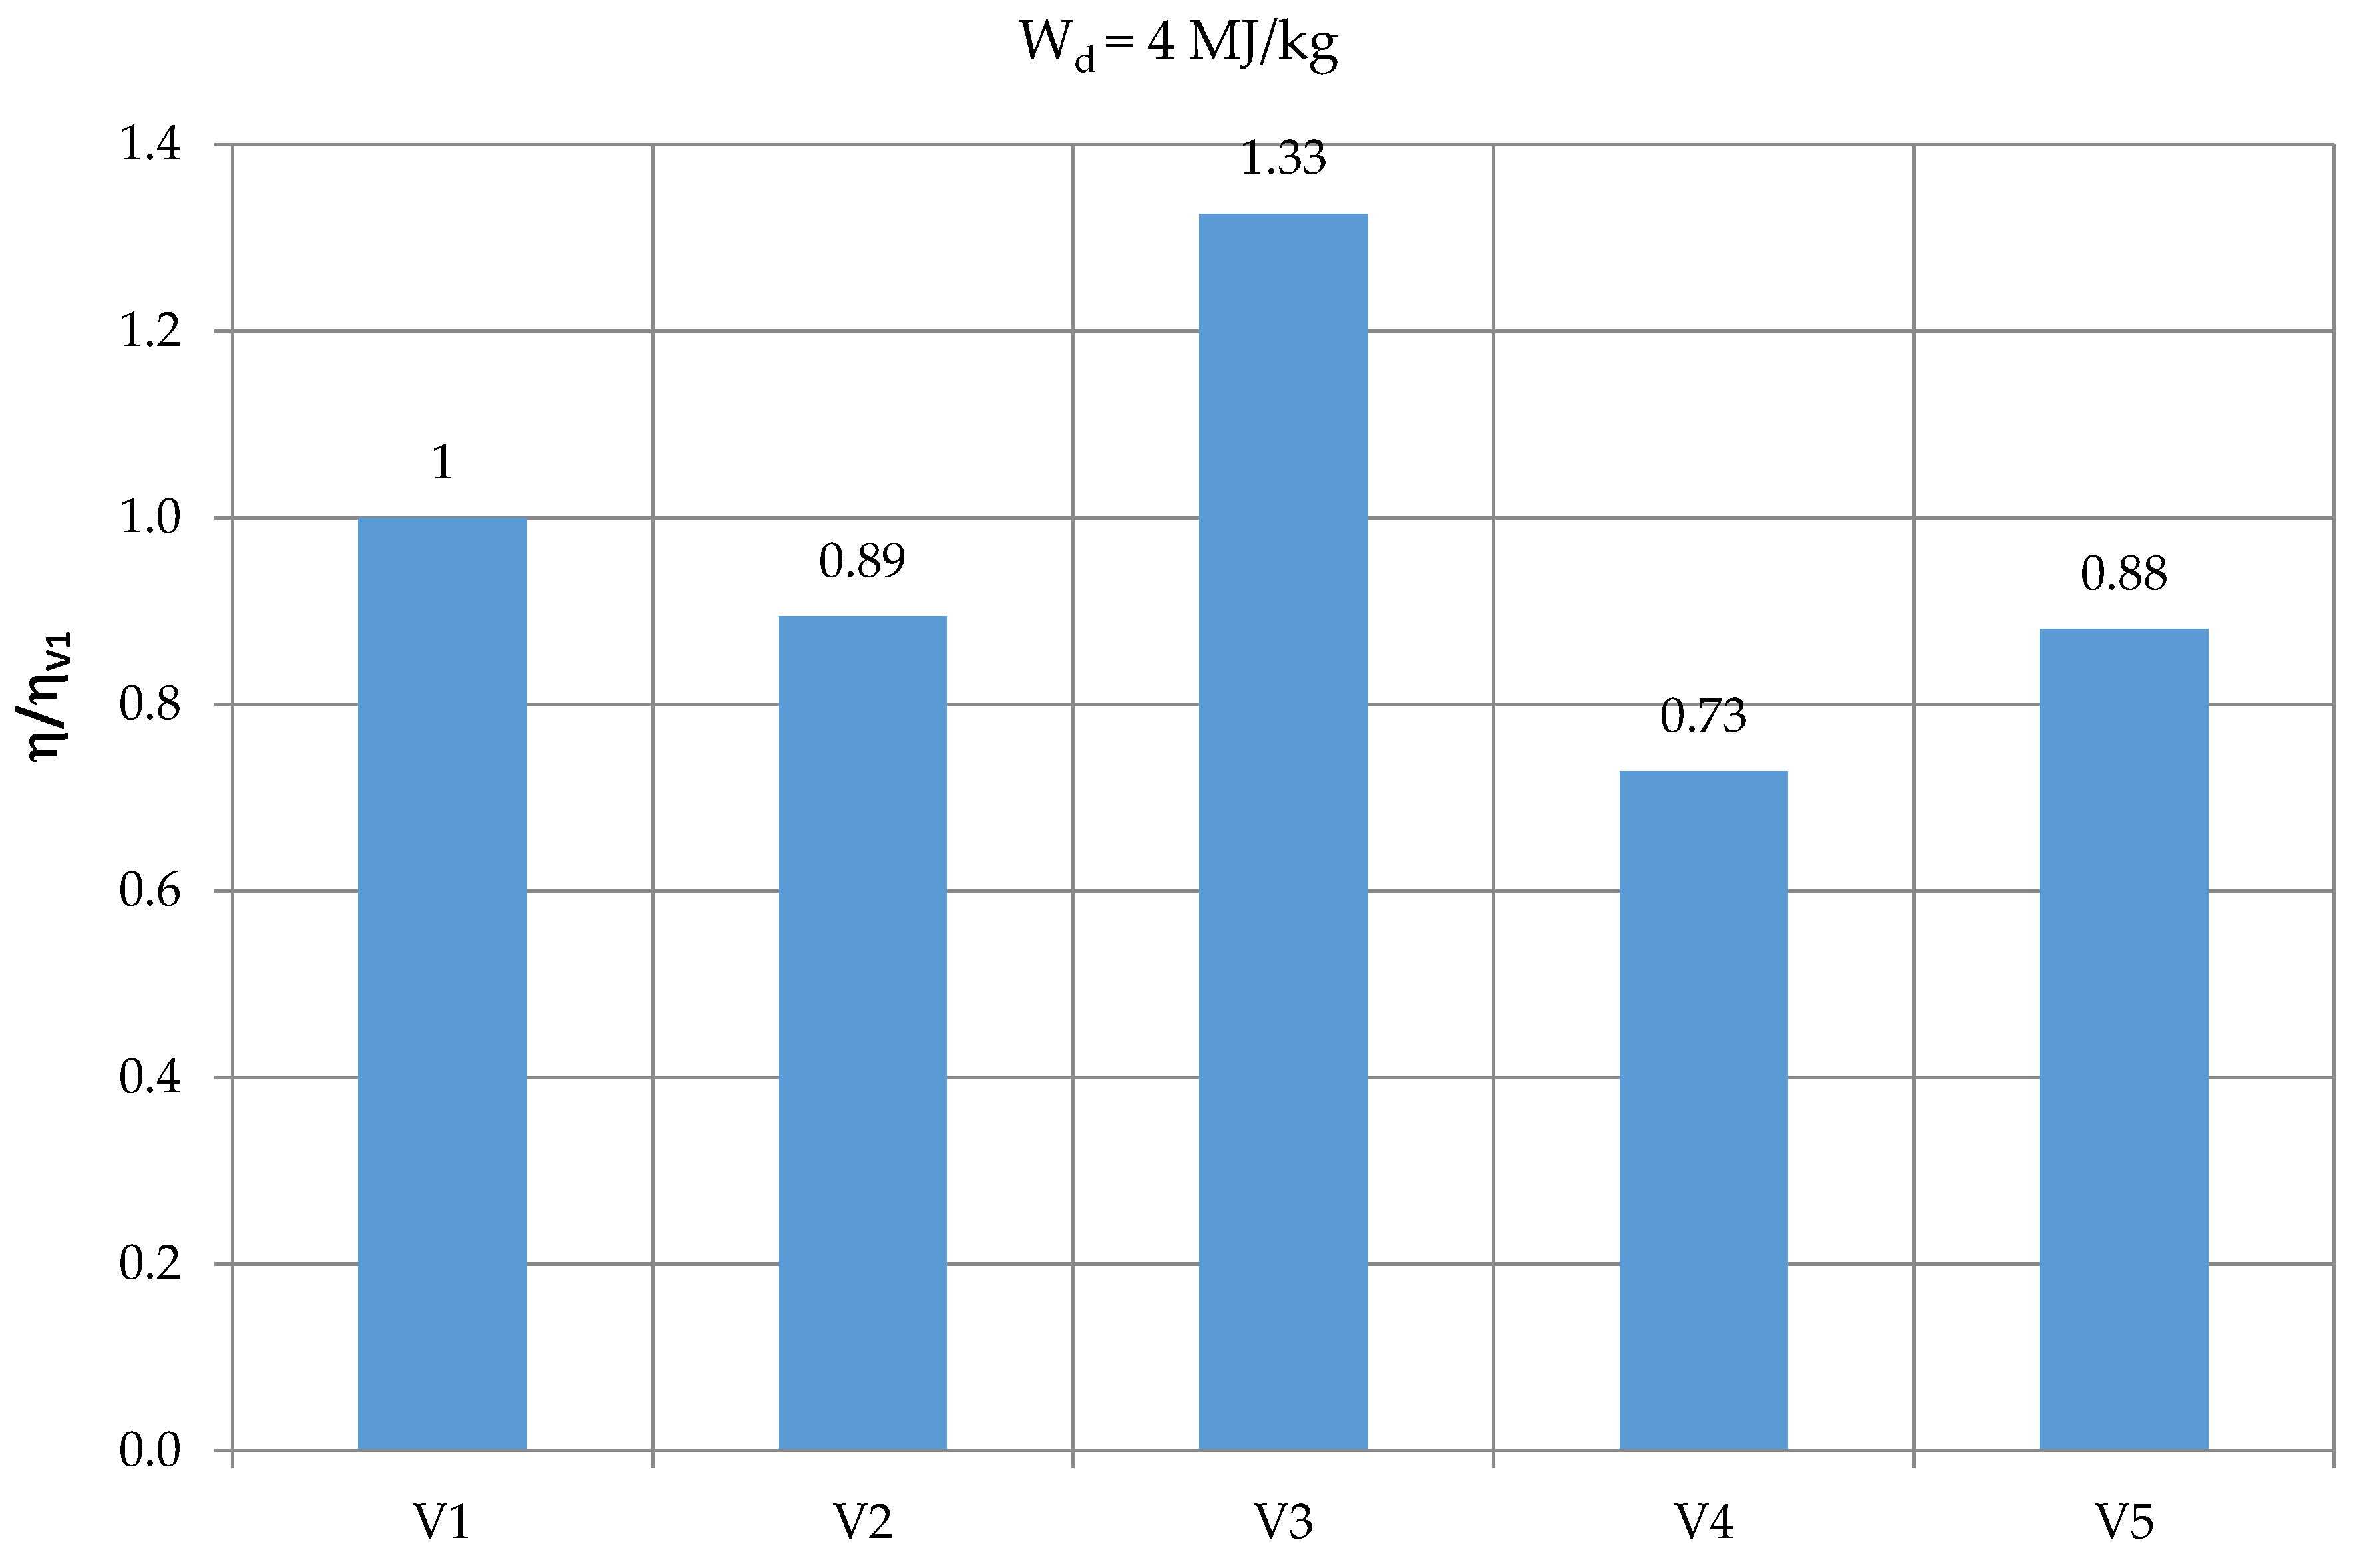
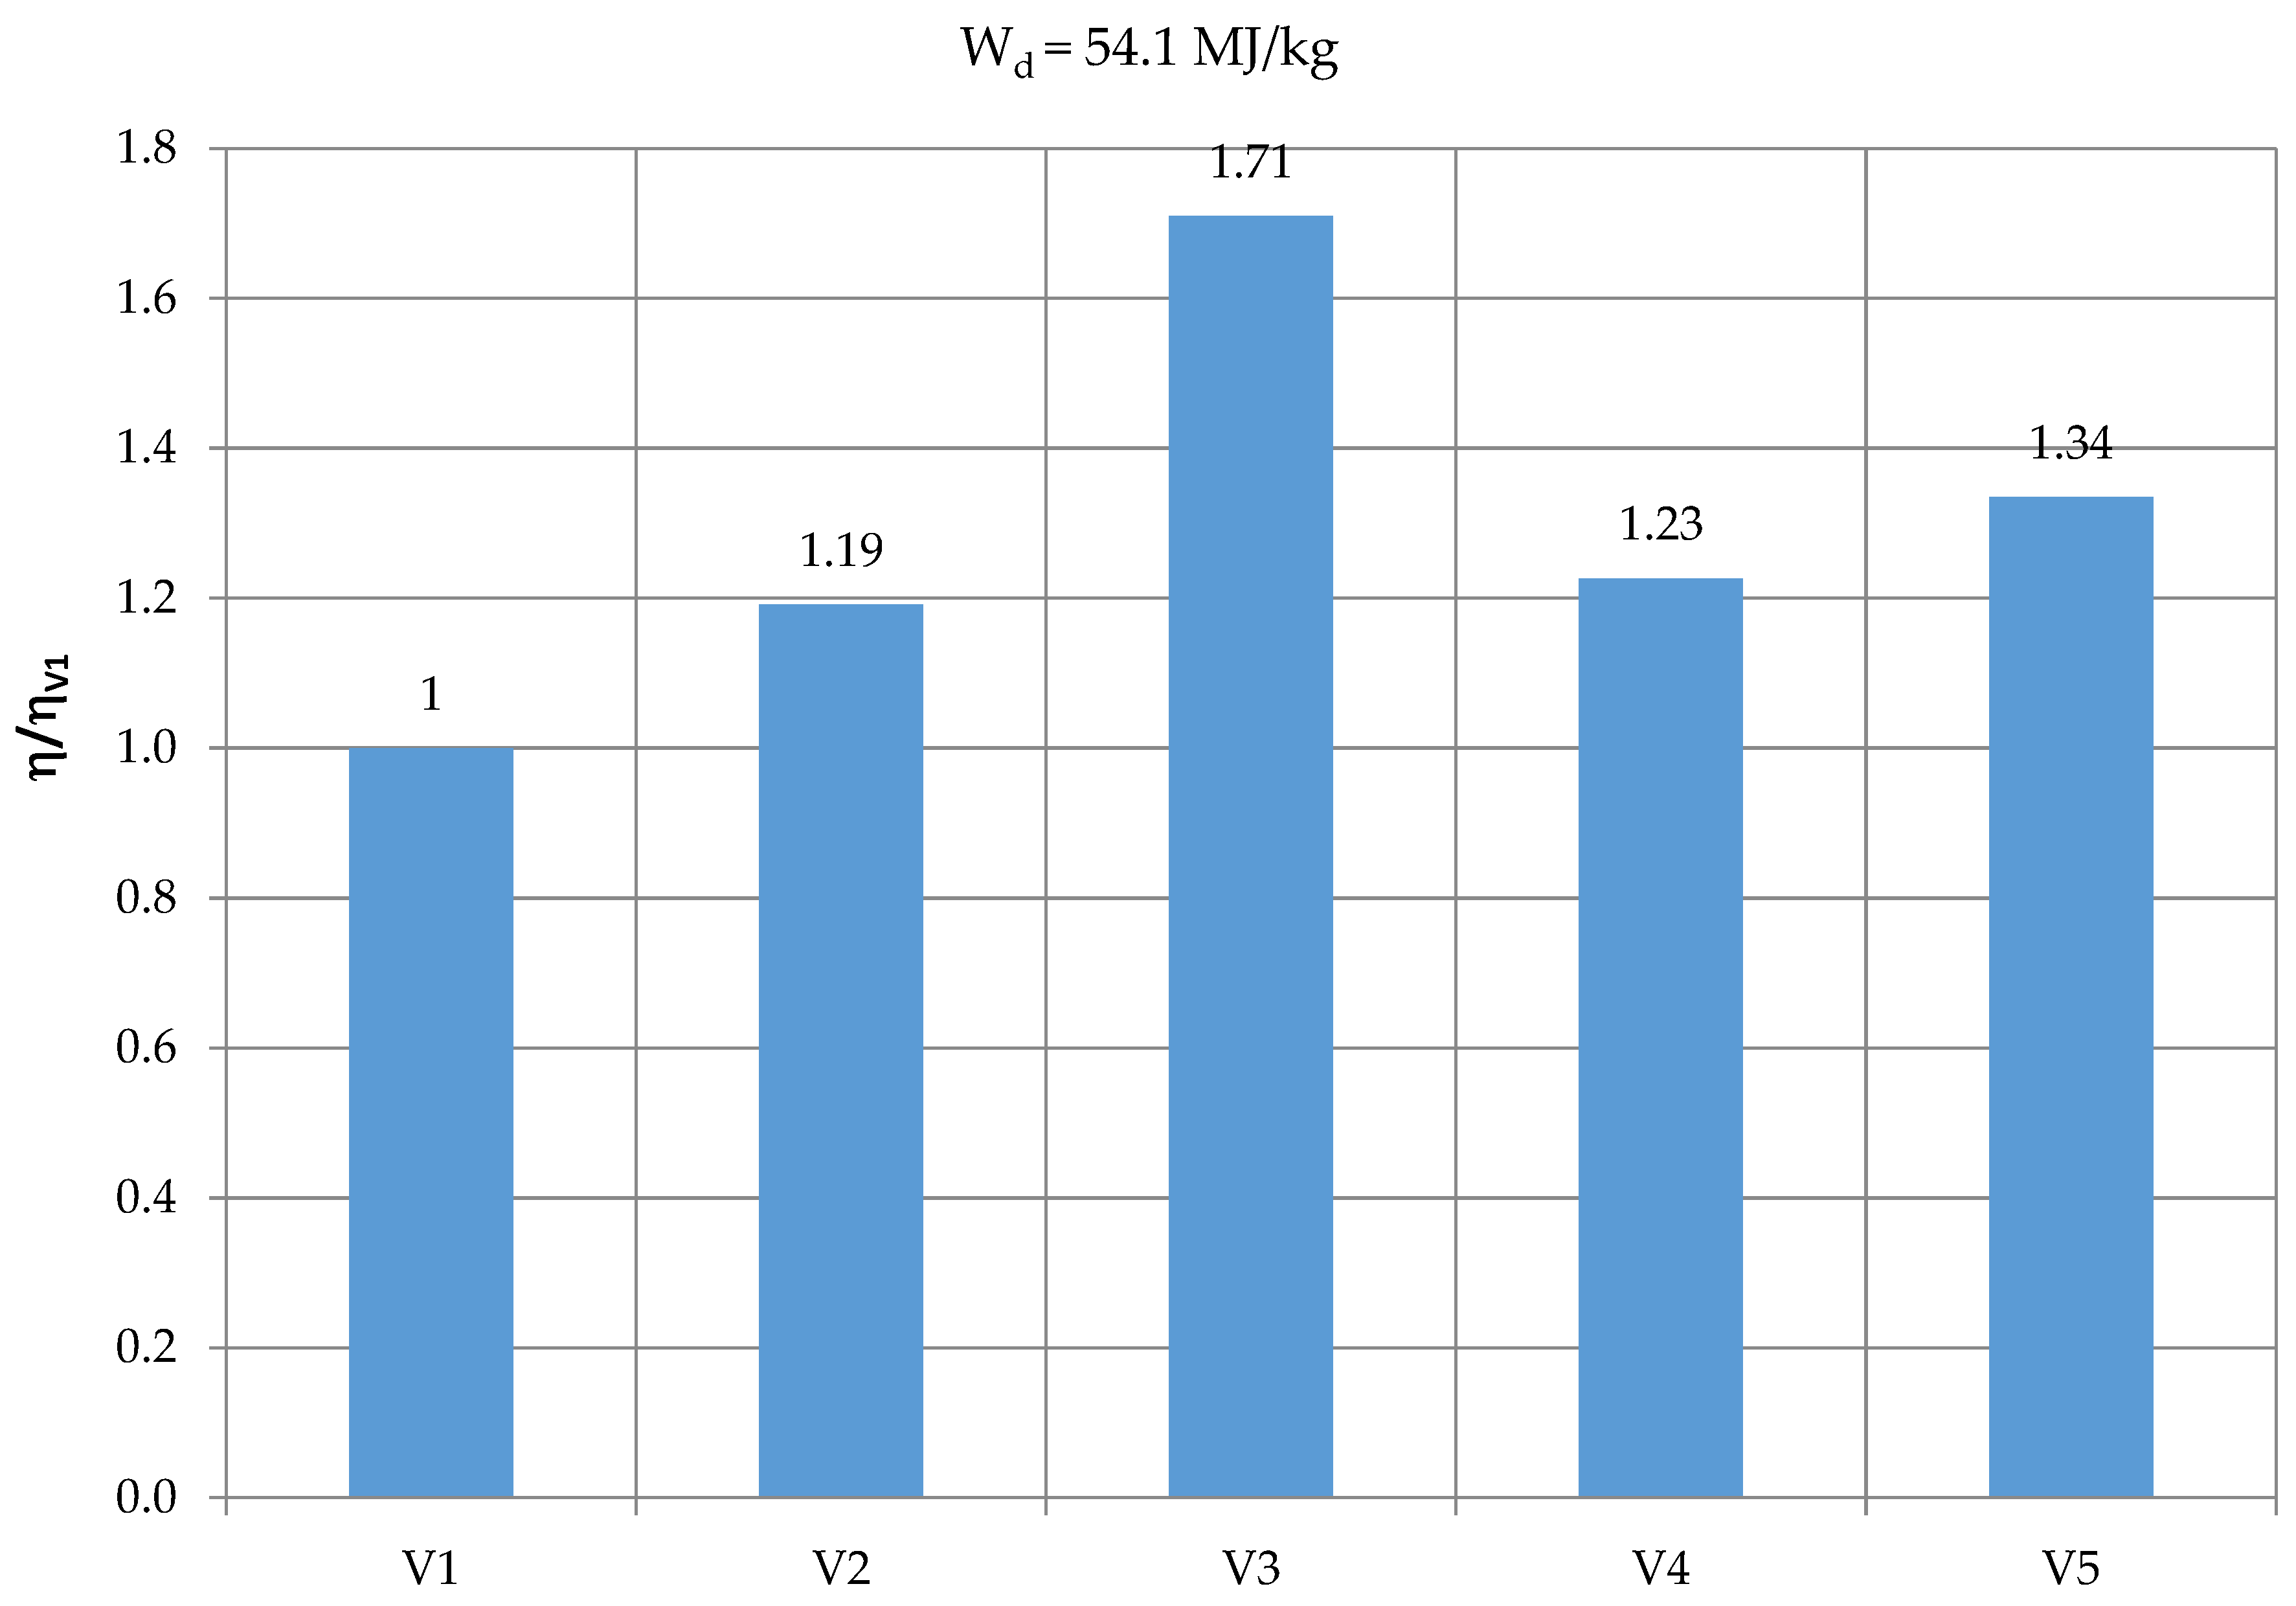
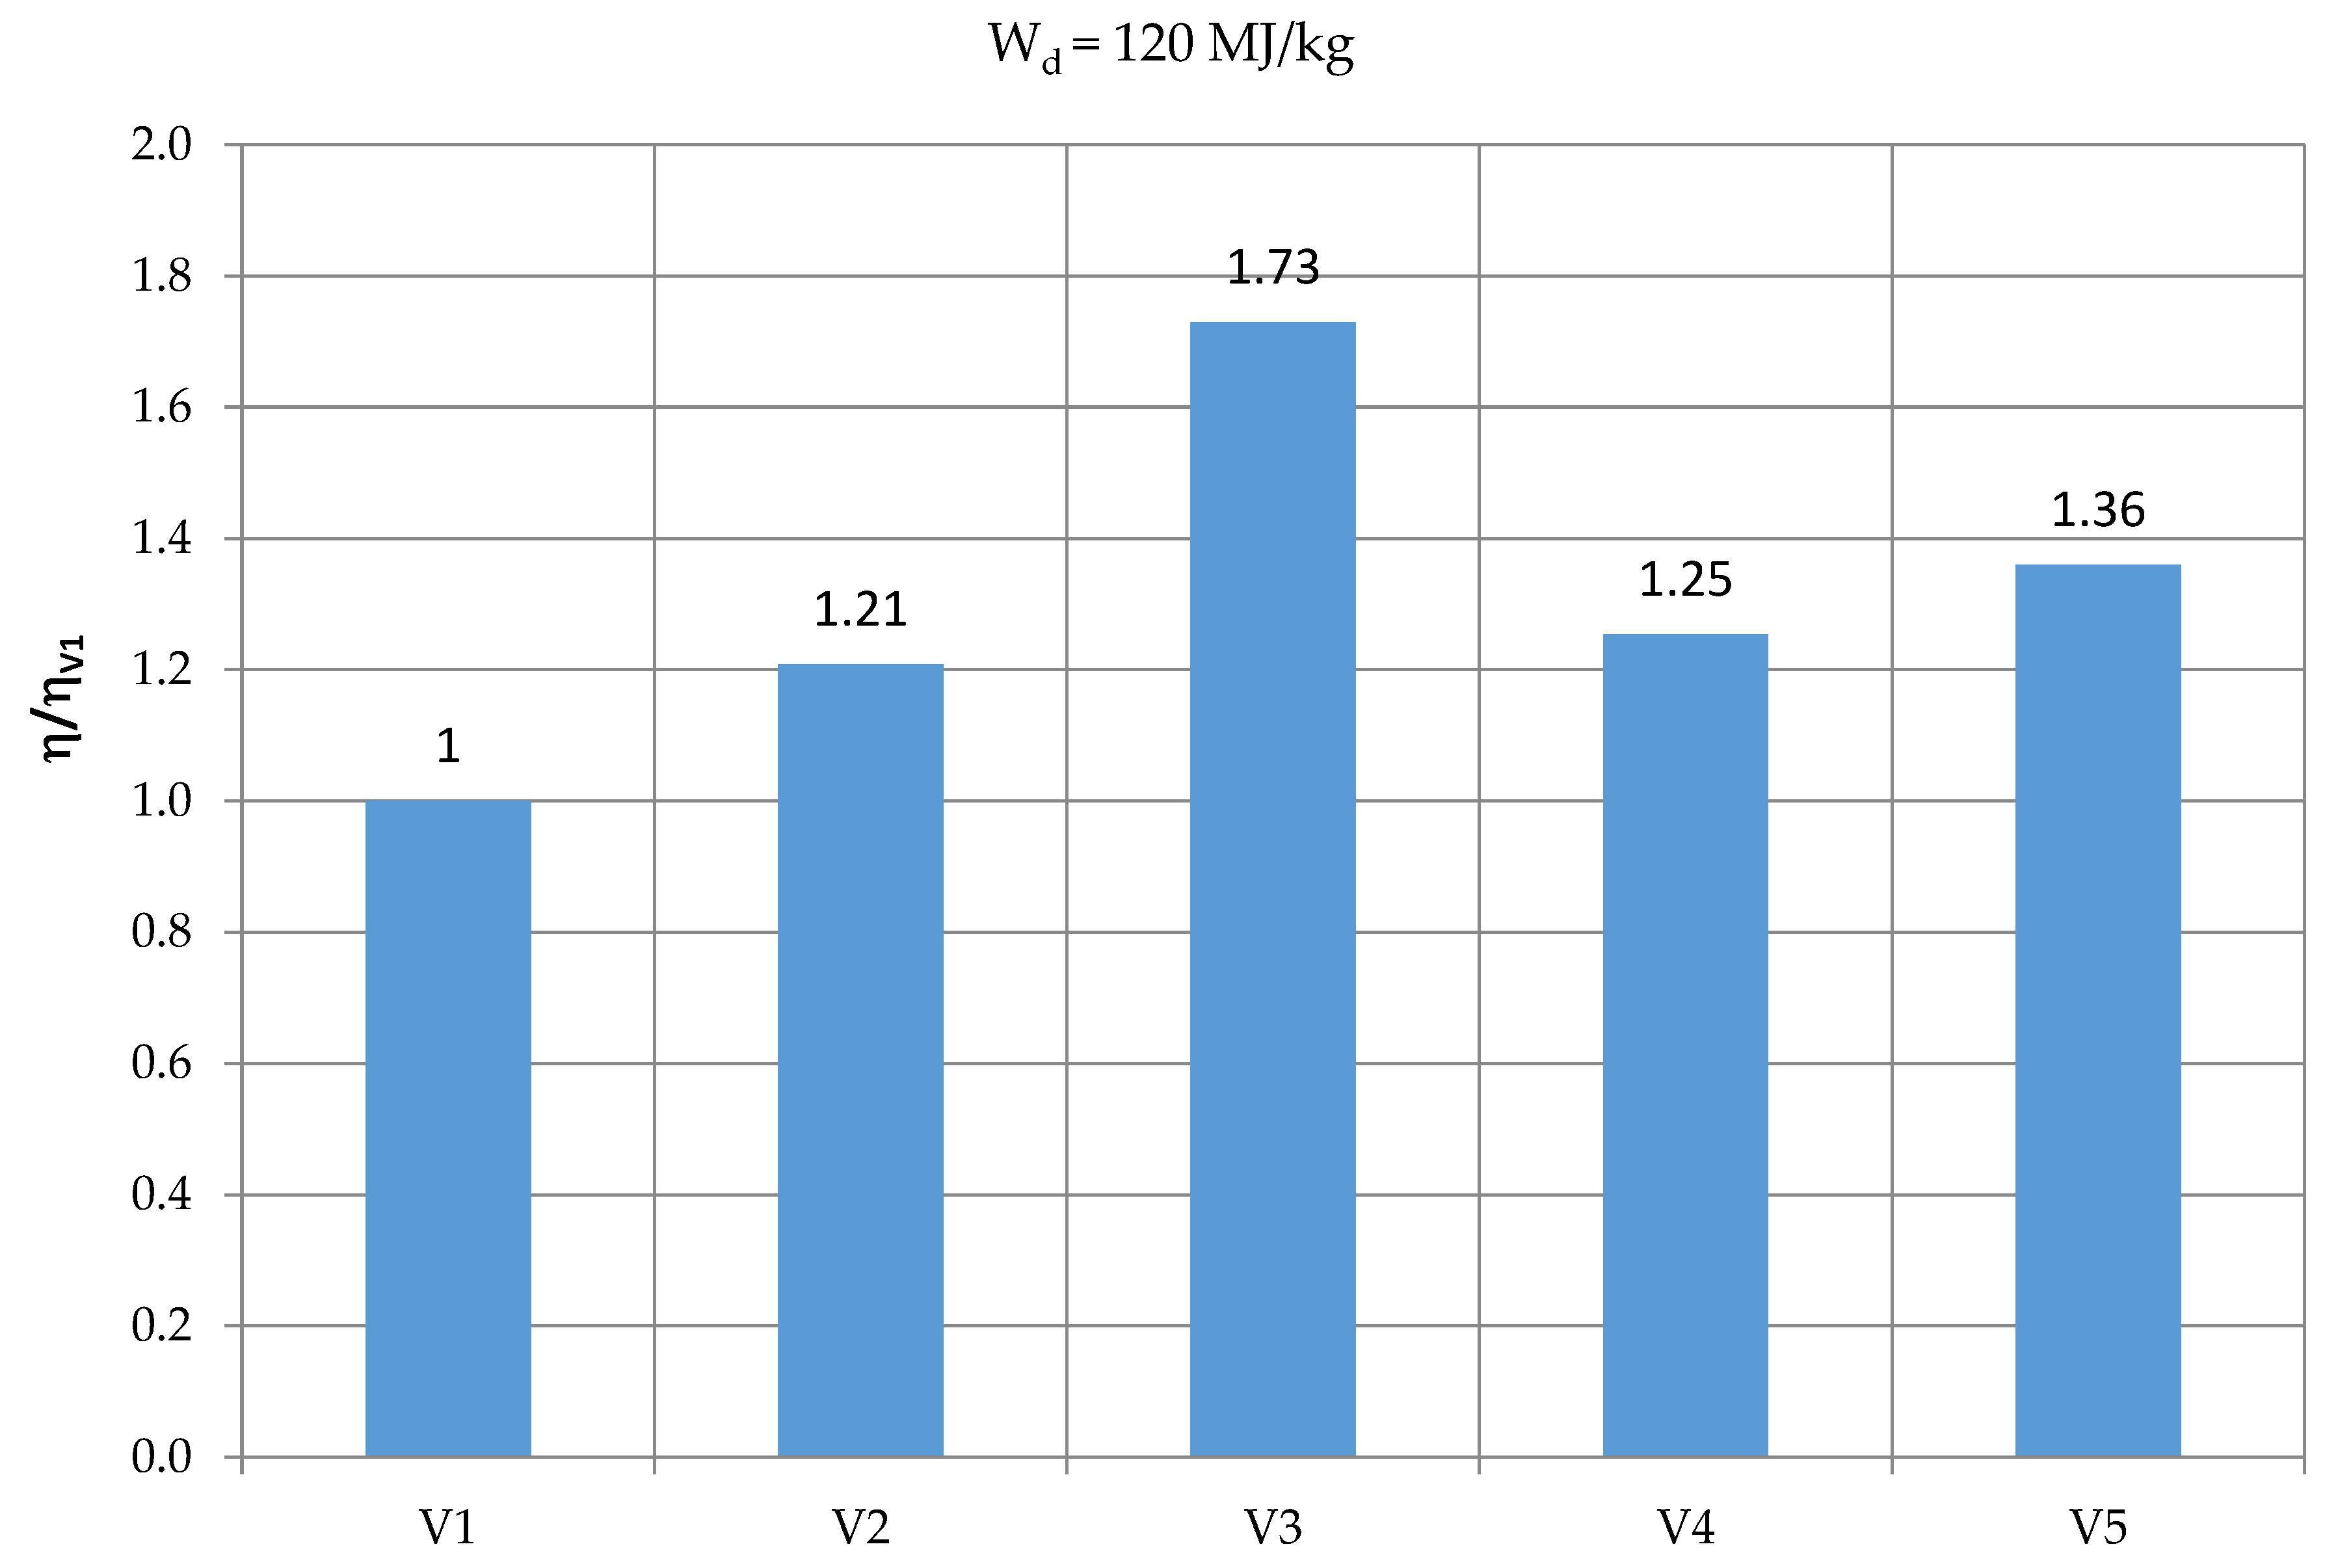
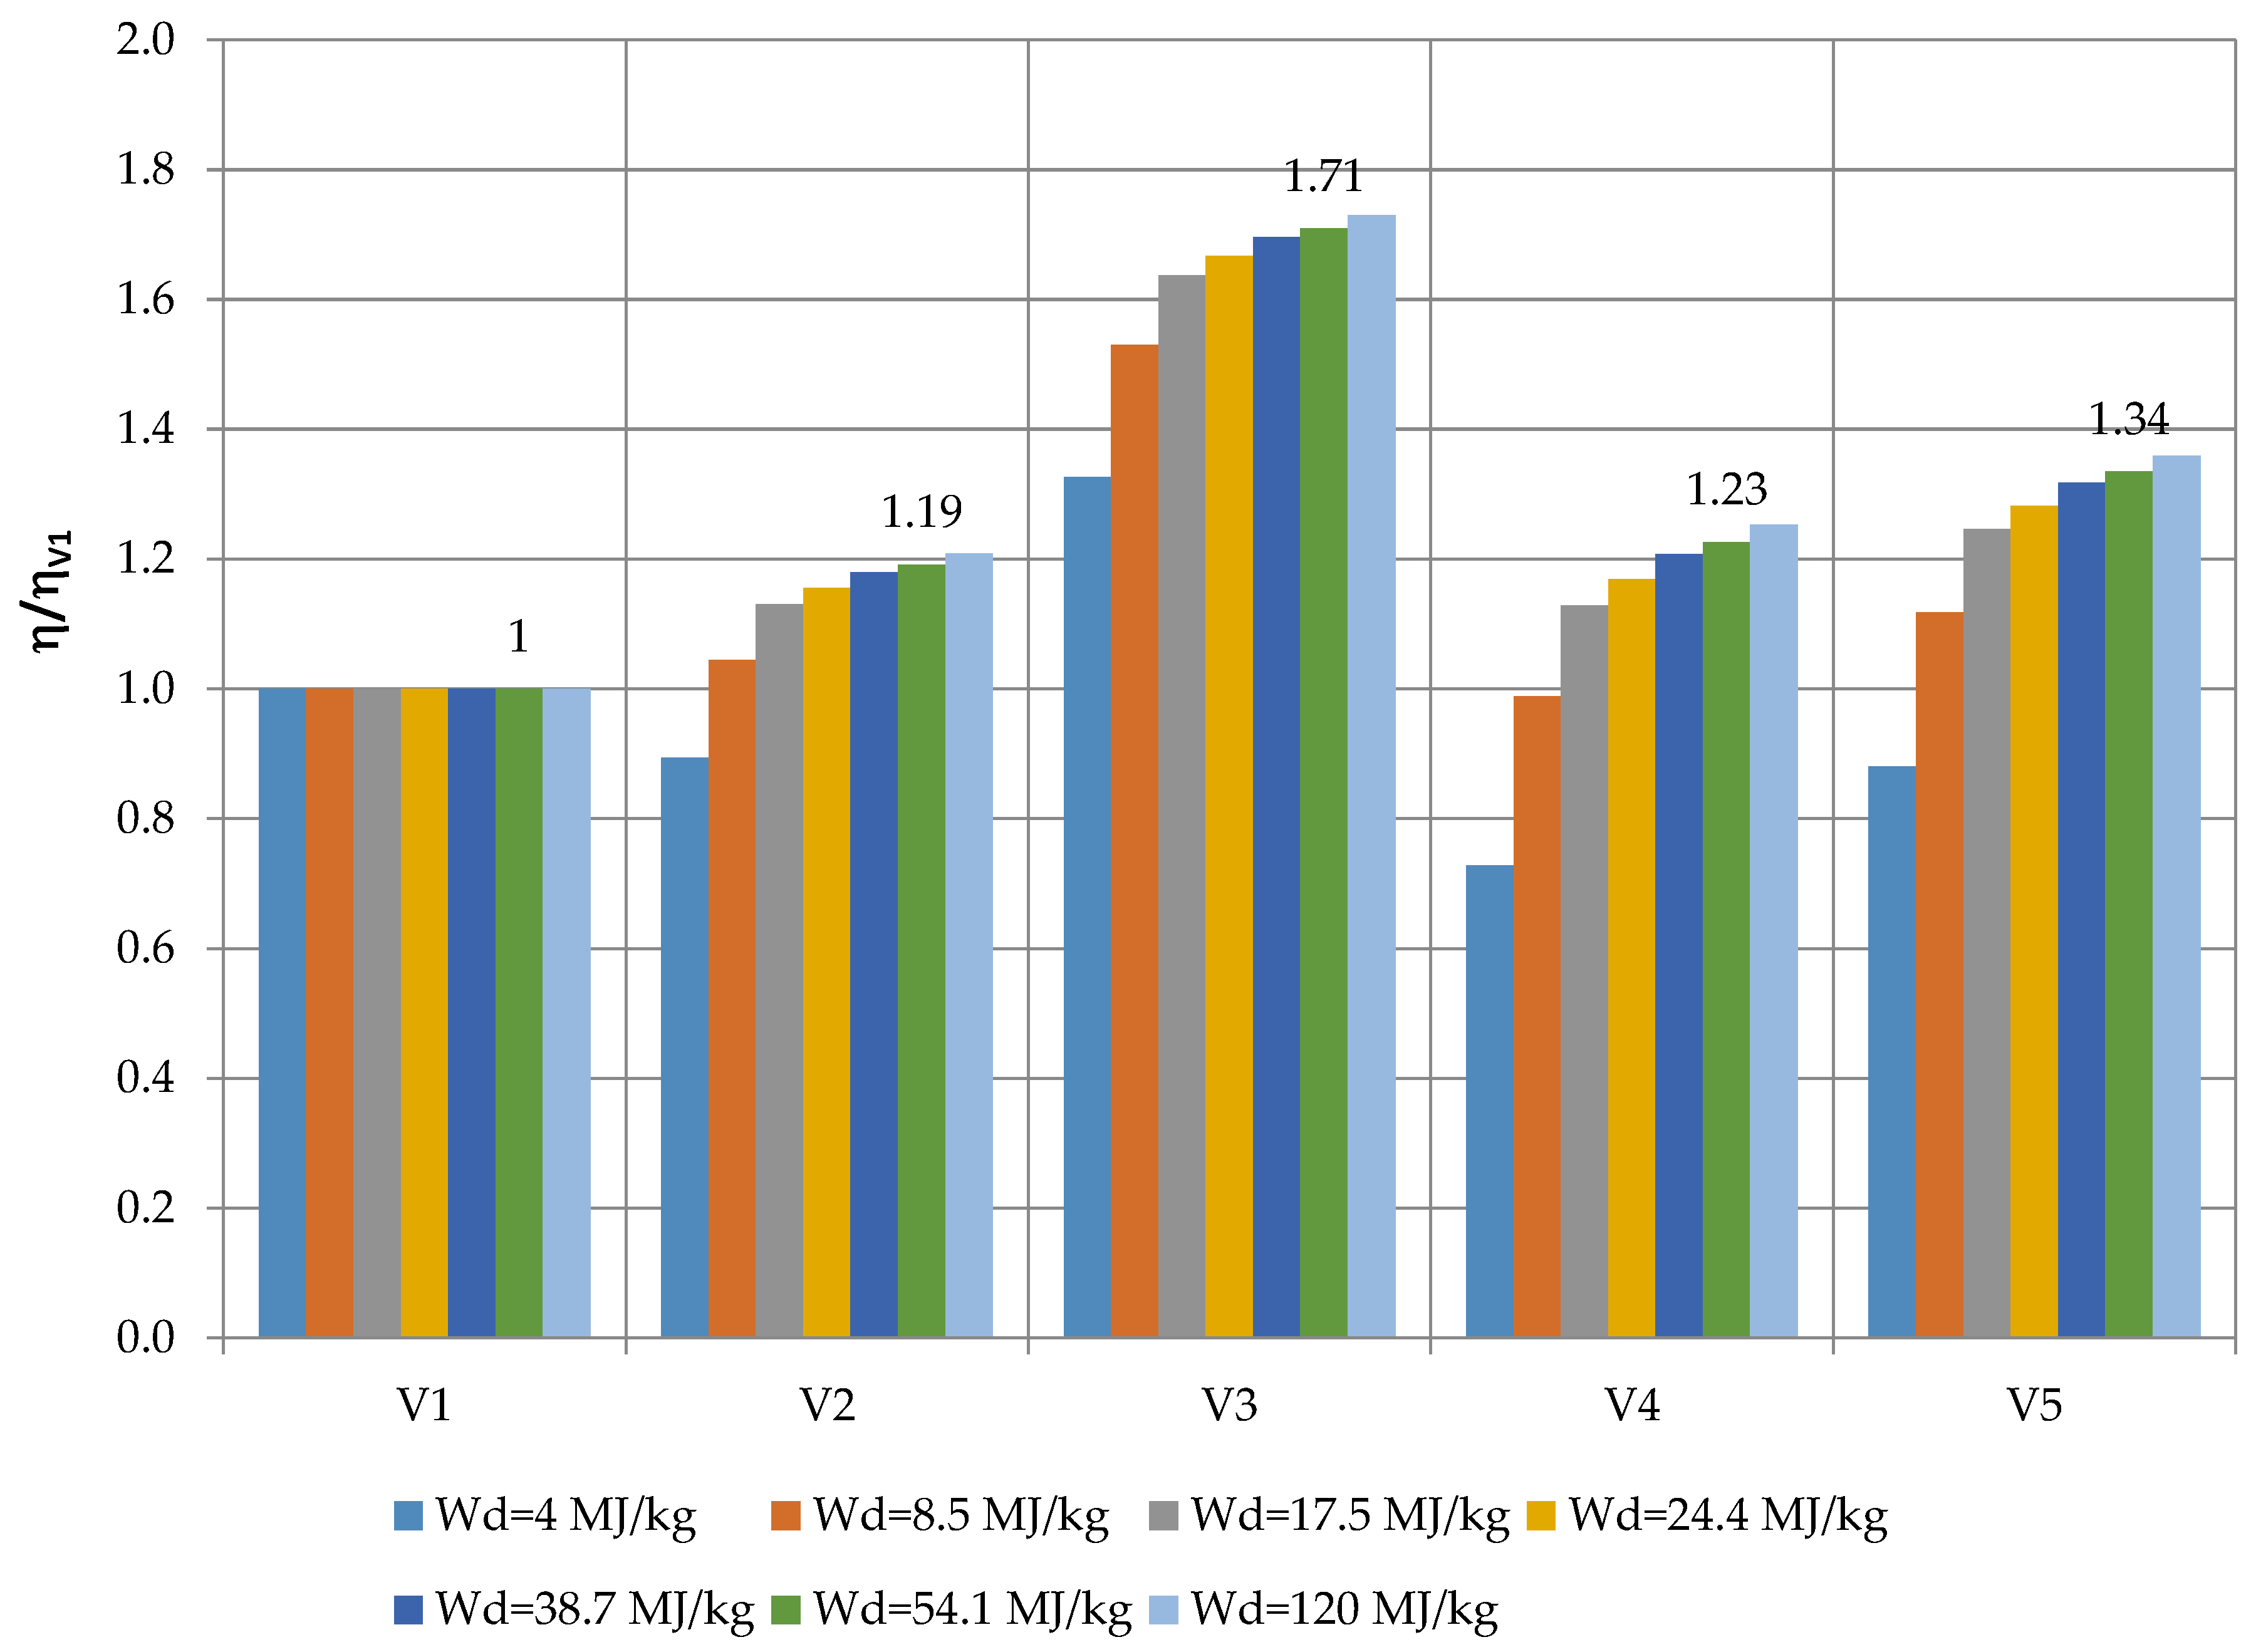
  • Variant 3 is the most-advantageous system due to the efficiency achieved; it allows for increasing the efficiency with respect to the reference value of variant 1 by even over 70%. Also, higher values are obtained for fuels with higher heating values (Figure 11).
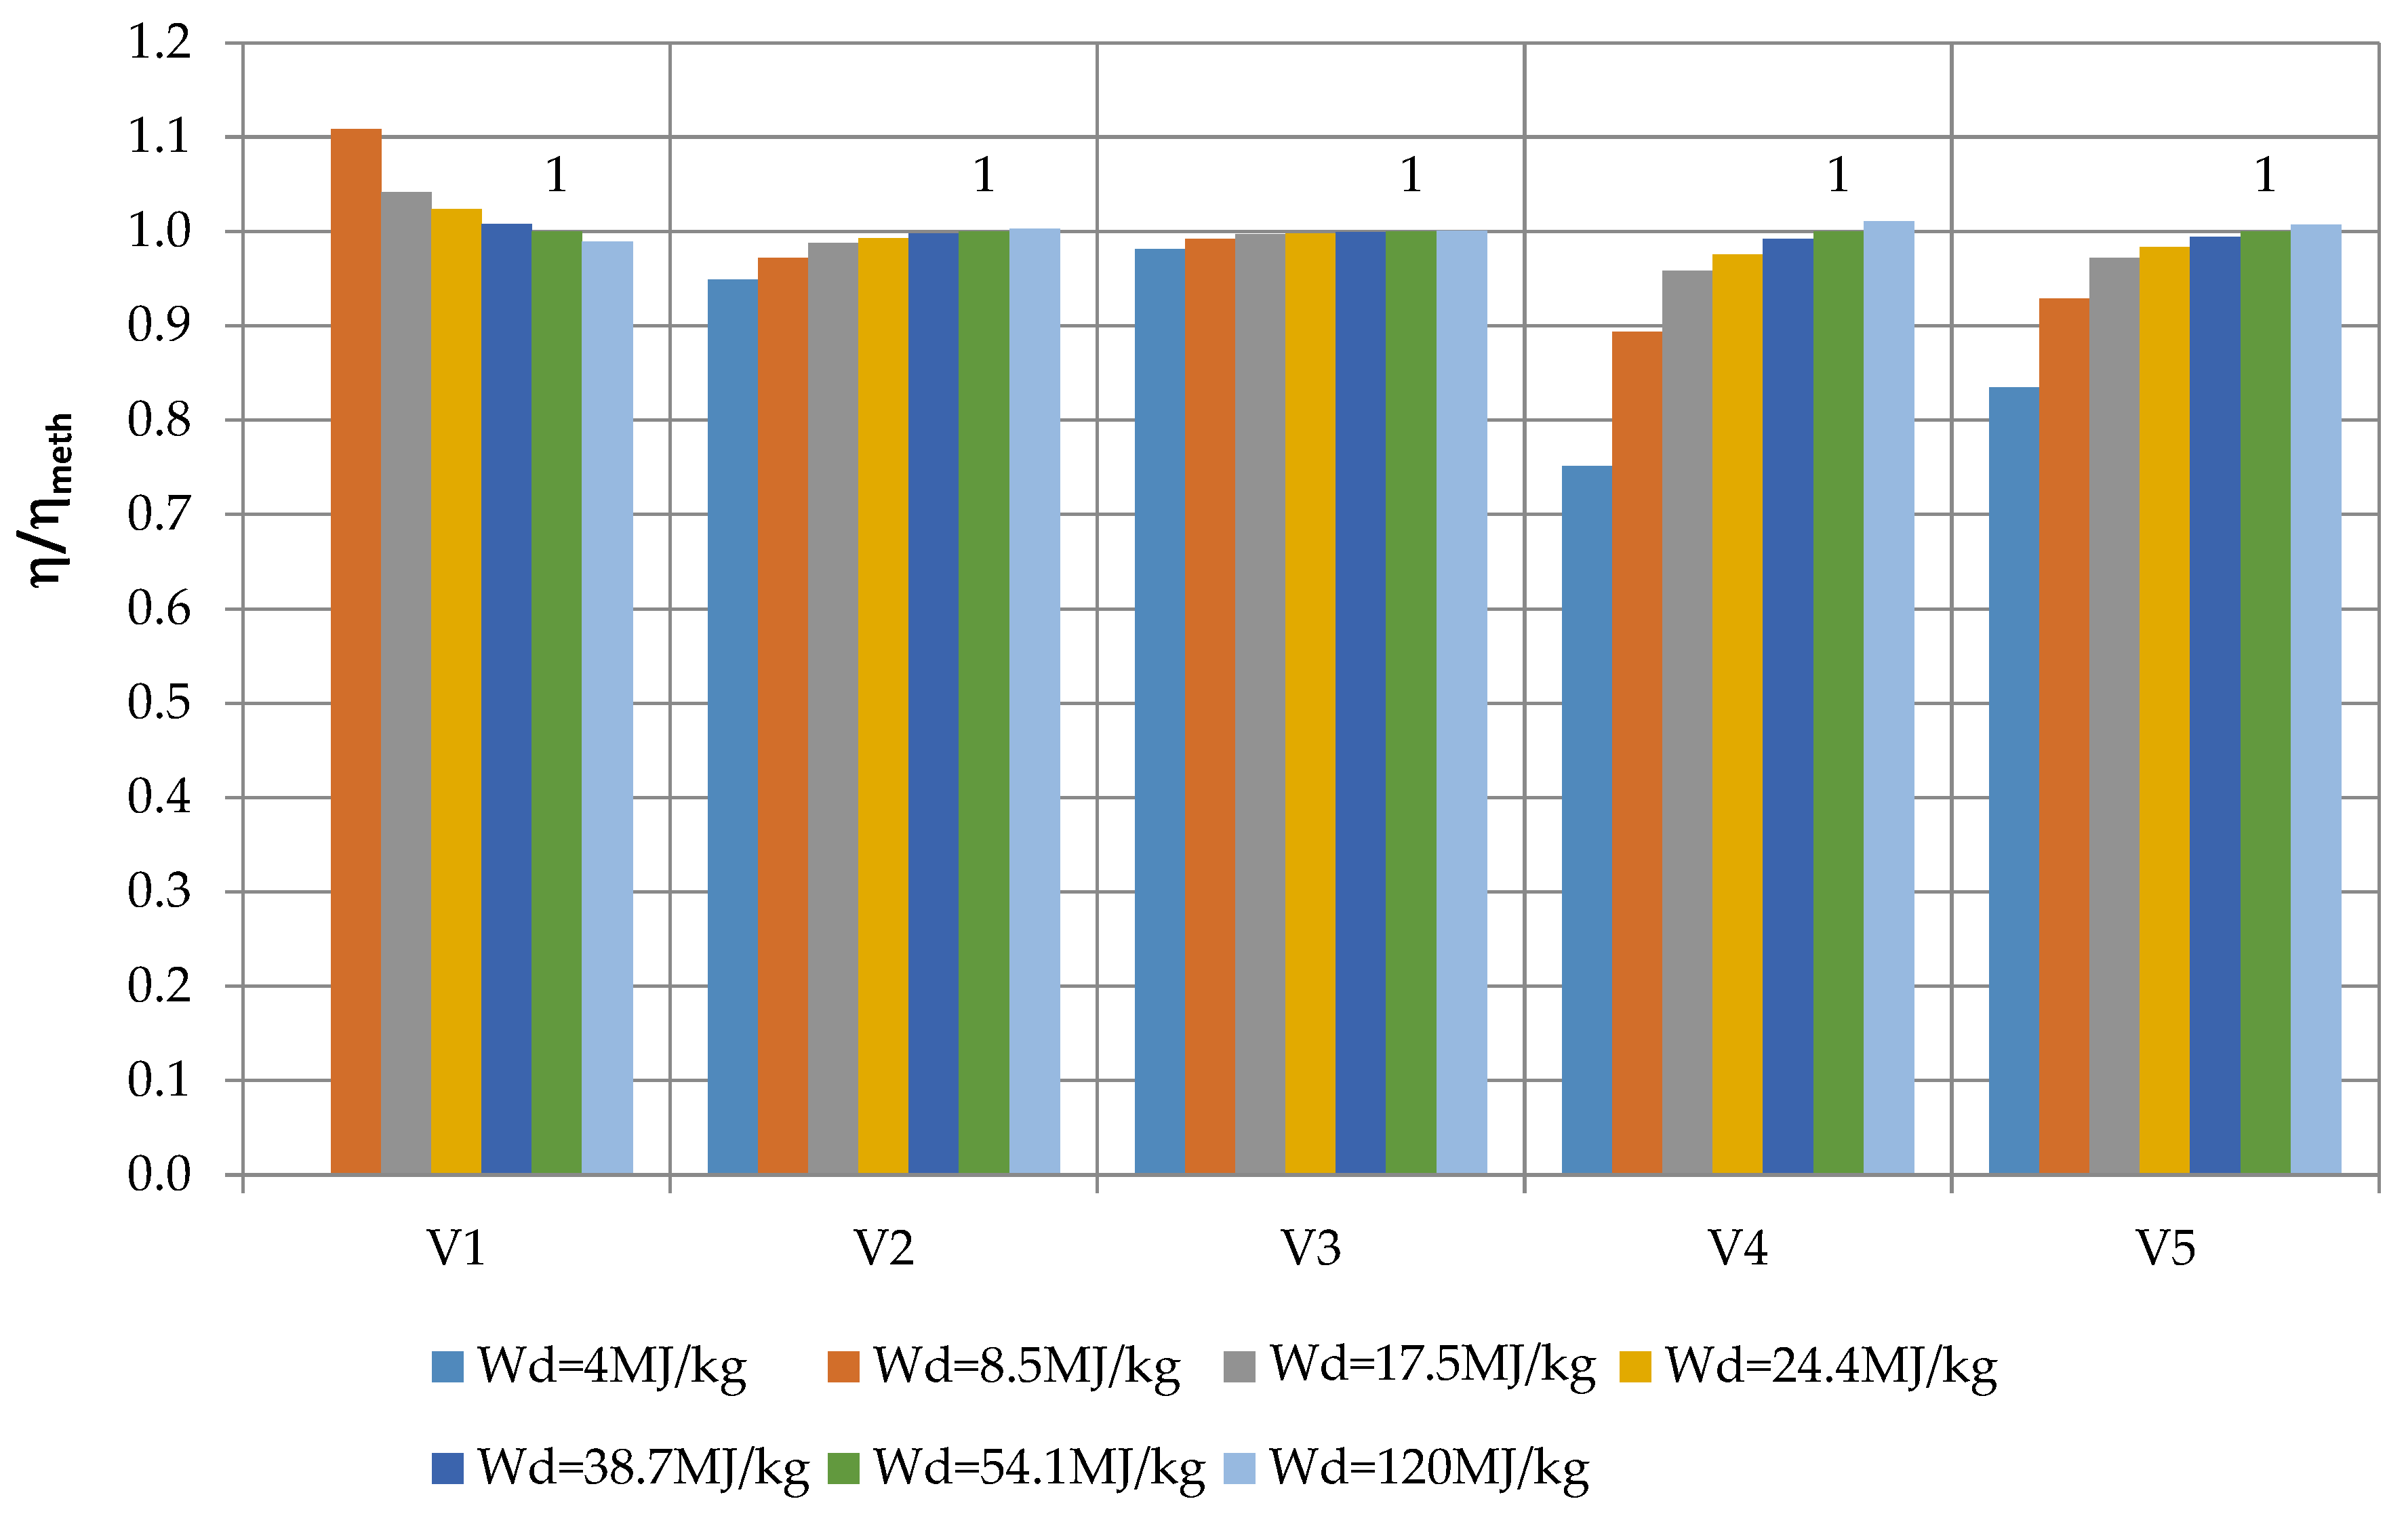
  • The type of fuel affects the cycle efficiency for variant 1 and variant 4 as well as variant 5 (Figure 12). In the case of variant 1, an increase in calorific value reduces efficiency (up to 30%) as related to the efficiency of the cycle with methane as a fuel, while in variant 4 and variant 5 an increase in calorific value increases (up to 20%) the efficiency related to the efficiency of the cycle with methane as a fuel.
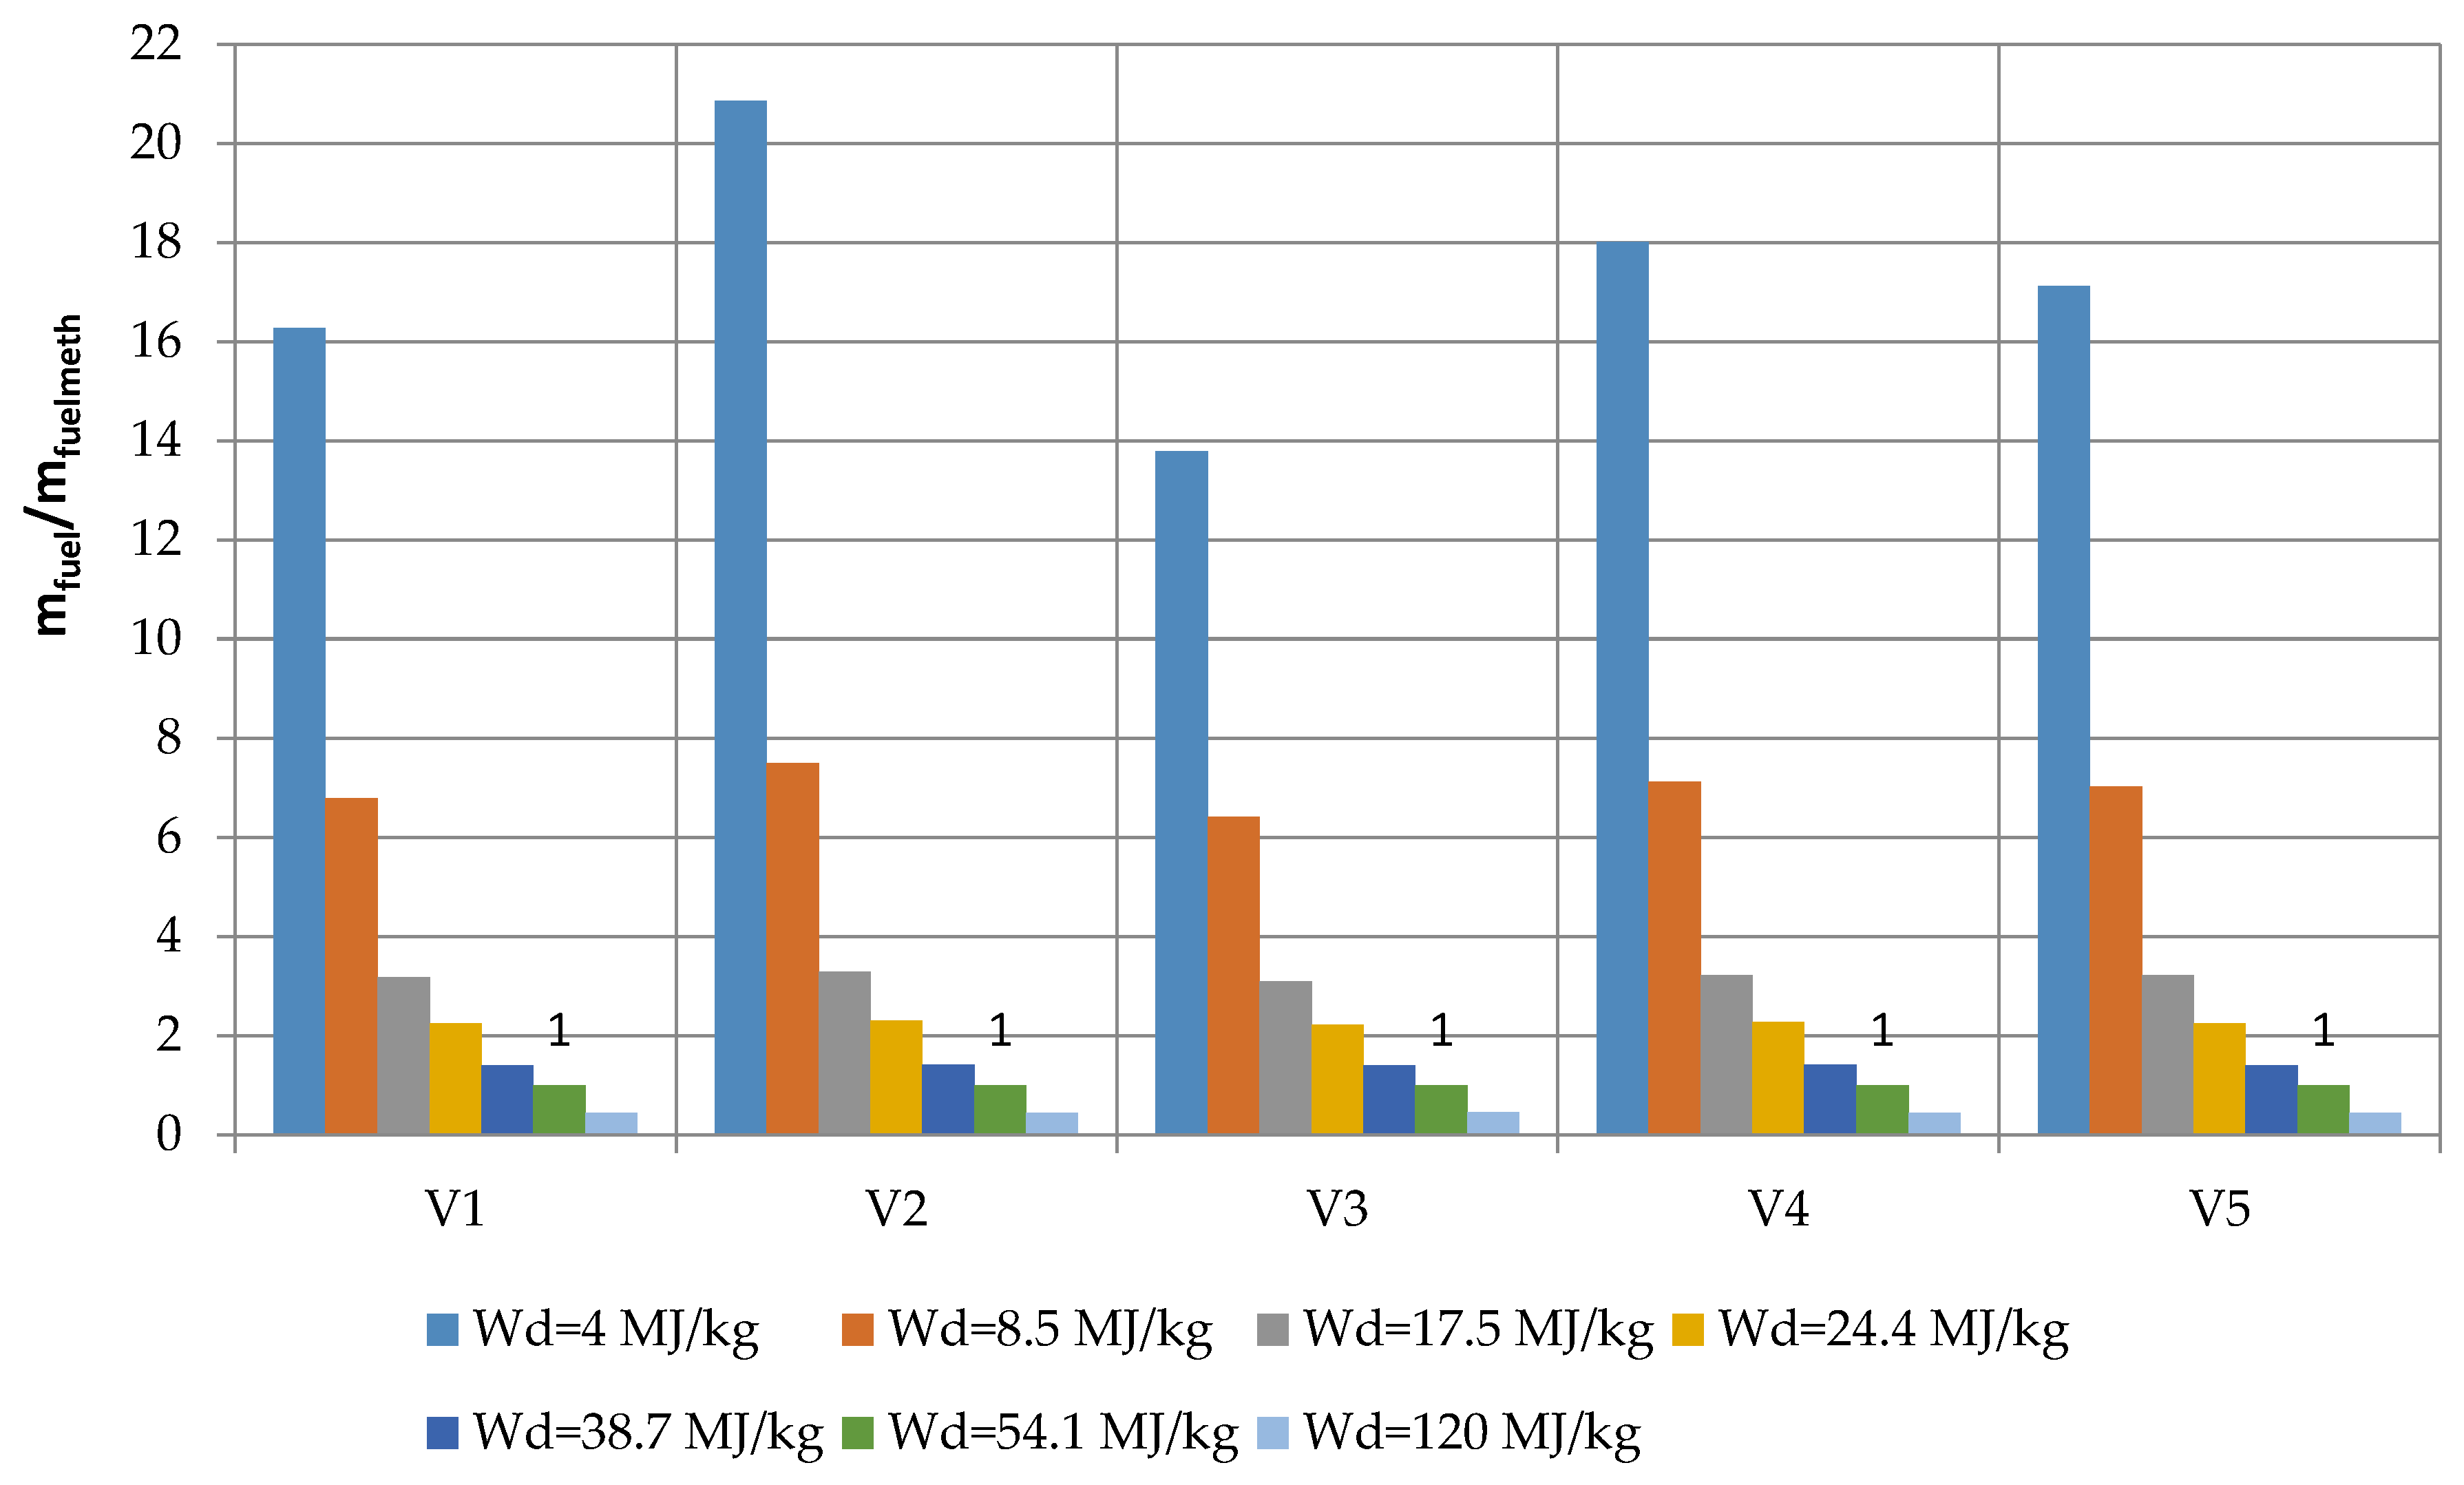
  • The change in calorific value has a very significant impact on the amount of fuel combusted in the combustion chamber (Figure 13); e.g., for a very low heating value (Wd = 4 MJ/kg), the amount of fuel burned increases by up to 20 times compared to the combusted methane (Wd = 54.1 MJ/kg).
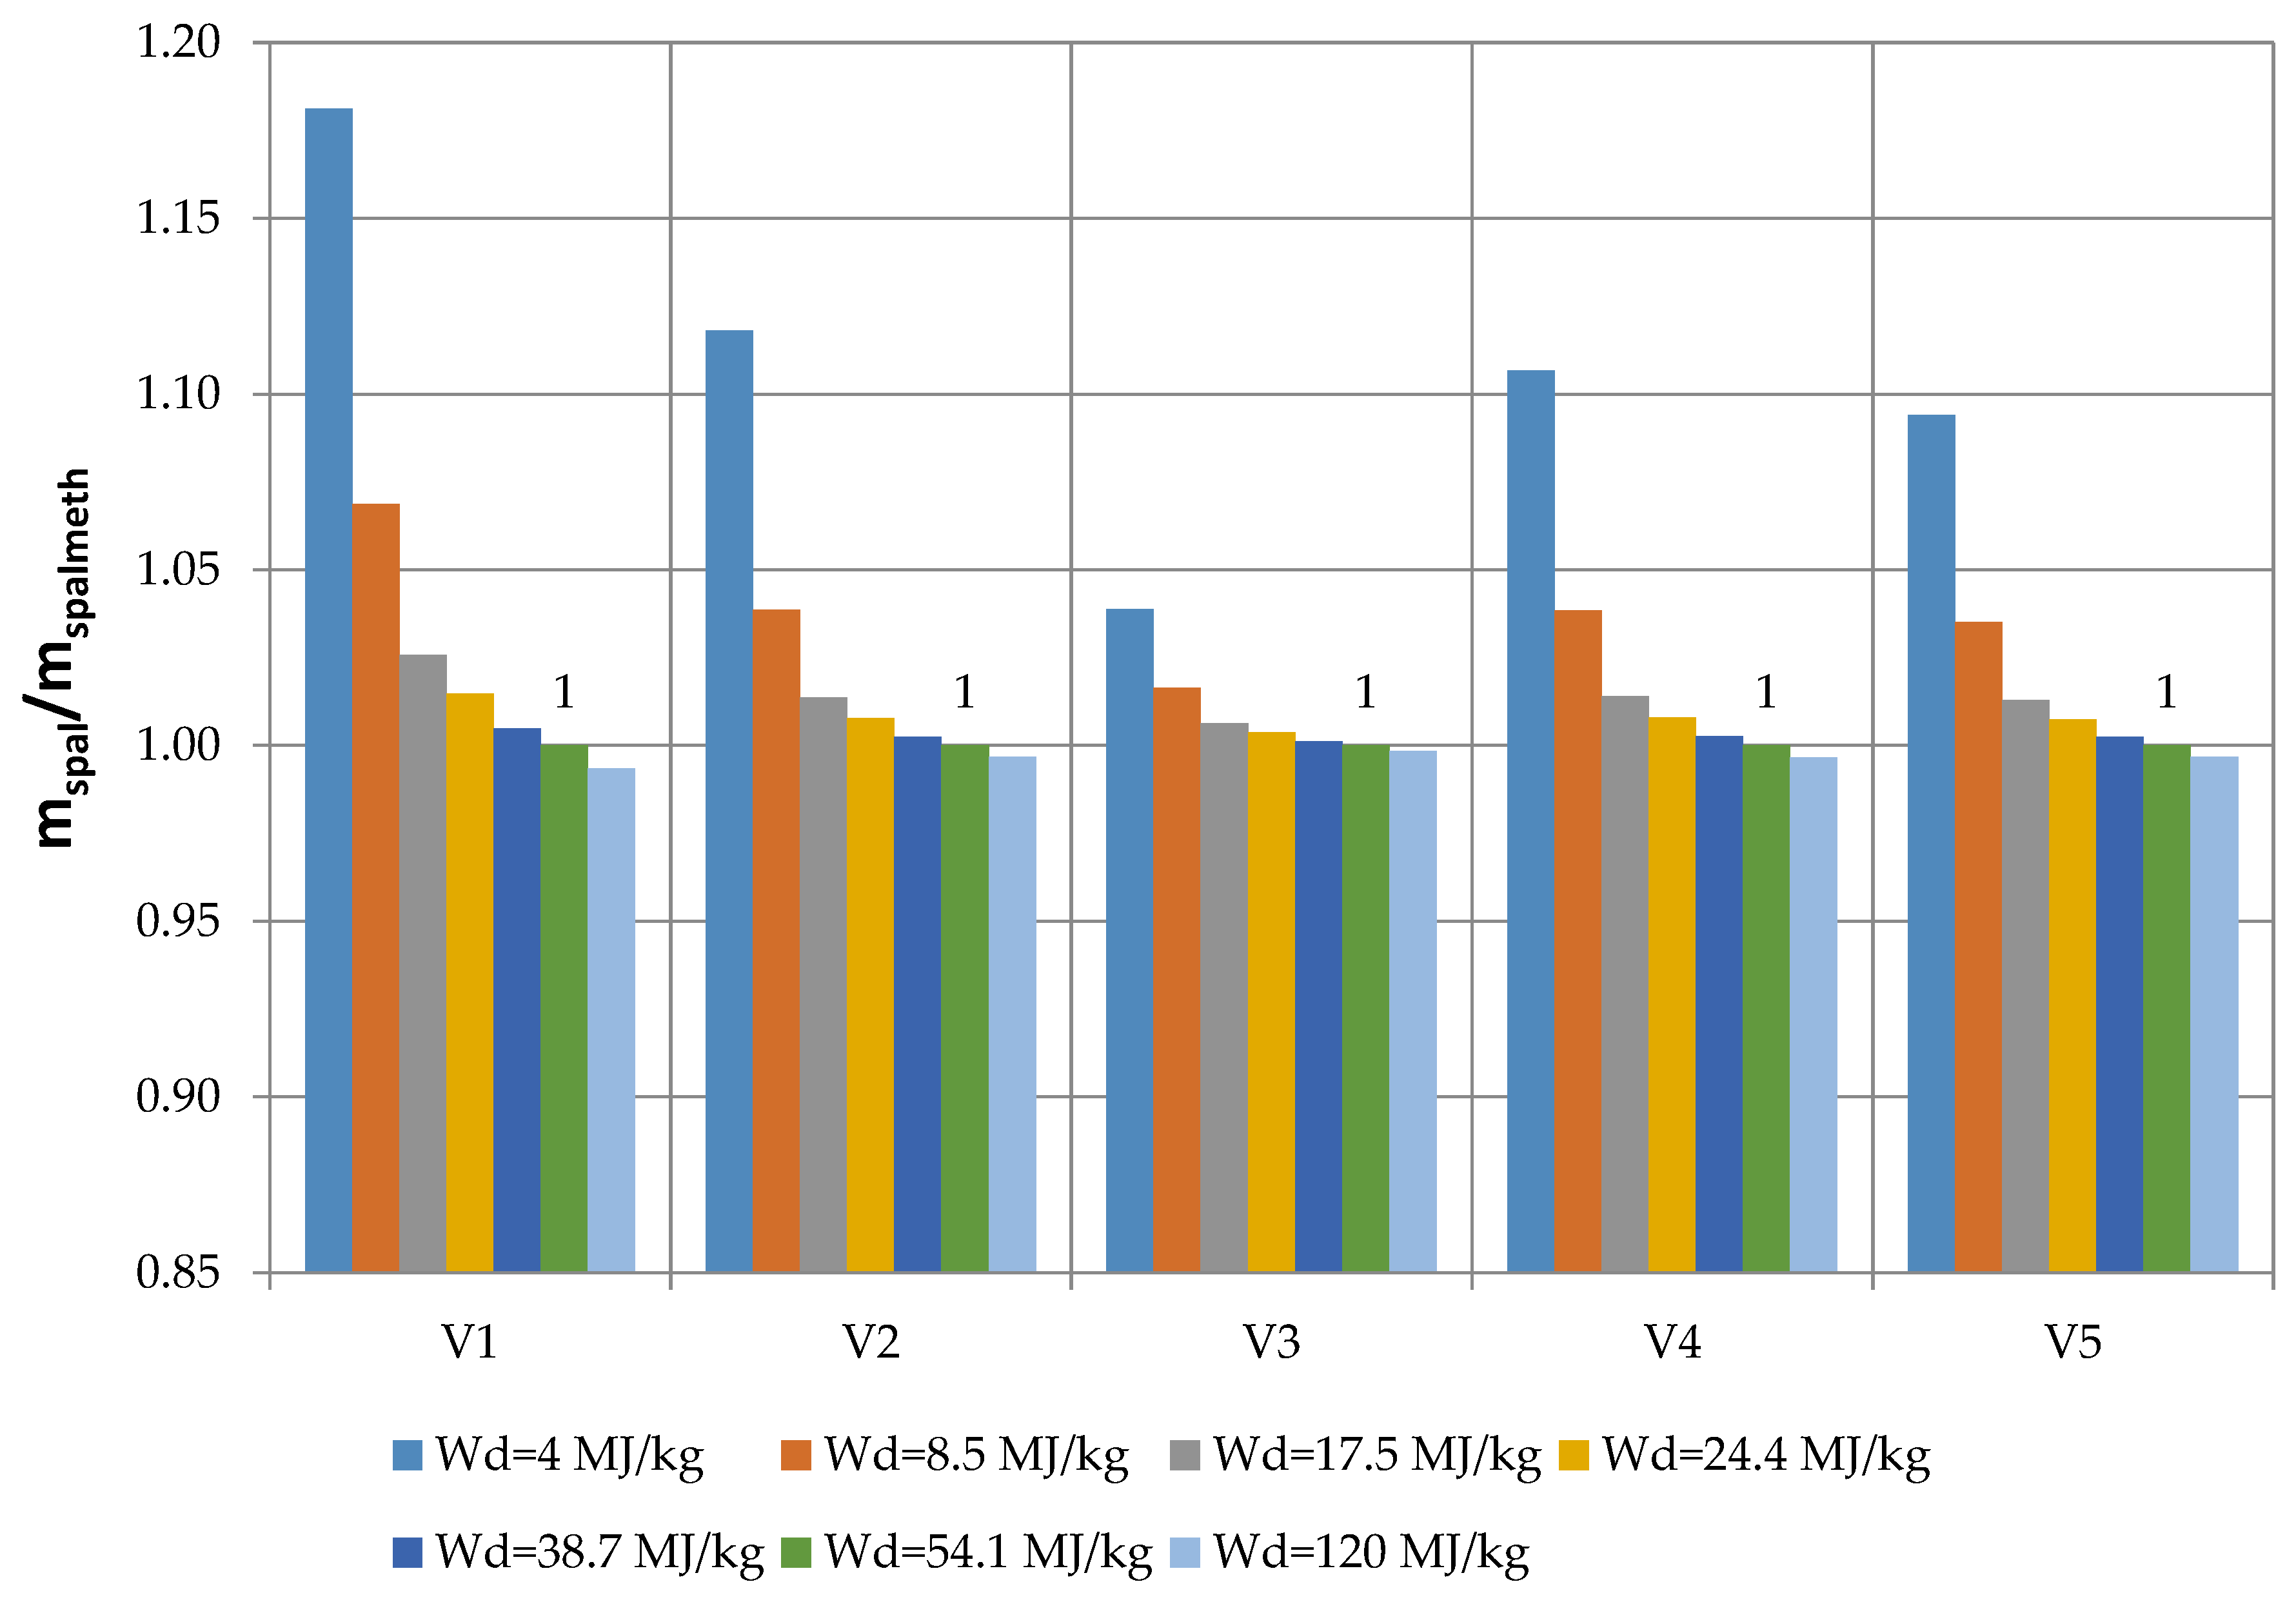
  • For fuels with very low calorific values (Wd = 4 MJ/kg and Wd = 8.5 MJ/kg), a clear change in the mass flux of flue gas flowing through the turbine as related to the exhaust mass flux of methane as fuel (Figure 14) can be observed; in other cases this change is minor.
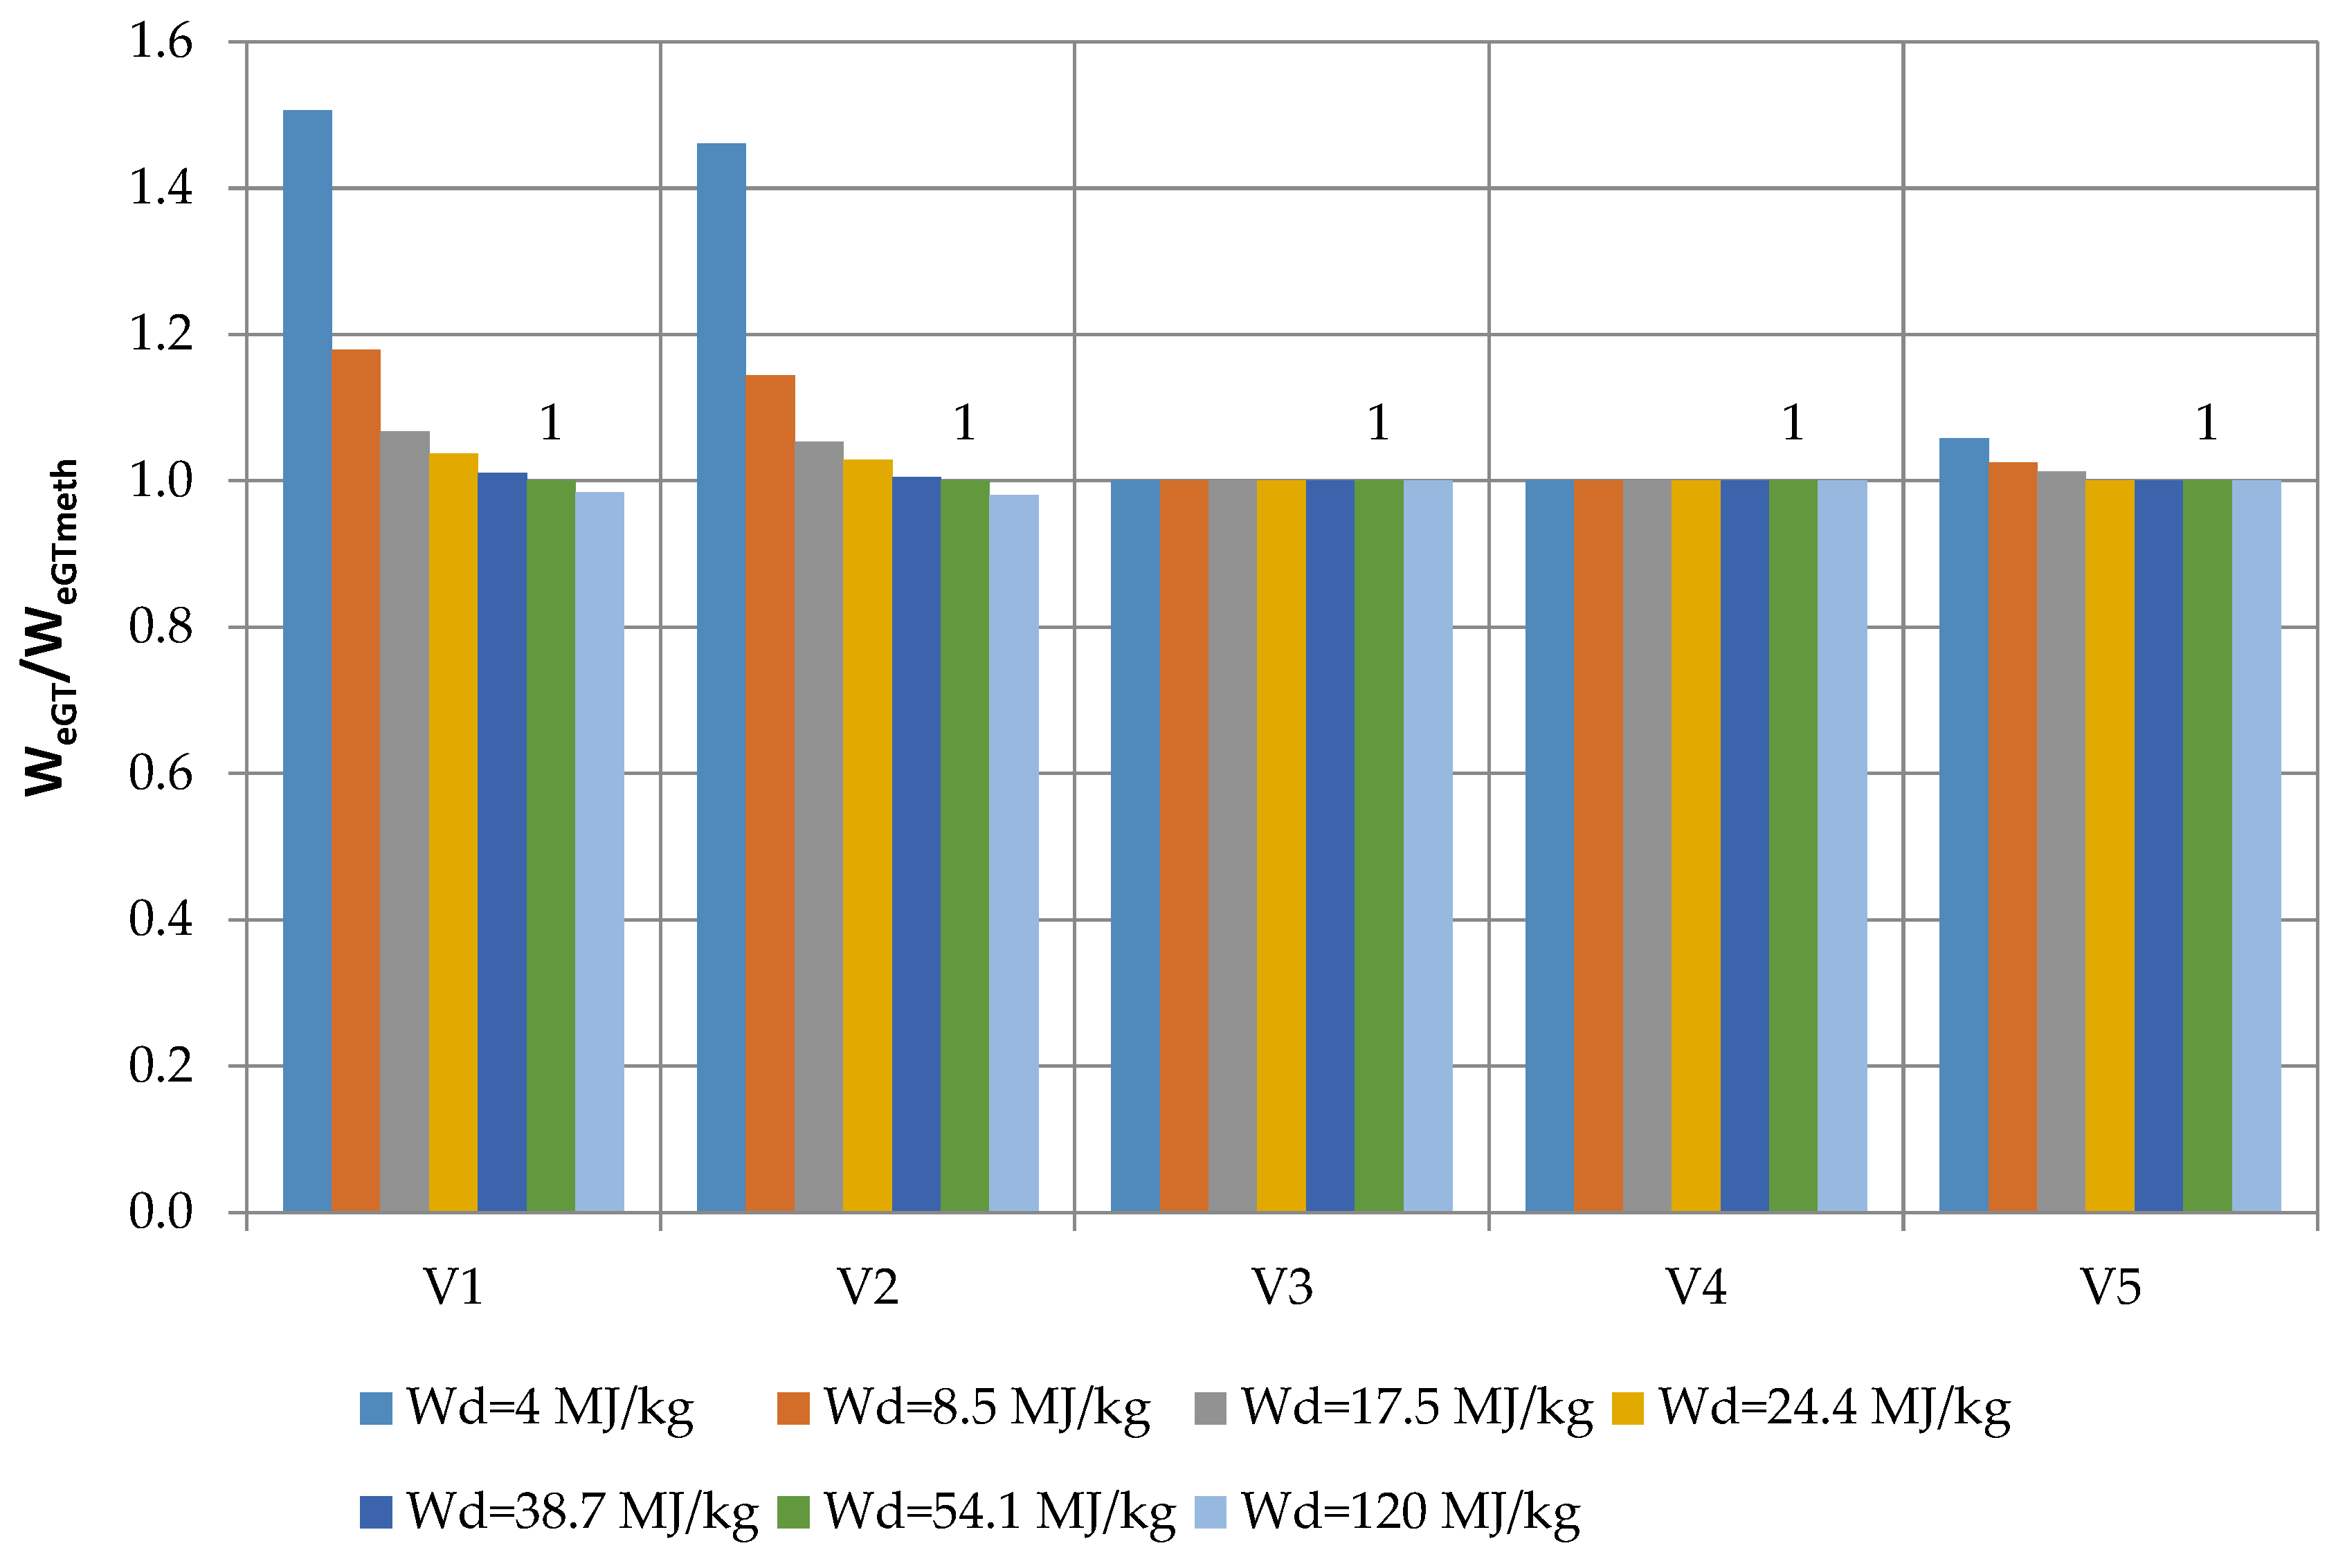
  • For variant 1 and variant 2, the effect of calorific value on the effective power referring to effective power with methane used as a fuel (Figure 15) can be seen, while in the remaining variants the heating value of the fuel shows minimal or no effect on the effective power of the turbine set.
The conducted analyses provide knowledge to help to mitigate potential environmental hazards through introduction of biofuels into distributed energy generation and optimization of turbines to such locally available fuels.
The problem still requires further research, but implementation of the findings might contribute to the reduction of environmental burdens.

Author Contributions

Conceptualization, K.K. and M.P.; R.S.; W.W.; methodology, K.T. and O.O.; investigation, R.S. and W.W.; writing—original draft preparation, K.T. and O.O.; funding acquisition, K.K. and D.M.

Funding

The authors wish to express their deep gratitude to Gdansk University of Technology for financial support given to the present publication (Krzysztof Kosowski). The research was carried out under financial support obtained from the research subsidy of the Faculty of Engineering Management (WIZ) of Bialystok University of Technology (Olga Orynycz).

Conflicts of Interest

The authors declare no conflict of interest. The funders had no role in the design of the study; in the collection, analyses, or interpretation of data; in the writing of the manuscript, and in the decision to publish the results.

Nomenclature and Units

The following list contains a collection of the most important quantities used in calculations, together with appropriate symbols and units.
Symbols and units used in calculations.
lwork of unit mass(kJ/kg)
henthalpy of unit mass(kJ/kg)
LHVlower heating value(MJ/kg)
compression ratio(-)
cpspecific heat at constant pressure(kJ/kg·K)
ienthalpy of unit mass(kJ/kg)
mmass flow rate(kg/s)
Wpower(kW)
ppressure(Pa)
Qheat flux(kW)
Rgas constant(kJ/kg·K)
sentropy of unit mass; also: blade pitch(kJ/kg·K); (mm)
Ttemperature(ᵒC)
vspecific volume(m3/kg)
Wdcalorific value(MJ/m3) or (MJ/kg);
ηefficiency(-)
κisentropic exponent(-)
List of used subscripts.
ean effective
hydhydrogen
Ggenerator
iinternal
junit
Ccompressor
CCcombustion chamber
mmechanical
methmethane
nleaks
obcycle
optoptimal
spalexhaust gas
Tturbine
GTgas turbine set
1, 2,…point numbers on diagrams

References

  1. Magazzino, C. Electricity Demand, GDP and Employment: Evidence from Italy. Front. Energy 2014, 8, 31–40. [Google Scholar] [CrossRef]
  2. Magazzino, C. Stationarity of electricity series in MENA countries. Electr. J. 2017, 30, 16–22. [Google Scholar] [CrossRef]
  3. Herran, D.S.; Tachiiri, K.; Matsumoto, K. Global energy system transformations in mitigation scenarios considering climate uncertainties. Appl. Energy 2019, 243, 119–131. [Google Scholar] [CrossRef]
  4. Veum, K.; Bauknecht, D. How to reach the EU renewables target by 2030? An analysis of the governance framework. Energy Policy 2019, 127, 299–307. [Google Scholar] [CrossRef]
  5. Wierzbowski, M.; Filipiak, I.; Lyzwa, W. Polish energy policy 2050—An instrument to develop a diversified and sustainable electricity generation mix in coal-based energy system. Renew. Sustain. Energy Rev. 2017, 74, 51–70. [Google Scholar] [CrossRef]
  6. Tucki, K.; Orynycz, O.; Wasiak, A.; Świć, A.; Dybaś, W. Capacity market implementation in Poland: Analysis of a survey on consequences for the electricity market and for energy management. Energies 2019, 12, 839. [Google Scholar] [CrossRef]
  7. European Electricity Market—Diagnosis 2018. Available online: https://www.pse.pl/web/pse-eng/-/the-diagnosis-of-the-european-electricity-market-from-the-point-of-view-of-the-polish-transmission-system-operator (accessed on 24 July 2019).
  8. Brown, T.; Schlachtberger, D.; Kies, A.; Schramm, S.; Greiner, M. Synergies of sector coupling and transmission reinforcement in a cost-optimised, highly renewable European energy system. Energy 2018, 160, 720–739. [Google Scholar] [CrossRef] [Green Version]
  9. Dusonchet, L.; Favuzza, S.; Massaro, F.; Telaretti, E.; Zizzo, G. Technological and legislative status point of stationary energy storages in the EU. Renew. Sustain. Energy Rev. 2019, 101, 158–167. [Google Scholar] [CrossRef]
  10. The Model of the Optimal Energy Mix for Poland by 2060. Chancellery of the Prime Minister. Available online: https://www.premier.gov.pl/en/news/news/the-model-of-an-optimal-energy-mix-for-poland-by-2060.html (accessed on 24 July 2019).
  11. Renn, O.; Marshall, J.P. Coal, nuclear and renewable energy policies in Germany: From the 1950s to the “Energiewende”. Energy Policy 2016, 99, 224–232. [Google Scholar] [CrossRef]
  12. Anifantis, A.S.; Colantoni, A.; Pascuzzi, S.; Santoro, F. Photovoltaic and Hydrogen Plant Integrated with a Gas Heat Pump for Greenhouse Heating: A Mathematical Study. Sustainability 2018, 10, 378. [Google Scholar] [CrossRef]
  13. Tucki, K.; Orynycz, O.; Świć, A.; Mitoraj-Wojtanek, M. The development of electromobility in Poland and EU States as a tool for management of CO2 emission. Energies 2019, 12, 2942. [Google Scholar] [CrossRef]
  14. Caragliu, A.; Del Bo, C.F. Smart innovative cities: The impact of Smart City policies on urban innovation. Technol. Forecast. Soc. Chang. 2019, 142, 373–383. [Google Scholar] [CrossRef]
  15. Haarstad, H.; Wathne, M.W. Are smart city projects catalyzing urban energy sustainability? Energy Policy 2019, 129, 918–925. [Google Scholar] [CrossRef]
  16. Tucki, K.; Sikora, M. Technical and logistics analysis of the extension of the energy supply system with the cogeneration unit supplied with biogas from the water treatment plant. TEKA Comm. Motorization Power Ind. Agric. 2016, 16, 71–75. [Google Scholar]
  17. Raymundo, H.; Dos Reis, J.G.M. Measures for Passenger-Transport Performance Evaluation in Urban Areas. J. Urban Plan. Dev. 2018, 144, 04018023. [Google Scholar] [CrossRef]
  18. Halkos, G.; Tsilika, K. Understanding transboundary air pollution network: Emissions, depositions and spatio-temporal distribution of pollution in European region. Resour. Conserv. Recycl. 2019, 145, 113–123. [Google Scholar] [CrossRef]
  19. Gawlik, L.; Szurlej, A.; Wyrwa, A. The impact of the long-term EU target for renewables on the structure of electricity production in Poland. Energy 2015, 92, 172–178. [Google Scholar] [CrossRef]
  20. Tucki, K.; Mruk, R.; Orynycz, O.; Wasiak, A.; Botwińska, K.; Gola, A. Simulation of the Operation of a Spark Ignition Engine Fueled with Various Biofuels and Its Contribution to Technology Management. Sustainability 2019, 11, 2799. [Google Scholar] [CrossRef]
  21. Tucki, K.; Orynycz, O.; Wasiak, A.; Swic, A.; Wichlacz, J. The Impact of Fuel Type on the Output Parameters of a New Biofuel Burner. Energies 2019, 12, 1383. [Google Scholar] [CrossRef]
  22. García-Álvarez, M.T.; Moreno, B. Environmental performance assessment in the EU: A challenge for the sustainability. J. Clean. Prod. 2018, 205, 266–280. [Google Scholar] [CrossRef]
  23. Capros, C.; Kannavou, M.; Evangelopoulou, S.; Petropoulos, A.; Siskos, P.; Tasios, N.; Zazias, G.; DeVita, A. Outlook of the EU energy system up to 2050: The case of scenarios prepared for European Commission’s “clean energy for all Europeans” package using the PRIMES model. Energy Strategy Rev. 2018, 22, 255–263. [Google Scholar] [CrossRef]
  24. Report on the Polish Power System Vision 2.0 Century Profile. Available online: https://www.agora-energiewende.de/en/ (accessed on 24 July 2019).
  25. Kosowski, K.; Tucki, K.; Piwowarski, M.; Stepien, R.; Orynycz, O.; Wlodarski, W. Thermodynamic Cycle Concepts for High-Efficiency Power Plants. Part B: Prosumer and Distributed Power Industry. Sustainability 2019, 11, 2647. [Google Scholar] [CrossRef]
  26. Bel, G.; Joseph, S. Climate change mitigation and the role of technological change: Impact on selected headline targets of Europe’s 2020 climate and energy package. Renew. Sustain. Energy Rev. 2018, 82, 3798–3807. [Google Scholar] [CrossRef]
  27. Adamczyk, J.; Dzikuć, M. The analysis of suppositions included in the Polish Energetic Policy using the LCA technique—Poland case study. Renew. Sustain. Energy Rev. 2014, 39, 42–50. [Google Scholar] [CrossRef]
  28. Moslehi, S.; Reddy, T.A. An LCA methodology to assess location-specific environmental externalities of integrated energy systems. Sustain. Cities Soc. 2019, 46, 1–14. [Google Scholar] [CrossRef]
  29. Cellura, M.; Cusenza, M.A.; Longo, S. Energy-related GHG emissions balances: IPCC versus LCA. Sci. Total Environ. 2018, 628, 1328–1339. [Google Scholar] [CrossRef]
  30. Cepeda, M. Assessing cross-border integration of capacity mechanisms in coupled electricity markets. Energy Policy 2018, 119, 28–40. [Google Scholar] [CrossRef]
  31. Manowska, A.; Tobór-Osadnik, K.; Wyganowska, M. Economic and social aspects of restructuring Polish coal mining: Focusing on Poland and the EU. Resour. Policy 2017, 52, 192–200. [Google Scholar] [CrossRef]
  32. Palm, J.; Eidenskog, M.; Luthander, R. Sufficiency, change, and flexibility: Critically examining the energy consumption profiles of solar PV prosumers in Sweden. Energy Res. Soc. Sci. 2018, 39, 12–18. [Google Scholar] [CrossRef]
  33. Zafar, R.; Mahmood, A.; Razzaq, S.; Ali, W.; Naeem, U.; Shehzad, K. Prosumer based energy management and sharing in smart grid. Renew. Sustain. Energy Rev. 2018, 82, 1675–1684. [Google Scholar] [CrossRef]
  34. Picchi, P.; Van Lierop, M.; Geneletti, D.; Stremke, S. Advancing the relationship between renewable energy and ecosystem services for landscape planning and design: A literature review. Ecosyst. Serv. 2019, 35, 241–259. [Google Scholar] [CrossRef]
  35. Van Aubel, P.; Poll, E. Smart metering in the Netherlands: What, how, and why. Int. J. Electr. Power Energy Syst. 2019, 109, 719–725. [Google Scholar] [CrossRef] [Green Version]
  36. Wang, Y.; Qiu, H.; Tu, Y.; Liu, Q.; Ding, Y.; Wang, W. A Review of Smart Metering for Future Chinese Grids. Energy Procedia 2018, 152, 1194–1199. [Google Scholar] [CrossRef]
  37. Jurasz, J.; Dąbek, P.B.; Kaźmierczak, B.; Kies, A.; Wdowikowski, M. Large scale complementary solar and wind energy sources coupled with pumped-storage hydroelectricity for Lower Silesia (Poland). Energy 2018, 161, 183–192. [Google Scholar] [CrossRef]
  38. Badyda, K.; Niewiński, G.G.; Patrycy, A.; Orzeszek, W. Attempt to Estimate the Costs of Implementing BAT Conclusions for Large Combustion Plants. Soc. Inequal. Econ. Growth 2016, 46, 315–333. [Google Scholar]
  39. Calise, F.; De Notaristefani di Vastogirardi, G.; D’Accadia, M.D.; Vicidomini, M. Simulation of polygeneration systems. Energy 2018, 163, 290–337. [Google Scholar] [CrossRef]
  40. Jarnut, M.; Wermiński, S.; Waśkowicz, B. Comparative analysis of selected energy storage technologies for prosumer-owned microgrids. Renew. Sustain. Energy Rev. 2017, 74, 925–937. [Google Scholar] [CrossRef]
  41. Aiying, R.; Risto, L. Role of polygeneration in sustainable energy system development: Challenges and opportunities from optimization viewpoints. Renew. Sustain. Energy Rev. 2016, 53, 363–372. [Google Scholar]
  42. Murugan, S.; Horák, B. Tri and polygeneration systems—A review. Renew. Sustain. Energy Rev. 2016, 60, 1032–1051. [Google Scholar] [CrossRef]
  43. Chmielak, T.; Ziębik, A. Obiegi Cieplne Nadkrytycznych Bloków Węglowych; Wydawnictwo Politechniki Śląskiej: Gliwice, Poland, 2010; pp. 19–43. (In Polish) [Google Scholar]
  44. Lampart, P.; Kosowski, K.; Piwowarski, M.; Jędrzejewski, L. Design analysis of tesla micro-turbine operating on a low-boiling medium. Pol. Marit. Res. 2009, 1, 28–33. [Google Scholar] [CrossRef]
  45. Mikielewicz, J.; Piwowarski, M.; Kosowski, K. Design analysis of turbines for co-generating micro-power plant working in accordance with organic rankine’s cycle. Pol. Marit. Res. 2009, 1, 34–38. [Google Scholar] [CrossRef]
  46. Piwowarski, M.; Kosowski, K. Design analysis of combined gas-vapour micro power plant with 30 kw air turbine. Pol. J. Environ. Stud. 2014, 23, 1397–1401. [Google Scholar]
  47. Turbines Markets 2016–2024: Steam, Gas Turbines, Wind, Others—Global Strategic Business Report 2018. Available online: https://markets.businessinsider.com/news/stocks/turbines-markets-2016-2024-steam-gas-turbines-wind-others-global-strategic-business-report-2018-1021662041 (accessed on 18 August 2019).
  48. Stępniak, D.; Piwowarski, M. Analyzing selection of low-temperature medium for cogeneration micro power plant. Pol. J. Environ. Stud. 2014, 23, 1417–1421. [Google Scholar]
  49. Weiß, A.P.; Popp, T.; Zinn, G.; Preißinger, M.; Brüggemann, D. A micro-turbine-generator-construction-kit (MTG-c-kit) for small-scale waste heat recovery ORC-Plants. Energy 2019, 181, 51–55. [Google Scholar] [CrossRef]
  50. Herrando, M.; Pantaleo, A.M.; Wang, K.; Markides, C.N. Solar combined cooling, heating and power systems based on hybrid PVT, PV or solar-thermal collectors for building applications. Renew. Energy 2019, 143, 637–647. [Google Scholar] [CrossRef]
  51. Hsu, P.C.; Huang, B.J.; Wu, P.H.; Wu, W.H.; Lee, M.J.; Yeh, J.F.; Wang, Y.H.; Tsai, J.H.; Li, K.; Lee, K.Y. Long-term Energy Generation Efficiency of Solar PV System for Self-consumption. Energy Procedia 2017, 141, 91–95. [Google Scholar] [CrossRef]
  52. Samson, I.; Sikora, M.; Bączyk, A.; Mączyńska, J.; Tucki, K. Technologies used to enhance the biogas and biomethane yield: A review. Przemysł Chem. 2017, 96, 1605–1611. [Google Scholar]
  53. Saadabadi, S.A.; Thattai, A.T.; Fan, L.; Lindeboom, R.E.F.; Spanjers, H.; Aravind, P.V. Solid Oxide Fuel Cells fuelled with biogas: Potential and constraints. Renew. Energy 2019, 134, 194–214. [Google Scholar] [CrossRef]
  54. Tonini, D.; Hamelin, L.; Alvarado-Morales, M.; Astrup, T.F. GHG emission factors for bioelectricity, biomethane, and bioethanol quantified for 24 biomass substrates with consequential life-cycle assessment. Bioresour. Technol. 2016, 208, 123–133. [Google Scholar] [CrossRef] [Green Version]
  55. Shen, X.; Kommalapati, R.R.; Huque, Z. The Comparative Life Cycle Assessment of Power Generation from Lignocellulosic Biomass. Sustainability 2015, 7, 12974–12987. [Google Scholar] [CrossRef] [Green Version]
  56. Adelt, M.; Wolf, D.; Vogel, A. LCA of biomethane. J. Nat. Gas Sci. Eng. 2011, 3, 646–650. [Google Scholar] [CrossRef]
  57. Gonzalez-Fernandez, C.; Sialve, B.; Bernet, N.; Steyer, J.P. Impact of microalgae characteristics on their conversion to biofuel. Part ii: Focus on biomethane production. Biofuels Bioprod. Biorefin. 2012, 6, 205–218. [Google Scholar] [CrossRef]
  58. Cozzolino, R.; Lombardi, L.; Tribioli, L. Use of biogas from biowaste in a solid oxide fuel cell stack: Application to an off-grid power plant. Renew. Energy 2017, 111, 781–791. [Google Scholar] [CrossRef]
  59. Hijazi, O.; Tappen, S.; Effenberger, M. Environmental impacts concerning flexible power generation in a biogas production. Carbon Resour. Convers. 2019, 2, 117–125. [Google Scholar] [CrossRef]
  60. Barbuzza, E.; Buceti, G.; Pozio, A.; Santarelli, M.; Tosti, S. Gasification of wood biomass with renewable hydrogen for the production of synthetic natural gas. Fuel 2019, 242, 520–531. [Google Scholar] [CrossRef]
  61. Coronado, C.R.; Yoshioka, J.T.; Silveira, J.L. Electricity, hot water and cold water production from biomass. Energetic and economical analysis of the compact system of cogeneration run with woodgas from a small downdraft gasifier. Renew. Energy 2011, 36, 1861–1868. [Google Scholar] [CrossRef] [Green Version]
  62. Kosowski, K.; Domachowski, Z.; Próchnicki, W.; Kosowski, A.; Stępień, R.; Piwowarski, M.; Włodarski, W.; Ghaemi, M.; Tucki, K.; Gardzilewicz, A.; et al. Steam and Gas Turbines with the Examples of Alstom Technology, 1st ed.; Alstom: Saint-Quen, France, 2007; ISBN 978-83-925959-3-9. [Google Scholar]
  63. Kosowski, K.; Tucki, K.; Piwowarski, M.; Stępień, R.; Orynycz, O.; Włodarski, W.; Bączyk, A. Thermodynamic Cycle Concepts for High-Efficiency Power Plans. Part A: Public Power Plants 60+. Sustainability 2019, 11, 2647. [Google Scholar] [CrossRef]
  64. Ślefarski, R.; Jójka, J.; Czyżewski, P.; Grzymisławski, P. Experimental investigation on syngas reburning process in a gaseous fuel firing semi-industrial combustion chamber. Fuel 2018, 217, 490–498. [Google Scholar] [CrossRef]
  65. Taler, J.; Mruk, A.; Cisek, J.; Majewski, K. Combined heat and power plant with internal combustion engine fuelled by wood gas. Rynek Energii 2013, 4, 62–67. [Google Scholar]
  66. Kordylewski, W. Spalanie i paliwa, 5th ed.; Oficyna Wydawnicza Politechniki Wrocławskiej: Wrocław, Polska, 2008; pp. 10–470. ISBN 978-83-7493-378-0. [Google Scholar]
  67. Masłow, L.A. Ship Gas Turbines, 1st ed.; Sudostroene: Leningrad Region, Russia, 1973. (In Russian) [Google Scholar]
  68. Kostiuk, A.G.; Serstiuk, A.N. Gas Turbines Units, 1st ed.; Wyschaya Skola: Moscow, Russia, 1979. (In Russian) [Google Scholar]
  69. Traupel, W. Thermische Turbomachinen, 2nd ed.; Springer: Berlin/Heidelberg, Germany; New York, NY, USA, 1982; pp. 122–525. Available online: https://link.springer.com/book/10.1007%2F978-3-642-96632-3 (accessed on 12 August 2019).
  70. Sawyer, J.W. Gas Turbine Engineering Handbook, 3rd ed.; Turbomachinery International Publications: Norwalk, CT, USA, 1985; pp. 98–245. ISBN 0-937506-14-1. [Google Scholar]
  71. Sorensen, H.A. Gas Turbines (Series in Mechanical Engineering), 1st ed.; Ronald Press Company: New York, NY, USA, 1951; pp. 48–440. [Google Scholar]
  72. Gailfuß, M. Private meets Public—Small scale CHP. Technological Developments. In Proceedings of the Workshop BHKW-Infozentrum Rastatt, Berlin, Germany, 9 September 2003. [Google Scholar]
  73. Kosowski, K.; Włodarski, W.; Piwowarski, M.; Stepień, R. Performance characteristics of a micro-turbine. Adv. Vib. Eng. 2014, 2, 341–350. [Google Scholar]
  74. Kosowski, K.; Piwowarski, M.; Stępień, R.; Włodarski, W. Design and investigations of the ethanol microturbine. Arch. Thermodyn. 2018, 39, 41–54. [Google Scholar]
  75. AE-T100 Externally Fired Micro Turbine. Available online: https://www.ansaldoenergia.com/business-lines/new-units/microturbines/ae-t100e (accessed on 9 August 2019).
  76. High Reliability and Easy Maintenance. Technical Data for Dresser-Rand KG2 Gas Turbines. Available online: https://new.siemens.com/global/en/products/energy/power-generation/gas-turbines/dresser-rand-kg2.html (accessed on 9 August 2019).
  77. 1.2 MW Gas Turbine for Biomass Burning. Available online: https://www.braytonenergy.net/our-projects/1-2-mw-gas-turbine/ (accessed on 9 August 2019).
  78. Gas Turbine Electric Power Plant of External Combustion 2.5 MW GTEUVS-2.5MS. Available online: http://www.motorsich.com/eng/products/land/vrazrabotke/gteuvc-2.5ms/ (accessed on 9 August 2019).
  79. C65. Available online: https://www.capstoneturbine.com/products/c65 (accessed on 9 August 2019).
Figure 1. Turbine set arrangements being analyzed. Variant 1: turbine set operating according to the simple open cycle; Variant 2: turbine set operating according to the open cycle with a regenerator; Variant 3: turbine set operating according to the open cycle with a combustion chamber at the turbine exit. The air introduced to the combustion chamber has a temperature equal to the temperature just behind the turbine and it can be compared to the situation when the effectiveness of the regenerator equals 1. Therefore, the efficiency of variant 3 can be higher than the efficiency of other variants. This solution has been well known for years [67,68] but it was not used in practice due to the properties of the materials for regenerators/combustors which did not allow the application of high temperature before the turbines. Nowadays, due to technological progress we can overcome these problems and propose variant 3 as a realistic solution. Variant 4: turbine set operating according to the open cycle with an external combustion chamber at the turbine exit and a high-temperature heat exchanger; Variant 5: turbine set operating according to the open cycle with partial bypassing of the external combustion chamber at the turbine exit and with a high-temperature heat exchanger.
Energies 12 03173 g001
Figure 2. The effect of a compression on the value of the efficiency referred to the maximum value of variant 1 for two exemplary fuels.
Energies 12 03173 g002
Figure 3. Influence of the structure of the cycle and calorific value of fuel on the optimal compression.
Energies 12 03173 g003
Figure 4. The effect of the cycle structure on its efficiency as compared to variant 1 for heating value Wd = 4 MJ/kg.
Energies 12 03173 g004
Figure 5. Influence of the cycle structure on its efficiency as compared to variant 1 for heating value Wd = 8.5 MJ/kg.
Energies 12 03173 g005
Figure 6. The effect of the cycle structure on its as compared to variant 1 for heating value Wd = 17.5 MJ/kg.
Energies 12 03173 g006
Figure 7. The effect of the cycle structure on its efficiency as compared to variant 1 for heating value Wd = 24.4 MJ/kg.
Energies 12 03173 g007
Figure 8. The effect of the cycle structure on its efficiency as compared to variant 1 for heating value Wd = 38.7 MJ/kg.
Energies 12 03173 g008
Figure 9. The influence of the cycle structure on its efficiency as compared to variant 1 for methane.
Energies 12 03173 g009
Figure 10. The influence of the cycle structure on its efficiency as compared to variant 1 for hydrogen.
Energies 12 03173 g010
Figure 11. Collective diagram of the influence of the structure of the cycle and calorific value of fuel on the efficiency of the cycle as compared to variant 1.
Energies 12 03173 g011
Figure 12. Collective diagram of the influence of the structure of the cycle and calorific value of fuel on its efficiency in relation to the variants of cycles with methane as a fuel.
Energies 12 03173 g012
Figure 13. Collective diagram of the effect of the structure of cycle and calorific value of fuel on the mass flux of the fuel recorded in the combustion chamber in relation to the variants of circulation with methane fuel.
Energies 12 03173 g013
Figure 14. Collective diagram of the influence of the structure of the cycle and the calorific value of fuel on the exhaust gas mass flux as compared to the variants of the cycles with methane.
Energies 12 03173 g014
Figure 15. Collective diagram of the effect of the structure of cycle and calorific value of fuel on the effective power in relation to the variants of the cycle with methane as a fuel.
Energies 12 03173 g015
Table 1. Assumptions adopted for the design analysis of turbine generator variants [62,63].
DescriptionUnitValue
compressor efficiency(-)0.800
turbine efficiency(-)0.820
mechanical efficiency(-)0.980
leakage losses(-)0.020
generator efficiency(-)0.900
efficiency of the combustion chamber(-)0.950
pressure loss in the filter(-)0.995
pressure loss in the silencer(-)0.995
pressure losses in the combustion chamber(-)0.980
pressure loss in the regenerator(-)0.980
Table 2. The list of analyzed gases with different heating values [65,66].
Fuel TypeVolumetric CompositionDensityCalorific ValueCalorific Value
(-)(kg/m3)(MJ/m3)(MJ/kg)
gas from biomass gasificationmethane 0.09; carbon dioxide 0.133; carbon monoxide 0.147; hydrogen 0.073; nitrogen 0.42; water 0.1371.21074.84.4
wood gasmethane 0.12; carbon dioxide 0.54; carbon monoxide 0.3; hydrogen 0.041.4197128.5
biogasmethane 0.4; carbon dioxide 0.23; hydrogen 0.16; carbon monoxide 0.1; nitrogen 0.110.943816.517.5
biogasmethane 0.75; carbon dioxide 0.15; carbon monoxide 0.02; hydrogen sulfide 0.04; nitrogen 0.040.90022224.4
city gasmethane 0.25; hydrogen 0.55; carbon monoxide 0.08; nitrogen 0.07; oxygen 0.050.452517.538.7
methanemethane 1.00.66603654.1
hydrogenhydrogen 1.00.083510.02120
Table 3. Selected calculation results.
ParameterVariantWd (MJ/kg)
4.08.517.524.438.754.1120.0
η/ηmeth (-)V11.2651.1091.0411.0241.00810.989
V20.9490.9720.9880.9930.99811.003
V30.9810.9920.9970.9980.99911.001
V40.7510.8930.9580.9760.99211.011
V50.8350.9290.9720.9840.99511.007
mfuel/mfuelmeth (-)V116.2726.7933.1742.2481.40210.448
V220.8537.4963.2962.2971.40910.441
V313.7826.4163.1012.2211.39910.450
V418.0067.1243.2252.2721.40910.446
V517.1217.0203.2202.2541.40510.448
mspal/mspalmeth (-)V11.1811.0691.0261.0151.00510.993
V21.1181.0391.0141.0081.00210.997
V31.0391.0161.0061.0041.00110.998
V41.1071.0381.0141.0081.00310.997
V51.0941.0351.0131.0071.00210.997
WeGT/WeGTmeth (-)V11.5061.1781.0671.0371.01010.984
V21.4601.1441.0531.0291.00510.981
V31.0001.0001.0001.0001.00011.000
V41.0001.0001.0001.0001.00011.000
V51.0581.0251.0131.0001.00011.000
η/ηV1 (-)V11111111
V20.891.041.131.161.181.191.21
V31.331.531.641.671.701.711.73
V40.730.991.131.171.211.231.25
V50.881.121.251.281.321.341.36
opt (-)V117.0015.0013.8013.6013.4013.2013.00
V23.603.002.852.802.752.752.70
V31.751.751.751.751.751.751.75
V42.602.602.602.602.602.602.60
V52.902.752.702.652.652.652.65

