1. Introduction
In the context of restructuring national grids and utilities in industrialized countries, shifting from a centralized structure to a more flexible architecture, MicroGrids (MGs) are obtaining traction as a way to exploit ever-so-cheap Distributed Energy Resources (DER) [
1]. In the context of developing countries, 1.1 billion people still lack access to electricity, with a 43% electrification rate in sub-Saharan Africa (SSA) [
2]. In fact, in spite of the general progress in recent years, at the current rate the SDG 7, that aims to achieve universal access to “affordable, reliable and modern energy services” by 2030, will not be reached [
3]. MGs will be a key factor in order to realize this effort; as indicated by the International Energy Agency (IEA) “Energy for all” scenario, an investment of about 190 billion dollars in MGs will be needed by 2030 [
2].
SSA has therefore the potential to bypass the fossil fuel intensive, centralized model that became standard in industrialized countries and to structure its future electricity supply system with a bottom-up approach, that mimics the decentralization taking place in developed countries [
4].
The solution traditionally adopted to provide electricity in rural areas was the deployment of MGs solely powered by diesel generators, due to their low initial investment cost [
5].
However, hybrid systems that integrate different renewable generation sources with energy storage technologies and use a diesel generator only for backup are more sustainable and cheaper than purely diesel systems considering all the costs incurred during the operational lifetime of an MG. It has in fact been shown that hybrid systems generally allow for a lower levelized cost of energy (LCOE) [
6], as also demonstrated specifically for the case study presented in this article, with a Homer Pro analysis [
7]. Furthermore, in rural areas diesel is available at a higher price compared to urbanized areas. Therefore, reducing the dependency of the energy supply on gensets will allow the following: i) to reduce the risks associated with fuel availability, ii) to consolidate the business model which will be less exposed to fuel price volatility, iii) to produce overall savings and CO
2 emissions reduction.
For that above, energy storage is the key in deploying intermittent and non-dispatchable renewable energy sources (RES) such as solar and wind in MGs while minimizing the dependency on fuel and guaranteeing reliability and high standards of quality of service, minimizing energy curtailment [
8].
Nowadays, electricity access is not only defined in terms of quantity of supply but also in terms of qualitative parameters—such as reliability, availability, stability of voltage—that concur to define an overall “tier” of access [
9]. The adequacy of access provided by a hybrid MG, guaranteed by the energy storage section, needs to allow the development of productive uses of energy, which are acknowledged to be crucial for assuring sufficient revenue streams and to realize the socio-economic transformational impact of the electrification project [
10].
At the present time, rural villages that require systems in the range 10–300 kW are still not a financially viable investment for utilities or developers due to current low input demand and the ability of customers to pay. Consequently, specific programs are needed to reduce the gap in the upfront costs of hybrid MGs with respect to diesel-based ones [
11].
To facilitate the widespread diffusion of storage systems in developing countries, the World Bank has recently launched the “Accelerating Battery Storage for Development” program, that is expected to mobilize 4 billion USD to promote investments in battery storage for developing and middle-income countries [
12].
Batteries are estimated to account for about 34% of the up-front costs of a typical MG, which is the largest share among all the capital expenditure (CAPEX) components [
13]. Furthermore, the presence of energy storage, while increasing upfront capital costs and adding another layer of complexity in the MG structure, will allow the adoption of sophisticated control techniques, thanks to the increasing availability on the market of cheap and reliable control devices. This will allow to pre-emptively optimize the power management among storage devices and fuel generators thanks to load and RES production forecasting, thus reducing the investment cost by optimizing the sizing of the MG components [
14].
However, the adoption of Energy Storage Systems (ESS) in rural electrification projects is still facing a funding gap. The financial and technical sustainability of an MG indeed should be considered along its entire lifetime, evaluating also the durability of ESS and the associated replacement costs; the risk of grant-based development financing is that the communities benefiting from the hybrid MG may not have the resources to replace the batteries once they have reached their end of life [
15], or that the relatively frequent battery substitution may represent a burden for developers if the revenue streams are too low. Therefore, increasing the durability of ESS is a key factor for the development of MGs.
The International Renewable Energy Agency (IRENA) predicts that in 2035, RES-based MGs may become competitive with grid extension even in areas not too far from the national grid, thanks to the LCOE which would decrease from the current 0.47–0.92 USD/kWh to 0.19–0.35 USD/kWh, due to a reduction in storage costs (Li-Ion battery installation costs could decrease by 54%–61% by 2030, flow batteries by 66%, and flywheel by 35% [
16]) and control techniques improvement [
17]. It is highlighted how technologies hybridization can bring significant achievements, since Hybrid Energy Storage Systems (H-ESS), including multiple storage devices complementary to each other, are able to cope with storage requirements for different timeframes [
18,
19], merging the positive features of base-technologies and extending their application ranges. In the present paper it is proved that LCOE values are already reduced under 0.4 USD/kWh (see
Section 4) for specific flywheel/Li-ion battery hybrid configurations implementing SoA devices.
Therefore, with respect to IRENA evaluations, an even better forecast is plausible considering technologies hybridization and future reduction in storage investment costs. H-ESS can provide a faster contribution, with respect to the development of enhanced technologies, to improve energy storage performance in terms of availability, durability, efficiency, response time, and a contextual cost reduction with reference to the current state of the art.
Consequently, the implementation of H-ESS will lead to huge MG diffusion in developing countries, thanks to the greater economic convenience compared to non-hybrid storage systems in the medium- to long-term. To highlight the potential impact of energy storage hybridization, it has been estimated that there is a worldwide potential of 5.3 GWh of storage systems, specifically in remote areas, for small islands between 1000 and 100,000 inhabitants that could be powered by hybrid MGs [
20].
Regarding technologies hybridization, the coupling of flywheels with conventional batteries for microgrid applications can extend the life of electrochemical storage systems, drastically reducing replacement costs associated with the latter. Specifically, in reference [
21] accelerated aging tests, performed over lithium cells operated both in hybrid and non-hybrid configurations, resulted in a one third reduction in the internal resistance increase in the case of hybridization over three years of operation, thus demonstrating that a relevant battery life extension is possible through flywheel–battery coupling. Flywheel energy storage systems (FESS) are capable of coping with highly oscillating power fluctuations [
22] and therefore can be used as short-term storage devices [
23]; reducing dangerous power spikes meanwhile increasing battery lifetime in hybrid configurations. FESS main characteristics are a high cycle life (hundreds of thousands), long calendar life (more than 20 years) independently from the depth of discharge, fast response, high round trip efficiency, high charge and discharge rates, high power density, high energy density [
7,
9], and low environmental impacts as described in reference [
24]. Moreover, they present very low operational and maintenance requirements. According to the classification reported in reference [
24], low-speed mechanical FESS (<10,000 rpm) and high-speed composite FESS (up to 100,000 rpm) technologies are available.
In the present study a low-speed flywheel with a steel cylindrical rotor, low-friction mechanical bearing, and housing under vacuum is taken into account for cost reduction. The extension in battery lifespan is determined for different flywheel/battery configurations under the relevant operating conditions; moreover, the correlated positive economic effects are evaluated by implementing battery replacement in the LCOE index calculation procedure. To this aim single technologies and hybrid storage configurations have been investigated starting from the data gathered, for that which concerns both photovoltaic (PV) production and users load request, at a Ugandan MG (Kitobo Island) chosen as representative of a remote area in a developing country. Moreover, different load profiles typical of industrialized countries, were considered for further evaluation of MG performance within more developed future scenarios.
In
Section 2, the case study is illustrated, with site-specific and broader context information, highlighting the differences between its load profile and the residential/industrial load profiles of developed countries.
Section 3 presents the methodology followed in performing the simulations through which, for different storage applied technologies and systems configurations, i) the power management and operation of MG components are simulated throughout a year; ii) the battery lifetime and LCOE index are consequently determined. In
Section 4 the detailed results of the simulations are discussed while the conclusions are reported in
Section 5.
3. Plant Description
The photovoltaic field consists of 880 PV panels with a nominal power of 260 Wp, adding up to a nominal power of 228.8 kWp, combined under eight inverters of 25 kW each. There is a back-up three-phase diesel generator, with 80 kVA rated power, to be used in cases of high demand not completely satisfied by the energy coming from the photovoltaic field, of prolonged periods without sun or in the case of extraordinary maintenance. The plant includes also vanadium redox flow batteries (VRFB), ensuring a total capacity of 520 kWh, each equipped with off-grid inverters able to modulate the power adequately. Since the village is densely populated and located at a reduced distance from the plant (200 m), a low-voltage distribution system is sufficient to reach the off-takers.
The generation and electric load data from the Kitobo microgrid used in the present study cover the months from July to December 2017. The data represent the first six months of operation of the MG and, as expected, in the first months of operations the energy demand was low: the design choices have to be evaluated in consideration of the future ramp-up of energy demand, the diversification of economic activities, and the modernization of current ones, even if this represents a slow process that takes places over years.
The case study presented has been used as a reference to investigate the potential benefits of H-ESS in increasing the financial feasibility for the replicability of the project in similar contexts, considering plant layouts that differ from the one actually in place, and are best suited to serve the electricity demand measured at the site.
For this purpose, the actual measured load profile was used as an input to depict the actual needs of similar remote communities, but also two load profiles that reflect more “advanced” user cases were derived from it, as explained in the following section.
As for the PV generation, the monitoring system registered a generation peak of 112 kW in the timespan considered, because the inverters automatically curtail production if there is a lack of request or the batteries are already charged. The output PV profile available was used in the scenarios considered without carrying out further simulations, but for the LCOE calculations a PV power of 112 kWp (as reported in
Table 1) instead of the nominal rating of 228 kWp was used. This assumption, justified by the very low average PV power generation in comparison with the 112 kW peak, allows the comparative evaluation of the LCOE of various energy storage configurations in a generalizable scenario where generation capacity is appropriate for the load to be served.
Accordingly, as it can be seen in
Table 2,
Table 3,
Table 4 and
Table 5, the storage sections considered for the investigated scenarios are significantly smaller than the VRFB capacity actually installed at Kitobo. Likewise, the power rating of the auxiliary generator is sensibly lower.
4. Methodology
The preliminary work carried out works on the annual profiles of electrical load (
profile) and PV production gathered at the Kitobo island microgrid. Since the available dataset covered only six months of data, the annual profile was obtained by duplicating the available load profile data, in consideration of the low seasonality of consumption patterns in the island. First, taking into account the acquired PV production and load profiles, the preliminary sizing of the energy storage devices (Li-ion, Lead-gel, also in hybrid flywheel/battery configurations, and VRFBs technologies are applied) is performed through the simulation code presented in reference [
21], also providing as output the State of Charge (
SoC) trend throughout the year (in terms of angular velocity for flywheel modules). Second, for conventional batteries the
SoC trend made it possible to estimate for each storage configuration the number of annual cycles and the relative lifespan in years, through the application of the Rainflow algorithm and the specific “Cycles to Failure” curve of the technology analyzed. Finally, the dataset was then used for the implementation of the LCOE index calculation together with further parameters as indicated below.
This procedure was followed for several storage architectures and, moreover, considering also different users load profile, characterized by a greater oscillating behavior (in the following
and
profiles) at parity of yearly energy consumptions, aiming to evaluate a possible future scenario consequent to the socio-economic development of the Kitobo community.
and
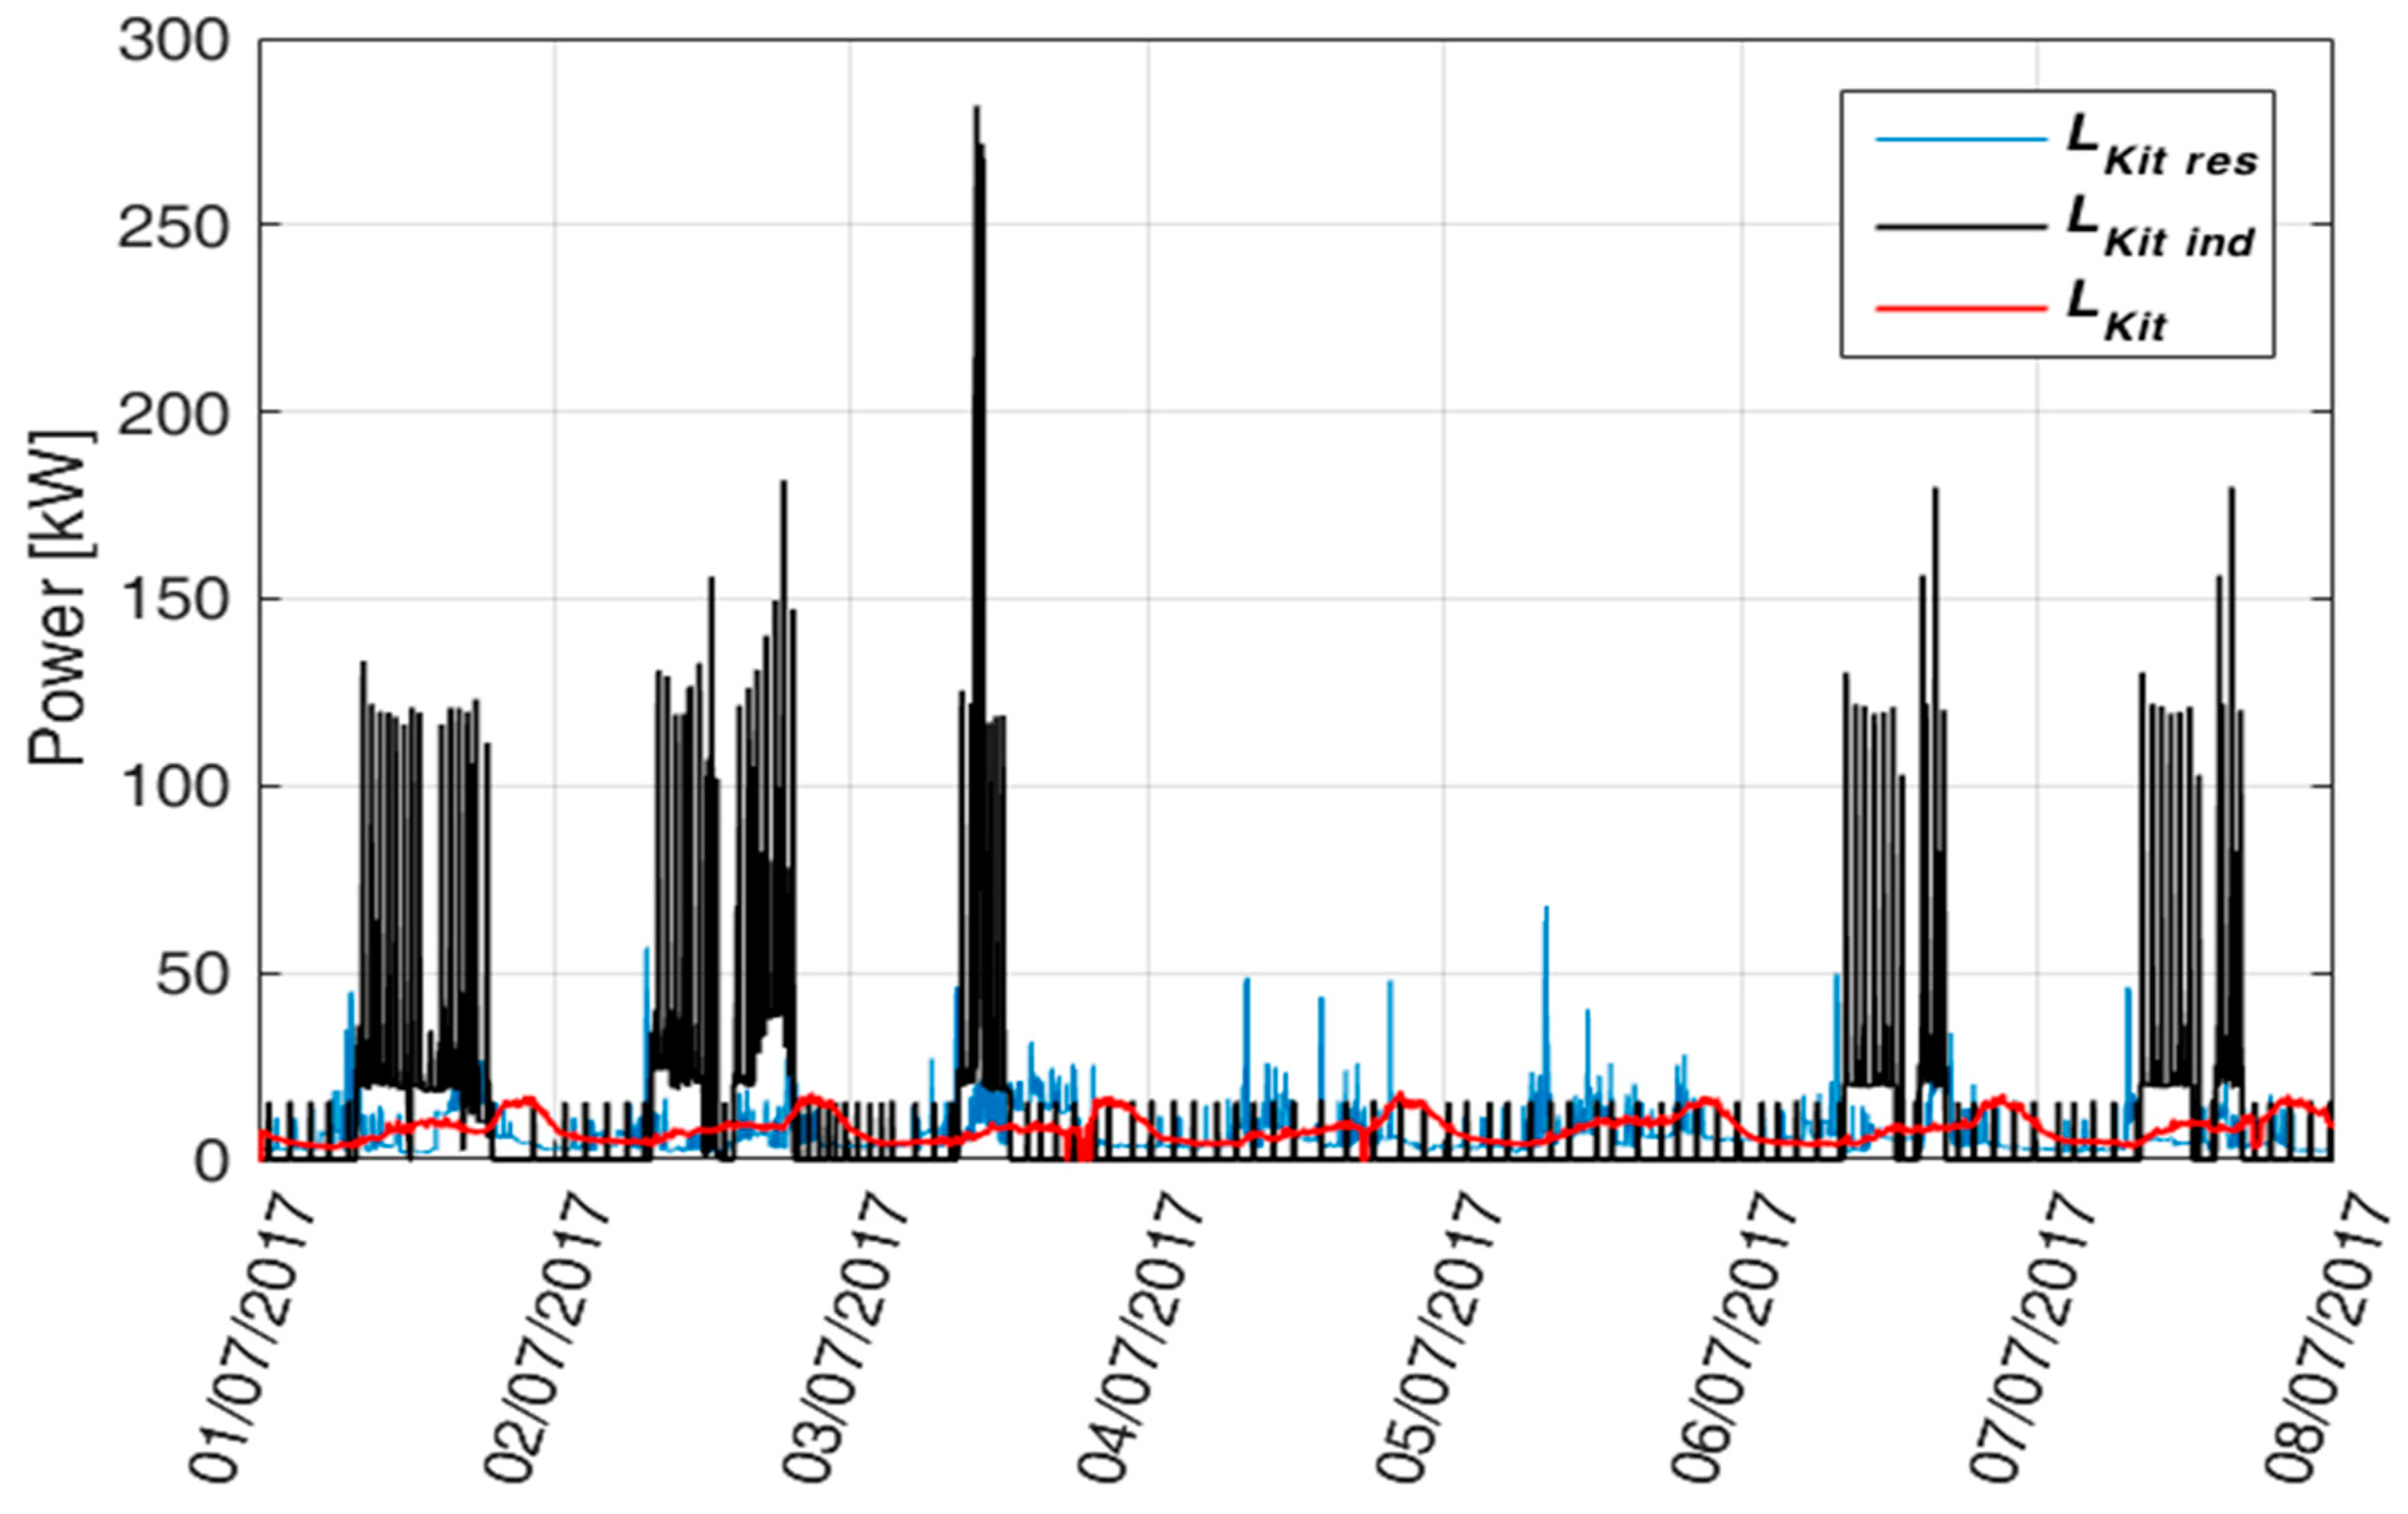
profiles were determined on the basis of measurements performed at residential and industrial users respectively, located in industrialized countries. These acquired load profiles were scaled to have the same overall annual consumption measured at Kitobo but maintaining their specific fluctuating character. To highlight differences in fluctuation among the three investigated load profiles,
Figure 1, as example, depicts their trends for a limited period of one week.It must be emphasized how
and
have higher power peaks, due to the use of appliances and industrial electric loads respectively. So that, a possible future socio-economic development can also increase the LCOE difference between hybrid (flywheel-battery) and non-hybrid (only battery) storage systems, with an increasing advantage provided by the H-ESS thanks to the greater exploitation of the FESS peak-shaving function towards the battery.
4.1. Assessment of the Annual Operation of the Storage System
The Kitobo microgrid represents an example of an off-grid system. Therefore, it is mandatory to maximize the self-consumption of energy produced by the PV plant and to minimize the diesel auxiliary generator operation, used to provide energy whenever requested.
MG energy performance is evaluated by means of the MG simulation code developed in the Matlab environment for batteries [
34] and flywheel/battery hybrid storage sections [
21,
22]. The code performs power flow management, with a 1 min time step, based on PV production and load profiles. It provides as outputs the trends of energy exchanges among the PV plant, the auxiliary generator, the load and the storage section, as well as the corresponding global yearly amounts. Thus, it is possible to evaluate the overall yearly amount of self-consumption due to the storage system as output.
The developed software requires the following input data:
RES production and load profiles with 1 min time step;
Storage battery capacity;
Battery depth of discharge;
Battery maximum charge/discharge power;
Battery round trip energy efficiency;
Presence or absence of flywheel storage system, including its technical features (inertia momentum, minimum/maximum rotational speed, round trip efficiency);
State of charge of the storage devices at the beginning of the simulation.
When production is greater than demand, the surplus energy is used to charge the storage system. On the other hand, the storage system provides energy to the load when higher than the PV production. In the case of battery/flywheel hybrid architectures, a complex management algorithm is used, as presented by the authors in references. [
21,
22], implementing the flywheel peak-shaving functionalities on the basis of the difference values (
Diff), the current and the one relative to the previous calculation step, between production and load. Specifically, on the basis of two consecutive
Diff values, two step-profiles (i.e., consisting of consecutives step variations), characterized by a slow variation and approximating the
Diff trend by excess or defect respectively (with reference to absolute values), are determined in real time. In accordance with the particular operating mode (surplus or lack of renewable energy, full charge, complete discharge, power saturation of storage devices), the current value of one of the step-profiles is chosen as the power accumulated/delivered by the battery pack in the time step (or the auxiliary generator in case the storage system cannot be operated), while the oscillation (i.e., the difference between such a parameter and the current
Diff value) is processed by the flywheel. The algorithm consists of two main sections corresponding to the case of lack and surplus of PV production, each one structured in several sub-cases identified according to flywheel rotational speed, battery state of charge, and absence/presence of PV production as detailed in reference [
21]. It is to note that the code was developed to characterize the energy exchanges in the grid connected MG. However, it was applied to the present study, considering that the potential extra energy amount could be provided by the diesel auxiliary generator.
The battery state of charge, which is continuously updated during the simulation, was used as input for the Rainflow algorithm, as detailed in
Section 4.2, in order to evaluate battery lifetime. The main outcomes of the annual microgrid simulation together with results of the Rainflow battery and further input parameters (see
Table 1), are implemented in the procedure detailed in
Section 4.3 for the LCOE calculation.
4.2. Rainflow Cycle Counting Algorithm
As described in reference [
35], the rainflow algorithm is a widely used model [
36,
37,
38,
39,
40,
41,
42,
43,
44,
45], usually applied to evaluate battery lifetime when subjected to complex cycles, as in the case of the present investigation. Even if it is not accurate, generally providing an overestimated lifespan evaluation, this strategy was here implemented since the authors were interested in a lifespan comparison among several storage configurations rather than to achieve an absolute estimation of battery useful life.
This method is based on counting the charge/discharge cycles
Zi corresponding to each range of Depth of Discharge (
DoD), split in
m intervals, for a year. The number of Cycles to Failure (
CFi) corresponds to each
DoD interval. By comparing the number of cycles performed during the year at a certain depth of discharge with the Cycle to Failure curve of the considered battery, it is possible to estimate the useful life of the battery, according to Equation (1), as reported in reference [
35]:
4.3. LCOE Evaluation Model
This section presents the calculation model for the LCOE index, here implemented in order to evaluate in economic terms the most convenient energy storage solution among the various investigated alternatives for the Kitobo microgrid.
As described in reference [
46], LCOE is a measure of costs which attempts to compare different methods of electricity generation. LCOE corresponds to the minimum cost at which electricity must be sold to achieve a break-even point over the considered lifetime of the project. In reference [
47], IEA provides an analytical definition of LCOE as the following:
Where:
| Ii | investment costs during year i; |
| Mi | operation and maintenance costs during year i; |
| Fi | fuel costs during year I due to the auxiliary diesel generator; |
| Ei | generation during year i; |
| r | discount rate; |
| n | lifetime of the project. |
In the discussed analysis, investment, maintenance, and replacement costs are referred to in the procedures discussed in reference [
48].
In detail, Equations (3)–(6) show the investment costs (in €) of: i) the energy generation system (PV panels, Equation (3) and diesel auxiliary generator, Equation (6); ii) the energy storage systems, in particular batteries (4) and the flywheel accumulator (5).
Where:
| Cost of storage section (€/kWh) |
| Cost of power conversion system (€/kW) |
| Cost of photovoltaic section (€/kWp) |
| | Photovoltaic peak power (kWp) |
| Maximum battery discharge power |
| Maximum battery charge power |
| Installed flywheel capacity |
| Maximum flywheel power |
| Total capital costs for PV section ( |
| Total capital costs for li-ion battery ( |
| Total capital costs for lead-gel battery ( |
| Total capital costs for vanadium redox flow battery ( |
| Total capital costs for flywheel ( |
| Flywheel installation costs ( |
| Maximum battery storable energy |
| BOP | Cost of balance of plant (€/kW) |
| Total capital costs for diesel generator (€) |
| Cost of diesel generator (€/kW) |
| Diesel generator peak power (kW) |
It is highlighted as for the FESS (Flywheel Energy Storage System) technology, capital (Equation (5)) costs consider the following:
as regards the costs depending on the size (CFW): cost of the rotor divided into the cost of the forging stock (it grows with the mass of the raw material) and the cost of the mechanical work on the piece (it grows with the mass of the forging stock due to the additional working hours needed for manufacturing); housing cost, related to the size and weight of the contained components, and cost of the adjustment system, related to the size of the rotor.
as regards the costs depending on the maximum power (PFW): cost of the linear machine depends on its volume (increasing costs of laminations, winding, resin and magnets with height and diameter of the machine); housing cost, related to the size and weight of the contained components; cost of the electrical system and its main sub-components, linked exclusively to the power of the electric machine.
cost of sensors.
Regarding the operation and maintenance costs of the aforementioned technologies, Equations (7)–(9) refer respectively to the different storage solutions, the PV system, and the diesel auxiliary generator.
Where:
| Fixed operational and maintenance costs for the considered storage technology (€/kW-year) |
| Variable operational and maintenance costs for the considered storage technology (€/MWh) |
| Fixed operational and maintenance costs for PV |
| Annual stored energy in the battery/flywheel unit |
| P | in the case of battery; in the case of flywheel |
| Operational and maintenance costs for storage section (€/year) |
| Operational and maintenance costs for PV (€/year) |
| Replacement cost (€) |
| Annual fuel and operative costs for the generator (€/year) |
| Annual energy production from the auxiliary diesel generator (kWh/year) |
| Fuel cost (Diesel) for generator (€/MWh) |
| Fixed operational and maintenance diesel generator costs (€/kW-year) |
| Variable operational and maintenance diesel generator costs (€/MWh) |
| PV installed power (kW) |
Replacement costs are expressed by Equation (10) in case of Li-ion and lead-gel technologies, while in the case of VRFB they are mainly due to membrane replacement, as described in references [
49,
50].
A mathematical model is shown in the following equations in order to evaluate membrane replacement costs, on the basis of the installed stack power and considering a replacement time of 8 years and 250 €/m
2 as membrane cost ([
49]). The current density (
CD) and internal resistance (
Rcell) for the single cell are set at 50 mA/cm
2 and 1.5 Ω·cm
2 ([
50]) in order to evaluate the cell voltage
according to Equation (11). Once the cell voltage has been determined, the nominal current
is calculated, as described by Equation (12), considering a stack voltage of 48 V and a specific stack number.
Subsequently, from Equation (13) the necessary number of cells is identified,
Ncell. Finally, the total surface of the membranes (
Smembrane) is deduced from Equation (14), while the replacement costs concerning VRFB technology result from Equation (15).
Where:
| Current density fixed at 0.05 A/cm2 |
| Cell internal resistance (Ω·cm2) |
| Stack voltage (V) |
| Number of stacks (-) |
| Cell voltage (V) |
| Rated current (A) |
| VRFB rated power (W) |
| VRFB effective membrane area (m2) |
| Electrode total area (m2) |
| Membrane cost (€/m2) |
Finally, it is highlighted that FESS technology has a significantly higher lifetime with respect to electrochemical accumulators, compatible with the analysis scenario. Hence, it implies no substitutions are needed during the considered LCOE time horizon.
It is emphasized that all costs (capital, O&M and replacement) must be discounted. The discounting is carried out considering the Weighted Average Cost of Capital (WACC) discount rate, which is the weighted average between the cost of equity and the cost of debt capital (the chosen numeric value is indicated in
Table 1. Considering all Equations (3)–(15), the calculating formula concerning the LCOE index implemented as the aim of the present study can be expressed by Equation (16).
Where:
| LCOE | Levelized Cost of Electricity (€/kWh) |
| Time horizon for LCOE calculation ( |
| Nominal discount rate |
| d | Annual photovoltaic degradation factor (%) |
| LTbatt | Battery lifetime ( |
| s | Number of replacements (-) |
| Annual amount of energy generated by the photovoltaic system |
| Total capital cost for storage section |
| Replacement costs |
4.4. Analysis of Alternative Configurations
The target of this work was the evaluation of the effectiveness of H-ESS integrating a flywheel coupled with conventional chemical storage devices, in terms of improved LCOE index with respect to batteries devices. Since the general purpose of the study was to evaluate if H-ESS can provide sufficient flexibility and competitiveness to islanded MGs fed by renewable sources in the context of developing countries, VRFBs were also considered as further comparative technology, due to the possibility of independent power and capacity sizing. Therefore, the following energy storage technologies were considered:
Li-ion and Lead-gel batteries are widespread nowadays. Lead-gel batteries (which represent an improvement of conventional lead batteries since the electrolyte is like a gelatinous compound, instead of a liquid one) are particularly suitable for bulk heavy storage, thanks to their relative low cost per kWh. Li-ion batteries are largely used in small and medium storage systems, thanks to their high energy to weight ratio, no memory effect, high levels of efficiency and reliability, and low self-discharge; however, they present a high price compared to other storage technologies and critical issues concerning lithium and cobalt availability [
34].
The use of vanadium redox flow batteries is one of the most promising storage systems, specifically for stationary applications, as the batteries are characterized by a high capacity to storage power ratio. Reference [
51] lists the main advantages of VRFB technology, such as independent sizing of power (which depends on cell area) and energy (which depends on electrolyte volume), high round-trip efficiency, 100% DoD, long durability, fast responsiveness, and limited environmental impact. However, the high cost of membranes has an economic disadvantage when high power is required.
Regarding flywheel storage systems, they have fast responsiveness, high efficiency, long cycling life, and high power densities [
52]. On the other hand, standing losses are non-negligible. This implies that flywheels are usually applied for power modulation (short term energy storage). In hybrid configurations, as in the present study, their application range can be extended. Hybridization allows multi-operation modes of the ESS, merging the positive features of base-technologies. Therefore, in this study a low-speed flywheel with a steel rotor was devoted to the peak-shaving function of Li-ion and lead-gel batteries, in order to extend their lifespan as already proved [
21]. Different flywheel sizes were considered. Flywheel capacity can be increased acting on mass and geometry, which determine the rotational inertia of the object. Ramping capability during transients is affected by the same parameter; however fast response is determined by the torque curve of the electric machine—that in turn is related to the power.
Table 1, which reassumes the main simulation parameters, includes also technical and economic parameters relative to the considered storage devices.
Furthermore, as already discussed, three different load profiles (i.e., and ) were used in order to evaluate the LCOE index taking into consideration the different oscillating behavior of the electric load profile according to the envisaged development of the community.
Table 1.
Specifications and costs for the photovoltaic system.
Table 1.
Specifications and costs for the photovoltaic system.
| Energy Production Technology | Photovoltaic—PV |
|---|
| 112 |
| d (%) | 0.05% |
| , from [53] | 8 |
| , from [54] | 1200 |
| 30 |
| 110,643.1 |
| 1 | 8.74% |
| Inflation (%) | 0% |
| €/kWh), from [55] | 0.17 |
| , from [56] | 13.2 |
| , from [56] | 13.2 |
| , from [56] | 572 |
Table 2.
Specifications and costs for the storage technologies considered.
Table 2.
Specifications and costs for the storage technologies considered.
| Storage Technology | Lead-Gel 1 | Li-Ion 2 | Vanadium Redox Flow Battery (VRFB) | Flywheel Energy Storage System (FESS) |
|---|
| See Table 3 | See Table 3 | See Table 5 | See Table 3 |
| |
(for hybrid configuration) | See Table 5 3 | See Table 3 3 |
|
(for hybrid configuration) |
(for hybrid configuration) | See Table 5 3 | See Table 3 3 |
| Efficiency (%) | 93% | 95% | 75% | 70% 4 |
| DoD (Depth of Discharge) (%) | 40% | 90% | 90% | - |
| Minimum State Of Charge (SOCm) | 60% | 10% | 10% | - |
| – (€/kWh) | 795 5 | 618 5 | 467 5 | 1500 |
| (€/kW) | 463 5 | 465 5 | 490 5 | 350 |
| – (€/kW-year) | 6.9 5 | 3.4 5 | 8.5 5 | 5.2 5 |
| – (€/MWh) | 2.1 5 | 0.37 5 | 0.9 5 | 2 5 |
| – (€) | see Equation (12) | see Equation (12) | Tbd 6 | - |
| BOP (€/kW) 7 | 877 5 | - | - | - |
5. Results
In this section simulation results relating to different energy storage configurations are presented and analyzed. For each load profile, several ESS were investigated considering different technologies (Li-ion, Lead-gel, VRFB) and, for each technology, the variation of main sizing parameters. Also H-ESS, consisting of conventional batteries coupled to a flywheel, were considered and compared to a battery of equivalent capacity equal to the sum of the flywheel and battery installed types. Moreover, in the case of hybrid configurations different flywheel features were investigated once battery capacity values were chosen.
First, assessments of the MG annual operation were determined by means of the code presented in
Section 5.1. Specifically, for all investigated ESS architectures, one-year simulation was performed with 1-minute time steps to determine the profile of all energy fluxes among MG components and their operating status. Among these parameters the cumulated amount of energy provided by a diesel auxiliary generator was determined to characterize the MG energy independence.
Second, lifetime expectation results are presented for Li-ion and lead-gel technologies on the basis of the simulated yearly SoC profile. Finally, LCOE analysis was realized according to the procedure presented in
Section 5.3 to compare all the different investigated configurations.
5.1. MG Annual Operation Assessment
Table 3 reports only the best performing configurations in terms of the LCOE index among the investigated ones based on Li-ion and Lead-gel technologies, including hybrid flywheel/battery systems. Sizing features characterizing the investigated configurations were chosen aiming to guarantee a sufficient energy independence of the microgrid (close to 90% and anyway greater than 85% with respect to the yearly amount of the users request measured in about 65,000 kWh/year), thus limiting the exploitation of the auxiliary diesel generator, with reduced values of installed storage capacity and power. It summarizes installed capacities for Li-ion, Lead-gel, as well as the flywheel’s power and capacity values for the hybrid configurations. With regard to Li-ion and Lead-gel technologies, installed capacity values correspond for each configuration (#1,3,5) to the same useful capacity considering DoD values of 90% and 40% respectively. Moreover, for non-hybrid configurations (#2,4,6), battery capacity is the equivalent capacity of the flywheel/battery corresponding architecture.
The same procedure was followed in the VRFB case considering different power values for a certain capacity.
Table 5 shows VRFB installed power values for the different investigated load profiles. It is highlighted how the installed power increases moving from configuration #7 to #9 accordingly to the higher peak power of the load profiles (an analogous consideration can be done in reference to the flywheel power sized for the H-ESS in the case
is adopted with respect to other load profiles).
Table 4 reports the auxiliary generator installed power values and the yearly amounts of produced energy (in the range 5000–9000 kWh/year for all reported configurations) implemented in the LCOE index evaluation as requested in the case of
and
load profiles. The sizing of the auxiliary diesel generator and its functioning were assessed, for each of the several investigated cases, to guarantee a continuous operation time at each start-up compatible with the technology features, so as not to satisfy peak requests. For this reason, in the case of the industrial load profile, withdrawals from diesel generator were neglected because of the characteristic instantaneous high power peaks.
Table 3.
Analyzed ESS configurations for Li-ion and Lead-gel technology.
Table 3.
Analyzed ESS configurations for Li-ion and Lead-gel technology.
| Configuration | | |
|
|
|
|
|---|
| 1 (hybrid) | 120 | 270 | 50 | 30 | 150 | 22 |
| 2 | 150/142 1 | 300/292 1 | - | - | - | - |
| 3 (hybrid) | 150 | 337.5 | 50 | 30 | 150 | 22 |
| 4 | 180/172 1 | 367.5/359.5 1 | - | - | - | - |
| 5 (hybrid) | 180 | 405 | 50 | 30 | 150 | 22 |
| 6 | 210/202 1 | 435/427 1 | - | - | - | - |
Table 4.
Installed power of the auxiliary generator and yearly energy production.
Table 4.
Installed power of the auxiliary generator and yearly energy production.
| Configuration | | |
|---|
| Li-Ion | Lead-Gel | | Li-Ion | Lead-Gel | |
|---|
| 1 (hybrid) | 5402 | 5415 | 5 | 8200 | 8243 | 10 |
| 2 | 6845 | 6860 | 5 | 6700 | 8078 | 15 |
| 3 (hybrid) | 5368 | 5368 | 5 | 7923 | 7934 | 10 |
| 4 | 6845 | 6845 | 5 | 6460 | 7764 | 15 |
| 5 (hybrid) | 5368 | 5368 | 5 | 7846 | 7856 | 10 |
| 6 | 6845 | 6845 | 5 | 6460 | 7695 | 15 |
Table 5.
Analyzed VRFB configurations.
Table 5.
Analyzed VRFB configurations.
| Configuration | | | | | |
|---|
| 7 () | 250 | 80 | 6571 | - | 5 |
| 8 () | 250 | 110 | - | 6550 | 15 |
| 9 () | 270 | 210 | - | - | - |
5.2. Battery Lifetime
Table 6 reports the values of useful battery life, estimated for the different configurations by means of the rainflow algorithm, in the case of the
load profile. It can be seen that the useful life of the batteries extends in the presence of the flywheel. The high values of expected lifespan are due to the overestimation provided by the rainflow algorithm (as it does not consider self-discharge phenomena, degradation due to thermal stresses, etc.) and, significantly, to the very flat load profile measured at the Kitobo MG.
This is evident from the battery lifespans indicated in
Table 7 when the more oscillating residential load profile
is considered. Also, in this case it is evident that flywheel hybridization extends the battery useful life.
Table 8 lists battery lifespans resulting in the case when the
industrial load profile is considered. In this case high peak power requests are smoothed through the peak-shaving function of the flywheel. Therefore, thanks to the flywheel operation mode, hybrid configurations present a significant increase in battery lifetime.
Moreover, it can be noted (see
Table 6 and
Table 8) that the advantages achievable in terms of battery life extension increase with the fluctuating character of the considered load profile.
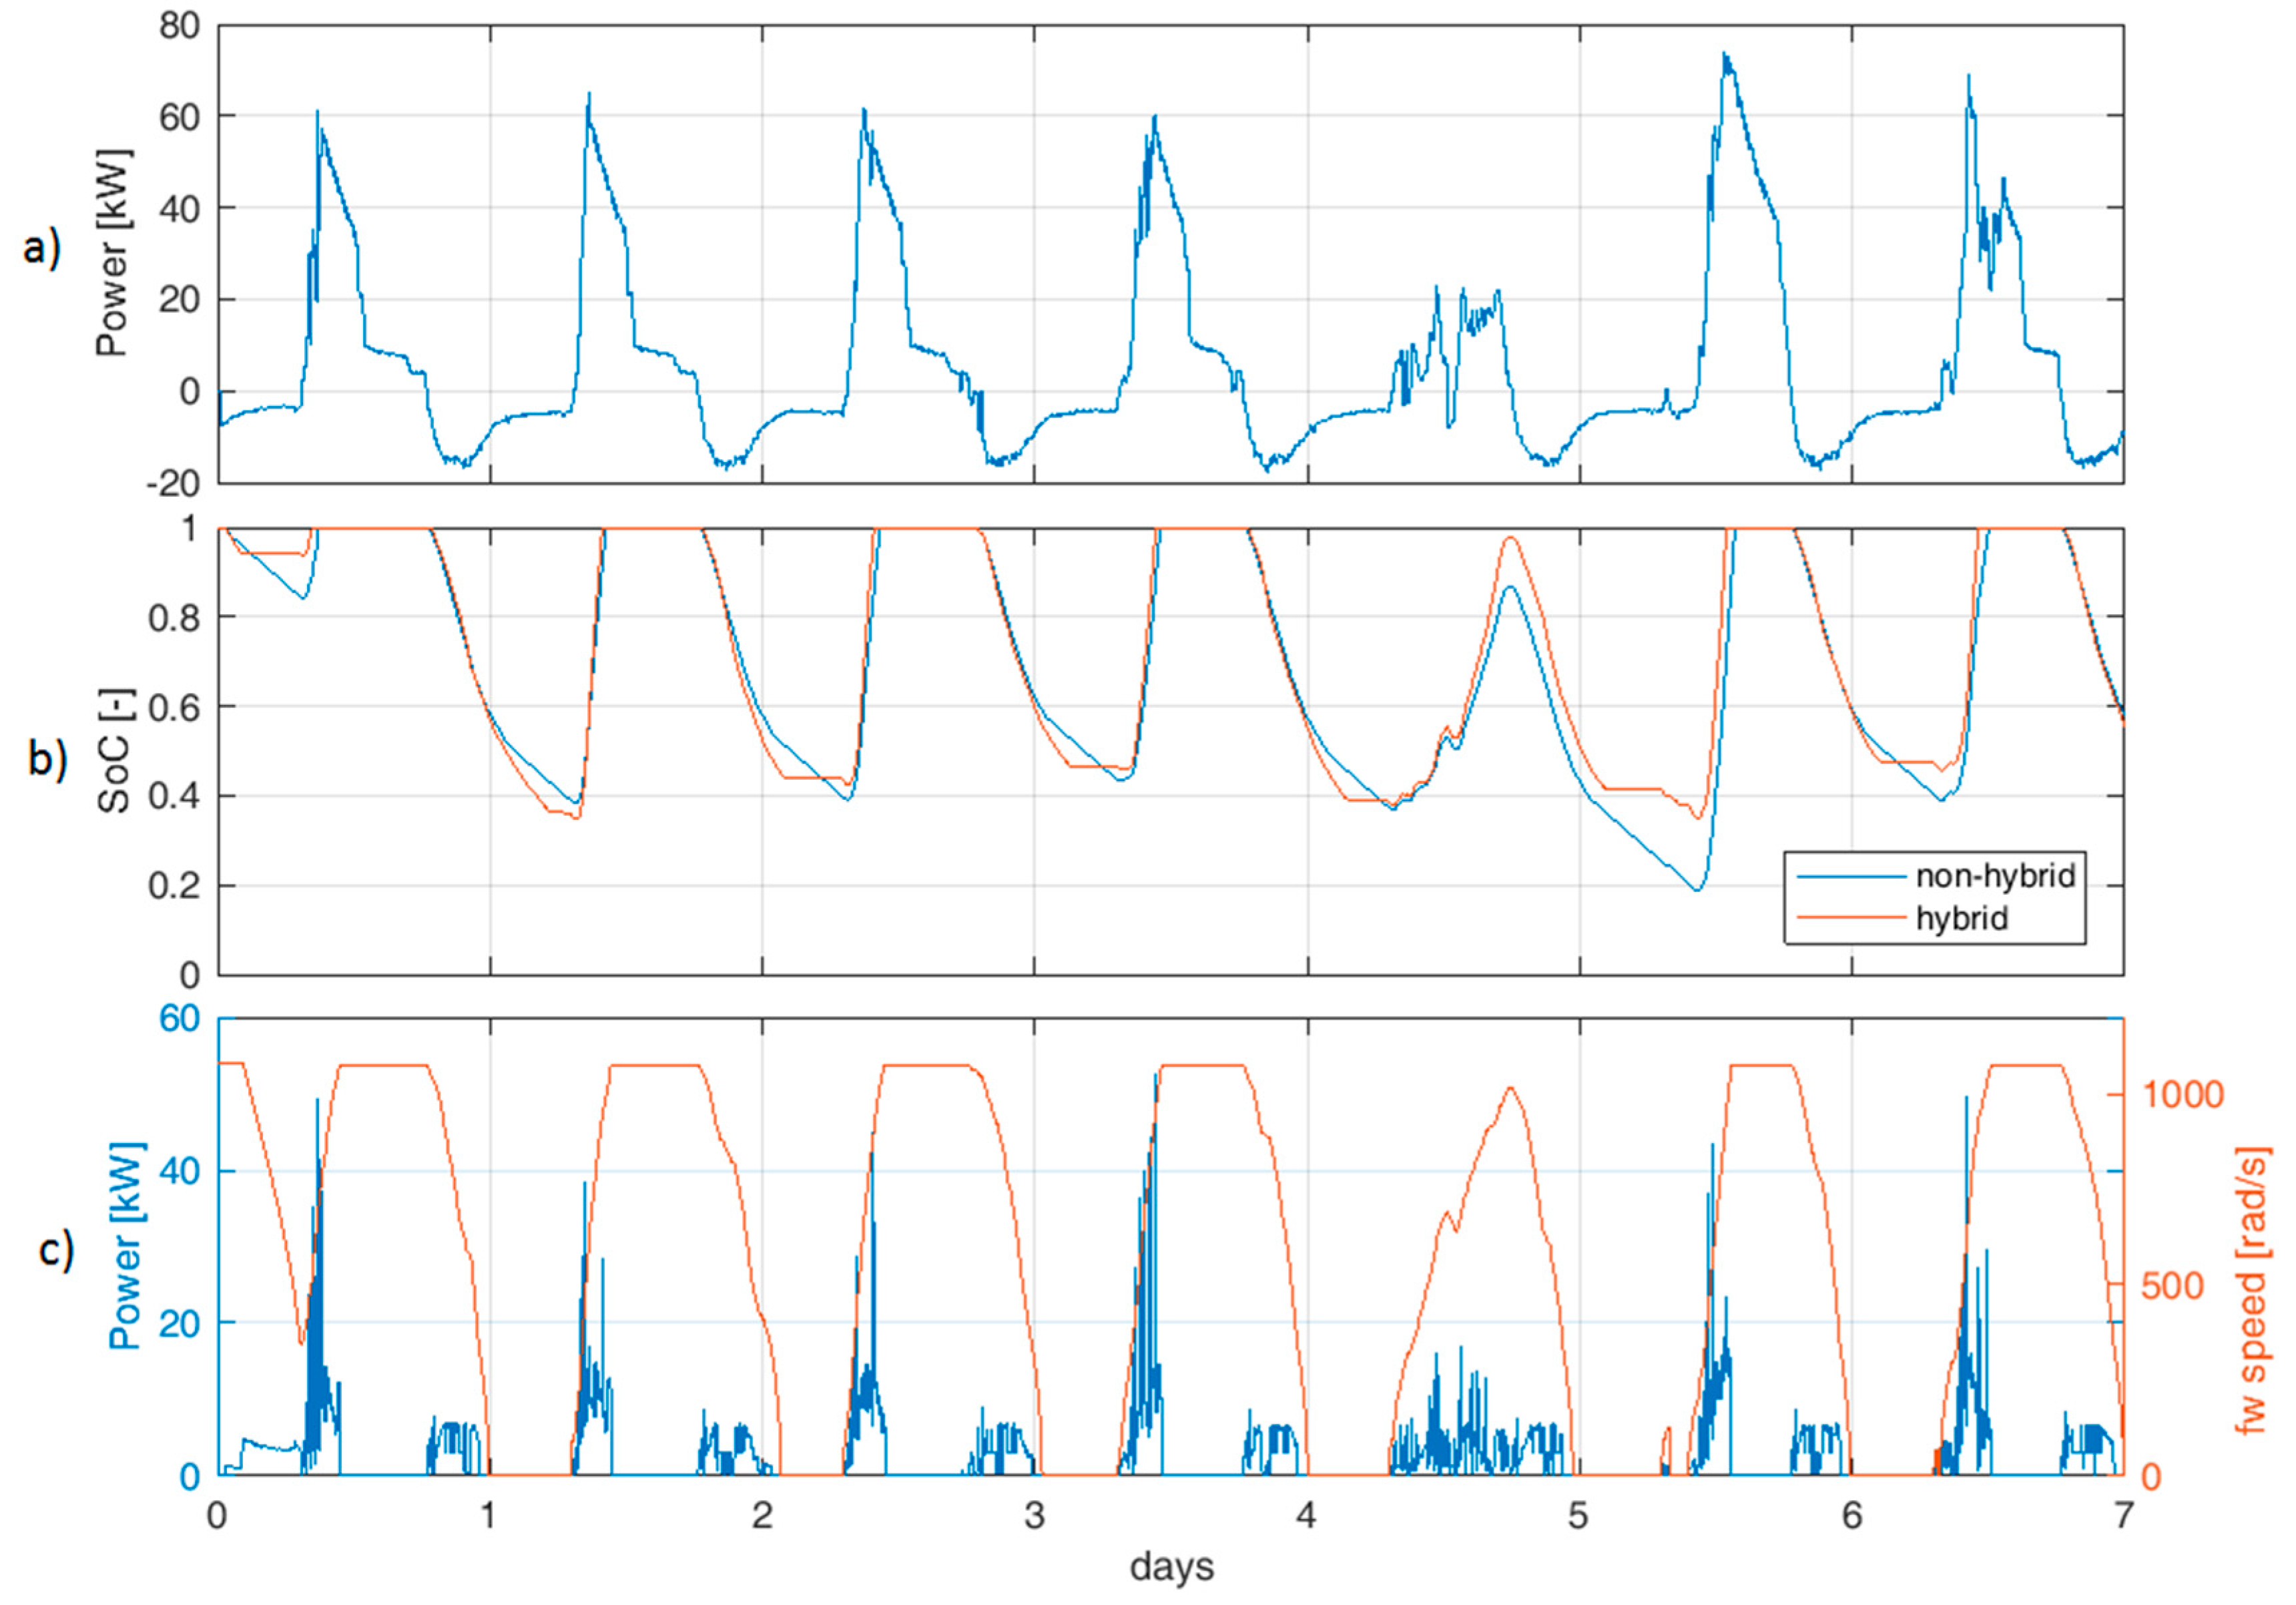
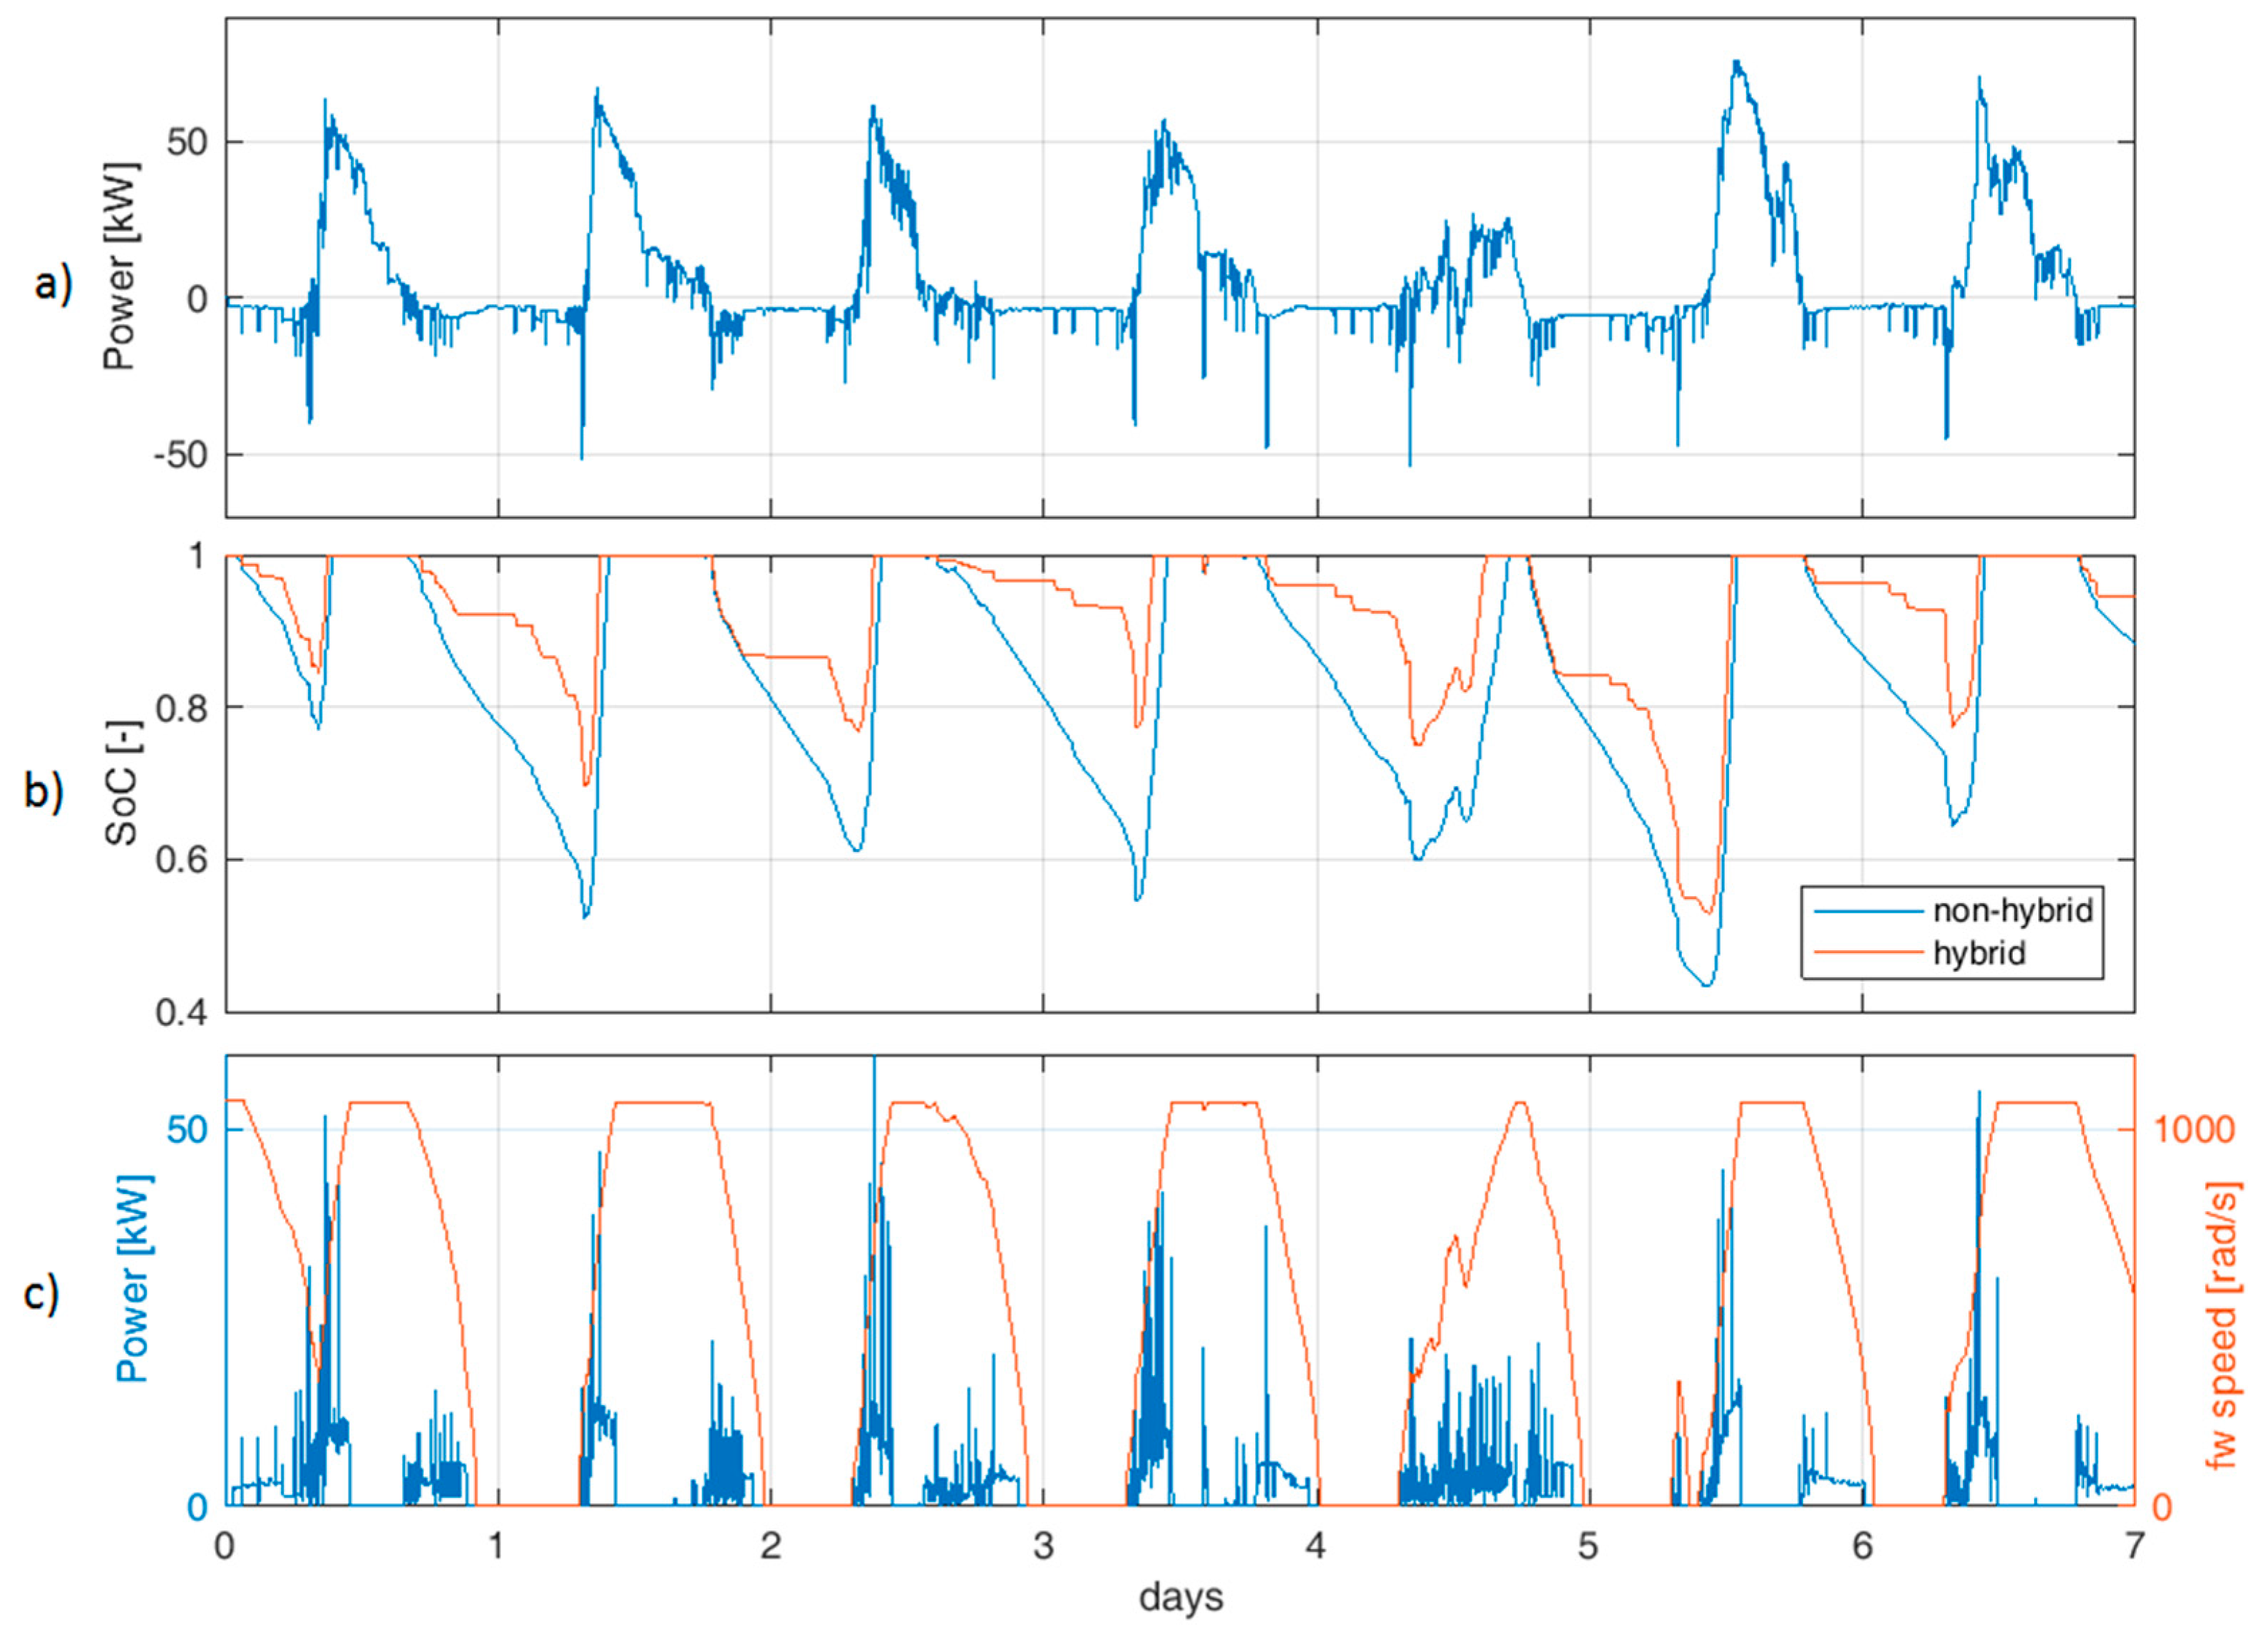
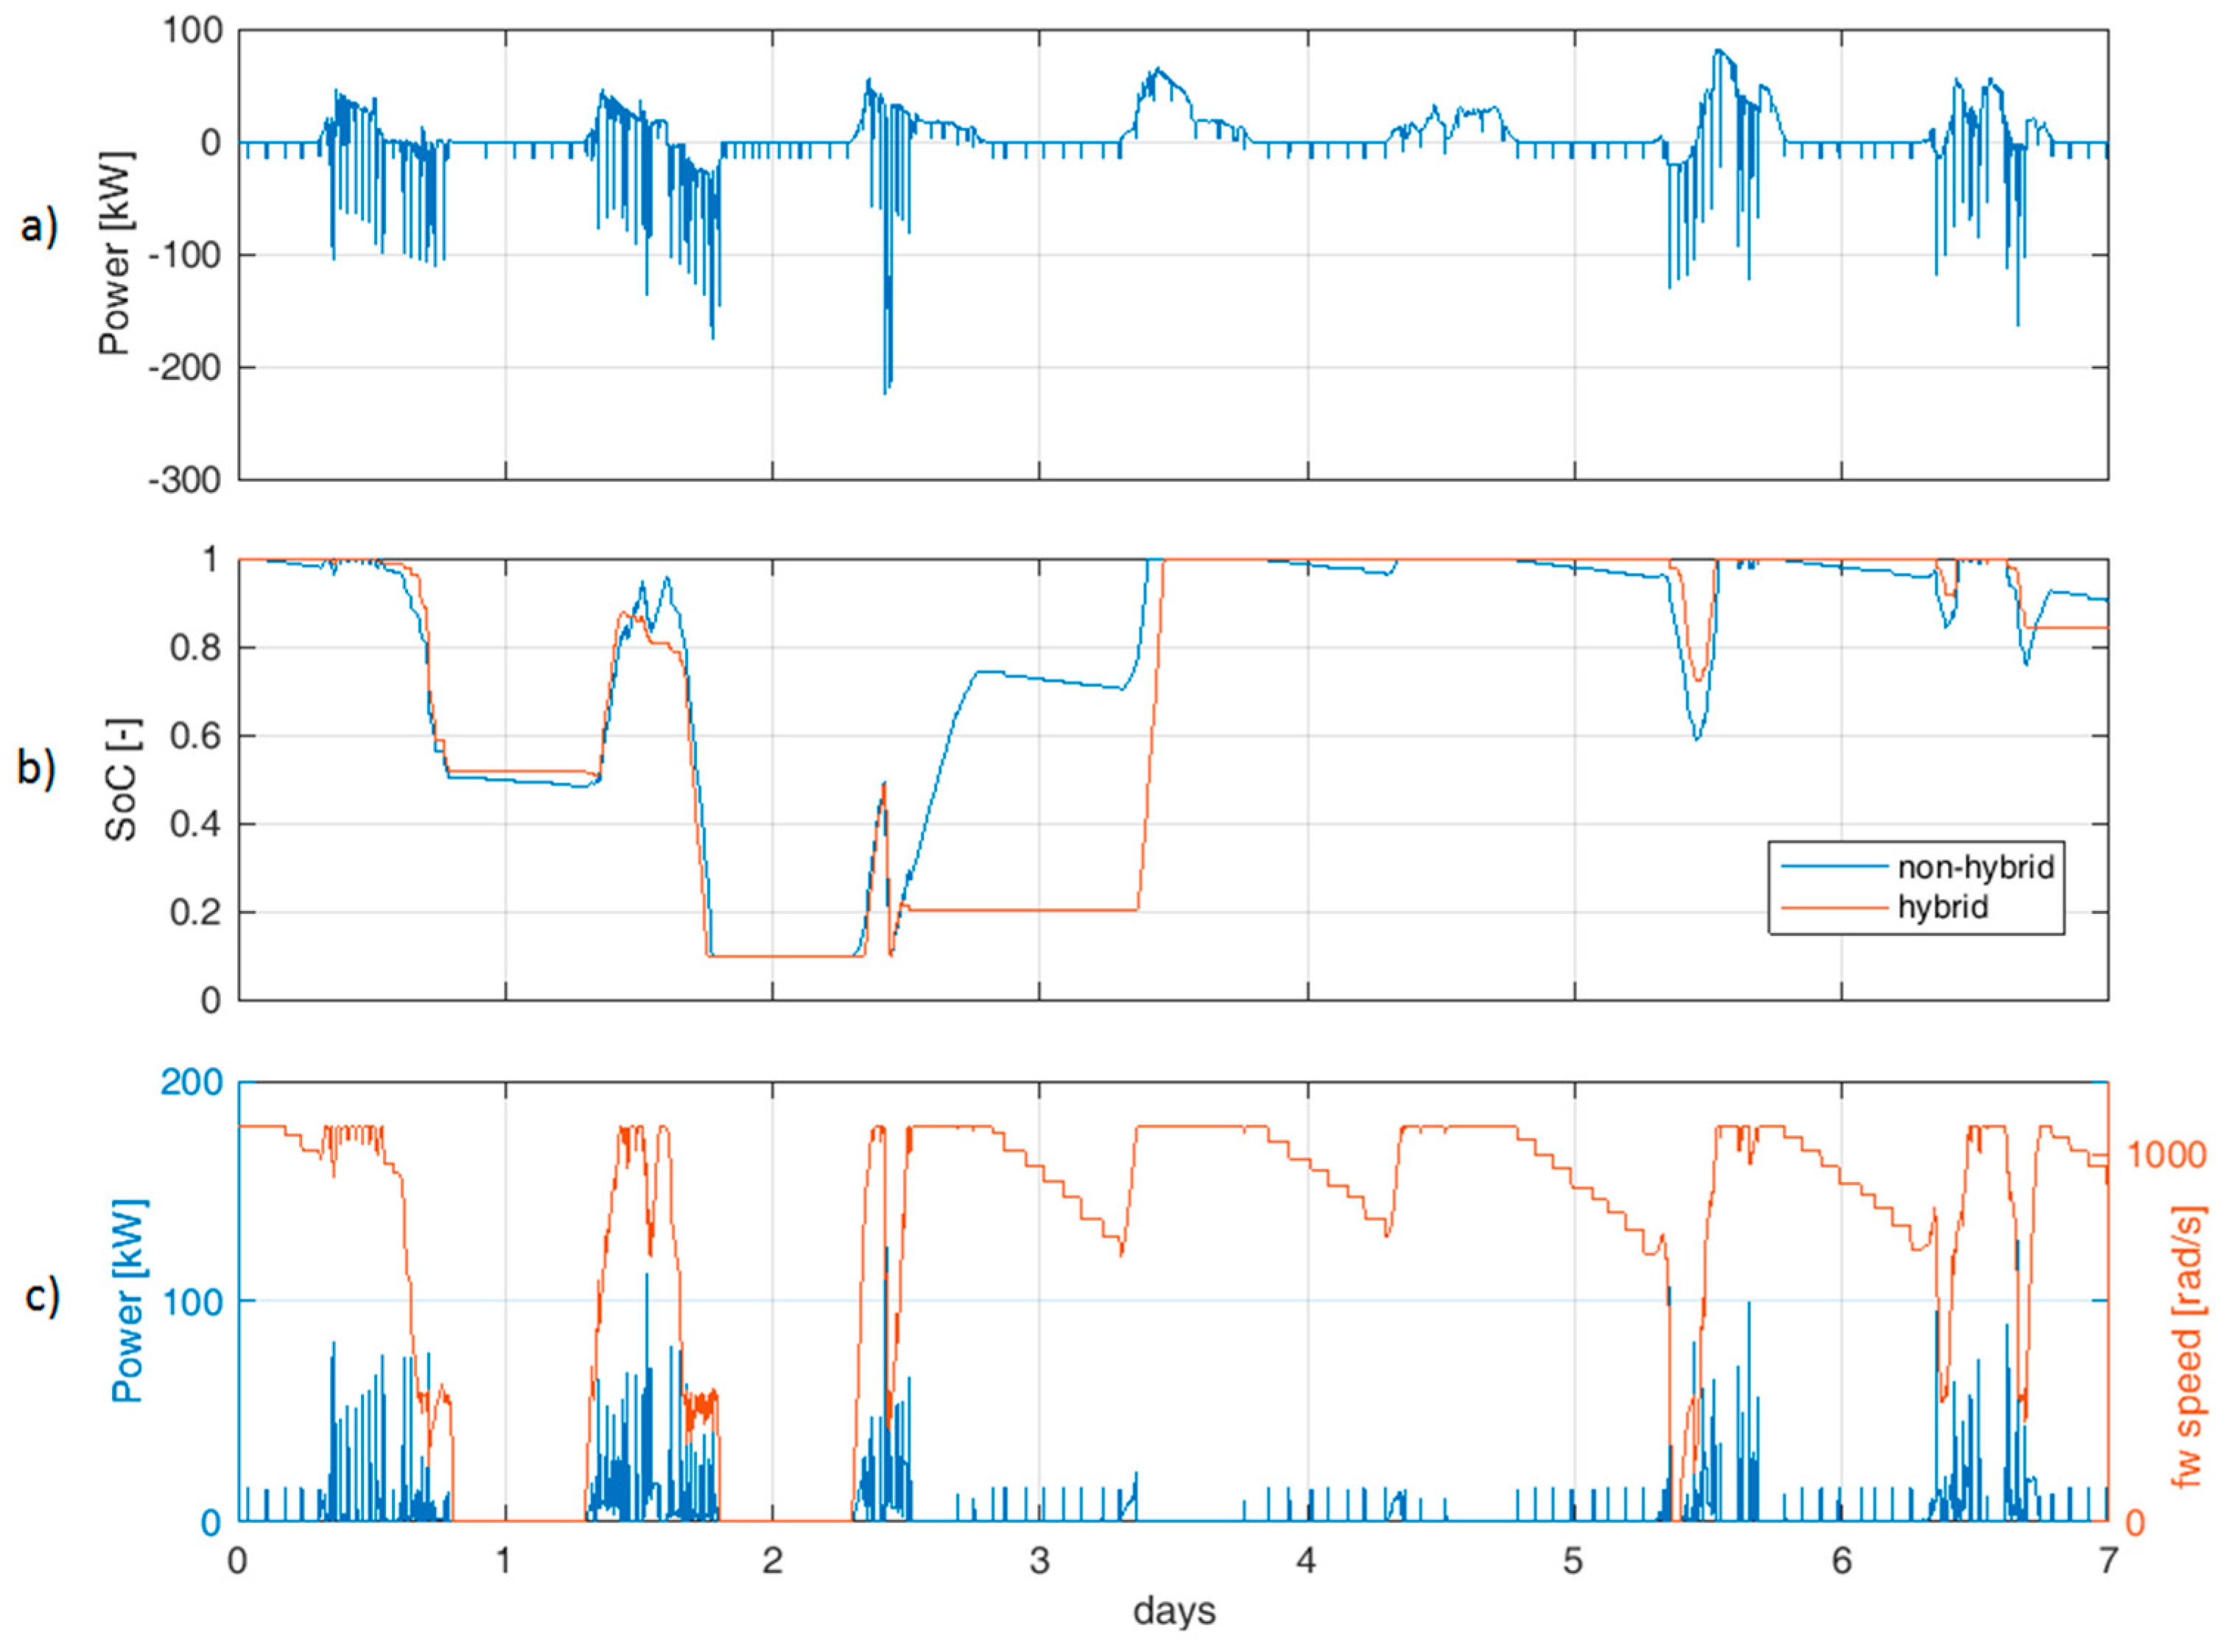
In this regard, it is worthy of note to highlight that the battery charge/discharge pattern is modified, for the investigated storage sections, by the presence of the flywheel which varies the adopted load profile. As example,
Figure 2,
Figure 3 and
Figure 4 compare, for each investigated load, the state of charge profile assessed through simulation for the specific Li-ion battery pack in hybrid configuration 1 to the one determined for the corresponding non-hybrid configuration 2. Also, the flywheel power profile is depicted, to highlight its smoothing function in the hybrid configuration, together with its rotational speed. Moreover, it is to be remarked that
Figure 2,
Figure 3 and
Figure 4 refer to the same week considered in
Figure 1 and depict, together with the battery and flywheel state of charge evolutions, the difference between PV production and the electric load profiles. Analyzing
Figure 2,
Figure 3 and
Figure 4 it can be noted that: i) the SOC profile of configuration 1 is always more stable than the one related to configuration 2; ii) the gap between the hybrid and non-hybrid SOC profiles increases with the fluctuating character of the load, thus with a greater impact of the flywheel on the battery lifespan.
5.3. LCOE Results
Table 9 reports LCOE results related to all investigated configurations in the case when the
load profile is considered. Lead-gel batteries exhibit a high value of LCOE, due to a greater replacement number because of the short lifetime of this solution. Moreover, their higher installed capacity (due to the imposed 40% DoD) with respect to Li-ion and VRFB technologies implies a higher investment cost, nevertheless a lower technology specific cost (€/kWh). The hybrid Li-ion/FESS configuration (#3) seems to be the best solution for the Kitobo microgrid, thanks to the extended lifetime due to the flywheel peak-shaving function on the battery. Low LCOE values for hybrid Li-ion/FESS architectures are ascribable to the particular battery management implemented in the case of flywheel installation. It implies that oscillations are provided by the flywheel; at the same time, as evident in
Table 2 operating charge and discharge battery powers are strongly limited with respect to the technological thresholds. This results in a significant reduction of battery exploitation to satisfy power requests.
Nevertheless, VRFB is a competitive alternative for energy storage in Kitobo, thanks to its long lifetime compared to the other technologies and the possible power and capacity independent sizing. The VRFB results in a LCOE index lower than all not-hybridized Li-ion batteries.
According to the fluctuating residential (
) and industrial (
) load profiles, as shown in
Table 10 and
Table 11, Li-ion-FESS technology (specifically configurations #3 and #1 respectively) seems to be still the best solution among the analyzed cases. Hybridization reduces LCOE costs, making of interest flywheel coupling to Li-ion batteries, since it makes this technology competitive with that of VRFB. It is highlighted that VRFB configurations always exhibit performance (in terms of LCOE index) higher than the not-hybridized Li-ion technology. Moving from
to
and
, the increasing oscillating behavior of the electric load profile (at parity of annual amount of consumed energy) implies higher LCOE index values. This is due for configurations based on Li-ion and Lead- gel technologies for a greater battery exploitation, while for VRFB cases for higher installed power (from 80 kW up to 210 kW as evident in
Table 4). In the case of
adoption, also the installed power of the flywheel triples to satisfy the high-power peak requests.
Finally the obtained results, proving that specific hybrid configurations are more convenient with respect to VRFB varying the considered load profile (as presented in
Table 6,
Table 7 and
Table 8 and
Table 9,
Table 10 and
Table 11 for that which concerns the battery lifespan estimation and LCOE assessment respectively), were analyzed again taking into account possible battery calendar aging. Specifically, in this regard a maximum battery duration of 15 years was considered. The result is the following:
In the case of the
load profile, all hybrid configurations resulted in being more convenient (lower LCOE) than the VRFB (
Table 9), but for all duration greater than 15 years (
Table 6) was determined. Analyzing configurations “3(hybrid)” and “1(hybrid)”, characterized by the lower LCOE values, and substituting the battery pack at the 15th year, we achieve:
for the storage configuration “3(hybrid)”, originally with the lowest LCOE value of 0.3422 €/kWh, the LCOE increases at 0.3713 €/kWh (considering one substitution at the 15th year instead of no replacement). It is to note that this value is still no greater than the one determined for the VRFB (0.3715 €/kWh).
For the configuration “1(hybrid)”, the LCOE decreases from 0.3567 €/kWh to 0.3381 €/kWh. This is due to the fact that, at parity of total investment cost (since one replacement is still required), the cost related to the battery pack substitution is amortized over 15 years instead of 8 years (from year 22 to year 30 according to the data of
Table 6).
In the case where the load profile was considered, two configurations had a LCOE index lower than the VRFB and, for the “1(hybrid)” one, a battery duration lower than 15 years was assessed. So the final conclusion on the greater convenience exhibited by hybrid storage section in terms of LCOE with respect to VRFB can be considered to be not affected by calendar aging.
Finally, under the load profile, two configurations resulted in being more convenient than the VRFB and for both a battery lifespan lower or equal to 15 years was evaluated. Therefore, we can consider also that this result was not affected by calendar aging.
6. Conclusions
Developing countries need to meet a fast-growing energy demand and extend modern energy services to more communities, since the access to electricity is crucial for socio-economic development and to improve people’s health. With regards to Africa, according to IRENA evaluations, the continent could meet nearly a quarter of its energy needs by 2030 through the exploitation of renewable energy. Considering at the same time that about 600 million people in Africa do not have access to electricity and approximately 730 million people rely on traditional uses of biomass, with the dramatic situation in East Africa where only 23% of the population of about 300 million people has access to electricity, the development of a decentralized and flexible energy system based on interconnected MGs fed by renewable sources can be the optimal solution. Ensuring financial sustainability is still a challenge because of the relevant costs of energy storage systems. In this regard IRENA evaluated that only in 2035, thanks to the expected reduction in storage costs, will the related LCOE decrease from the current 0.47–0.92 USD/kWh (0.41–0.81 €/kWh—an exchange €/USD = 1.14 was considered) to 0.19–0.35 USD/kWh (0.17–0.31 €/kWh), making renewable MGs potentially competitive with grid extension. With regards to this scenario, the present study demonstrates, through an organic analysis which considers energy storage technologies usually applied for applications up to hundreds of kW, that technologies hybridization can significantly accelerate this process. Specifically, in the case of Li-ion battery hybridization with a mechanical flywheel, the peak-sheaving function of the flywheel on the battery allows the battery lifespan to be extended largely with a relevant positive effect on replacement costs. Consequently, the LCOE is reduced, from estimations included in the range variation indicated above for conventional solutions, down to about 0.34 €/kWh in the case of hybrid configurations implementing SoA devices (Li-ion battery, flywheel) compared to the real load and PV production profiles measured at the Kitobo MG, considered representative of the East African scenario. It was also proved that when considering more oscillating residential and industrial load profiles, typical of European developed countries, the Li-ion battery/flywheel hybrid configuration still exhibits the lowest LCOE values among the investigated solutions, thus confirming the convenience of this strategy also for the case of the expected socio-economic development of the African communities. It is also of note that the use of low-speed flywheel technology is suitable for applications in developing countries and in the framework of renewable MGs, since it significantly improves the quality of the energy sent to users, as well as the fact that it is characterized by low needed maintenance and independence from climate conditions typical of the installation.

 ,
, 


