Article

Study on the Influence of Temperature, Moisture and Electric Field on the Electrical Conductivity of Oil-Impregnated Pressboard

1
College of Electrical Engineering, Sichuan University, No. 24 Yihuan Road, Chengdu 610065, China
2
State Key Laboratory of Power Grid Environmental Protection, Wuhan 430074, China
*
Author to whom correspondence should be addressed.
Energies 2019, 12(16), 3136; https://doi.org/10.3390/en12163136
Submission received: 8 July 2019 / Revised: 25 July 2019 / Accepted: 9 August 2019 / Published: 15 August 2019
(This article belongs to the Section F: Electrical Engineering)

Abstract

:
The main insulation of converter transformers consists of transformer oil and oil-impregnated pressboard. Under operating conditions, the valve-side winding of the converter transformer is subject to DC voltage components. Therefore, studies on the characteristics of oil-impregnated pressboard conductivity are necessary. In this paper, the temperature, moisture and electric field dependency of pressboard conductivity are investigated based on a specially designed three-electrode experimental chamber, which allows for a variation in temperature ranging from 25 °C to 120 °C and an electric field strength ranging from 0 to 30 kV/mm. The experimental results show that, within the experimental conditions, the conductivity of oil-impregnated pressboard increases exponentially with increasing moisture and temperature. High moisture and temperature will increase both the carrier concentration and carrier mobility, which explains the exponential correspondence. Furthermore, the electric field dependency of the conductivity is more obvious for wet pressboard than for dry pressboard. Protons in the wet pressboard are more easily accelerated by the electric field than the impurity ions in the oil of the dry pressboard, which leads to an obvious electric field dependency of the wet pressboard conductivity.

1. Introduction

The converter transformer is the primary component of high voltage direct current (HVDC) transmission systems, and it is of crucial significance for ensuring safe and optimal design, manufacture, and operation [1,2,3,4]. Since 1954, over 80 HVDC projects have been deployed worldwide, yet failures—especially insulating failures—of the convertor transformer are twice as common as they are in AC transformers [5], partially due to the complex electrical stress on the insulation of the valve-side winding in the converter transformer. In addition to AC voltage, insulating materials (transformer oil and paper/pressboard) in valve-side windings are also subjected to DC voltage. Under composite voltages, the insulation may face new threats, including partial discharge and local overheating [6,7,8]. Since the electrical conductivity of the insulating materials plays a decisive role in the DC electric field distribution and directly affects the insulation structure design and operational stability of the converter transformer, studying the characteristics of oil-pressboard insulation conductivity is of great significance.
Previous studies on the conductivity characteristics of oil-pressboard insulation have mainly centered on transformer oil. For example, Vahidi studied the influence of moisture on the electrical conductivity of natural ester and mineral oil and found that the conductivity of natural ester was two orders of magnitude higher than that of mineral oil [9]. Abedian investigated the temperature effects on the electrical conductivity of dielectric liquids and proposed an empirical correlation that accounts for the variation in the electrical conductivity of dielectric liquids with temperature [10]. Zhou from Tsinghua University studied the influence of electric field, temperature and moisture on the electrical conductivity of transformer oil and obtained qualitative conclusions [11]. However, it should be noted that the oil-pressboard insulation includes both the transformer oil and the pressboard. Thus, studies on the characteristics of transformer oil conductivity do not fully elucidate the conduction phenomenon of oil-pressboard composite insulation.
The existing research on the conductivity characteristics of oil-impregnated pressboard is basically limited to the temperature dependency only and is mostly conducted under very low electric field strength. For instance, Żukowski analyzed the AC conductivity in moist oil-impregnated insulation pressboard under different temperatures but without consideration of electric field strength [12,13]. Li determined that the resistivity of oil-impregnated pressboard varies with temperature and electric field strength; however, the largest adopted electric field strength was 10 kV/mm, which is lower than the real electric field strength that the pressboard must handle, and the influence of moisture was ignored [14]. In 1994, Takahashi studied the influence of electrical stress on the conductivity of oil-impregnated pressboard; however, the results were qualitative and cannot be adopted to determine the electric field strength within oil-pressboard insulation [15]. In real converter transformers, the pressboard of the valve-side windings needs to handle a very strong DC electric field, normally 107 V/m or higher [16]. Under such a strong electric field, the conductivity of the oil-impregnated pressboard will exhibit certain characteristics. However, quantitative research on the temperature and moisture dependency of pressboard conductivity under high electric field strength is rarely found in the literature, which undoubtedly limits the determination of the electric field strength with the oil-pressboard insulation and restricts the optimization design of the insulation structure of converter transformers.
In this paper, the conductivity characteristics and conduction mechanism of oil-impregnated pressboard under different temperatures, moisture contents and electric field strengths were studied. The calculation formula of pressboard conductivity was derived with consideration of the above factors. Based on the results, we analyzed the source of the carrier and the corresponding physical process within the oil-impregnated pressboard under each condition. The derived results may help elucidate the conduction phenomenon of oil-pressboard insulation.

2. Experimental Descriptions

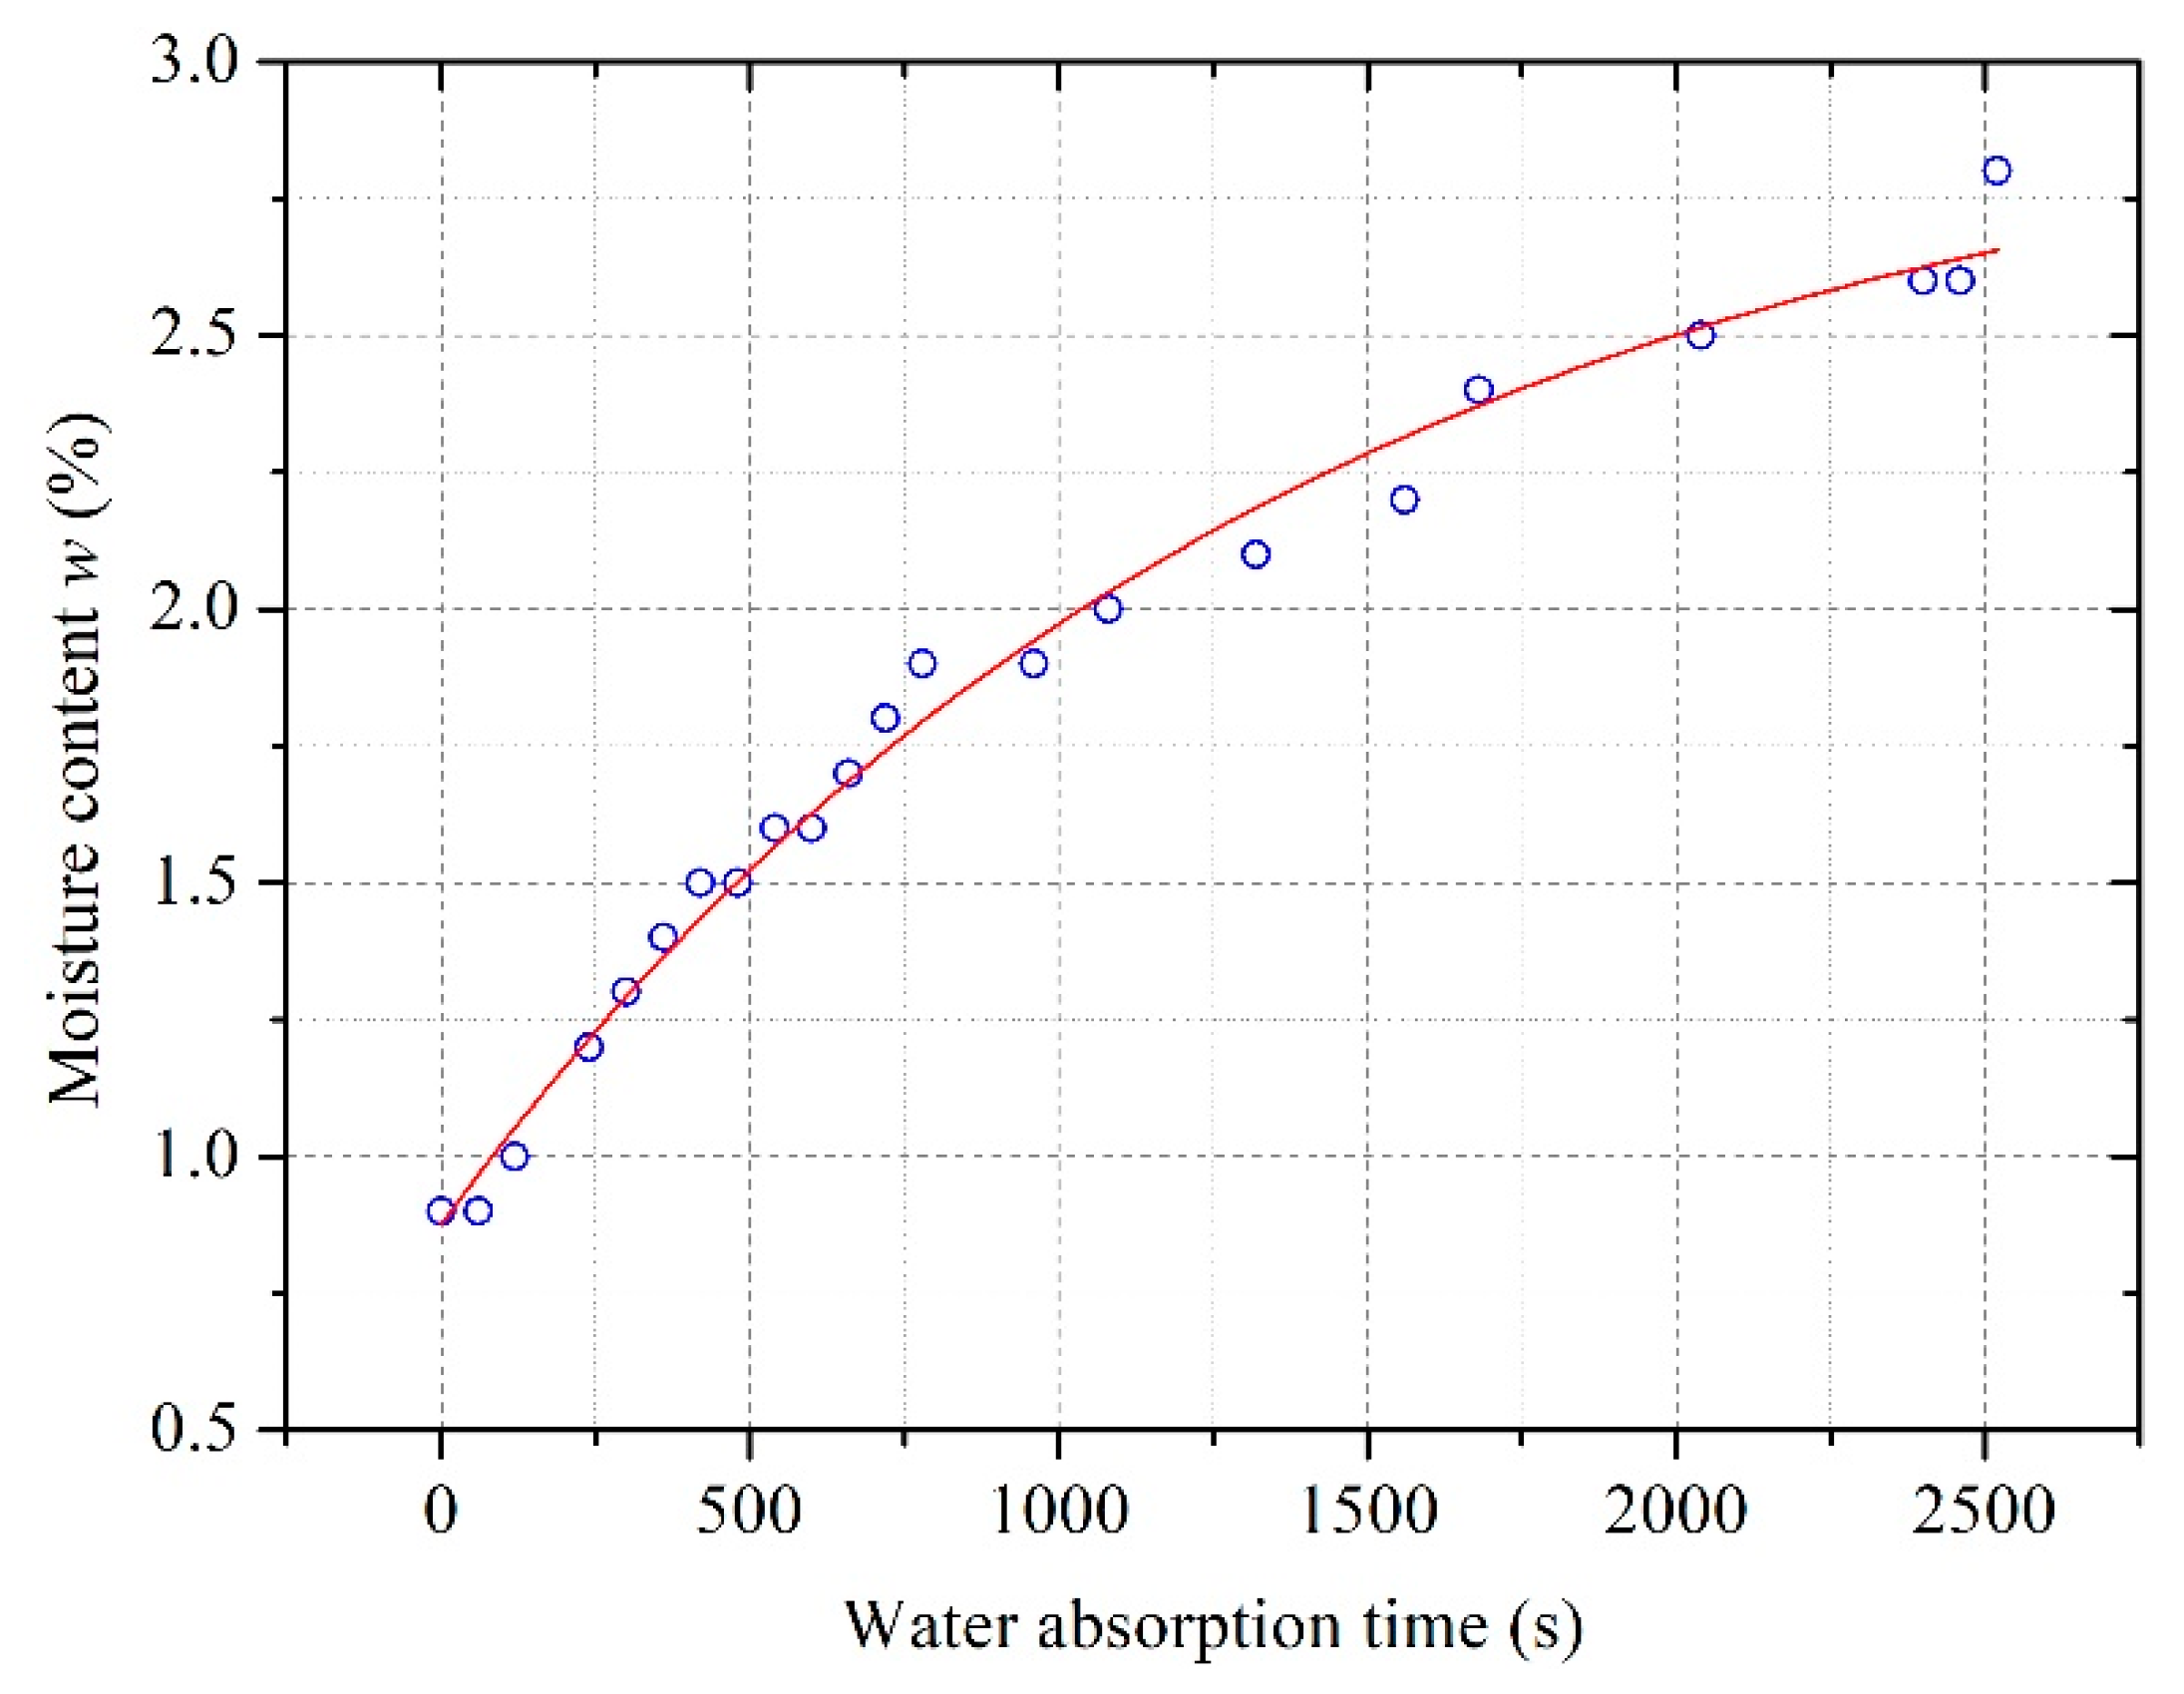
2.1. Sample Preparation

Oil and pressboard properties must be known a priori to investigate the conductivity characteristics of oil-pressboard insulation. The transformer oil we adopted in the experiment was KI25X oil manufactured by the Kunlun Company. The characteristics of the oil are listed in Table 1. The pressboard we used, had a thickness of 0.5 mm, a density of 1.15 g/cm3, a relative permittivity of 4.3, and a volume resistivity after impregnation of approximately 1014 Ω∙m, and was produced by the TaiZhou Weidmann Corporation. The properties of the oil and pressboard were measured based on IEC (International Electrotechnical Commission) standards.
Before the experiment, the pressboard was cut into 100 mm × 100 mm square samples and dried for 48 h in a vacuum drying oven at 80 °C. After being dried, the samples were placed in a humidity chamber (temperature 30 °C, relative humidity 50%) to absorb water. By controlling the duration of the water absorption process, pressboard samples with different moisture contents can be derived. Figure 1 shows the relationship between the duration of water absorption and the moisture content of the pressboard samples.
After absorbance, the pressboard samples were placed in an evacuated chamber. Degassed dry oil was then injected into the chamber to impregnate the pressboard samples. For full impregnation, the samples were left in the oil for another 24 h prior to the experiment. Note that the volume of the oil absorbed by the pressboard sample was very small, and water in oil was considered to have no influence on the moisture content of the pressboard.

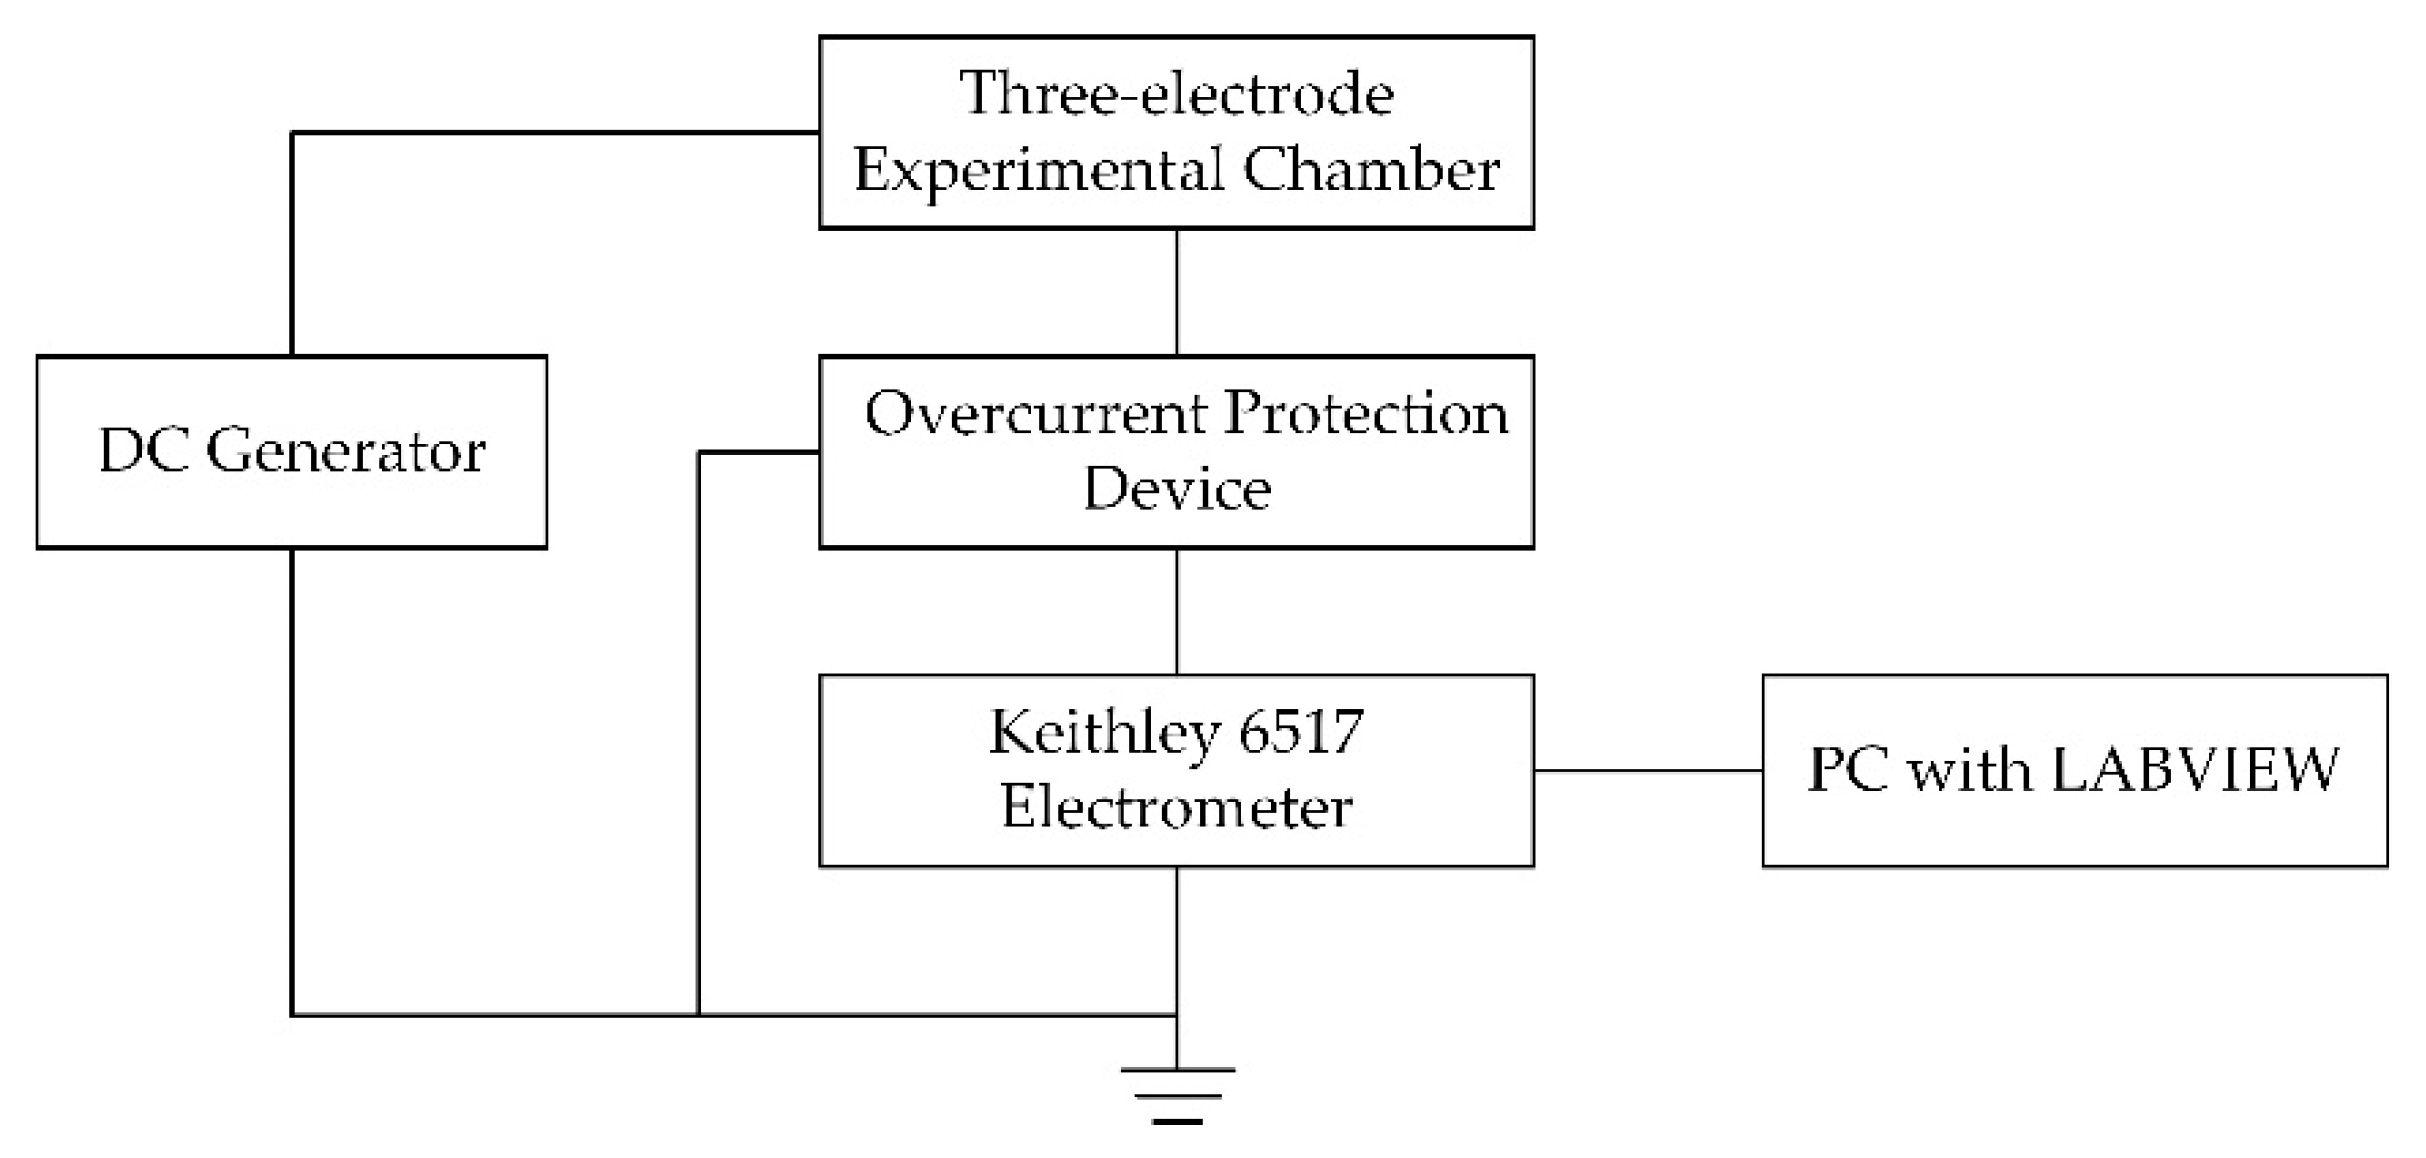
2.2. Experimental Setup

Figure 2 shows a schematic diagram of the conductivity measurement circuit, which mainly consists of five parts: A DC generator, a three-electrode experimental chamber, an overcurrent protection device, an electrometer and a computer. The input end of the three-electrode experimental chamber was connected to a high voltage DC generator. The output end of the chamber was connected to a Keithley 6517 electrometer via an overcurrent protection device. The Keithley 6517 electrometer was used to measure the conduction current of the pressboard, whereas a computer connected to the Keithley 6517 was used to automatically convert the conduction current into the conductivity of the pressboard. Additional work was performed to ensure that the measurement circuit was noise-free and to measure the leakage current within the pressboard sample successfully.
To acquire the conductivity of the oil-impregnated pressboard under various conditions, we designed a three-electrode experimental chamber, as shown in Figure 3. The fundamental design of the chamber was based on a three-electrode model according to IEC 60093-2014. The sizes of the three electrodes are shown in Table 2. The three electrodes were encapsulated with polytetrafluoroethylene (PTFE), and the electrode slightly protruded from the PTFE plane. The measuring electrode and the shielding electrode were supported by springs to ensure close contact between the electrode and the pressboard sample. The outer casing of the PTFE was shielded by a metal shell. The upper and lower shells were flanged to ensure that the modules were closely connected during the experiment. Note that, due to the lack of an independent heat source, the experimental chamber needed to be heated as a whole when studying the temperature dependency of the conductivity.

2.3. Experimental Methods

When measuring the conductivity of the pressboard sample, the upper and lower shells of the chamber were first fastened by bolts to ensure close contact between the electrodes and the pressboard sample. Then, a Keithley 6517 electrometer was connected to the measuring electrode via an overcurrent protection device, and the shielding electrode was connected to the ground to prevent the surface current from affecting the experimental results. Afterwards, DC voltage was applied to the spherical electrode in the figure so that the leakage current could be measured by the electrometer through the pressboard bulk. Finally, the conductivity of the pressboard was calculated, as the leakage current and electrode sizes were known parameters.
When DC voltage was applied, the pressboard experienced a polarization process, during which the leakage current measured by the electrometer gradually decreased. The leakage current became stable and equal to the conduction current of the pressboard only after the polarization process was completed, which was used to calculate the conductivity of the pressboard. Therefore, an additional experiment was conducted to determine the relaxation time of pressboard polarization. Figure 4 shows the experimental results. According to the figure, the polarization of the pressboard was completed within 8 min (relaxation time) under all experimental conditions; thus, we used the leakage current measured at 10 min (>relaxation time) to calculate pressboard conductivity. The calculation was based on IEC 60093-2014.

3. Experimental Results

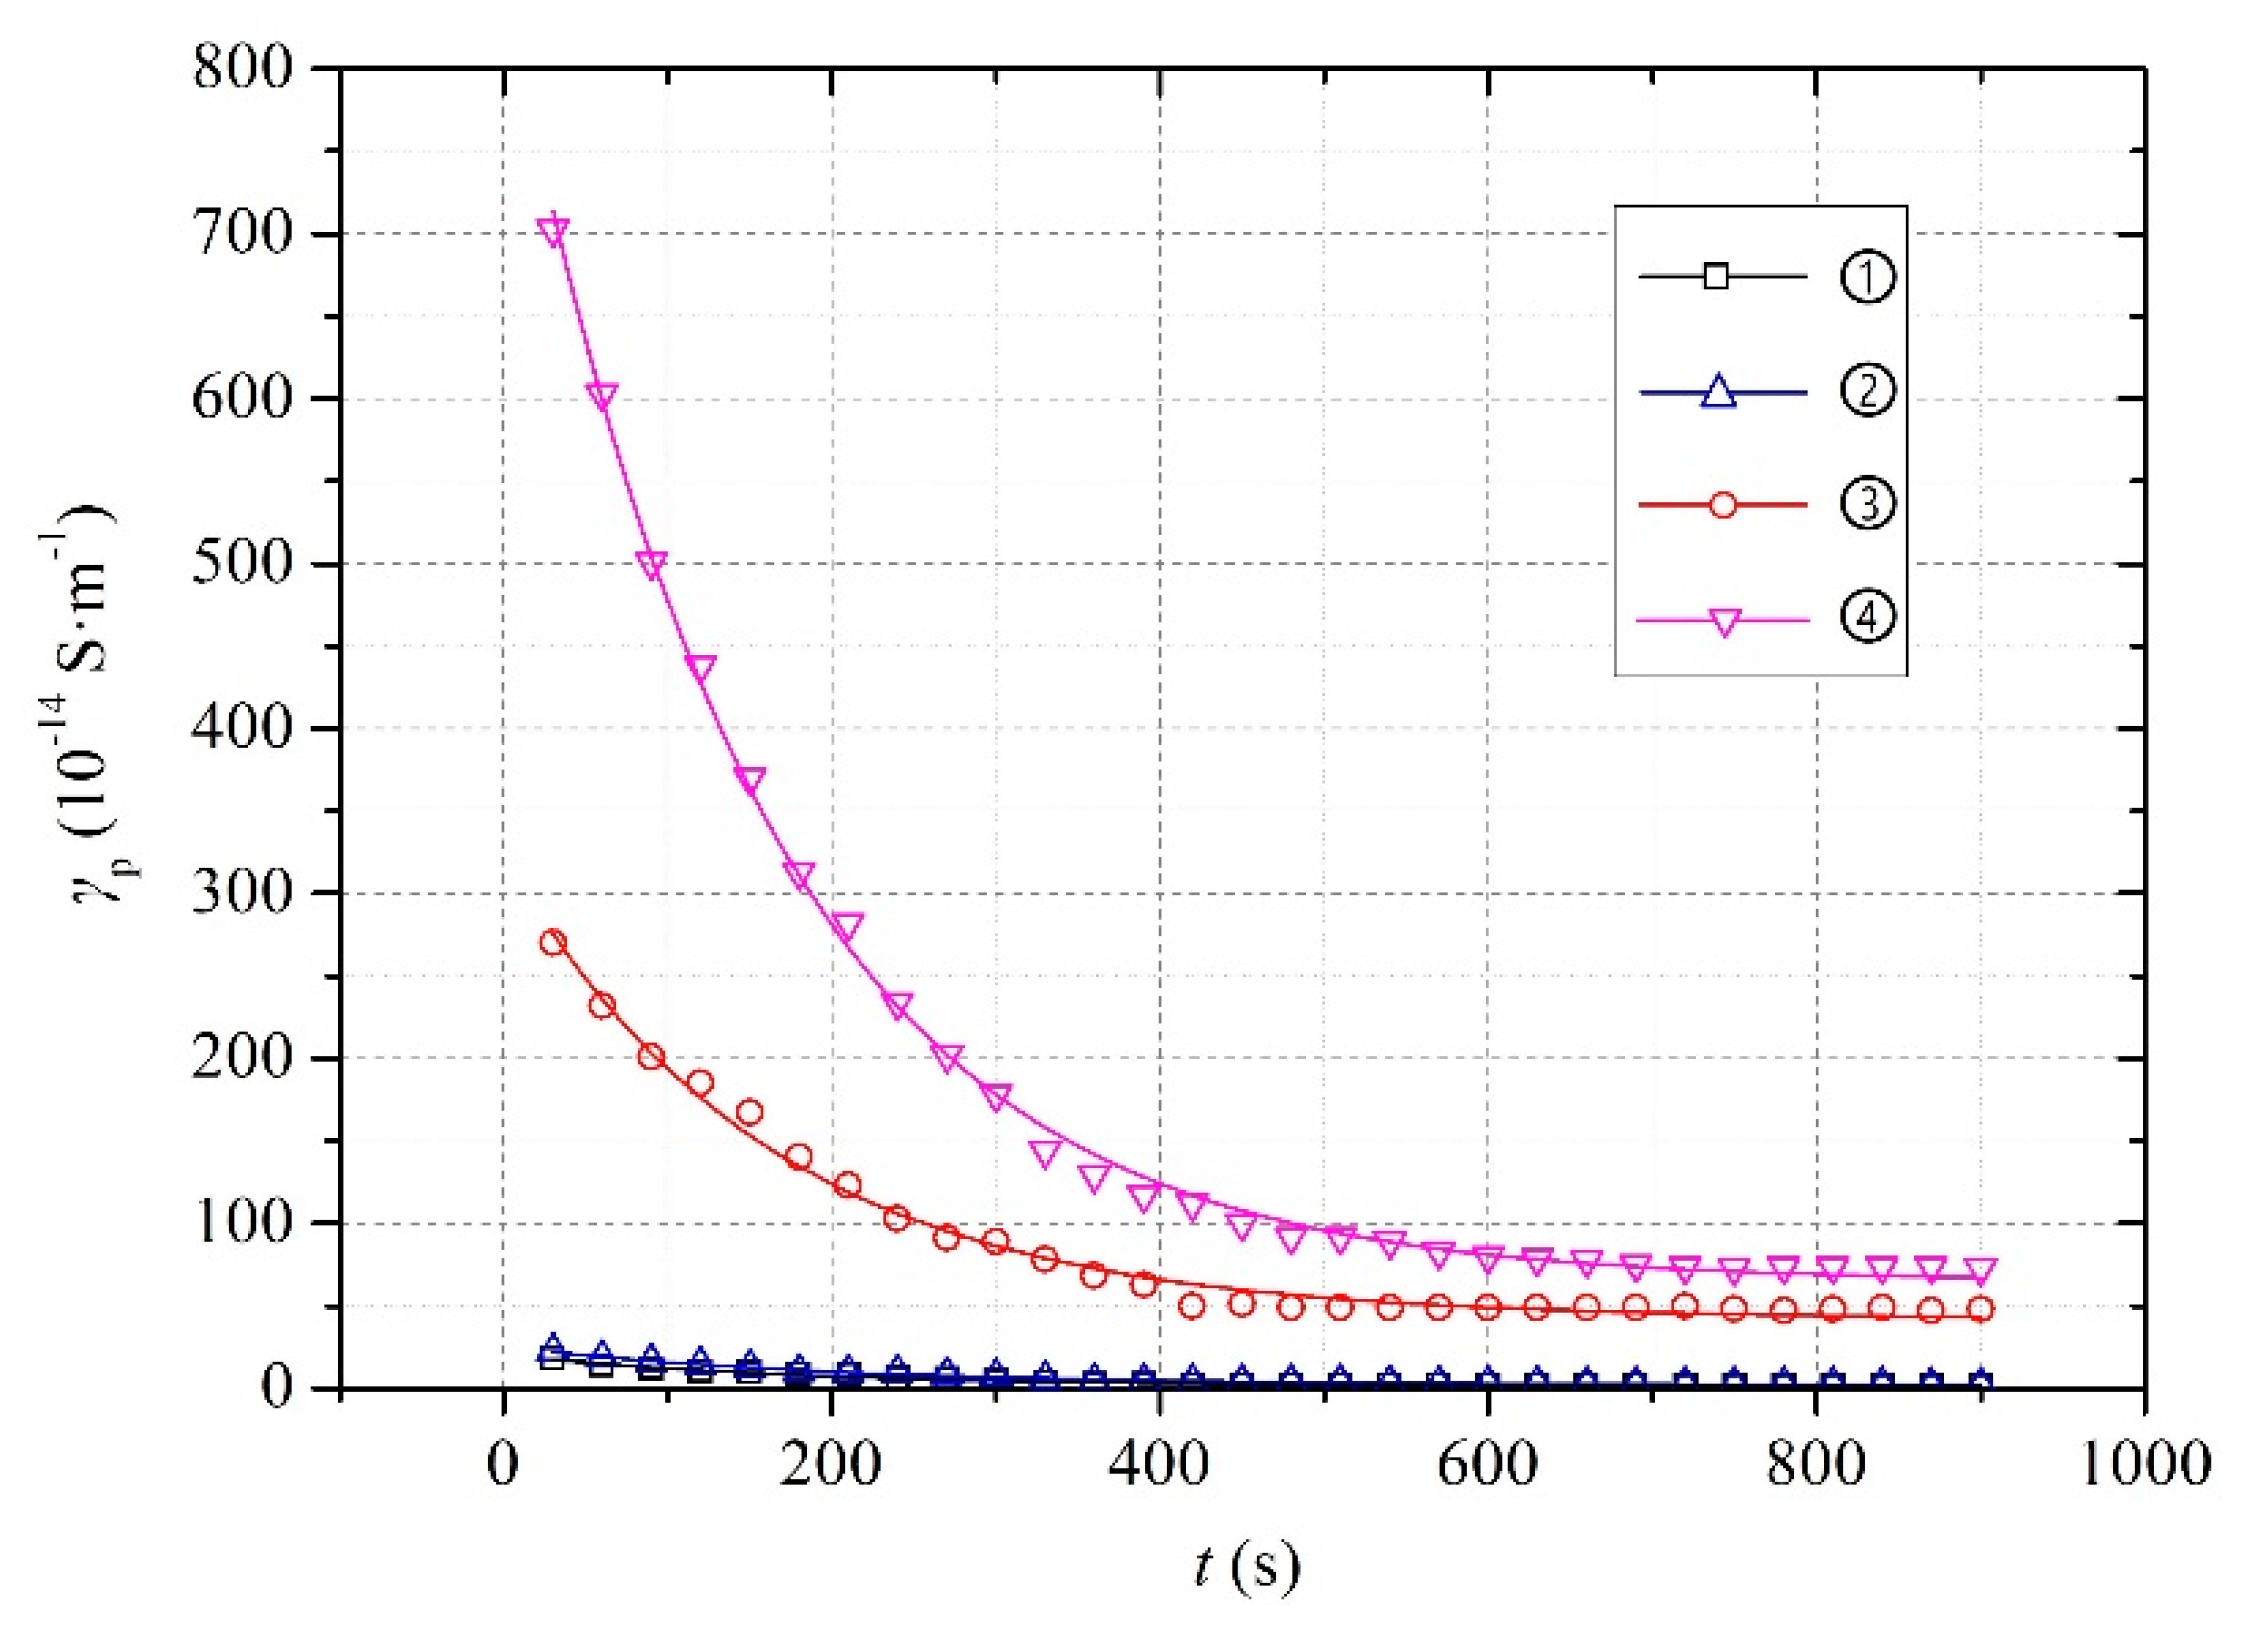
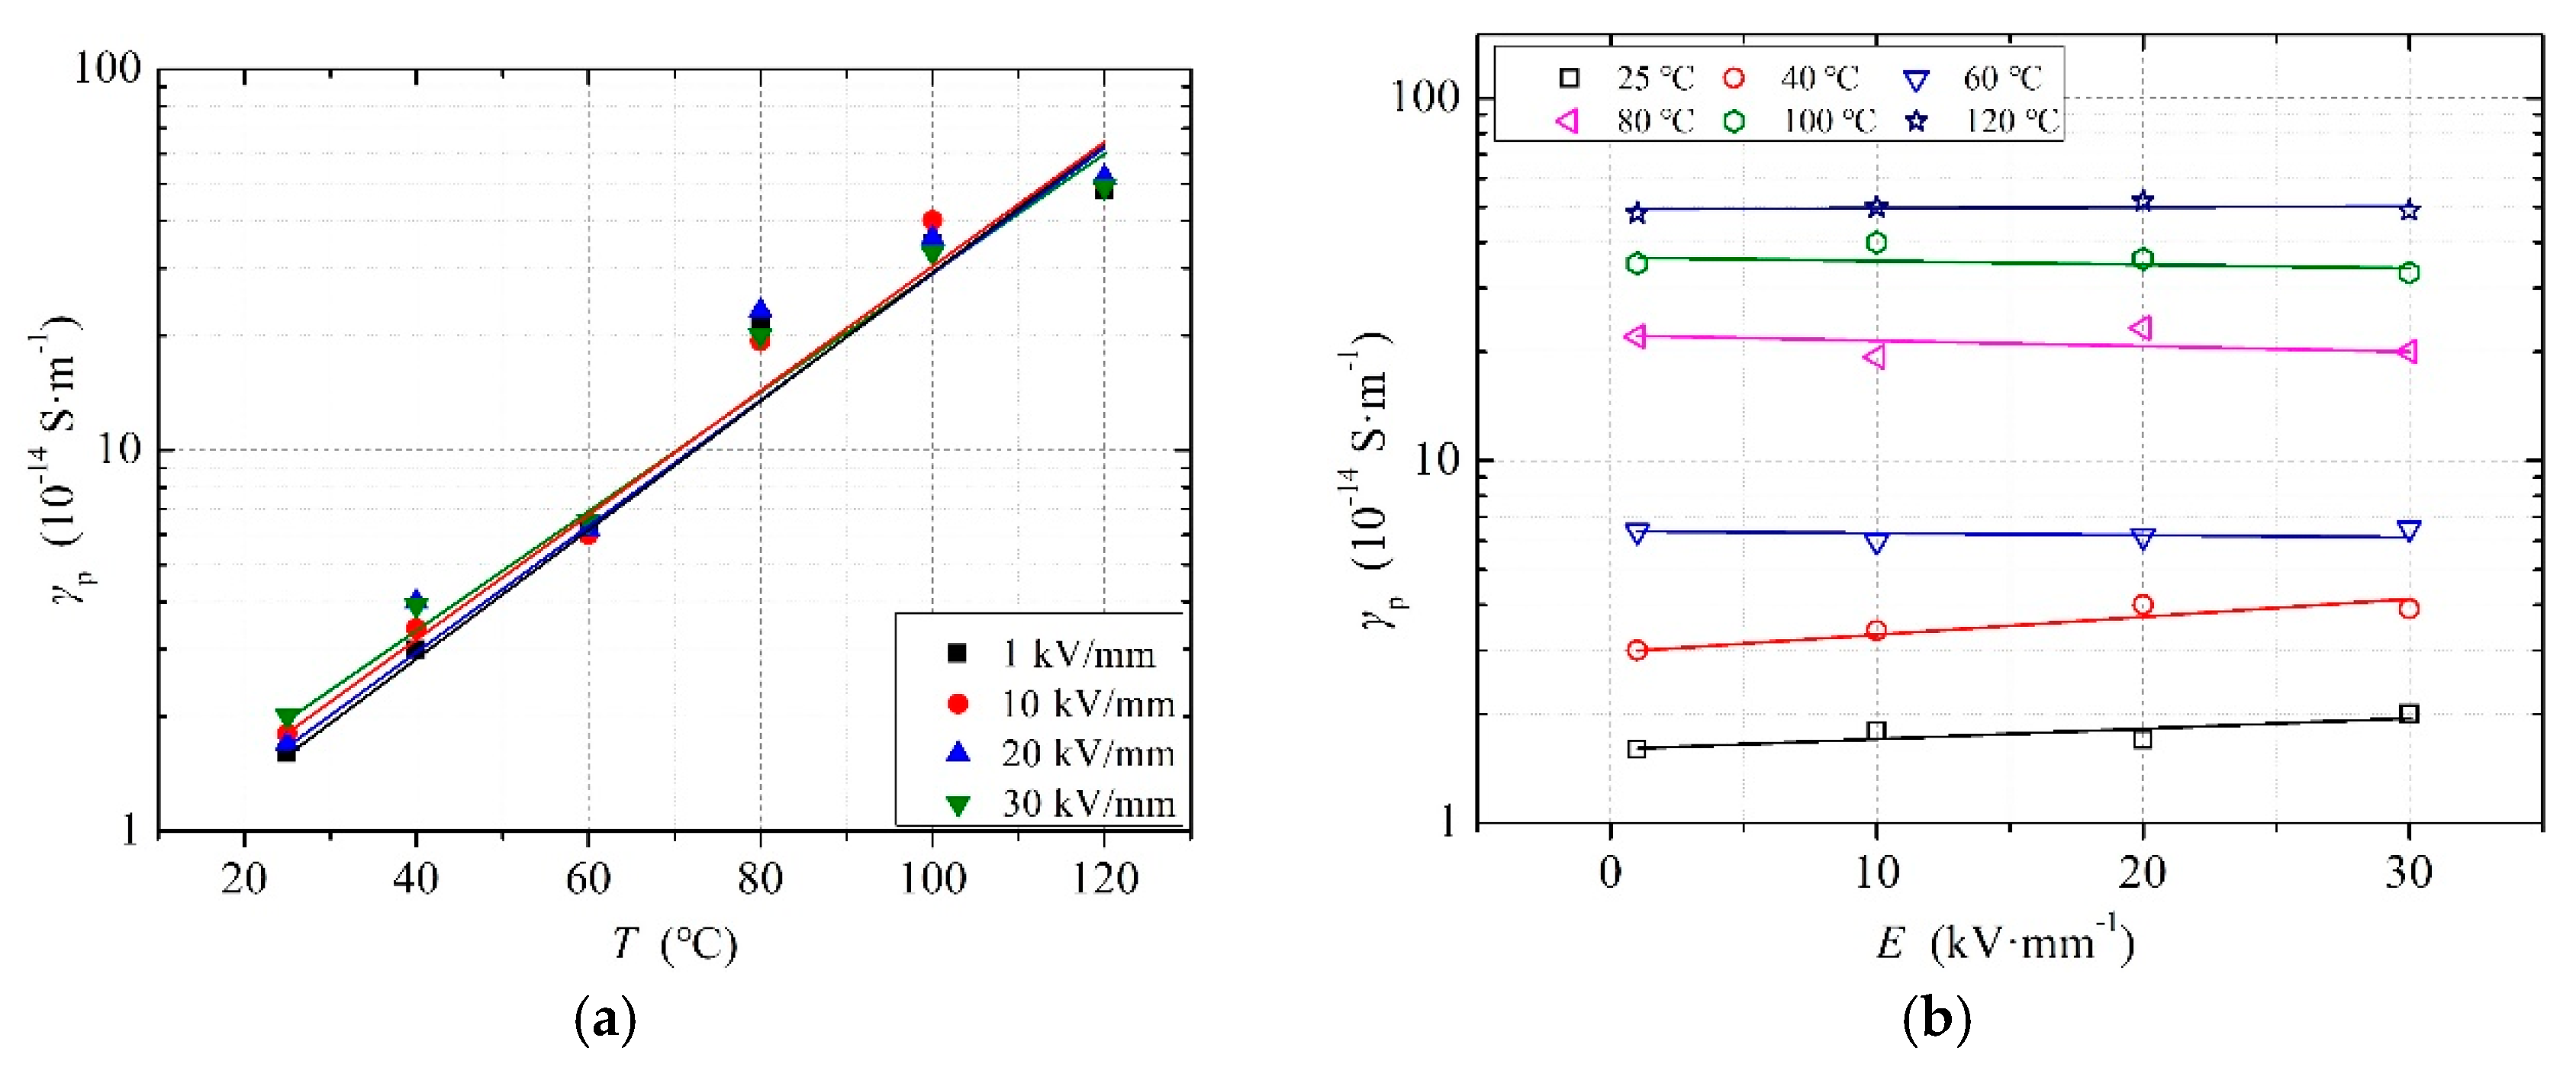
3.1. Temperature and Electric Field Dependency of the Conductivity

In this part, we studied the temperature and electric field dependency of pressboard conductivity. Before the experiment, the pressboard samples were fully dried (w < 1%) and well impregnated. The experimental results are shown in Figure 5. As the temperature increased, the conductivity of the pressboard increased. However, as the electric field strength increased, the pressboard conductivity barely changed. At 1 kV/mm and 25 °C, the conductivity of the pressboard was 1.6 × 10⁻¹⁴ S/m. When the temperature increased to 120 °C, the conductivity of the pressboard increased to 48.2 × 10⁻¹⁴ S/m. Meanwhile, when the temperature remained at 25 °C and the electric field strength increased to 30 kV/mm, the pressboard conductivity became 2.1 × 10⁻¹⁴ S/m, with little change compared with the result at 1 kV/mm. In general, the conductivity of the pressboard changed significantly with temperature and changed little with electric field strength. The calculation of pressboard conductivity can therefore be simplified by only taking temperature into consideration. Further analysis of the results in Figure 5 will be presented in Section 4.1.

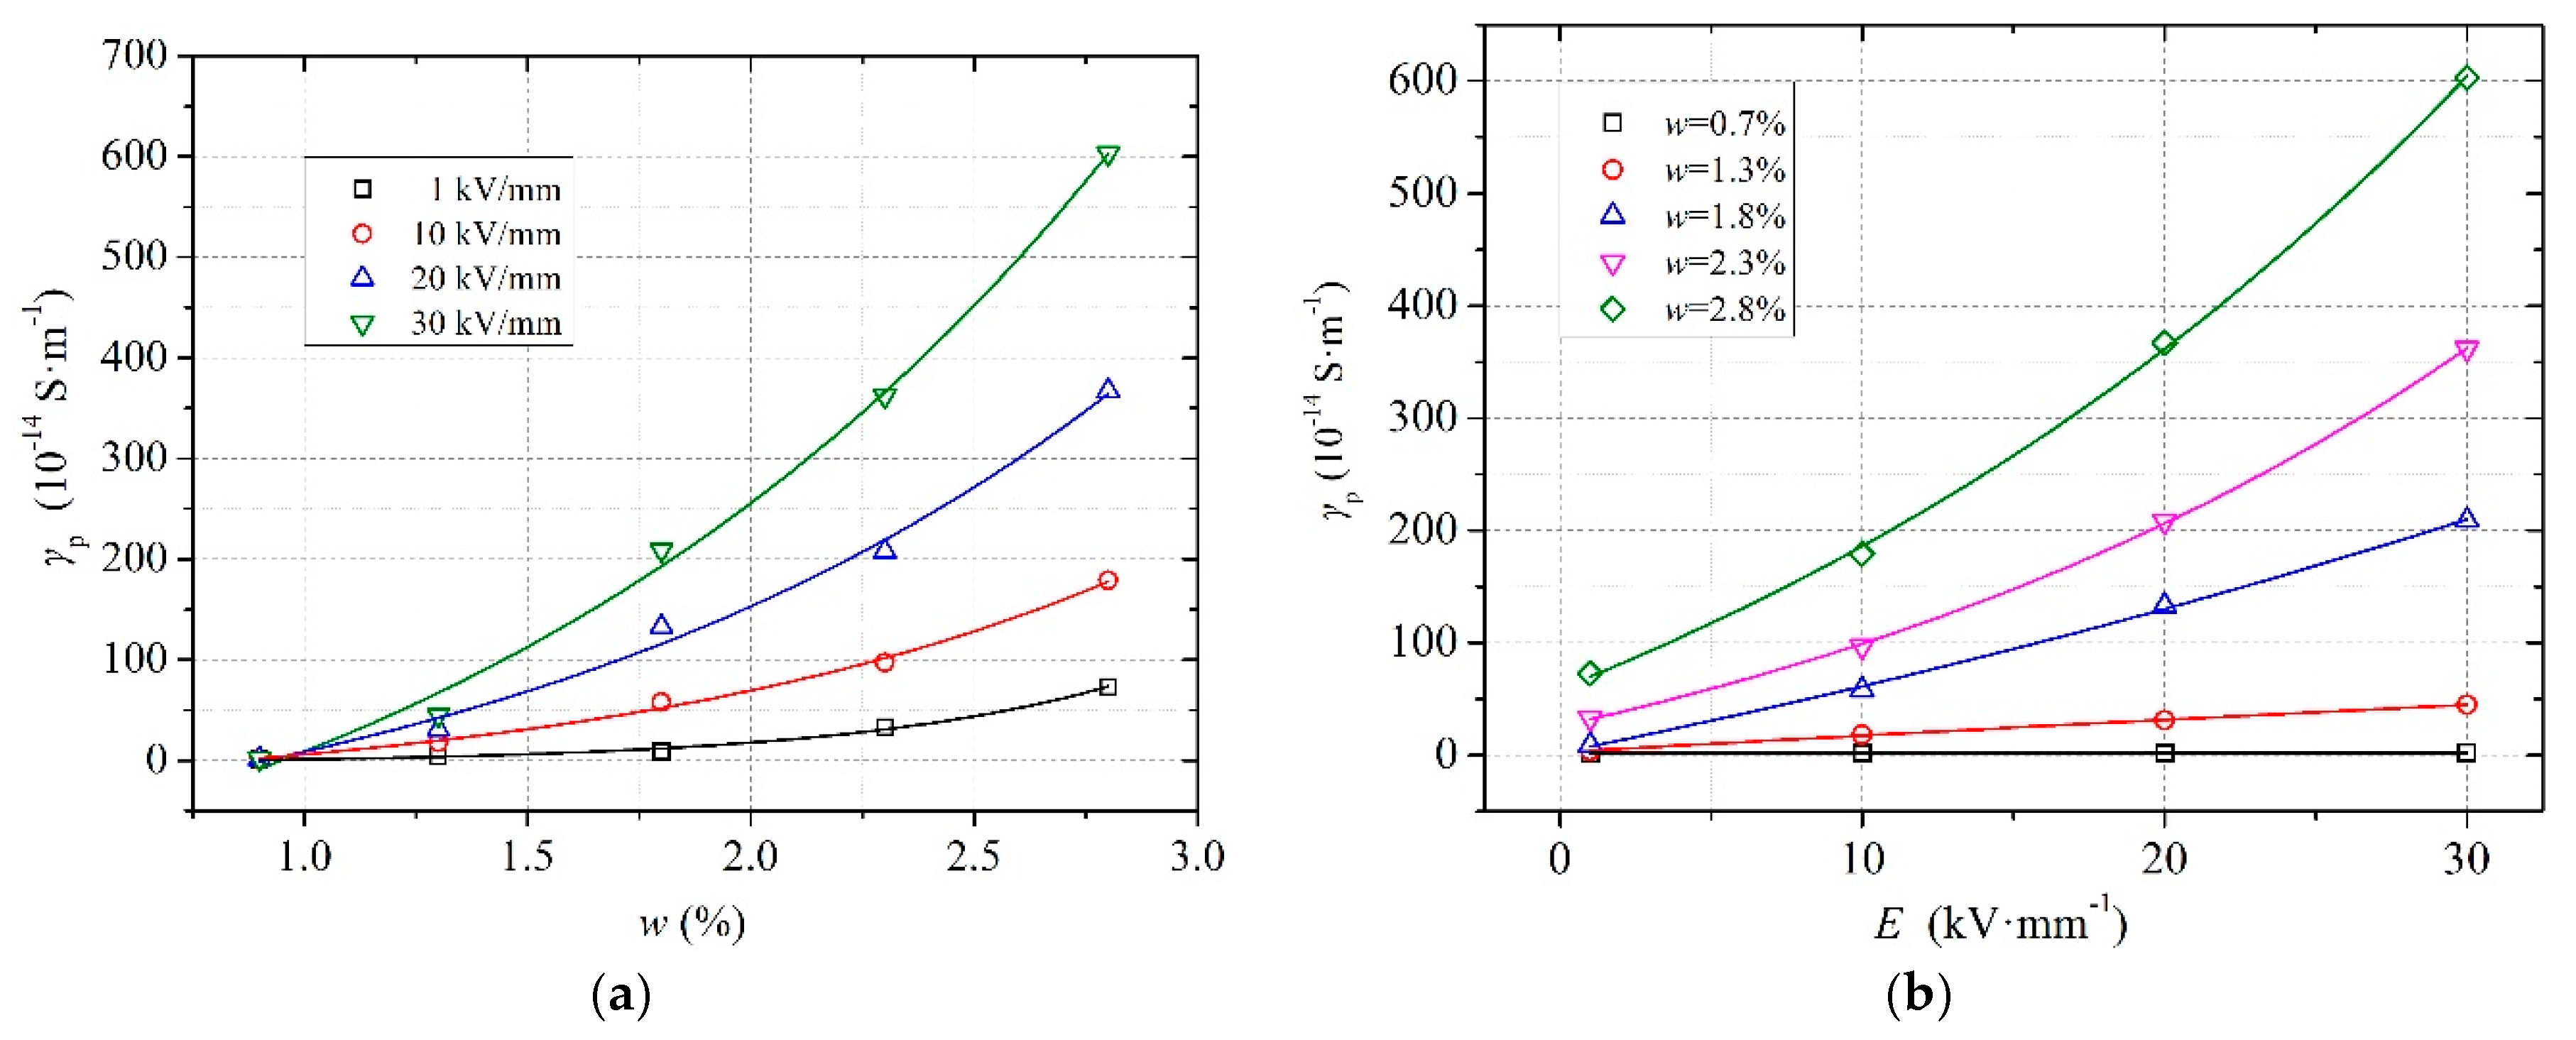
3.2. Moisture and Electric Field Dependency of Conductivity

In this section, we studied the moisture and electric field dependency of pressboard conductivity. The experimental temperature was maintained at 25 °C. Figure 6 shows the experimental results. According to the figure, the conductivity of the oil-impregnated pressboard gradually increased to a certain value as the moisture increased. When the electric field strength was 1 kV/mm, the conductivity of the pressboard increased from 7.8 × 10⁻¹⁴ S/m to 578 × 10−14 S/m as the moisture increased from 0.9% to 2.8%. When the electric field strength was 30 kV/mm, the conductivity of the pressboard increased from 8.5 × 10⁻¹⁴ S/m to 872 × 10−14 S/m, a difference of nearly three orders of magnitude. Further analysis of the results in Figure 5 will be presented in Section 4.2.

4. Analysis and Discussion

In this section, we first conduct an in-depth analysis of the experimental results. Afterwards, the mechanism behind the experimental phenomena is discussed.

4.1. Analysis on the Temperature and Electric Field Dependency of Conductivity

The conductance mechanism of the pressboard is both ionic and electronic, where ionic conductance is the major contributor to the process [14]. Ions in ionic conductance are generated from the transformer oil, the moisture and other impurities within the pressboard [11]. For fully impregnated dry pressboard samples, the ion concentration and ion migration in oil increase significantly as temperature increases. However, under DC voltage, the electric field is mainly concentrated within the cellulose, instead of the oil gaps, of the pressboard. Therefore, when the average electric field within the pressboard changes, only the ionic conductance process is affected, resulting in a pressboard conductivity that is mostly unchanged.
Based on Figure 5, the calculation formula of pressboard conductivity with regard to temperature and electric field strength can be derived. First, let the pressboard be in a three-axis Cartesian coordinate system. When no DC voltage is applied, the distribution possibility of impurity ions in the pressboard should be equal along the −x, +x, −y, +y, −z, and +z directions. If the initial ion concentration is n0, then the ion concentration along each direction should be n0/6. The energy of the ion’s thermal vibration obeys the Boltzmann distribution. Therefore, once the temperature is increased to Tk, the ion concentration should be [17]:
n = ( n 0 6 ) ν e ( u 0 k T k )
where v is the ion’s thermal vibration frequency, u0 is the hopping barrier for the ion transition, k is the Boltzmann constant, and Tk is the Kelvin temperature. Now, consider the existence of an electric field along the +x direction. Under the influence of an electric field, ions begin to migrate. The change in the hopping barrier introduced by the electric field within a unit distance δ can be expressed as:
Δ u = q δ E oil 2
Based on Equations (1) and (2), the equivalent concentration of the ions that migrate along the +x direction should be [17]:
Δ n = n + n = ( n 0 6 ) ν e ( u 0 k T k ) ( e Δ u k T k e Δ u k T k )
where n+ is the concentration of ions that migrate along the +x direction, and n is the concentration of ions that migrate along the −x direction.
In general, Δu << Tk. Therefore:
e ± Δ u k T k 1 ± e Δ u k T k = 1 ± ( q δ E oil 2 k T k )
Combining Equations (3) and (4), we have:
Δ n = ( n 0 q δ ν 6 k T k ) e u 0 k T k E oil
Based on Equation (5), the migration rate of ions can be derived:
μ = Δ n δ n 0 E oil = ( q δ 2 ν 6 k T k ) e u 0 k T k
Then, the conductivity of the pressboard is:
{ γ p = n q μ = A e B T k A = n 0 q 2 δ 2 ν 2 36 k T k B = 2 u 0 k
In Equation (7), A is relevant to temperature. However, the influence of temperature on A is very small compared with the influence on the exponential part. Therefore, when calculating the conductivity of the pressboard using Equation (7), A can be regarded as a constant. In addition, due to the small temperature range, the Kelvin temperature can be replaced by the Celsius temperature. Thus, Equation (7) can be rewritten as:
γ p = γ p ( 0 ) e η T
where γp(0) represents the conductivity of the pressboard at 0 °C, T is the temperature in Celsius, and η is the temperature index constant of the pressboard conductivity. Fitting the data in Figure 5 with Equation (8), a semi-empirical calculation formula for the conductivity of the pressboard at different temperatures can be obtained:
γ p = 0.653 e 0.036 T × 10 14   S / m

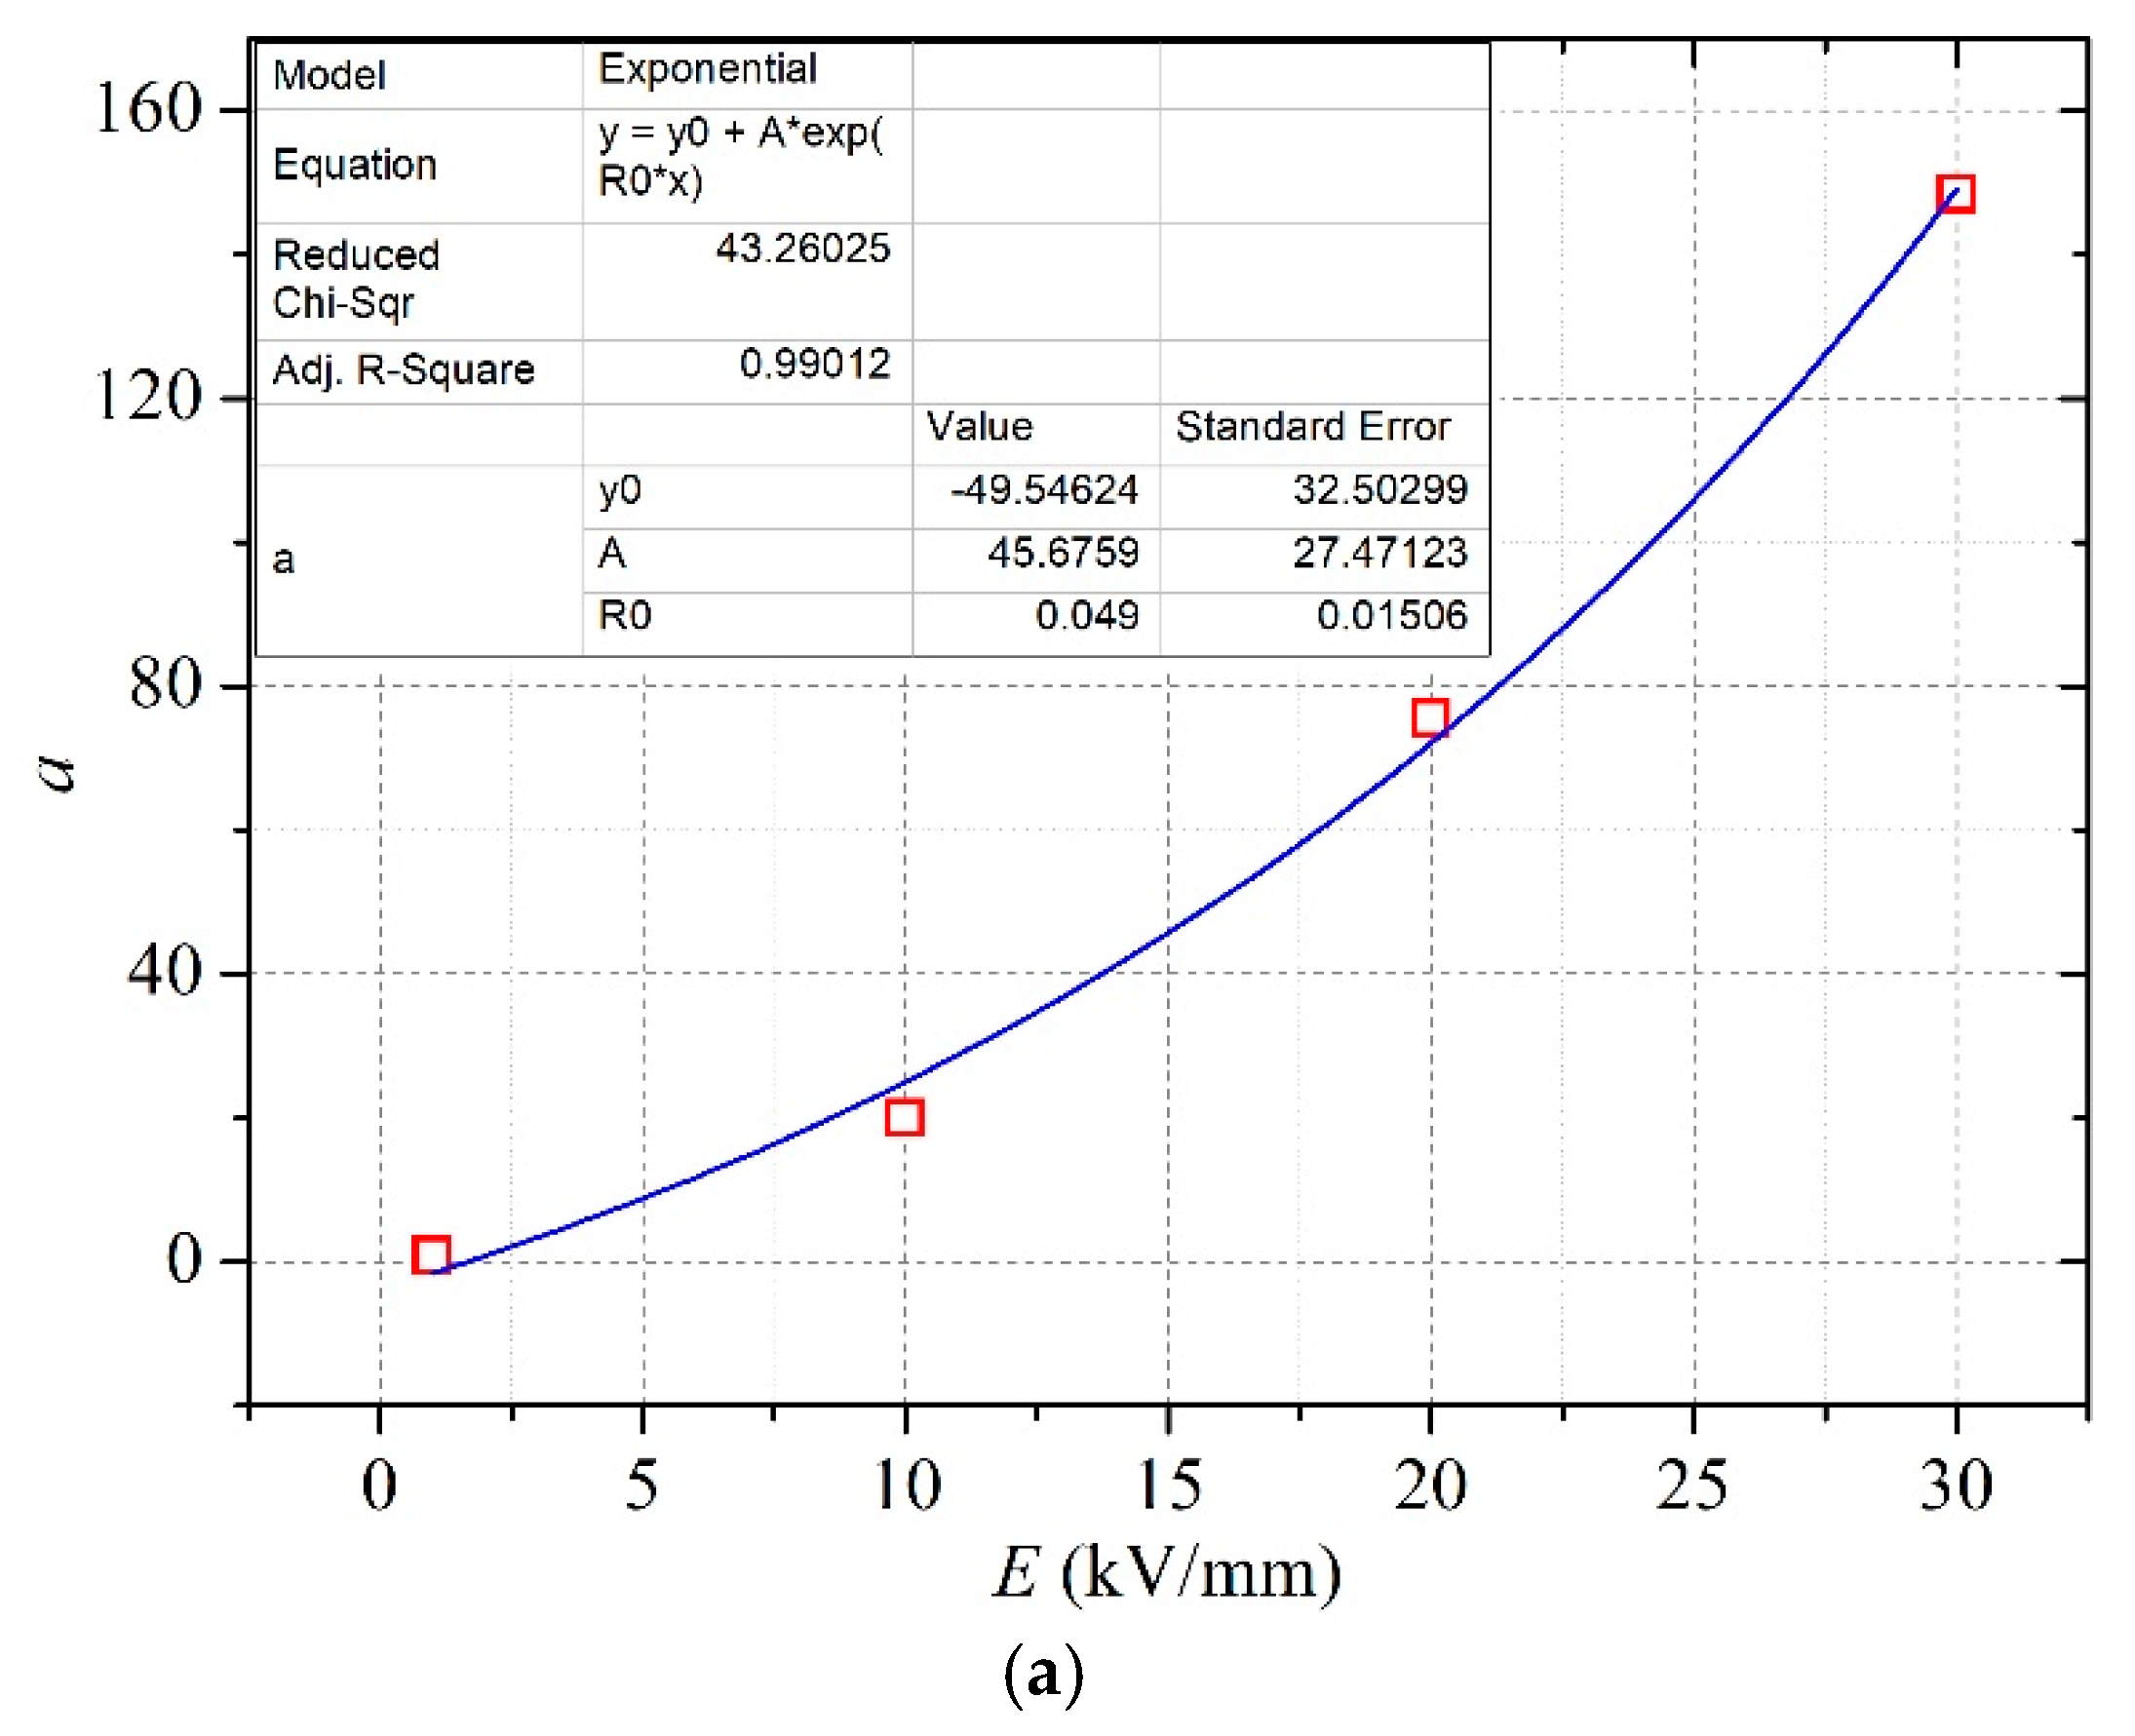
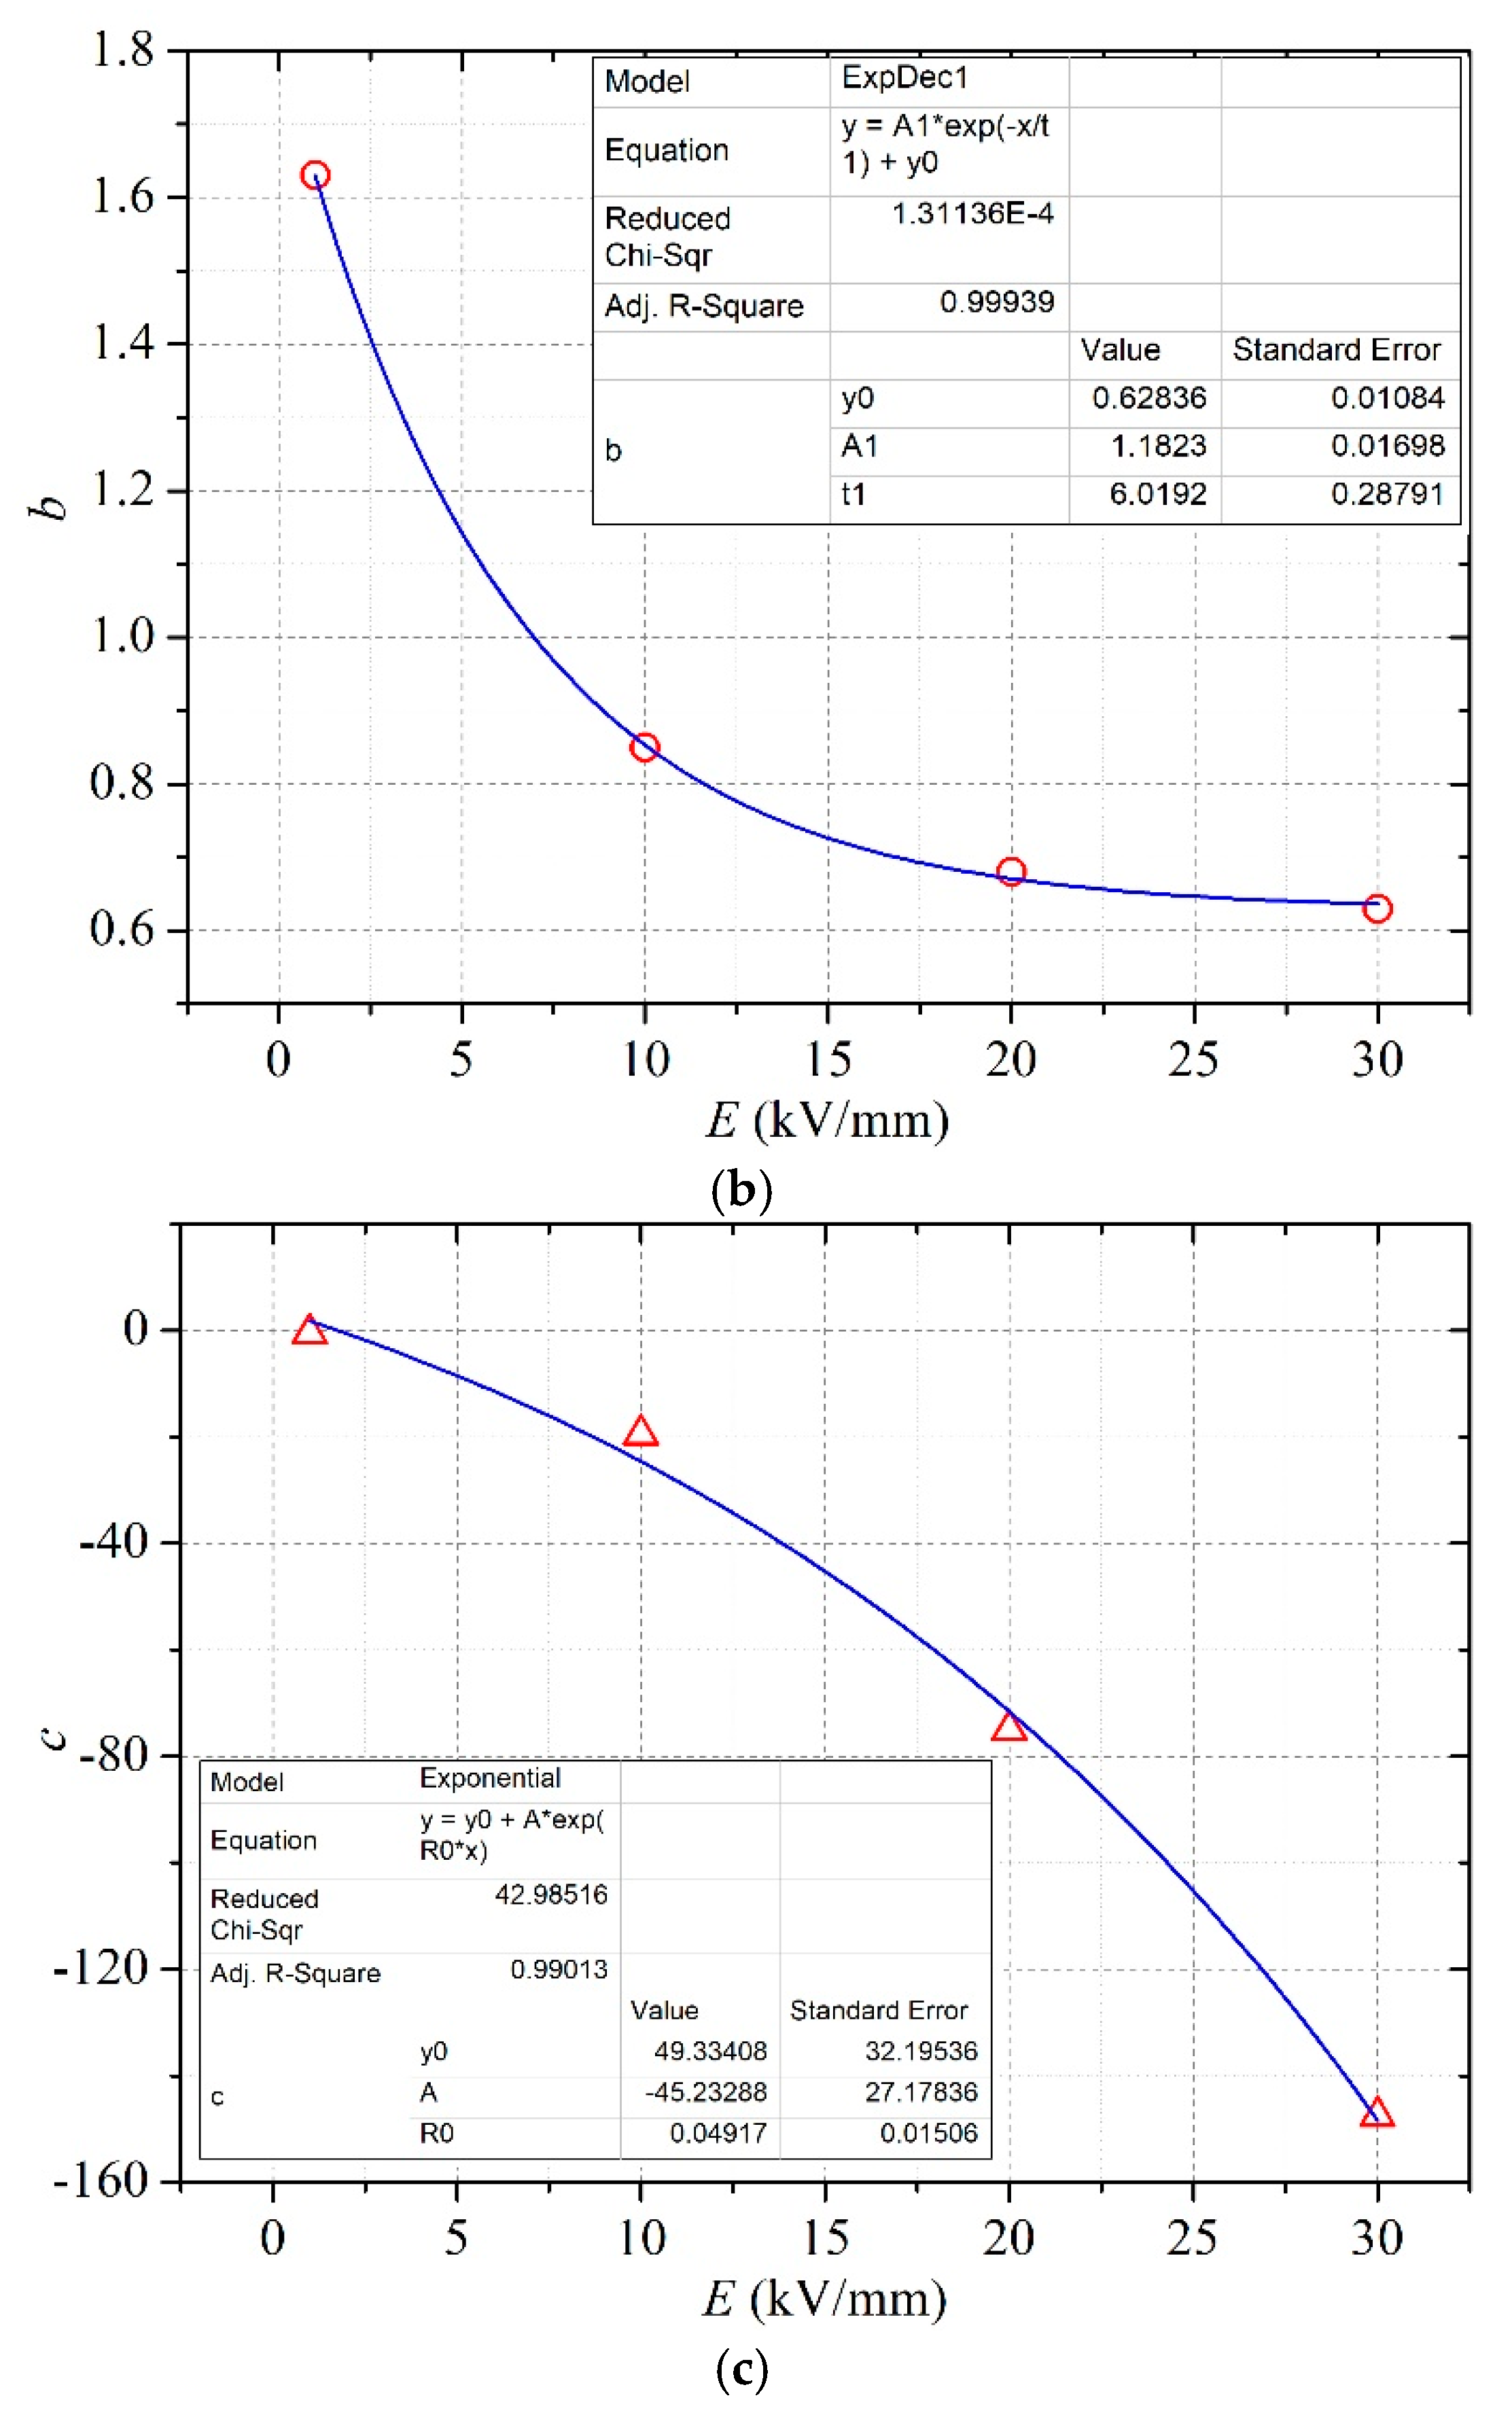
4.2. Analysis of the Moisture and Electric Field Dependency of Conductivity

In general, pressboard is composed of cellulose, hemicellulose and lignin; however, because the content of lignin is extremely small, pressboard is often considered to be composed of cellulose and hemicellulose [18]. The arrangement of the two parts is shown in Figure 7a, where the cellulose constitutes the backbone of the pressboard, and the hemicellulose is interspersed within.
Cellulose is a linear semi-crystalline polysaccharide. Its basic structure is the glucose monomer, which is connected by glycosidic bonds, as shown in Figure 7b. Due to this structure, stable hydrogen bonds can be formed inside the cellulose molecule. Due to the crystal structure and hydrogen bonds, the cellulose is insoluble in water; however, the unsaturated hydroxyl groups in cellulose molecules are hydrophilic. Hemicellulose is a heterogeneous multimer, and it is composed of several different types of monosaccharides, mainly five- and six-carbon sugars, including xylose, arabinose and galactose. The hemicellulose molecule contains a large number of hydroxyl groups and is hydrophilic [19]. Due to the hydrophilicity of cellulose/hemicellulose and the porous structure, pressboard tends to absorb a large amount of water.
Moisture will introduce impurity ions within the pressboard, which increases the ion concentration and changes the conductivity of the pressboard, as shown in Figure 8. The impurity ions, namely, H+ and OH, are generated due to the dissociation of water, as shown below:
2 H 2 O OH + H 3 O +
From the perspective of ion drift, protons (H+) in water can migrate quickly, which in turn increases the conductivity of the pressboard. However, due to the high concentration of protons in water and the small volume of water molecules, the proton migration rate is fast in water gaps within the pressboard. Even if the electric field is mainly concentrated within the cellulose, a slight electric field enhancement in the water is enough to accelerate the migration rate of protons. Therefore, the electric field dependency of pressboard conductivity is more obvious under different moisture conditions than under different temperatures.
Once the proton reaches the cathode, it will recombine with the electrons and generate hydrogen, as described by reaction Equation (11). Hydrogen generated during this process can either leave or remain in the pressboard sample.
2 H + + 2 e H 2
The mathematical equation cited in [20] indicates that the pressboard’s resistivity can be calculated using:
γ p = a ( E ) × e b ( E ) w + c ( E )
In Equation (12), γp is the resistivity of the pressboard, w is the moisture (%) of the pressboard sample, and a, b and c are electric field dependent parameters. By fitting the data in Figure 6 with Equation (12), the exact values of a, b and c under different electric field strengths can be derived, as shown in Table 3.
Based on Table 3, we can plot the curves of the relationship between the electric field and the parameters, which are shown in Figure 9. Then, we use the exponential function to fit the data in Figure 9 numerically. The calculation formulas (13) of pressboard conductivity concerning the influence of moisture and electric field strength can thus be derived.
{ γ p = a ( E ) × e b ( E ) w + c ( E ) a ( E ) = 45 . 676 e 0.049 E 49.546 b ( E ) = 1.182 e E / 6.019 + 0.628 c ( E ) = 45 . 233 e 0.049 E + 49.334

4.3. General Remarks

The conductance of solid dielectrics is mainly divided into two types, i.e., electronic conductance and ionic conductance, according to the type of carrier [14]. The carrier of the electronic conductance is composed of free electrons and holes. Pressboard in this paper can be regarded as a wide band gap semiconductor with a high forbidden band width. For such a structure, the energy that is needed to generate intrinsic carriers via heat-excited transition is very high. The temperature and the electric field strength in this paper were not enough to induce such a process. Therefore, the electronic conductance is not the primary conductance process in the oil-impregnated pressboard. The carriers of the ionic conductance are mainly intrinsic ions (of the dielectric) and impurity ions. Intrinsic ionic conductance is mainly related to crystals, and it is negligible for oil-impregnated pressboard. Impurity ionic conductance is caused by foreign impurity molecules within the dielectric in this paper, namely water and oil. Under the influence of the electric field, free ions in water and oil will move in a regular orientation and contribute to the conductance of the pressboard.
According to Equations (5) and (6), temperature can increase both the concentration and the migration rate of the carriers within the oil-impregnated pressboard. In addition, an increased temperature will activate the electrons within the electrode. The excited electron tends to cross the barrier and migrate into the pressboard from the electrode. This process further increases the concentration of the carriers within the pressboard and thus increases the conductivity of the pressboard. Moisture, as previously stated, will introduce ions (H+, OH) to the pressboard, which remarkably increases the carrier concentration. Protons (H+) can migrate very quickly within the water gap under the influence of an electric field, which indirectly increases the migration rate of the carriers. Under DC voltage, the electric field mainly concentrates on the dielectric with larger conductivity, namely, the cellulose within the pressboard. Accordingly, the electric field strength in the oil/water within the pressboard is low. Even if the applied DC voltage is increased, the electric field strength in the oil/water does not change significantly. When the pressboard is wet, protons in the water of the pressboard are one of the main sources of carriers. Since the protons are light and easily accelerated, even by a slightly increased electric field, the conductivity of the wet pressboard depends on the electric field. However, when the pressboard is dry, the carriers are mainly macromolecules from the oil, which are difficult to accelerate by a weak electric field. Therefore, the conductivity of the dry pressboard is independent of the electric field.

5. Conclusions

The DC electric field distribution in the valve-side winding of a converter transformer follows the conductivity ratio of materials used in its structure. The conductivity of oil-impregnated pressboard is not a constant parameter, as it depends on various parameters and test conditions. Three important dependencies of pressboard conductivity were investigated in this paper. First, we studied the influence of temperature on dry pressboard conductivity. A 95 °C change of the test temperature from 25 °C to 120 °C increases the conductivity of the pressboard more than 30 times. In addition, the moisture dependency of the pressboard conductivity was investigated. As moisture increases, the conductivity increases remarkably. For pressboards with high moisture content, an exponential function was proposed to describe the conductivity behavior. Based on studies of the temperature and moisture dependencies of pressboard conductivity, the influence of the DC electric field on the conductivity was analyzed. For a dry pressboard, regardless of how the temperature changes from 25 °C to 120 °C, no significant changes in conductivity are observed when the electric field strength changes from 1 kV/mm to 30 kV/mm. For a wet pressboard, however, an increase in electric field strength leads to conductivity values that are dozens of times higher.

Author Contributions

Conceptualization, Y.L.; data curation, G.Z. and J.Z.; investigation, Y.L., M.L. and S.L.; methodology, Y.L.; writing—original draft preparation, Y.L.; writing—review and editing, K.Z.

Funding

This research was funded by the Fundamental Research Funds for the Central Universities, grant number YJ201882, and the Open Fund of State Key Laboratory of Power Grid Environmental Protection, grant number GYW51201801166.

Acknowledgments

The authors thank the Fundamental Research Funds for the Central Universities (YJ201882) for providing financial support for this research. The authors also want to thank Prof. Qiaogen Zhang from Xi’an Jiaotong University for his help with this research.

Conflicts of Interest

The authors declare no conflicts of interest.

References

  1. Bhuvaneswari, G.; Mahanta, B.C. Analysis of converter transformer failure in HVDC systems and possible solutions. IEEE Trans. Power Del. 2009, 24, 814–821. [Google Scholar] [CrossRef]
  2. Pu, Z.H.; Ruan, J.J.; Zhang, Y.D.; Du, Z.Y.; Xie, Q.J.; Wang, K. Wave process in scale-down model of UHVDC converter transformer under the lightning impulse voltage. IEEE Trans. Magn. 2015, 51, 1–4. [Google Scholar] [CrossRef]
  3. Takeda, H.; Ayakawa, H.; Tsumenage, M.; Sanpei, M. New protection method for HVDC lines including cables. IEEE Trans. Power Del. 1995, 10, 2035–2039. [Google Scholar] [CrossRef]
  4. Forrest, J.A.C.; Allard, B. Thermal problems caused by harmonic frequency leakage fluxes in three-phase, three-winding converter transformers. IEEE Trans. Power Del. 2004, 19, 208–213. [Google Scholar] [CrossRef]
  5. Li, Y.; Zhang, Q.G.; Wang, T.L.; Li, J.Z.; Guo, C.; Ni, H.L. Degradation characteristics of oil-impregnated pressboard samples induced by partial discharges under DC voltage. IEEE Trans. Dielectr. Electr. Insul. 2017, 24, 1110–1117. [Google Scholar] [CrossRef]
  6. Smajic, J.; Hughes, J.; Steinmetz, T.; Pusch, D.; Mönig, W.; Carlen, M. Numerical computation of ohmic and eddy-current winding losses of converter transformers including higher harmonics of load current. IEEE Trans. Magn. 2012, 48, 827–830. [Google Scholar] [CrossRef]
  7. Sha, Y.C.; Zhou, Y.X.; Li, J.Z.; Wang, J.Y. Partial discharge characteristics in oil-paper insulation under combined AC-DC voltage. IEEE Trans. Dielectr. Electr. Insul. 2014, 21, 1529–1539. [Google Scholar] [CrossRef]
  8. Bao, L.W.; Li, J.; Zhang, J.; Li, X.; Li, X.D. Influences of temperature on partial discharge behavior in oil-paper bounded gas cavity under pulsating DC voltage. IEEE Trans. Dielectr. Electr. Insul. 2016, 23, 1482–1490. [Google Scholar] [CrossRef]
  9. Vahidi, F.; Haegele, S.; Tenbohlen, S.; Rapp, K.; Sbravati, A. Study on moisture influence on electrical conductivity of natural ester fluid and mineral oil. In Proceedings of the 2017 IEEE Electrical Insulation Conference, Baltimore, MA, USA, 11–14 June 2017. [Google Scholar]
  10. Abedian, B.; Baker, K.N. Temperature effects on the electrical conductivity of dielectric liquids. IEEE Trans. Dielectr. Electr. Insul. 2008, 15, 888–892. [Google Scholar] [CrossRef]
  11. Zhou, Y.X.; Sha, Y.C.; Chen, W.J.; Lu, L.C.; Nie, D.X.; Wu, Z.R.; Deng, J.G. Conduction characteristics in transformer oil and electrical insulation paper. Power Sys. Tech. 2013, 37, 2527–2533. [Google Scholar]
  12. Żukowski, P.; Koltunowicz, T.N.; Kierczyński, K.; Subocz, J.; Szrot, M.; Gutten, M. Assessment of water content in an impregnated pressboard based on dc conductivity measurements-theoretical assumptions. IEEE Trans. Dielectr. Electr. Insul. 2014, 21, 1268–1275. [Google Scholar] [CrossRef]
  13. Żukowski, P.; Koltunowicz, T.N.; Kierczyński, K.; Subocz, J.; Szrot, M.; Gutten, M.; Sebok, M.; Jurcik, J. An analysis of AC conductivity in moist oil-impregnated insulation pressboard. IEEE Trans. Dielectr. Electr. Insul. 2015, 22, 2156–2164. [Google Scholar] [CrossRef]
  14. Li, H.Q.; Zhong, L.S.; Yu, Q.X.; Mori, S.; Yamada, S. The resistivity of oil and oil-impregnated pressboard varies with temperature and electric field strength. IEEE Trans. Dielectr. Electr. Insul. 2014, 21, 1851–1856. [Google Scholar] [CrossRef]
  15. Takahashi, E.; Shirasaka, Y.; Okuyama, K. Analysis of anisotropic nonlinear electric field with a discussion of dielectric tests for converter transformers and smoothing reactors. IEEE Trans. Power Del. 1994, 9, 1480–1486. [Google Scholar] [CrossRef]
  16. Nara, T.; Kato, K.; Endo, F.; Okubo, H. Study on dielectric breakdown at DC polarity reversal in oil/pressboard-composite insulation system. In Proceedings of the 2009 IEEE Conference on Electrical Insulation and Dielectric Phenomena, Virginia Beach, VA, USA, 18–21 October 2009. [Google Scholar]
  17. Zhong, L.S.; Li, S.T.; Xu, C.X.; Liu, F.Y. Physics of Engineering Dielectrics and Dielectric Phenomena, 1st ed.; Xi’an Jiaotong University Press: Xi’an, China, 2013; pp. 99–109. [Google Scholar]
  18. Martin, D.; Krause, O.; Saha, T. Measuring the pressboard water content of transformers using cellulose isotherms and the frequency components of water migration. IEEE Trans. Power Del. 2017, 32, 1314–1320. [Google Scholar] [CrossRef]
  19. Moser, H.P.; Dahinden, V. Transformer Board, 1st ed.; Shenyang Transformer Research Institute Press: Shenyang, China, 1988; pp. 20–22. [Google Scholar]
  20. Chi, M.H. Influence of Working Condition on Breakdown Characteristics of Oil-paper Insulation under Complex Electric Field. Ph.D. Thesis, Harbin University of Science and Technology, Harbin, China, 2015. [Google Scholar]
Figure 1. Relationship between the duration of water absorption and the moisture content of the pressboard samples.
Energies 12 03136 g001
Figure 2. Schematic diagram of the conductivity measurement circuit.
Energies 12 03136 g002
Figure 3. Schematic diagram of the three-electrode experimental chamber: (1) Spherical electrode; (2) current-limiting resistance; (3) bushing; (4) metal shell; (5) polytetrafluoroethylene (PTFE); (6) high voltage electrode; (7) pressboard sample; (8) measuring electrode; (9) shielding electrode; (10) spring; (11) epoxy pillar; (12) flange with through hole.
Energies 12 03136 g003
Figure 4. Relationship between pressboard conductivity and voltage applying time under different conditions: ① −1 kV/mm, 25 °C, w = 0.9%; ② −30 kV/mm, 25 °C, w = 0.9%; ③ −1 kV/mm, 100 °C, w = 0.9%; ④ −1 kV/mm, 25 °C, w = 2.8%.
Energies 12 03136 g004
Figure 5. Relationship between pressboard conductivity and temperature/electric field strength (w = 0.9%): (a) Temperature as the x coordinate; (b) Electric field strength as the x coordinate.
Energies 12 03136 g005
Figure 6. Relationship between pressboard conductivity and moisture/electric field strength (25 °C): (a) Moisture as the x coordinate; (b) Electric field strength as the x coordinate.
Energies 12 03136 g006
Figure 7. Schematic diagram of the pressboard microstructure: (a) The arrangement of cellulose and hemicellulose within the pressboard; (b) The chemical structure of cellulose glucose monomer.
Energies 12 03136 g007
Figure 8. Schematic of the generation and accumulation of H+/OH ions within the pressboard.
Energies 12 03136 g008
Figure 9. Relationship between the electric field strength and the values of the parameters in Equation (12): (a) a(E)-E; (b) b(E)-E; (c) c(E)-E.
Energies 12 03136 g009aEnergies 12 03136 g009b
Table 1. Characteristics of the KI25X transformer oil.
ItemKunlun KI25X
Relative permittivity2.3
Breakdown voltage (kV, 2.5 mm)66
Volume resistivity (Ω∙m)≈1012
Moisture (mg/L, 20 °C)7.4 (after drying)
Particle numbers (≥5 μm/100 mL)≈500
Table 2. Sizes of the three electrodes.
ItemThickness × Diameter
High Voltage Electrode10 mm × 80 mm with a chamfer of 5 mm
Measuring Electrode10 mm × 30 mm without chamfer
Shielding Electrode10 mm × 60 mm (inner)/80 mm (outer) without chamfer
Table 3. Values of the parameters in Equation (12) under different electric field strengths.
E (kV/mm)a(E)b(E)c(E)
10.811.63−0.56
1019.990.85−19.62
2075.580.68−75.01
30148.320.63−147.62

