Volume-Based Assessment of Erosion Patterns around a Hydrodynamic Transparent Offshore Structure


Ludwig-Franzius-Institute for Hydraulic, Estuarine and Coastal Engineering, Leibniz Universität Hannover, 30167 Hannover, Germany
*
Author to whom correspondence should be addressed.
Energies 2019, 12(16), 3089; https://doi.org/10.3390/en12163089
Submission received: 1 July 2019
/
Revised: 6 August 2019
/
Accepted: 6 August 2019
/
Published: 10 August 2019
(This article belongs to the Special Issue Renewable Energy in Marine Environment)
Abstract
:The present article presents results of a laboratory study on the assessment of erosion patterns around a hydrodynamic transparent offshore foundation exposed to combined waves and currents. The model tests were conducted under irregular, long-crested waves in a scale of 1:30 in a wave-current basin. A terrestrial 3D laser scanner was used to acquire data of the sediment surface around the foundation structure. Tests have been conducted systematically varying from wave- to current-dominated conditions. Different volume analyzing methods are introduced, which can be related for any offshore or coastal structure to disclose physical processes in complex erosion patterns. Empirical formulations are proposed for the quantification of spatially eroded sediment volumes and scour depths in the near-field and vicinity of the structure. Findings from the present study agree well with in-situ data stemming from the field. Contrasting spatial erosion development between experimental and in-situ data determines a stable maximum of erosion intensity at a distance of 1.25 A, 1.25 times the structure’s footprint A, as well as a global scour extent of 2.1–2.7 A within the present study and about 2.7–2.8 A from the field. By this means, a structure-induced environmental footprint as a measure for erosion of sediment affecting marine habitat is quantified.
1. Introduction
To meet the rising demand for renewable energy, the expansion of offshore wind energy converters (OWECs) in coastal waters is progressing steadily. Due to continuing technological development, upcoming offshore wind parks will not only utilize larger turbines with a capacity of 10 MW and beyond [1], but also create opportunities to open new available space in larger water depths. As the average water depth increases in projected wind parks globally, different construction types are adopted that are more complex and have a larger footprint than commonly used monopiles. However, the installation and operation of those structures, especially if several are closely aligned next to each other, may lead to impacts on the formerly unaffected marine environment in the near- but also in the far-field. Potential impacts [2,3,4] include large scale morphological changes and entrainment of large quantities of sediment in the water body due to interaction of the structure with ocean currents and waves [5,6,7]. Of course, the scouring processes might also affect the sustainability of the structure itself over time. Unfortunately, only a limited understanding of environmental impacts and the impairment of the structure’s stability over its lifetime due to scouring processes around complex foundation structures exist. This is why for some structures that are affected by scouring, e.g., gravity-based foundations (GBF), the installation of a scour protection system became mandatory. The protection of those structures against the degradation due to scour is often designed following a conservative, and thus, inefficient approach that is based on monopiles. Yet, this evident mismatch may also lead to incorrect prediction of scour depths and unreliable design of scour protection (see Rudolph et al. [8]). This in turn might also impose an effect of superimposing global scouring processes, that possibly contribute to the subsidence of the seabed, in particular around complex structures see, e.g., Rudolph et al. [8] and Baelus et al. [9]. While the equilibrium scour depth around monopile foundations has been investigated and published extensively over the last decades, limited understanding exists for jacket-type foundations, see [8,9,10,11]. Even though the bed topography was measured, these studies were more focused on the local scour development for specific conditions rather than on the spatial scour development on a global extent. A literature study on model tests and field studies related to jacket-type foundations can be found in Welzel et al. [12].
Research conducted for groups of circular cylinders represents the basis of knowledge to understand the initiation and development of local and global scour around a hydrodynamic transparent structure like a jacket. For groups of circular cylinders, several studies outlined a dependency between the distance of piles (gap ratio) and the local as well as global scour development [13,14,15]. Furthermore, it is reported that hydrodynamic interactions between individual circular piles are small if the distance between them exceeds six times the piles’ diameter (see e.g. [16,17,18]). Bolle et al. [10] transferred this knowledge to jacket structures, arguing that the distance was clearly above 6 D in their study and thus global scour does not have to be considered. To gain insights into potential effects of global scouring processes on the marine environment and the structures’ stability, spatial seabed changes in the vicinity of the structure need to be measured. Although different measurement techniques and analysis methods were already applied in previous studies, they are rarely used to provide information beyond the calculation of volumes of displaced sediment. Porter [19] used a photogrammetric-based measurement system to analyze the scour hole, depth and shape in tidal currents around a monopile. Margheritini et al. [20] conducted physical model tests for the scour development around monopile foundations in unidirectional and tidal currents. They analyzed the scour volume by means of a laser probe bottom profiler. Stahlmann and Schlurmann [21] conducted small scale, 1:40, as well as large scale, 1:12, physical model tests for a tripod foundation in regular and irregular wave conditions and evaluated the scour development by using either a laser distance bottom profiler (for 1:40) or a multi-beam echo sounder (for 1:12). Hartvig et al. [22] investigated the scour and backfilling processes around a monopile foundation due to steady currents and combined wave-current load. A laser probe bottom profiler was used to obtain bed topography measurements for several time steps. Insights about scour processes and results on scour depth, scour volume and a scour shape factor are derived as a function of time and space. As the spatial investigation of erosion volumes around offshore structures so far has attracted little research interest (also for technical reasons of measurement instruments), few studies exist which may provide a systematic analysis. Studies of Margheritini et al. [20] and Hartvig et al. [22] systematically analyzed erosion processes and introduced a dimensionless erosion volume (normalized with a structural volume). Nevertheless, the lack of a spatial reference (e.g., the related interrogation area of the erosion volume) to the information of eroded sediment volume seems to be an important point missing for a further normalization.
However, several aspects regarding scouring processes around complex offshore structures remain (so far) disregarded and demand a more systematic investigation of erosion patterns. Consequently, the objective of the present paper addresses a systematic volume-based analysis of erosion processes to evaluate the degree and extent of the local and global scour development around a jacket structure. This enables the sediment redistribution footprint of the offshore structure to be deduced in the transition between the near- and the far-field. Therefore, hydraulic model tests have been carried out in the wave and current basin of the Ludwig-Franzius-Institute to conduct a systematic study of erosion processes around a jacket-type offshore foundation under waves, combined waves and current as well as steady current conditions. Different volume-analyzing concepts and calculation methods are introduced, which can be adapted, generally, for any offshore structure or coastal structure to reveal physical processes in complex erosion patterns.
The objectives of this paper are:
- (1)
- The systematic study of global scour patterns in combined waves and current conditions around a jacket foundation.
- (2)
- Gaining further insights into the spatial scouring process around jacket structures with detailed 3D laser scan measurements.
- (3)
- The introduction and application of a novel method to analyze volume-based erosion processes with a spatial reference.
- (4)
- The improvement of prediction methods to account for local and global erosion volumes/scour depths and the extent of global and local scour around jacket type offshore structures.
- (5)
- The quantification of eroded sediment volume, and the determination of areas, which exhibit an increased erosion rate, and therefore, have an impact on the natural dynamics of the ocean floor.
It should be noted that the present physical model tests were part of a fundamental study previously described in [12]. While Welzel et al. [12] focused on local scour depths, measured for a wide range of wave, wave-current and steady current conditions, the present study concentrates on the volume-based assessment of spatial erosion processes in the near-field and vicinity of the structure.
2. Experimental Setup
The physical model tests have been conducted using a jacket-type model in the 3D wave and current basin of the Ludwig-Franzius-Institute, Leibniz Universität Hannover, Germany. The wave basin has a maximum water depth of 1 m, a total length of 40 m and a width of 24 m (see Figure 1). Passive wave absorbers are installed at three sides of the wave basin, resulting in an effective usable length of 30 to 15 m (see Figure 1). An integrated active wave absorption system further reduces reflections. The snake type wave machine consists of 72 wave paddles, allowing generation of regular and irregular waves at angles of 45° between 135° degrees. For the present study a perpendicular wave direction was set to 90° to the current coming from 0° (see Figure 1).
This superposition angle was chosen to enable a better comparability to other studies as well as to investigate the influence of waves approaching perpendicular to a current on the global scour development. As shown in Figure 2b, the water depth of 0.67 m, representing a water level of 20 m in prototype scale according to the model scale of 1:30, was kept constant during the study. The sediment pit is located in the center of the basin, providing an additional depth of 1.2 m, a length of 8 m and a width of 6.6 m. A sediment trap with a length of 1.5 m at the downstream side of the pit was installed to prevent large amounts of sediment from being transported as bed load into the pump sump. A jacket structure was assembled to physically mimic a generic structure of a jacket-type foundation without considering the influence of post piles or mud-mats. The physical model was constructed using 3D printed parts, which were glued together, sanded down and painted with filler and lacquer in multiple layers to achieve a smooth coating of the surface. The jacket structure has been built in a quadratic cross section consisting of four main piles with a diameter of 4 cm each and with a distance of 0.55 m between them. The piles below the lowest nodes were made out of aluminum and were connected to the bottom of the wave basin. The model was installed in the middle of the sediment pit. As the jacket structure was not rotated during the laboratory experiments, only one orientation of the model with respect to the current and wave direction was investigated in the present study. The model was installed and constructed in a way that the lowest node of the structure was positioned in a distance of one pile diameter D (with D = 4 cm) above the sediment bed, as shown in Figure 2. Consequently, a substantial influence of the jacket structure on the flow and thus on the sediment bed was intended. The sediment pit was filled with sand with a median diameter of 0.19 mm. To achieve a good compaction, without entrapped air, the sand was installed in wet condition and levelled with aluminum bars.
Two Acoustic Doppler Velocimeters (ADVs, Vectrino+, Nortek AS, Rud, Norway) measured wave and current induced flow velocities. One was placed 2.5 m upstream (in current direction) from the model (ADV2), and the other one (ADV1) was positioned in line with the wave gauge array.
Both ADVs were installed in a distance of 2.5 D (10 cm) over the sediment surface, vertically (looking down). Additional preliminary tests were carried out to measure the undisturbed current velocity . Furthermore, vertical velocity profiles of horizontal flow components were measured at the location of ADV2 to calculate the undisturbed and depth-averaged current velocity . The undisturbed orbital velocity was measured during previously conducted tests with ADV1 at a distance of 10 cm above the sand level. A terrestrial 3D laser scanner (Focus 3D, FARO, Lake Mary, FL, USA) was used to measure the surface elevation around the model. The FARO Focus 3D laser scanner offers the advantage of high-resolution measurements of up to 70 million data points per scan. In comparison to photogrammetric [20], echo sounder based measurement techniques [23] as well as measurements with laser probe bottom profiler [22], the 3D laser scanning method provides higher resolution and therefore a better accuracy to measure the scour patterns around the structure. The high accuracy of up to ±1 mm is especially important for volume analyzes around small/thin objects (e.g., the present structure with diameters D = 4 cm).
As mentioned previously, the present tests were part of a larger investigation, in which the time dependent development of the scour around the jacket at different locations was measured and analyzed (cp. [12]). For this, measurements were carried out by means of echo sounding transducers with a diameter of ~1cm around pile 1 and pile 3 as well as in between the piles. These echo sounders are additionally illustrated in Figure 2. For more detailed information about the experimental setup and procedure refer to Welzel et al. [12].
Experimental Procedure and Test Conditions
Before each test, the sediment bed was smoothed under wet conditions (water depth kept at the level of sediment bed) by making use of aluminum bars. Subsequently the wave basin was carefully filled overnight. No general starvation of the bed (general seabed lowering) has been observed in the present study. Therefore, the measured erosion patterns can be attributed to the presence of the structure. JONSWAP wave spectra were generated until a maximum amount of 6500 waves (or 7 h for test 5) were reached in one test. Studies related on scour around OWECs in combined waves and current exhibit test durations in ranges of 1 to 3 hours (see, e.g., [11,24,25,26]). Some of those studies did not reach an equilibrium stage of the related scour depth. Therefore, a maximum amount of 6500 waves was chosen in the present study (test durations of 3.7 between 8.3 hours) to ensure the erosion process to reach its equilibrium stage. The test procedure can be summarized as follows:
- (1)
- Smoothing the sand level and carefully filling the basin to avoid disturbances of the adjusted sand level.
- (2)
- Running the desired test until the scour process has attained an (almost) equilibrium stage.
- (3)
- Emptying the wave basin and carefully draining the sand pit to avoid further influence on the scour pattern.
- (4)
- 3D scans of the global sediment surface around the structure.
The maximum value of the undisturbed orbital velocity (see Equation (1)) is calculated with , the root-mean-square value (RMS) of the orbital velocity at the bottom in the direction of the waves defined as , with power spectrum of which corresponds to the wave component, with frequency. As investigated in [27], the Keulegan-Carpenter number is defined as , in which peak wave period and pile diameter. The parameter (see Equation (2)) represents a wave current velocity ratio introduced by Sumer and Fredsøe [27] to assess the ratio of undisturbed current to undisturbed wave generated flow velocity :
The Shields parameter, which is based on the current velocity and the orbital velocity , was determined by the approach of Soulsby [28]. The test program consisted of a wave only test, three tests in which different wave and current loads were combined, and a final test with current-only conditions. Current velocities and wave parameters were selected to cover a wide range of and numbers. A critical Shields parameter of was calculated for the sediment of the present study. Considering the Shields parameters given in Table 1, all tests have thus been conducted under live bed conditions.
3. Calculation of Erosion Volumes
The determination of dimensionless erosion volumes analyzed over increasing interrogation areas (), enables the spatial assessment of eroded sediment quantities (eroded sediment per surface area) around offshore structures. To enable an improved analysis of erosion processes, in particular of the related erosion patterns, only erosion volumes of sediment are considered within each interrogation area without the additional influence of deposited sediment volume as the deposited sediment patterns would affect the analysis of the considered erosion. Different techniques for the analysis of these volumes are introduced in the following. The application of those techniques is not limited to jacket-type structures as used in this study but can also be adapted for other complex structures to reveal physical processes behind complex erosion patterns. To avoid optically shadowed interrogation areas in close proximity of the structure, scans were taken from three different angles and subsequently merged into a single 3D point cloud, providing a high-resolution bed topography in a point density of 100 data points per cm² in the carefully drained wave basin around and beneath the structure. No changes in the sediment bed have been observed while slowly draining the sediment pit. To ensure the same spatial reference for every laser scan taken, 6 reference spheres were set in preparation of every measurement. Each merged measurement was pre-processed to reduce the number of outliers as well as to cut unnecessary data points. The pre-processed point cloud data were exported and further processed with MATLAB®. The irregular spaced point cloud data were interpolated by a cubic Delaunay triangulation to calculate the Z value of each data point and converted into a regular 3D mesh grid in a 2 mm resolution. Similar as proposed by Vosselman [29] a slope-based filtering method was implemented to reduce remaining outliers. The x- and y- coordinate system was centered to the middle of the structure. Erosion volumes located in a considered interrogation area , were calculated by subtracting the digital elevation model (DEM) from the reference level at the beginning of a test. As stated by Raudkivi and Ettema [30] for the case of monopiles, the extent and shape of a scour hole is related to the pile diameter, but can also be expressed by a dimensionless volume (see Margheritini et al. [20], Hartvig et al. [22]). Accordingly, the dimensionless eroded volume within a certain area is defined in this study as:
in which n is the number of piles, a rectangular area (see Figure 3) and the pile diameter. The investigated erosion patterns are a result of the complex flow and scouring mechanism, which are briefly described in Section 4.1. In the present study the global erosion volume is related with the four main piles of the jacket () for global erosion calculations and for local erosion analyses in the near-field of an individual single pile.
In contrast to the erosion volume , the cumulative erosion volume represents a volume which is related to a normalized ratio of the area , with being the area of the structure’s footprint. By considering monotonously increasing areas around the structure, the development of the erosion volume with increasing distance from the center of the structure can be evaluated. This approach enables both an insight into the spatial extent and a quantitative measure how the erosion process translates from local to global patterns. By this means also the distance to which the structure has a quantifiable influence on the mobile seabed can be projected. The cumulative erosion volume is defined as:
and both provide a quantity of an erosion volume in reference to a specific area (see Figure 3). The incremental erosion volume is representing the net gradient volume related to a corresponding ratio of areas . In addition to , the incremental erosion volume provides information on the variation of erosion volumes between two individual areas and . Thereby, it is possible to assess and analyse the volumetric change of sediment with the erosion intensity as eroded volume per area with an increasing distance from the center of the structure. The incremental erosion volume is given by:
The incremental erosion volume and the incremental erosion depth are representing both a net gradient volume, relating to an area between two adjacent interrogation areas and . The incremental erosion volume Equation (5) is directly related to Equations (3) and (4) and represents an erosion volume in relation to an area. On the other hand, the incremental parameter depicts an erosion depth for an interrogation area, calculated by normalisation with the pile diameter. This enables a comparison between scour depths and bathymetric surface data as well as a quantification of local and global scour extends for the design and prediction of the foundation structure:
4. Results
4.1. Changes in Bed Topography
It is reasonable to assume from current understanding of scouring and scour extent, that the near bed flow acceleration around a jacket structure is focused along the individual piles. This in turn leads to a mobilization and transport of the sediment bed. Furthermore, it can be assumed that structural elements as braces which are close to the seabed are generally causing additional vortex shedding and streamline contraction, also leading to a potential increase of bed shear stresses, and thus, sediment mobilization. The interaction of structural elements, flow and sediment bed is particularly pronounced if the structural elements are located close to the seabed, as shown in Welzel et al. [31]. To visualize the impact of the structure on the spatial erosion and deposition of sediment, Figure 4 presents an exemplary photo of the model setup and the final scour pattern after test 4 (additional photos of tests 2–5 are provided and described in Welzel et al. [12]).
In the following, the measured bed topography of tests 1–5 are described and graphically illustrated. Figure 5 is divided in to two color representations, color-coding on the left is optimized to differentiate between global (green) and local erosion (blue) as well as deposition (red). Whereas the colorbar on the right side is optimized regarding different elevations, using an HSV colourmap with an additional computed light source. Distances along the x and y axis are given as a dimensionless value times the structure footprint spacing (see Figure 5), defined in the following as A (A = x or y distance/structure footprint reference distance; e.g., 0.5 A = 0.275 m/0.55 m). Test 1 was conducted under wave only conditions , with waves approaching from 90°. For this condition, an overall deposition of sediment around and beneath the structure was observed (Figure 5a). However, reasonable magnitudes of local scour depths were measured around the piles. Similar to those observed in the local scour development (cp. Welzel et al. [12]), measurements of the present study in general confirm a low erosion, in particular for globally affected areas.
Figure 5b illustrates results stemming from test 2, which is conducted under wave dominated flow conditions ( = 20.8 cm/s, KC = 23.4, ) with a superimposed current of = 10.1 cm/s. The 3D scan reveals short-crested sand ripple migration in the wave direction with slightly longer crests compared to test 1. As the same wave spectra were used as in test 1, the change in bed topography indicates that the superimposed steady current of = 10.1 cm/s has a significant impact on the erosion of sediment around the structure. In contrast to test 1, full coverage of the spatial erosion processes is now visible, which is confined to the area beneath the structure. On the other hand, a large deposition of sediment formed at the lee side of the structure (in terms of current flow direction). The extent of the sediment deposition might be a result of the waves, which prevent the sediment from settling down and instead re-distribute the sediment over a relatively large area. It is assumed that this erosion and deposition pattern is a direct consequence of the sediment being picked-up and entrained by the waves and then being transported downstream by the current. These processes cumulate in an increase in the global scour, which reached a maximum global scour depth of about = −0.3 D in a distance of 1.2–1.25 A.
The 3D scan of test 3 (Figure 5c) reveals a long-crested sand ripple migration into the direction of the progressing wave. The test was conducted with a slightly smaller orbital velocity ( = 17.5 cm/s, KC = 14.9) and an increased current velocity ( = 22.5 cm/s) compared to the tests before. This led to a wave current velocity ratio of = 0.56. This particular pattern reveals that erosion of sediment was taking place mainly in the direction of wave propagation. This might be a result of the combination of flow contraction stemming from the current component and vortices induced by waves that dominate the local sediment transport process. Nevertheless, in relation to the current direction, deposition of sediment was found on the lee side and at a small distance from the structure, confined to a long-crested dune-like sediment accumulation. For this test, an erosion depth up to = −0.54 D was measured for a distance of approx. 1.2–1.25 A.
Test 4 (Figure 5d) was conducted under current-dominated conditions . Here, sand ripples with comparable long crests and smaller heights (as compared to steady current conditions) migrated in the current direction. Measurements for test 4 indicate a more globally affected erosion process in particular in between the structure’s footprint area. Laterally distributed erosion areas, emerging from the upstream located piles (pile 1 and 4), indicate that the bed topography is influenced by structure-induced near-bed vortices that arise from the front piles and might be influenced by perpendicular approaching orbital wave motion. Sediment is deposited behind the structure, elongated in the current direction. The global scour in between the structure footprint (areas 1 A) is increased significantly ( = −0.6 D) in comparison to tests 1–3. The incremental erosion depth value increases on up to = −0.71 D over a distance of approximately 1.2–1.25 A.
Figure 5e illustrates test 5, conducted under steady current conditions without the presence of waves for a flow velocity of 38.8 cm/s . The absence of the superposed orbital wave motion led to shorter crested sand ripples migrating in the current direction. Ripples are generally higher and longer than those under combined wave-current load (see Figure 5d). A comparison with studies of [32] and [33] shows a similar bedform of ripples under current only conditions, indicating a fully developed ripple length and height. The 3D scan, depicted in Figure 5d reveals a globally affected erosion pattern with comparable high scour depths ( = −0.75 D) in between the structure footprint (areas 1 A) and a maximum global scour depth of −0.84 D (for 1.2–1.25 A), which is further increased in comparison to test 4. The eroded sediment is deposited behind the structure elongated over a longer distance than shown in test 4.
Present results show that the extent and distribution of the spatial scouring process depends on the hydraulic conditions, i.e., whether the flow is current, or wave dominated. For wave dominated conditions the oscillating flow induced by irregular waves is leading to backfilling of once eroded areas, and thus also to a considerably lower erosion rate, while a more current dominated flow is leading to a more constant bed load and suspended load transport in downstream direction. Therefore, wave dominated conditions of the present study lead to smaller global scour depths, whose pattern seems to align with the direction of wave propagation. Current dominated conditions cause a deeper global scour, whose largest intensity can be found between the individual piles of the jacket structure.
4.2. Analysis of Global Erosion Volumes
Figure 6a illustrates the dimensionless eroded sediment volume with increasing distance from the center of the structure. A general trend of increasing erosion volumes depending on the wave current velocity ratio of each test is depicted. This correlation is in agreement with the observations on the bed topography around the structure as illustrated in Figure 5. The volume of eroded sediment is increased (independently of ) with increasing distance from the structure as expected. However, the rate of volume growth with increasing distance is not constant see Figure 6a. Instead, the volume of eroded sediment is increased rapidly in areas in close proximity to the structure and loses its influence with distance from the jacket. Again, this might be expected, as the amount of eroded volume near the structure is mainly controlled by the local scouring process around the piles. With growing distance from the structure, the influence of the global scouring process on the erosion volume diminishes. Thus, the inconsistent development of is an indication for different erosion processes taking place, the change in the dominance between those processes and thus also an indication for different erosion intensities (eroded sediment volume per area) around the structure.
In addition, to elucidate the dependency of the erosion process on the distance from the structure, Figure 6b illustrates the cumulative erosion volume as a function of . Test 1–3 have been conducted under wave current velocity ratios of 0–0.56. In tests 1–3, wave spectra with higher orbital velocities were studied, leading to a more wave dominated erosion pattern with lower values of . In comparison, test 4–5 have been conducted under current dominated conditions, leading to higher magnitudes of . To allow a comparison between each test, whether a more global or more local erosion process dominated the morphodynamic regime, values around the main piles for approx. 1–1.25 A are compared with magnitudes in between the structure footprint 0.5–1 A, which is more affected by global erosion processes. Therefore, the representation of the cumulative erosion volume reveals a more locally pronounced erosion of sediment around the main piles for test 1–3, as values in between the structure 0.5–1 A are significantly smaller than the maximum value observed in a distance of 1.25 A around the main piles. While measurements for tests 4 and 5 are indicating a more globally affected erosion process as values in between the structure footprint (0.5–1 A) are exhibiting magnitudes of a similar values than the maximum erosion value (1.25 A). However, Figure 6b shows a stable peak at about ~1.25A for each test. Here, the local scour around each pile is superimposed with the global erosion pattern around the foundation structure. Areas in between the structure footprint (A < 1) show larger fluctuations as they are further away from the more stable local scour and normalized over smaller areas. Subsequently, Figure 6b indicates a similar decrease of the cumulative erosion volume for gradients beyond 1.25 A.
As deposition of sediment is not considered, the decrease of eroded volume per area might be explained with a general decrease of flow contraction and disturbances due to vortices. The aforementioned peak of the cumulative eroded volume at around 1.25 A is compared to in Figure 7. Obviously, a slight current superimposed on waves causes the erosion volume to increase significantly. With further increasing values of the maximum eroded sediment volume increased as well. Furthermore, the comparison of values measured in test 4 and 5 shows the addition of irregular waves reduce the amount of eroded sediment. Overall, Figure 7 reveals a rather strong dependency of the maximum eroded volume on . The maximum of eroded sediment can be described as a function of the wave current velocity ratio as follows:
Equation (7) enables the calculation and prediction of the maximum cumulative erosion volume , which appears to be found in a distance of about 1.25 times the structure footprint. Thus, quantifies the maximum erosion volume depending on and is convertible into the parameters introduced in Section 3 (Equations (3)–(6)). The knowledge of this distance, as well as of the values of the eroded sediment at this point, might be of practical use for the prediction of scour and the design of a scour protection system in a graduated intensity starting at . By this means, it might be possible to adapt areas with different erosion intensities to different scour protection areas (e.g., different stone sizes) with a reference on the maximum erosion intensity at . Due to the limited number of tests, the influence of different numbers on the transition between wave and current dominated hydrodynamic conditions could not be studied as of now. However, it is expected, that a wide range of and values would lead to an array of non-dimensional erosion volume curves comparable to the transition of wave and current dominated scour depth at a jacket structure, see Welzel et al. [12] as well as originally developed for cylindrical piles (see e.g., [14,26,27,34,35,36]).
Figure 8 illustrates the cumulative erosion volume (see also Figure 6b) normalized with the maximum value for each test to further elaborate the differences in the development of erosion volumes over the distance from the center of the structure. Starting from a distance of 1.25 A, this representation reveals a rapidly increasing dependency on hydraulic conditions with decreasing distance. Therefore, values corresponding to test 1–3 reveal lower magnitudes in between the structure footprint (0.5–1 A), while values of test 4–5 show magnitudes (0.5–1 A) similar to around the main piles. On the other hand, for distances larger than 1.25 A, the dependency of erosion volumes on the hydraulic condition is much less pronounced. Values for distances > 1.25 A reveal a similar decreasing trend for gradients of eroded sediment. Figure 8 also indicates that the global scouring process is more affected by a change of hydraulic conditions and the interaction of the structure than by the local erosion process, which is limited to approximately 1–1.25 A. An exception is test 1, where large amounts of sediment were deposited near the structure. Test 1 was considered as an outlier for the derivation of Equations (9) and (10) as the test was influenced due to sediment deposition around the structure (see Section 4.1). A combination of Equation (7) and additional terms, that relate to the increase and decrease of erosion volume with change in and distance to structure, leads to a general description of non-dimensional areal erosion volumes for the present study:
with:
In which is calculated for the development over the wave current velocity ratio , multiplicated with a factor in relation to the size of the area to consider for areal volume differences. Equation (9) accounts for the development of distances < 1.25 A, with and to account for different wave current velocity ratios (), while Equation (10) describes the decreasing trend of dimensionless erosion volumes for areas > 1.25 A in dependency to the size of the considered area, which is given with the dimensionless distance A (structure footprint = 1 A).
Equation (8) (approx. = 0.87) allows the calculation of cumulative erosion volumes which makes it possible to quantify the intensity of erosion in reference to the spatial extent. Values calculated with Equation (8) can be converted into parameters introduced in Section 3, Equations (3)–(6). In consequence, it is possible to estimate sediment volumes or scour depths in relation to the hydraulic condition or distance from the center of the structure. The calculated erosion volumes can give important information about a possible impact of a structure or a wind park on the natural dynamics of the ocean floor environment. The knowledge of the value of eroded sediment around and within the foundation structure, thus is also of practical use for the prediction of scour depths or eroded sediment volumes, in example for the design of a structure or a scour protection system around such complex foundation structures. Figure 9 is illustrating cumulative erosion volumes , compared with calculated values of Equation (8) in relation to the distance of each interrogation area to the center of the structure. Measured areal erosion volumes generally agree with the calculated values relating to Equation (8). Nevertheless, some minor differences can be recognized for the areal development (regarding the representation of Equations (9) and (10)) of test 3 and 4.
A comparison of erosion volumes for test 3 (see Figure 9) shows lower eroded sediment volumes within areas of 0.5 A up to 1.25 A as well as slightly higher erosion volumes for areas > 1.25 A. In contrast, test 4 reveals a slightly higher erosion intensity (erosion per area) for the areal development within 0.5–1.25 A as well as a lower intensity for areas > 1.25 A for measured compared to predicted values, see Figure 9. Additionally, Figure 10 illustrates the non-dimensional incremental erosion volumes around the jacket structure and compares them with predicted values obtained with Equation (8). The comparison with Equation (8) shows that predicted values (calculated with Equation (8) and converted from in to ) can correctly describe measured values of of the present study. In contrast to , the incremental erosion volumes exhibit an enhanced fluctuation near the pile which can be explained with the calculation method related to Equation (5). For a distance from the center of the structure > 1.2 A, erosion rates decrease significantly towards an equilibrium stage at a distance of about 3.5 A. The convergence of erosion volume within all tests might thus be used to define the maximum extent of the global scour around the structure. Due to a natural ripple migration under live bed conditions, a certain erosion rate still remained for areas which were unaffected by the immediate structure’s influence on the flow. Therefore, the global scour extent is defined with a threshold of less than 10% of the peak value (at 1.2 A), in reference to the value of an interrogation area, located in a distance of 5 A. For all tests this was the case at a distance between 2.1–2.7 A. As a consequence, the maximum erosion intensity (erosion per area) is reduced by about 90% in this distance. Contrary to approaches which were partly applied to predict global scour development in the past (see e.g. Bolle et al. [10] and Sumer and Fredsøe, [14]), the present study reveals a significant impact of the complex structure on the morphodynamic regime, which extends up to a distance of 2.7 A from the structure.
To provide a comparison to data obtained in the field, Figure 11 juxtaposes data measured in this study with in-situ field data from Rudolph et al. [8], Baelus et al. [9] and Bolle et al. [10]. As erosion volumes are not available for the field datasets, the data is given in terms of the incremental erosion depth in Figure 11. Bolle et al. [10] and Baelus et al. [9] presented field data around the same jacket structure (with approx. = 2 m) in the Thornton Bank offshore wind farm located in the southern North Sea. The authors analyzed several scans of the bed topography at various points in time over a period of three years. Rudolph et al. [8] analyzed bathymetric surveys after three years around a wellhead jacket production platform which was founded by additional post piles and near bed braces. A comparison between common prediction approaches for single piles and the scour development observed in [8] led to a factor of 3–4 times the predicted local scour depths, which might be explained by the disturbing effect of additional structural elements close to the seabed. In consequence, the disturbance impact of the foundation structure on the scour development could not be represented by the pile diameter alone. Instead, the influence of additional post piles as well as the horizontal and diagonal braces have to be considered since additional effects increase the local contraction of the flow and influence the vortex system. Therefore, data of Rudolph et al. [8] are compared in Figure 11 with the post pile diameter = 1.2 m, as well as with an artificially increased diameter = 2 m, similar to the one in [9] and [10]. Furthermore, the data shown in Figure 11 are calculated in reference to the post dredging survey given in [9] and [10] as well as a reference value given in [8]. Whereas a direct comparison of magnitudes of erosion depths between the present study and the field measurements is hindered by missing information on hydraulic conditions, the development of erosion depth with changing distance from the center of the structure can be compared. Therefore, it is revealed that the in-situ field data are generally in agreement with the areal distribution of the incremental erosion depth measured in the present study, given in Figure 11 with the dependence to the dimensionless distance A. The comparison shows in particular that the bathymetric surveys, similarly, yield a peak of erosion depth at a distance of around 1.2–1.25 A. In addition, all datasets exhibit a similar development of erosion depths before and after this distance, i.e., a rapid increase of depths towards the structure and a slower decrease with increasing distance.
As the bed topography, especially shown in Baelus et al. [9] was illustrated over an area of A 3, the global scour extent is analyzed related to the previously introduced definition. The bathymetric surveys of [8] and [9] indicate a reduction of the maximum erosion rate by 90% in a distance of 2.7–2.8 times the structure footprint length (2.7–2.8 A), which is in line with the distance obtained for the data in this study. In this respect, the bathymetric surveys of Bolle et al. [10] show a time dependent context of the global scour development around the jacket foundation as those surveys were conducted 3 and 5 months after the installation. On the other hand, the bathymetric surveys of Rudolph et al. [8] and Baelus et al. [9] were measured three years after the installation of the jacket structure. In addition to the varying and unknown hydraulic conditions, differences between the field data and the test results might stem from a difference in the time dependent stage of the global scour development as well as differences in the structural design.
The previously described comparison illustrates that findings stemming from the present laboratory study, generally agree with data from field studies (surveys of Rudolph et al. [8]; Baelus et al., [9] and Bolle et al. [10]). Furthermore, it is shown that predicted values (calculated with Equation (8)) generally agree with measurements from the present study. It is shown that the introduced equations and methods generally account for the spatial extent of global erosion volumes and scour depths around the compared jacket structures, also for jacket structures which have a non-symmetric footprint as shown with the compared field data of Rudolph et al. [8]. Additionally, it is revealed that it is possible to determine areas which exhibit or exceed a certain erosion rate. A similar areal distribution of eroded sediment volume as well as a global scour extent in a range of the present study (2.1–2.7 A) is found with a comparison of in-situ data (2.7–2.8 A). The comparison between the present study and in-situ field measurements reveals a significant impact on the near field (A < 1) but also on the morphodynamic regime close to the structure (2.7 > A > 1). Furthermore, the analysis proves, that jacket structures, known as “hydrodynamic transparent” can also cause global scouring under certain hydrodynamic conditions.
4.3. Local Scour around Individual Piles
In this section the local scour around each pile is analyzed thoroughly and compared with the global erosion on the near-field bed topography around the structure. For this, local and global erosion volumes are analyzed and defined. In contrast to definitions given in previous paragraphs, related interrogation areas are arranged in a circular pattern and are related to a distance times the pile diameter (see Figure 12).
Figure 13 shows a top view of the measured bed topography over an area of 7 D around each pile. X and Y coordinates refer to the center of each individual pile and are given in multiples of the diameter. This allows a direct comparison between the bed topography and the analyzed erosion depths . A shadowing effect of the jacket piles, which could not be eliminated with the present filtering method, seemed to have only marginal influence on the computed surface elevation near the piles. This is observed for example in Figure 13e around pile 1. The influences were found to be negligible for the calculated erosion volumes.
Similar to what was found in the global erosion analysis, the local bed topography generally confirms the trend of deeper scour with an increasing wave current velocity ratio. The bed topography of test 1 (Figure 13b), on the one hand, illustrates the deposited sediment volume as an influence on the measurement, but on the other hand, also shows a reasonable local erosion depth around each pile. Furthermore, the bed topography for tests 2–5 (Figure 13c–f) shows an increase in scouring on the upstream side of each pile, relative to the current direction, as well as higher erosion rates for pile 1 and 4 (upstream located, in current direction) in comparison to pile 2 and 3 (downstream located). The bed topography measured for tests 4 and 5 around pile 1 and 4 (Figure 13e,f) shows a similar magnitude of erosion. As shown by Welzel et al. [12], for current dominated flow conditions with values of > 0.7 the local scour depth approach values similar to that in current only conditions, whereas the bed topography measured after test 5 (Figure 13f) shows a significant deeper scour around pile 3 and a less pronounced scour depth around pile 2 than around the equivalent piles after test 4. Nevertheless, a clear explanation despite the fluctuations due to erosion and backfilling is not found yet for the difference between pile 2 and 3 at the end of test 5. Furthermore, especially test 4 and 5 reveal a slightly higher erosion of sediment in an area under the diagonal braces (crossing the current direction), which is an indicator for increased bed shear stresses below these diagonal braces. A similar erosion pattern with increased scour depths below the braces was found by Welzel et al. [31], who conducted tests for the same hydraulic conditions and the same jacket structure, only with the difference that the lowest nodes were closer to the seabed.
Figure 14 compares the development of the erosion depth for each pile over increasing circle areas. Independent of the hydraulic condition and the position of each pile, the maximum erosion depth was always found at a distance from the pile of around 2 D. At the inner most points measurements show that the bed elevation appears to decrease again. As shown in Figure 14 measurements, related to areas > 2 D reveal a similar decreasing trend of erosion, in relation to the slope of the scour hole. As sand is being re-distributed, the local slope angle exceeds the internal friction angle, hence the inner frictional forces of sediment grains are not able to withstand the gravity acting on the grains and thus sediment sliding occurs. Sediment slides from higher to lower locations of the bed and erodes again. A comparison of the incremental erosion depth of global areas (cp. Figure 11) with local erosion depth values (Figure 14) illustrates a significantly higher erosion per surface area for eroded sediment close around each pile. With distance from the pile, the erosion depth resembles that of the global erosion value. However, it remains strongly dependent on even for larger distances to the pile. The global scour depths for different values of clearly converged with increasing distance from the structure, indicating a boundary of influence of the structure’s interaction with the flow. The influence is not as clear for the local scouring processes around the main piles, illustrated in Figure 14. The global erosion causes a subsidence of the seabed simultaneously to the deepening of the local scour hole. However, Figure 14 reveals a boundary of influence at a distance from the pile at which the gradient of the erosion depth clearly decreases. Based on this definition, the size of the local scour hole is found to be about 5–6 D for the present study and 3 D as an outlier for test 1. Thus, the maximum extent of the local scour hole is defined as six times the pile diameter. The distance of about 6 D, at which the gradient of erosion clearly decreases, thus might be interpreted as the boundary of influence of the local scour processes on the global ones. The knowledge of this distance, as well as of the values of eroded sediment, is of practical use for the design of a scour protection system and the required spatial extent.
The literature reports that hydrodynamic interactions are relatively small for distances > 6 D around circular cylinders [16,17,18], which is partly transferred as a border of influence for global scouring processes [10]. The present jacket model has a spacing of ~14 D between the pile centers, which is far above a previously described critical distance of 6 D. The volume analysis presented in paragraph 3 proves that there is a significant influence on the global erosion for areas > 6 D for the present structure. Nevertheless, the illustrated erosion depth shown in Figure 14 also confirms that hydrodynamic interactions are significantly smaller for distances > 6 D.
To quantify and compare local and global erosion processes on the overall eroded sediment volume, global erosion volumes are calculated for a threshold of 1.25 A as this distance was found to mark the maximum erosion intensity around the structure. The local eroded sediment volume is considered to be limited to an area of approximately 6 D, as discussed previously, and is summed up for all four piles. Figure 15 illustrates the difference between local and global dimensionless erosion volumes as a function of . For values smaller than = 0.56 large amounts of the global erosion volume can be attributed to local scouring processes around the individual piles. In particular, for = 0.56, 68% of the erosion volumes can be referred to locally eroded sediment and 32% to globally eroded sediment volumes. However, Figure 15 also reveals that the share of global erosion processes is significantly increased in current dominated hydrodynamic conditions. Measurements of the present study show an increase to about twice the amount of locally eroded sediment volume under current dominated conditions, see Figure 15.
5. Remarks Regarding Practical Application and Scale Effects
Remark 1: Uncertainties regarding various scale effects may exist and must be considered when results of small-scale experiments are extrapolated to prototype conditions. Scale effects in laboratory experiments with a movable bed, e.g., the erosion of sediment, are attributed to the well-known difficulties in geometrically scaling sediment [37,38]. To avoid cohesive behaviour, the sediment was not geometrically scaled in accordance with the model length scale. Instead, to ensure some form of similitude of sediment mobility, the flow velocities were scaled related to the desired flow intensities, i.e. to reach shields parameters (calculated after Soulsby and Clarke [39]) close to the critical Shields parameter. In addition, wave parameters were selected to achieve a certain range of Keulegan-Carpenter numbers and wave current velocity ratios . As a result of the disproportional scaled sediment, i.e., relatively large grain sizes compared to field conditions with comparable small velocities in the present tests, it is expected that bedload transport is thus overrepresented in relation to suspended sediment transport. In consequence, a complete similitude in sediment transport and sediment pick-up rate is not reached. A possible scale effect in consequence of the underestimated ration of suspended load might be that sediment is transported over shorter distances as in prototype scale, presumably leading to different deposition patterns of sediment.
Remark 2: As a consequence of the disproportionally scaled sediment, the bed forms, e.g., ripples are also larger in the laboratory experiments than in the field. The dynamic flow field over ripples causes form drag and turbulence associated with erosion on the stoss side (upstream side) and deposition of sediment on the lee side (downstream side) of the ripples. As an effect of the increased ripple size the boundary layer is also affected and might be increased in thickness, thus leading to a larger horseshoe vortex, influencing the scour development around the piles [14]. Furthermore, according to Sutherland and Whitehouse [40] there is an increased sediment transport due to ripple migration in a model with non-linear flows with proportional larger ripples than in a prototype scale with equally non-linear flows.
Remark 3: In order to compare the present results with field measurements, it is also important to know which temporal stage of the scouring process was reached during the tests, i.e., whether or not an equilibrium stage was achieved. As tests of the present study have been part of Welzel et al. [12], in which the development of scour around the jacket at different locations over time was analyzed, the test duration was generally chosen to enable the scour process to reach the equilibrium stage. By an extrapolation of the expected equilibrium scour depths, Welzel et al. [12] concluded that around 90% of the equilibrium depths were reached for the local scouring processes at the end of the tests. In contrast, the study did not show a clear attainment of an equilibrium stage for measurements related to the global scour depth, particularly under higher current velocities. With a scale factor of 1:30, present test durations correspond to a storm duration of ~20–45 hours, depending on the wave period. This is in the range of typical storm durations in the North Sea [41], but presumably not enough to reach a global scour equilibrium stage (also under laboratory conditions). The local scour depth data and combined bed topography data of Baelus et al. [9] and Bolle et al. [10] indicate a similar trend of a faster developing local scour and a slower developing global scour. Results of [9,10] and [12] therefore indicate that local and global scouring rates are controlled by scouring processes on different time scales. However, the results also indicate that local and global scouring processes are affected by a characteristic depth ratio but are correlated to each other by means of entwined feedback mechanisms, presumably leading to an influence of the global scour on the local scour development and vice versa (see [12]). In particular, the timescale of the global scour development as well as the impact on the local scour development seems to be an important research question in this context, which remains unsolved.
Remark 4: Furthermore, it should be noted that prediction approaches as Equation (8) and Equation (7) are derived for tests based on the present study. Therefore, caution must be exercised when these equations are applied and extrapolated to prototype conditions. To better estimate differences to prototype conditions, scale effects have been discussed and measurements of the present study were compared to available field studies on the scour development around jacket structures (see Figure 11).
6. Summary and Conclusions
Only a few studies exist which provide an approach to analyze complex erosion patterns around offshore foundations. Therefore, hydraulic model tests were carried out, investigating the spatial erosion process in the near-field and vicinity of the hydrodynamic transparent jacket-structure in combined wave and current conditions. The main conclusions can be summarized as follows:
- Different volume analyzing methods and dimensionless parameters are introduced which can be generally adapted for any other offshore structure or coastal structure to reveal physical processes in complex erosion patterns. Therefore, eroded sediment volumes are normalized in relation to a structural volume as well as in relation to the considered erosion area, , and the structural diameter , given in Equations (3)–(6).
- A comparison between locally (circle area of 6 D around each pile) and globally (area of 1.25 times the structure footprint) attributed erosion volumes revealed that wave dominated hydrodynamic conditions with 0.57 led to scour patterns which were dominated by local erosion around the piles (68% locally, 32% globally, for = 0.57). Furthermore, it is shown that the share of globally eroded sediment volume is significantly increased in current dominated conditions 0.75 (33% locally, 67% globally, for = 1.0).
- The literature reports that hydrodynamic interactions between groups of circular piles are small if the distance between them is larger than six times the piles’ diameter [14,15,16]. In the past, this was partly interpreted as a border beyond which global scour around jacket-type foundations may not occur [10]. In contrast to this, insights from the present study illustrate that the area of the seafloor affected by a supposedly transparent hydraulic structure is considerably larger than expected and is estimated to be 2.1–2.7 times the structure’s footprint for the present study.
- A comparison reveals that findings stemming from the present study generally agree well with in-situ data from field studies [8,9,10]. Similar areal distributions of eroded sediment volume with a stable maximum of the erosion intensity at 1.25 A (1.25 times the structure’s footprint) as well as a global scour extent in a similar range to the present study (2.1–2.7 A) is found from a comparison of in-situ data (2.7–2.8 A).
- To improve the prediction of global scour around jacket-type offshore foundations, empirical expressions (Equations (7) and (8)) are proposed to account for the areal development and extent of global erosion volumes and scour depths in the near-field and vicinity of the foundation structure. The analysis and derivation is explained stepwise and is based on insights of the introduced methods. Furthermore, the knowledge of the extent of erosion patterns in relation to the erosion intensity, as well as of the value of the eroded sediment at different points, is useful for the design of a scour protection system around such complex foundation structures. While the former might be used to determine the required spatial extent of a scour protection, the latter helps determining the volume, which has to be refilled by a subsequently installed scour protection.
- Results allow a prediction of areas which exceed a certain erosion rate as well as a quantification of spatially eroded sediment in the near-field and vicinity of the foundation structure. By this means a structure-induced environmental footprint as a measure of eroded sediments partially affecting marine habitat can be exposed. Once eroded sediment is entrained into the water column it deposes behind the structure with the effect of burying marine habitats and can be transported over long distances due to long lasting vortices and an increased turbulence and mixing [5,6,7]. As a consequence, not only areas in the vicinity but also in the far-field of the structure can be affected, with potential impacts [2,3,4] on the marine wildlife and the ocean seabed environment in general. These potential impacts to the marine environment might represent an important hurdle for the future of wind technology in general.
Author Contributions
For this research article the specifying of the individual contributions of the authors is as follows: idea and concept of the article, M.W.; methodology, M.W.; investigation and volume calculations, M.W.; resources, T.S.; writing—original draft preparation, M.W.; writing—review and editing, M.W., A.S., T.S. and A.H.; supervision, T.S. and A.H.; project administration, T.S. and A.H.; funding acquisition, T.S.
Funding
The present study is part of the research project “HyConCast—Hybrid substructure of high strength concrete and ductile iron castings for offshore wind turbines” (BMWI: 0325651A). The authors gratefully acknowledge the support of the German Federal Ministry for Economic Affairs and Energy within the funded project. The publication of this article was funded by the Open Access fund of Leibniz Universität Hannover.
Acknowledgments
The authors gratefully acknowledge the support of T. Kreklow, and F. Faltin for their support in conducting the laboratory experiments and pre-processing of the 3D scan data. The authors thank also the FZK and in particular M. Miranda-Lange for support related to the 3D scanner.
Conflicts of Interest
The authors declare no conflict of interest.
Notations
| Reference distance times the structure footprint length; A given times the structure footprint distance, for this structure 0.55 m in both directions, 1 A = 0.55 m/0.55 m, A = x or y distance / structure footprint distance in x or y direction | |
| Structure footprint area; for the present study | |
| Interrogation area in dependence to | |
| Additional term of equation (9); | |
| Additional term of equation (9); | |
| Pile Diameter of the main struts of the jacket structure or | |
| Diameter of the pile sleeve of the jacket structure | |
| Diameter of the legs of the jacket structure | |
| Incremental erosion depth; representing an erosion depth of the related interrogation area times the pile diameter | |
| Grain size for which 50% of the material by weight is finer | |
| Frequency | |
| Gravitational acceleration | |
| Significant wave height | |
| Keulegan-Carpenter number | |
| Number of piles | |
| Velocity frequency spectrum | |
| Orbital velocity at the bed in direction of the waves | |
| Undisturbed current velocity at 2.5 D from bed | |
| Mean current velocity of the vertical profile | |
| Wave-current velocity ratio | |
| Undisturbed maximum orbital velocity at 2.5 D from bed | |
| Root-mean-square (RMS) value of at the seabed | |
| Cumulative erosion volume; in relation to each normalized area | |
| Additional term in equation (8) to account for the areal development of volumes | |
| Dimensionless erosion volume; of an interrogation area in relation to the structural reference volume | |
| Incremental erosion volume; the net gradient volume in relation to each corresponding area . | |
| Eroded sediment volume in m3 below a reference value based on the pre-scans | |
| Shields parameter | |
| Critical value of the Shields parameter |
References
- International Renewable Energy Agency (IRENA). Offshore Innovation Widens Renewable Energy Options: Opportunities, Challenges and the Vital Role of International Co-Operation to Spur the Global Energy Transformation (Brief to G7 Policy Makers); IRENA: Abu Dhabi, UAE, 2018. [Google Scholar]
- Carpenter, J.R.; Merckelbach, L.; Callies, U.; Clark, S.; Gaslikova, L.; Baschek, B. Potential Impacts of Offshore Wind Farms on North Sea Stratification. PLoS ONE 2016, 11, e0160830. [Google Scholar] [CrossRef] [PubMed]
- Shields, M.A.; Woolf, D.K.; Grist, E.P.M.; Kerr, S.A.; Jackson, A.C.; Harris, R.E.; Bell, M.C.; Beharie, R.; Want, A.; Osalusi, E.; et al. Marine renewable energy: The ecological implications of altering the hydrodynamics of the marine environment. Ocean Coast. Manag. 2011, 54, 2–9. [Google Scholar] [CrossRef]
- Miller, R.G.; Hutchison, Z.L.; Macleod, A.K.; Burrows, M.T.; Cook, E.J.; Last, K.S.; Wilson, B. Marine renewable energy development: Assessing the Benthic Footprint at multiple scales. Front. Ecol. Environ. 2013, 11, 433–440. [Google Scholar] [CrossRef]
- Grashorn, S.; Stanev, E.V. Kármán vortex and turbulent wake generation by wind park piles. Ocean Dyn. 2016, 66, 1543–1557. [Google Scholar] [CrossRef]
- Vanhellemont, Q.; Ruddick, K. Turbid wakes associated with offshore wind turbines observed with Landsat 8. Remote Sens. Environ. 2014, 145, 105–115. [Google Scholar] [CrossRef] [Green Version]
- Vanhellemont, Q.; Ruddick, K. Landsat-8 as a Precursor to Sentinel-2: Observations of Human Impacts in Coastal Waters. Presented at the 2014 European Space Agency Sentinel-2 for Science Workshop, Frascati, Italy, 20–23 May 2014. ESA Special Publication SP-726. [Google Scholar]
- Rudolph, D.; Bos, K.J.; Luijendijk, A.P.; Rietema, K.; Out, J.M.M. Scour Around Offshore structures—Analysis of Field Measurements. In Proceedings of the Second International Conference on Scour and Erosion, ICSE 2, Singapore, Singapore, 14–17 November 2004. [Google Scholar]
- Baelus, L.; Bolle, A.; Szengel, V. Long term scour monitoring around offshore jacket foundations on a sandy seabed. In Proceedings of the Ninth International Conference on Scour and Erosion, ICSE 9, Taipei, Taiwan, 5–8 November 2018. [Google Scholar]
- Bolle, A.; de Winter, J.; Goossens, W.; Haerens, P.; Dewaele, G. Scour monitoring around offshore jackets and gravity based foundations. In Proceedings of the Sixth International Conference on Scour and Erosion, ICSE 6, Paris, France, 27–31 August 2012. [Google Scholar]
- Chen, H.H.; Yang, R.Y.; Hwung, H.H. Study of Hard and Soft Countermeasures for Protection of the Jacket-Type Offshore Wind Turbine Foundation. J. Mar. Sci. Eng. 2014, 2, 551–567. [Google Scholar] [CrossRef]
- Welzel, M.; Schendel, A.; Hildebrandt, A.; Schlurmann, T. Scour development around a jacket structure in combined waves and current conditions compared to monopile foundations. Coast. Eng. 2019, 152, 103515. [Google Scholar] [CrossRef]
- Sumer, B.M.; Fredsøe, J. Wave scour around group of vertical piles. J. Waterw. Port Coast. Ocean Eng. 1998, 124, 248–256. [Google Scholar] [CrossRef]
- Sumer, B.M.; Fredsøe, J. The Mechanics of Scour in the Marine Environment; World Scientific: Hackensack, NJ, USA; Singapore; London, UK; Hong Kong, China, 2002. [Google Scholar]
- Yagci, O.; Yildirim, I.; Celik, M.F.; Kitsikoudis, V.; Duran, Z.; Kirca, V.S.O. Clear water scour around a finite array of cylinders. Appl. Ocean Res. 2017, 68, 114–129. [Google Scholar] [CrossRef]
- Breuers, H.N.C. Local Scour Near Offshore Structures; Delft Hydraulics Publication: Delft, The Netherlands, 1972. [Google Scholar]
- Hirai, S.; Kuruta, K. Scour around multiple- and submerged circular cylinders. Memoirs Faculty of Engineering; Osaka City University: Osaka, Japan, 1982; Volume 23, pp. 183–190. [Google Scholar]
- Hildebrandt, A.; Sparboom, U.; Oumeraci, H. Wave forces on groups of slender cylinders in comparison to an isolated cylinder due to non-breaking waves. In Proceedings of the International Conference on Coastal Engineering, NO. 31, Hamburg, Germany, 31 August 2008. [Google Scholar]
- Porter, K.E. Seabed Scour Around Marine Structures in Mixed and Layered Sediments. Ph.D. Thesis, University College London (UCL), London, UK, 2016. [Google Scholar]
- Margheritini, L.; Frigaard, P.; Martinelli, L.; Lamberti, A. Scour around monopile foundations for offshore wind turbines. In Proceedings of the First International Conference on the Application of Physical Modelling to Port and Coastal Protection (CoastLab06), Porto, Portugal, 8–10 May 2006. Faculty of Engineering, University of Porto. [Google Scholar]
- Stahlmann, A.; Schlurmann, T. Kolkbildung an komplexen Gründungsstrukturen für Offshore-Windenergieanlagen—Untersuchungen zu Tripod-Gründungen in der Nordsee. Bautechnik 2012, 89, 293–300. [Google Scholar] [CrossRef]
- Hartvig, P.A.; Thomsen, J.M.; Frigaard, P.; Andersen, T.L. Experimental Study of the development of scour and backfilling. Coast. Eng. 2010, 52, 157–194. [Google Scholar] [CrossRef]
- Porter, K.; Simons, R.; Harris, J. Comparison of three techniques for scour depth measurement: Photogrammetry, Echosounder profiling and a calibrated pile. In Proceedings of the International Conference on Coastal Engineering, No. 34, Seoul, Korea, 15–20 June 2014. [Google Scholar]
- Raaijmakers, T.; Rudolph, D. Time-dependent scour development under combined current and waves conditions—laboratory experiments with online monitoring technique. In Proceedings of the Fourth International Conference on Scour and Erosion, ICSE 4, Tokyo, Japan, 5–7 November 2008. [Google Scholar]
- Petersen, T.U.; Sumer, B.M.; Fredsøe, J. Time scale of scour around pile in combined waves and current. In Proceedings of the Sixth International Conference on Scour and Erosion, ICSE 6, Paris, France, 27–31 August 2012. [Google Scholar]
- Qi, W.G.; Gao, F.P. Physical modeling of local scour development around a large-diameter monopile in combined waves and current. Coast. Eng. 2014, 83, 72–81. [Google Scholar] [CrossRef] [Green Version]
- Sumer, B.M.; Fredsøe, J. Scour around pile in combined waves and current. J. Hydraul. Eng. 2001, 127, 403–411. [Google Scholar] [CrossRef]
- Soulsby, R. Dynamics of Marine Sands: A Manual for Practical Applications; Thomas Telford: London, UK, 1997. [Google Scholar]
- Vosselman, G. Slope Based Filtering of Laser Altimetry Data. Int. Soc. Photogramm. Remote Sens. Congr. Amst. 2000, 33, 935–942. [Google Scholar]
- Raudkivi, A.J.; Ettema, R. Clear-water scour at cylindrical piers. J. Hydraul. Eng. 1983, 109, 338–350. [Google Scholar] [CrossRef]
- Welzel, M.; Schlurmann, T.; Hildebrandt, A. Local scour development and global sediment redistribution around a jacket-structure in combined waves and current. In Proceedings of the Ninth International Conference on Scour and Erosion, ICSE 9, Taipei, Taiwan, 5–8 November 2018. [Google Scholar]
- Coleman, S.E.; Melville, B.W. Bed-Form Development. J. Hydraul. Eng. 1994, 120, 544–560. [Google Scholar] [CrossRef]
- Flemming, B.W. Zur Klassifikation subaquatischer, strömungstransversaler Transportkörper. Boch. Geol. Geotech. Arb. 1988, 29, 93–97. [Google Scholar]
- Rudolph, D.; Bos, K.J. Scour around a monopile under combined wave current conditions and low KC-numbers. In Proceedings of the Third International Conference on Scour and Erosion, ICSE 3, Amsterdam, The Netherlands, 1–3 November 2006. [Google Scholar]
- Zanke, U.C.E.; Hsu, T.W.; Roland, A.; Oscar, L.; Reda, D. Equilibrium scour depths around piles in noncohesive sediments under currents and waves. Coast. Eng. 2011, 58, 986–991. [Google Scholar] [CrossRef]
- Sumer, B.M.; Petersen, T.U.; Locatelli, L.; Fredsøe, J.; Musumeci, R.E.; Foti, E. Backfilling of a Scour Hole around a Pile in Waves and Current. J. Waterw. Port Coast. Ocean Eng. 2013, 139, 9–23. [Google Scholar] [CrossRef]
- Ettema, R.; Melville, B.W.; Barkdoll, B. Scale effects in pier-scour experiments. J. Hydraul. Eng. 1998, 124, 639–642. [Google Scholar] [CrossRef]
- Hughes, S.A. Physical Models and Laboratory Techniques in Coastal Engineering; World Scientific Publishing Co. Pte. Ltd: Singapore; London, UK, 1993. [Google Scholar]
- Soulsby, R.; Clarke, S. Bed Shear-Stresses under Combined Waves and Currents on Smooth and Rough Beds; Report TR 137 Rev 1.0; HR Wallingford: Wallingford, UK, 2005. [Google Scholar]
- Sutherland, J.; Whitehouse, R.J.S. Scale Effects in the Physical Modelling of Seabed Scour; Report TR 64; HR Wallingford: Wallingford, UK, 1998. [Google Scholar]
- Hildebrandt, A.; Schmidt, B.; Marx, S. Wind-wave misalignment and a combination method for direction-dependent extreme incidents. Ocean Eng. 2019, 180, 10–22. [Google Scholar] [CrossRef]
Figure 1.
Sketch of the wave basin, plan view including the test setup, unidirectional current is coming from left to right with 0°, waves are propagating perpendicular in 90°.
Figure 1.
Sketch of the wave basin, plan view including the test setup, unidirectional current is coming from left to right with 0°, waves are propagating perpendicular in 90°.

Figure 2.
Schematic view of the jacket model (a) plan view on the model, including dimensions, the mounted echo sounding transducer, the reference structure footprint and the increasing interrogation area to compute the erosion volume (b) side view of the model with dimensions, angles and water level, D = 4 cm.

Figure 3.
Schematic sketch of increasing rectangular interrogation areas around the present model, (a) illustrated exemplarily for an area , related to Equation (4) ( = 1.1 × 1.1 m, shaded area); (b) as well as increasing incremental areas, related to Equation (5). Interrogation areas are centered to the structure, starting at up to .

Figure 4.
Exemplary photo of the model setup and scour pattern after test 4; the dashed line illustrates the extent of the global scour, current is coming from left to right with 0°, waves are propagating perpendicular in 90°.
Figure 4.
Exemplary photo of the model setup and scour pattern after test 4; the dashed line illustrates the extent of the global scour, current is coming from left to right with 0°, waves are propagating perpendicular in 90°.

Figure 5.
Bed topography measured after test 1–5 (a–e), top view on erosion and deposition around the jacket structure, current is coming from left to right, waves are propagating in 90° to the current, x and y distances given times the structure footprint length of 0.55 m, 1 A = 0.55 m/0.55 m [-]; (left) optimized illustration to differ between global (green) and local (blue) erosion depths as well as deposition (red); (right) HSV colourmap to differentiate between different elevations.

Figure 6.
(a) Dimensionless eroded sediment volume (see Equation (3)) as function of the distance from the center of the structure A; (b) cumulative eroded volume (see Equation (4)) in dependency to the dimensionless distance A given times the structure footprint of 0.55 m, 1 A = 0.55 m/0.55 m [-].
Figure 6.
(a) Dimensionless eroded sediment volume (see Equation (3)) as function of the distance from the center of the structure A; (b) cumulative eroded volume (see Equation (4)) in dependency to the dimensionless distance A given times the structure footprint of 0.55 m, 1 A = 0.55 m/0.55 m [-].

Figure 7.
Maximum cumulative erosion volume (see Equation (4)) of test 1–5, depicted over the wave current velocity ratio (see Equation (2)) in comparison to Equation (7) (see also Figure 6b; ~1.25 A).
Figure 7.
Maximum cumulative erosion volume (see Equation (4)) of test 1–5, depicted over the wave current velocity ratio (see Equation (2)) in comparison to Equation (7) (see also Figure 6b; ~1.25 A).

Figure 8.
Cumulative erosion volume (see Equation (4)), normalized with the maximum value as a function of the distance A to the center of the structure, compared with predicted erosion volumes relating to Equation (9), A < 1.25 A and Equation (10) for A > 1.25 A, for Equation (8) including Equations (9) and (10).

Figure 9.
Cumulative erosion volume (see Equation (4)) as a function of the distance A to the center of the structure, compared with calculated values after Equation (8).
Figure 9.
Cumulative erosion volume (see Equation (4)) as a function of the distance A to the center of the structure, compared with calculated values after Equation (8).

Figure 10.
Incremental erosion volume (see Equation (5)) depicted over the structure footprint length A and compared with calculated values stemming from Equation (8).
Figure 10.
Incremental erosion volume (see Equation (5)) depicted over the structure footprint length A and compared with calculated values stemming from Equation (8).

Figure 11.
Global erosion of the dimensionless incremental erosion depth (see Equation (6)) around the jacket structure plotted over the structure footprint A, compared with in-situ field measurements of Rudolph et al. [8], Baelus et al. [9] and Bolle et al. [10].

Figure 12.
Schematic showing the increasing circle interrogation areas around pile (P1–P4), illustrated exemplarily for a circle area with a diameter of 4 D for pile 1, related to Equation (6).
Figure 12.
Schematic showing the increasing circle interrogation areas around pile (P1–P4), illustrated exemplarily for a circle area with a diameter of 4 D for pile 1, related to Equation (6).

Figure 13.
(a) Local bed topography, illustrated as an example for test 5, pile 3 with a sketch of the diagonal braces, including the direction of the incoming current, which is coming from left to right, waves are perpendicular to the current as well as exemplary circles related to an incremental interrogation area of 3 D and the directions of the diagonal braces; (b–f) local bed topography related to test 1–5; (b–f) in an area of 7 D around each main pile of the jacket structure.

Figure 14.
Local, nondimensional erosion depth (see Equation (6)) plotted over increasing diameters D around pile 1–4 (a–d), inner graphical subset of figure a–d is showing the related pile location, current (0° from left to right) and wave (90° perpendicular to the current) direction.
Figure 14.
Local, nondimensional erosion depth (see Equation (6)) plotted over increasing diameters D around pile 1–4 (a–d), inner graphical subset of figure a–d is showing the related pile location, current (0° from left to right) and wave (90° perpendicular to the current) direction.

Figure 15.
Comparison between non-dimensional local erosion volumes (see Equation (3)) of pile 1–4, depicted over the wave current velocity ratio (see Equation (2)) for circular areas of 6 D and global erosion volumes for rectangular areas of 1.25 times the structure footprint length (1.25 A).
Figure 15.
Comparison between non-dimensional local erosion volumes (see Equation (3)) of pile 1–4, depicted over the wave current velocity ratio (see Equation (2)) for circular areas of 6 D and global erosion volumes for rectangular areas of 1.25 times the structure footprint length (1.25 A).


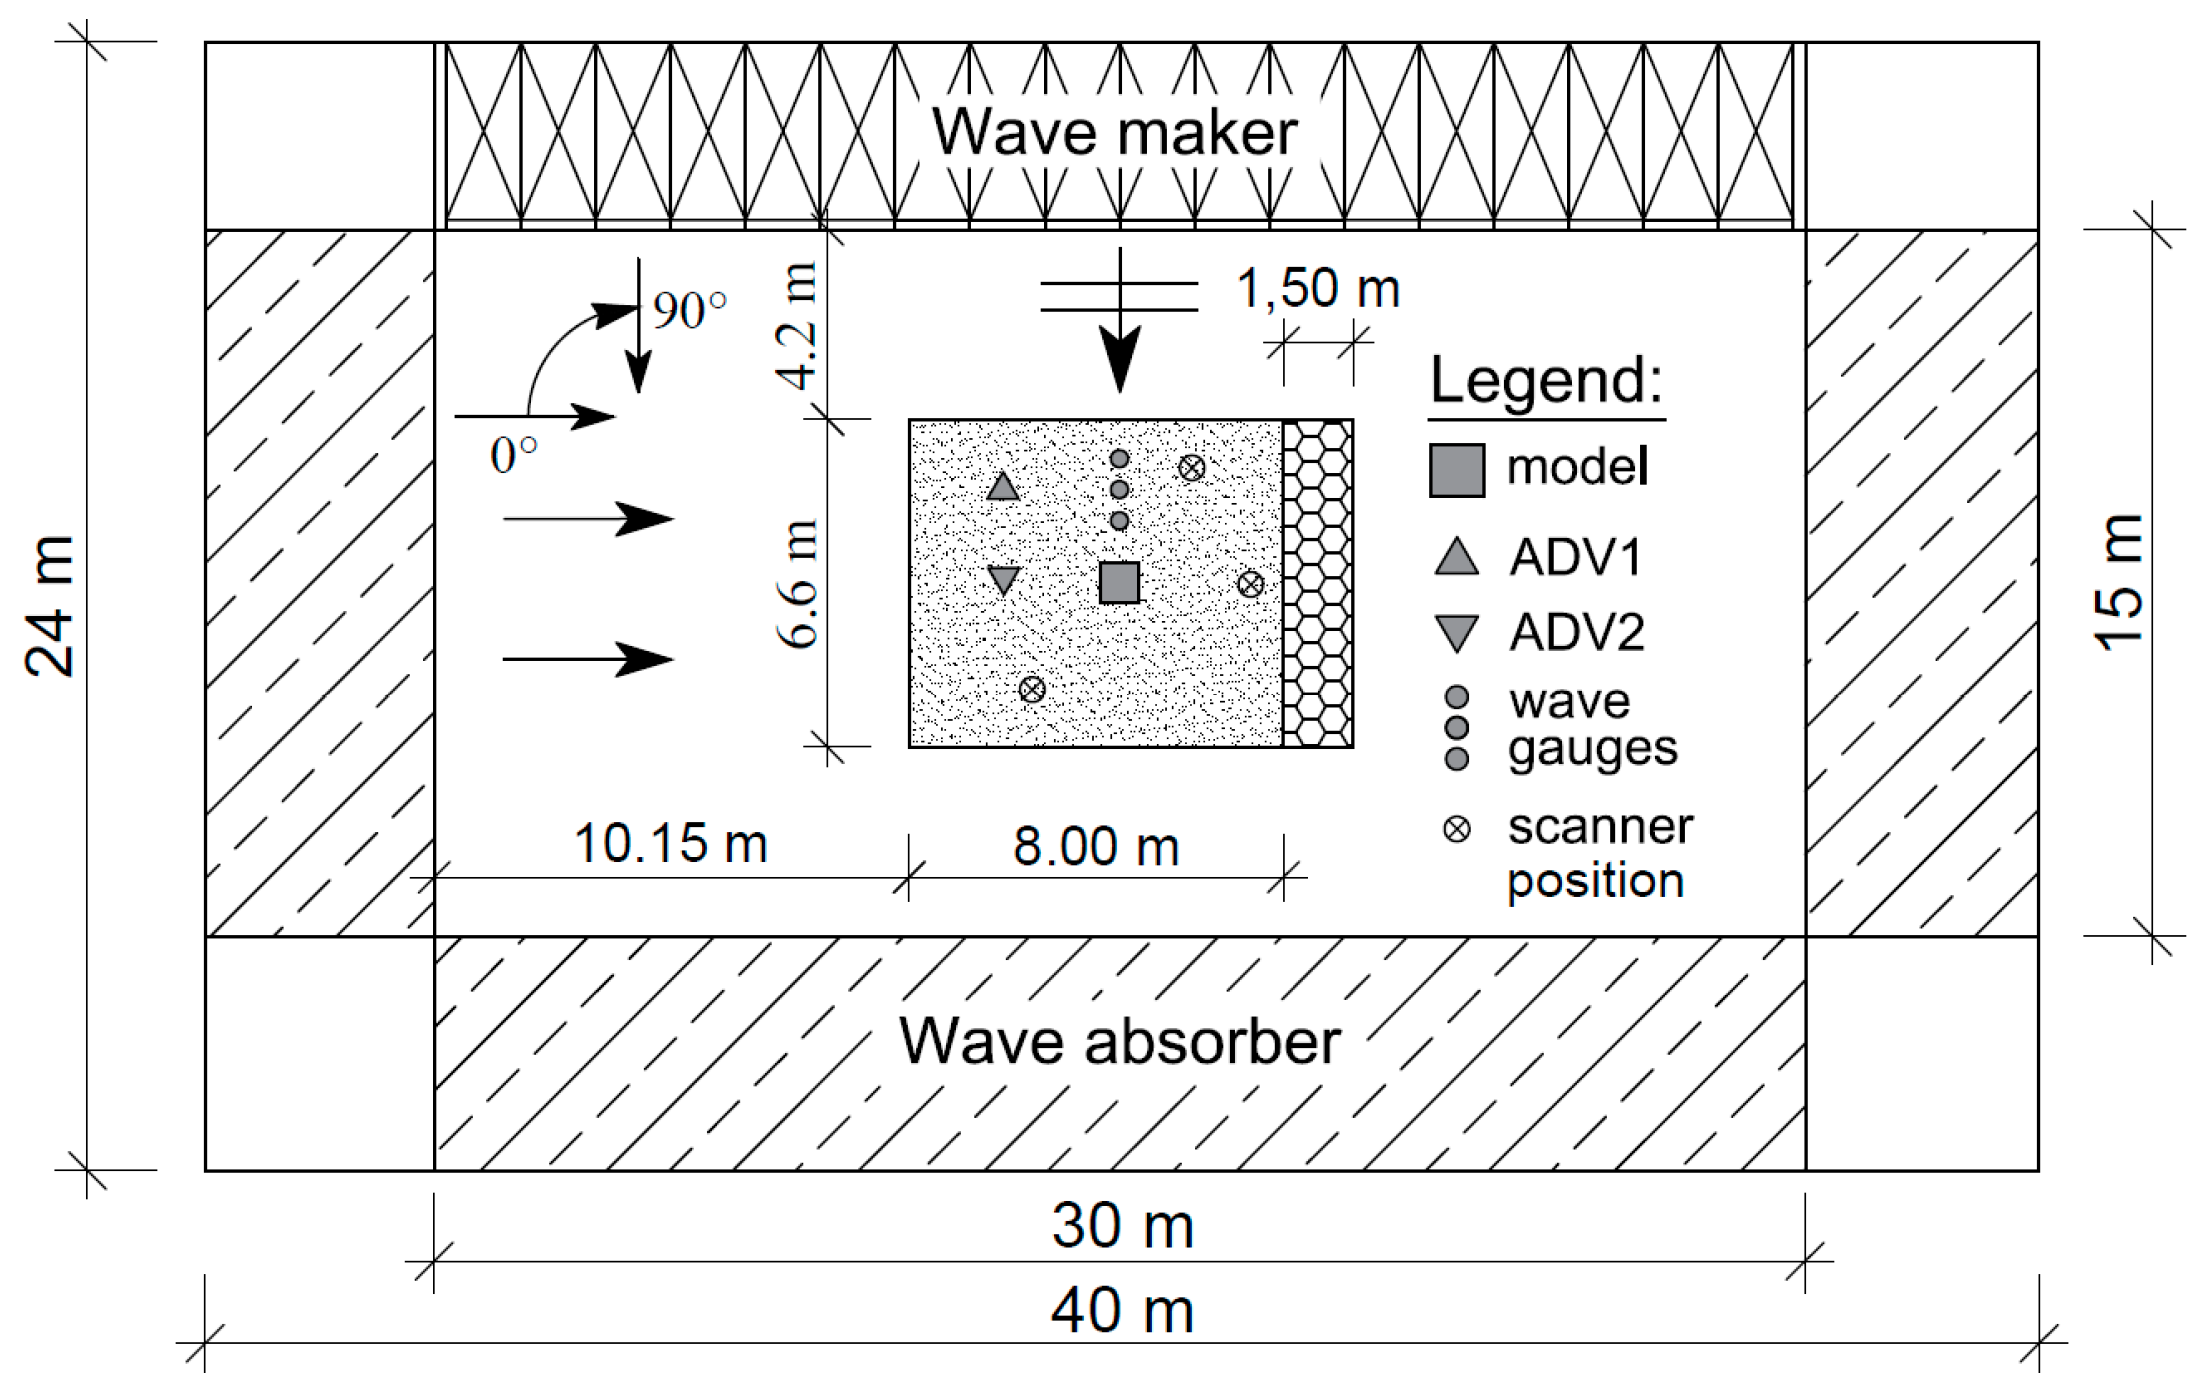
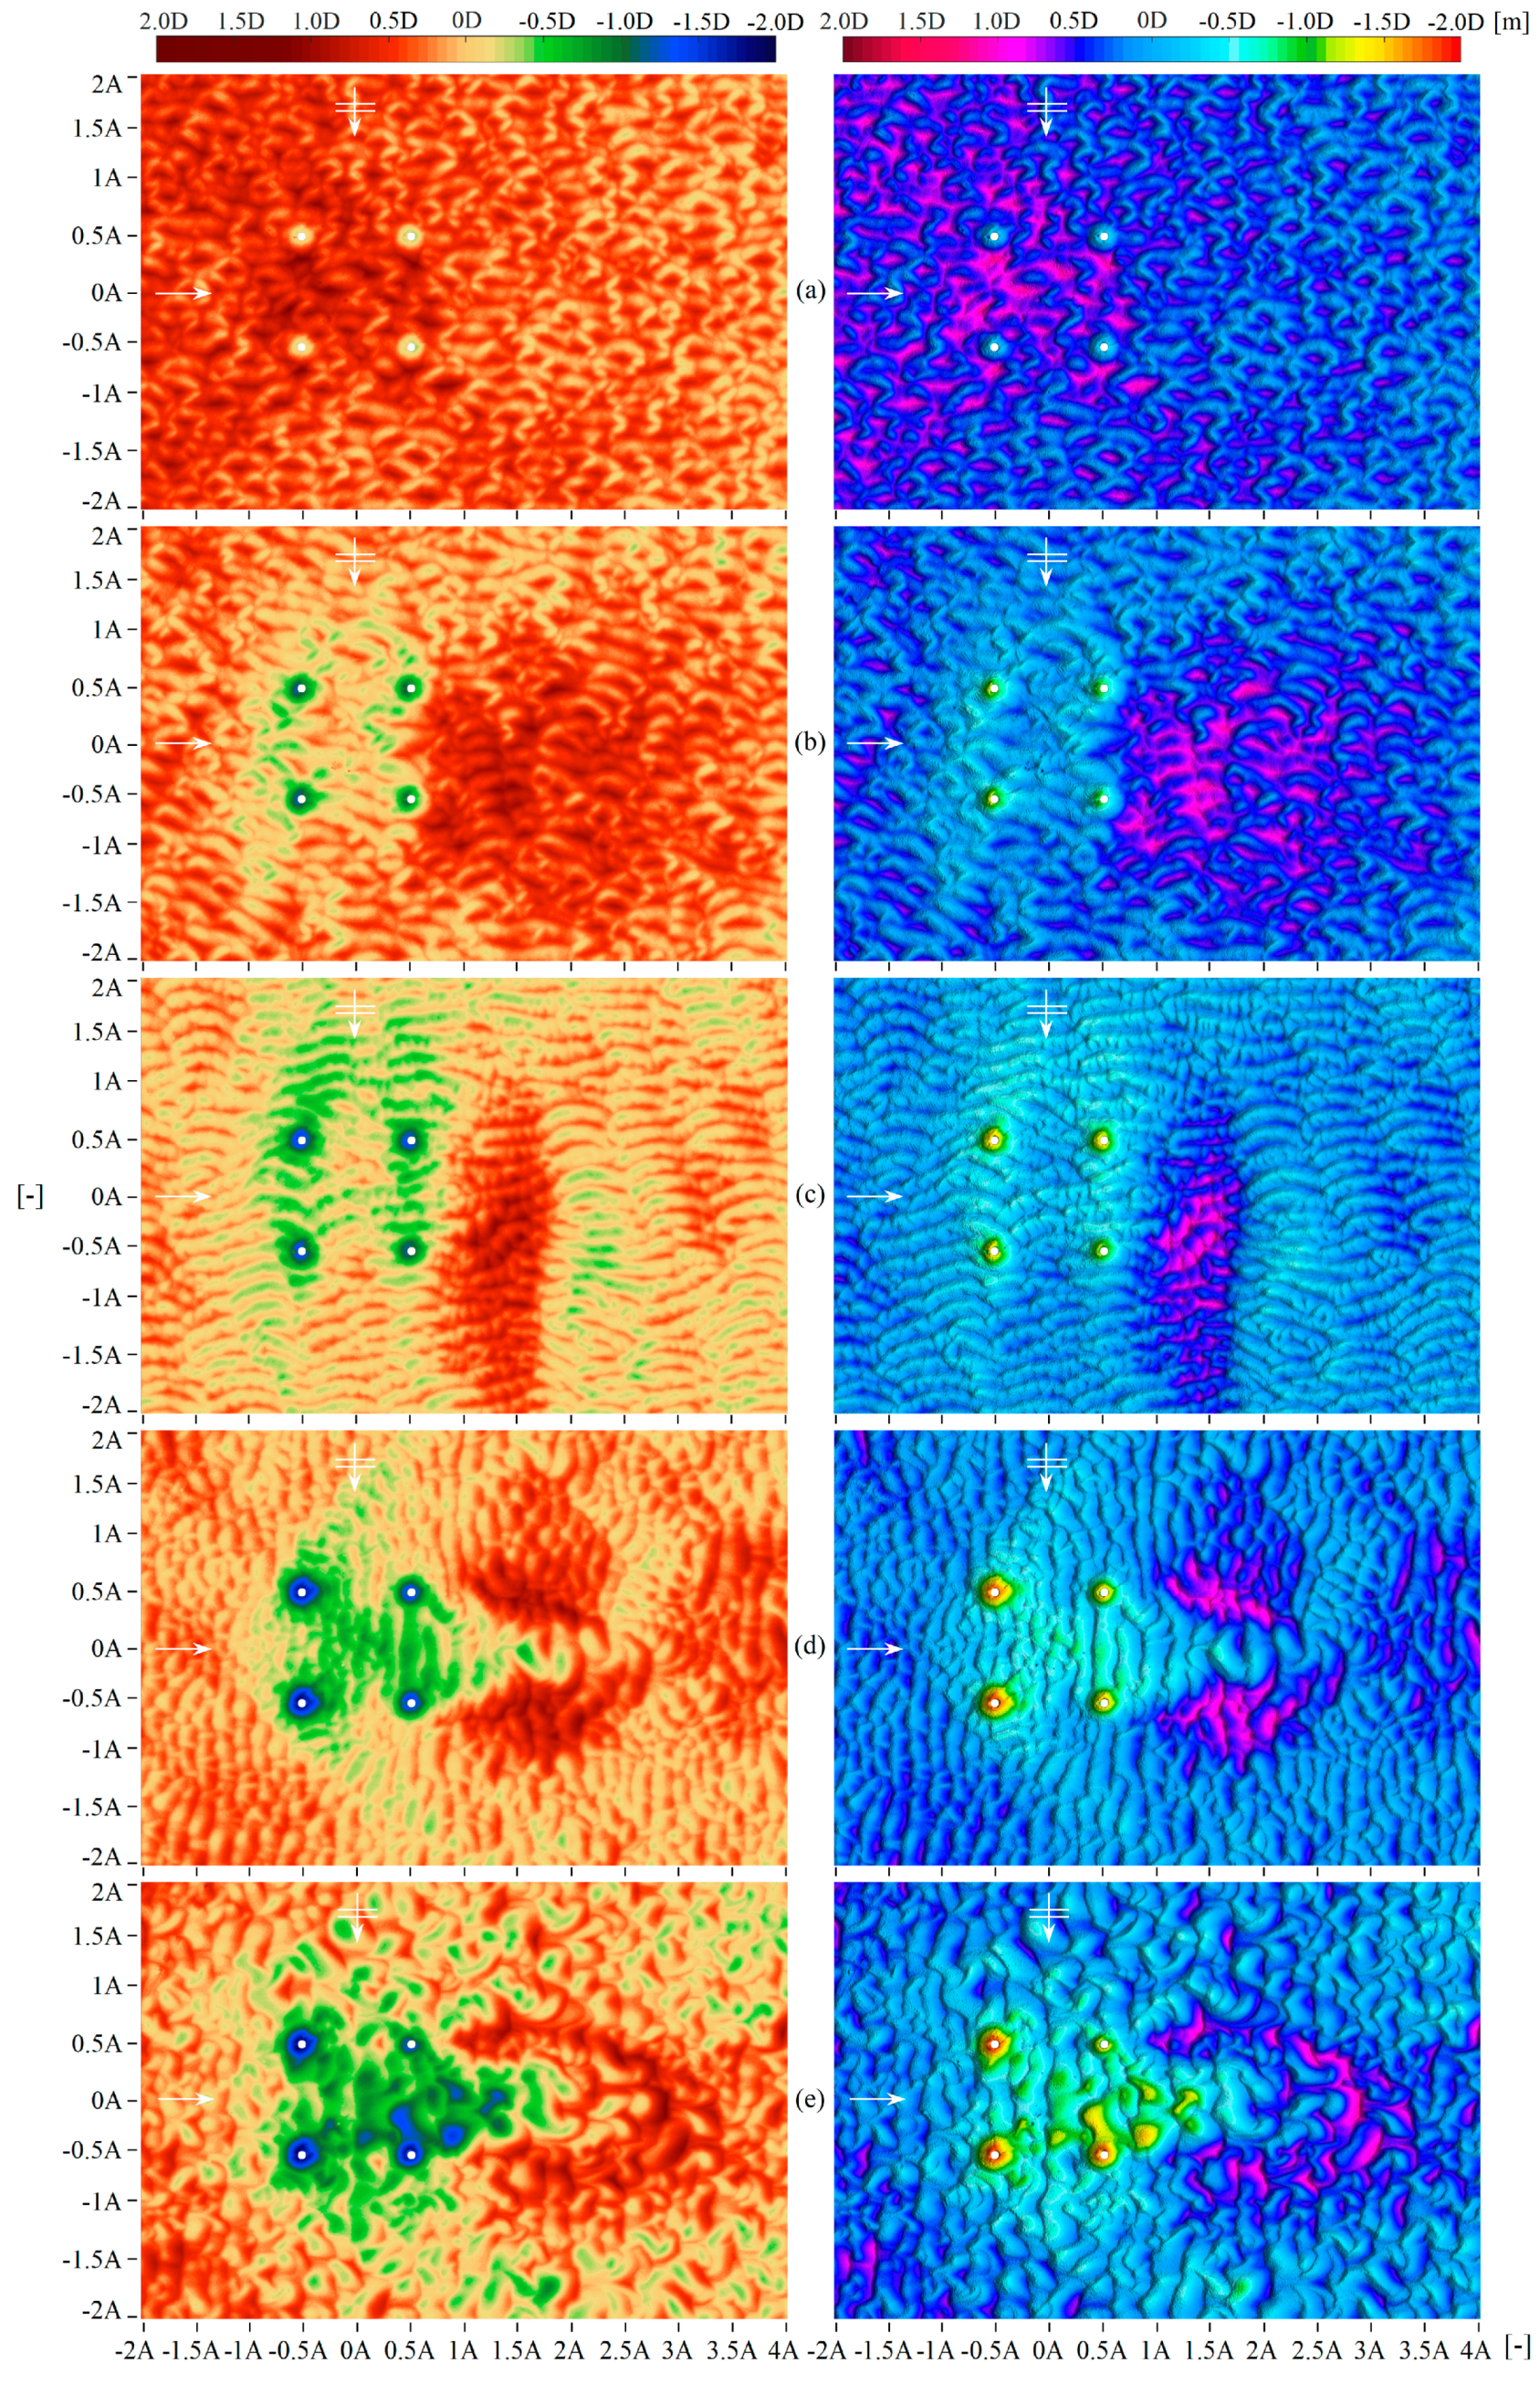
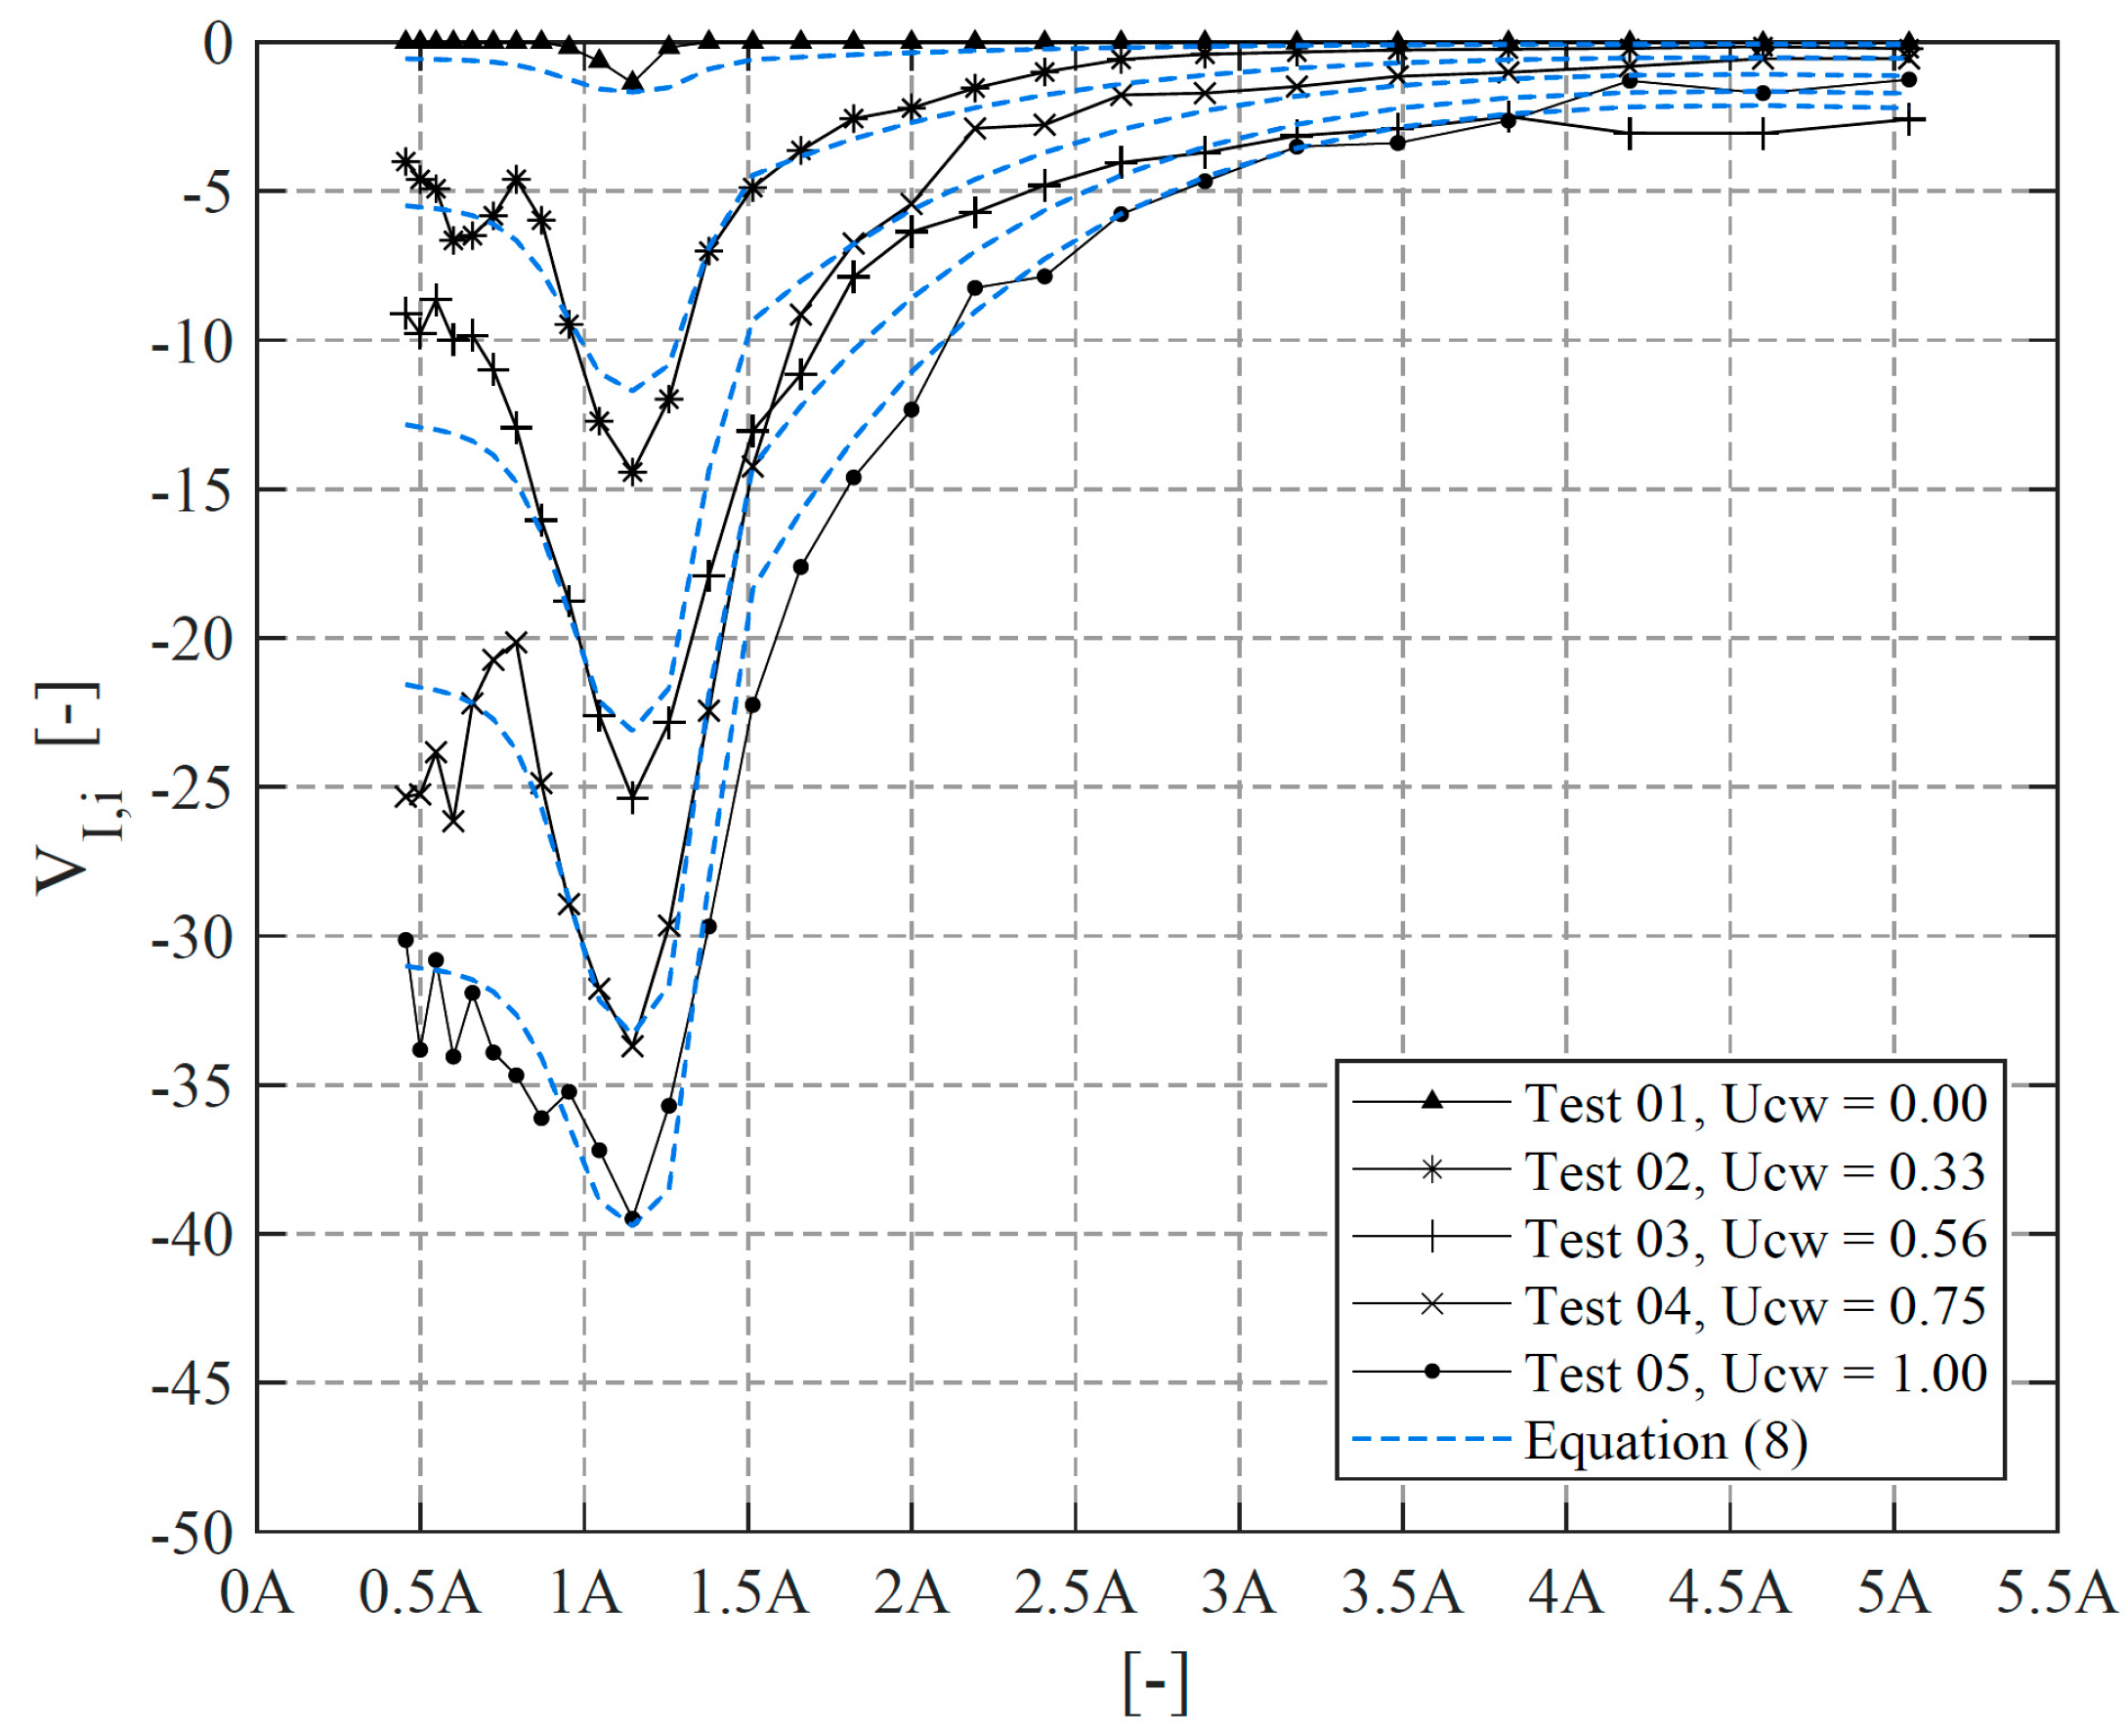
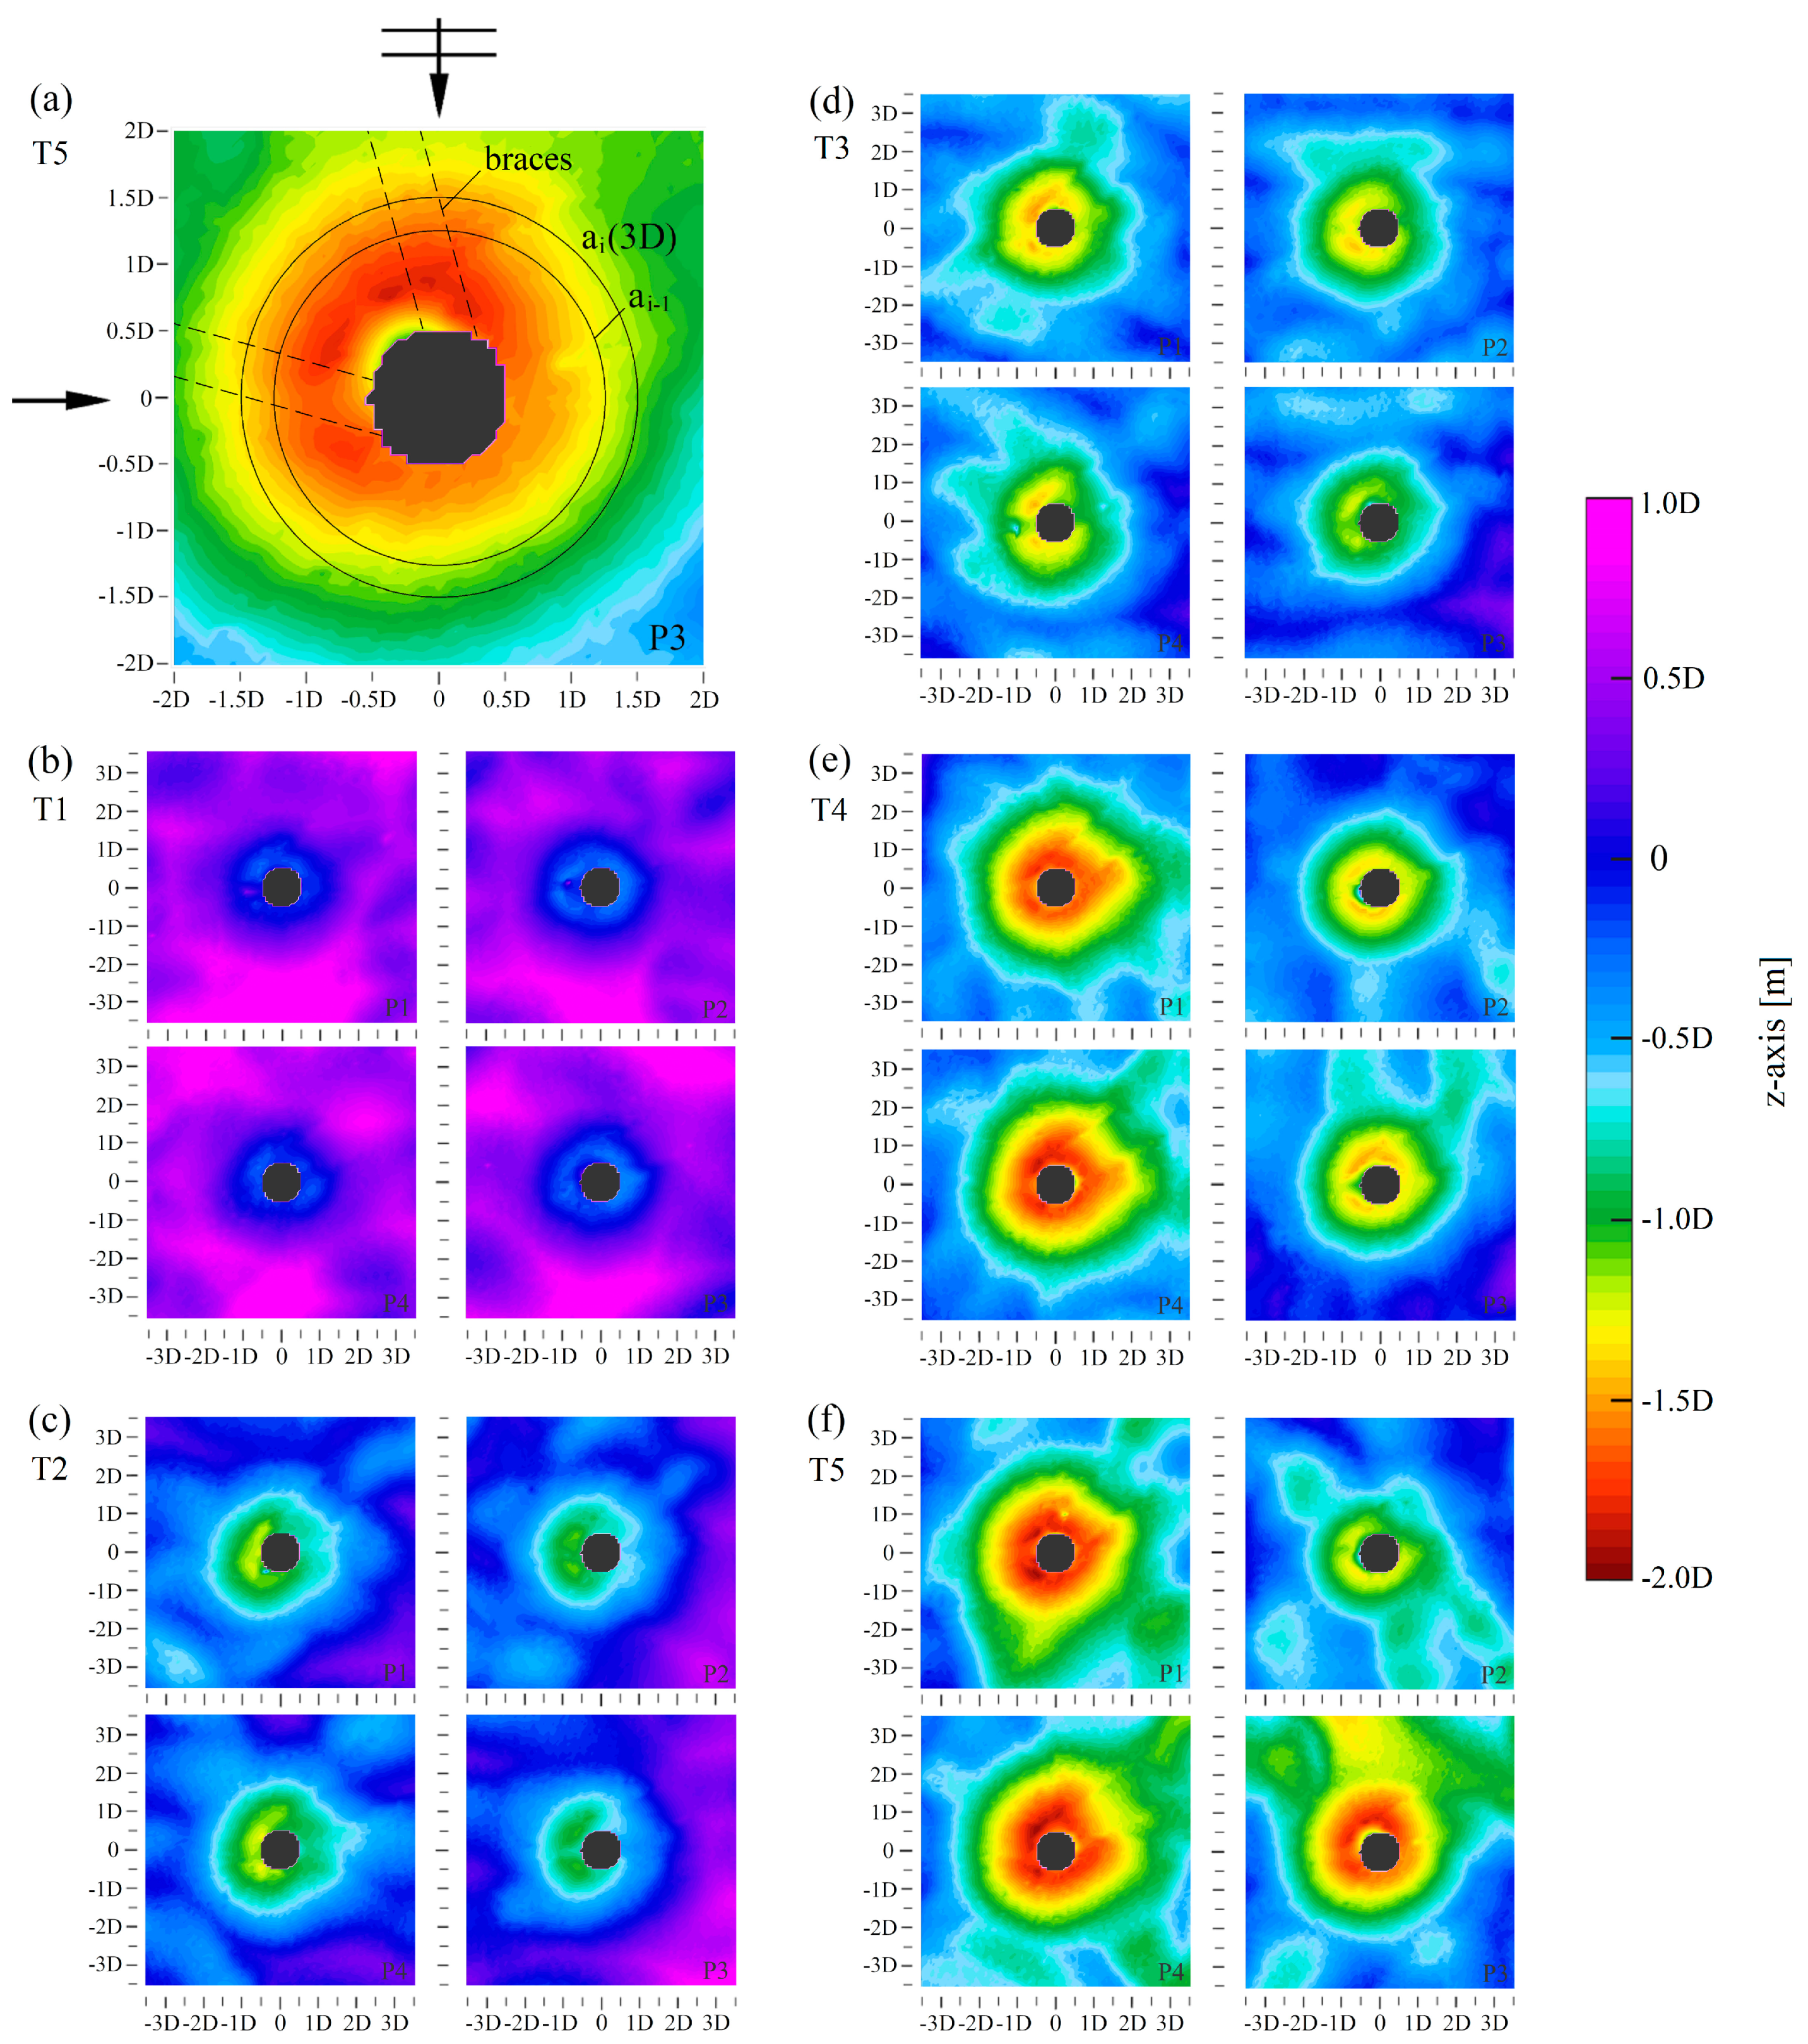
Table 1.
Test conditions/Measured values (waves are propagating in 90° to the current).
| Test | [m] | [s] | Bed Orbital Velocity [cm/s] | Depth Averaged Current Velocity [cm/s] | Current Velocity 10 cm Above Bed [cm/s] | KC [-] | [-] | Shields Parameter θ [-] | Global Eroded Volume: for an Area of 1.25 A [-] | Local Eroded Volume: Diameter of 6 D [-] |
|---|---|---|---|---|---|---|---|---|---|---|
| 1 | 0.165 | 4.5 | 20.8 | - | - | 23.4 | 0.00 | 0.080 | −0.49 | −0.49 |
| 2 | 0.165 | 4.5 | 20.8 | 11.4 | 10.1 | 23.4 | 0.33 | 0.085 | −14.14 | −10.62 |
| 3 | 0.158 | 3.4 | 17.5 | 24.3 | 22.5 | 14.9 | 0.56 | 0.087 | −27.26 | −18.50 |
| 4 | 0.147 | 2.0 | 13.3 | 41.7 | 38.8 | 6.7 | 0.75 | 0.123 | −43.61 | −23.82 |
| 5 | - | - | - | 41.7 | 38.8 | - | 1.00 | 0.084 | −55.52 | −27.19 |
* Test 1–5 are related (in the same order) to test 3, 10, 8, 6 and 13 in Welzel et al. [12].
© 2019 by the authors. Licensee MDPI, Basel, Switzerland. This article is an open access article distributed under the terms and conditions of the Creative Commons Attribution (CC BY) license (http://creativecommons.org/licenses/by/4.0/).
Share and Cite
MDPI and ACS Style
Welzel, M.; Schendel, A.; Schlurmann, T.; Hildebrandt, A. Volume-Based Assessment of Erosion Patterns around a Hydrodynamic Transparent Offshore Structure. Energies 2019, 12, 3089. https://doi.org/10.3390/en12163089
AMA Style
Welzel M, Schendel A, Schlurmann T, Hildebrandt A. Volume-Based Assessment of Erosion Patterns around a Hydrodynamic Transparent Offshore Structure. Energies. 2019; 12(16):3089. https://doi.org/10.3390/en12163089
Chicago/Turabian StyleWelzel, Mario, Alexander Schendel, Torsten Schlurmann, and Arndt Hildebrandt. 2019. "Volume-Based Assessment of Erosion Patterns around a Hydrodynamic Transparent Offshore Structure" Energies 12, no. 16: 3089. https://doi.org/10.3390/en12163089
Note that from the first issue of 2016, this journal uses article numbers instead of page numbers. See further details here.