Application Assessment of Pumped Storage and Lithium-Ion Batteries on Electricity Supply Grid

Department of Electrical Engineering, Tshwane University of Technology, Pretoria 0183, South Africa
*
Author to whom correspondence should be addressed.
Energies 2019, 12(15), 2855; https://doi.org/10.3390/en12152855
Submission received: 5 May 2019
/
Revised: 29 June 2019
/
Accepted: 1 July 2019
/
Published: 24 July 2019
(This article belongs to the Special Issue Analysis and Design of Hybrid Energy Storage Systems)
Abstract
:National electricity supply utility in South Africa (Eskom) has been facing challenges to meet load demands in the country. The lack of generation equipment maintenance, increasing load demand and lack of new generation stations has left the country with a shortage of electricity supply that leads to load shedding. As a result, alternative renewable energy is required to supplement the national grid. Photovoltaic (PV) solar generation and wind farms are leading in this regard. Sunlight fluctuates throughout the day, thereby causing irradiation which in turn causes the output of the PV plant to become unstable and unreliable. As a result, storage facilities are required to mitigate challenges that come with the integration of PV into the grid or the use of PV independently, off the grid. The same storage system can also be used to supplement the power supply at night time when there is no sunlight and/or during peak hours when the demand is high. Although storage facilities are already in existence, it is important to research their range, applications, highlight new technologies and identify the best economical solution based on present and future plans. The study investigated an improved economic and technical storage system for generation of clean energy systems using solar/PV plants as the base to supplement the grid. In addition, the research aims to provide utilities with the information required for making storage facilities available with an emphasis on capital cost, implementation, operation and maintenance costs. The study solution is expected to be economical and technically proficient in terms of PV output stabilization and provision of extra capacity during peak times. The research technology’s focus includes different storage batteries, pumped storage and other forms of storage such as supercapacitors. The analysis or simulations were carried out using current analytic methods and software, such as HOMER Pro®. The end results provide the power utility in South Africa and abroad with options for energy storage facilities that could stabilise output demand, increase generation capacity and provide backup power. Consumers would have access to power most of the time, thereby reducing generation constraints and eventually the monthly cost of electricity due to renewable energies’ accessibility. Increased access to electricity will contribute to socio-economic development in the country. The proposed solution is environmentally friendly and would alleviate the present crisis of load shedding due to the imbalance of high demand to lower generations.
1. Introduction
South Africa has rich renewable energy (RE) capacity of approximately 4000 MW according the Department of Energy, Eskom has a target of 10,000 GWh to be introduced into the grid. Eskom estimates the photovoltaic (PV) potential to be 64.6 GW. However, just like many other utilities across the world, they are in search of a storage facility for these renewable energies that are expected to supplement the grid during peak hours or whenever required. The dependency on fossil fuels is decreasing while the usage of RE is increasing [1]. This paper presents the research conducted to assess better economic and technical storage systems for clean energy systems using solar/PV plants as a base to supplement the grid. The investigation focused on using lithium-ion (Li) batteries and pumped storage (PPS). Pumped storage is already in use by the utility. This study is intended to provide the utility with information on recent storage battery technologies and how they compare with traditional PPS. Furthermore, if the PPS expected output is achieved, for continuous improvement, new forms of energy storage need to be investigated. Traditionally storage batteries were considered to be very expensive, requiring frequent maintenance and not environmentally friendly in comparison with PPS [2,3]. The study reviews how the development of batteries has improved over the years thereby resulting in cost reduction and traditional perceptions elimination.
The investigation analysis and simulations were carried out using current methods and software called HomerPro® with emphasis on capital cost, implementation, operation and maintenance costs.
To achieve the objectives of the study, which include finding the economic and technical solutions to renewable energy storage, the following design processes were implemented: development of a PV model and its integration with storage batteries using lithium-ion and the design of a pumped storage (PPS) model as well as its integration with the PV model. Comparison of the battery and PPS model was carried out and finally, a developed model arising from the result obtained at different stages of design implementation and efficacy was made. The model development and simulations were carried out in HOMER Pro® environments. Analysis of the results was also carried out to accentuate the impact and contribution of the various scenarios, factors and storage systems. Storage batteries and PPS were simulated and compared, using 3 scenarios: 200 kWh, 600 kWh and 1 MWh storage capacities.
From the results obtained, it can be inferred that both storage systems are significant to PV output stabilisation as required. Both of these can be used to supplement PV in times of high demand and times where PV is not sufficient, due to weather conditions or fluctuations. While these systems have capacities to discharge as and when required, the PPS has a very rapid response and can be used where there are large loads or emergency loading is required. When operated as a hybrid system with the PV, it has been proven that for lower storage requirements, such as the 200 kWh storage bank, PPS is a cheaper option than storage batteries, by operating at almost half the cost. As storage capacity increases to 600 kWh, then the gap closes and PPS becomes approximately 16% cheaper than batteries. The difference reduces as storage capacity increases to 1 MWh. The research has demonstrated that when required storage capacity becomes greater than 1 MWh, then batteries are able to be selected. The assumption was made that both storage resources are available at one site.
Lastly, the research provides the utility with the option to select which storage it requires, depending on the resources at the area where PV is installed. This will improve the stability of the grid, thereby averting outage as a result of load (electricity demand), increasing generation capacity and consumers will have access to power most of the time, which, in the long run, is expected to bring about a reduction in the cost of electricity and contributes to socio-economic development in the country, by creating jobs which will invariably transform into an increase in production capacity. The preferred solution is environmentally friendly and alleviates the present crisis which is a result of high demand and low generation—i.e., supply.
2. Storage Capacity Review
2.1. Lithium-Ion Batteries
The renewable energy output voltage is not constant and requires a storage facility or capacity to regulate the output. In addition, the energy generated can be stored for later use when demand increases, especially for times when sunlight is insufficient to generate power. A simple example is to store energy and release it when the demand is high, such as in the mornings and afternoons. The stored energy can be utilised to supplement the grid. Batteries have the ability to store electrical energy which can be drawn later when required. The other advantages of storage batteries area is that they can assist the solar plant with ramp rate (kW/min) which must be maintained by the solar plant as per utility requirements. Ramp rate may be affected by sudden weather changes. This is why batteries are significant: to control the said ramp rate. Mismatches happen between load and generation, causing frequency deviations; however, the storage batteries can assist with frequency control and voltage [4]. The question arising here concerns which batteries are suitable for grid-connected PV plants. There are many types of batteries manufactured but this study only examined the most commonly used ones: lithium-ion and lead-acid batteries. There are important characteristics of batteries that one should consider when choosing the best or most suitable battery solution, such as depth of discharge (DoD), effective capacity, charging/discharging rate and life cycle. In a PV plant, batteries will be connected in parallel-series to meet the required voltage and power.
Lithium-ion batteries are rechargeable type. These batteries over the years have been compared to others in their class; results indicate they currently have lower costs, higher energy, weigh less, higher circuit voltage, safe to use, they have an extended life cycle of up to 16 years and better power densities [5]. The efficiency of these batteries has improved over the years to about 70%–99%. More importantly, they no longer require maintenance as it was traditionally [6]. Considering their high cell voltage, they offer few cells required to achieve equal voltage in the same circuit compared to other batteries, resulting in reduced transportation cost and less space required for installation. The fastest charging time of less than 2 h makes them very attractive. Lastly, Li-ion batteries are very friendly and simple to use [7,8,9]. While these batteries are attractive to use, they require a good strategy, and accurate management to maintain and improve their operating efficiency while enhancing their life span. There are different types of battery management in use while others are being investigated [10,11,12]. State of charge (SOC) plays an important role in the life span of the batteries, it helps to know when to charge and discharge the batteries. This prevents batteries from damage caused by overcharging and over-discharging. Storage batteries rely on accurate SOC to compete with other forms of storage facilities in terms of offering better storage capacity. Sliding mode observer (SMO), as proposed in [5], focuses on charging and discharging of a battery as exemplified; charging:
And discharging;
‘^‘denotes estimated quantity.
Where t0 and t1 are starting and end times respectively.
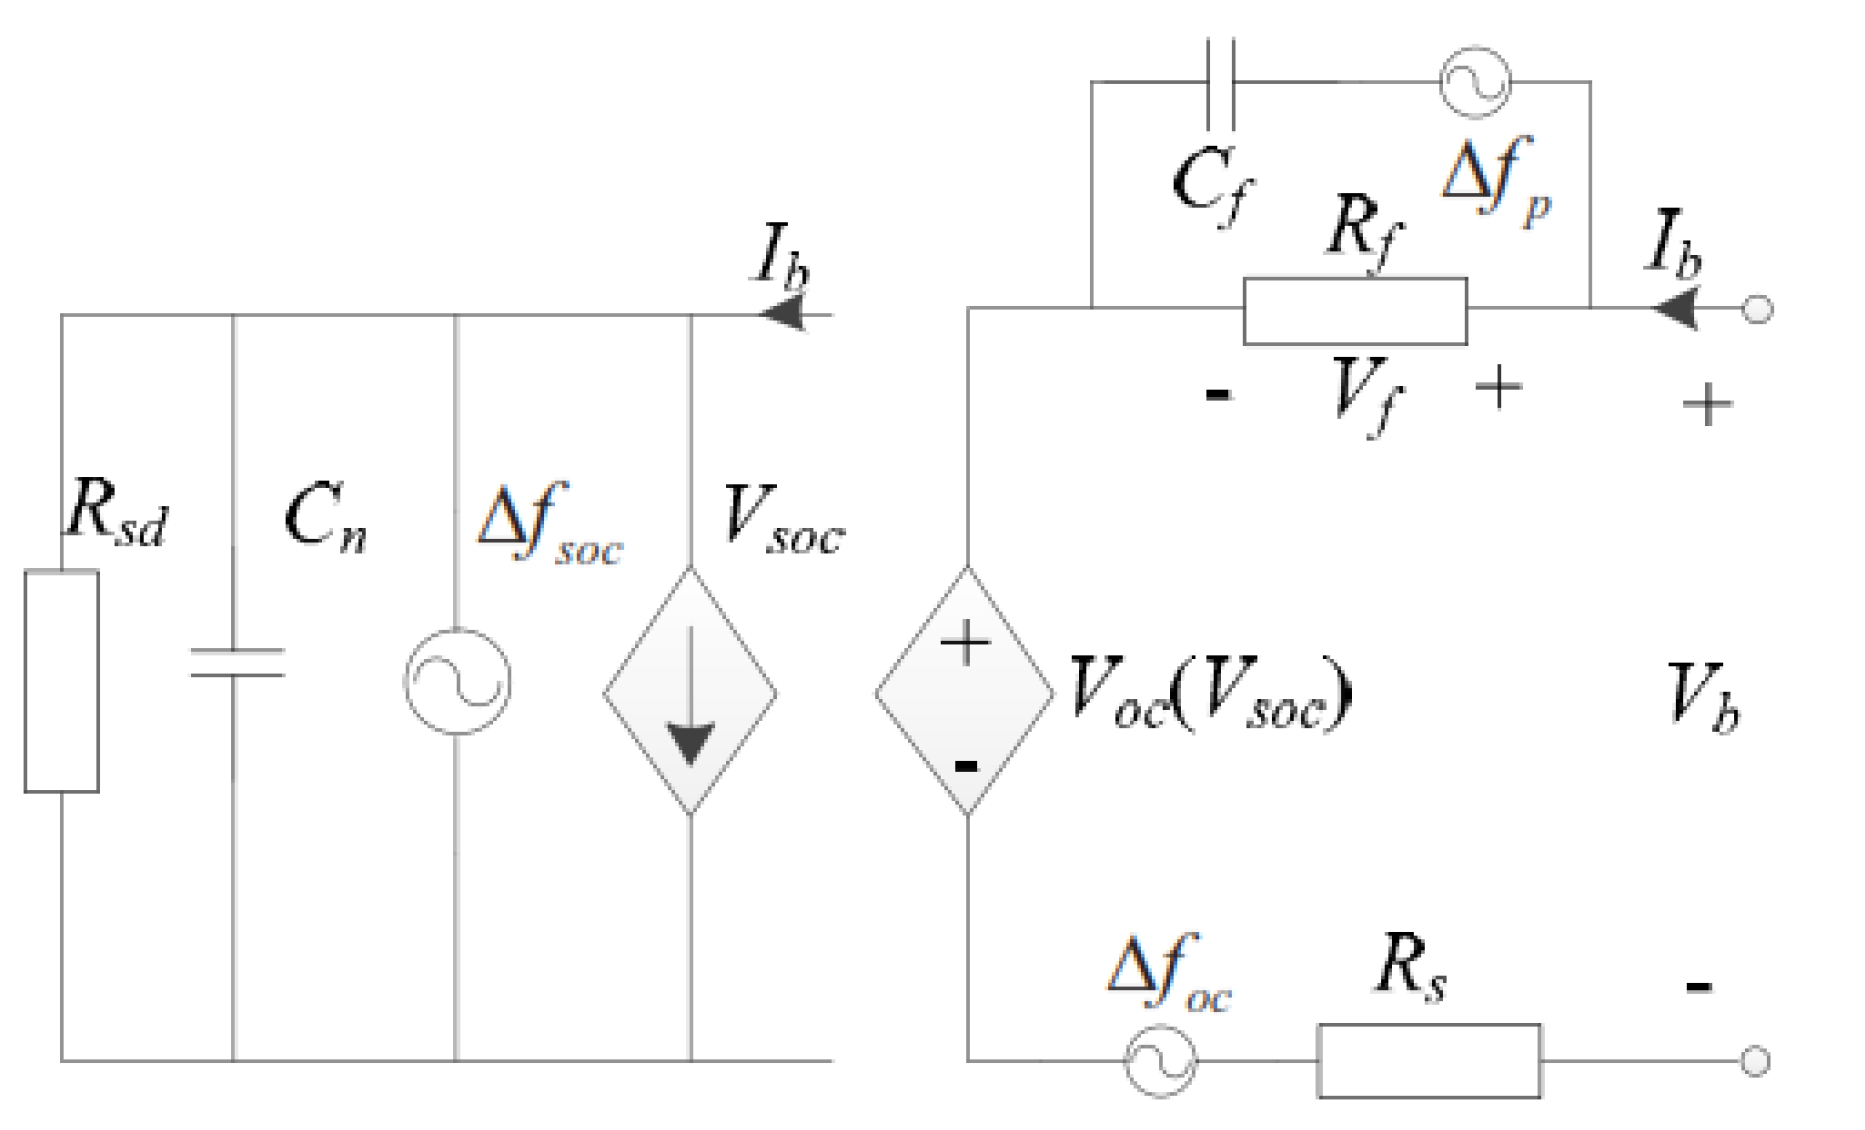
Reading from Figure 1 above; measures the battery open circuit voltage, which is also the function of the battery’s State of Charge (SOC). The SOC voltage is represented by while Rs is the ohmic resistance inserted to control the energy and SOC during battery discharging and charging. RC block (,) shows the battery’s reaction upon application of a step load current. The charge capacitor is represented by .where and is the nominal capacity (A × h). It is to be noted that there are modelling errors, time-varying elements and uncertainties and [5] shows can be used to address these errors. To model the battery, the (voltage accross RC) can be given by (3):
2.2. Pumped Storage
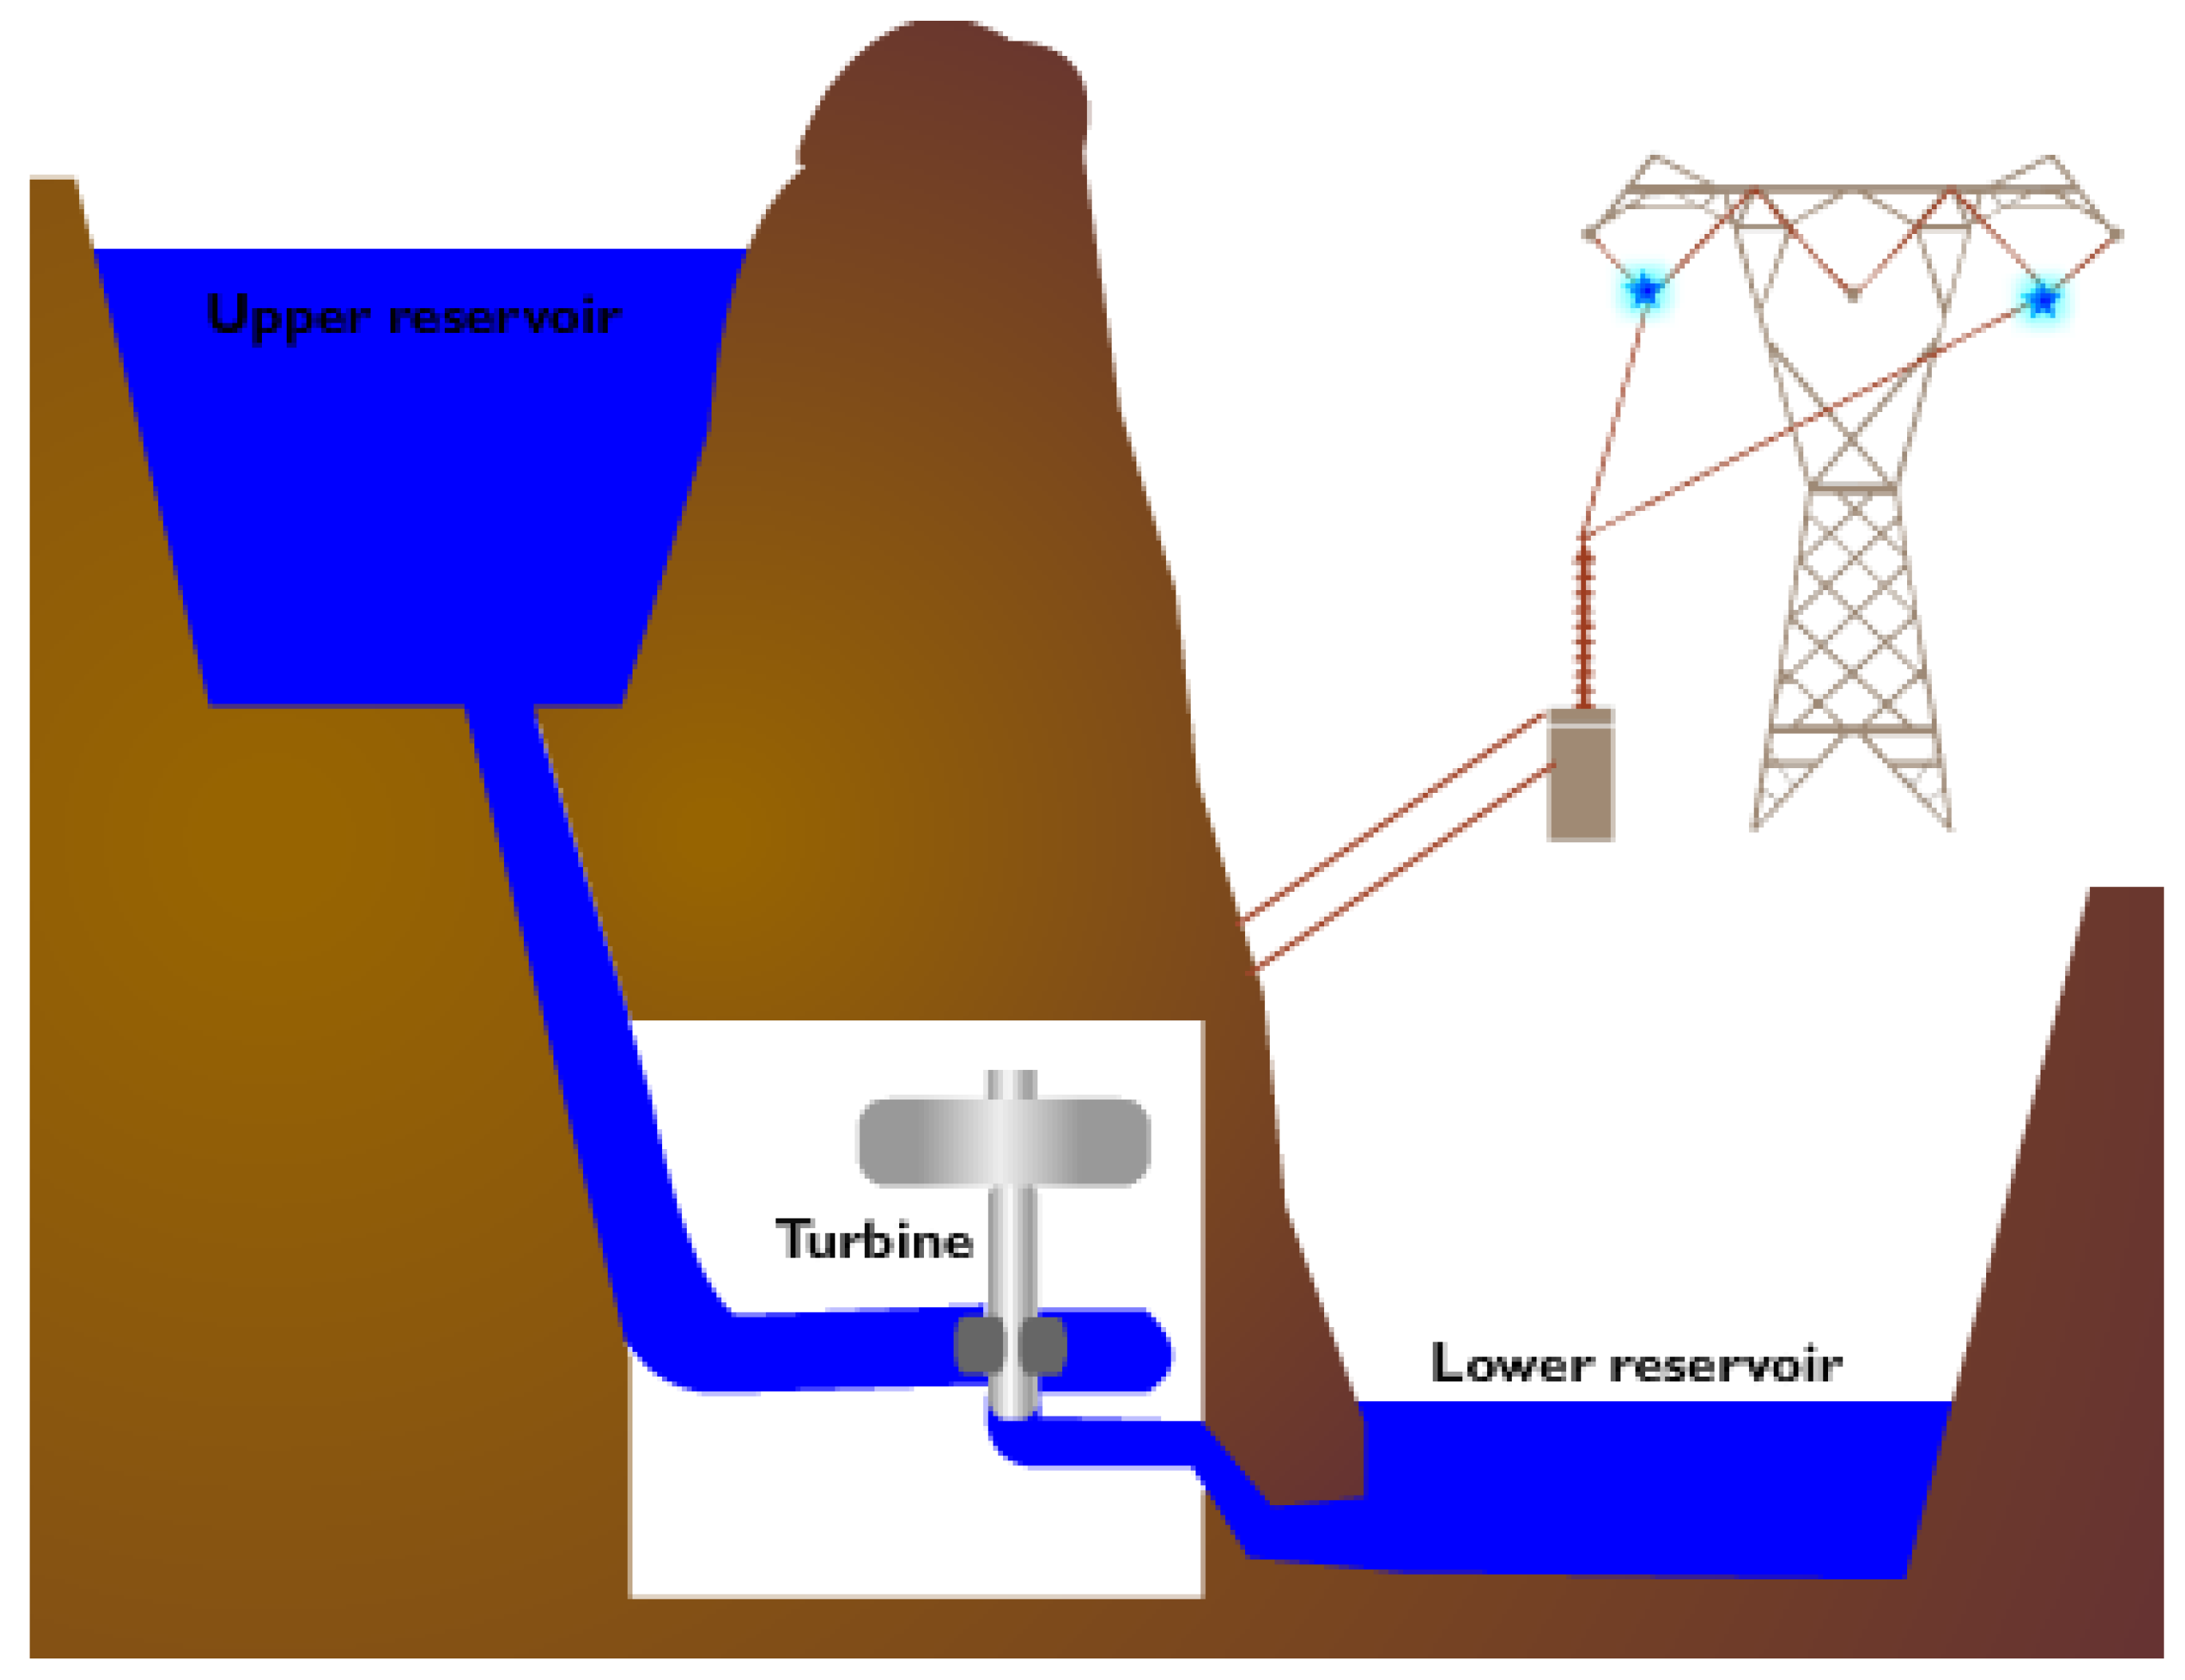
The pumped storage power plant (PPS) has been in existence since 1904; the first installation was used in the 1890s in Italy and Switzerland [13]. PPS built around the world are still functioning, while improved new plants are being continuously built due to their functioning flexibility and adeptness to deliver a quick response to load changes in the system or good electricity price. Synchronous motors are deployed in the system to convert the mechanical energy into electrical energy and, in reverse, to upper reservoirs [14]. PPS is operated by controlling the level of water in the upper reservoir and the output voltage frequency.
Water is stored in the upper tank. During generation mode this water will flow through the hydropower plant to generate electricity. For storage, the used water is pumped from the lower tank into the upper tank using the same reversible turbines. It is noted that some use abandoned mines for lower reservoirs as the height difference between two storage tanks is of paramount importance to generate more mechanical energy [13,14].
Energy is produced by controlling the water level on the upper tank. The Simulink model of water level control is shown in [15]. Traditional PPS used two engines/electric motors, one for pumping water to the upper tank and one to generate electricity through the hydro plant. Recently only one pump can be used to do both works, these pumps are called reversible turbines. These reversible turbines have brought about reduced installation and maintenance costs [16]. Figure 2 below illustrates a typical PPS installation.
When water flows from the upper reservoir to the discharge reservoir, the motor acts as a turbine and converts gravitational power to mechanical power. The potential power relies on the water head and its flow rate can be expressed as:
where the output mechanical power of the turbine is given by:
is the total output mechanical power from the turbine shaft in Watts, is the turbine efficiency, is the volume density of water (kg/m3), g is the gravitational acceleration (m/s2) due to the height of the upper reservoir. Qw is the water flow rate passing through the turbine (m3/s) and H is the effective head of water across the turbine (m) [15].
The mathematical expression of the efficiency is expressed below in turbine mode:
with
and
R is the turbine radius, A is the Area swept by rotor blades (m2) and; Ω is the rotational speed (rad/s).
While for fixed water head which is the case for this study, the pump-turbine hydrodynamic torque depends only on water flow rate and rotational speed. The torque equation is given below:
When the mechanical friction effects are neglected, the pump turbine motion equation is given by:
where J is the total inertia of the pump-turbine and motor generator coupling, is the motor-generator (electromagnetic) torque.
2.3. Supercapacitors
Another option for supplementing the unreliable solar plant with energy is that of utilising supercapacitors. Supercapacitors are proven to have a long life span, high power density and high dynamics [17]. Supercapacitors are the fastest energy source and can be used to supply the shortage-voltage to achieve DC bus voltage regulation. Supercapacitors store energy between two electrodes in a non-converted electrical form [18].
In the research conducted on [19], the load profile is compared to PV power and the results demonstrate high-low fluctuation in frequency. Supercapacitors are implemented to compensate for low frequencies between the PV plant and the load. These supercapacitors also provide high-frequency components of power and they can absorb high transients due to its rapid response. Supercapacitors have high-density and long life and can last for a life span of 12 years when operated properly [17,18,19]. This solution of a hybrid supercapacitor with PV plant is mainly used on small scale micro-grids where power requirements are a few megawatts.
It has also been proven that when in the same system or interfaced with batteries’ storage (supercapacitor–battery storage combination) the plant is more efficient than when it is PV–battery storage alone [19,20]. These supercapacitors can operate in low and harsh environments, i.e., very high and low temperatures. They are maintenance-free for about 10 years. Unlike the batteries, supercapacitors require less management [21,22,23,24].
2.4. Lead Acid Batteries
Lead acid batteries were first invented in the 1800s by the French physician, Gaston Plante and are the oldest known rechargeable batteries. During the discharging mode, both positive and negative plates become lead (II) sulphate PBSO4 and the electrolyte loses much of its dissolved sulphuric acid and becomes primarily water. These batteries are also used in storage requirements facilities, were traditionally used in vehicles and are now found in solar plants. Lead acid batteries can operate under harsher temperature conditions than lithium-ion batteries and furthermore, they provide low-cost storage and are safe to use [8,25]. Lead acid batteries have harmful chemicals which may negatively impact the environment if not disposed correctly. There are several ways of disposing these batteries which is: using a landfill, stabilisation, incineration and recycling [26]. Recycling is becoming a more favourable option because it reduces the environmental impact. Waste lead and acid have serious pollution problems.
2.5. Battery Management System
Battery management system (BMS) improves the life expectancy and operating efficiency of batteries. Each battery type should be managed to ensure that it is not overcharged or undercharged [5,6]. To achieve battery management can be tricky on battery banks. This is because a large number of batteries are connected in series or parallel and all batteries should have equal voltages. BMS becomes effective in this regard. A cell balancing circuit is proposed in [6] as one of the BMS methods to ensure battery banks have equal voltages, although most of these methods are still under study. State of charge (SOC) is used to know when to charge or discharge the batteries. An accurate SOC will prevent the batteries from overcharging and over discharging, and thus prevent damages. Several methods, such as fuzzy logic, extended Kalman filter, unscented Kalman filter, open circuit voltage, sliding mode observer and non-linear observer, can be used to estimate and improve battery SOC [10,11,27,28,29,30]. All methods focus on improving the accuracy for SOC. BMS predicts the state of health, state of charge and the remaining useful life, besides being used as protection circuit. This is achieved by continuous measurement of battery voltage, current and temperature. This is referred to as a direct method of SOC [28,29]. A dual polarisation model is proposed in [29] as the best dynamic performance by providing more accurate SOC estimation.
Cost Reduction on Storage Batteries
According to Bloomberg’s analysis and predictions in 2017 after surveying more than 50 manufacturers, the cost of lithium-ion batteries was to fall to USD 100/kWh by 2025. The prediction was done when the cost was USD 209/kWh. In 2017, the cost was placed at USD 140/kWh giving indications that the target of USD 100/kWh might be reached by 2020, five years earlier than Bloomberg’s prediction; the drop in price being almost 75% [31,32]. Tesla also developed a single battery called a Powerwall system that can store and supply energy for seven days to household applications, assuming the households have solar systems already installed to supply network. In addition, this Powerwall is able to detect grid power loss and spontaneously restore/supply power within milliseconds to a point where outage will not even be noticed. It is indicated that appliances in the houses will continue to function without any interruption. One Powerwall with an estimated usage of 22 kWh/day will cost $6600 inclusive of all materials. More of these technologies are expected and with more funds and time spent on research and development, the battery cost is expected to reduce considerably—i.e., the trend for lithium-ion batteries [33].
Tesla has proved the future of storage lies in batteries and specifically lithium-ion batteries. More research and development should focus on it. It is further suggested in [34] that management of manufacturing process can reduce the cost of batteries. In the same paper, it is suggested that replacing statistical process control with advanced process control and also replacing conventional furnace processing with thermal processing may have an impact in reduction of battery manufacturing costs, as well.
2.6. Storage Capacity Review Conclusion
The low initial capital costs, low operational costs, higher life expectancy, user friendly system, high efficiency, high energy and power density are the desired results required to determine the ideal storage facility. It can be deduced that the ideal solution is not possible since no single storage facility can offer all of these good characteristics or outputs [7]. The selection should, therefore, be based on the application and budget. For example, lithium-ion batteries would mostly provide high energy density and have simple operation methods [35]. However, they have a short life span and low power density compared to supercapacitors. This in turn has low-speed response capabilities [18,22]. It is suggested that having supercapacitors in the system can compensate for the shortfalls of batteries because of their high-power density and long-life span [7]. Supercapacitors, however, are complicated to configure on installation, the initial costs are high and not easy to control [22,36]. If choices were to be made on batteries alone, then lithium-ion batteries offer fast charging times and unlike the lead-acid batteries, they require no maintenance [7,35]. Another form of storage in research, in use and under development is the fly-wheel; this stores energy in the form of mechanical energy, is very efficient and has a long-life cycle. Their capability of charging and discharging at high power rates is good; this can be done without loss of efficiency. They are also greenhouse-like pumped storage plants, with no effect on the environment [7]. This research did not focus on this form of storage.
This then gives pumped-storage power plants an advantage over storage batteries because of their functional flexibility and capability to offer quick responses to changes in the system due to a change of loading and/or good price of electricity. Pumped storage, due to its more power output can be used during peak time and thus bring more revenue, a lot of energy can be sold that time and that is the time when energy costs are more expensive [37]. The system can be ready in 90 s and be working on full capacity in 120 s. The switching from pumping to generation or vice versa can happen between 180–240 s, with an efficiency of up to 67% [38] and contribute positively to frequency and voltage control. The only challenge to the pumped storage facility is finding a suitable location based on environmental, topography, geographical and size of reservoirs. There are a lot of initial costs involved and it takes around 10 years to construct and commission. In some areas, reservoirs have to be created, rivers have to be diverted to channel water into the built upper reservoirs [37,38].
3. Investigation Approach and Methodology
The program that was utilised for study costs comparison is Homer Pro®. HOMER (Hybrid Optimisation of Multiple Energy Resources) software was developed to assist engineers with modelling, costs simulations and optimisations of hybrid energy systems. HOMER software can model the grid-tied, off-grid, hybrid systems and stand-alone complex systems. It uses formulas to optimise the required system based on user requirements. It can be used to do cost analysis of different mentioned systems. This can be either renewable energies or traditional grids such as diesel generators, pumped storage, storage batteries, conventional hydro-power plants, boilers, hydrokinetic plant, hydrogen tanks, thermal load controllers and grid [39].
Factors considered and applied during the cost evaluation are stated. The location data such as irradiation, geographical location and temperature were determined using Solaris software (PVplanner) to plot the ideal location for base PV plant. The data obtained was inputted into the Homer Pro® program. To develop the economical solution using HomerPro® software, the following information was required and inputted: geographical location, meteorological data, hourly/daily/monthly load profiles which the PV system will feed, life span of the system, carbon emissions if any including cost of penalties, cost of each equipment in the system as well as the capital, operation and maintenance. For the cost of each equipment, HomerPro® default and updated values in USD were used. Once all the data is captured, the search space is also used to find the optimal solution for the required load based on the cheapest system analysis to optimise the system behaviour and output. The ultimate solution will then be presented. From [40,41], the levelised costs of energy (COE), annualised cost (Cann) and net present cost (NPC) were determined for each system using below respective formulas/equations; levelised cost:
where = system annual cost ($/yr); = boiler marginal cost ($/kWh); = total thermal load served (kWh/yr) = total electrical load served (kWh/yr).
In the system that does not serve a thermal load then
Annualised cost ():
where = the net present cost ($); i = the annual real discount rate (%); = the project lifetime (yr).
Net present cost (NPC):
where, is the total annual cost ($/year) which includes the capital, replacement, annual operating and maintenance and fuel costs. CRF is the capital recovery factor, used to calculate the present value of a series of equal annual cash flows, is the real interest rate (%) and N is the project lifetime (in number of years).
Lastly, it is of great significance to include the operation and maintenance costs as they are a major part of any system including any penalties due to emissions/pollution. However, the system proposed is environmentally friendly and thus no emissions penalties will be incurred. Operation and Maintenace
(O&M) costs will be calculated with the equation using HomerPro®:
where = system fixed O&M costs ($/yr), = penalty for capacity shortage ($/yr), Penalty for emissions ($/yr). Which for this system will be neglected.
For any system to be analysed, the load needs to be connected. The resultant load is based on residential loading. This means each house is already deduced to have usage of 12 kWh per day as calculated below in Table 1. To determine how many houses can be fed with this envisaged demand output, the calculation below is applied.
Assuming a plant of 5 MW peak capacity and load factor of 0.2 as given by HomerPro® for residential loading, the average load for 5 MW peak will is deduced by:
Load factor (LF); the load factor is defined as a dimensionless number equal to the average load divided by the peak load.
Since per household consumption is 12 kWh, it can be calculated how may houses can be fed from this plant:
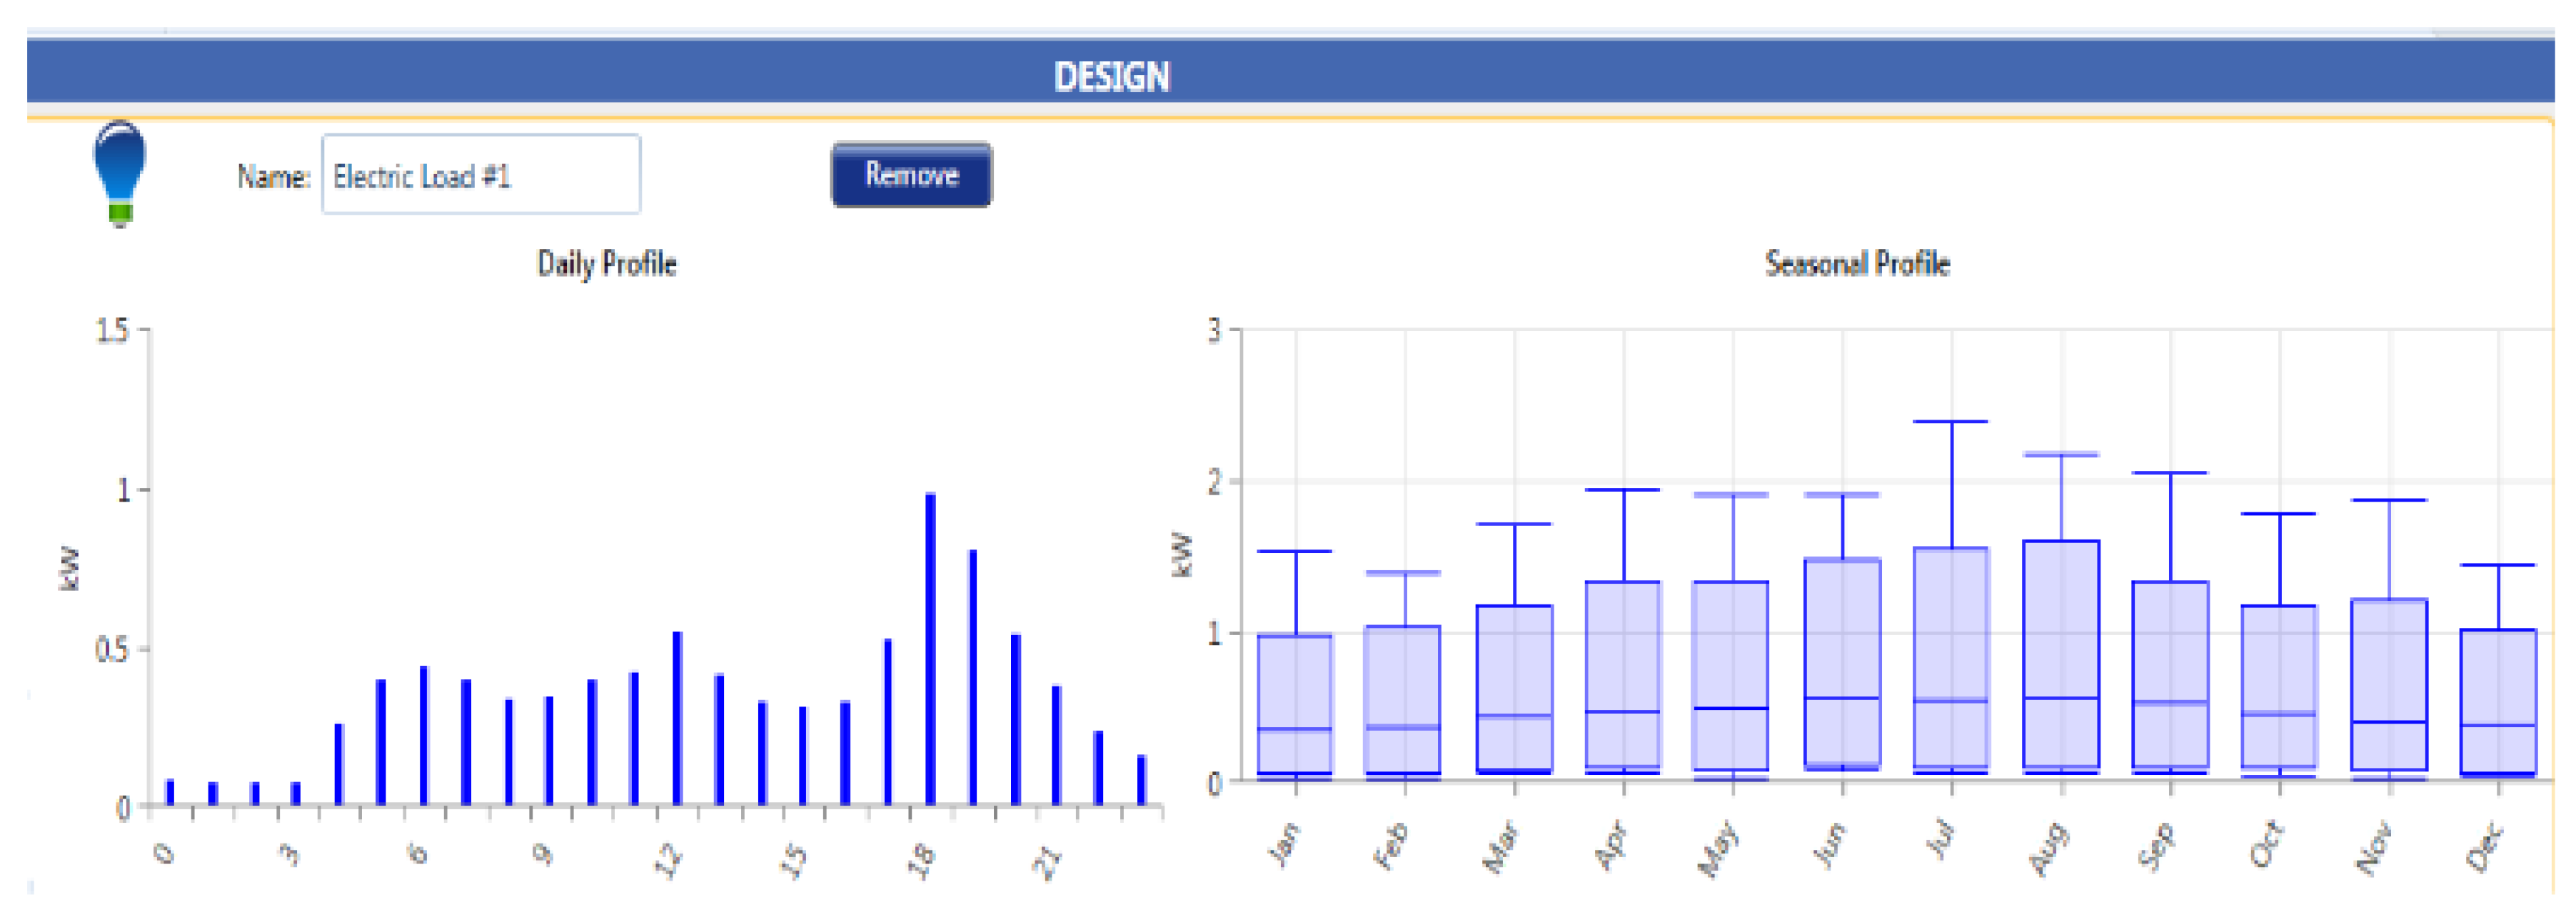
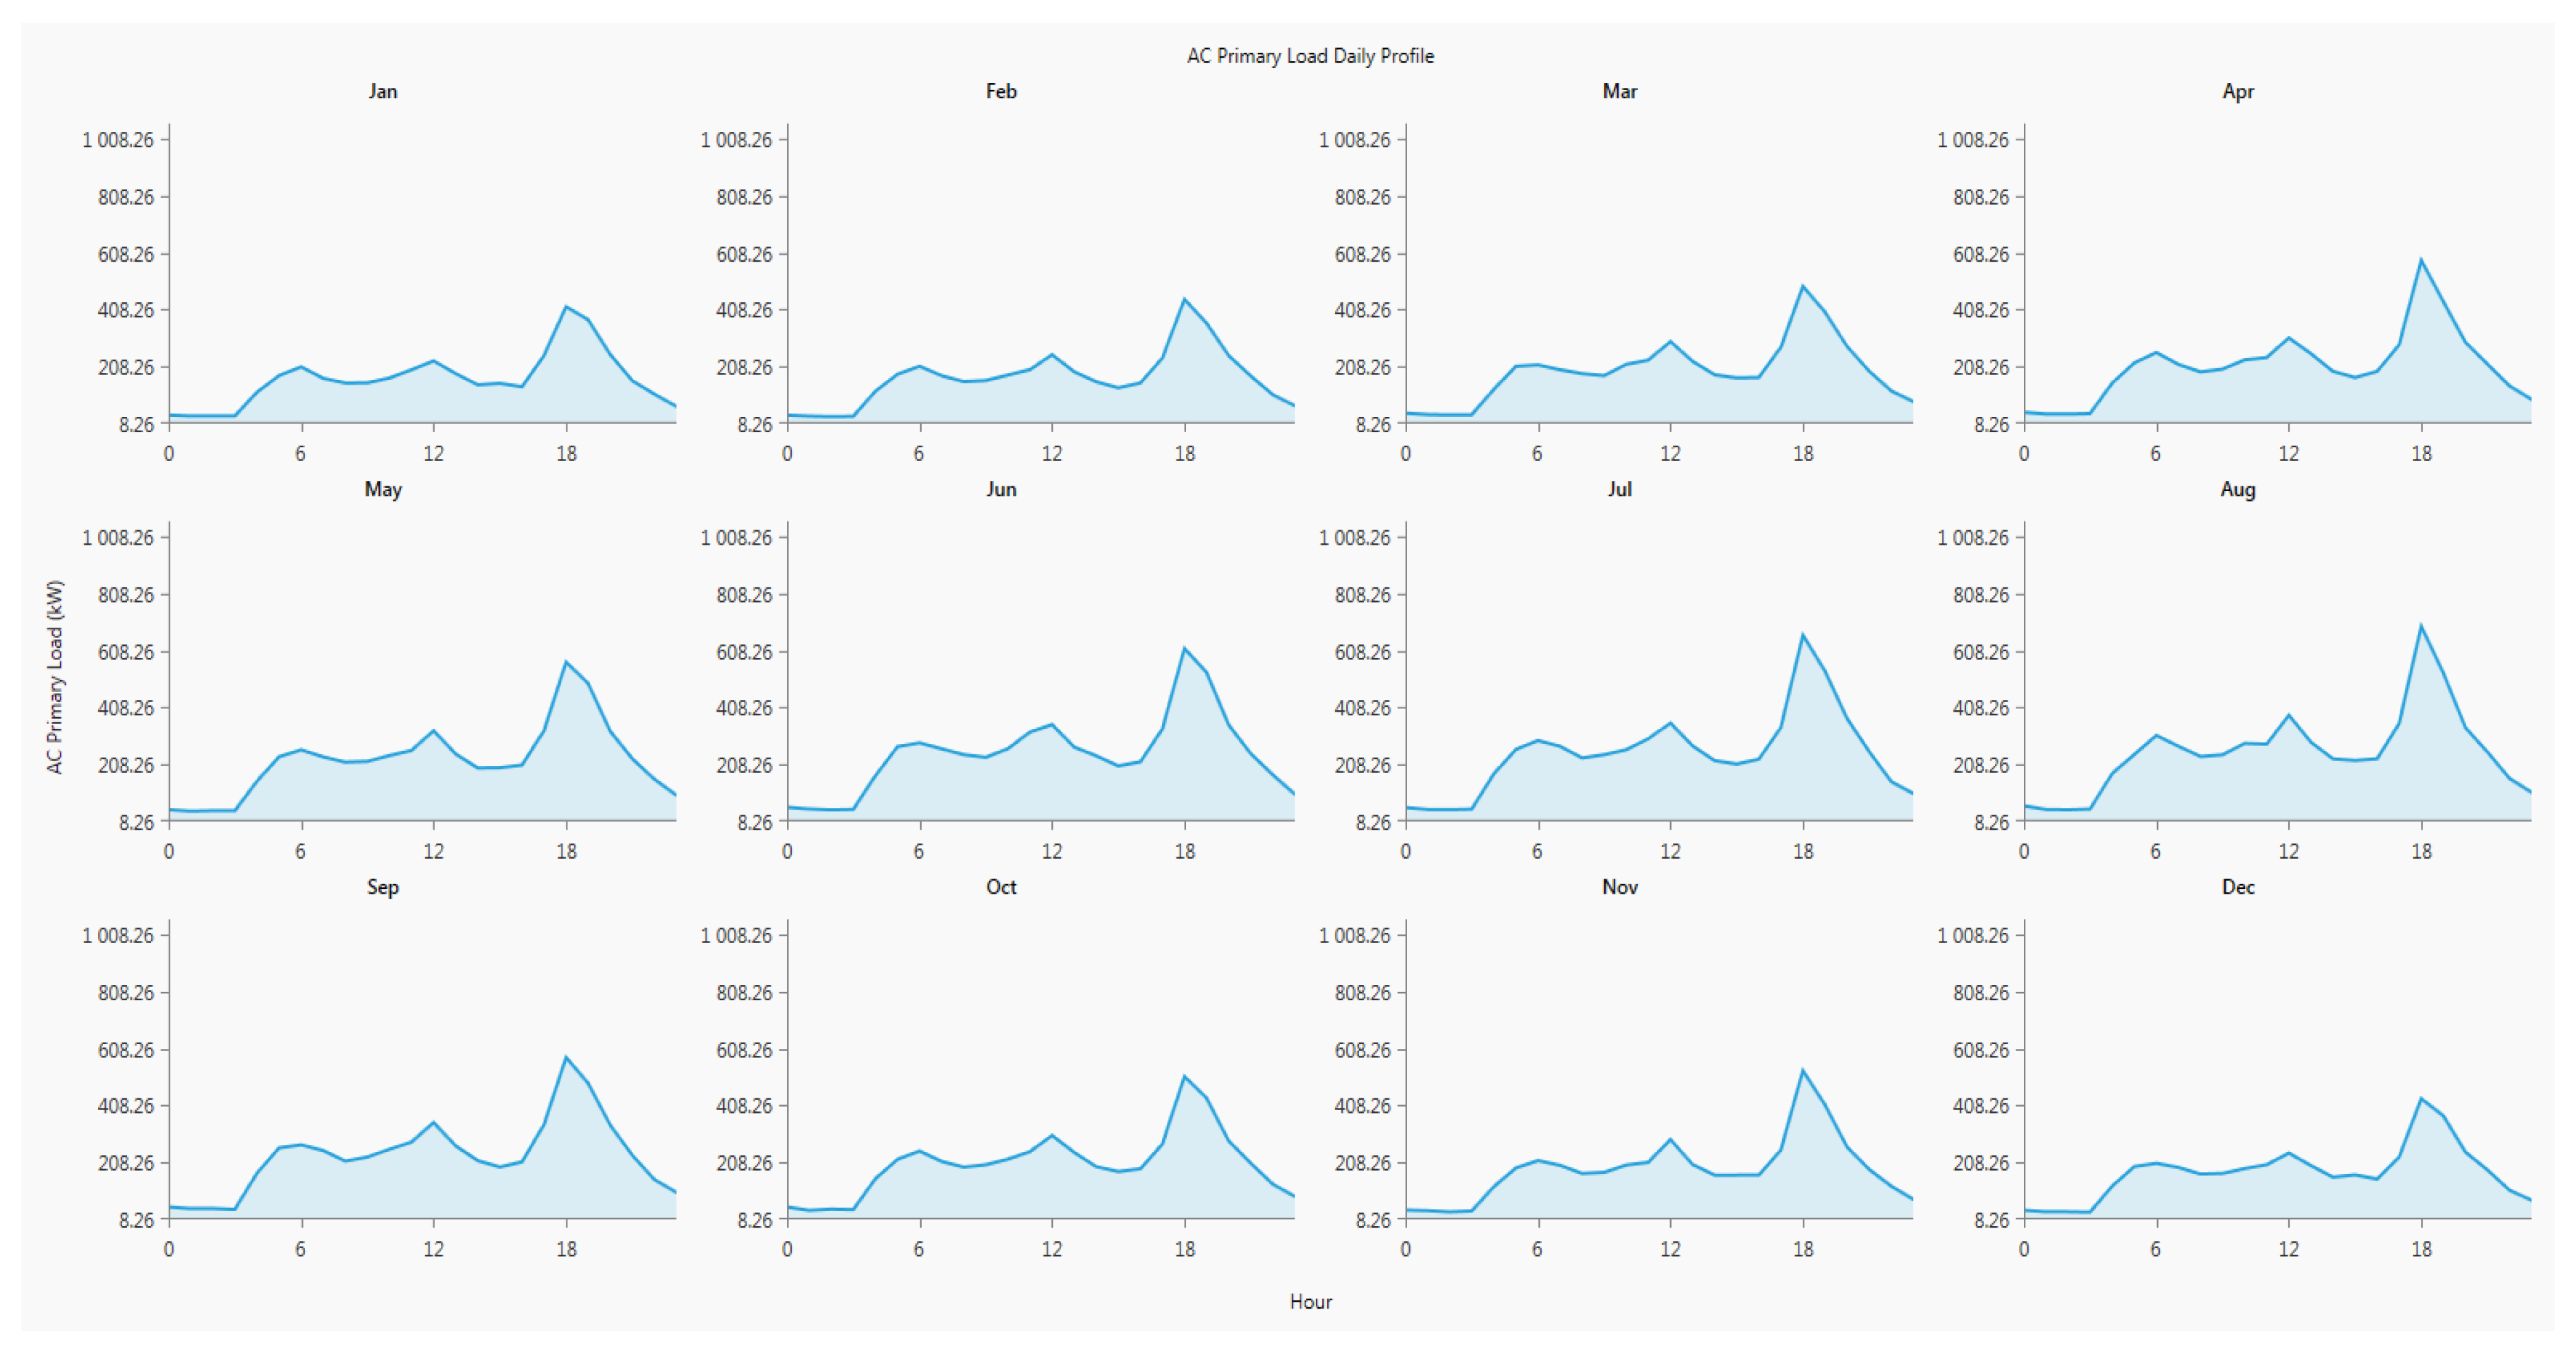
two thousand houses can be fed from a 5 MW plant. Figure 3 below shows the typical daily and seasonal profile of a residential customer in South Africa.
4. Simulation, Results and Discussion with Investigation
PPS and Li-ion batteries were modelled using six different scenarios on HomerPro® with system loading of 1 MW, 3 MW and 5 MW. Each system load was to have storage of 20% capacity for PPS and Li-Ion. An off-grid system is applied for all investigations.
The below case studies were simulated and analysed:
- Case study 1: 5 MW Load, PV Plant and 20% Storage Battery Capacity.
- Case study 2: 5 MW Load, PV Plant and 20% Pump Storage Plant.
- Case study 3: 3 MW Load, PV Plant and 20% Storage Battery Capacity.
- Case study 4: 3 MW Load, PV Plant and 20% Pump Storage Plant.
- Case study 5: 1 MW Load, PV Plant and 20% Storage Battery Capacity.
- Case study 6: 1 MW Load, PV Plant and 20% Pump Storage Plant.
Throughout the discussion that follows in the case studies, the load varied per case study and the PV plant was kept constant. Just the storage facilities were varied to determine the most economical solution. This study considered only Li-ion type batteries.
Case Study 1: 5 MW Load, Photovoltaic (PV) Plant and 20% Storage Battery Capacity
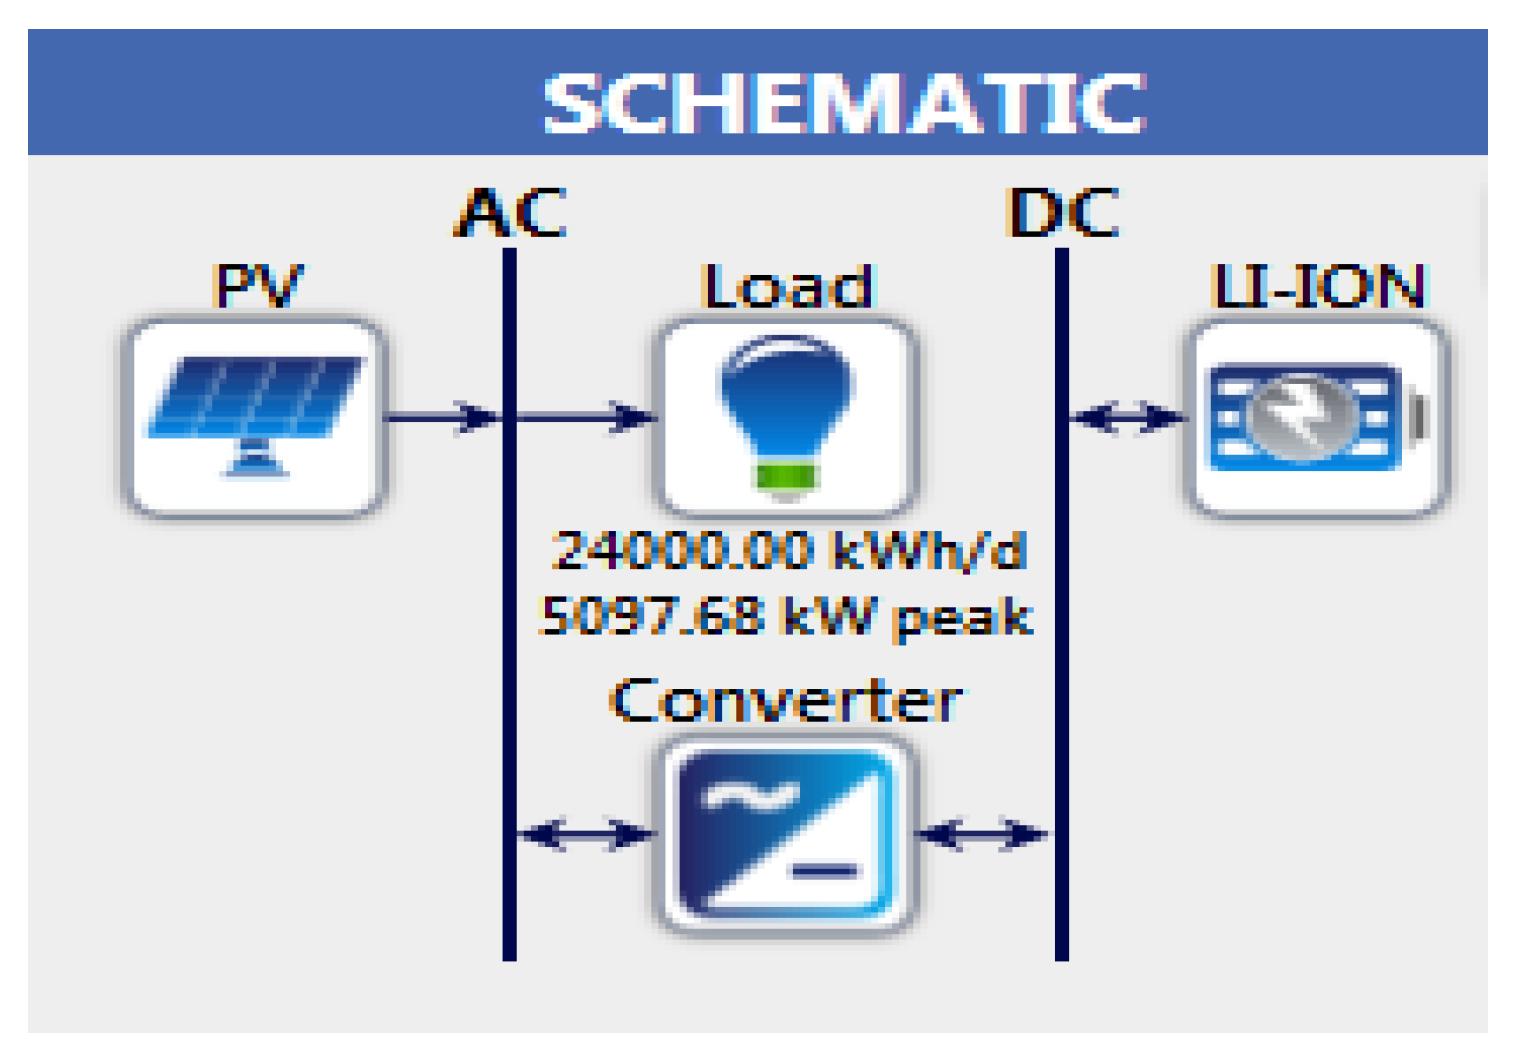
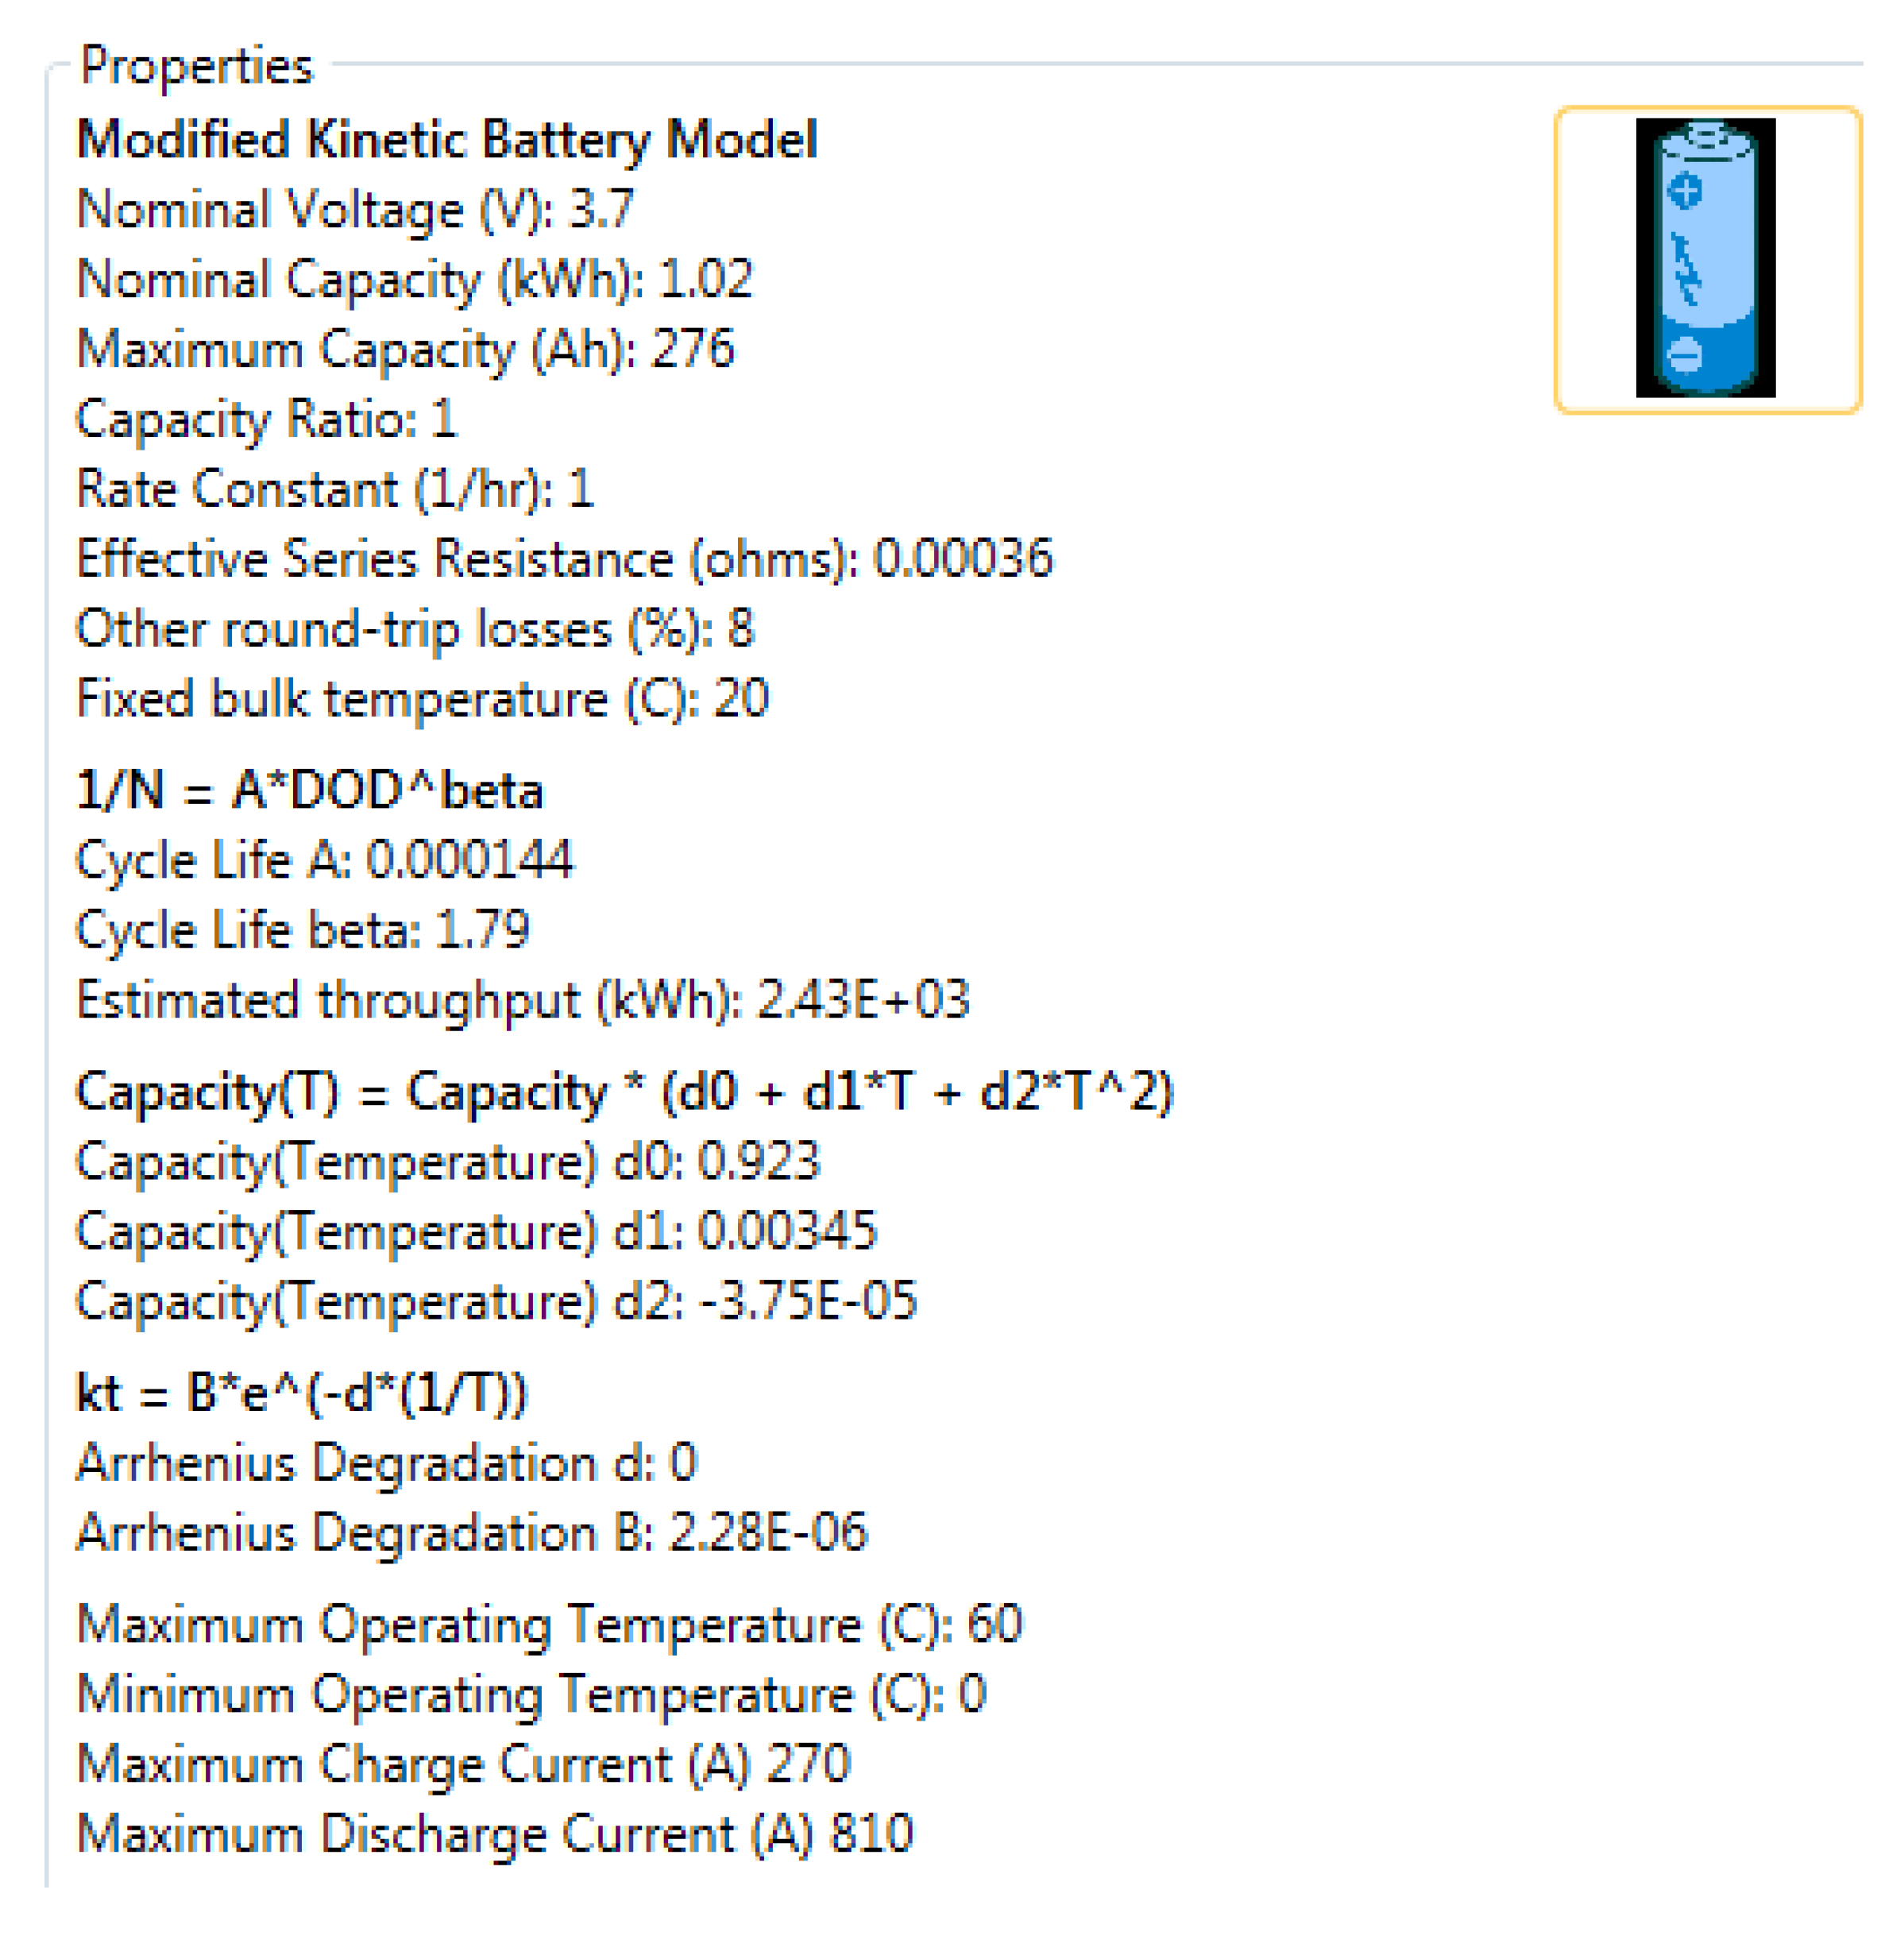
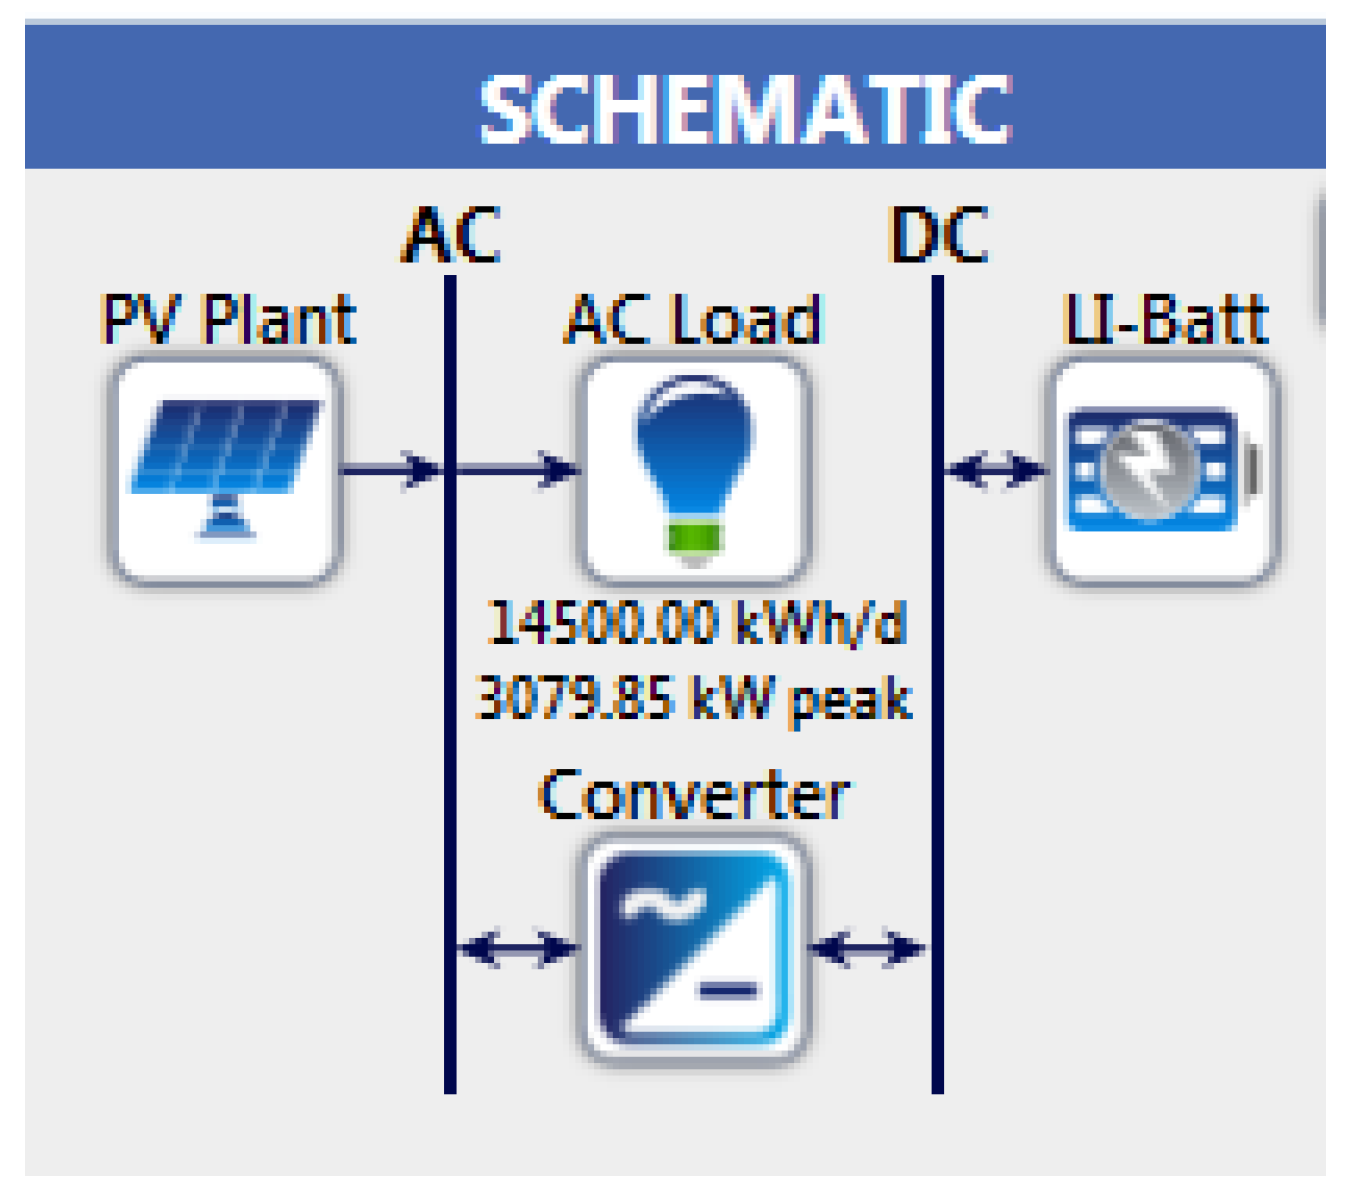
The peak load was 5 MWh, and merely 20% of the load, which was just 1 MWh, had to be stored in Li-Ion batteries. Figure 4 shows the schematic diagram of case study 1. The properties of the storage batteries are provided below in Figure 5. A total of 1000 batteries were required to make 1 MWh storage.
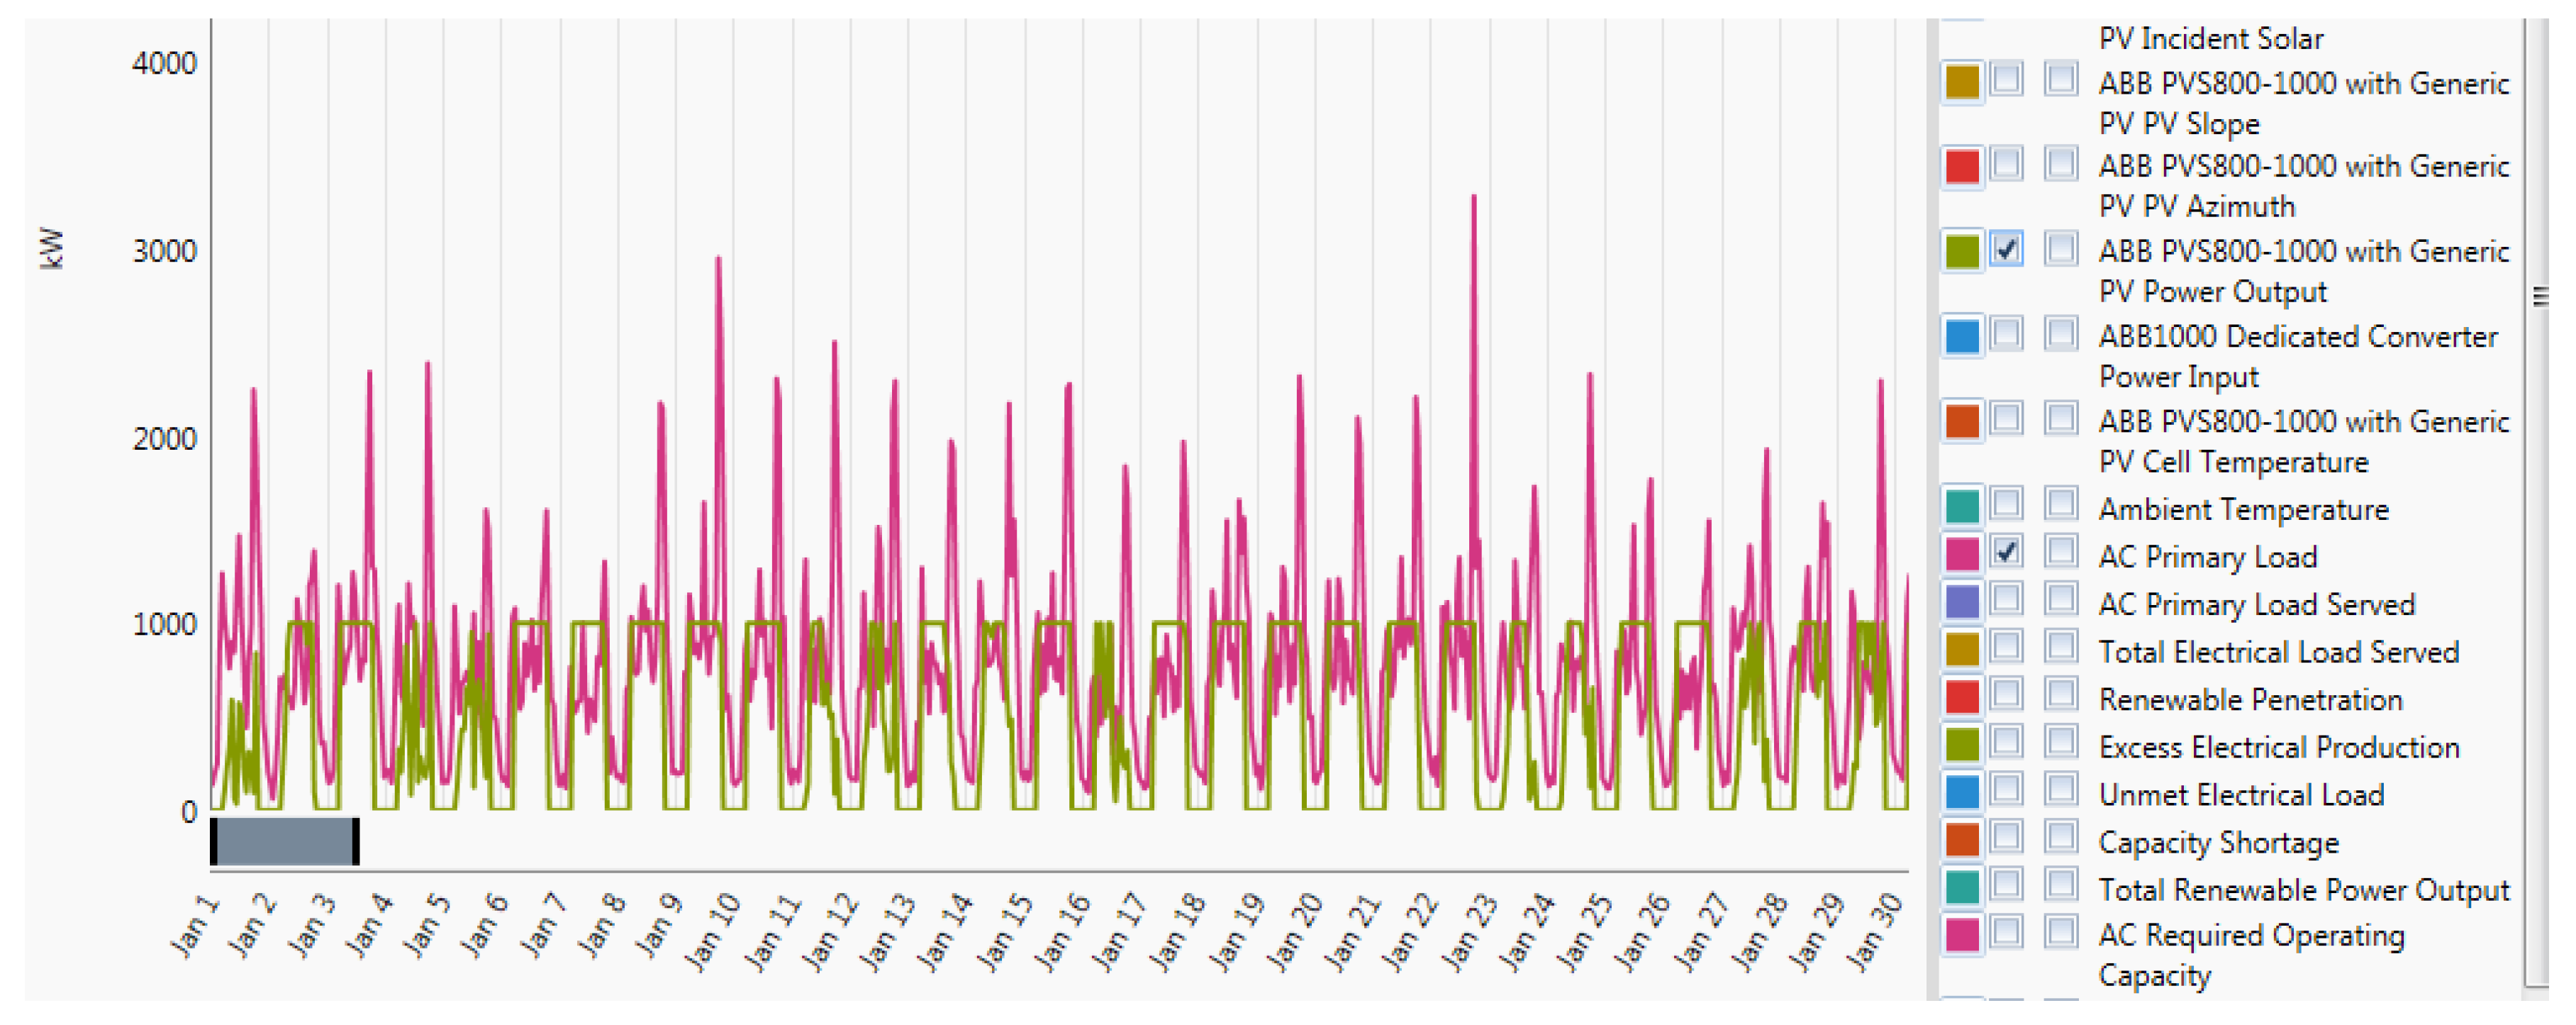
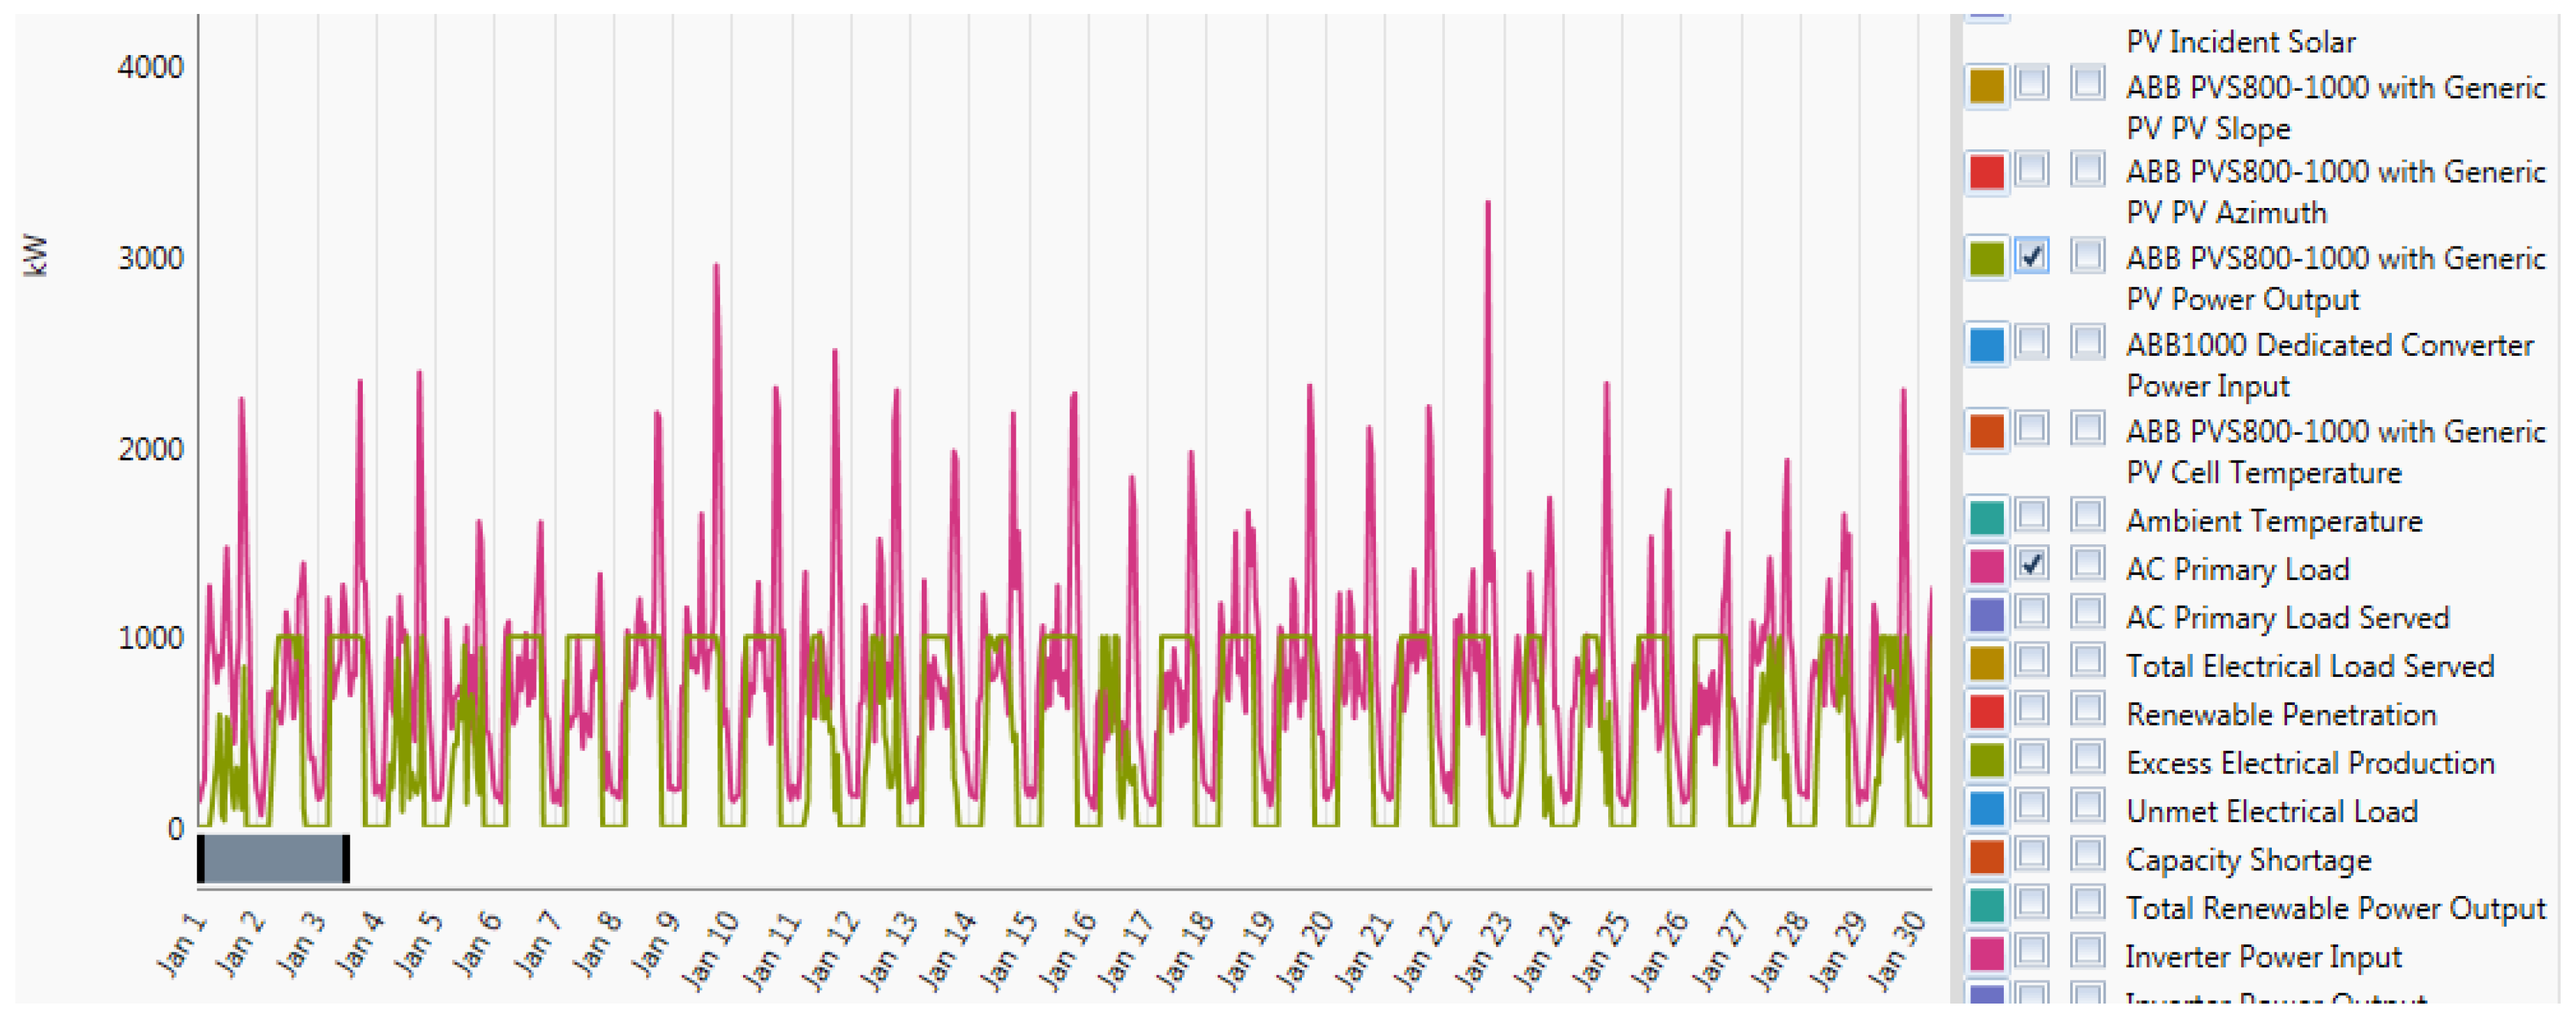
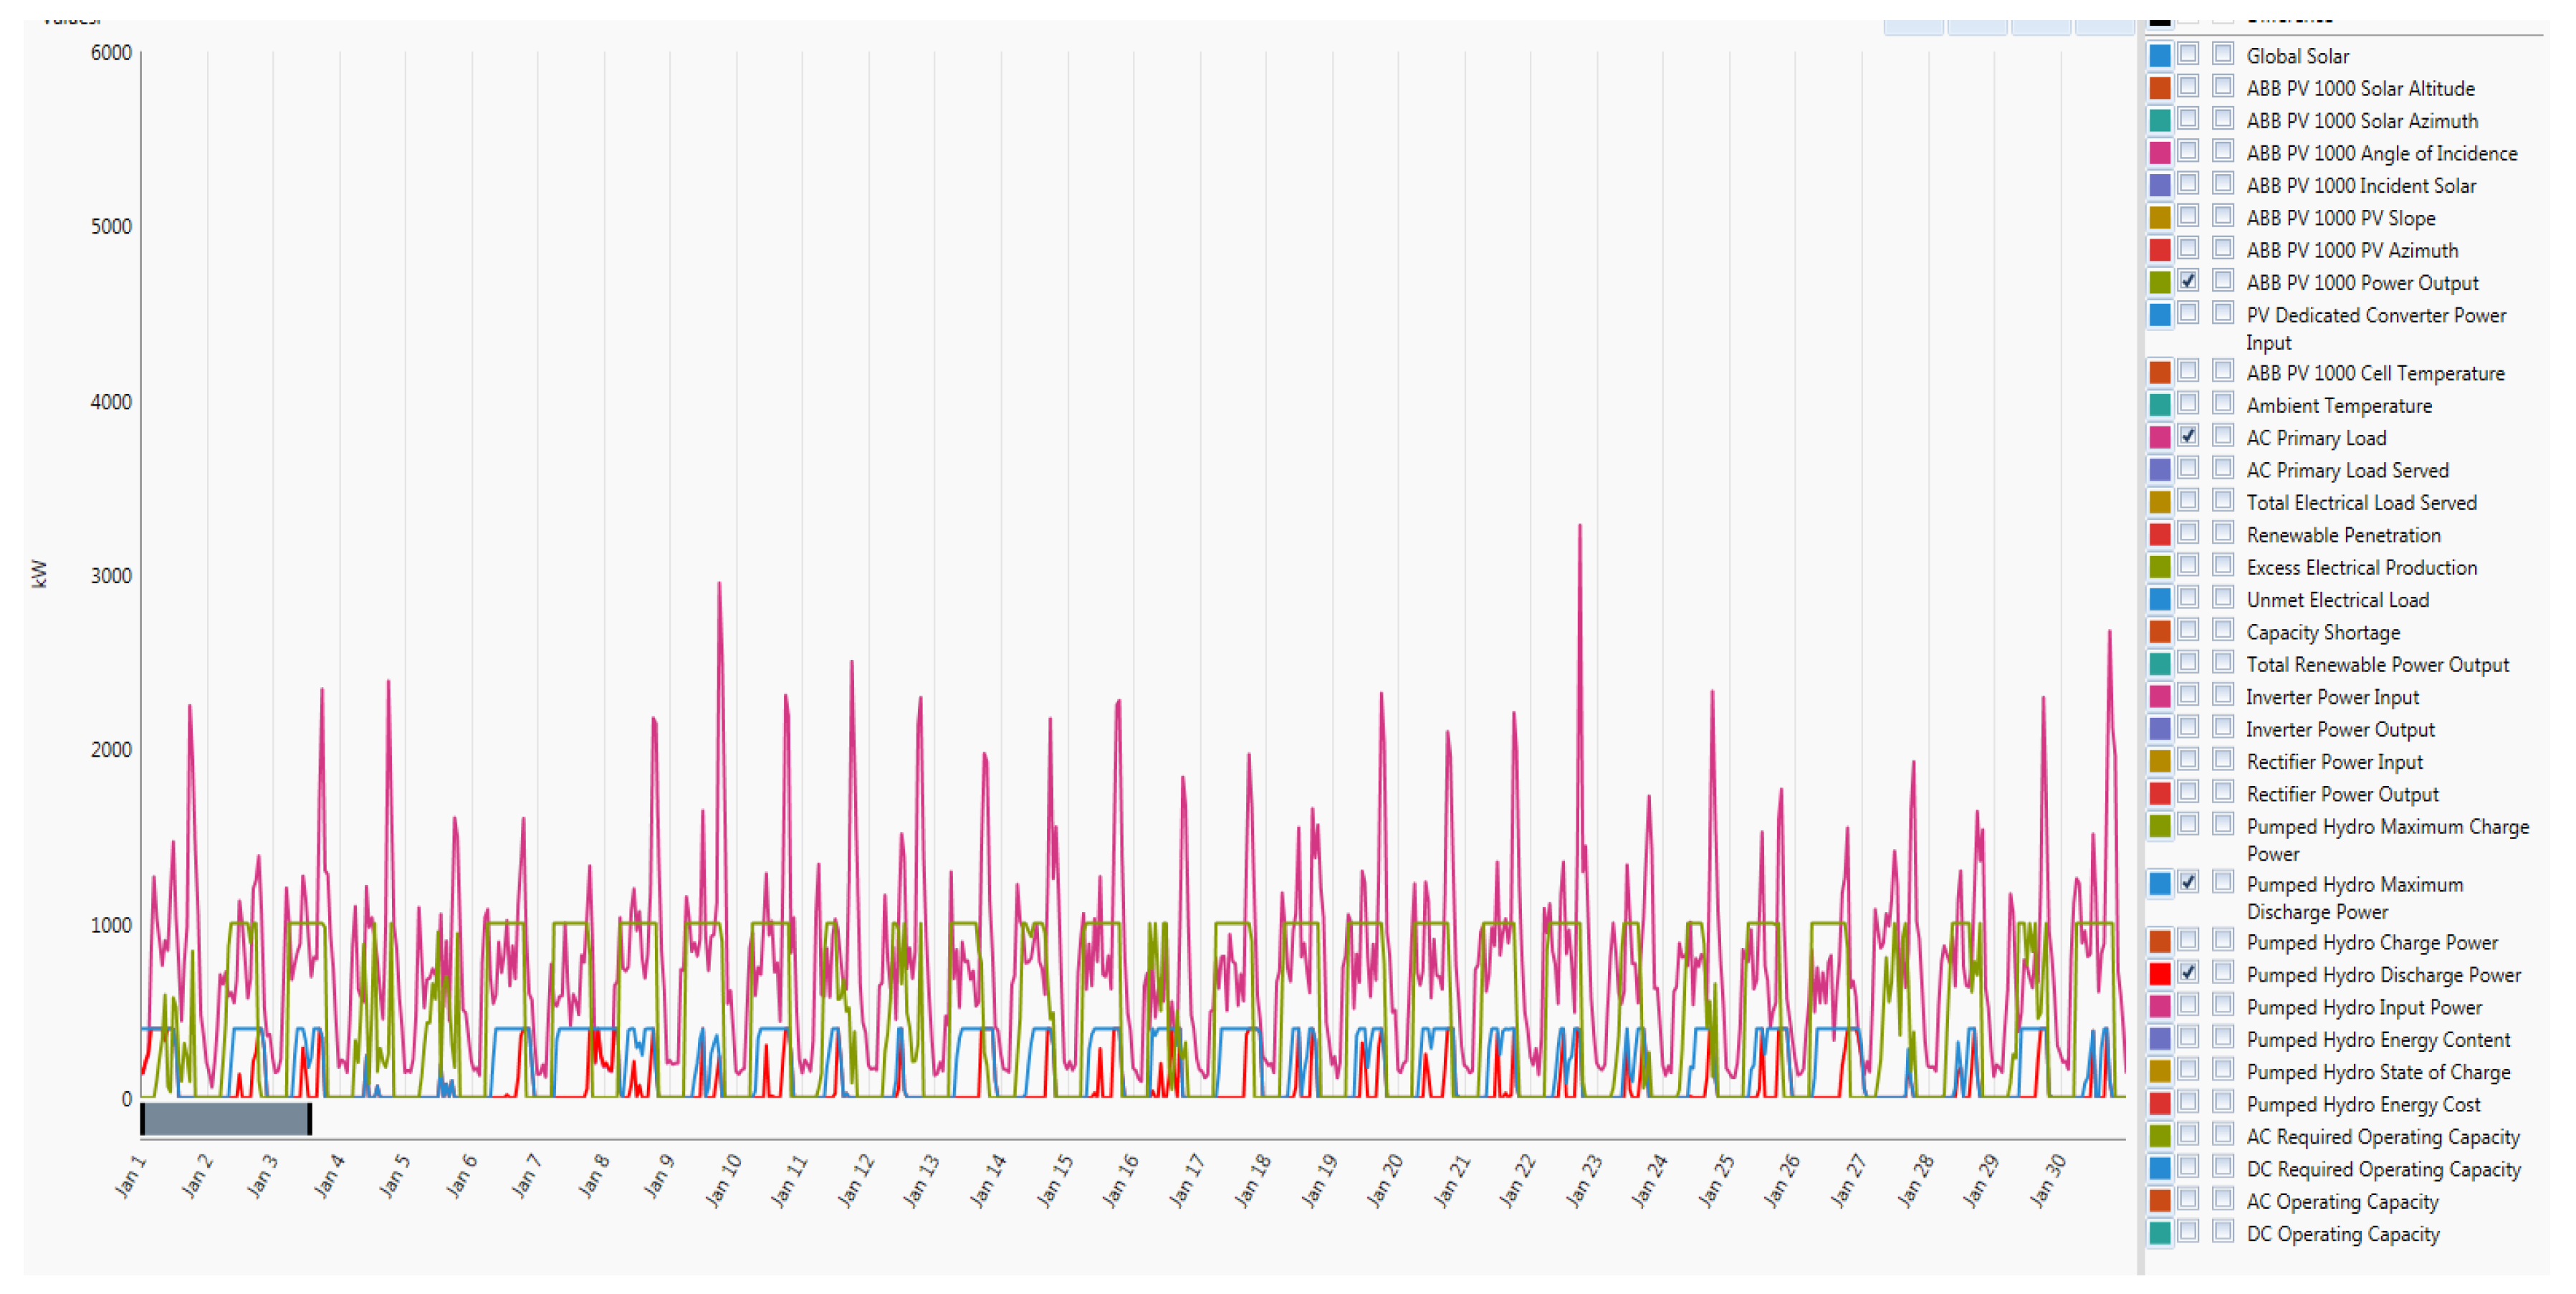
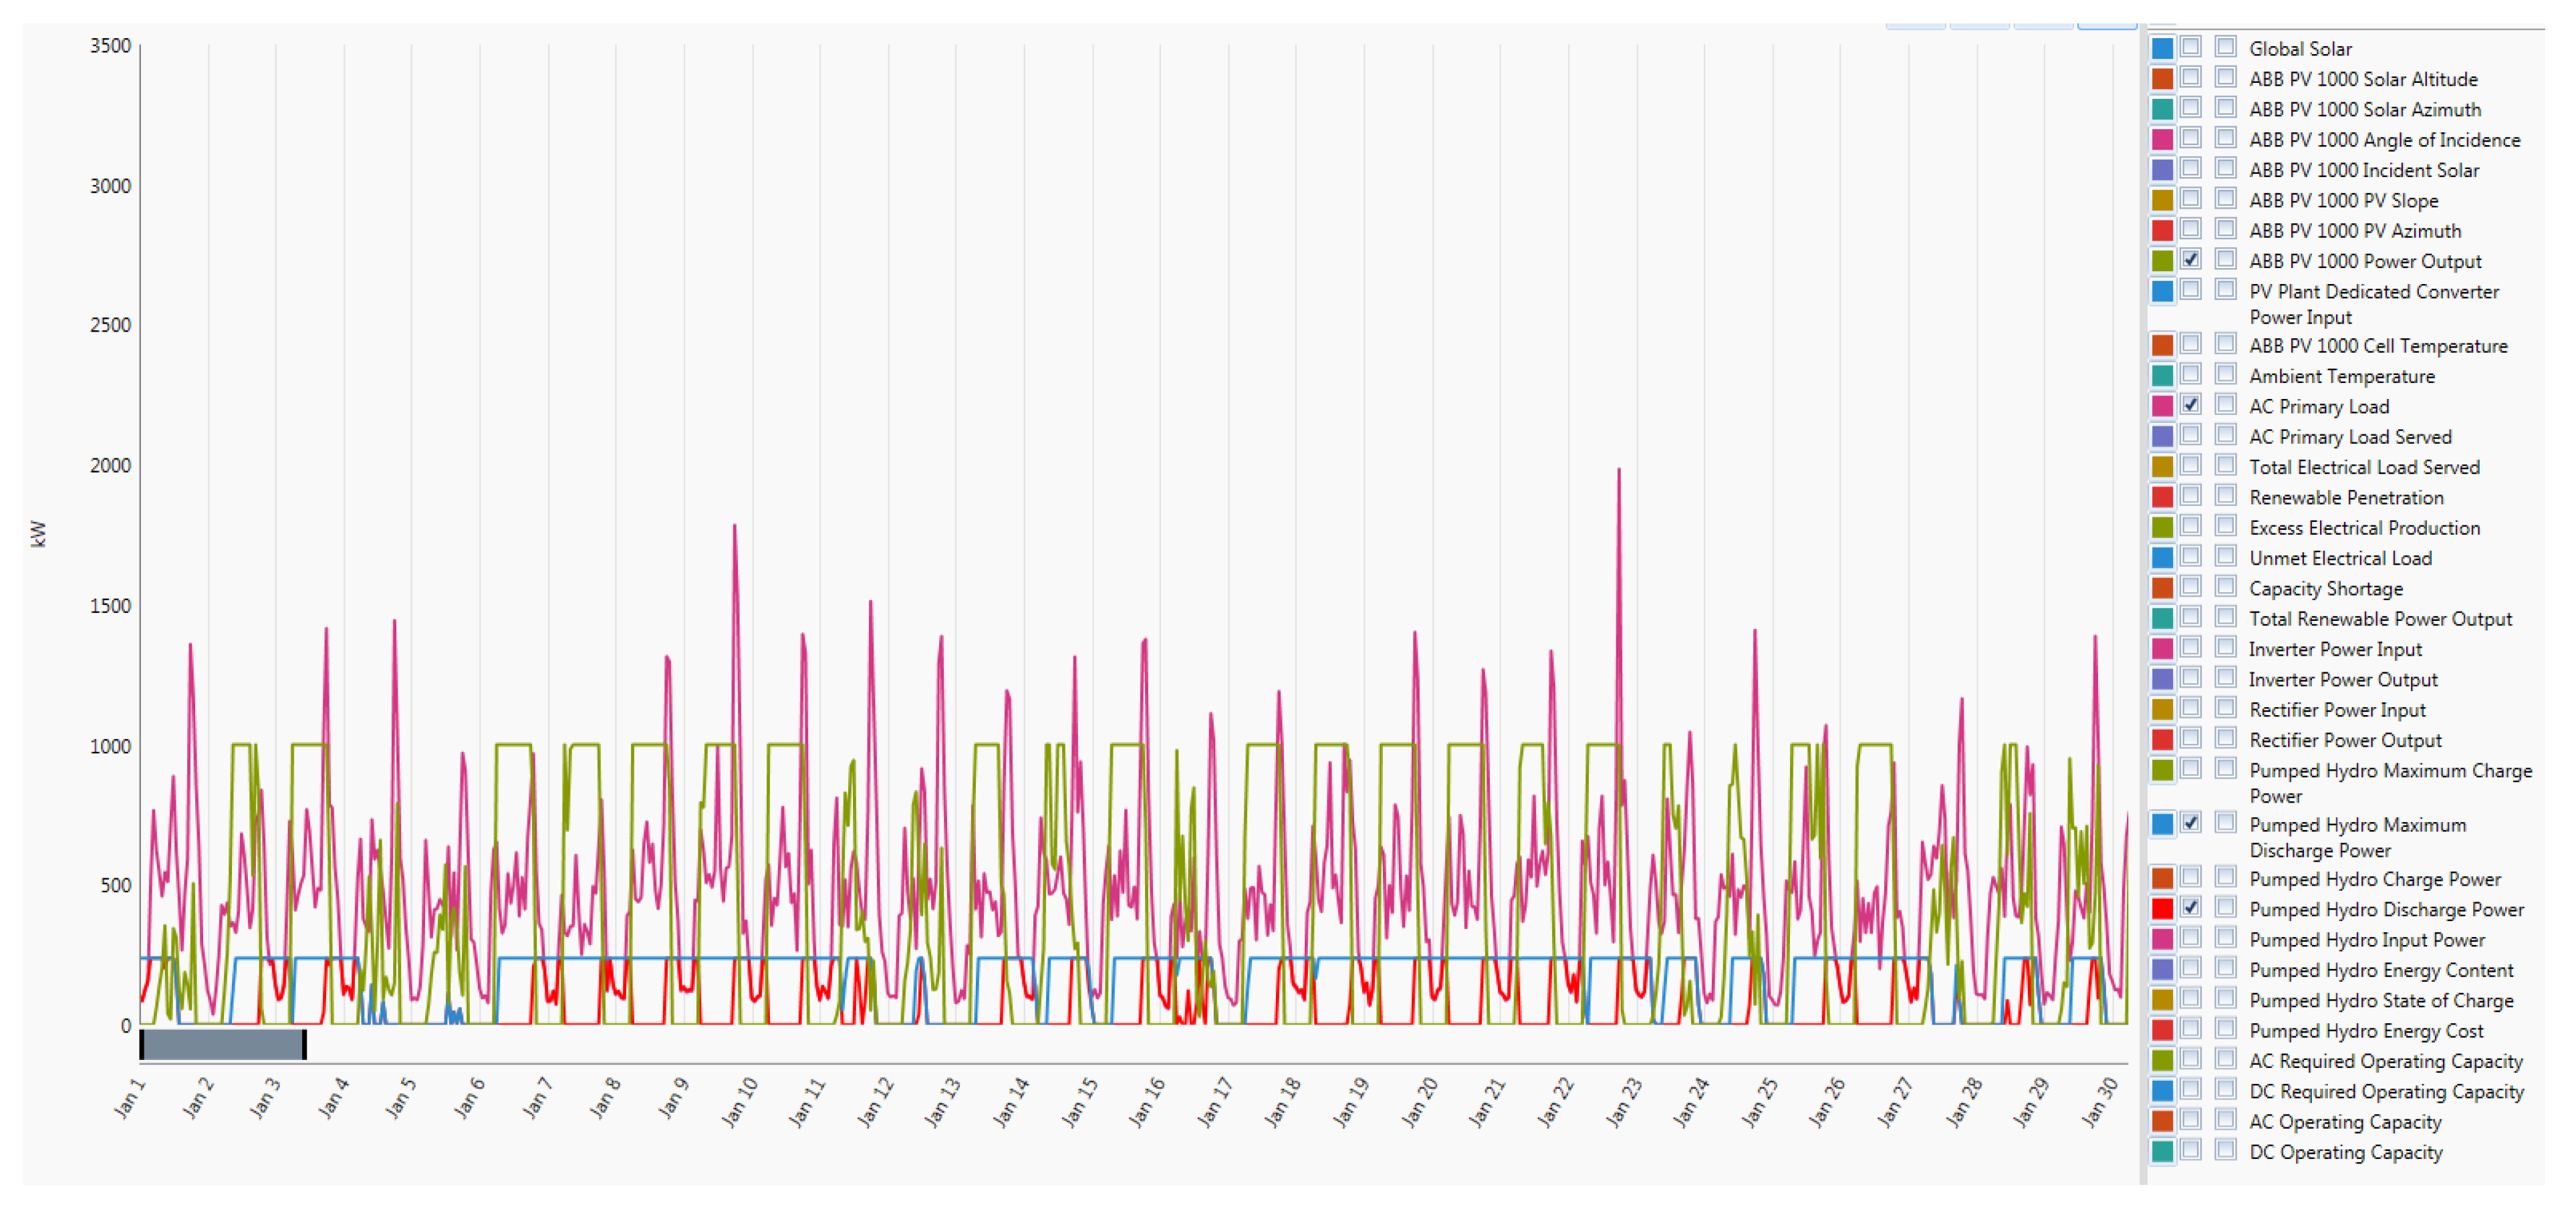
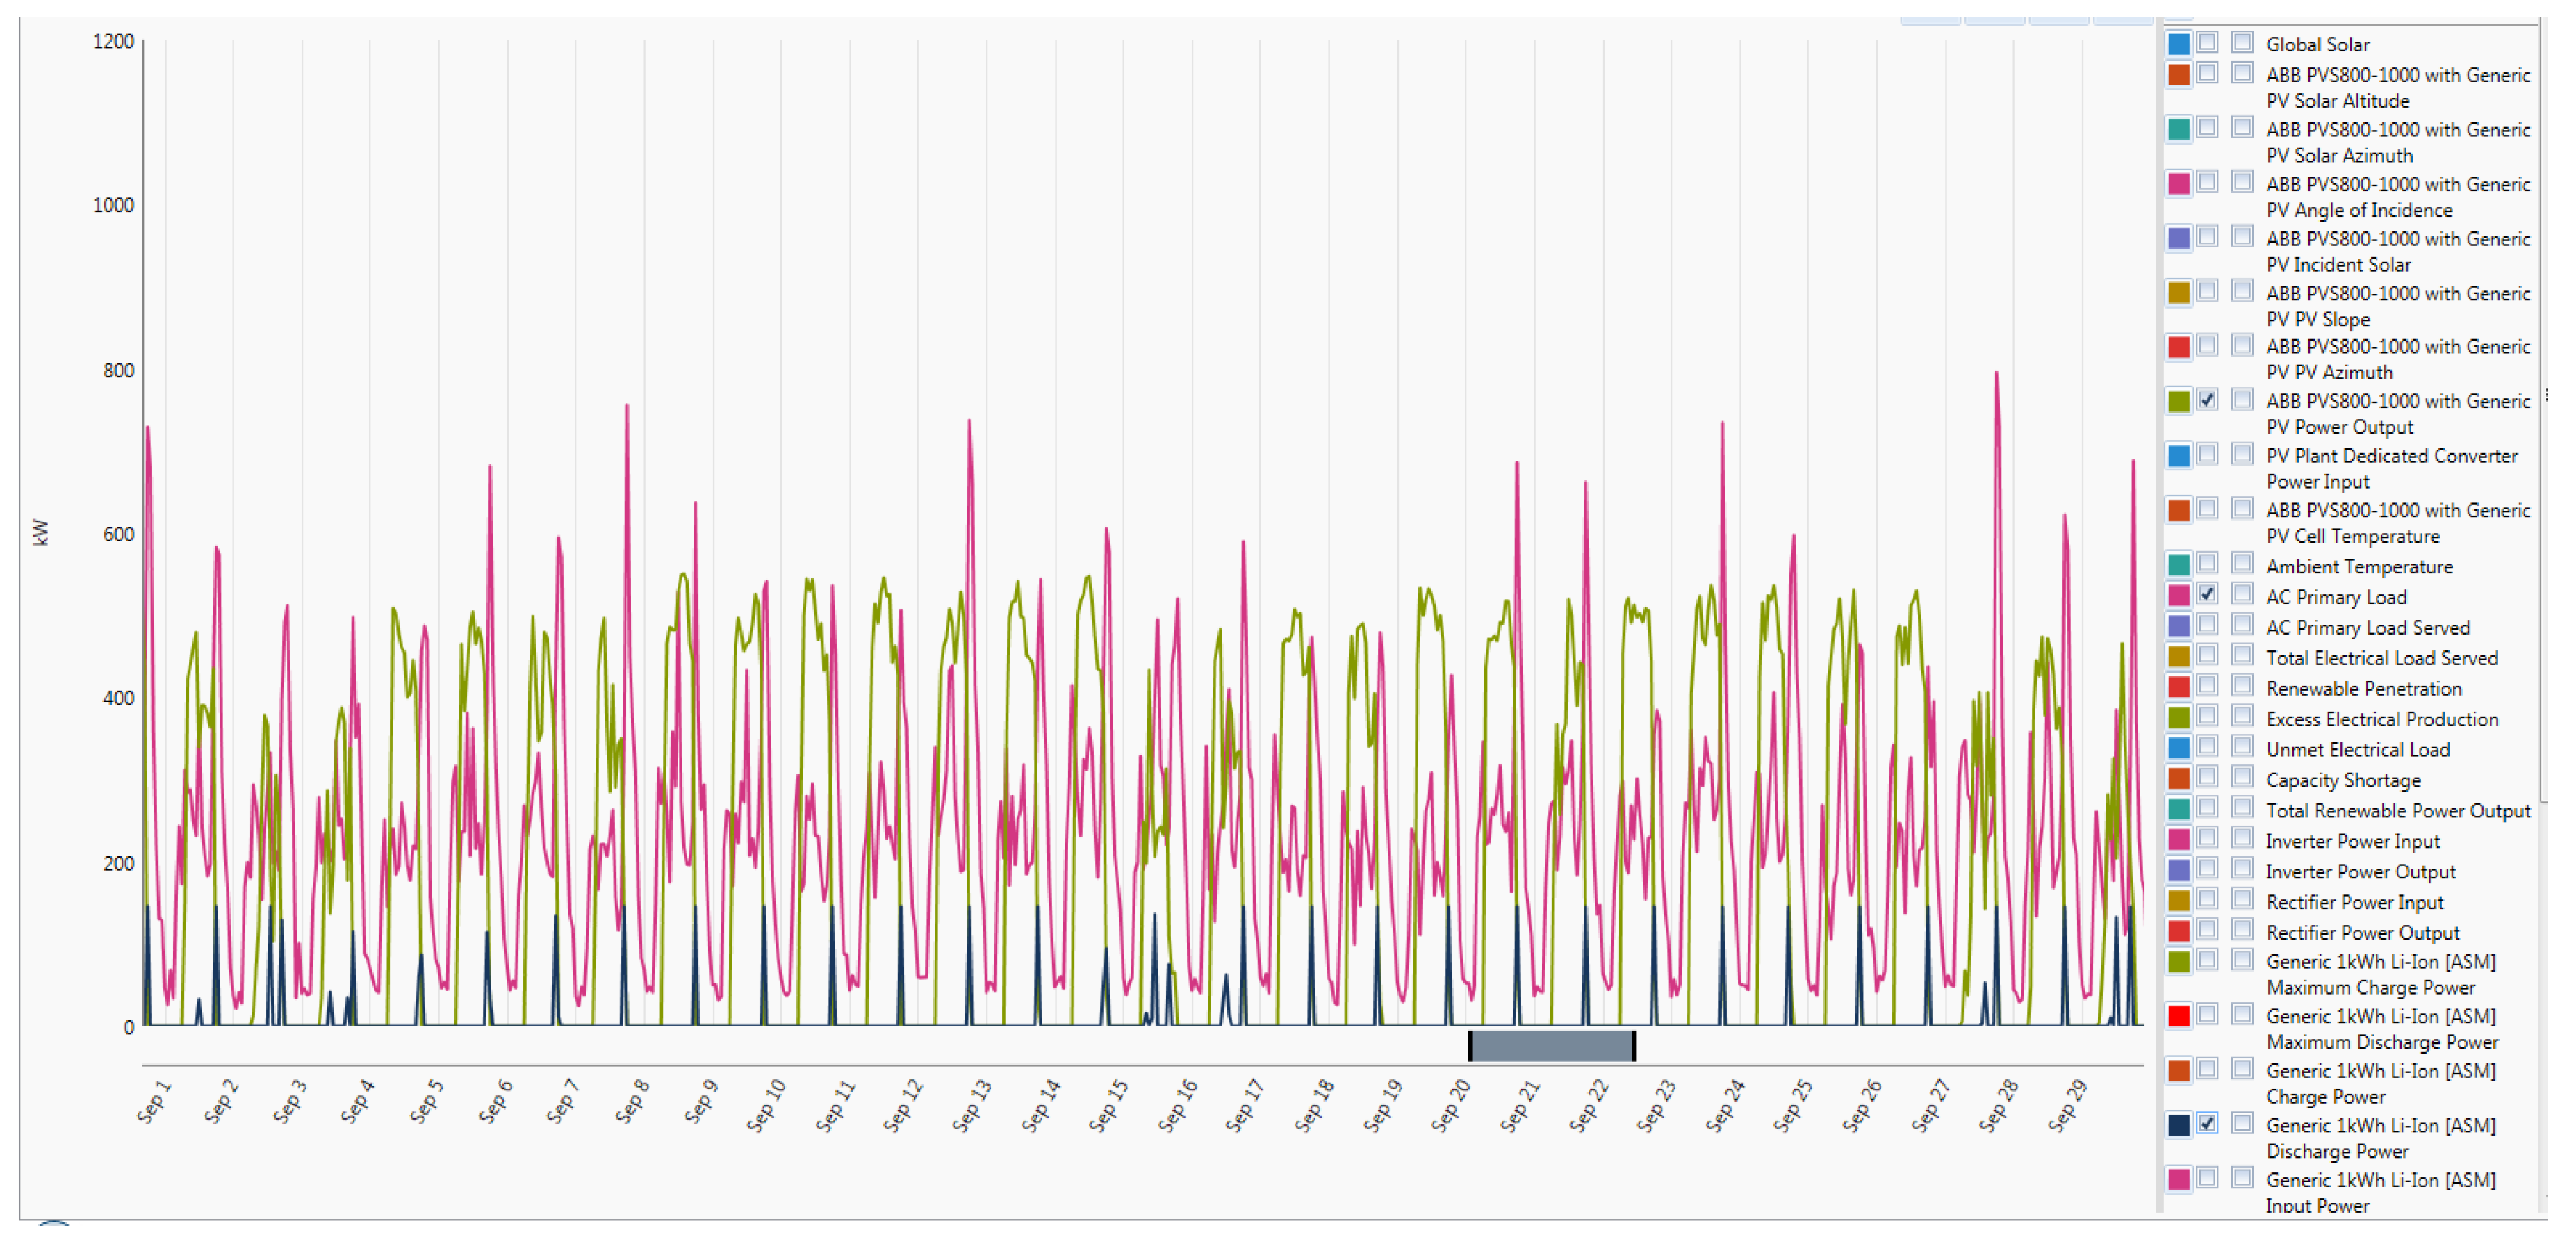
Looking at Figure 6, Figure 7 and Figure 8 below makes it clear that PV would only supply the load at times where there is sun available. This is usually from 7 am. till 5 pm. South African Time. At night time there will be no power supplied to the load and the output is not smooth during the day due to the inconsistency of the weather. This is the reason why storage is required. Figure 8 shows the typical behaviour of a PV plant in the month of January, most importantly the variation of AC load per day while the supply remains almost constant. PV will never be able to supply the load hence storage can be used to at least supplement the PV where and when the load has peaked.
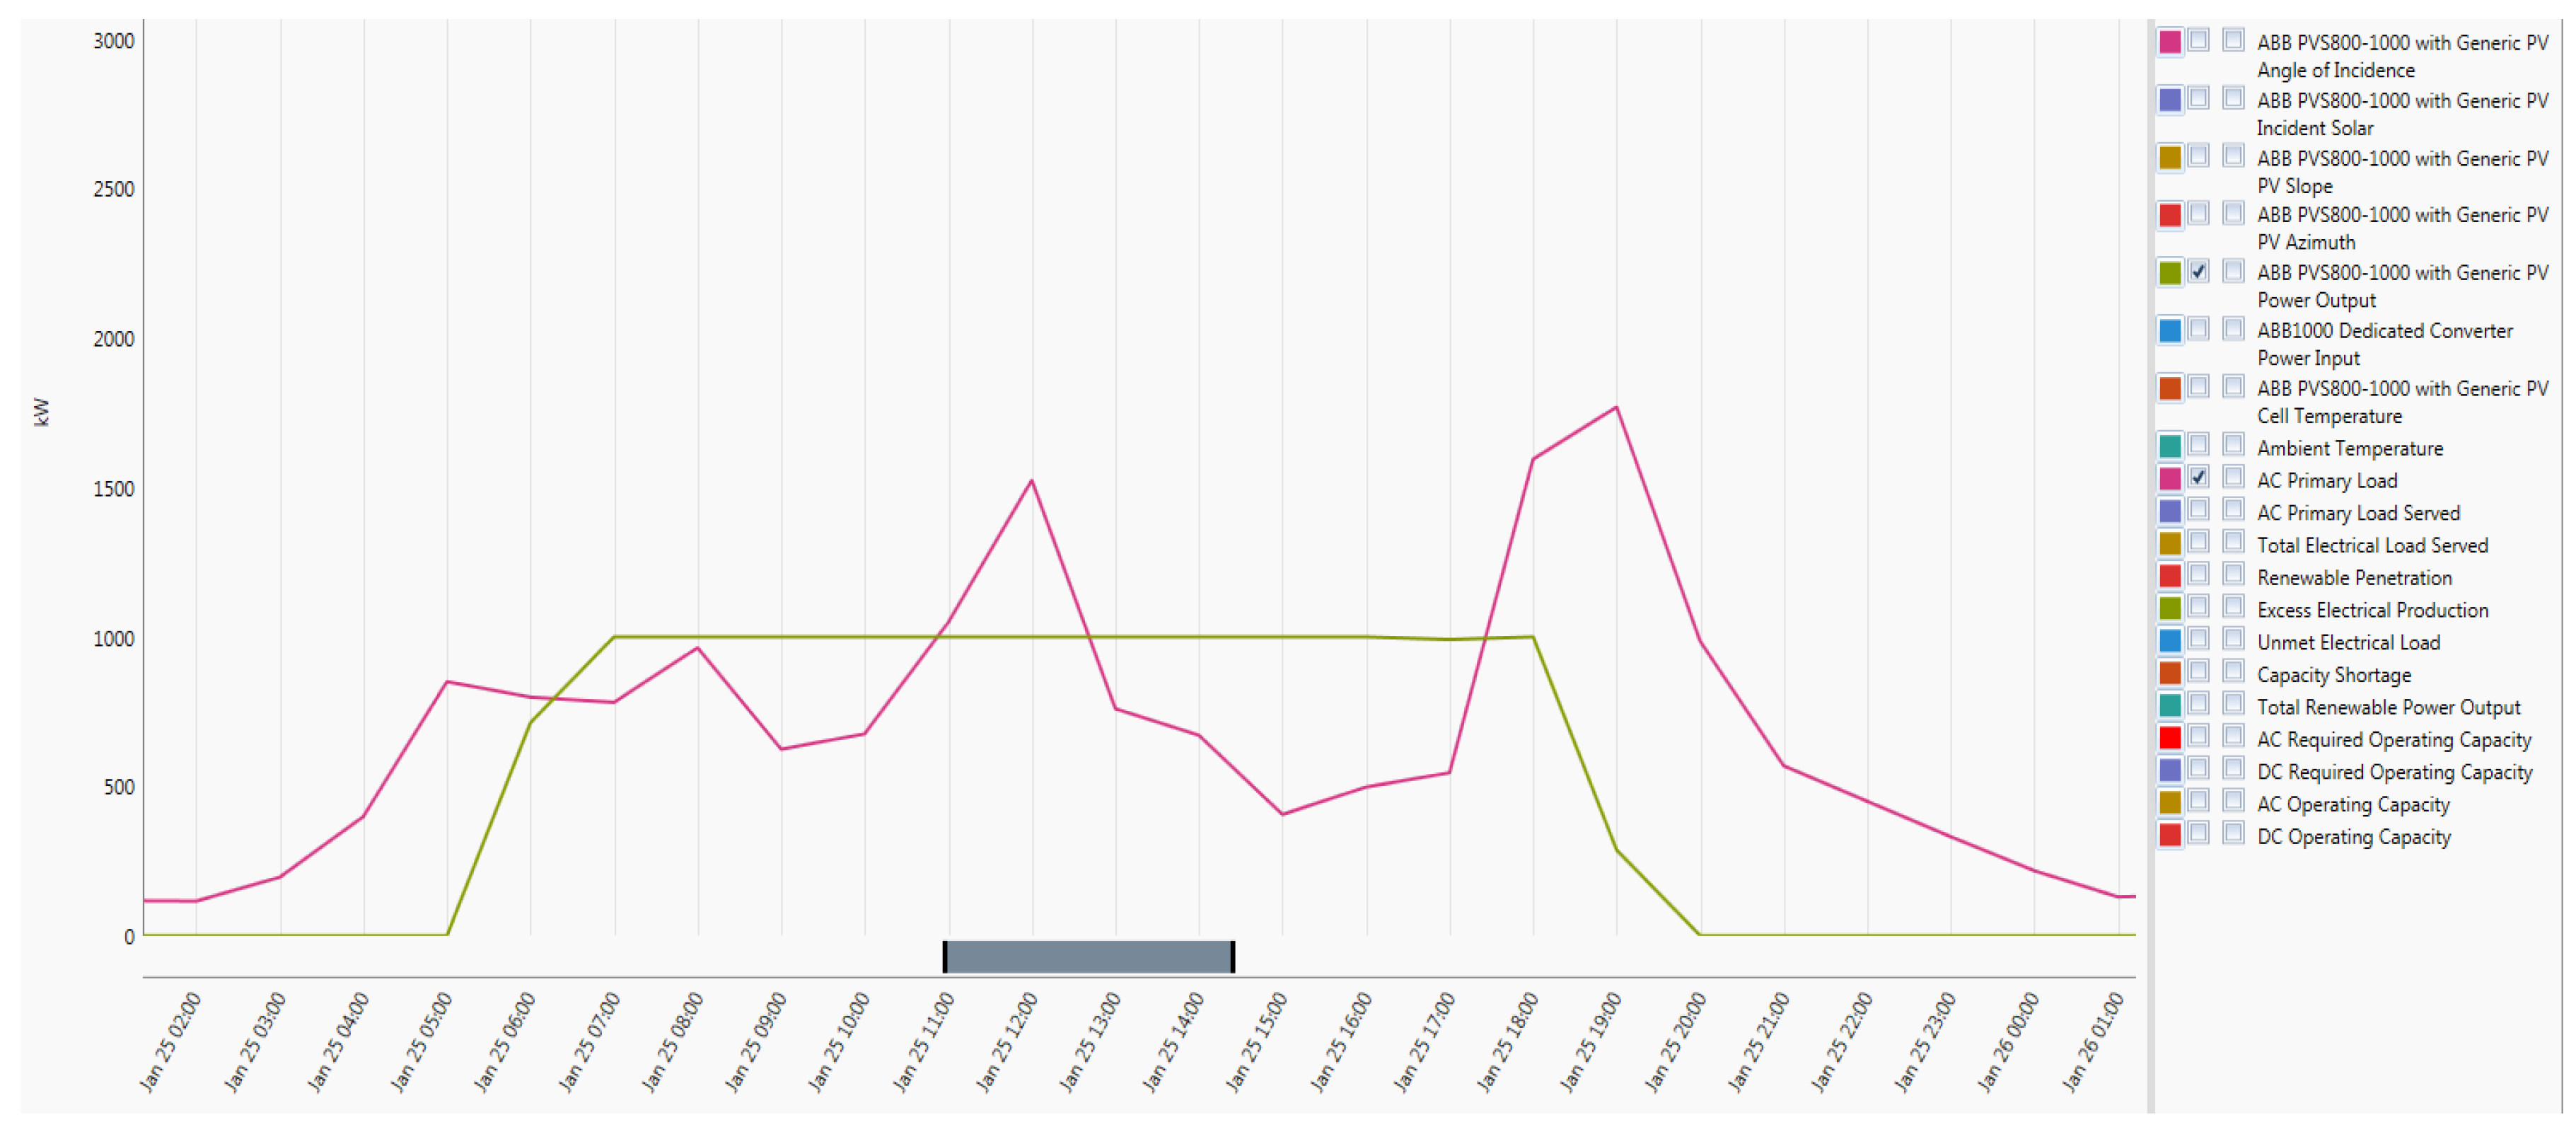
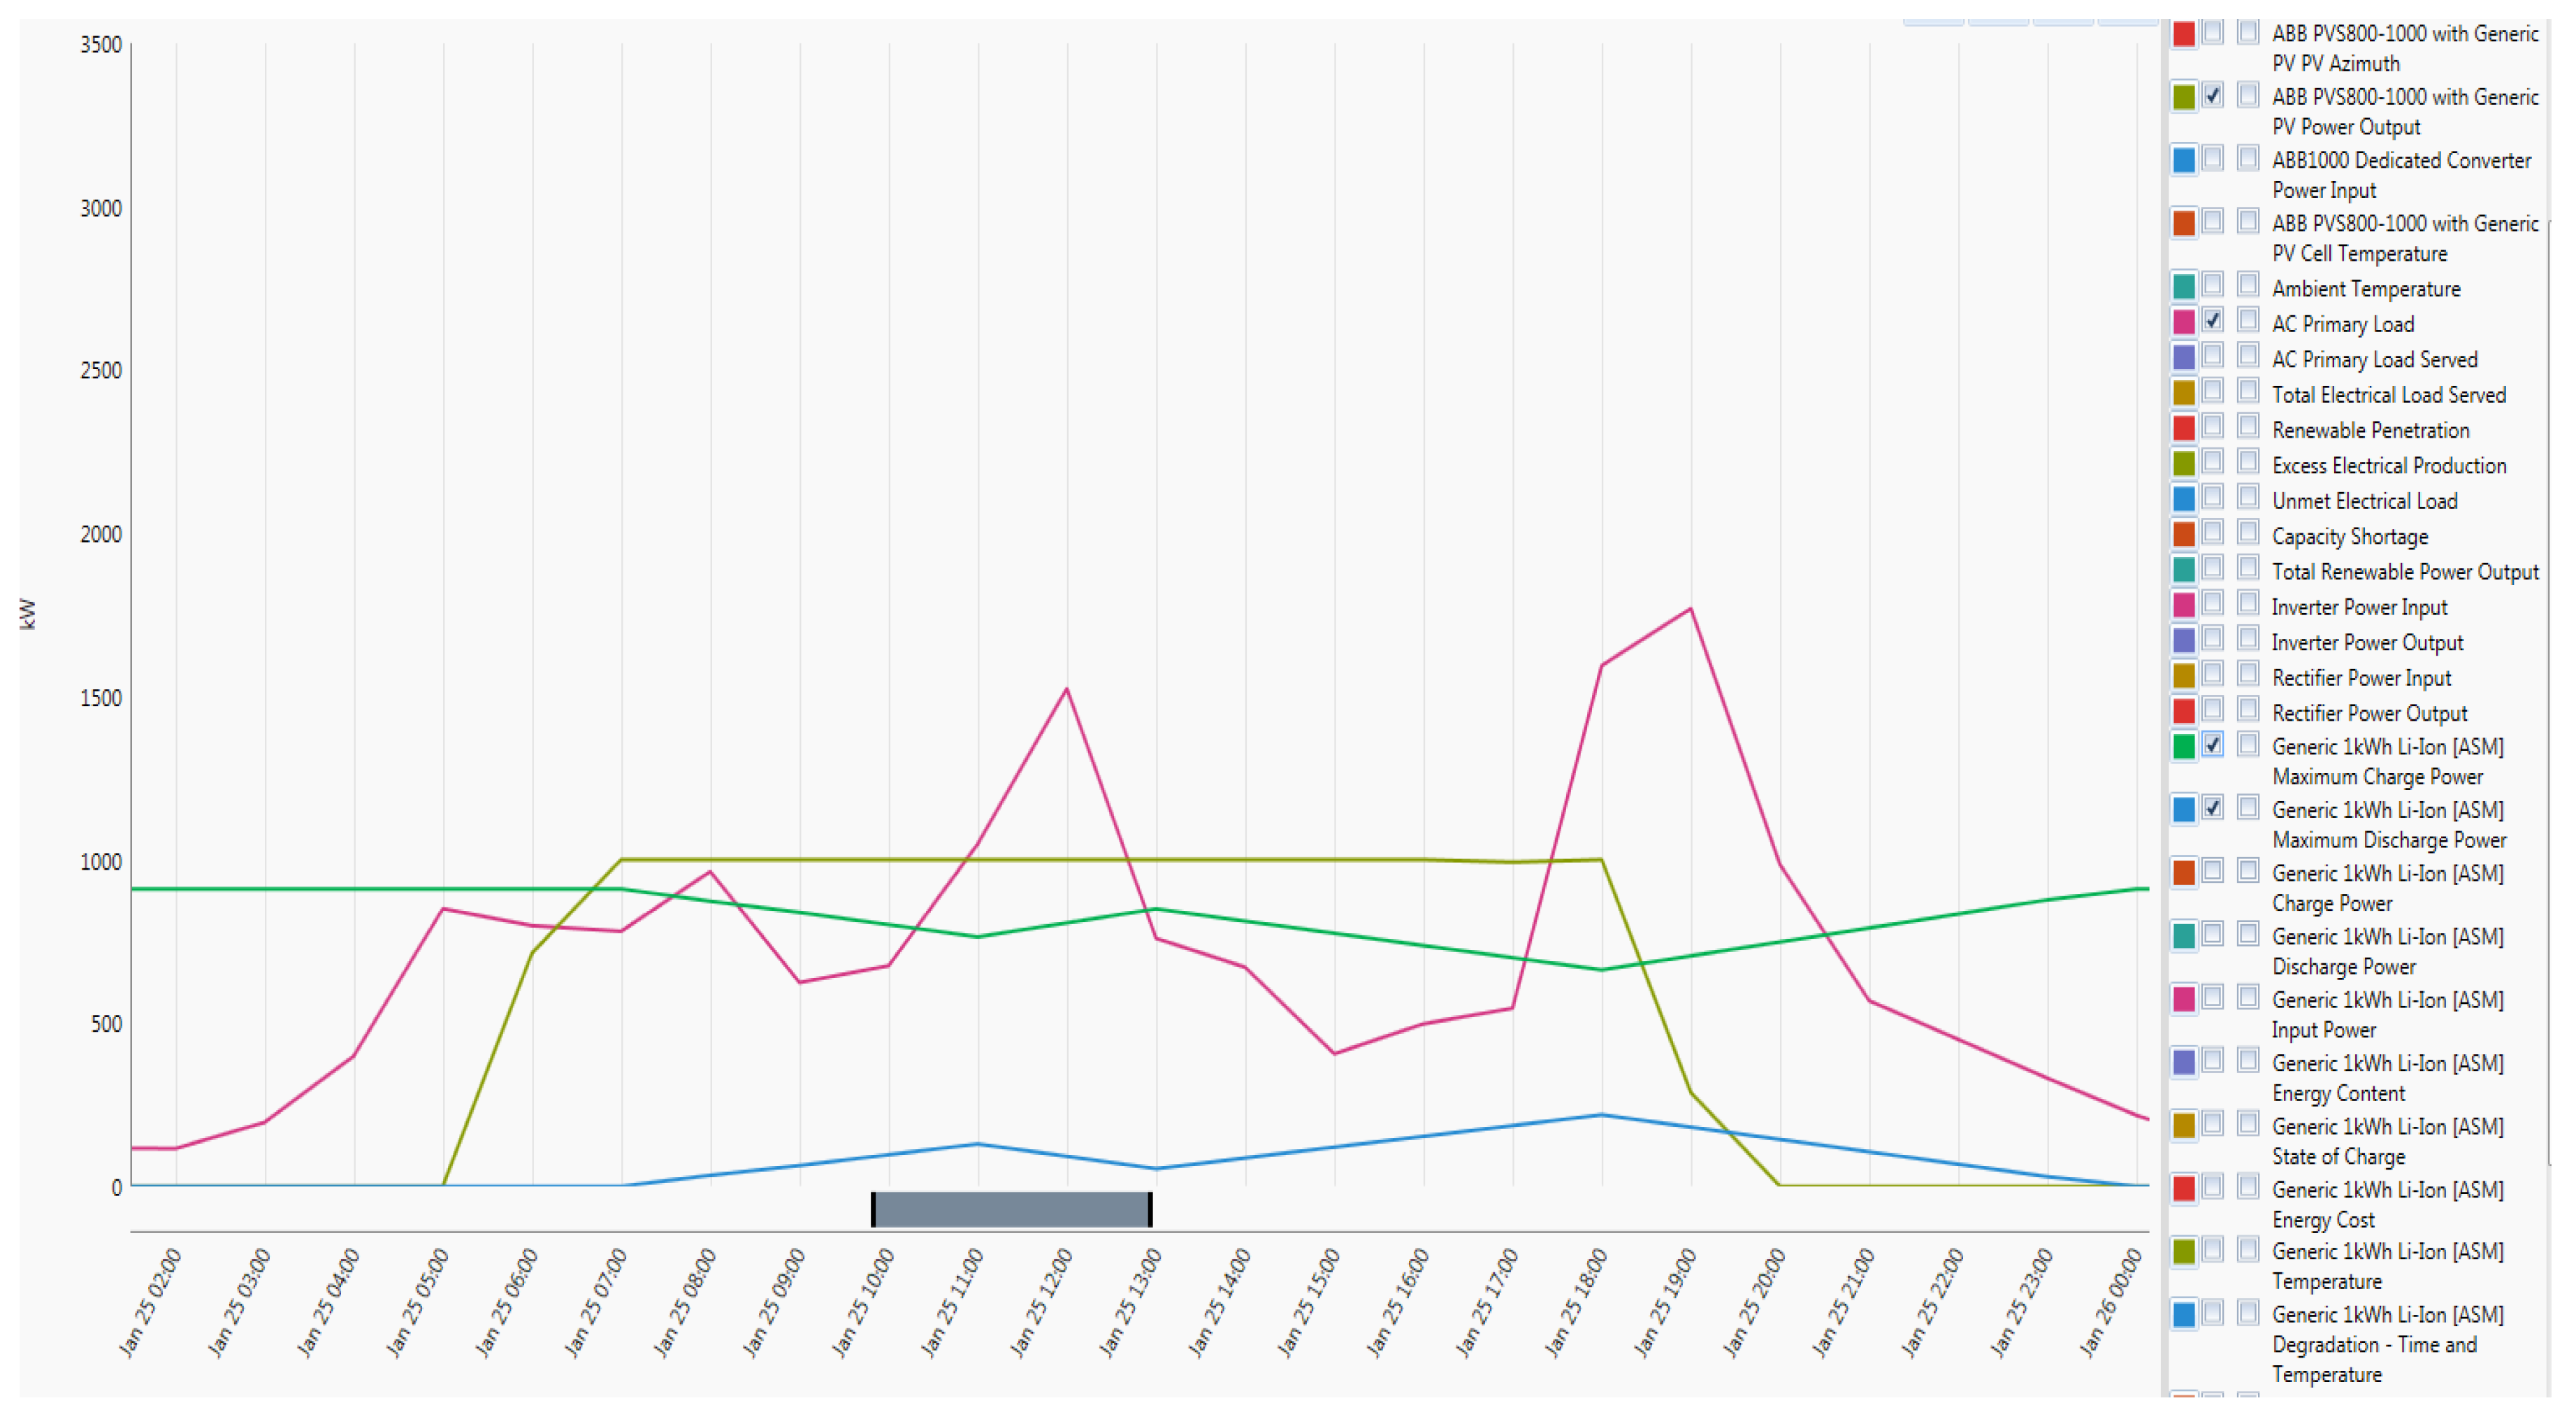
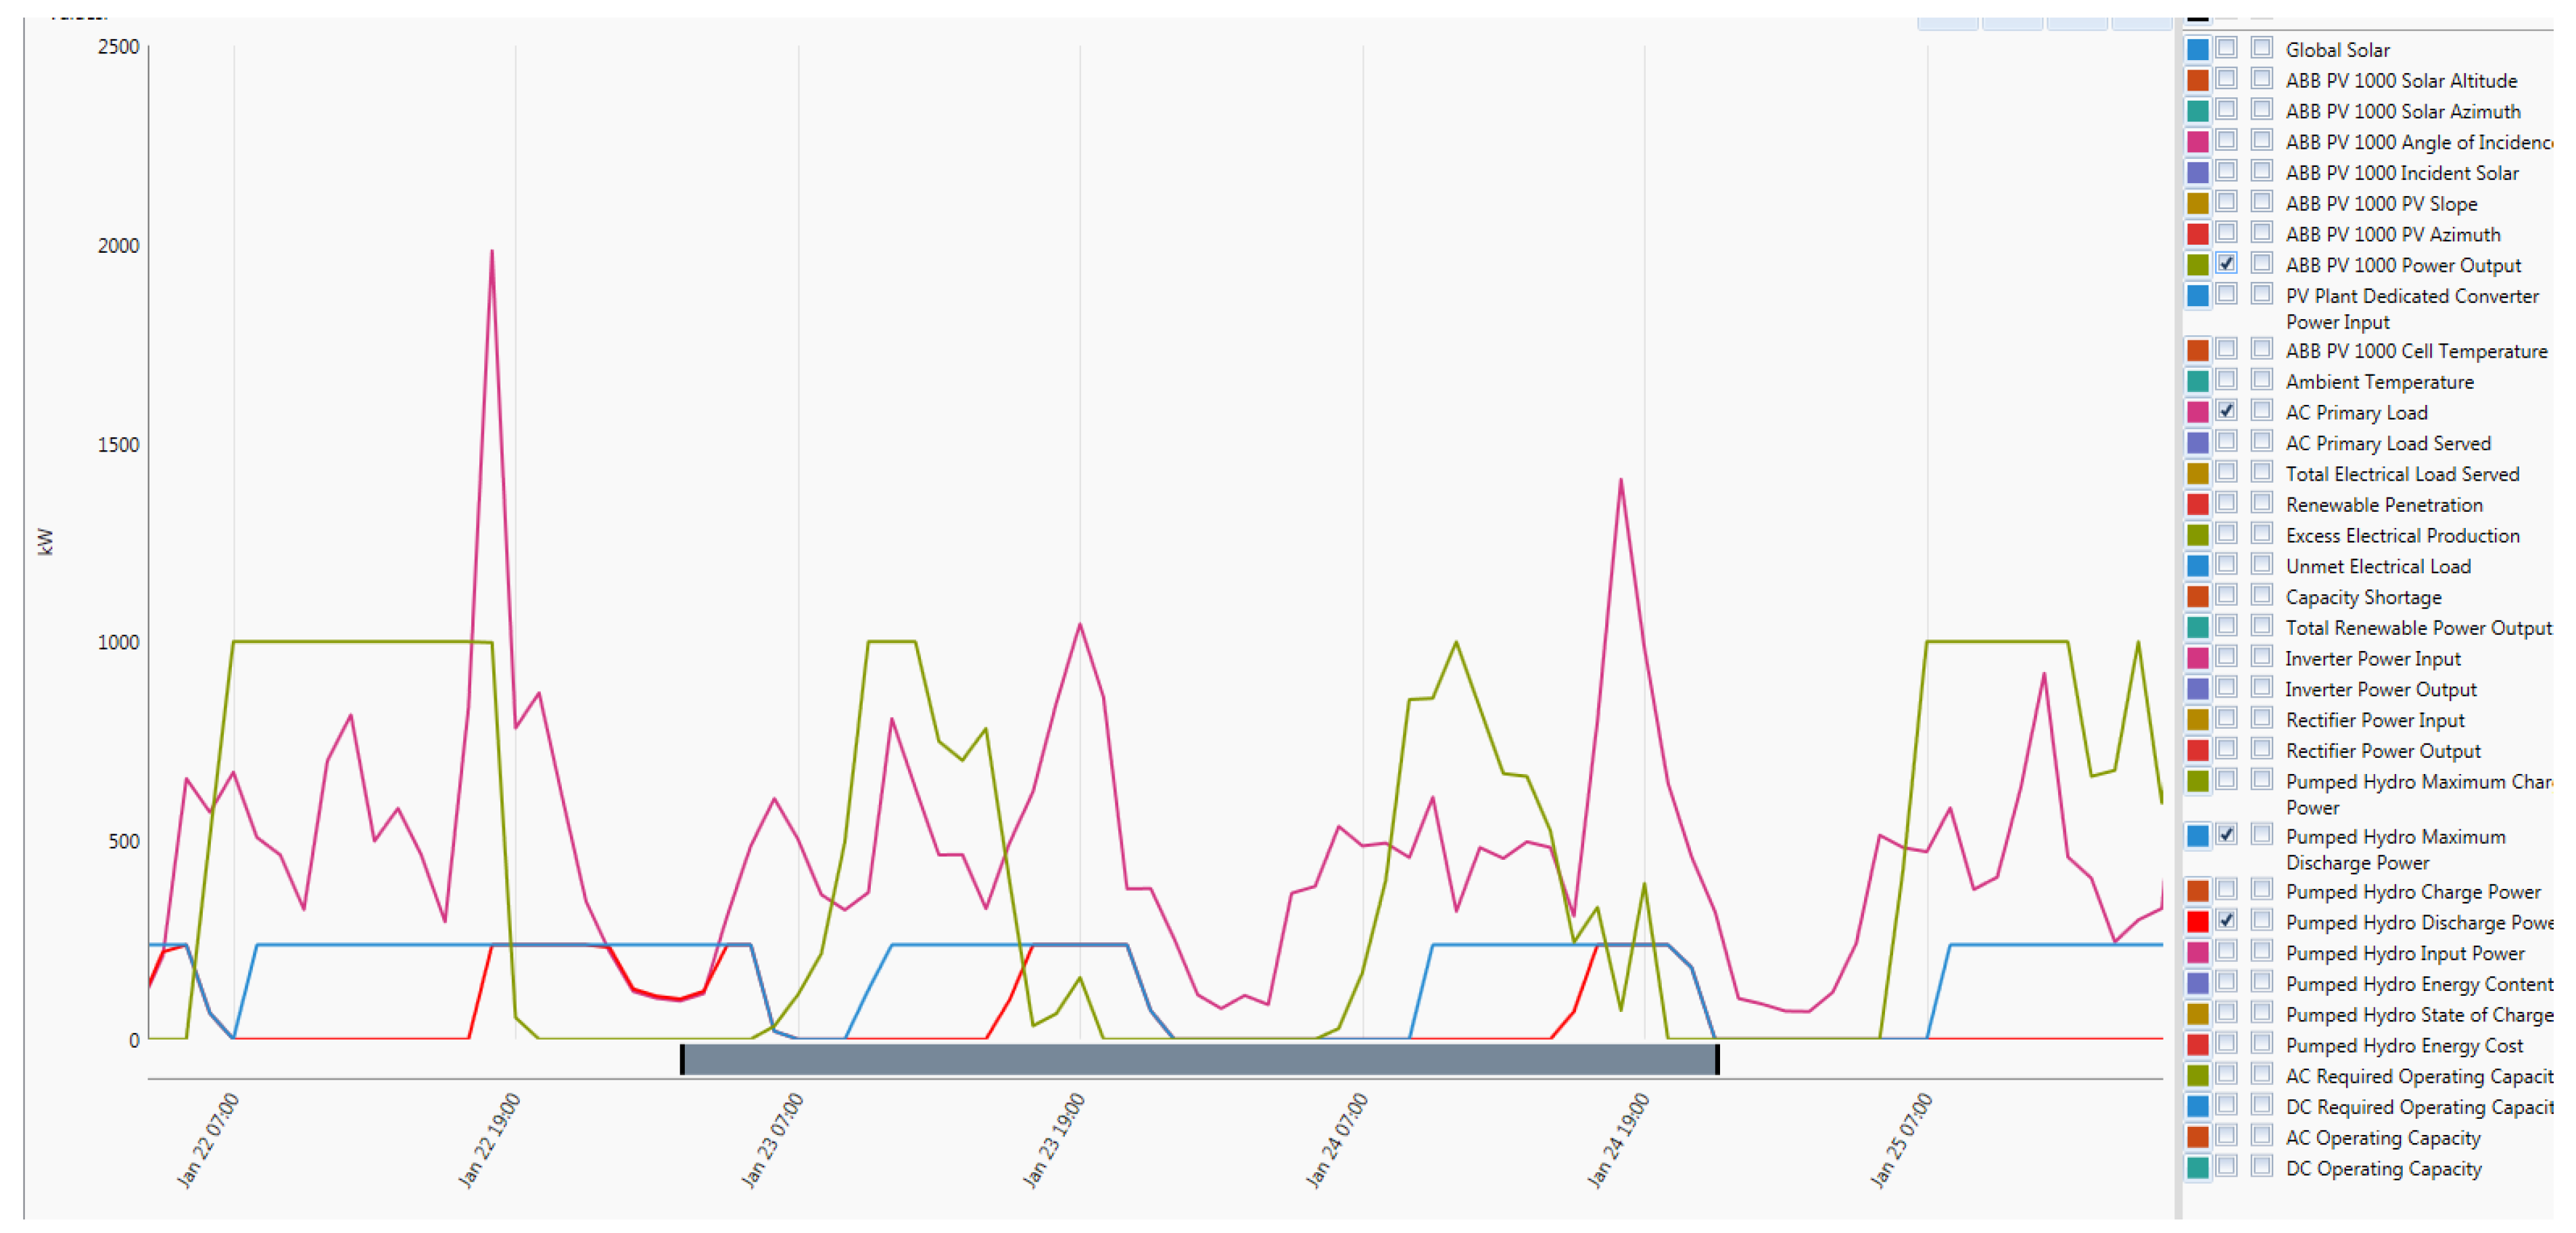
Continuing from Figure 6, now the storage battery bank is introduced in the system and that is shown in Figure 9. PV power output is drawn as the green graph and load is the purple one. In Figure 6; where there is no storage facility on the system, PV output starts increasing from 5 am and peaks at 7 am. From there the output is smooth; it is up and down depending on the irradiation on the day. This output started dropping at 18:00 because it depends solely on the sun. From 19:00 little power can be supplied and there will be no power by 20:00. The simulations and results were based on Cape Town times, which are different from other areas because it has longer sun day by nature.
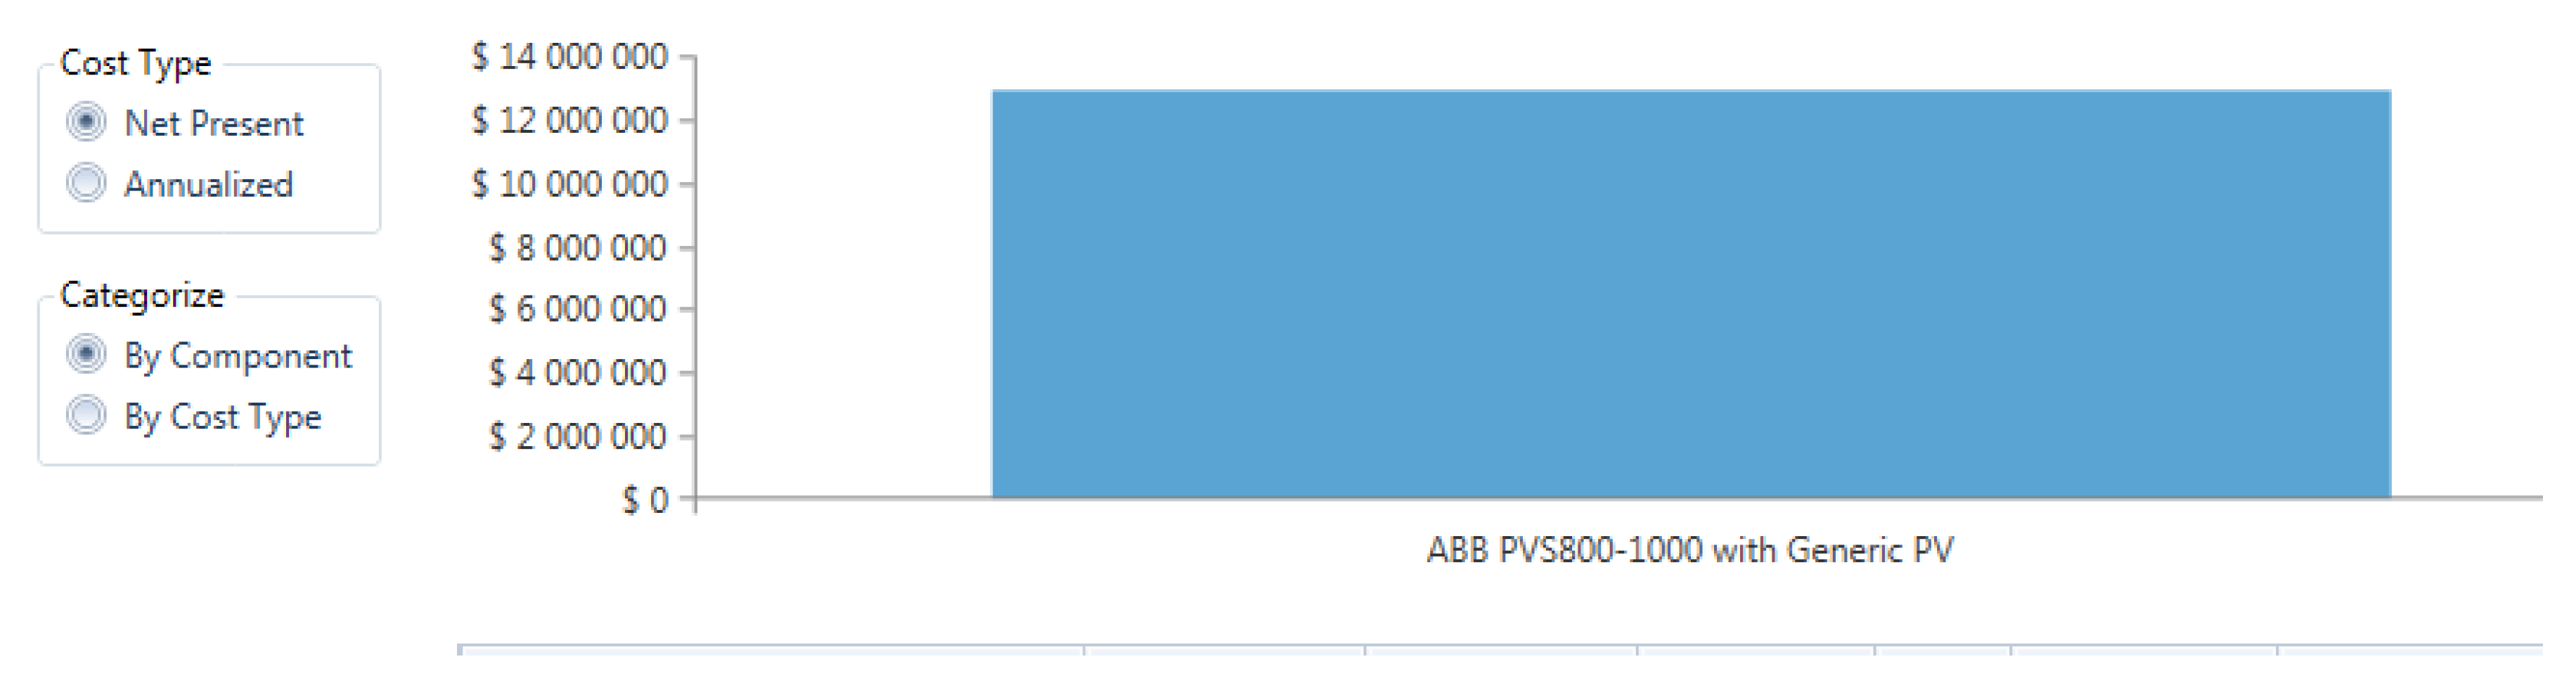
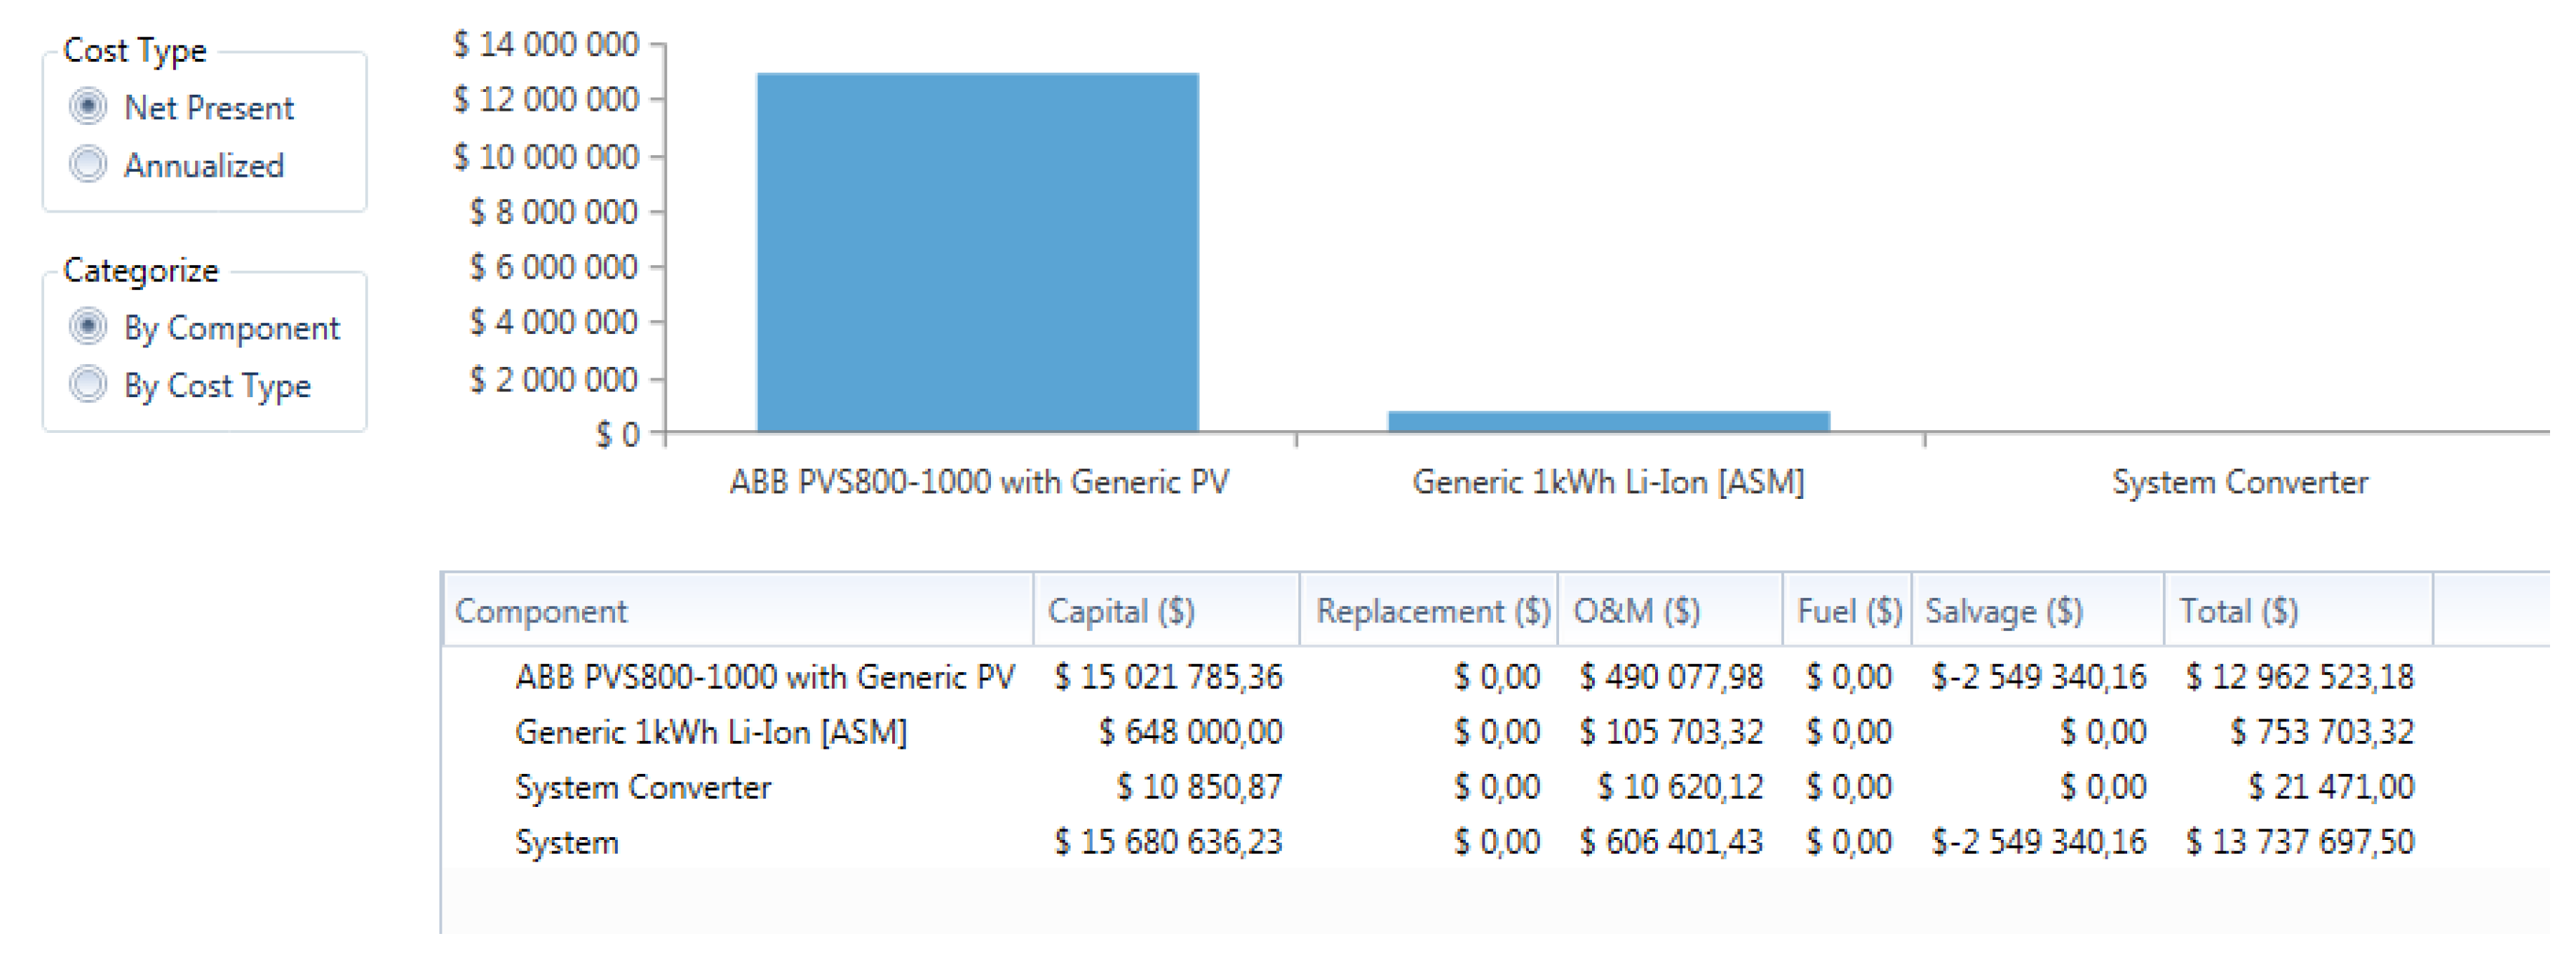
Figure 9 Where the system had a battery storage facility, the PV output behaved the same. The difference came about at 8 am where there was sudden peak loading until 11 am, then storage power could be discharged from batteries to supplement the PV and the same occurred again from 13:00 to 18:00. For example at 18:00, 218 kW could be drawn from batteries when the load was at peak and PV was dropping. Normally, when load drops occur, then PV is used to charge the batteries. Figure 10 shows the 5 MW PV plant net present cost without storage using ABB PSV800-1000 solar panels.
4.1. Photovoltaic (PV)–Battery Plant Off-Grid Cost Analysis
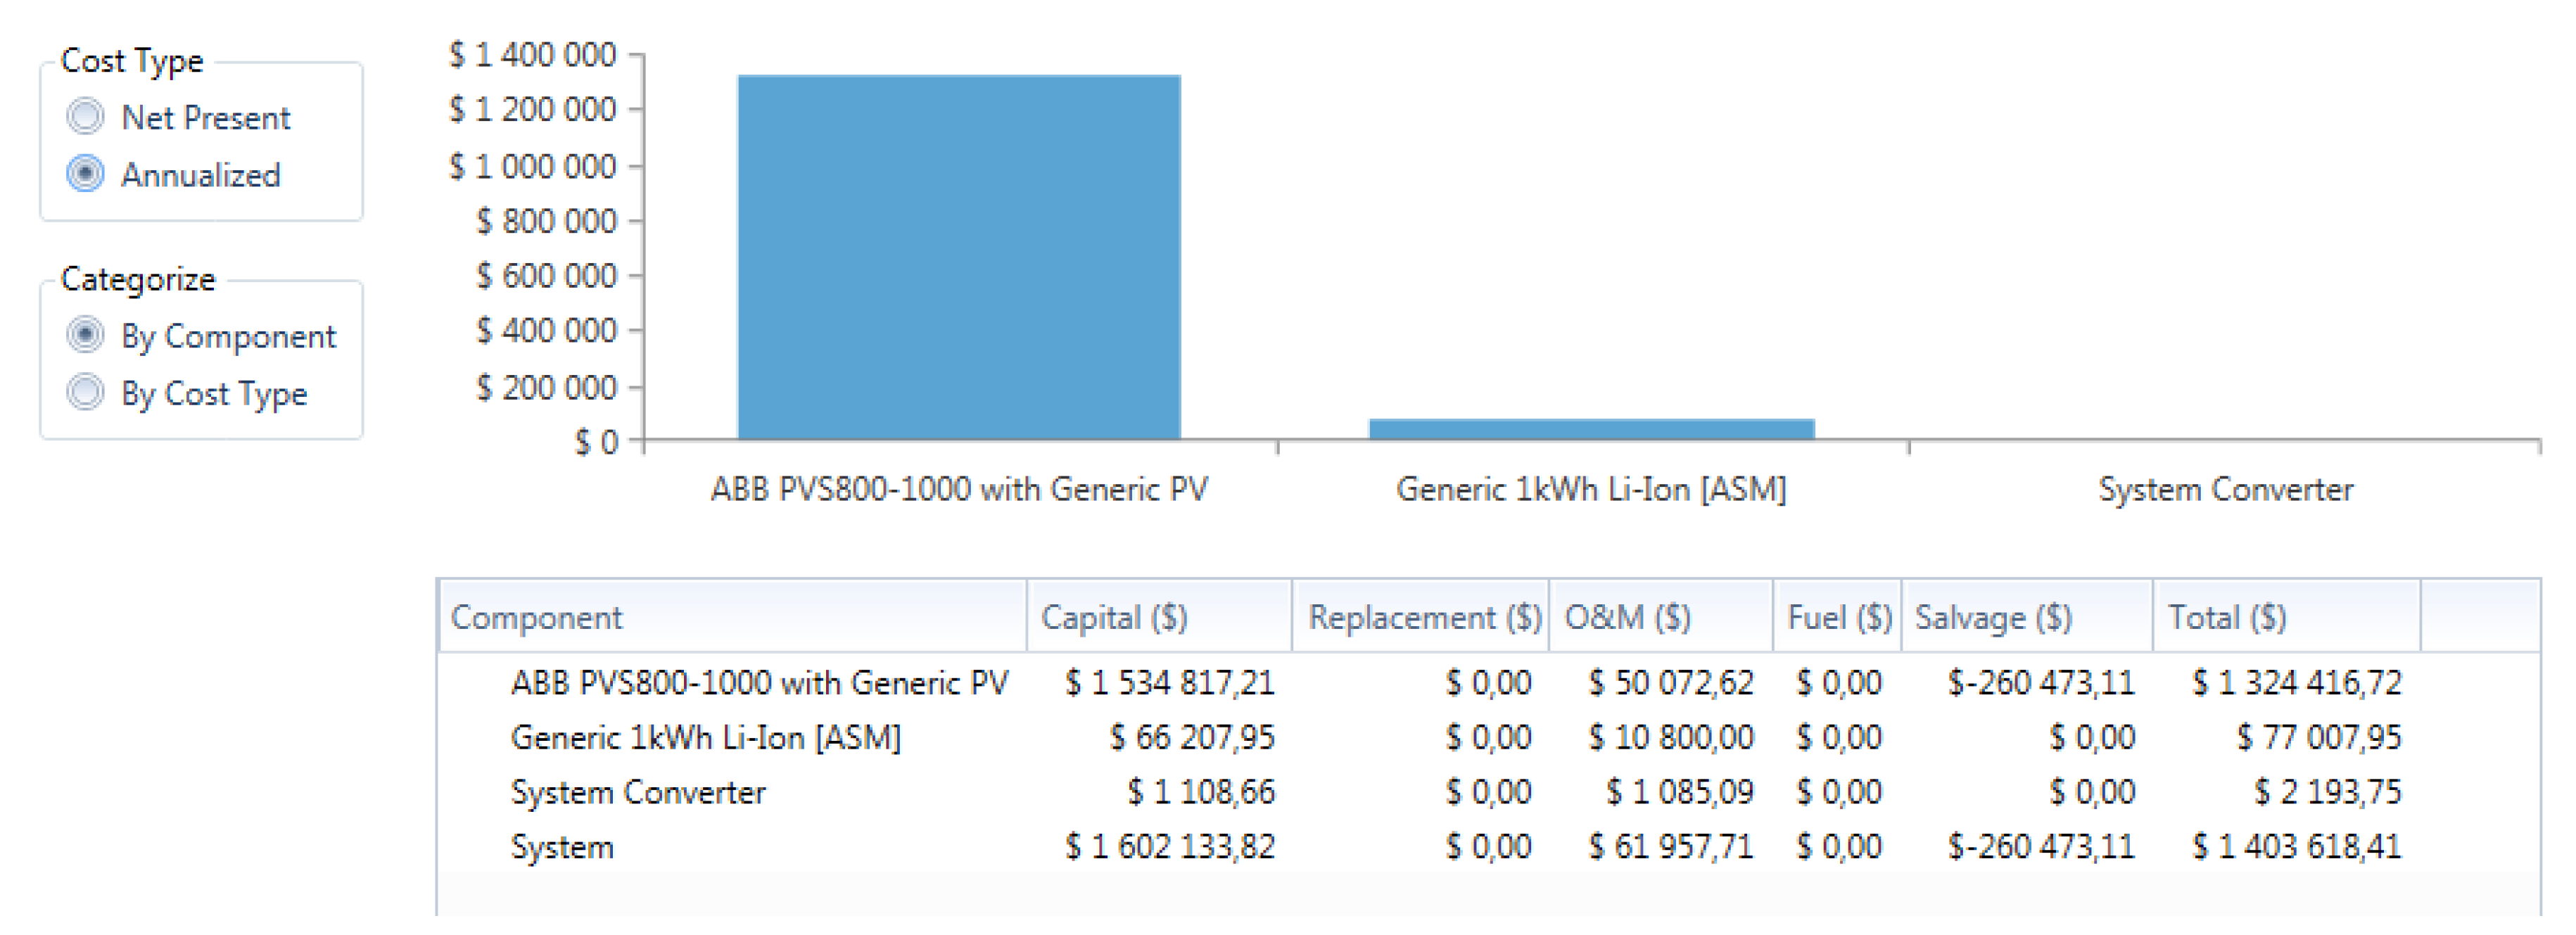
Based on the results on Figure 10, Figure 11 and Figure 12, having a PV-Battery power plant in the Western Cape would cost approximately Net USD 15 Million with annual cost of USD 1.4 Million for a project with a life cycle of 25 years. This system is technically excellent but it may require a huge amount of capital to build. This system is 100% renewable with 20% battery storage capacity, 56% unmet load and up to 90% capacity shortage settings. However, the return on investment is very low −1.7%. This then may be too expensive to construct. However, it can be used as a base for smaller systems/plants. Since the system is off-grid, the number of batteries was increased which increases the system cost. Accordingly, it was demonstrated that there would be no investment in building such a system since it will not bring fruitful returns.
4.2. Case Study 2: 5 MW Load, PV Plant and 20% Pump Storage Plant
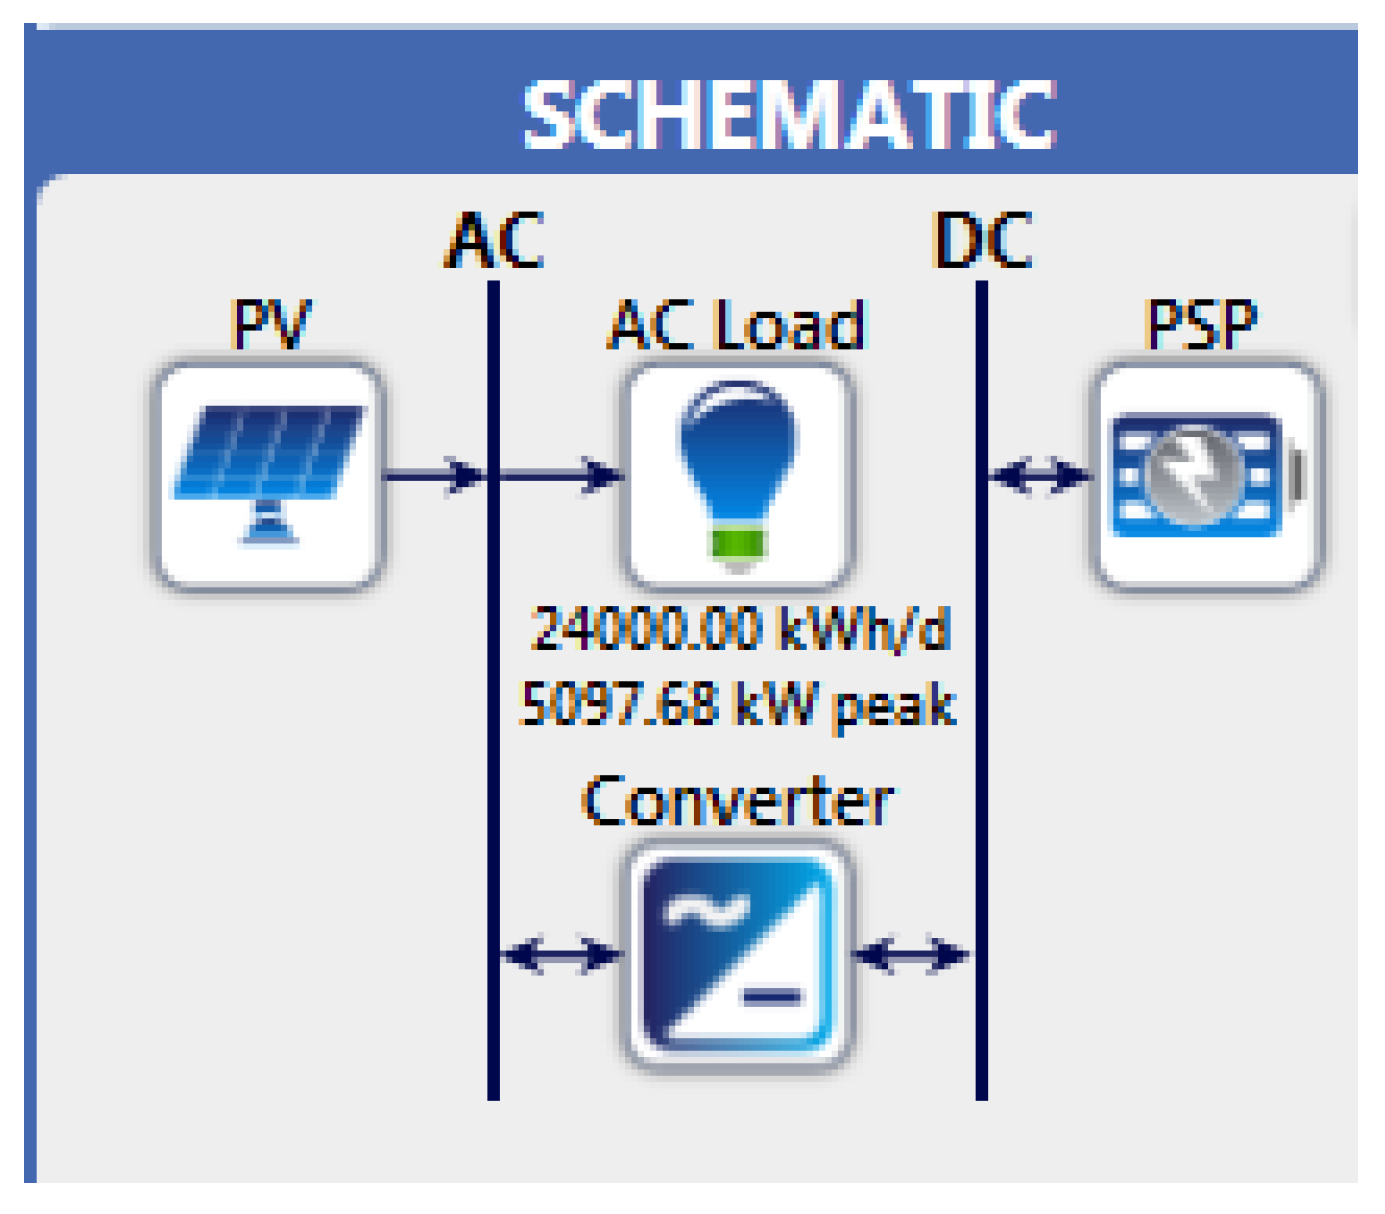
The PV plant and the load used in the previous section were decreased to match the 5 MW load. Storage batteries are very flexible in terms of where they can be used (different locations). Any location may be suitable, unlike the location for pumped storage where it is restricted to areas where there is a huge amount of water and high altitudes. For this study, we assumed that the optimum location for Pump storage was Palmiet, in the Western Cape since there is already similar storage existing in the area. A schematic diagram of PV plant with PPS as base storage is shown on Figure 13 below.
- is the Dam Capacity (upper and lower) to be calculated
- is the time required to discharge and restore water to upper dam = 12 h, since this water had to be available for electrical production the next day
- is the effective head = 150 m
- is the generator efficiency = 90%
- g is the gravitational force = 9.81 m/s2
- is the discharge rate/flow = 0.03 cubic metres per s.
Since the load was already known, some of the above was assumed in order to calculate the amount of water or dam capacity to meet the load demand:
- is the peak load = 5 MWh
- PPS rating to be 20% of the load = 1 MWh.
It is assumed one generator output generation over 12 h will be 245 kW; this will be used only as a baseline. Bigger generators are normally used in real life situations. HOMER has its pumped storage per generator stored at 24 kWh, this helped on the calculations below in order to use the program effectively;
Therefore = 4 generators, was practical. It was possible to use one generator of 250 kW or higher ratings to reduce the number to a maximum of 4 units.
Discharging;
To discharge 1 MW in 12 h is required:
= = 2097 m3 of water required.
Charging;
Since the same turbine could be used as a pump, the effective head, efficiency and power remained unchanged. Therefore, the flow rate was calculated as follows:
= = 0.06 m3 per s.
.
83.33 kW × 9.7 h = 0.81 MWh.
Round trip efficiency of the PPS = ratio of discharging electrical energy output to the charging electrical input = 1/0.81 = 1.23
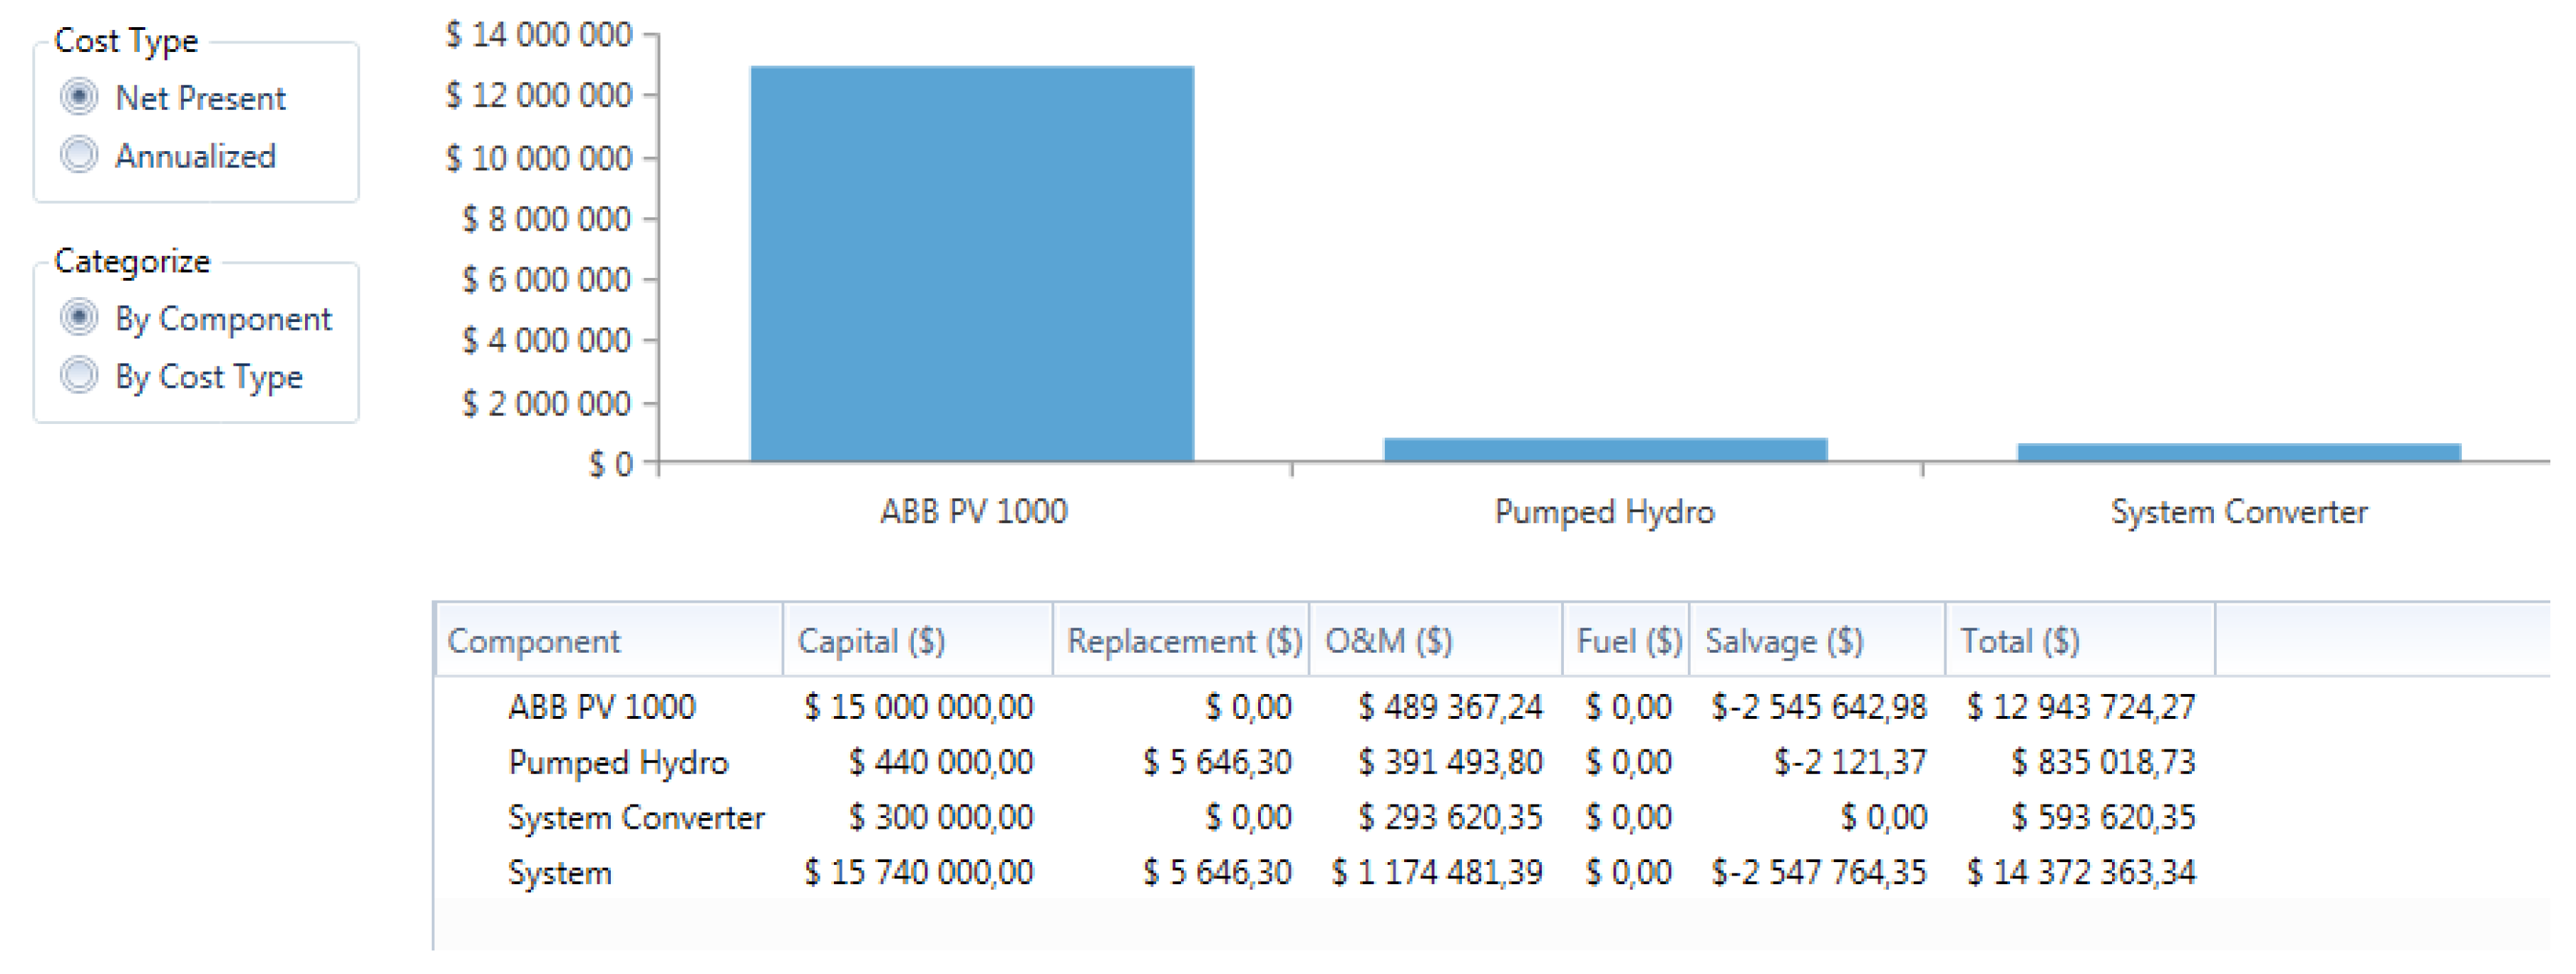
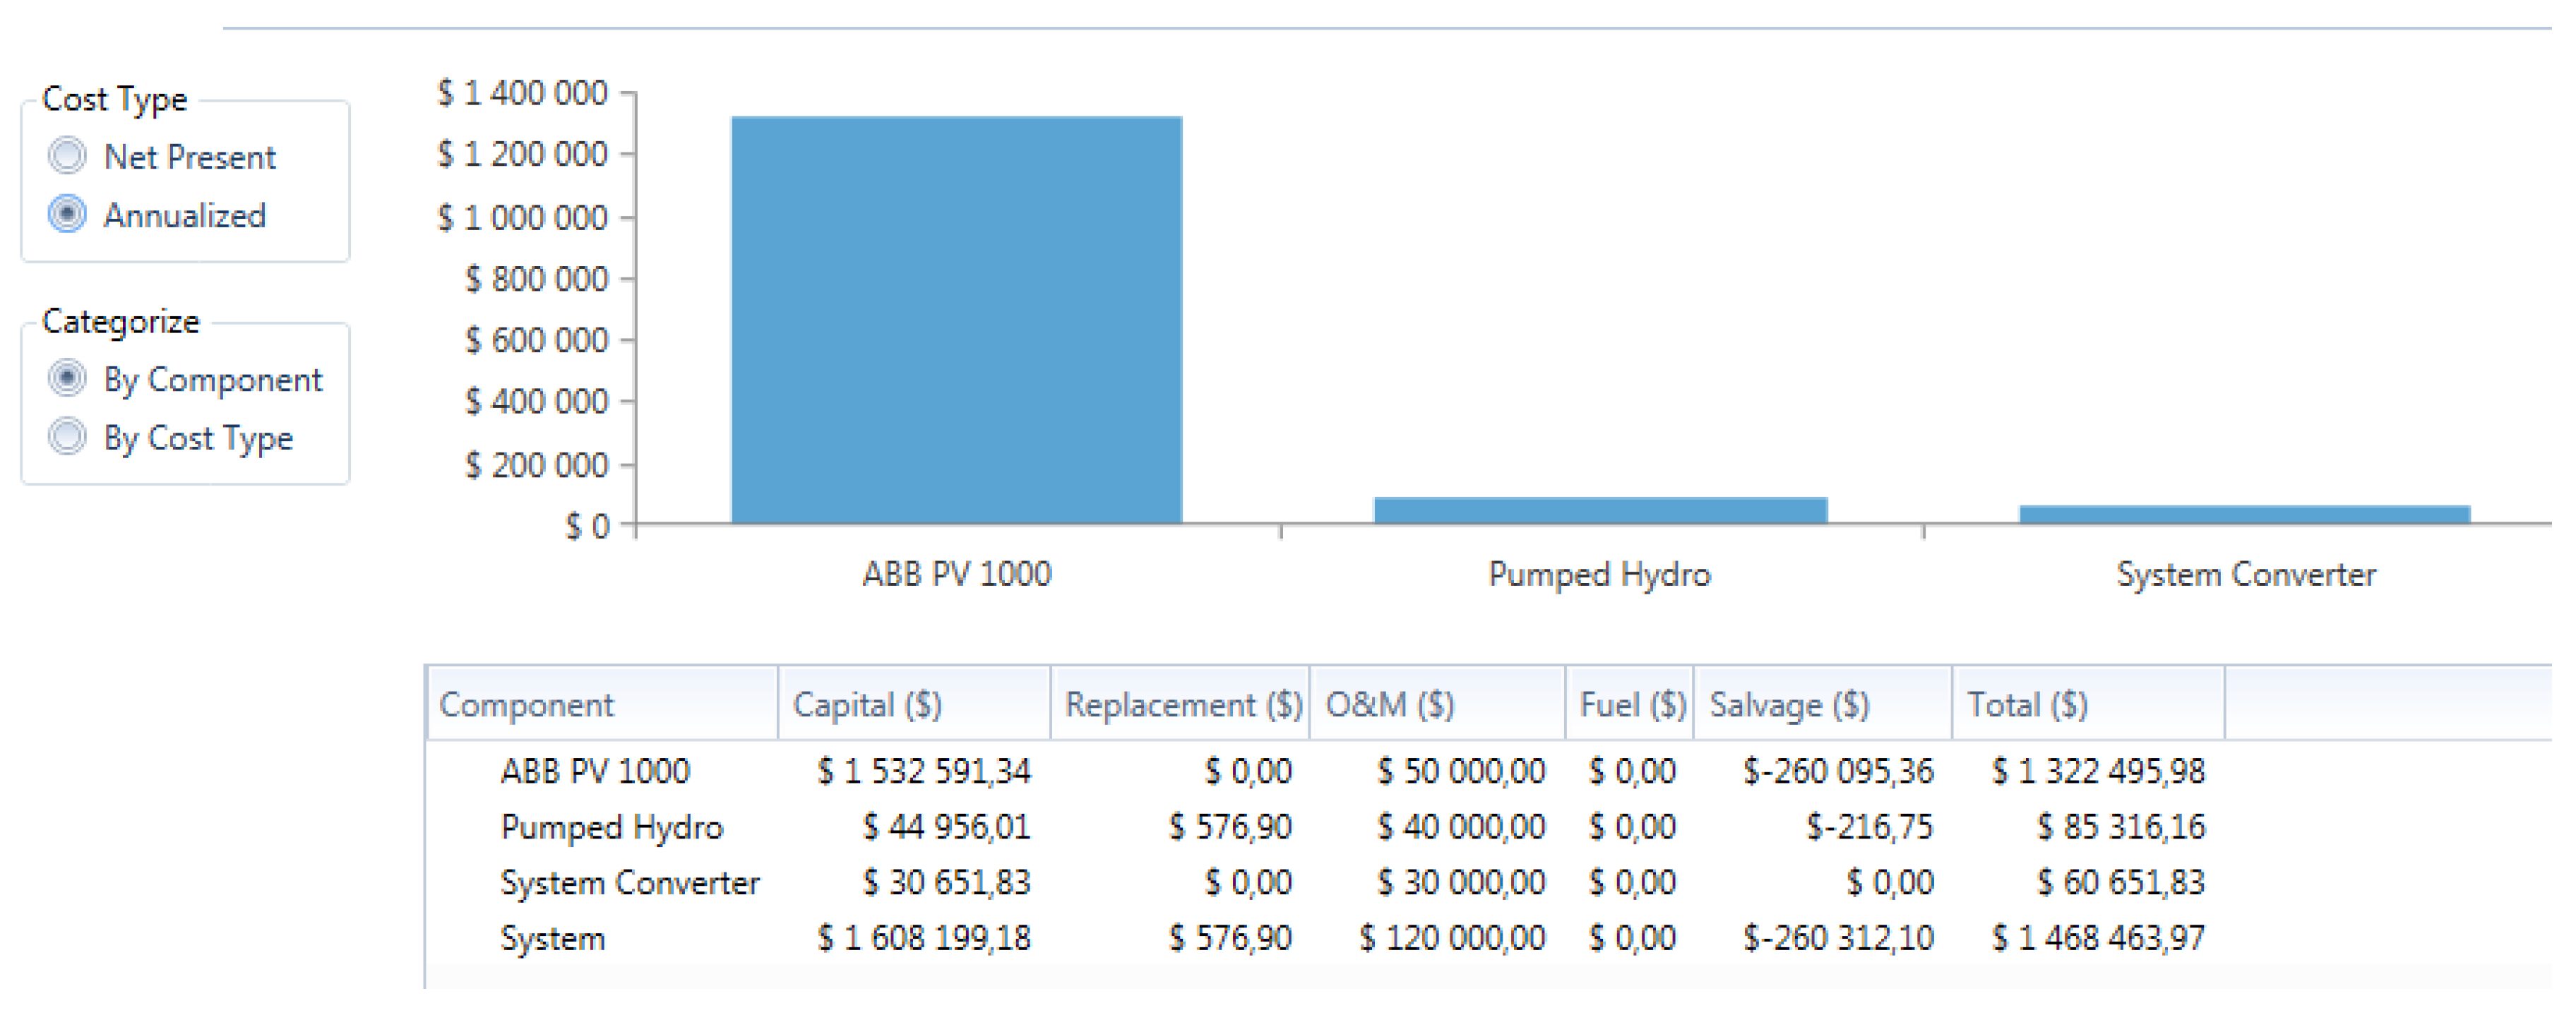
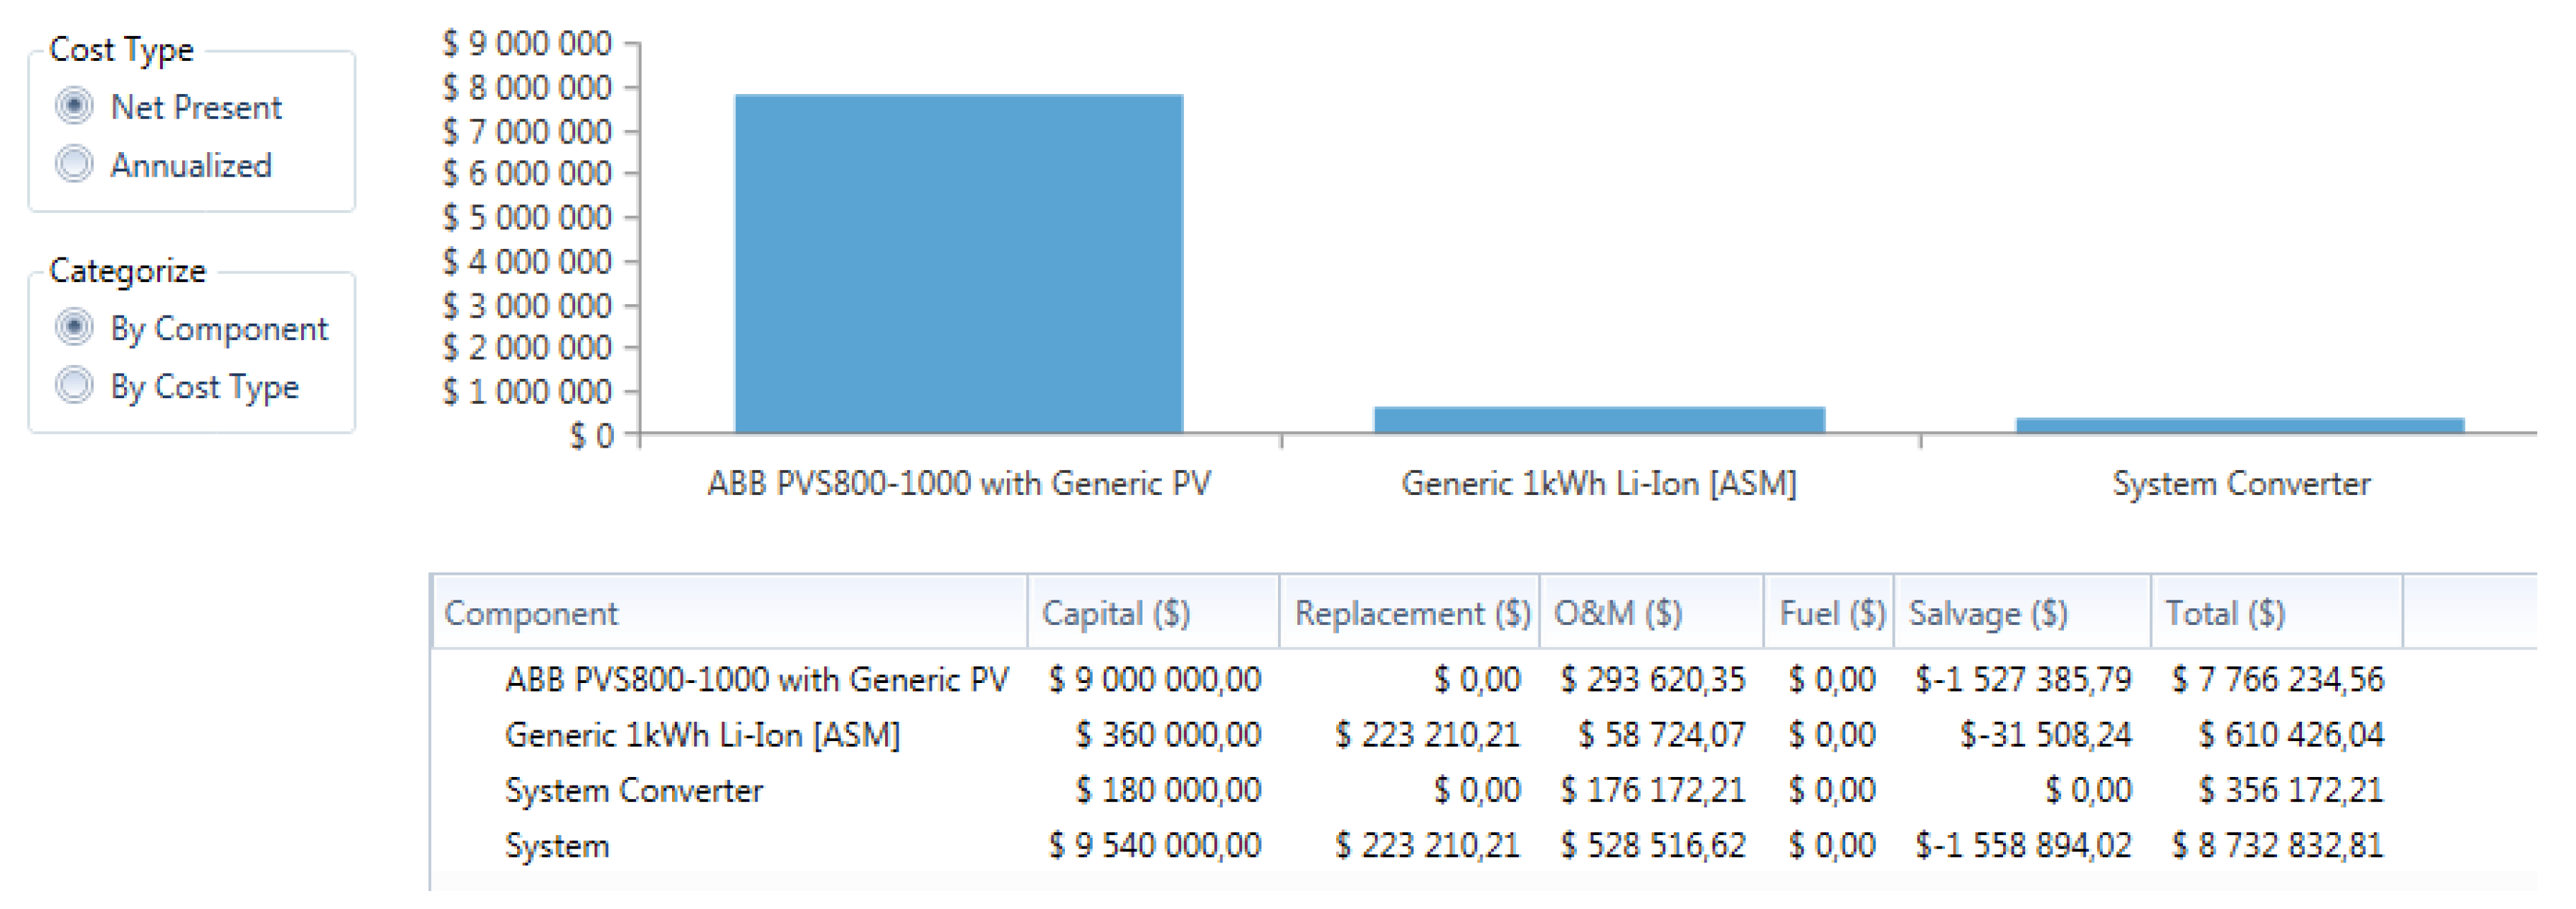
Using pumped storage to supplement the load and rectify the PV seems to be working; the cost associated with the system of only 20% storage capacity was just USD 14 million as illustrated in Figure 14 and Figure 15. Storage costs were quite high on PPS compared to the batteries. Battery storage cost is USD 13 million while PPS is USD 14 million. Based on cost alone, for a 5 MW plant with 20% storage, batteries were considered the better option. The same was true for annualised costs, thus PPS is quite expensive storage.
Reading from Table 2 below, it can be seen that the difference between the two components is not big if analysed by individual components in the system. Meaning that on bigger plants the individual component does not play a big role but the entire system required to accommodate that individual component. Comparing Table 1 and Table 2, it can be concluded that when building the system consider all components required to build it. If calculating only the cost of the component, then incorrect information will be used.
Figure 16 and Figure 17 depict the operation of the plant/system: PV + PPS = load. Technically, the system was configured to work in the following manner:
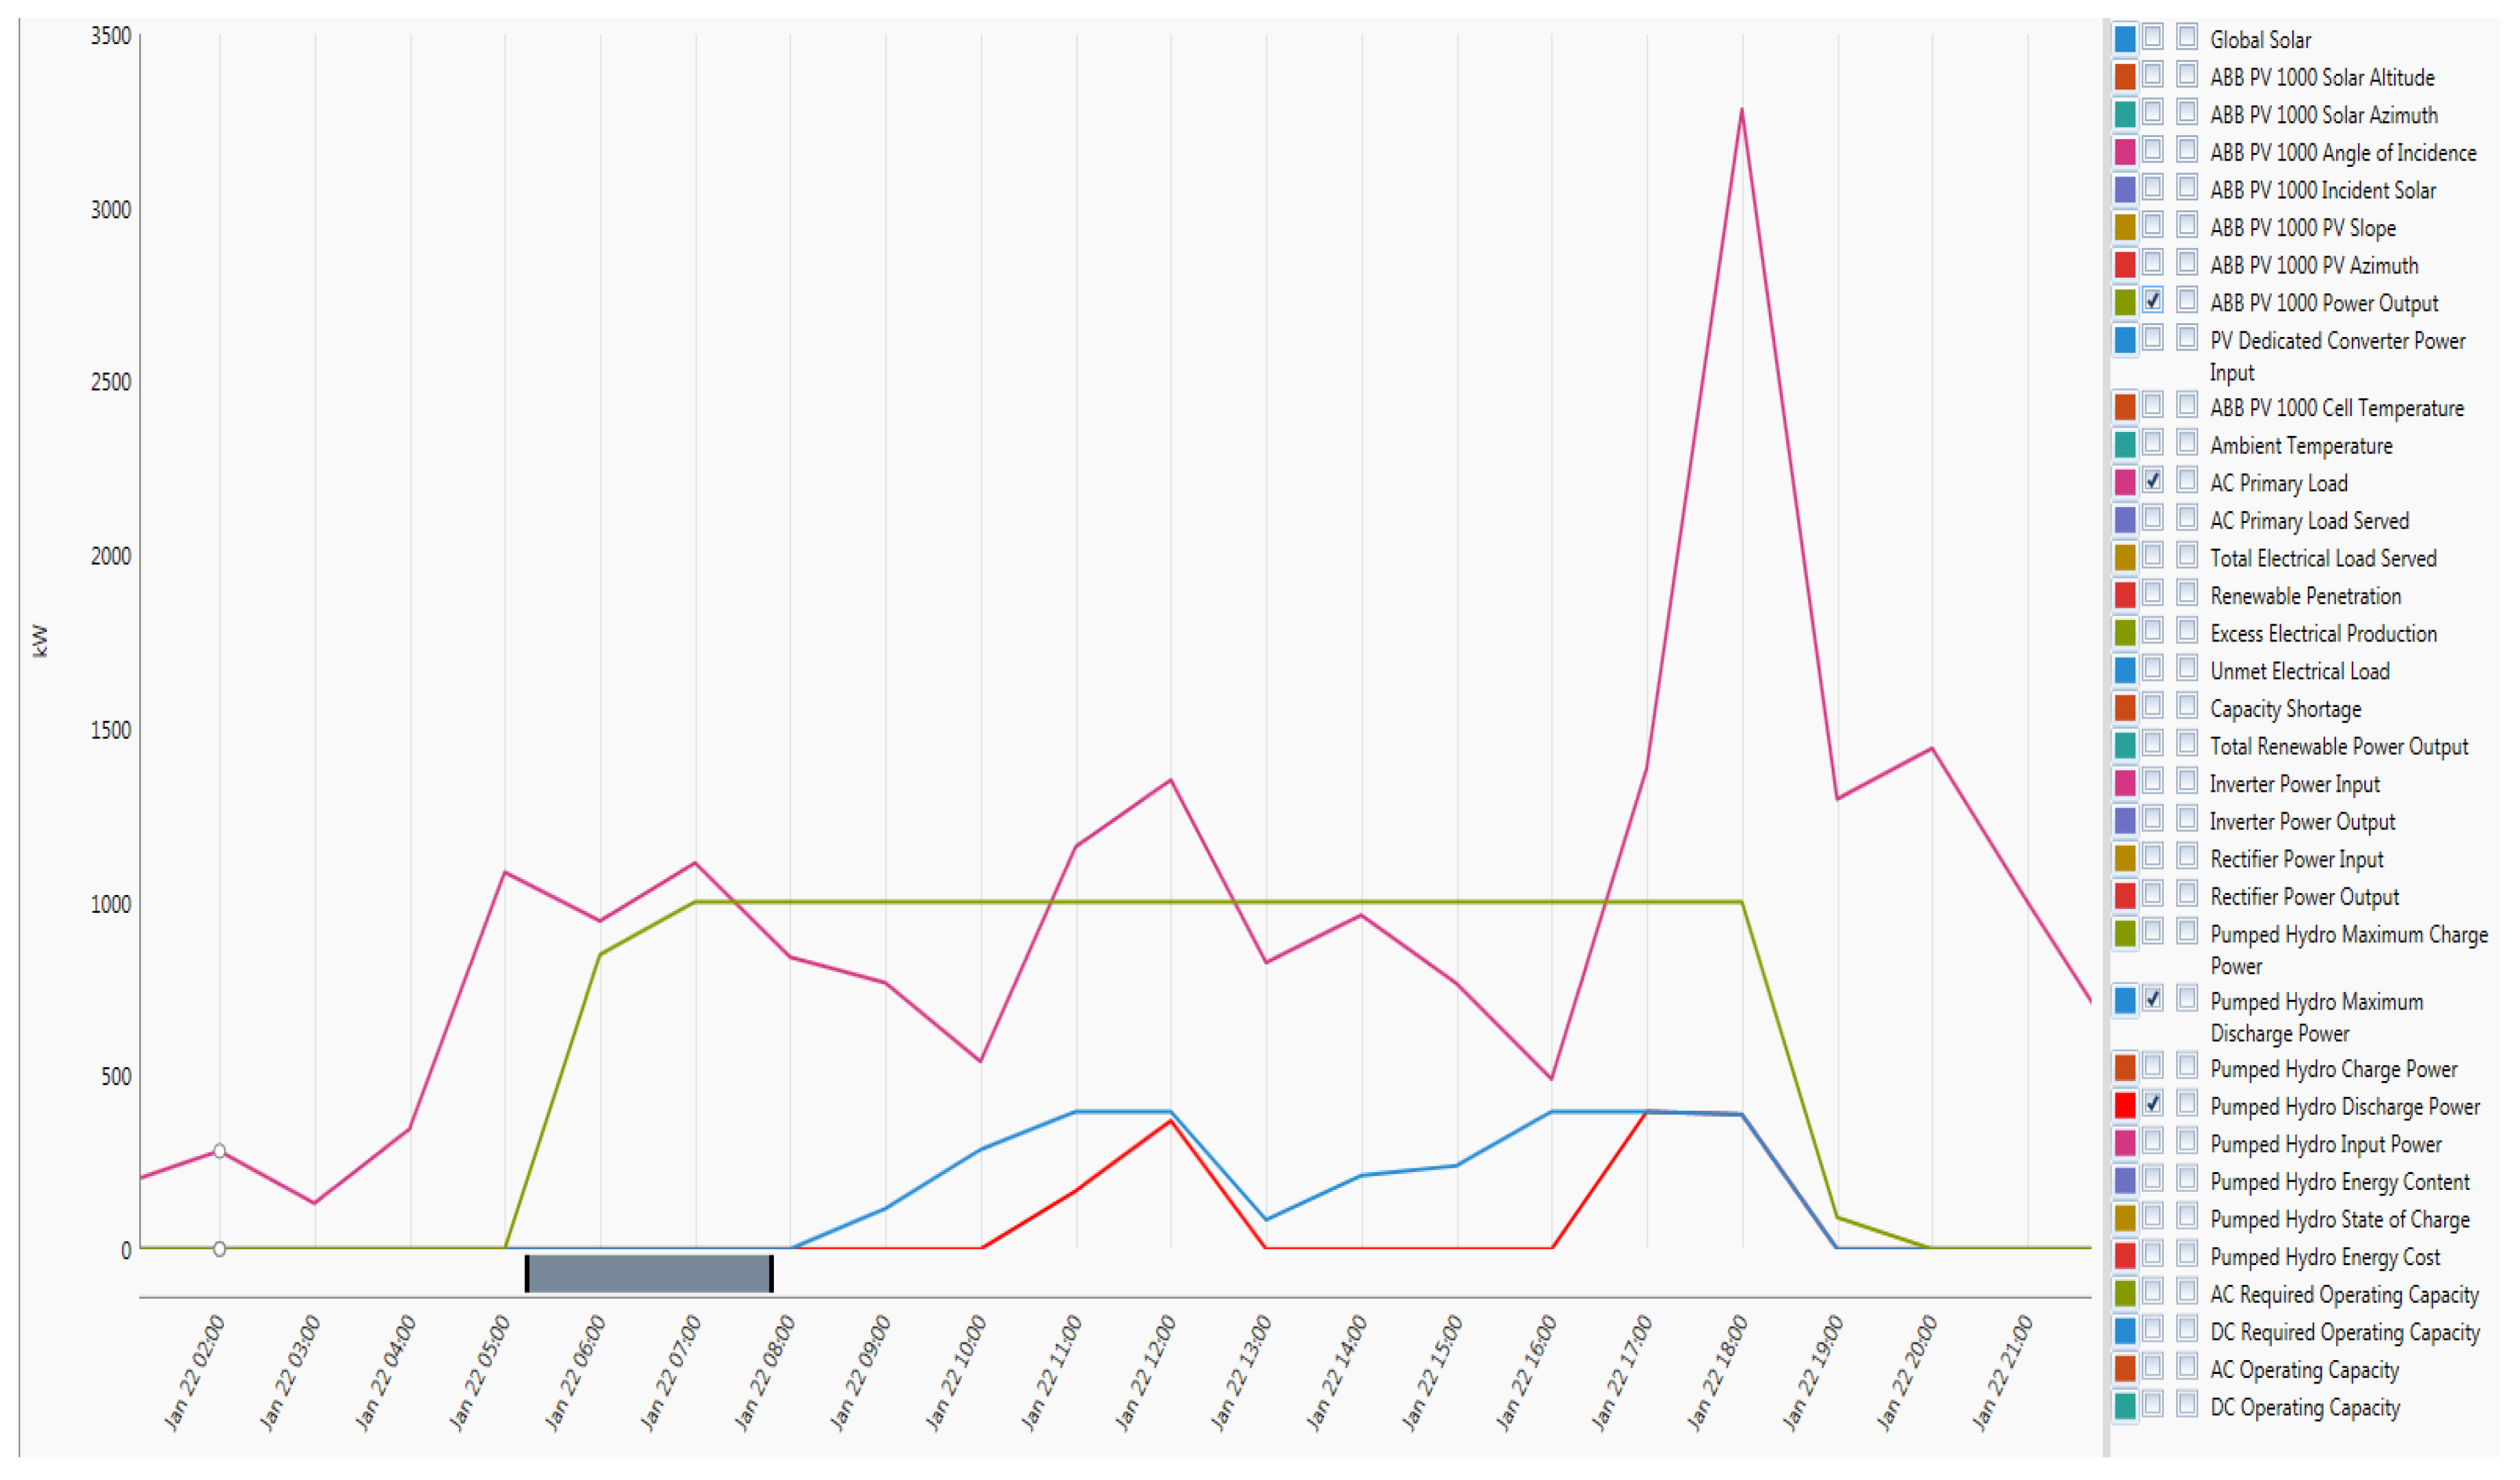
PV is the primary source of power. From 6 am, the PV supplies the load with assistance/backup from the PPS, while at the same time, the PV is pumping water back to the upper reservoir. At 9 am the PV is at maximum output and the hydro is no longer supplying the load until the moment where there is surge on the load and the PV cannot cope with it. During the day from 12 pm, when the PV is stable, the excess electricity is used to pump water back to the upper reservoir. At that time no water is discharged until there is a sudden load surge on the system again. In the afternoon during peak time, the PV cannot cope with the usual peak load increase and, simultaneously, the solar energy decreases towards sunset. At this time the PPS takes over and supplies the load overnight while the PV is off. This continues until the following morning at 7 am when the PV picks up again.
4.3. Case Study 3: 3 MW Load, PV Plant and 20% Storage Battery Capacity
The peak load was 3 MWh, while just 20% of the load, which is only 600 kWh, had to be stored on Li-Ion batteries. A total of 600 batteries would be required to make 600 kWh storage. The characteristics of the battery are still the same as Figure 5. The schematic diagram of PV plant and Li-ion battery bank is shown on Figure 18 below.
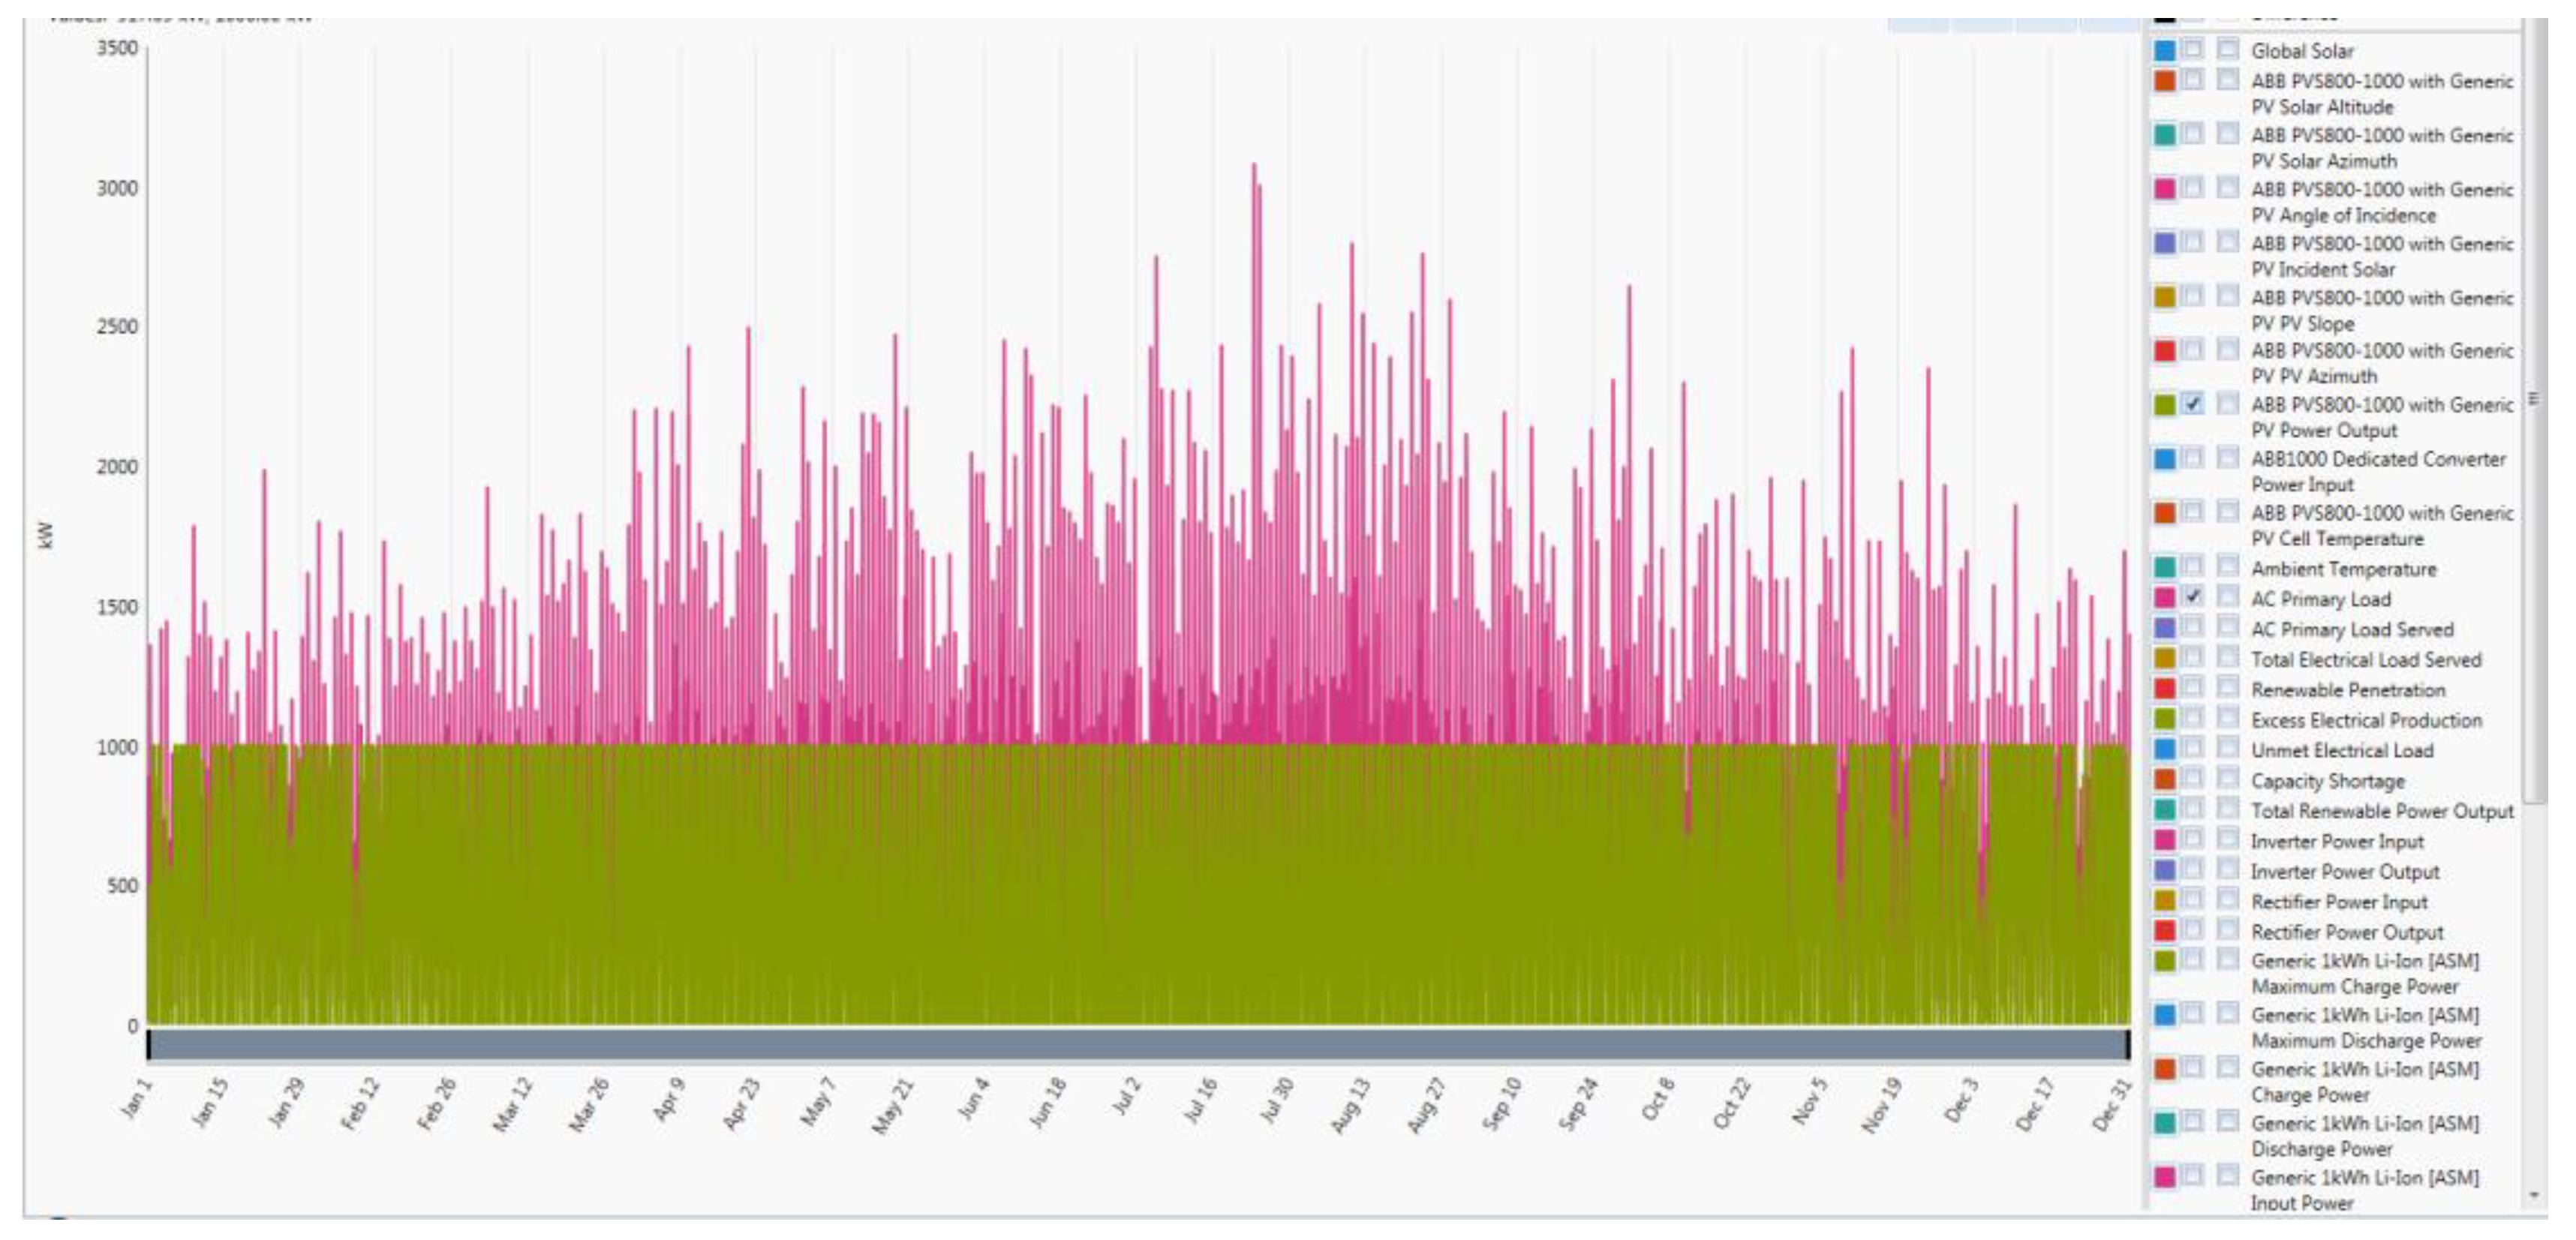
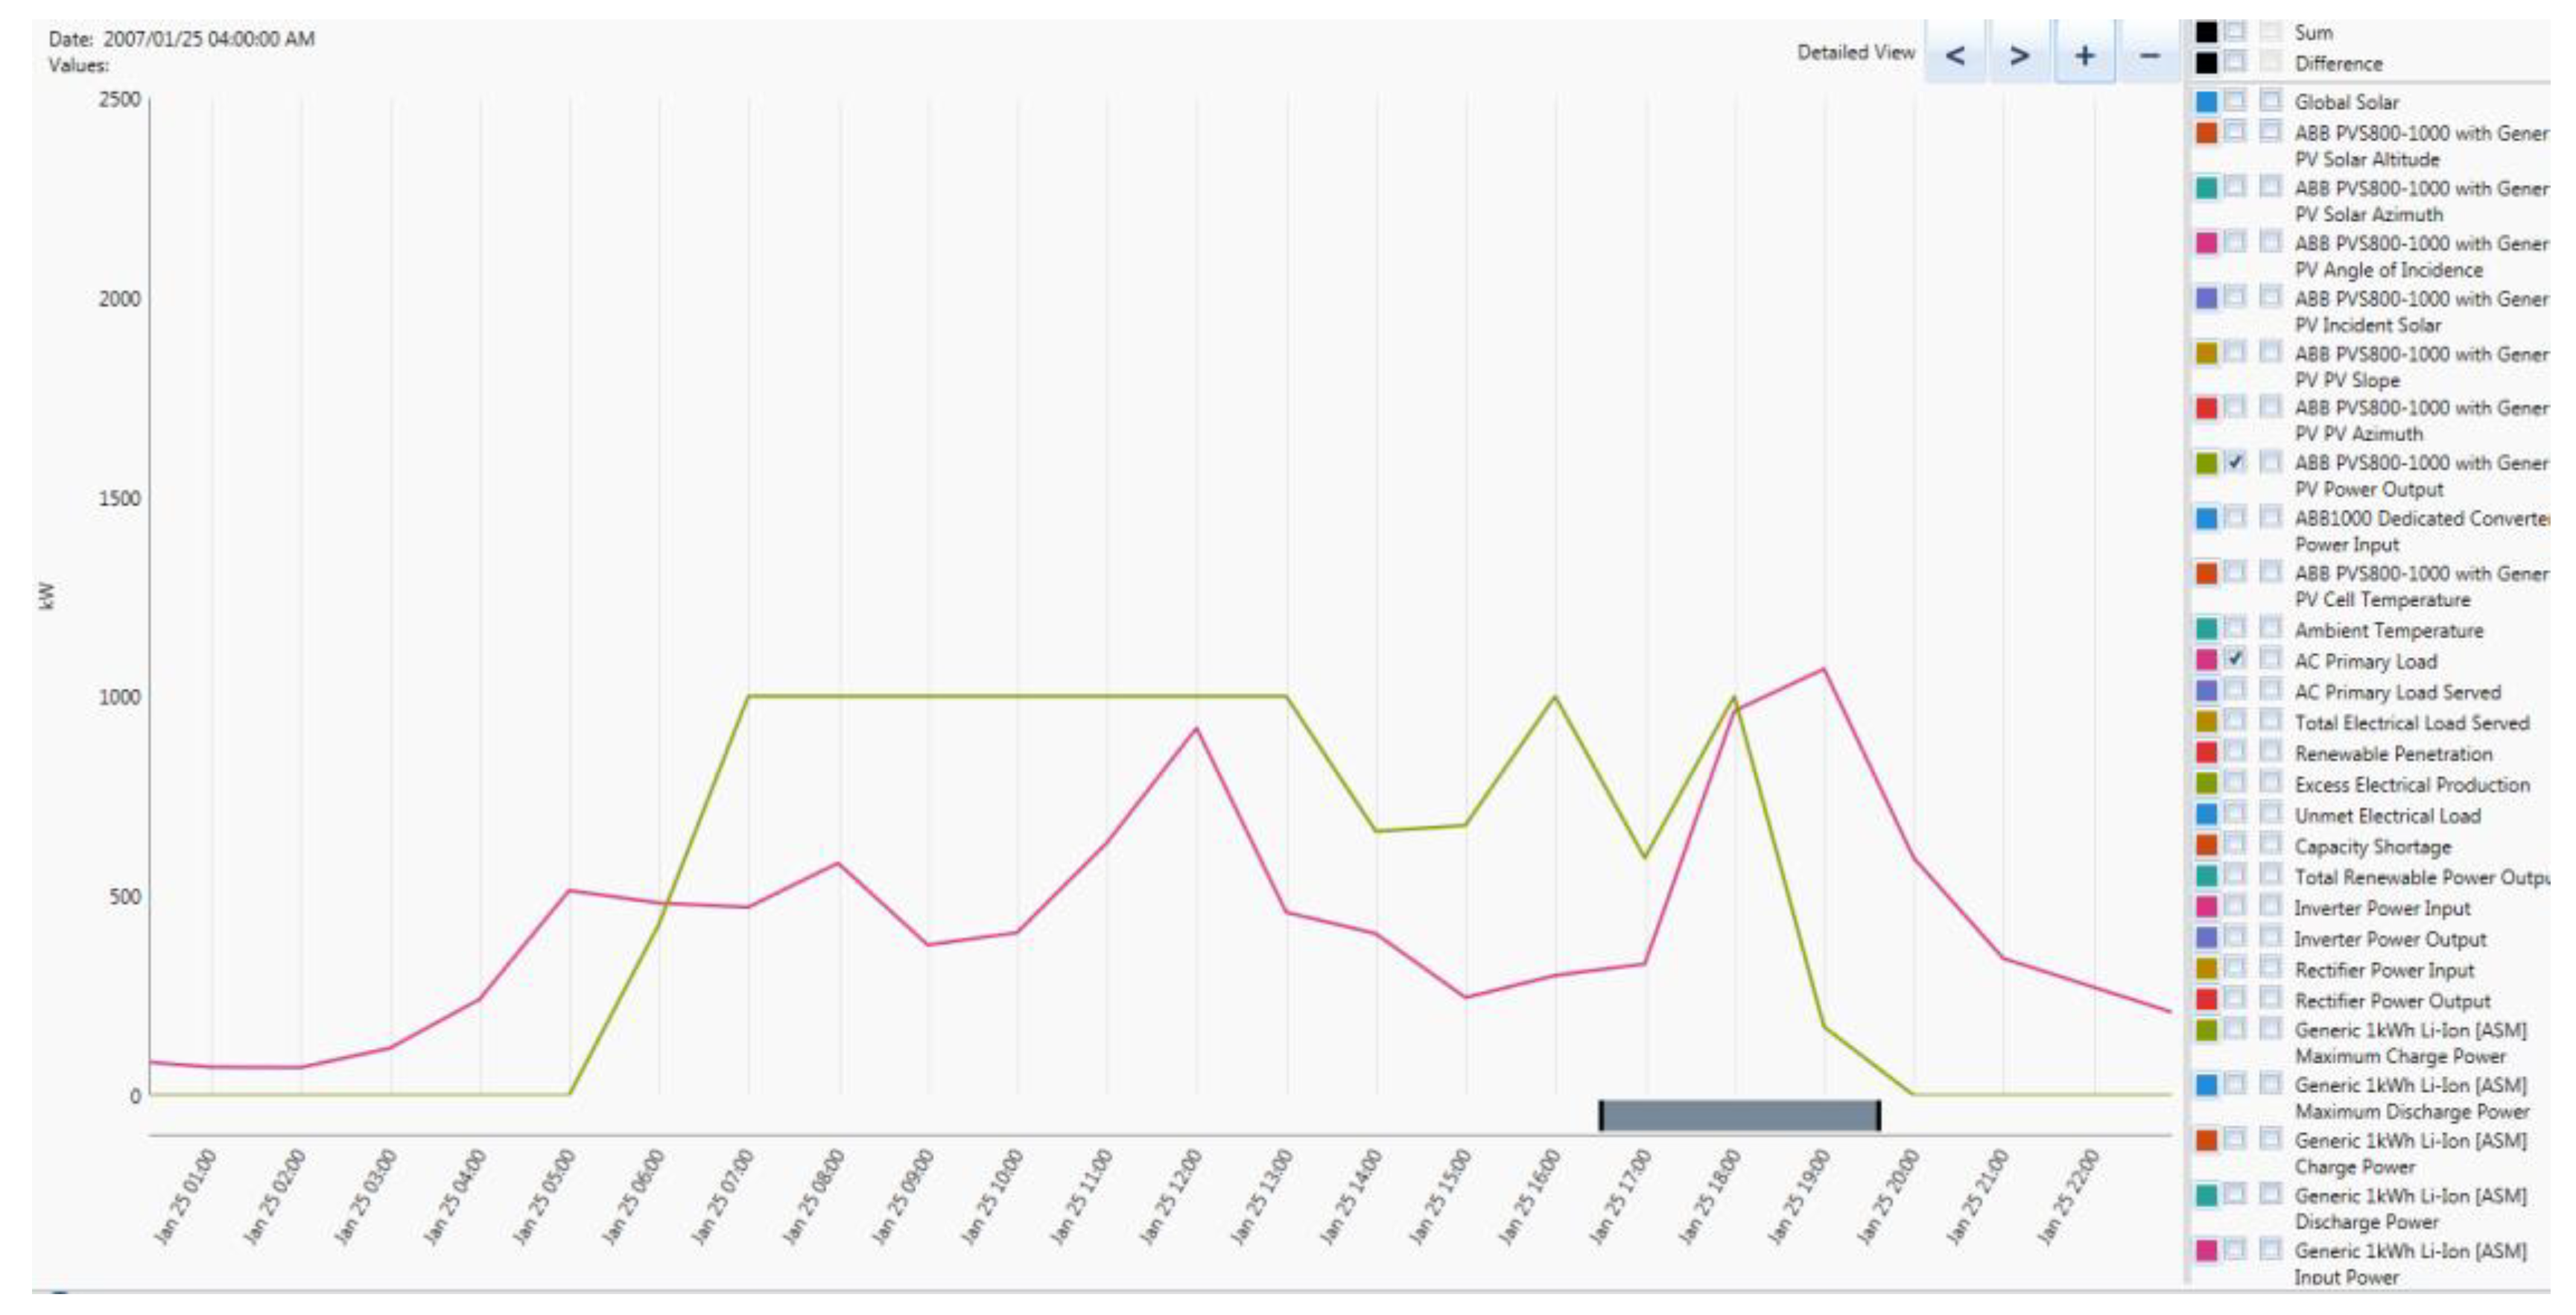
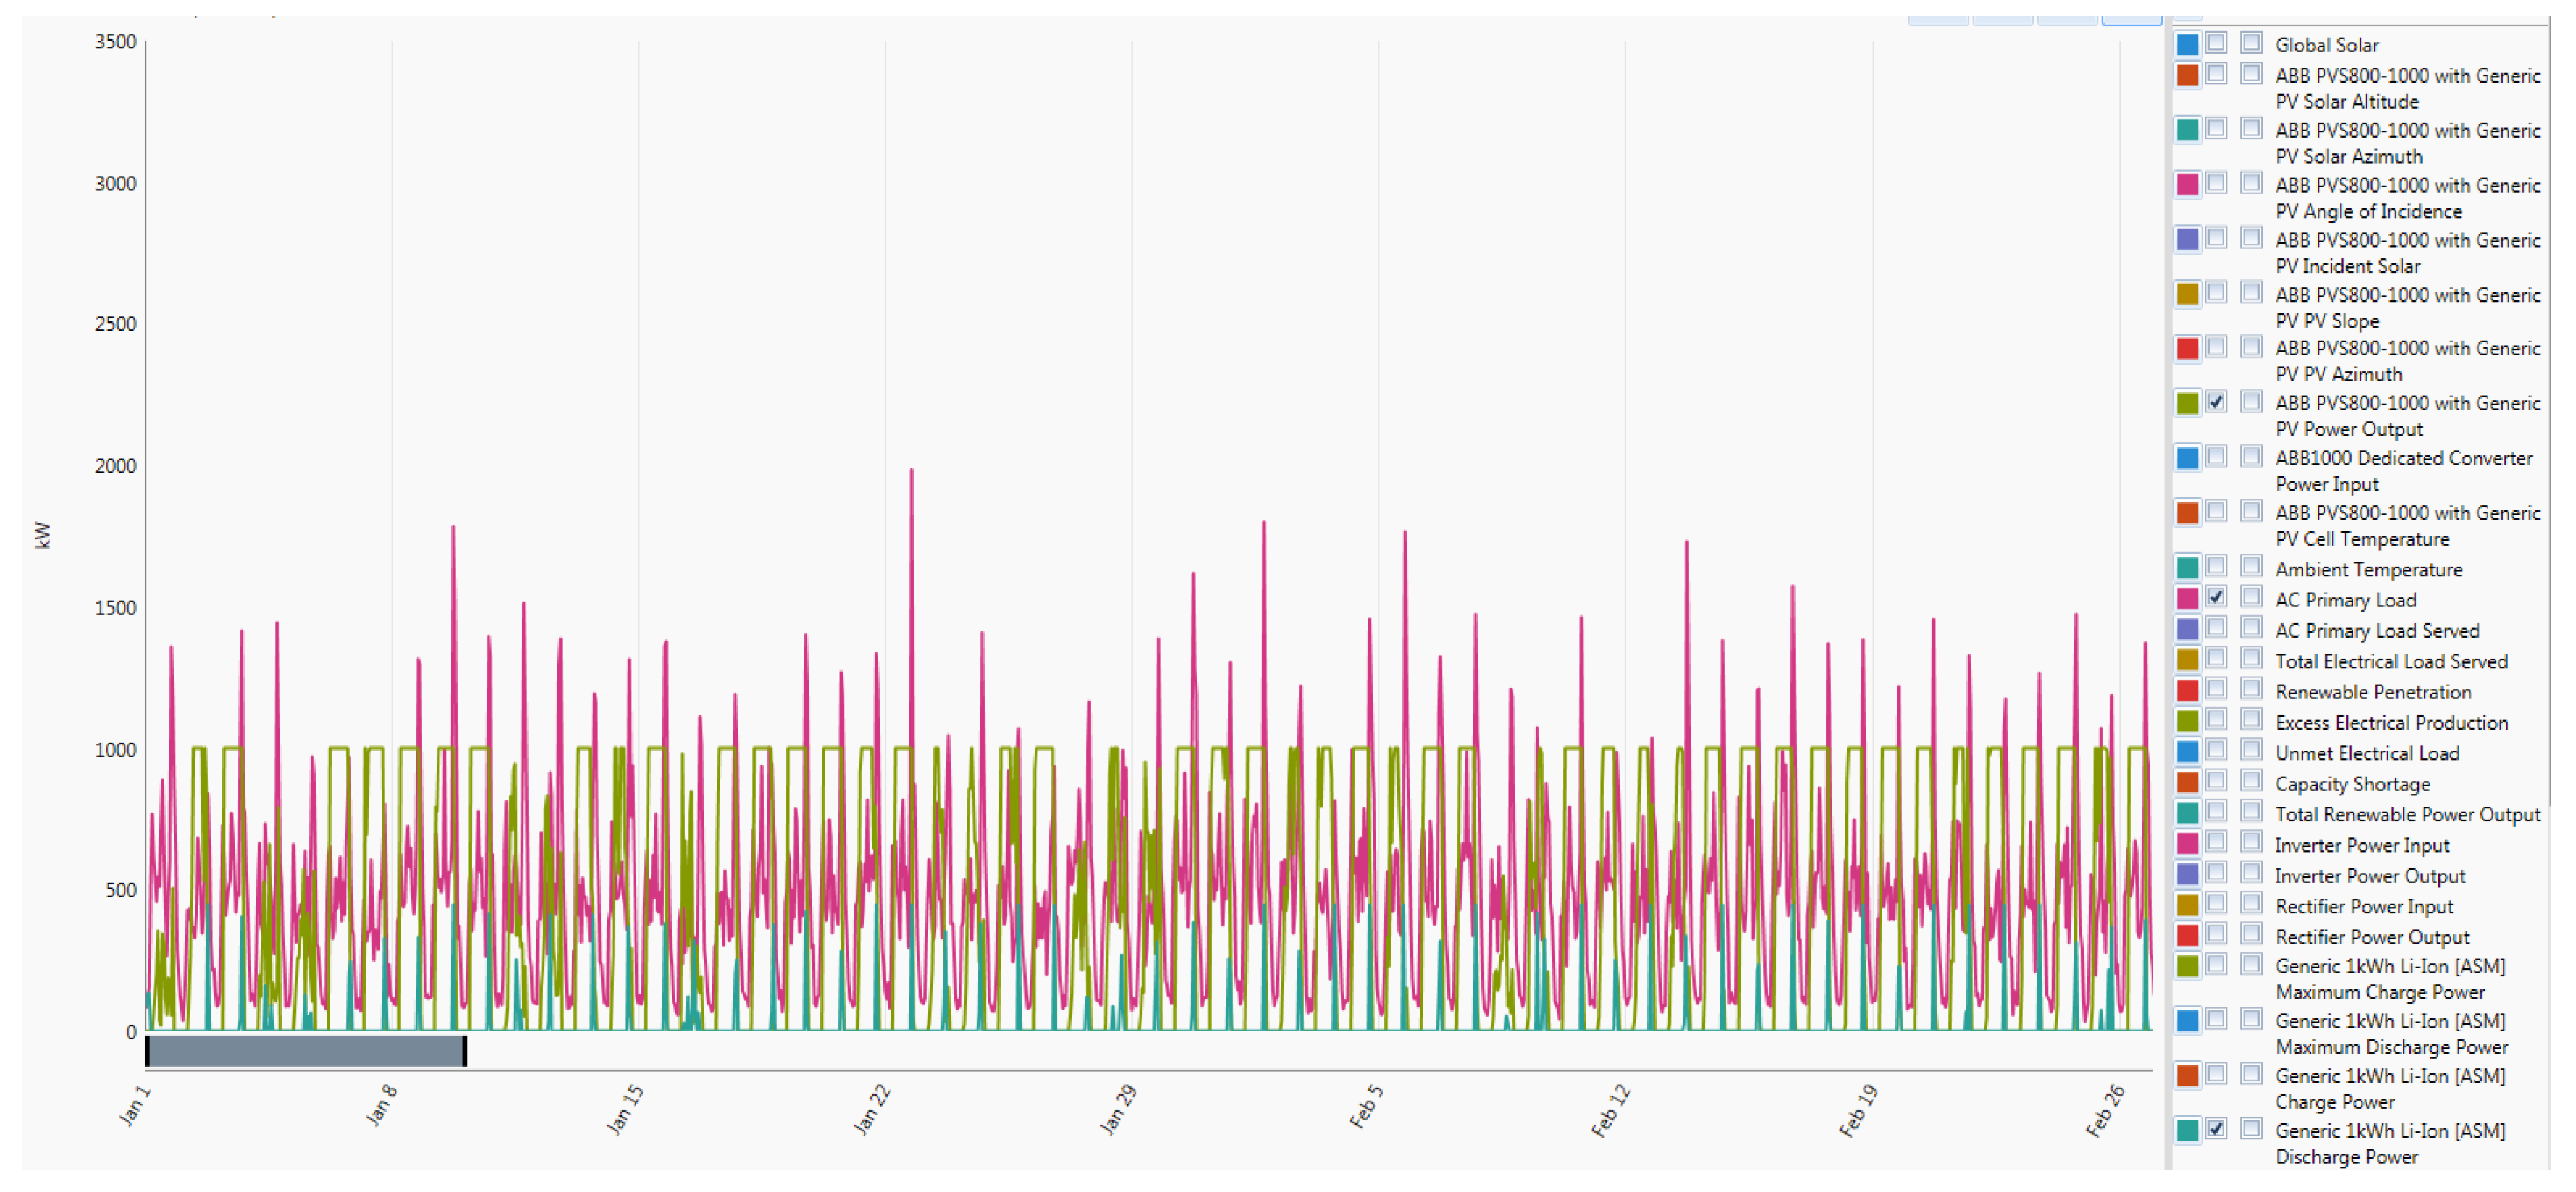
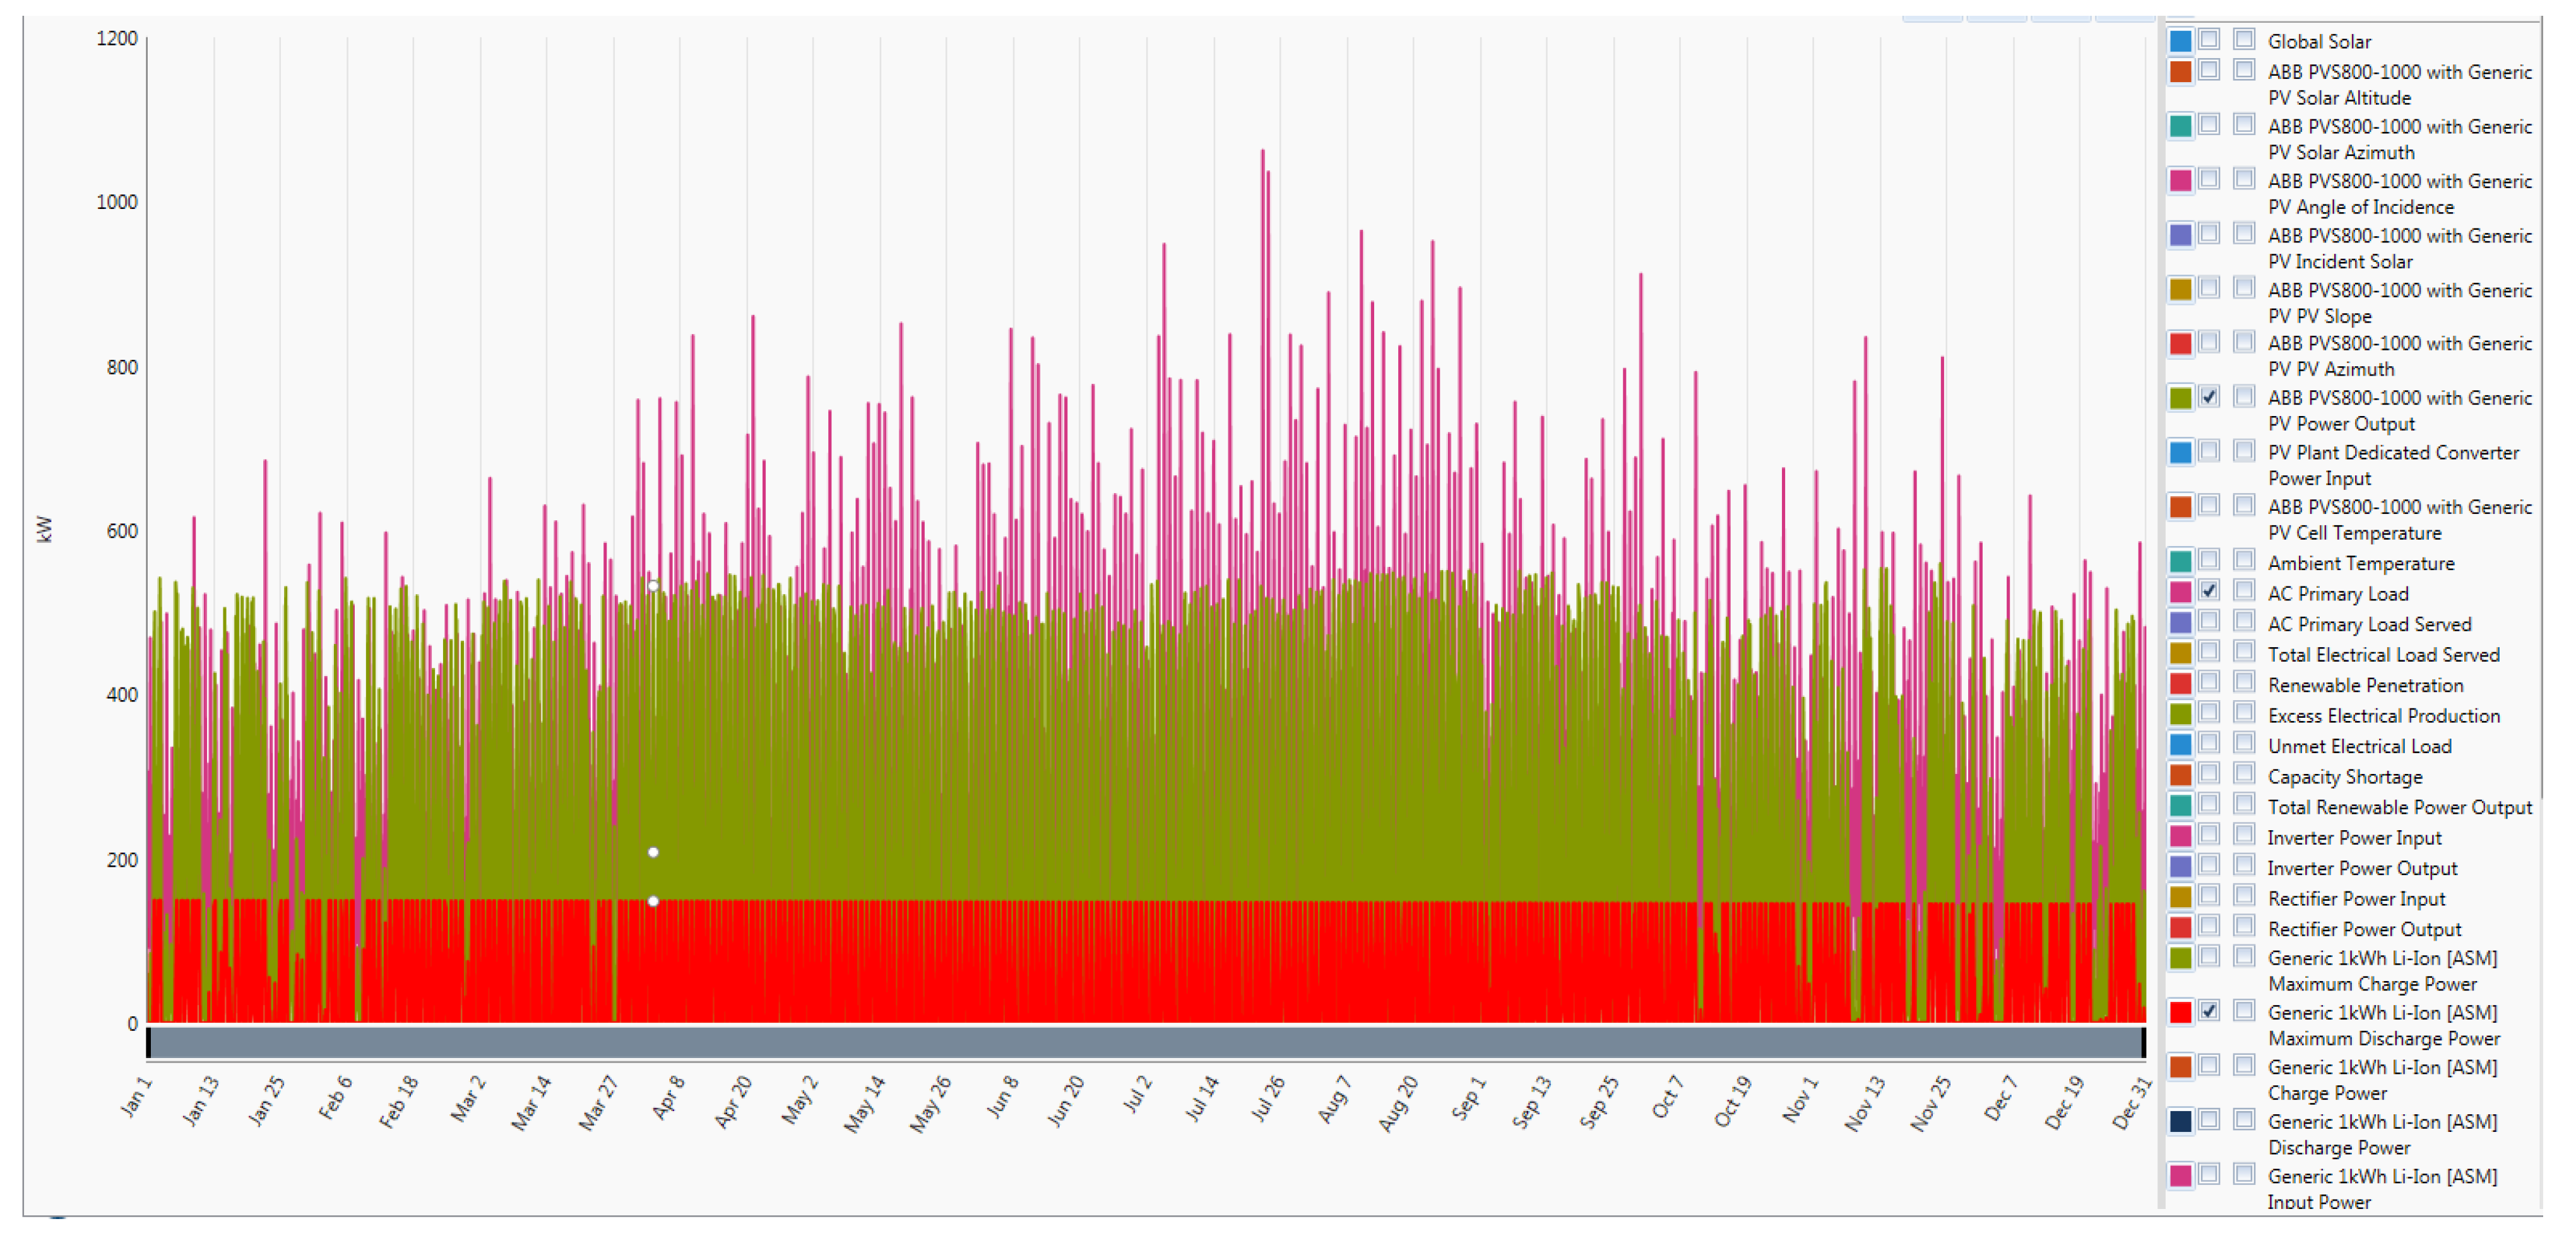
As in the previous case study, the same results can be realised from a decreased system in terms of performance. Figure 19 and Figure 20 above illustrate how the PV would supply the load throughout the year, with storage facility and peak months being July. It is clear that PV behaviour is not changed by loading or plant scaling; it will continue to supply the load at times where there is sun available and be off at night. Since the simulation was based in the Cape Town area, the sun is usually up at 5:34 am in the summer and sets around 20:00 as illustrated in Figure 20, which is usually from 5 am till 6 pm South African Time. At night there is no power supplied to the load. On other days, the output is not smooth throughout the day; this can be seen at 13:00 in Figure 20, this is the point at which storage becomes useful.
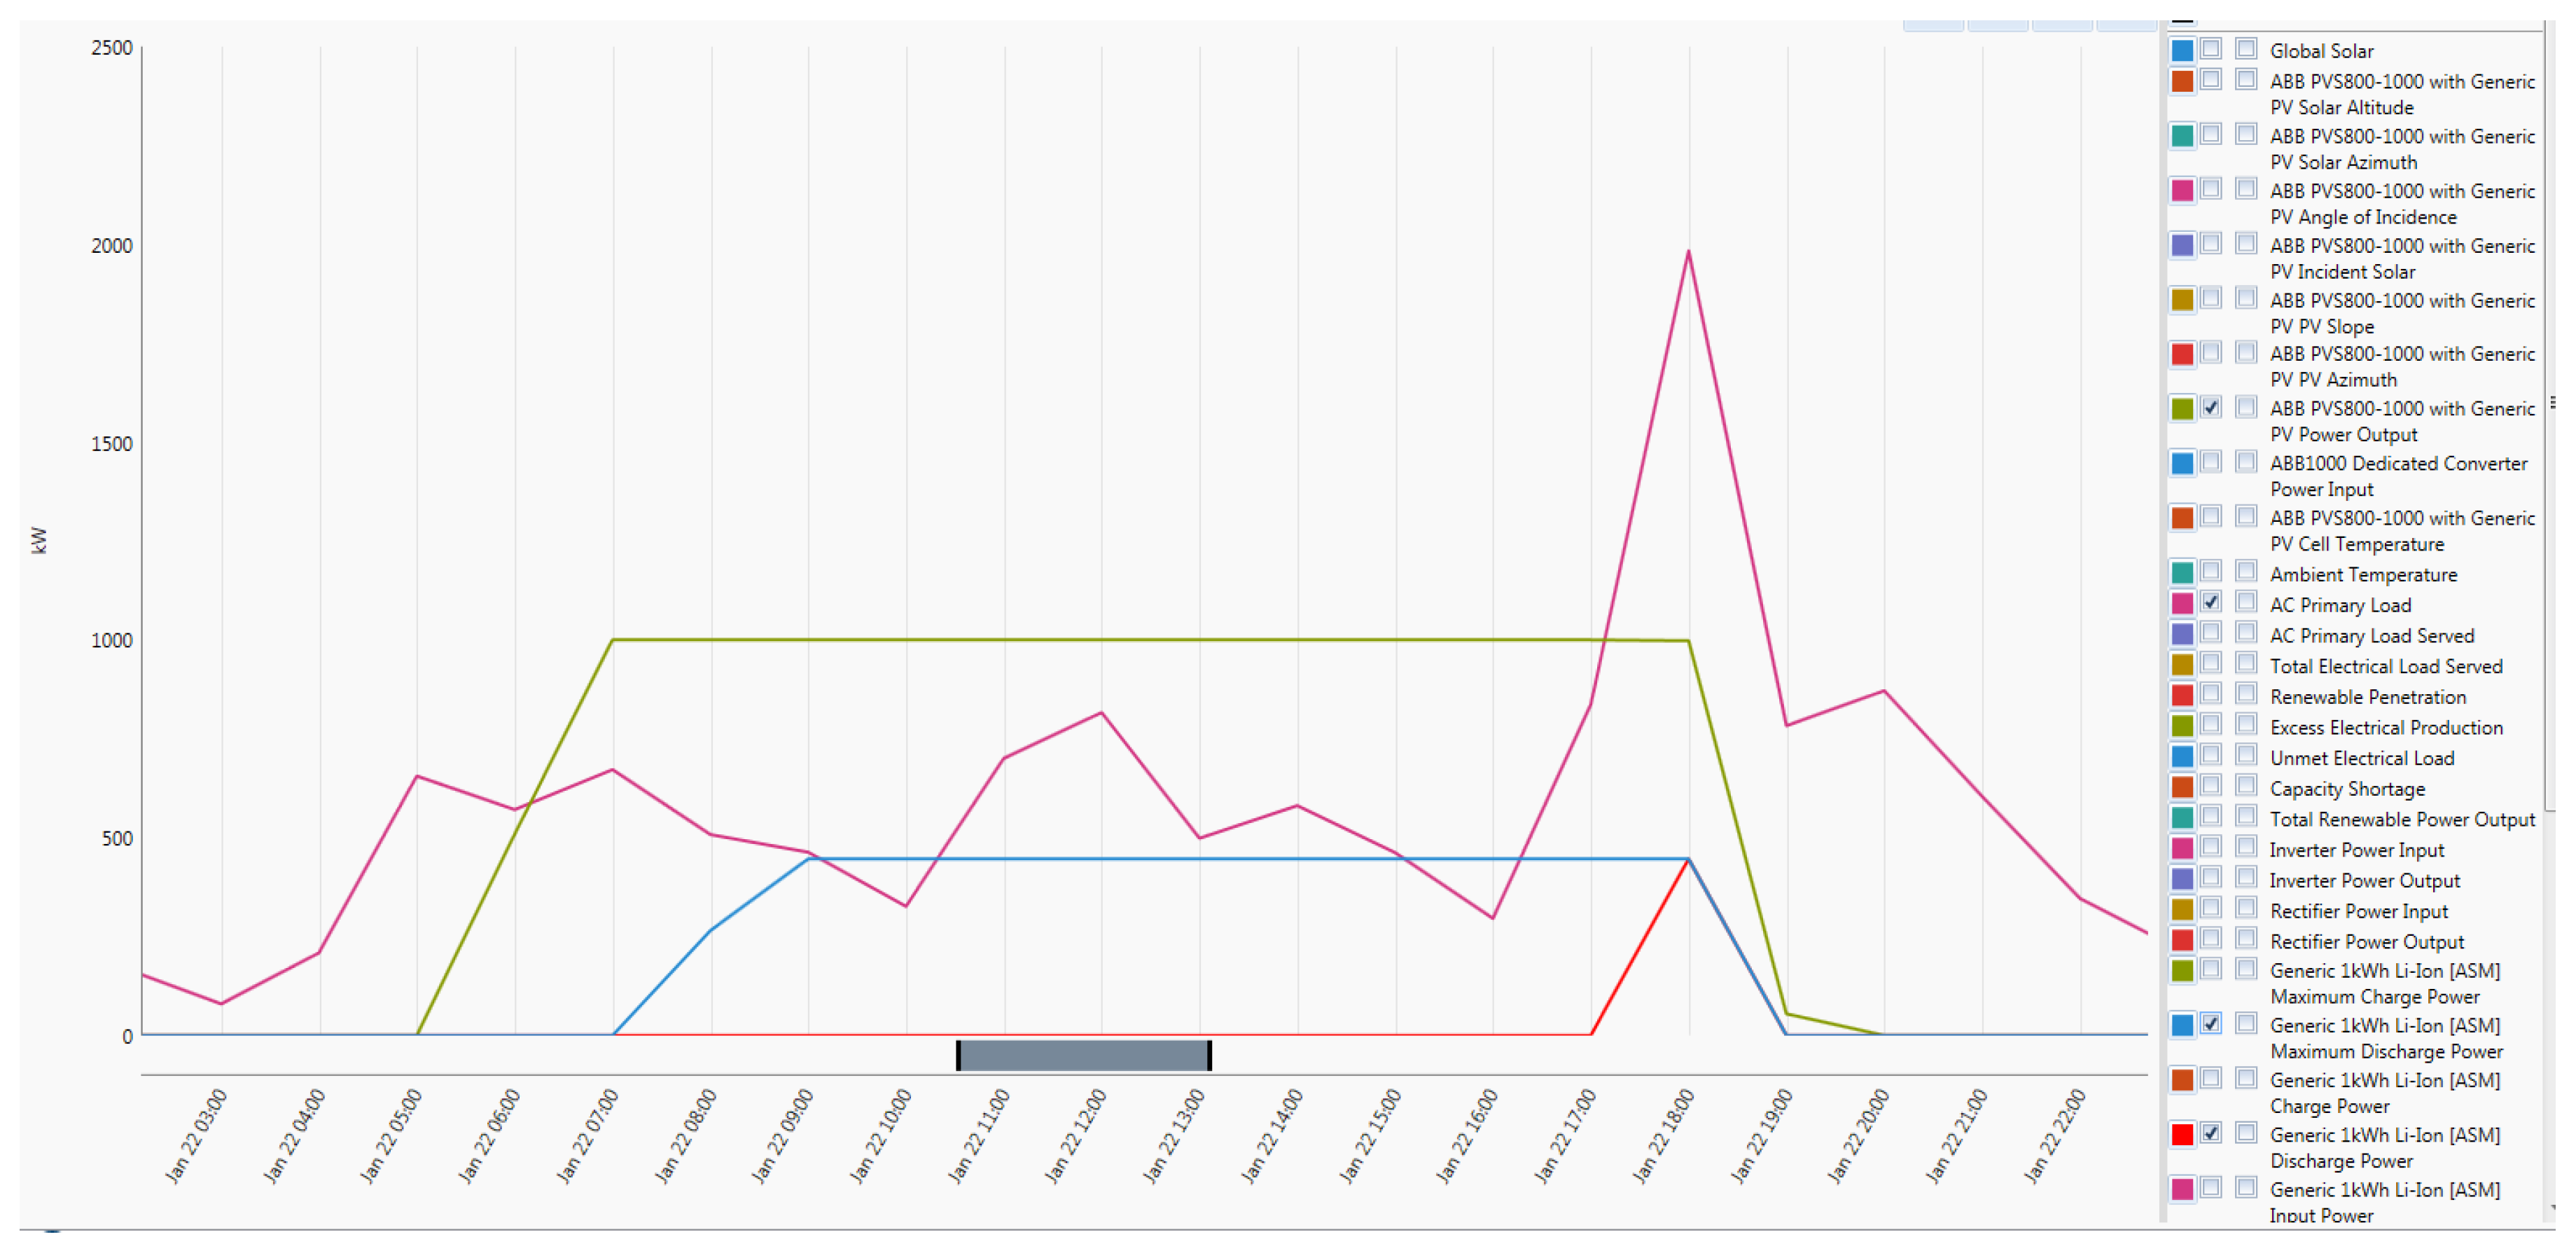
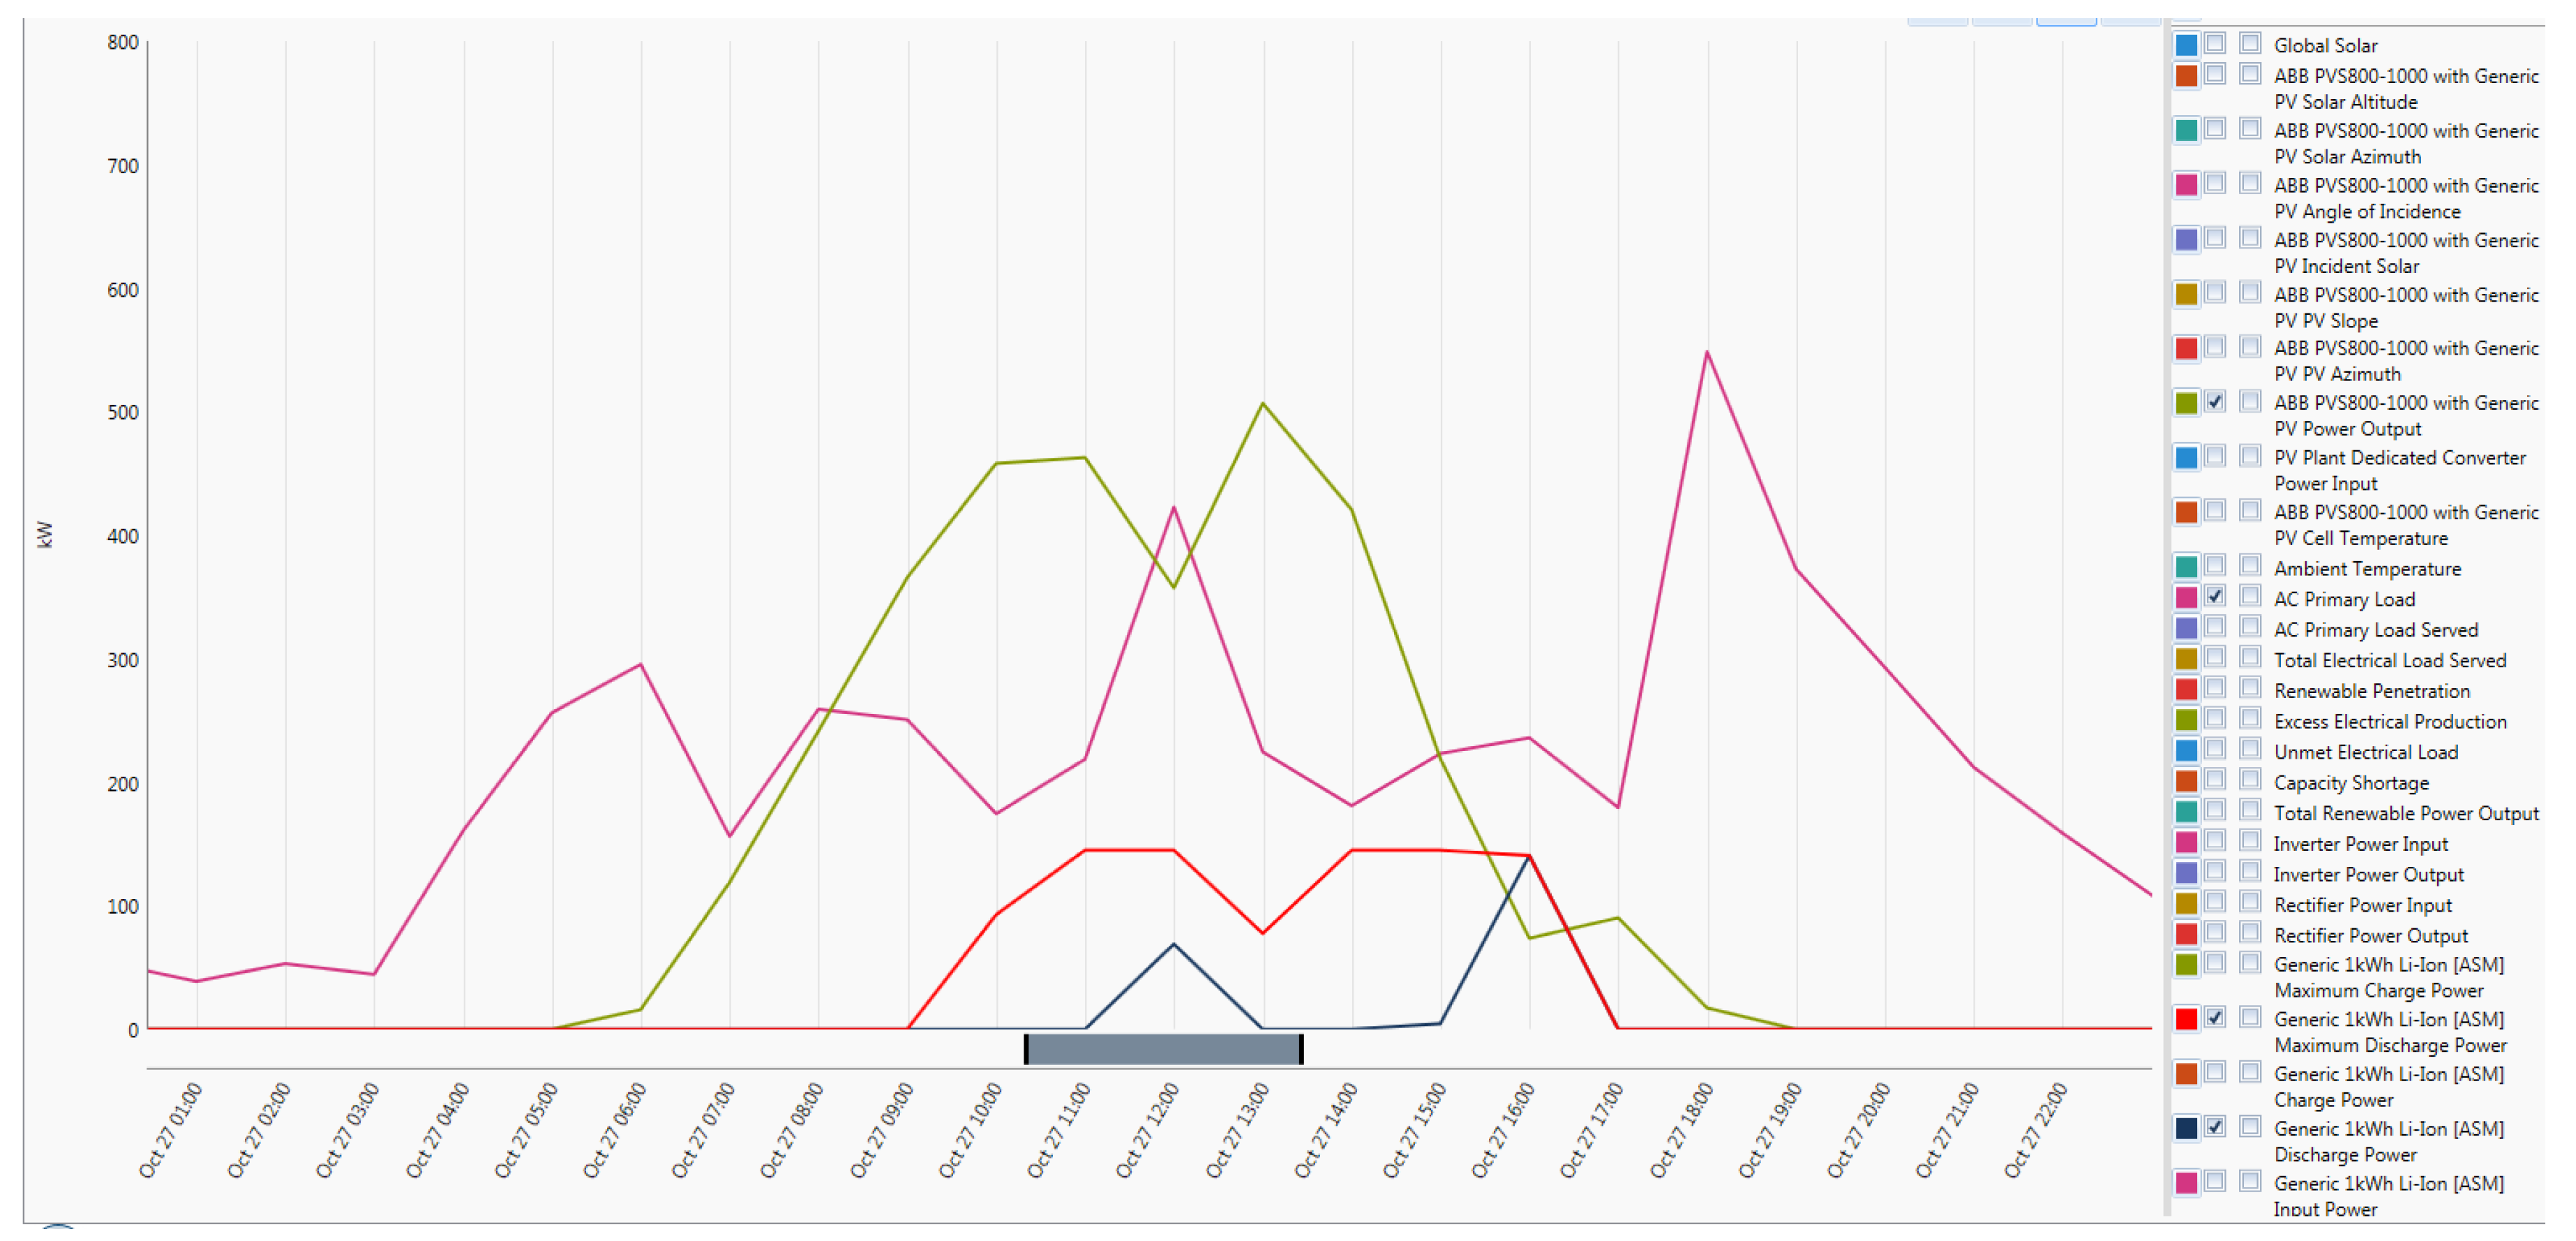
As may be observed from Figure 21
- PV power output is drawn as a green line in the graph;
- The load is the purple line in the graph;
- Maximum discharge battery output is drawn as a blue line; and
- The operating discharge output is in red on the graph.
When analysing the two graphs below (i.e., Figure 21 and Figure 22), it may be seen that the PV output started increasing from 5 am and peaks at 6 am with an output power of 1000 kW. The unmet and fluctuating load remained present for 24 h. Li-ion battery banks were available and could be discharged from 7 am. if required, as indicated by the blue line of the graph, but this was not the case because, at the time, PV was peak and could manage the load. The graph illustrates that the maximum available storage that could be discharged was 446 kW. The red line indicates the operating battery storage operation, where there was no discharge on batteries throughout the day, until such time where the load was greater than the PV output. That scenario occurs at 17:00 in the afternoon. At that time the peak load started, the battery ‘kicked-in’ to supplement the PV up until 18:00. At 18:00, PV was peak at 1000 kW; Load was 1983 kW, while the storage supply peak was at 446 kW. The storage battery percentage overload = 446/1983 = 22% peak. After 18:00, the load starts decreasing and the storage facility and the PV supply followed. By 19:00, both the battery bank and the PV plant stop supplying the load as required. The scenario is repeated daily throughout the year.
4.4. PV-Battery Plant Off-Grid Cost Analysis
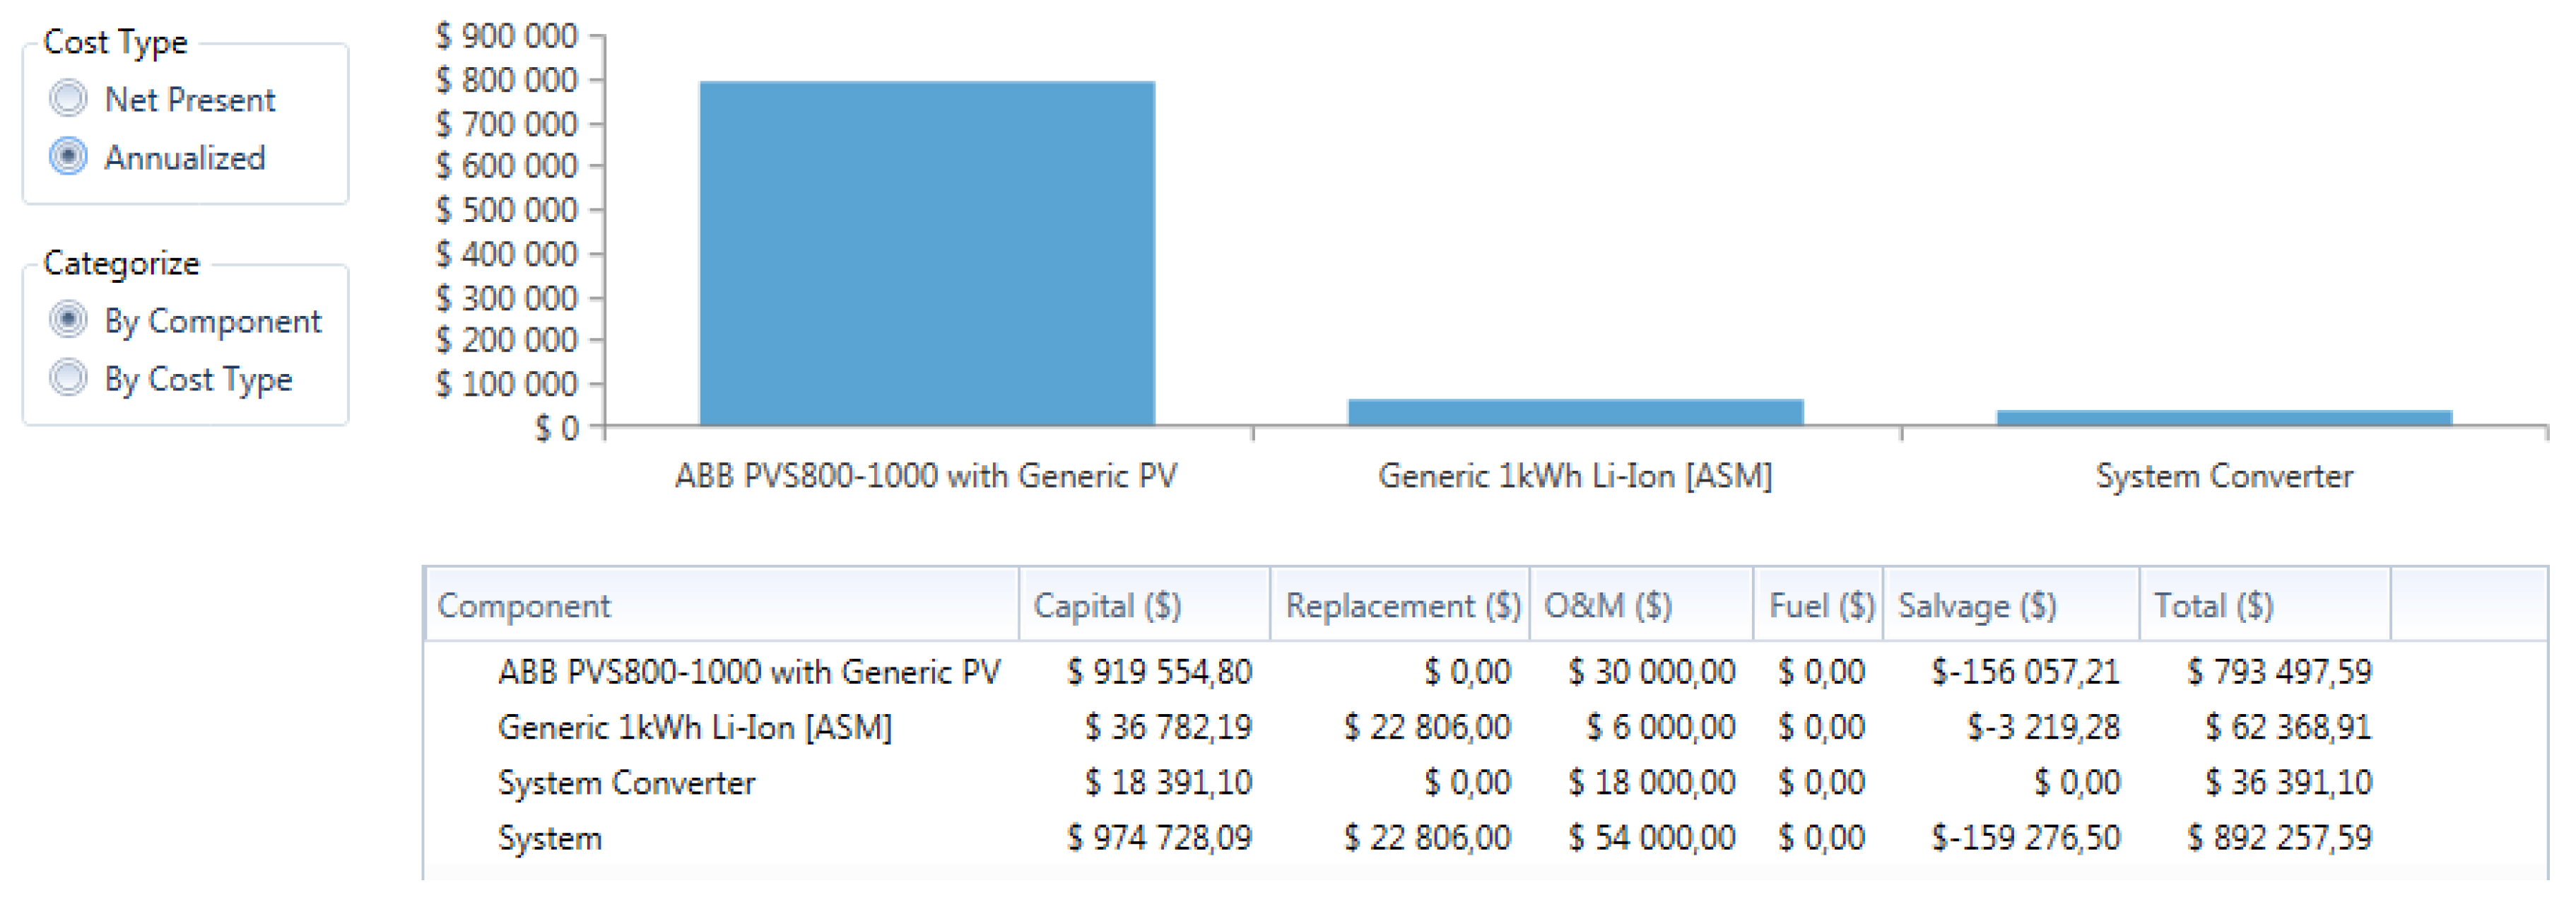
Based on the results of above Figure 23 and Figure 24, it can be seen that having a 3 MW PV power plant with 20% battery storage capacity in the Western Cape would cost approximately Net USD 8 million with an annual cost of USD 0.8 million for a project with a life cycle of 25 years. This system is technically excellent but could require an exorbitant amount of funding to build. This system is 100% renewable with 20% battery storage capacity, 48.3% unmet load and up to 73% capacity shortage. Nonetheless, the return on investment would be very low at −0.8%, possibly making this too expensive to construct. However, it can be used as a baseline for smaller systems/plants. Since the system was off-grid, the quantity of batteries has increased. Accordingly, it is proven that there is no investment reward for building such a system as it has very low investment rate.
The difference between using a system with no storage on the same system is only USD 540,000.
4.5. Case Study 4: 3 MW Load, PV Plant and 20% Pump Storage Plant
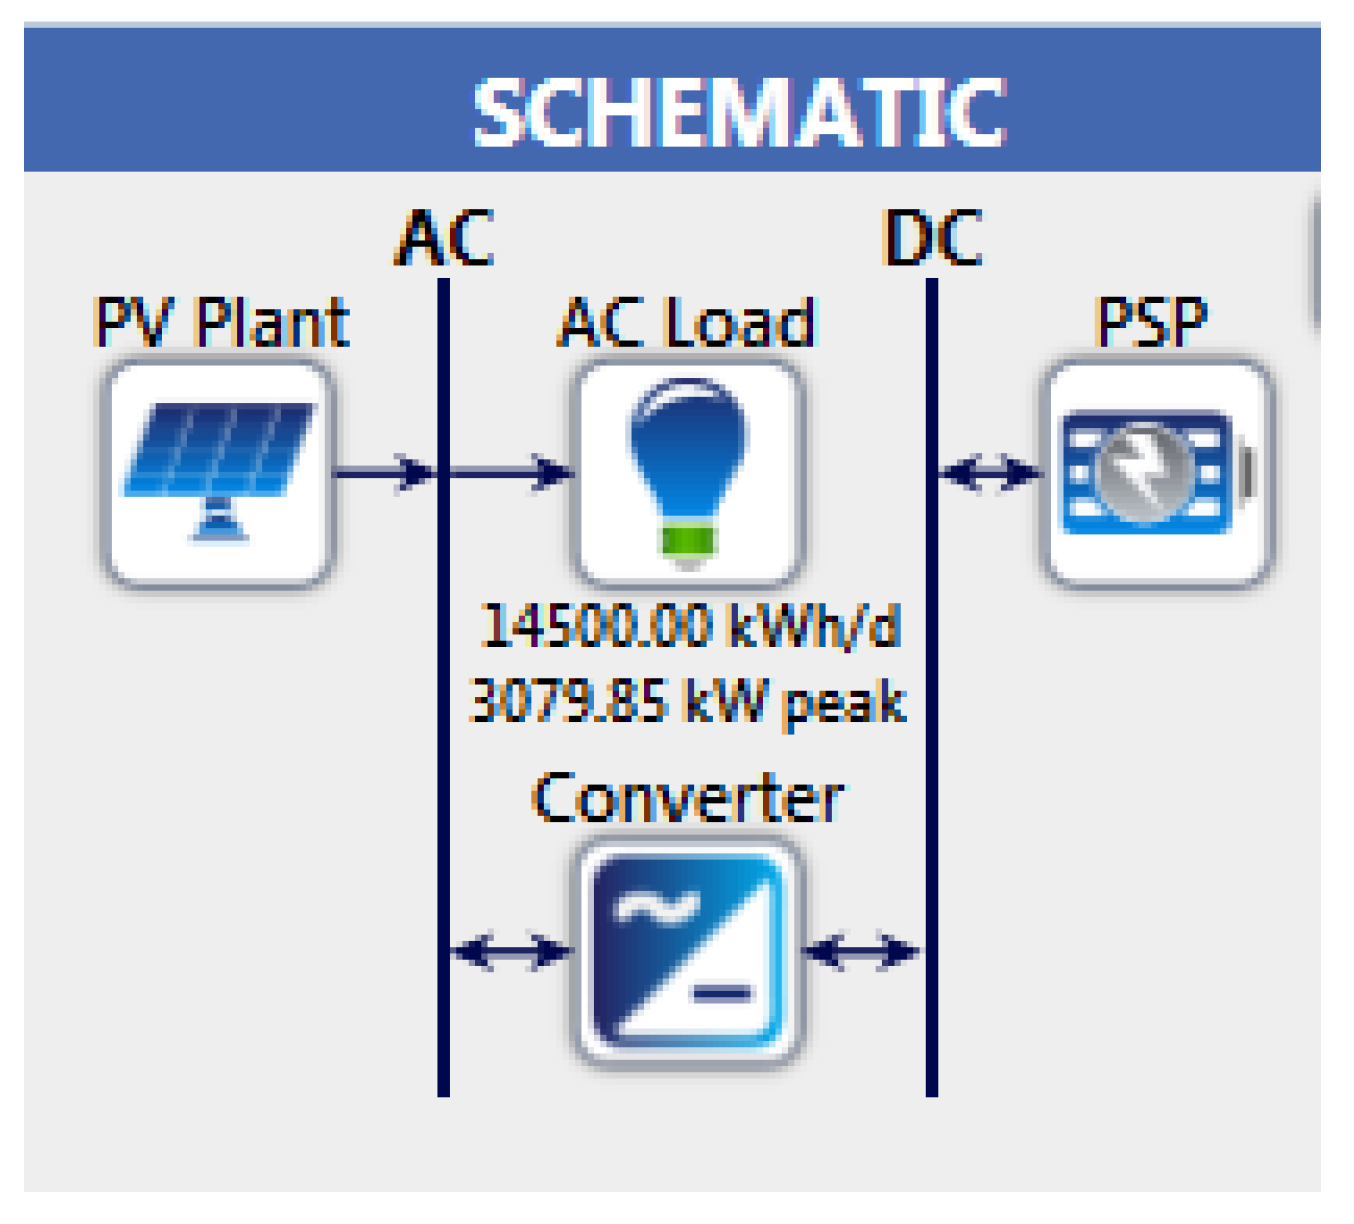
The PV plant and the load used in case study 2 were decreased to match the 3 MW load. As per case study 2, the optimum location of the system remains the same. A schematic diagram of 3 MW load supplied by PV plant and PPS storage is shown in Figure 25 below;
- is the Dam Capacity (upper and lower) to be calculated.
- is the time required to discharge and restore water to upper dam, which is 12 h, since this water had to be available for electrical production the next day.
- is the effective head = 150 m
- is the Generator efficiency = 90%
- g is the gravitational force = 9.81 m/s2
- is the discharge rate/flow = 0.03 cubic metres per s.
Since the load was already known, some of the above were assumed to be able to calculate the amount of water or dam capacity to meet the load demand.
is the peak load = 3 MWh
PPS rating to be 20% of the load = 0.6 MWh.
Assuming one generator output generation over 12 h to be 245 kW; this will be used just as a baseline. Bigger generators are normally used in real life situations.
Therefore = 2.44 generators, which is impractical. One generator of 300 kW or higher ratings can be used to reduce the number to a maximum of 2 units.
Discharging
To discharge 600 kW in 12 h is required; using Equation (18); Power generated () = 600 kWh/12 h = 50 kW
Using Equation (19); mass of water required = = = = 1258 m3 water is required.
Charging
Since the same turbine could be used as a pump, as discussed in Chapter 3, the effective head, efficiency and power remained unchanged. Therefore, the flow rate was calculated as follows:
- From Equation (20); flow rate = =
- = = 0.031 m3 per s
- Time required to refill the upper dam, using Equation (21) =
- From Equation (22); Electrical energy required = 50 kW × 5.82 h = 291 kWh
- Round trip efficiency of the PPS = ratio of discharging electrical energy output to the charging electrical input = 0.6/0.291 = 2.06
- Maximum capacity using Equation (23) = = 2500 Amp hours. This is the maximum electrical output divided by the nominal voltage.
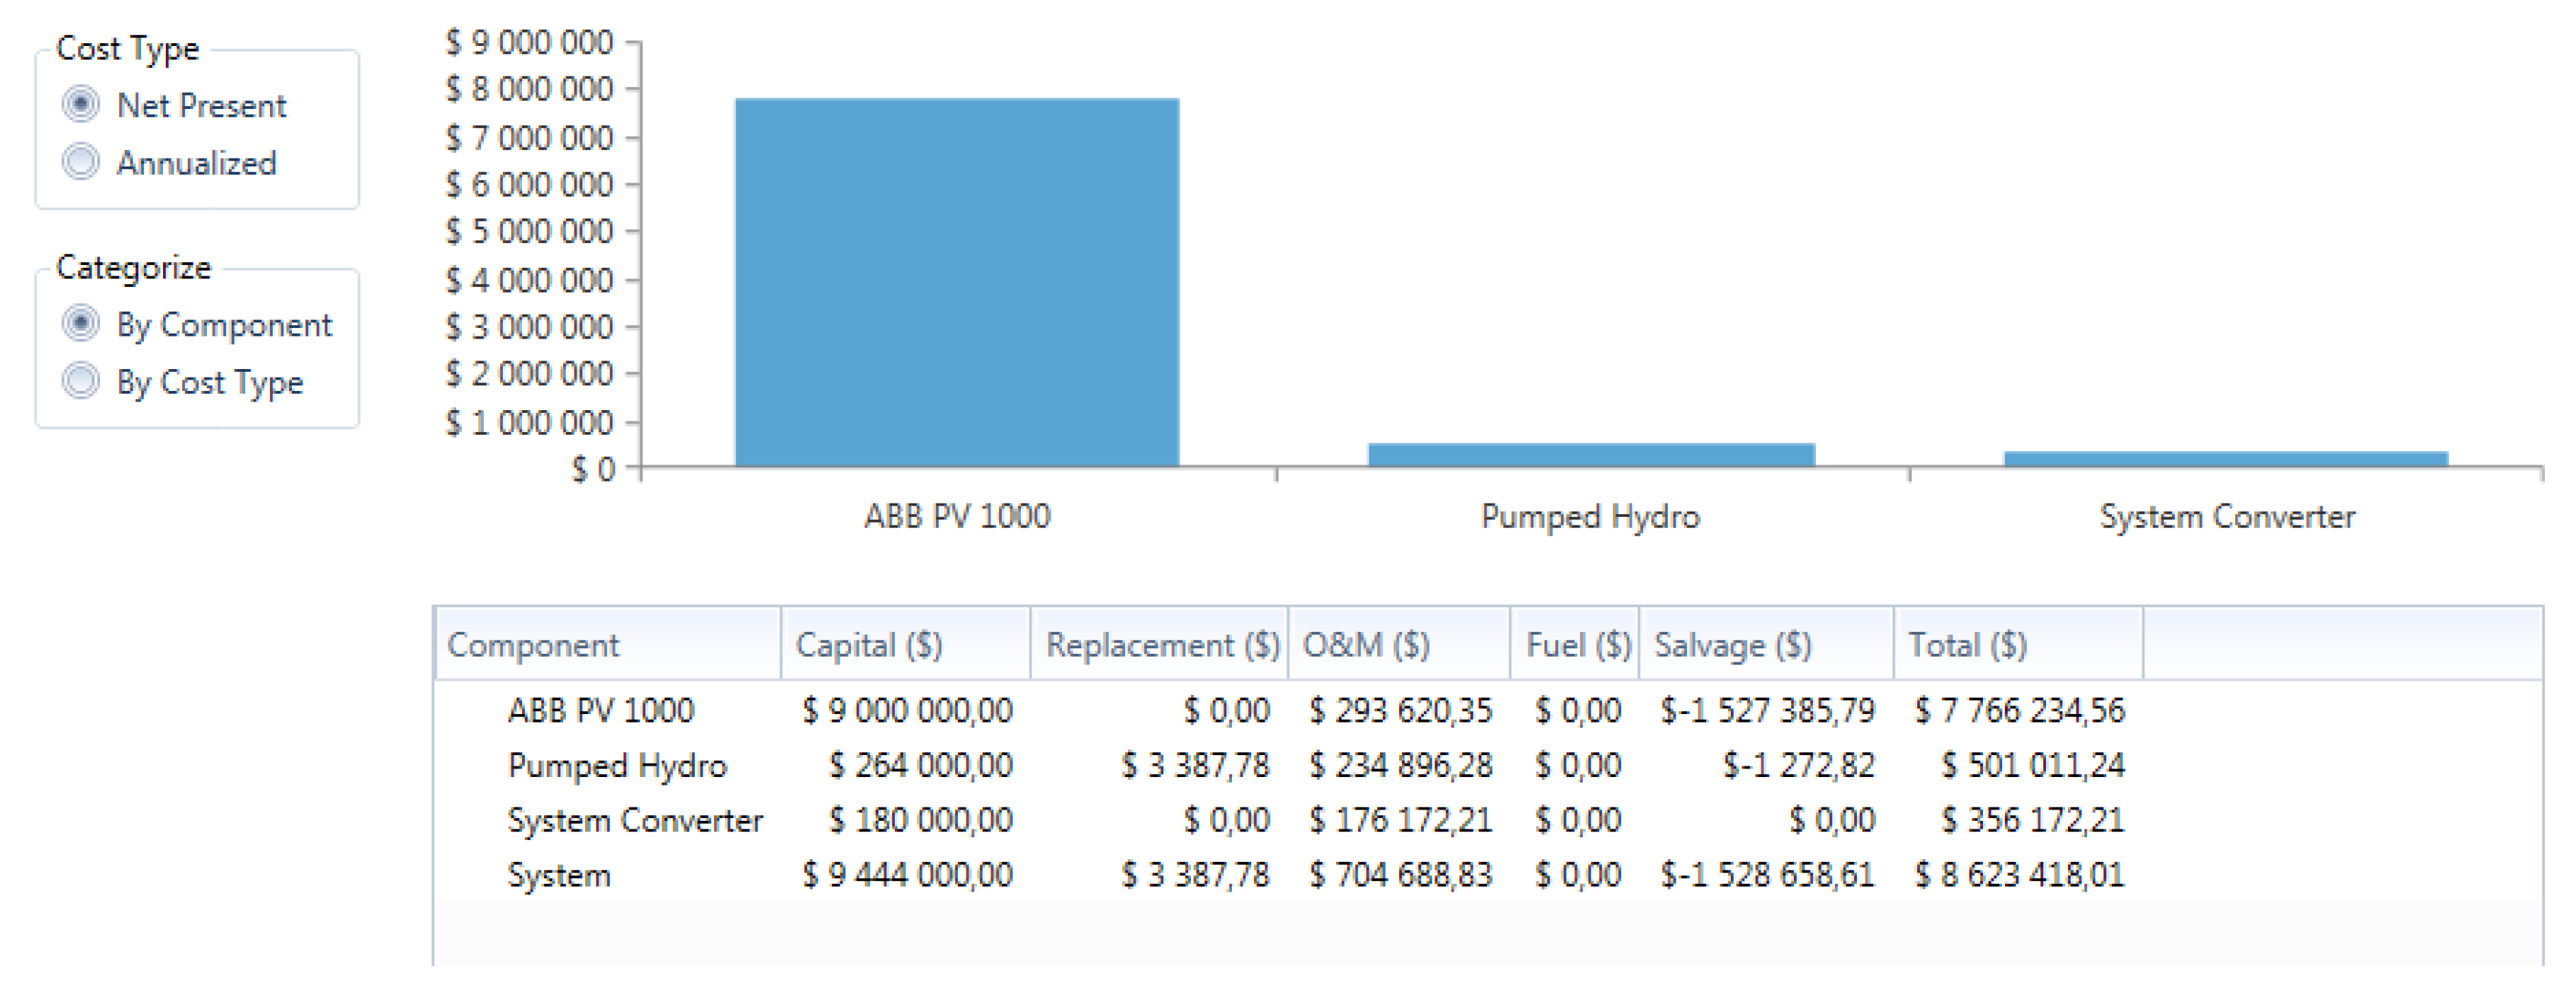
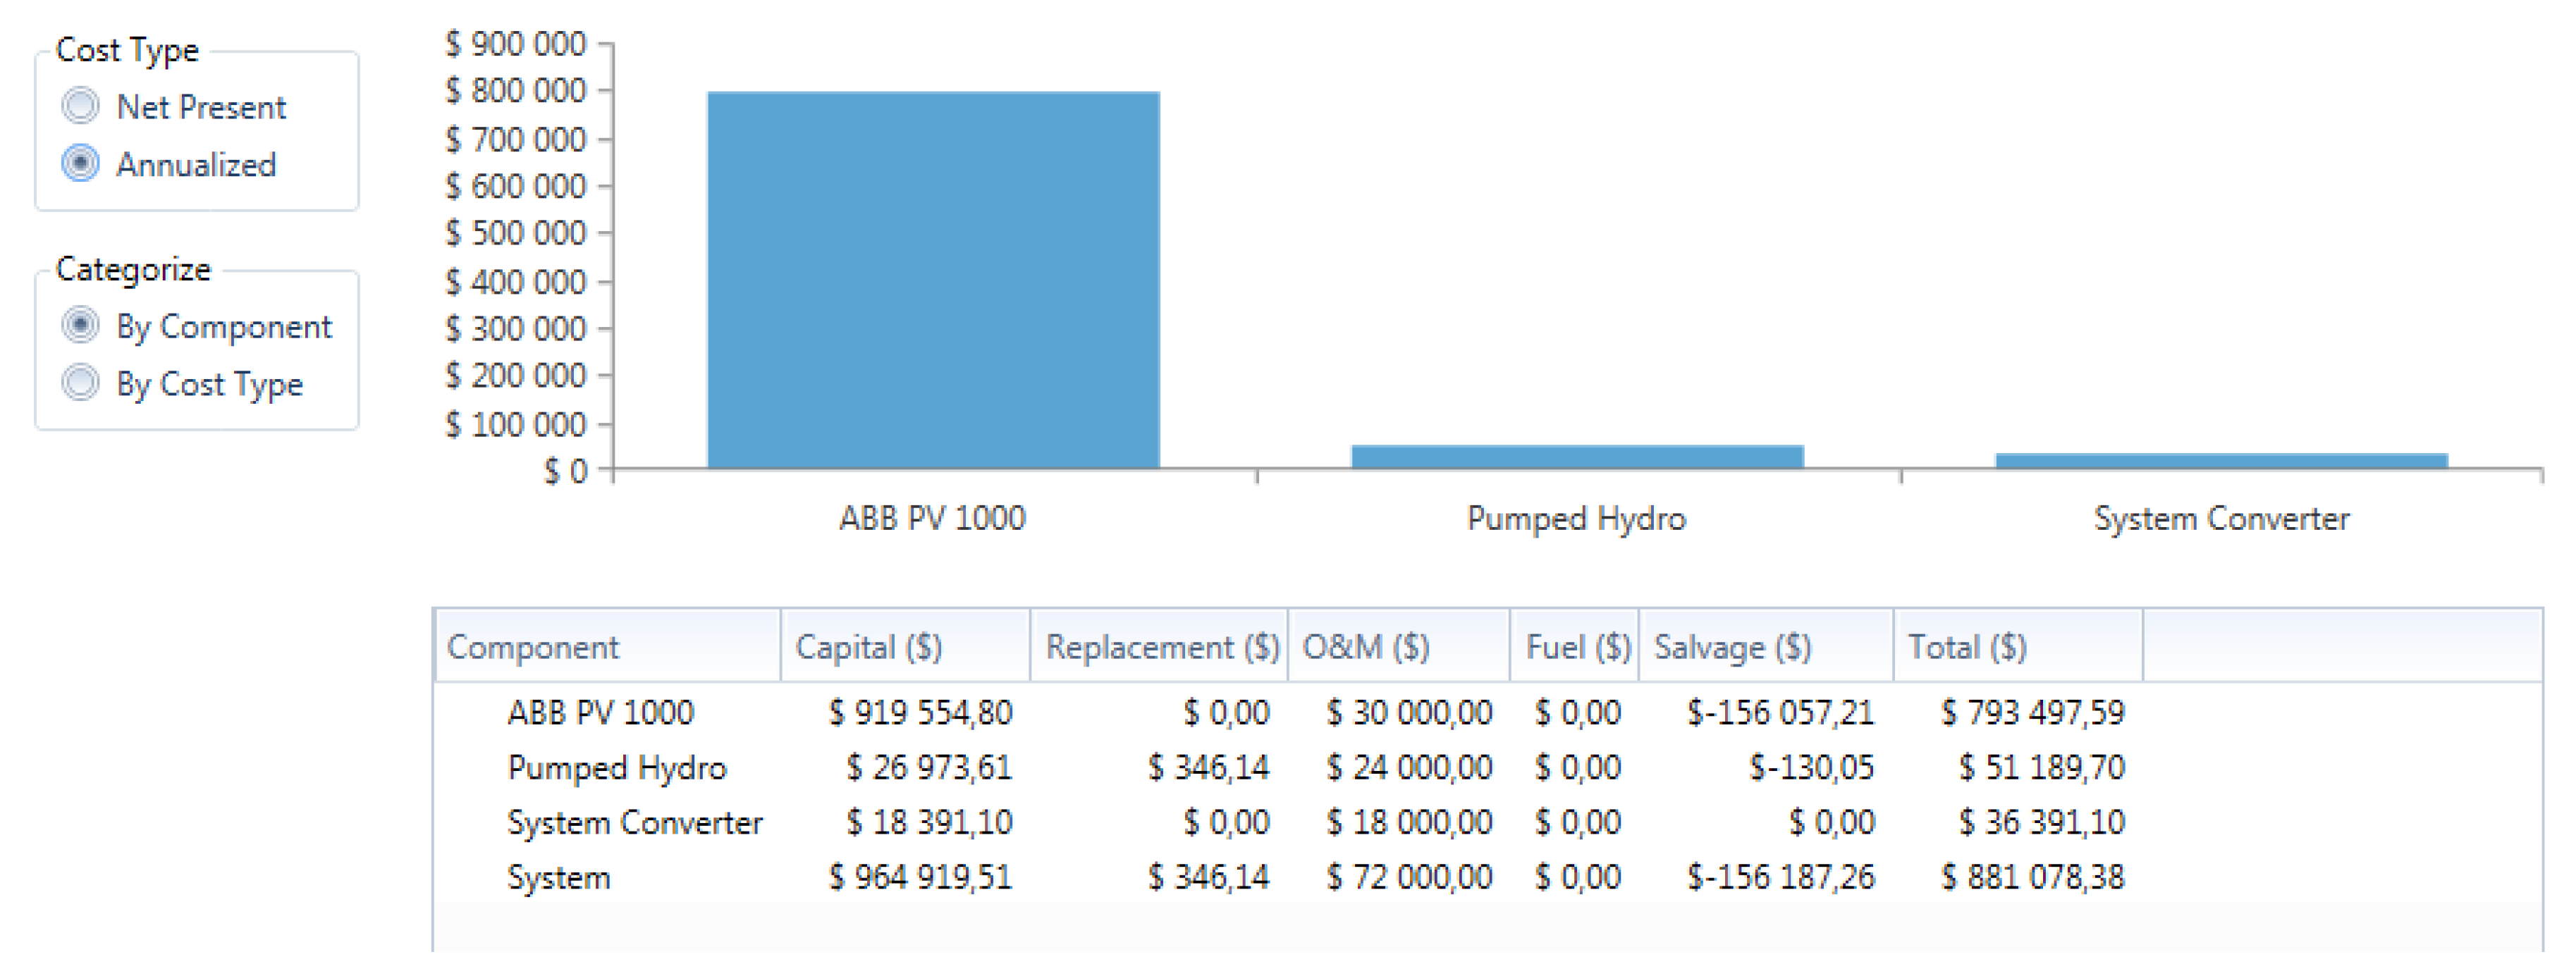
Using pumped storage to supplement the load and rectify the PV seemed to be working; the cost associated with the system at just 20% storage capacity was just USD 8.6 million as recorded in Figure 26 and Figure 27. Storage costs are almost the same for the PPS as that of the batteries in Figure 23 and Figure 24. The difference between the two systems presented in Table 3 below. Based on the results, it can be stated that any storage facility can be chosen for the 3 MW plant.
Reading from Table 4 below, it can be seen that the difference between the two components is reduced when analysing by individual component in the system. Meaning that on bigger plants the individual component does not play a big role but the entire system required to accommodate that individual component. However, when the system reduced then the individual component makes a difference as seen in Table 3 and Table 4.
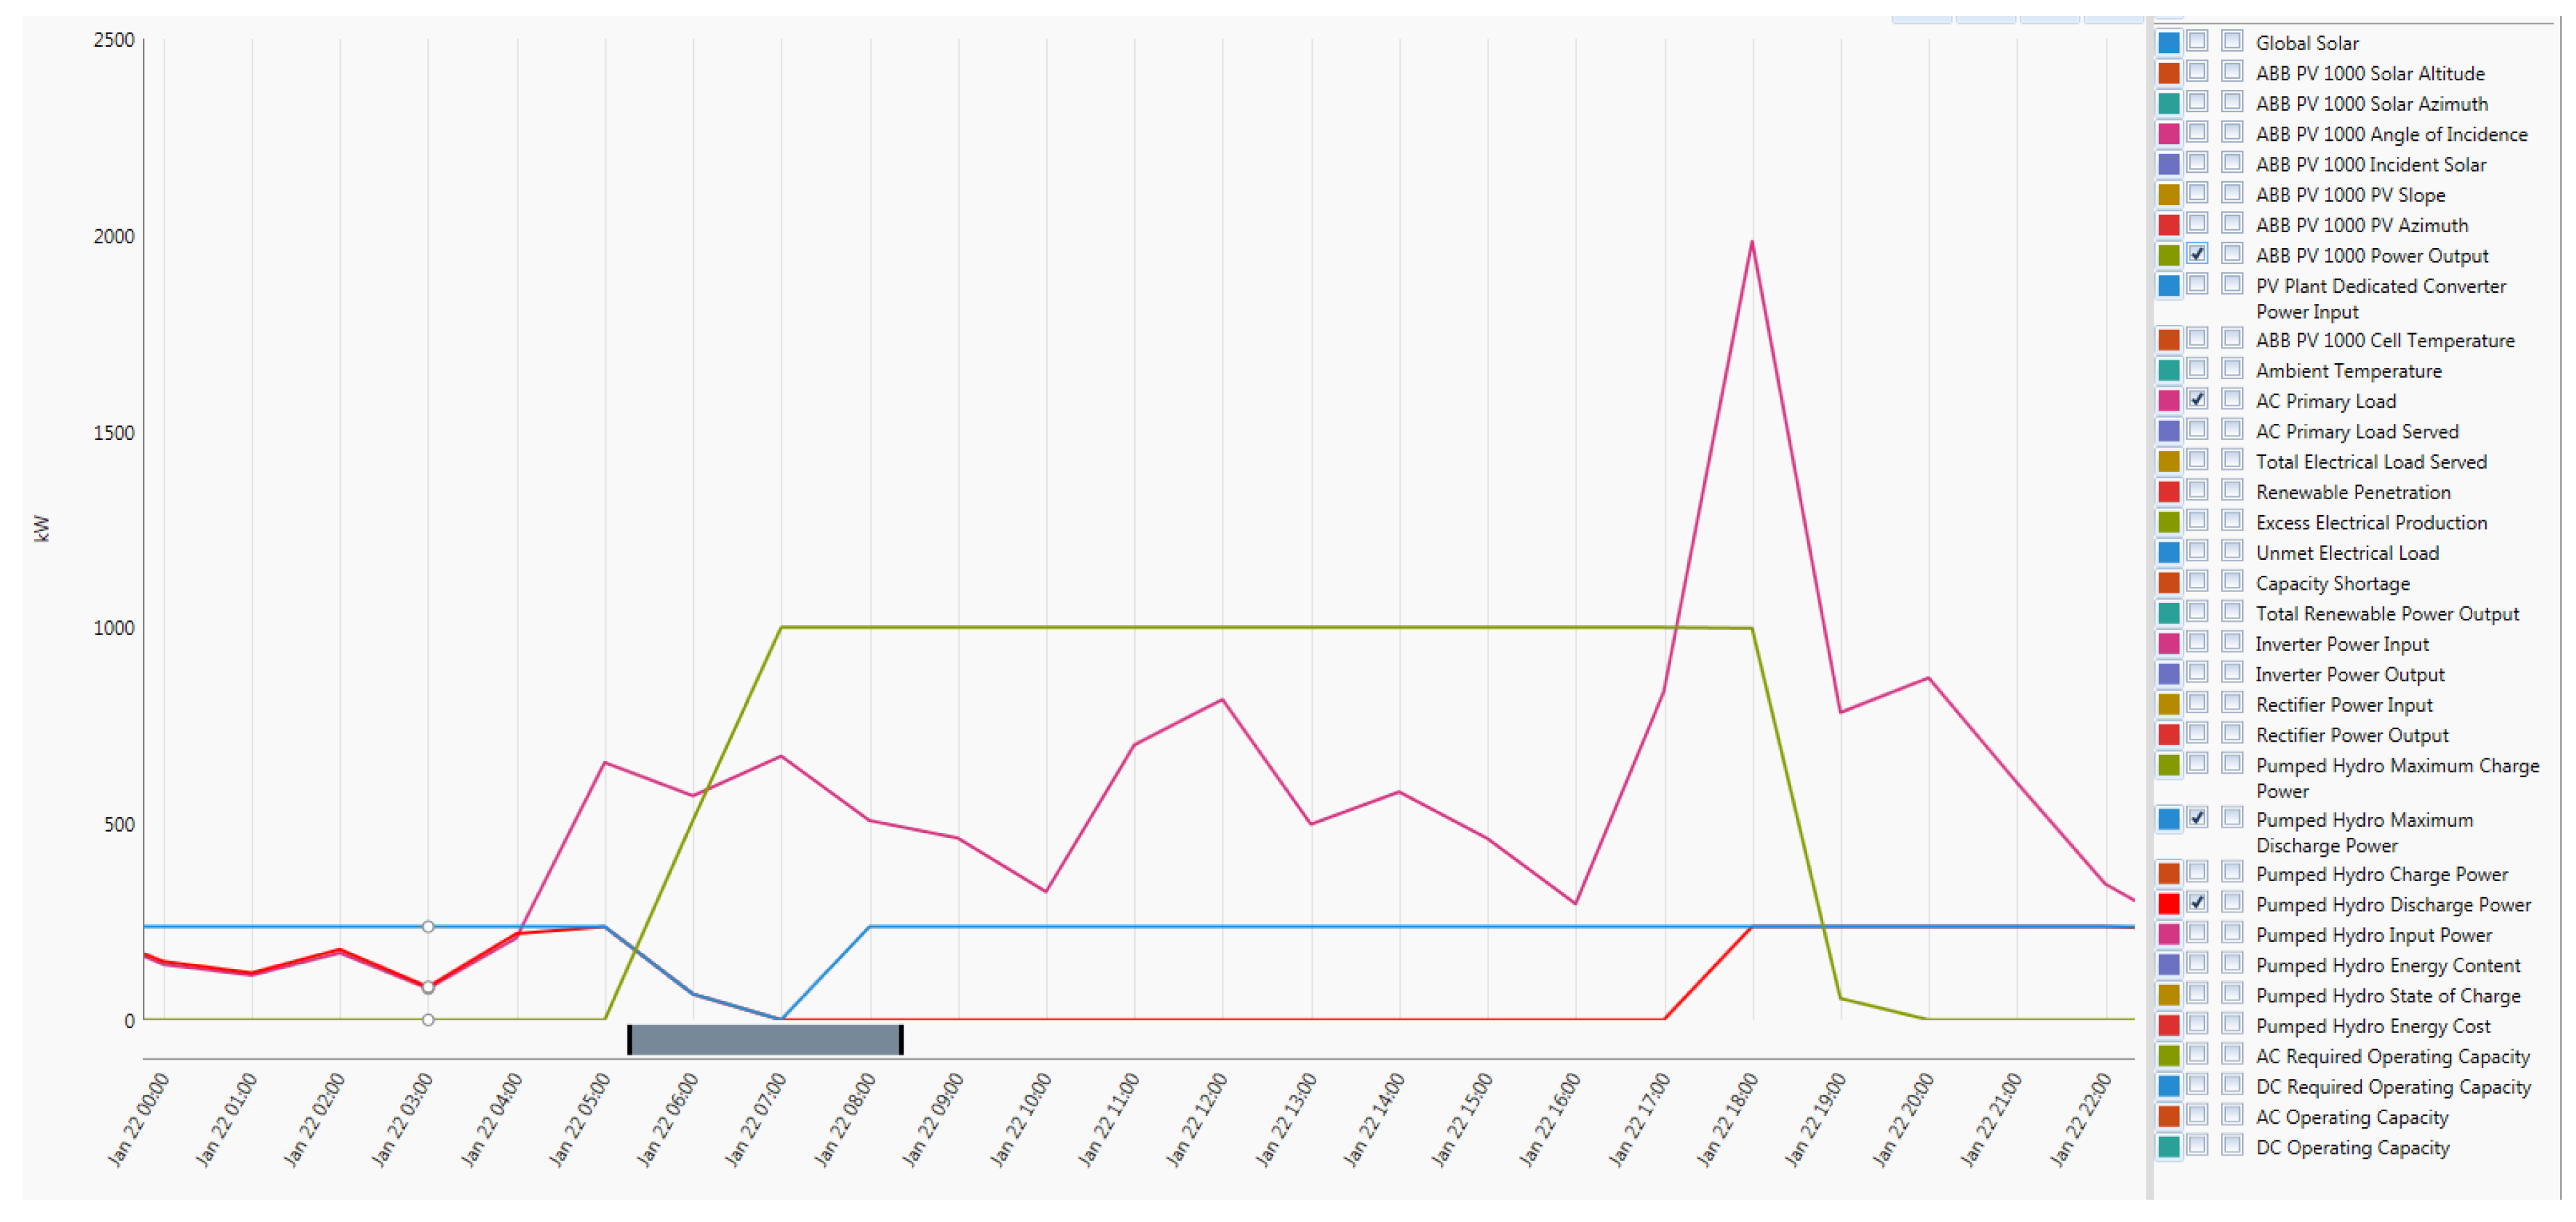
Figure 28, Figure 29 and Figure 30 represent the operation of the plant/system with the PPS connection. PV + PPS = load. Technically, the system was configured to work in the following manner:
PV is the primary source of power. From 5 am. in the morning, the PV supplies the load with assistance/backup from the PPS just at peak times. During the night the PV storage discharges to supply the load or can be switched off. While supplying the load from 6 am, excess electricity is used to pump water back to the upper reservoir as per the calculation above. In the afternoon during peak time, the PV is unable to cope with the usual peak load increase and simultaneously, the solar energy decreases towards sunset. At this time the PPS takes over and supplies the load overnight while the PV is off. This continues until the following morning at 6 am. when the PV picks up and becomes stable. The operation remains the same as in case study 2.
4.6. Case Study 5: 1 MW Load, PV Plant and 20% Storage Battery Capacity
The peak load is 1 MWh, while just 20% of the load, which is only 200 kWh had to be stored on Li-ion batteries. The characteristics of the battery remain the same in this study as shown on Figure 5. A total of 200 batteries is required to make 200 kWh storage, the schematic diagram is shown in Figure 31.
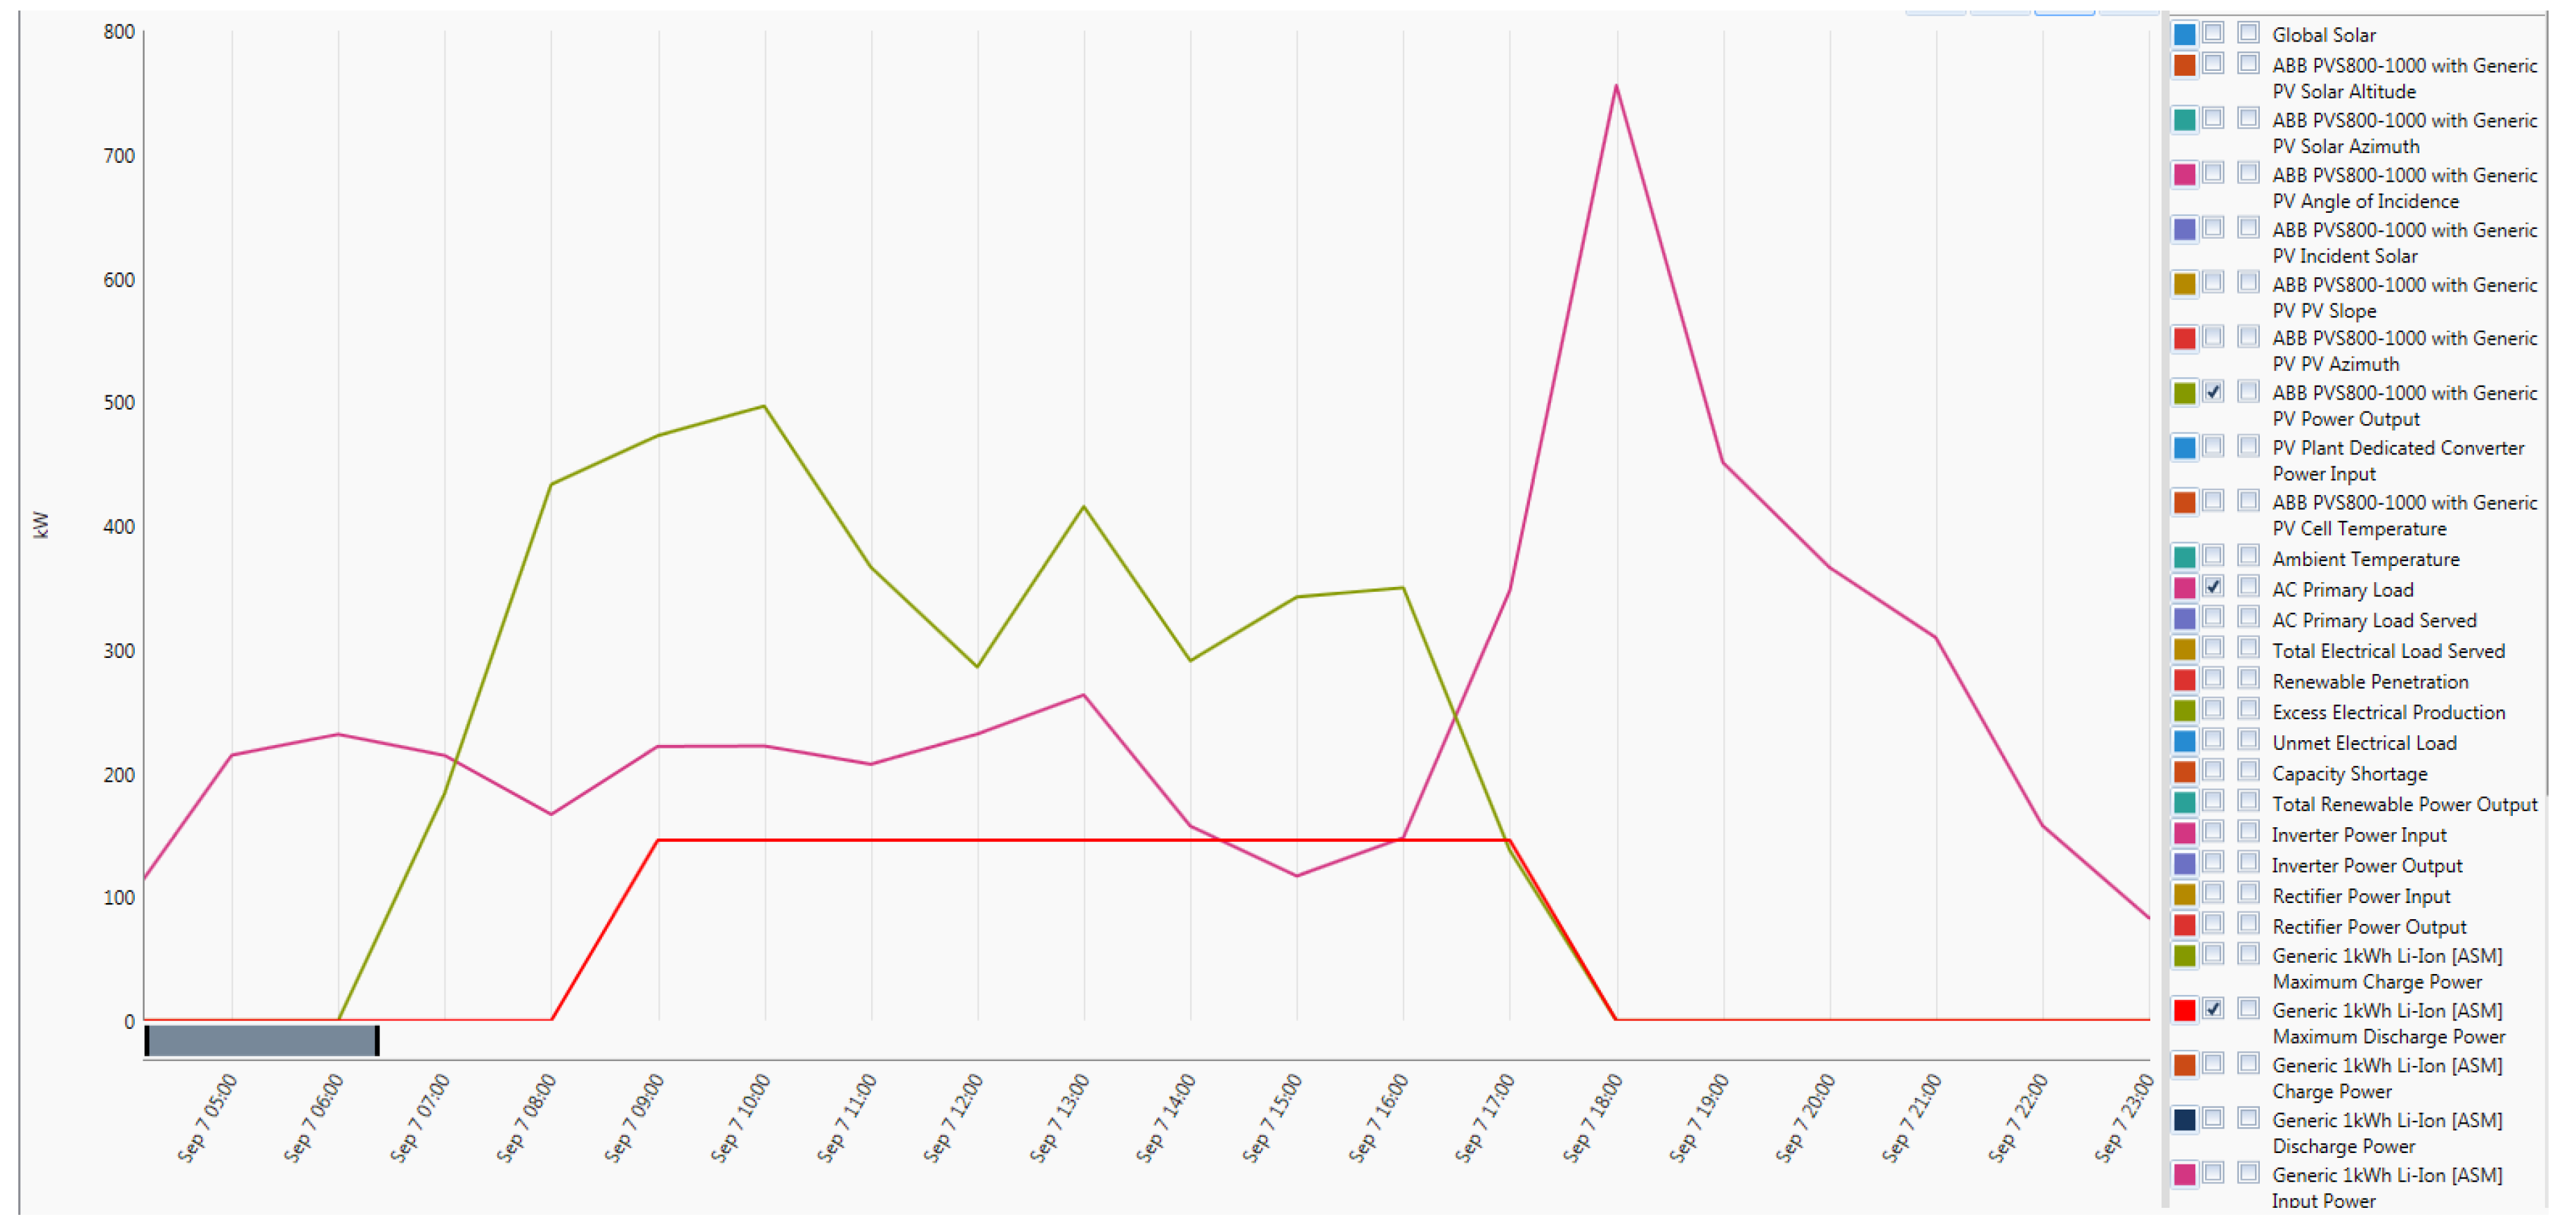
The system is rather smaller than the two previous case studies; PV output is rated at 500 kW with a maximum demand of 1000 kW. Figure 32 and Figure 33 above illustrates how PV will supply the load throughout the year with a storage facility of 20%. Previous case studies indicated the beginning and middle of the year, which are summer and winter. Case studies 5 and 6 will focus on springtime which is in September. PV plant behaviour is not changed by the loading or plant scaling; it will continue to supply the load at times when there is available sun and will switch off at night. Since the simulation was based on the Cape Town area, the sun in the springtime is usually up at 7 am and set at 19:00 as shown in Figure 32, that is usually from 5 am till 6 pm South African time. At night time there will be no power supplied to the load. On some days the output is not smooth throughout the day. As per Figure 33, there are two occasions where storage is required to supplement the PV: between 6 and 10 am as well as between 6 and 8 pm. In this scenario, PV would produce excess energy during the day, which may allow the charging of batteries. This means that batteries can be used more at night since there is enough power to charge during the day in this scenario.
As seen in Figure 34:
- PV power output is drawn in a green line in the graph;
- The load is drawn in purple in the graph;
- Maximum discharge battery output is the red line in the graph; and
- The operating discharge output is the blue line in the graph.
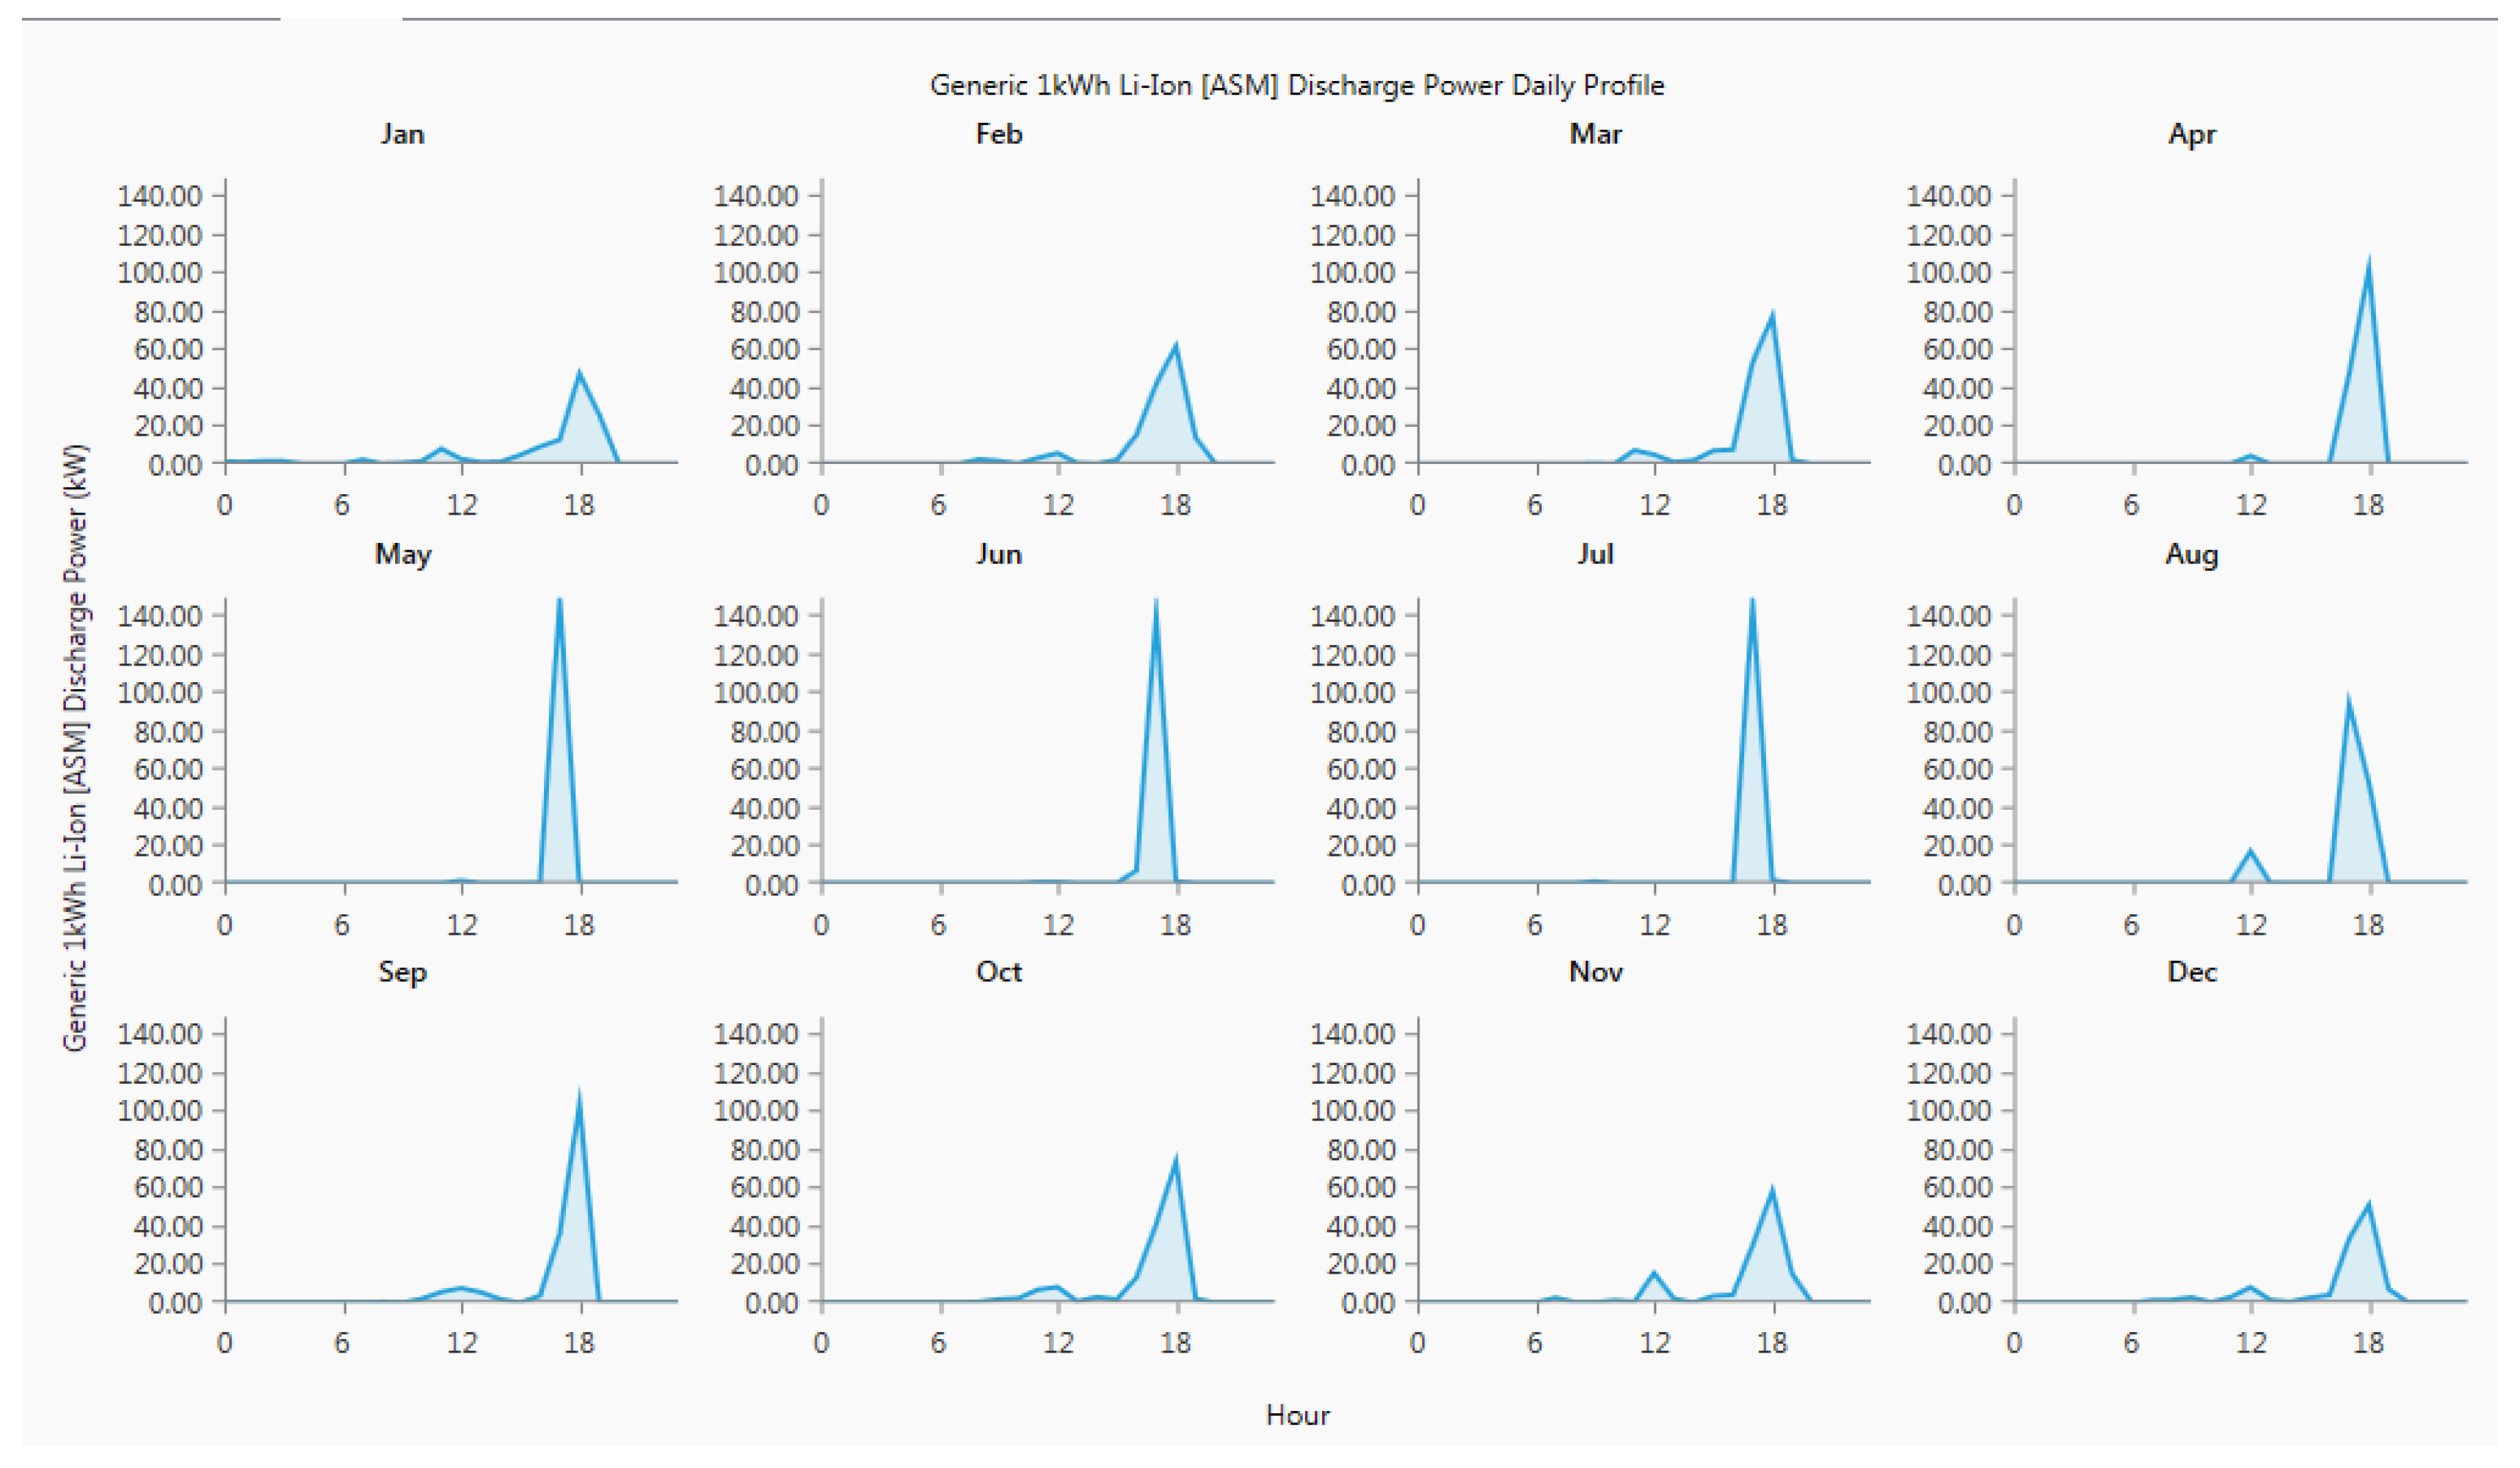
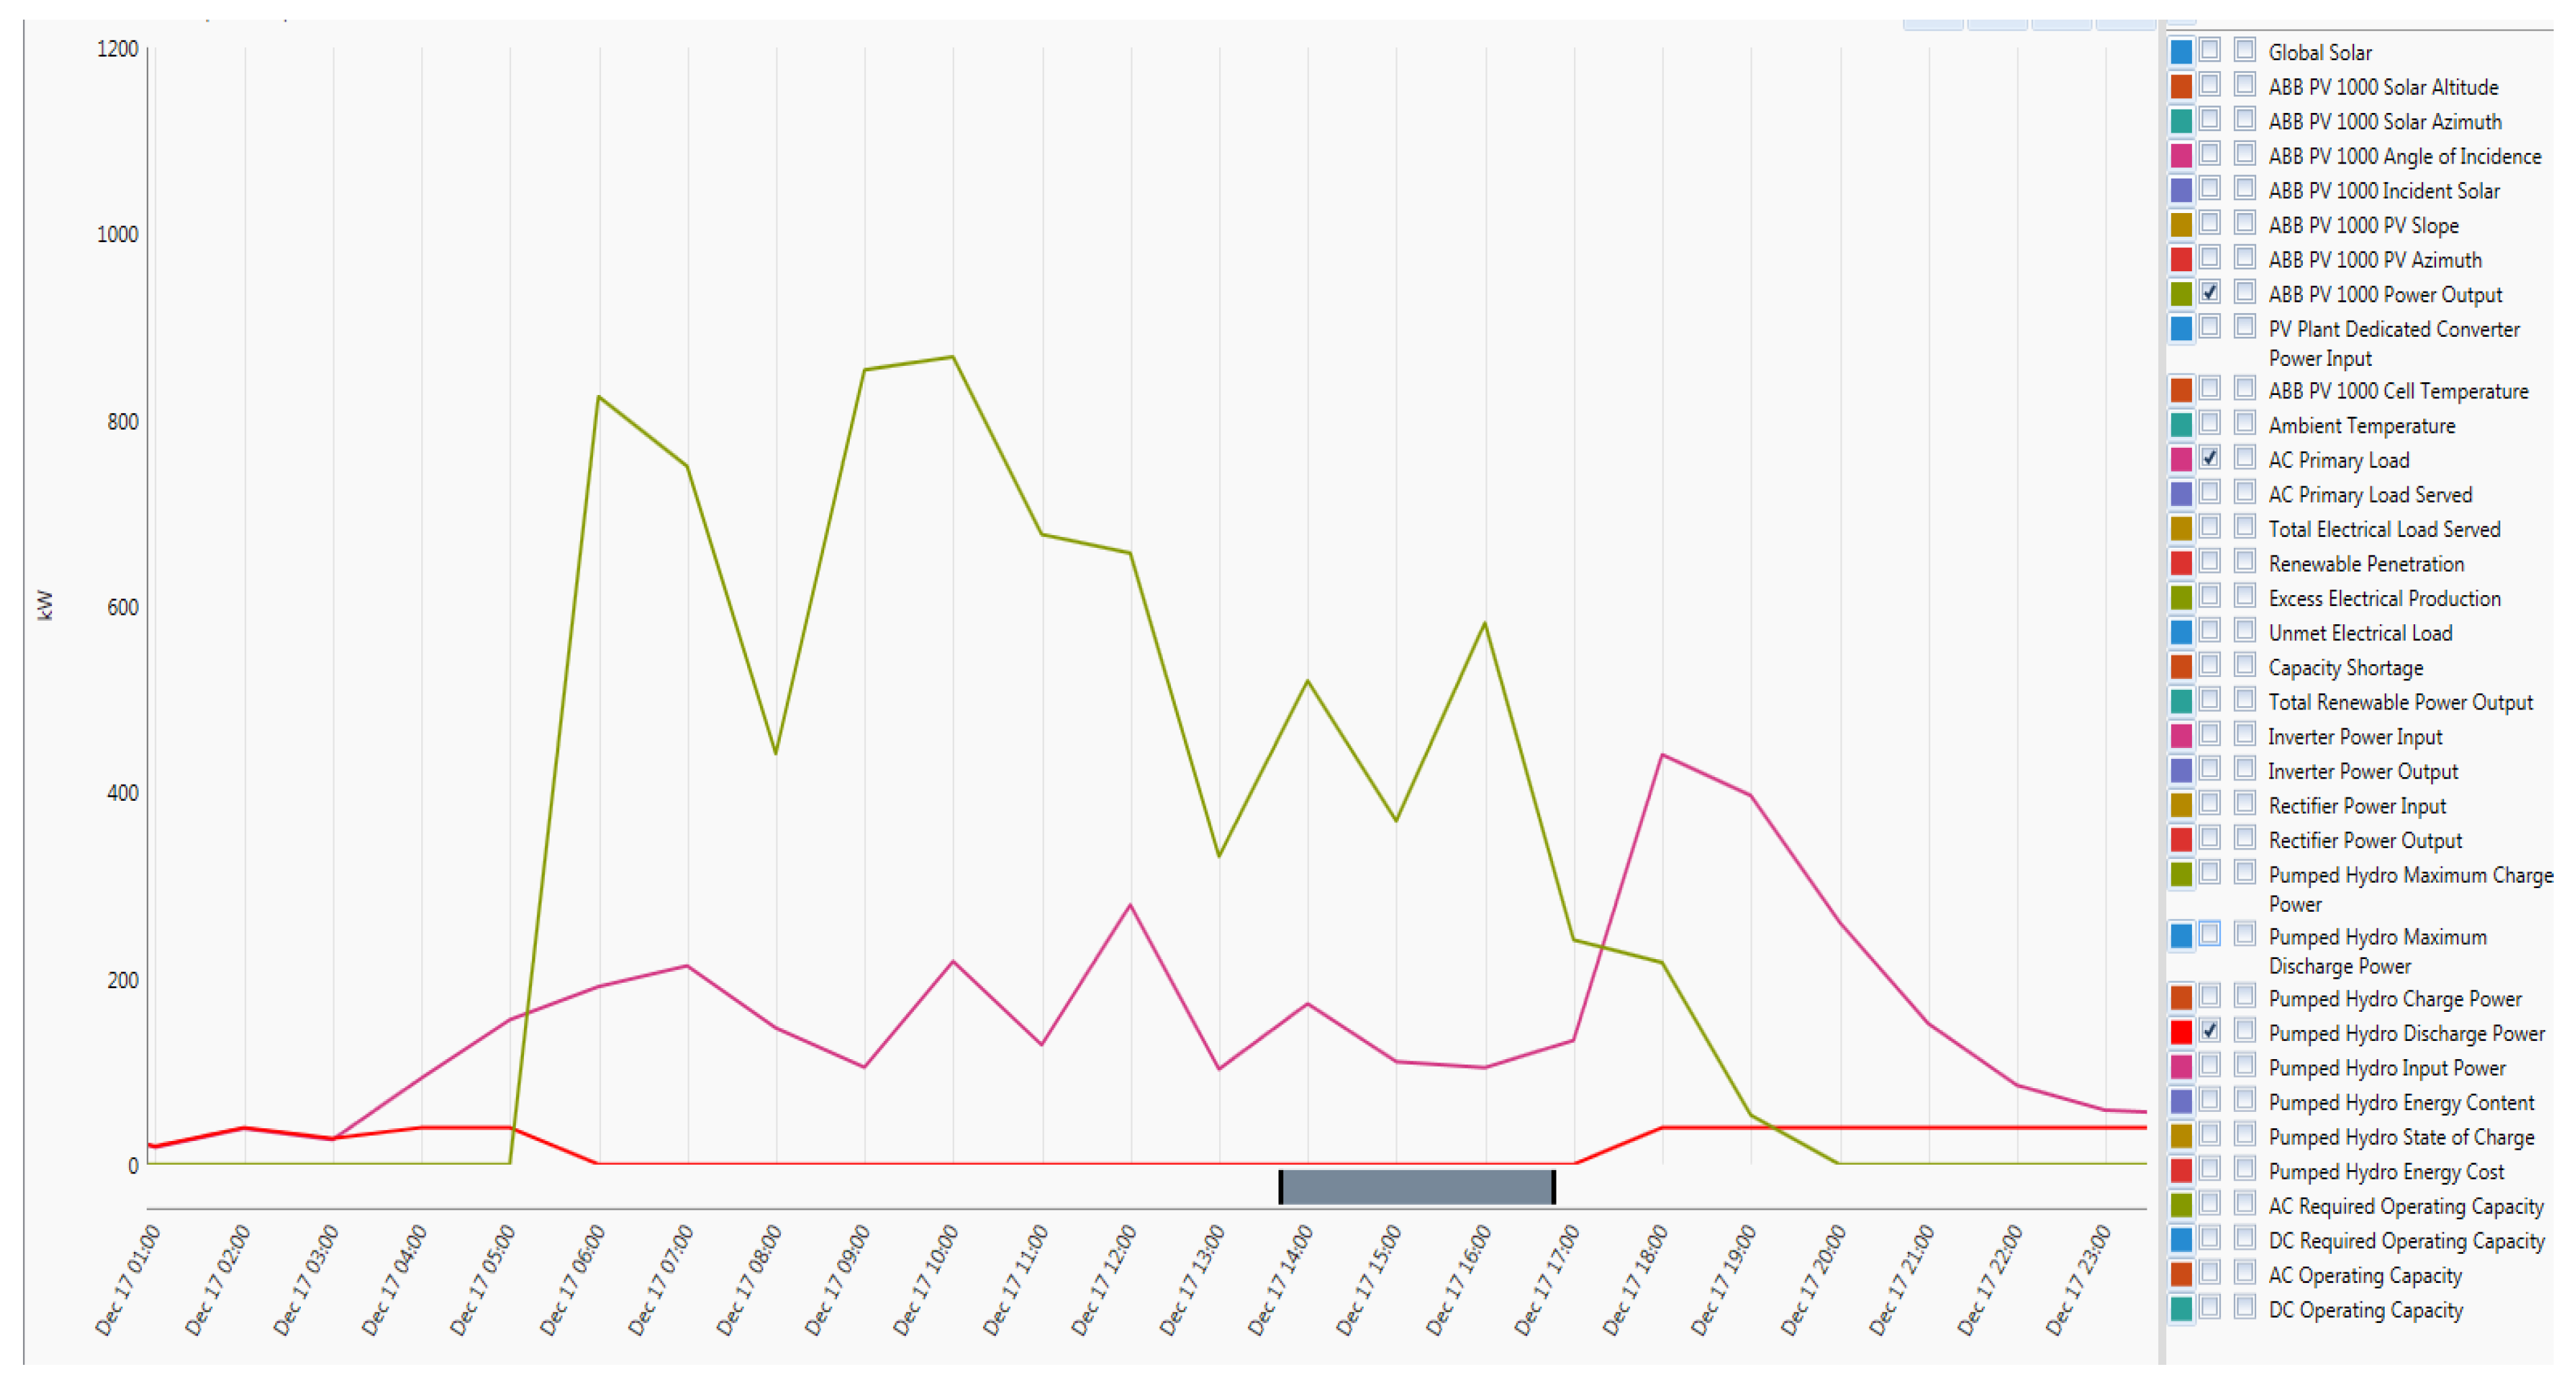
Analysing the two graphs below (i.e., Figure 34 and Figure 35), it can be seen that PV output starts increasing from 5 am and peaks at 10 am with an output power of 460 kW. The unmet and fluctuating load has remained present for a few hours during the day and 11 h at night. Li-ion Battery banks are available and can be discharged from 9 am if required as shown by the red graph line, but this does not occur since at the time PV is at peak and can manage the load until 11 am. The battery line in the graph reveals that the maximum available storage that can be discharged is 145 kW. The blue graph line showing the operating battery storage operation, where there will be no discharge from batteries throughout the day until such time where the load is greater than PV output. That scenario is seen between 11:00 and 13:00 in the morning to the afternoon. Then again between 15:00 and 17:00. After 17:00, peak load starts, battery power is already utilised during the day and can no longer be used, and PV output is also declining since it is sunset. Looking into peak load at 12:00, PV is peak 358 kW; load is 423 kW while the storage supply is peak 69 kW. Storage battery percentage overload = 69/423 = 16% peak. The scenario will be repeated daily throughout the year with different seasons as per with respective to load profile graphs in Figure 36 and battery discharge power in Figure 37 below.
4.7. PV-Battery Plant Off-Grid Cost Analysis
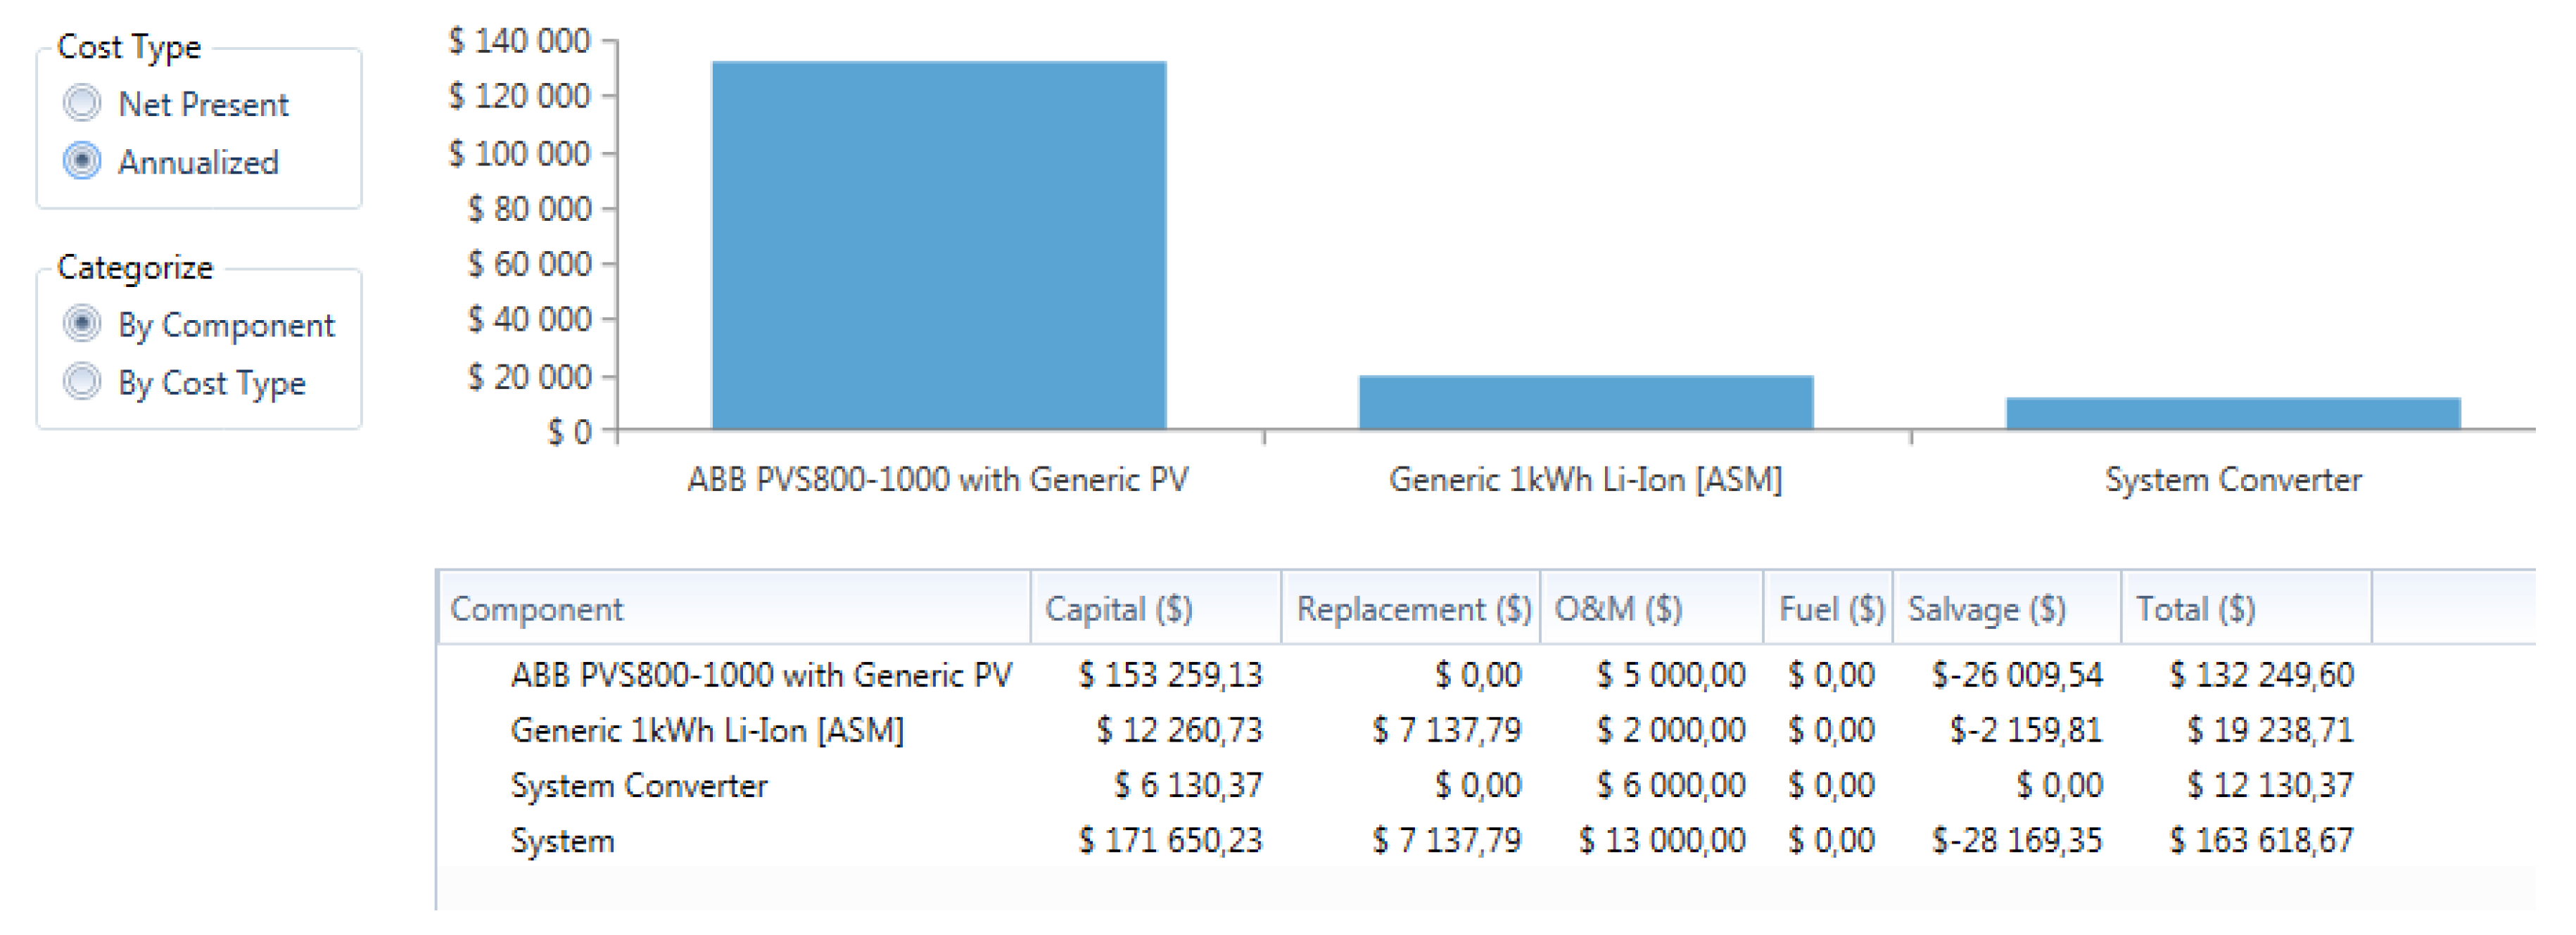
Based on the below results in Figure 38 and Figure 39, it can be seen that having a 1 MW PV power plant with 20% battery storage capacity in the Western Cape will cost approximate Net USD 1.6 million with annual cost of USD 163,000 for a project with the life cycle of 25 years. This system is technically excellent and may require little capital to build it. This system is 100% renewable with 20% battery storage capacity. However, the return on investment is very low at −0.7%. This then may be too expensive to construct because of no return on investment. However, it can be used as a base for smaller systems/plants. Since the system is off-grid, the number of batteries can be reduced or increased as required.
The difference between using a system with no storage on the same system is only USD 400,000.
4.8. Scenario 6: 1 MW Load, PV Plant and 20% Pump Storage Plant
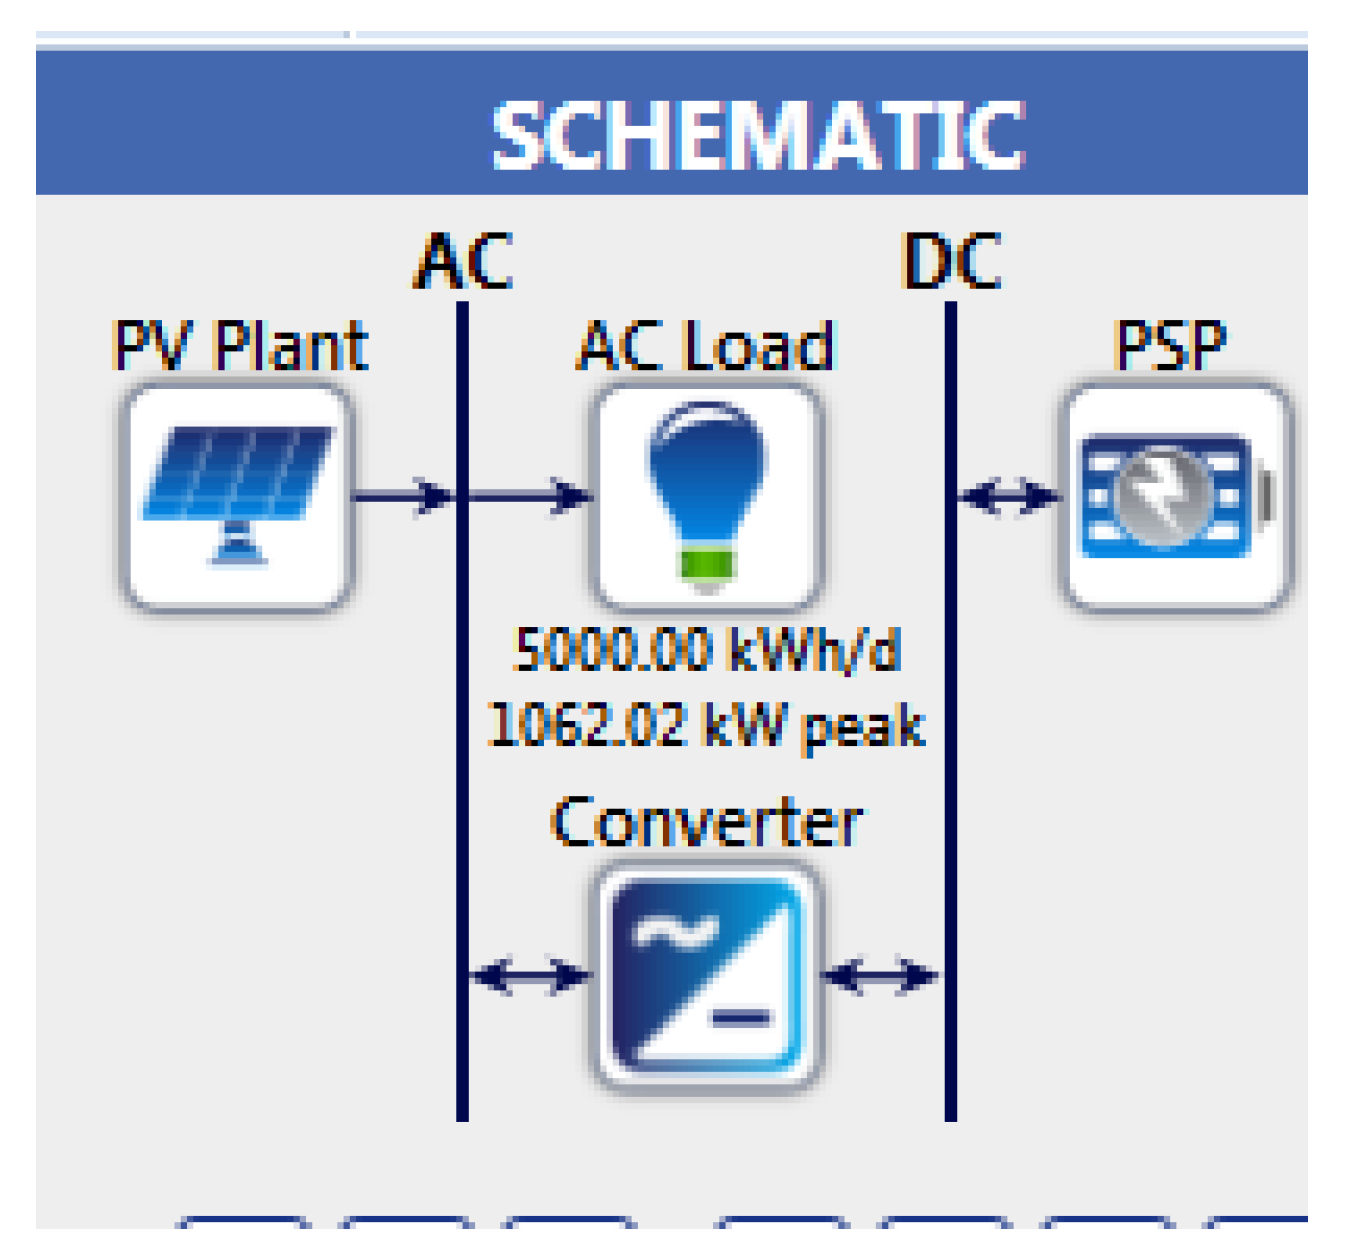
The PV plant and the load used in the previous section of this chapter was decreased to match the 1 MW load. Storage batteries are very flexible in terms of where they can be used (different locations). Any location will work, unlike the pumped storage where it is restricted to areas where there is a huge volume of water and high altitudes. For this study, as mentioned, we assumed the optimal location for pump storage is Palmiet in the Western Cape. Figure 40 shows schematic diagram of scenario 6.
- is the Dam Capacity (upper and lower) to be calculated.
- is the time required to discharge and restore water to upper dam = 12 h, since this water had to be available for electrical production the next day.
- is the effective head = 150 m
- is the Generator efficiency = 90%
- g is the gravitational force = 9.81 m/s2
- is the Discharge rate/flow = 0.03 cubic metres per s.
Since load was already known, some of the above were assumed to be able to calculate the amount of water or dam capacity to meet the load demand.
is the Peak load = 1 MWh
PPS rating to be 20% of the load, it is 200 kWh.
Assuming one generator output generation over 12 h to be 245 kW; this will be used only as a baseline. Bigger generators are normally used in real life situations.
Therefore = 1 generator which was enough. One generator of between 200–300 kW could be used or, for maintenance purposes, two generators of 150 kW could be utilised so that total power is not lost, should faults occur or maintenance be required.
Discharging
From Equation (18); to discharge 200 kW in 12 h; Power generated () = 200 kWh/12 h = 17 kW
From Equation (19); mass of water required = = = = 427 m3 water is required.
Charging
Since the same turbine could be used as a pump, as discussed in Chapter 3, the effective head, efficiency and power remained unchanged. Therefore, the flow rate was calculated as follows:
- Using Equation (20); flow rate = = = = 0.0104 m3 per s.
- Using Equation (21); time required to refill the upper dam =
Electrical energy required using Equation (22) = 17 kW × 2 h = 34 kWh
Round trip efficiency of the PPS = ratio of discharging electrical energy output to the charging electrical input = 0.2/0.34 = 0.59
Maximum Capacity from (23) = = 833 Amp h.
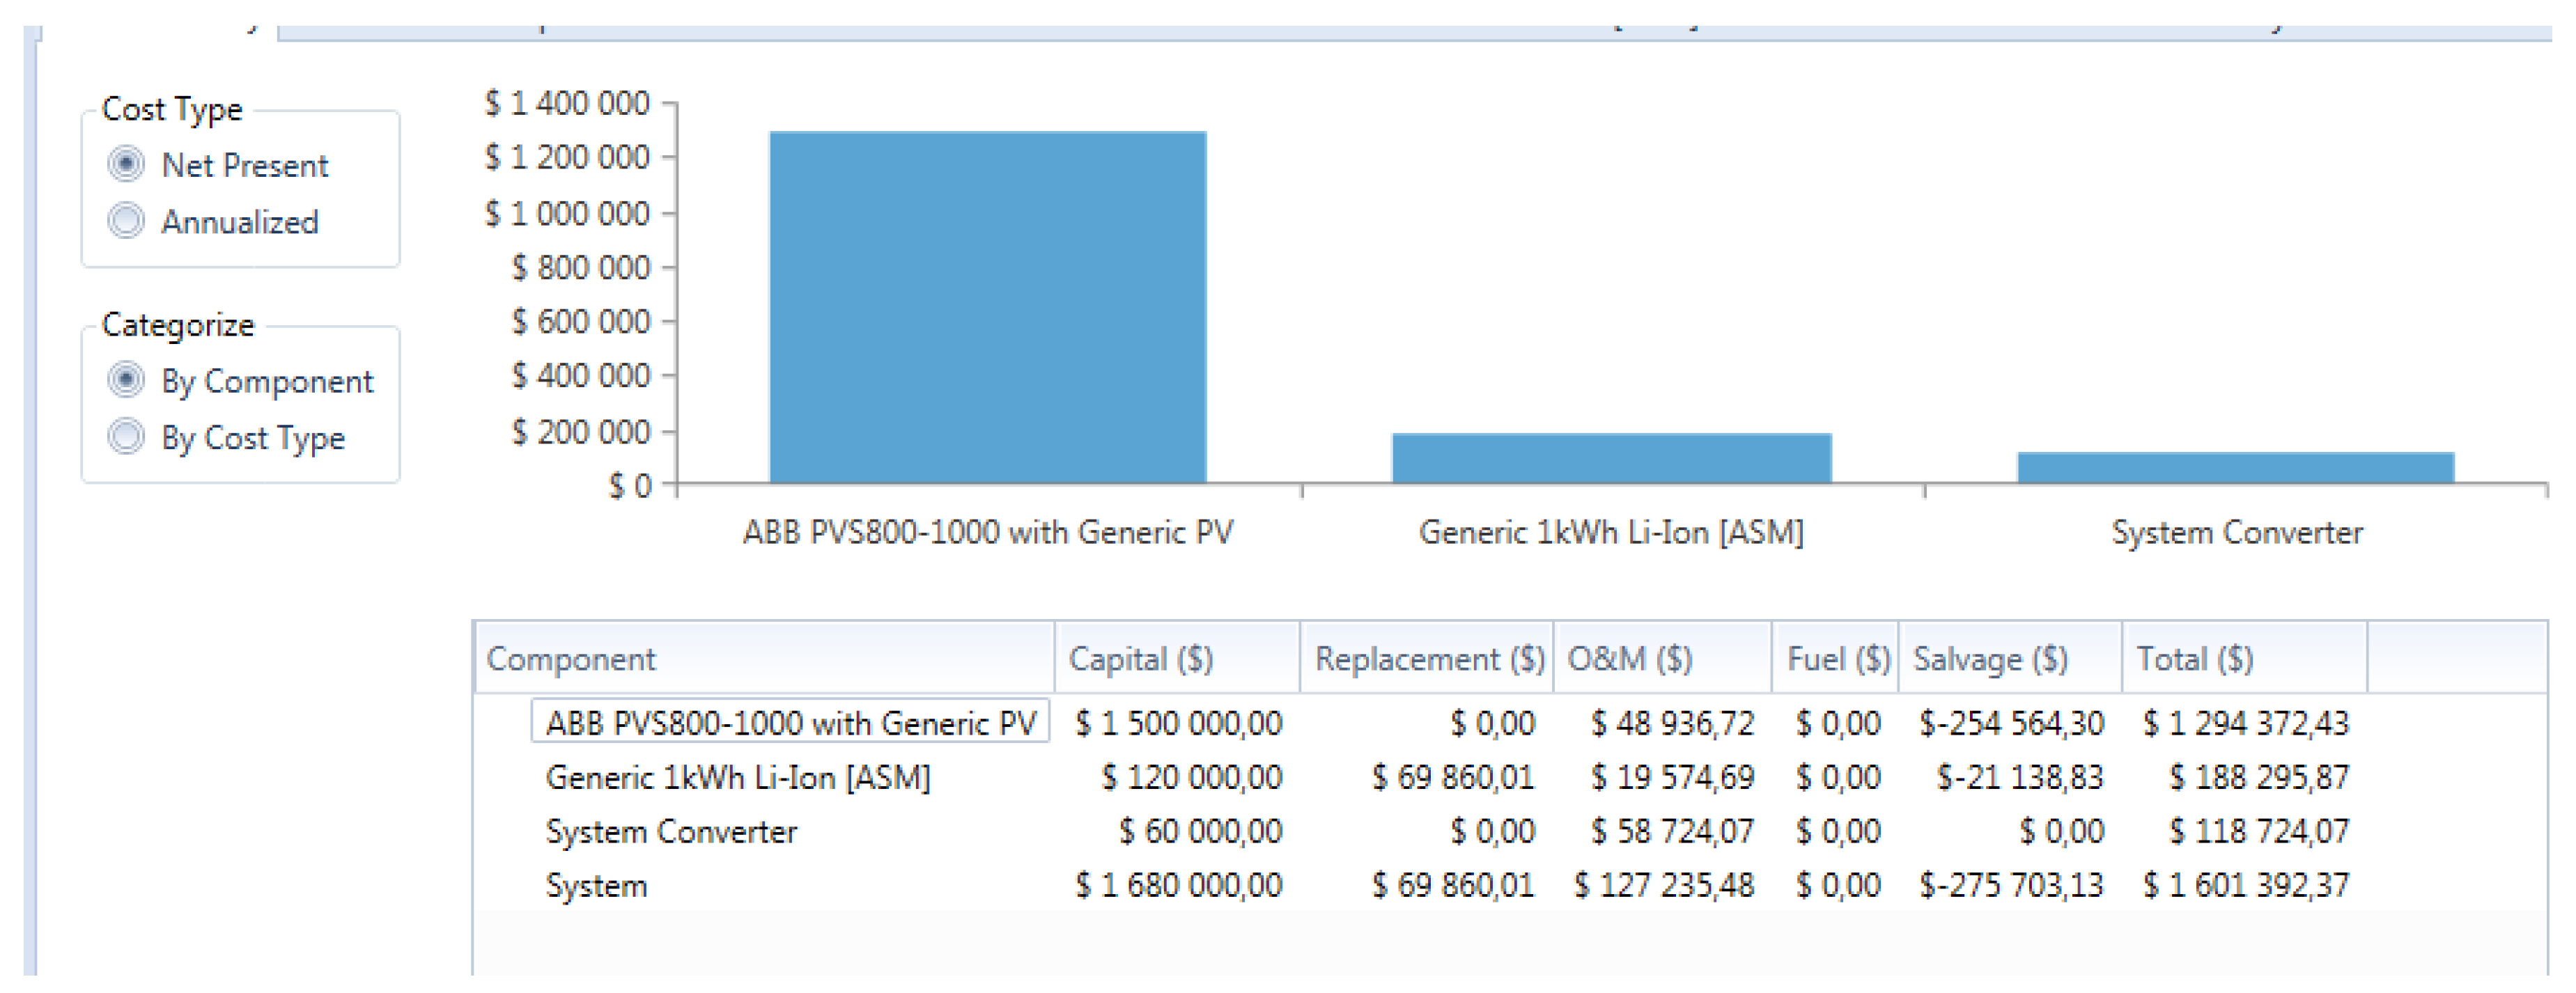
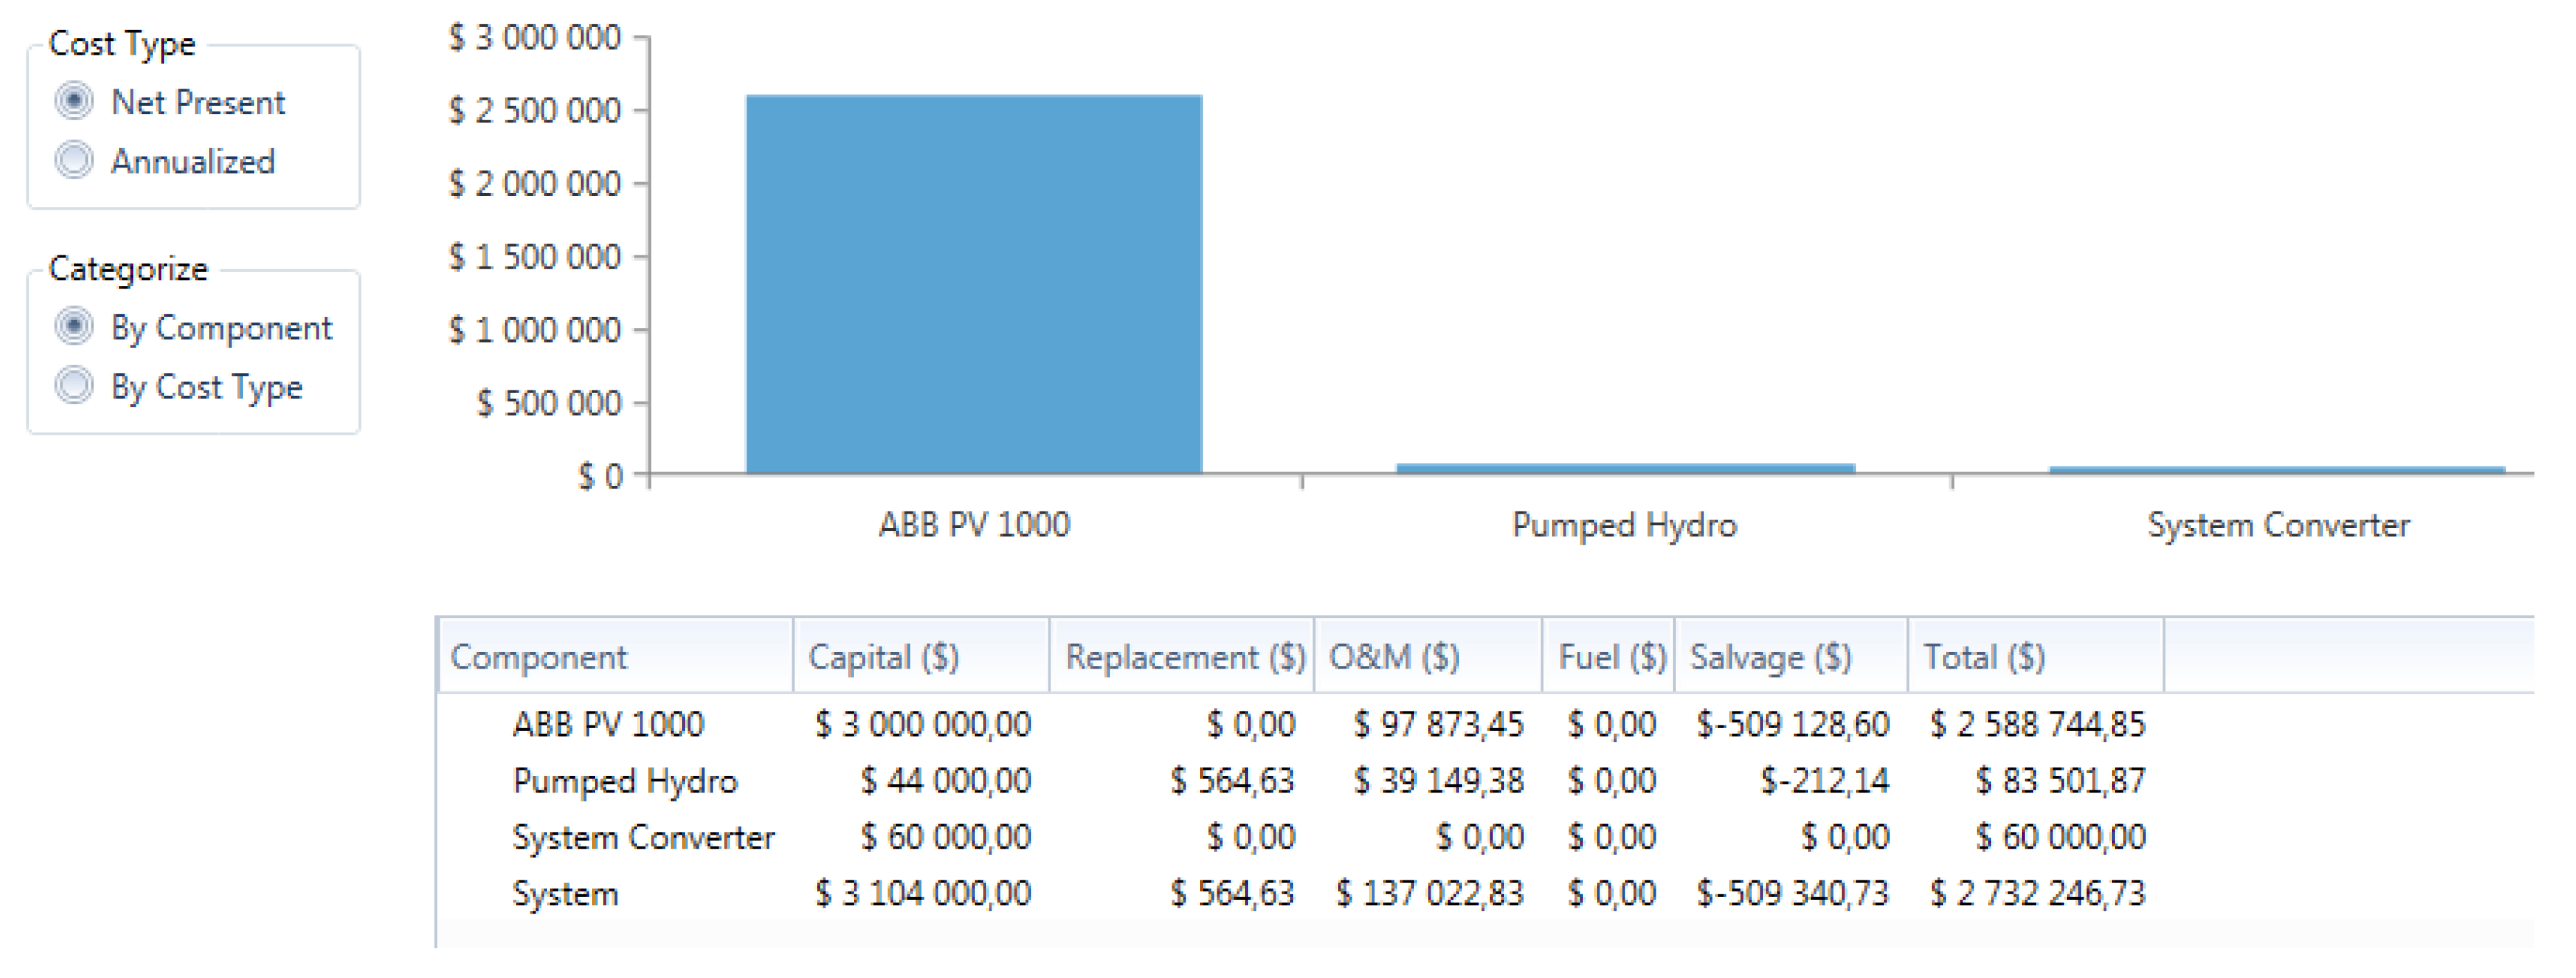
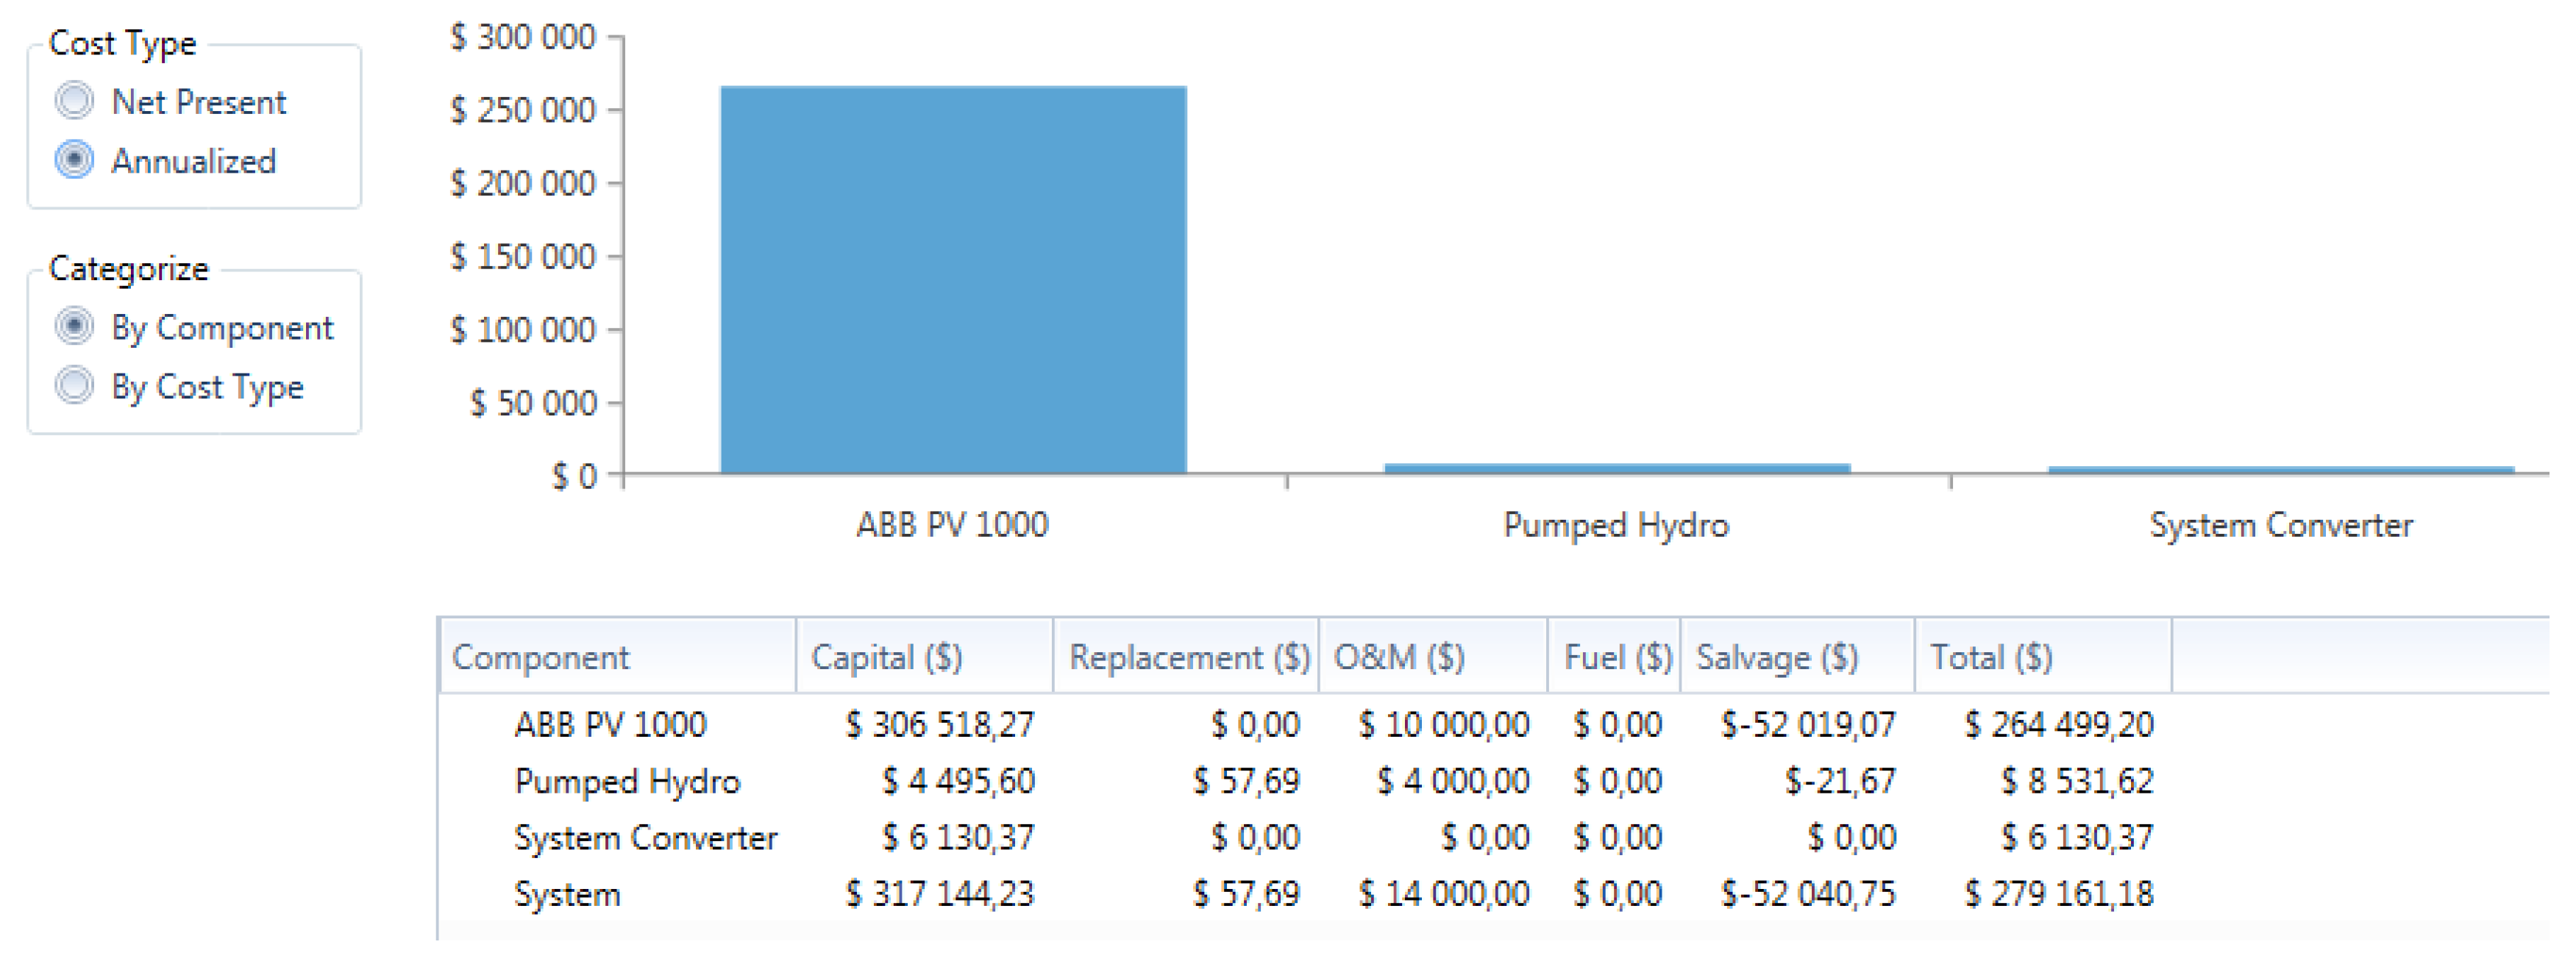
Using pumped storage to supplement the load and rectify the PV also worked as did battery storage; the cost associated with the system at only 20% of storage capacity is just USD 2.7 million as shown in Figure 41. PPS storage cost is higher than when using the batteries on the same system as displayed in Figure 41 and Figure 42. The difference between the two systems is reported in Table 5 below. Based on the cost results, the sole system that can be chosen for the 1 MW plan is storage batteries.
Reading from Table 6 below, it can be seen that the difference between the two components has reduced by reducing the storage capacity. However, the component cost is almost equal to the difference when comparing with case studies 3 and 4. This means that as the storage capacity reduces, the difference in component price also reduces. Though it is much cheaper to build the PPS system than storage batteries as shown on both Table 5 and Table 6.
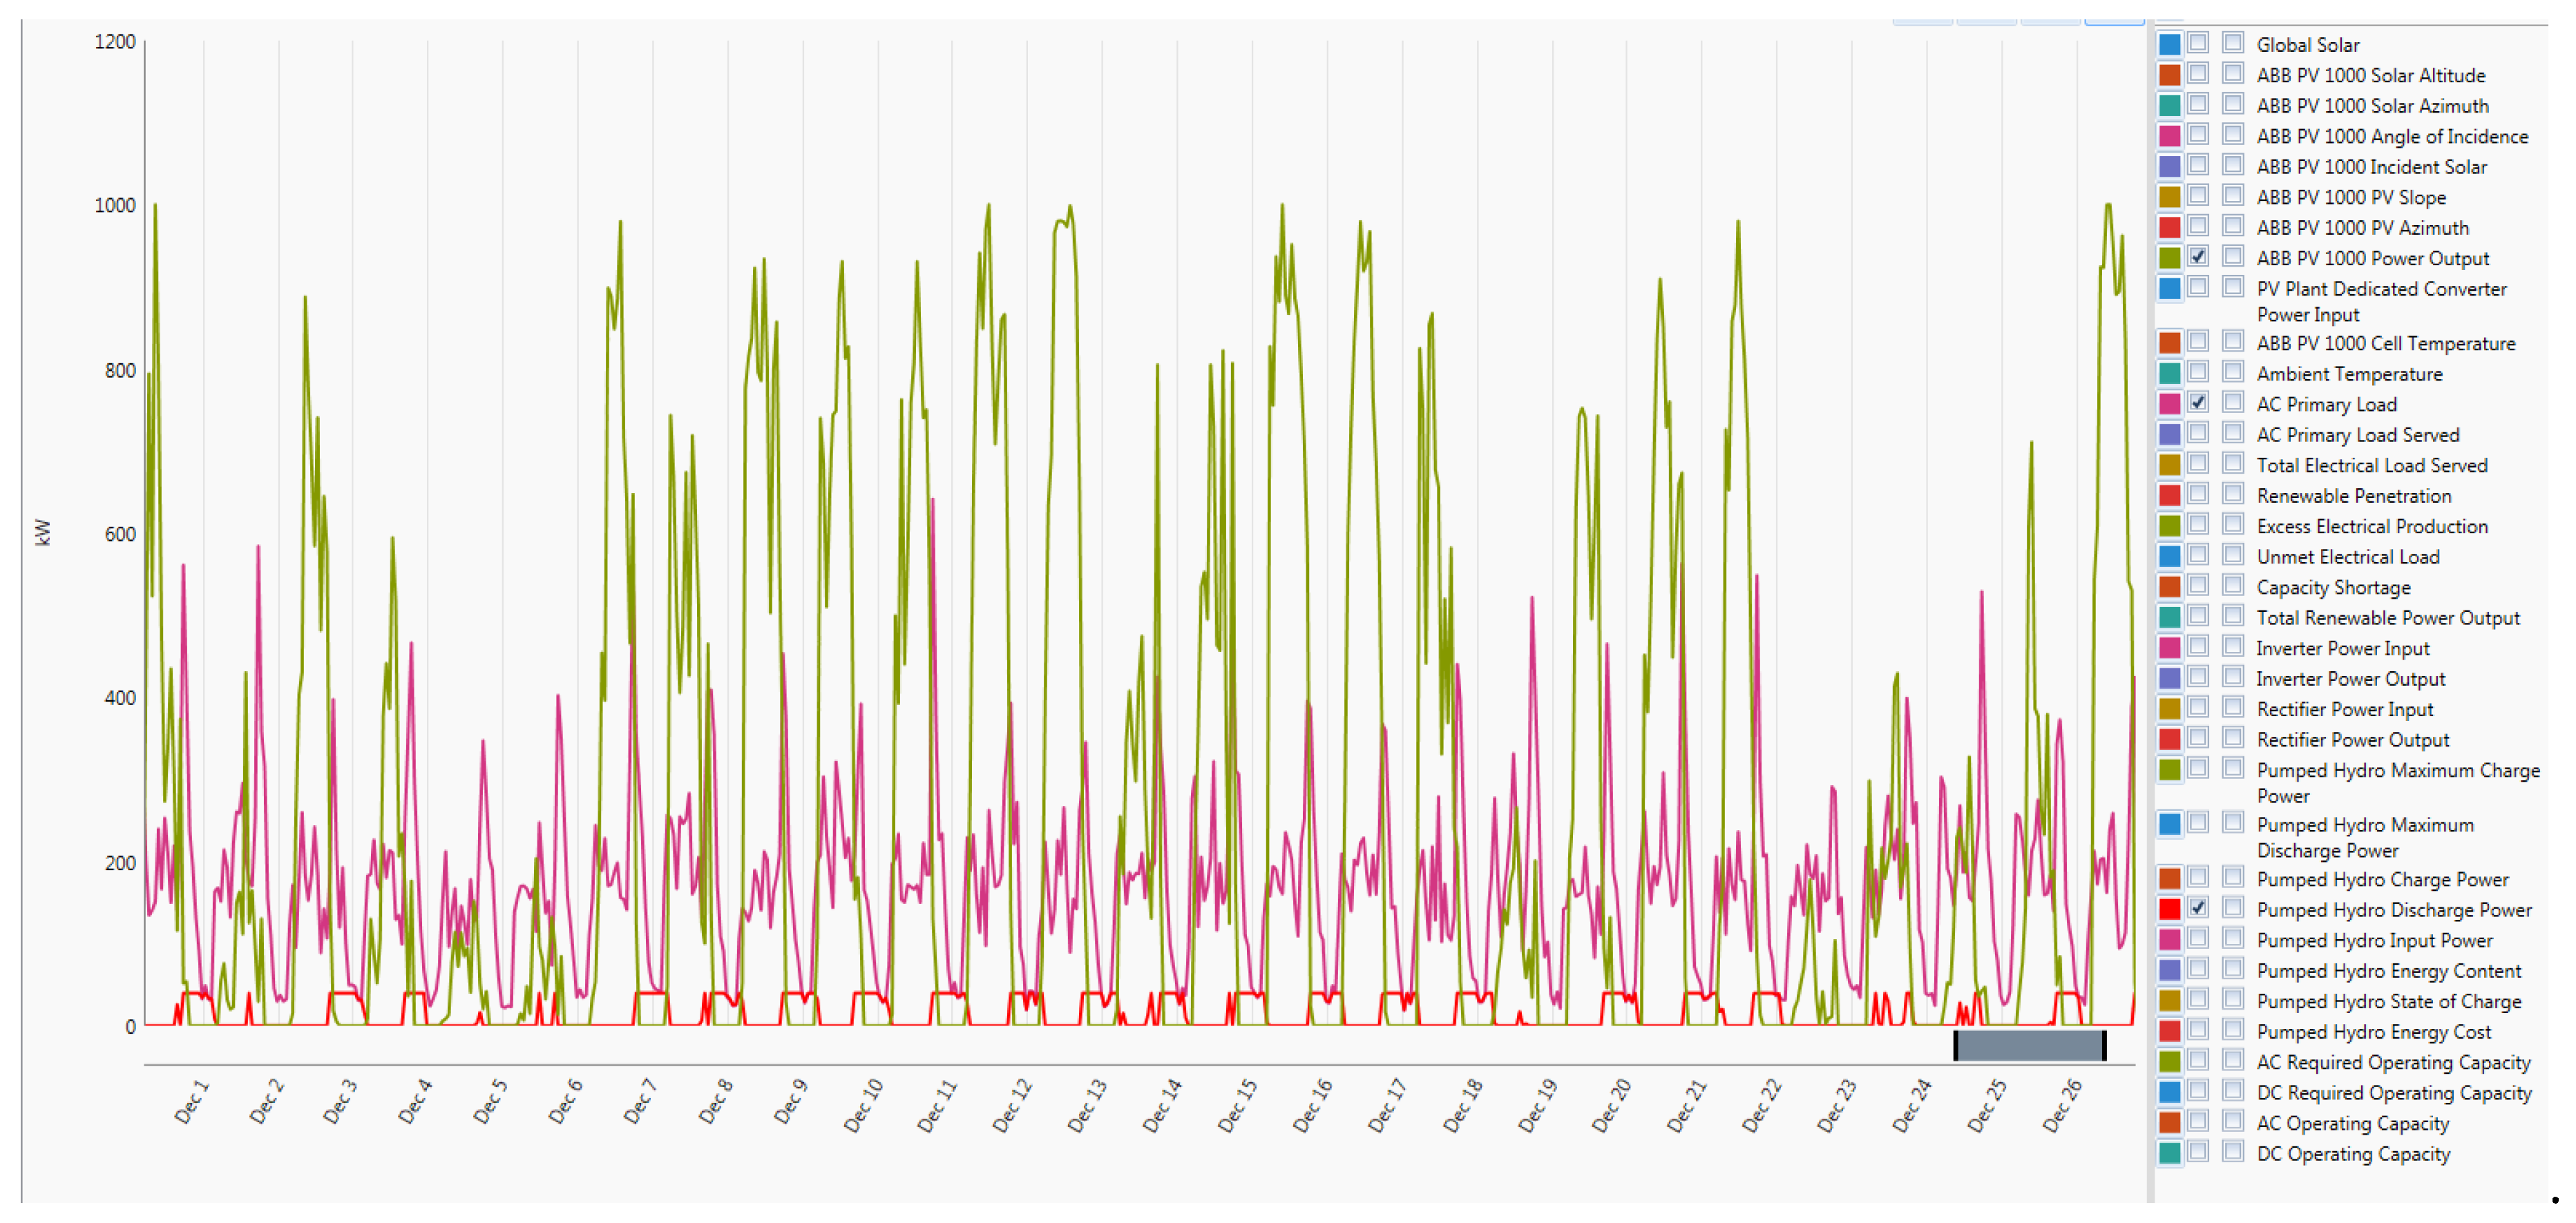
Figure 43 and Figure 44 illustrate the performance of PPS on the 1 MW PV plant. As indicated previously, pumped storage works in such a way that during peak times and night hours, energy can be discharged to supply the load. During the day when the PV is overproducing power, the excess energy can be utilised to pump water back to the upper reservoir. The two figures above demonstrate the same can be used when the storage batteries are in use. In this situation, there is enough energy produced during the day, as shown in Figure 43, to be used as required. The same excess power can be sold to the grid to make profit and returns on the PV plant.
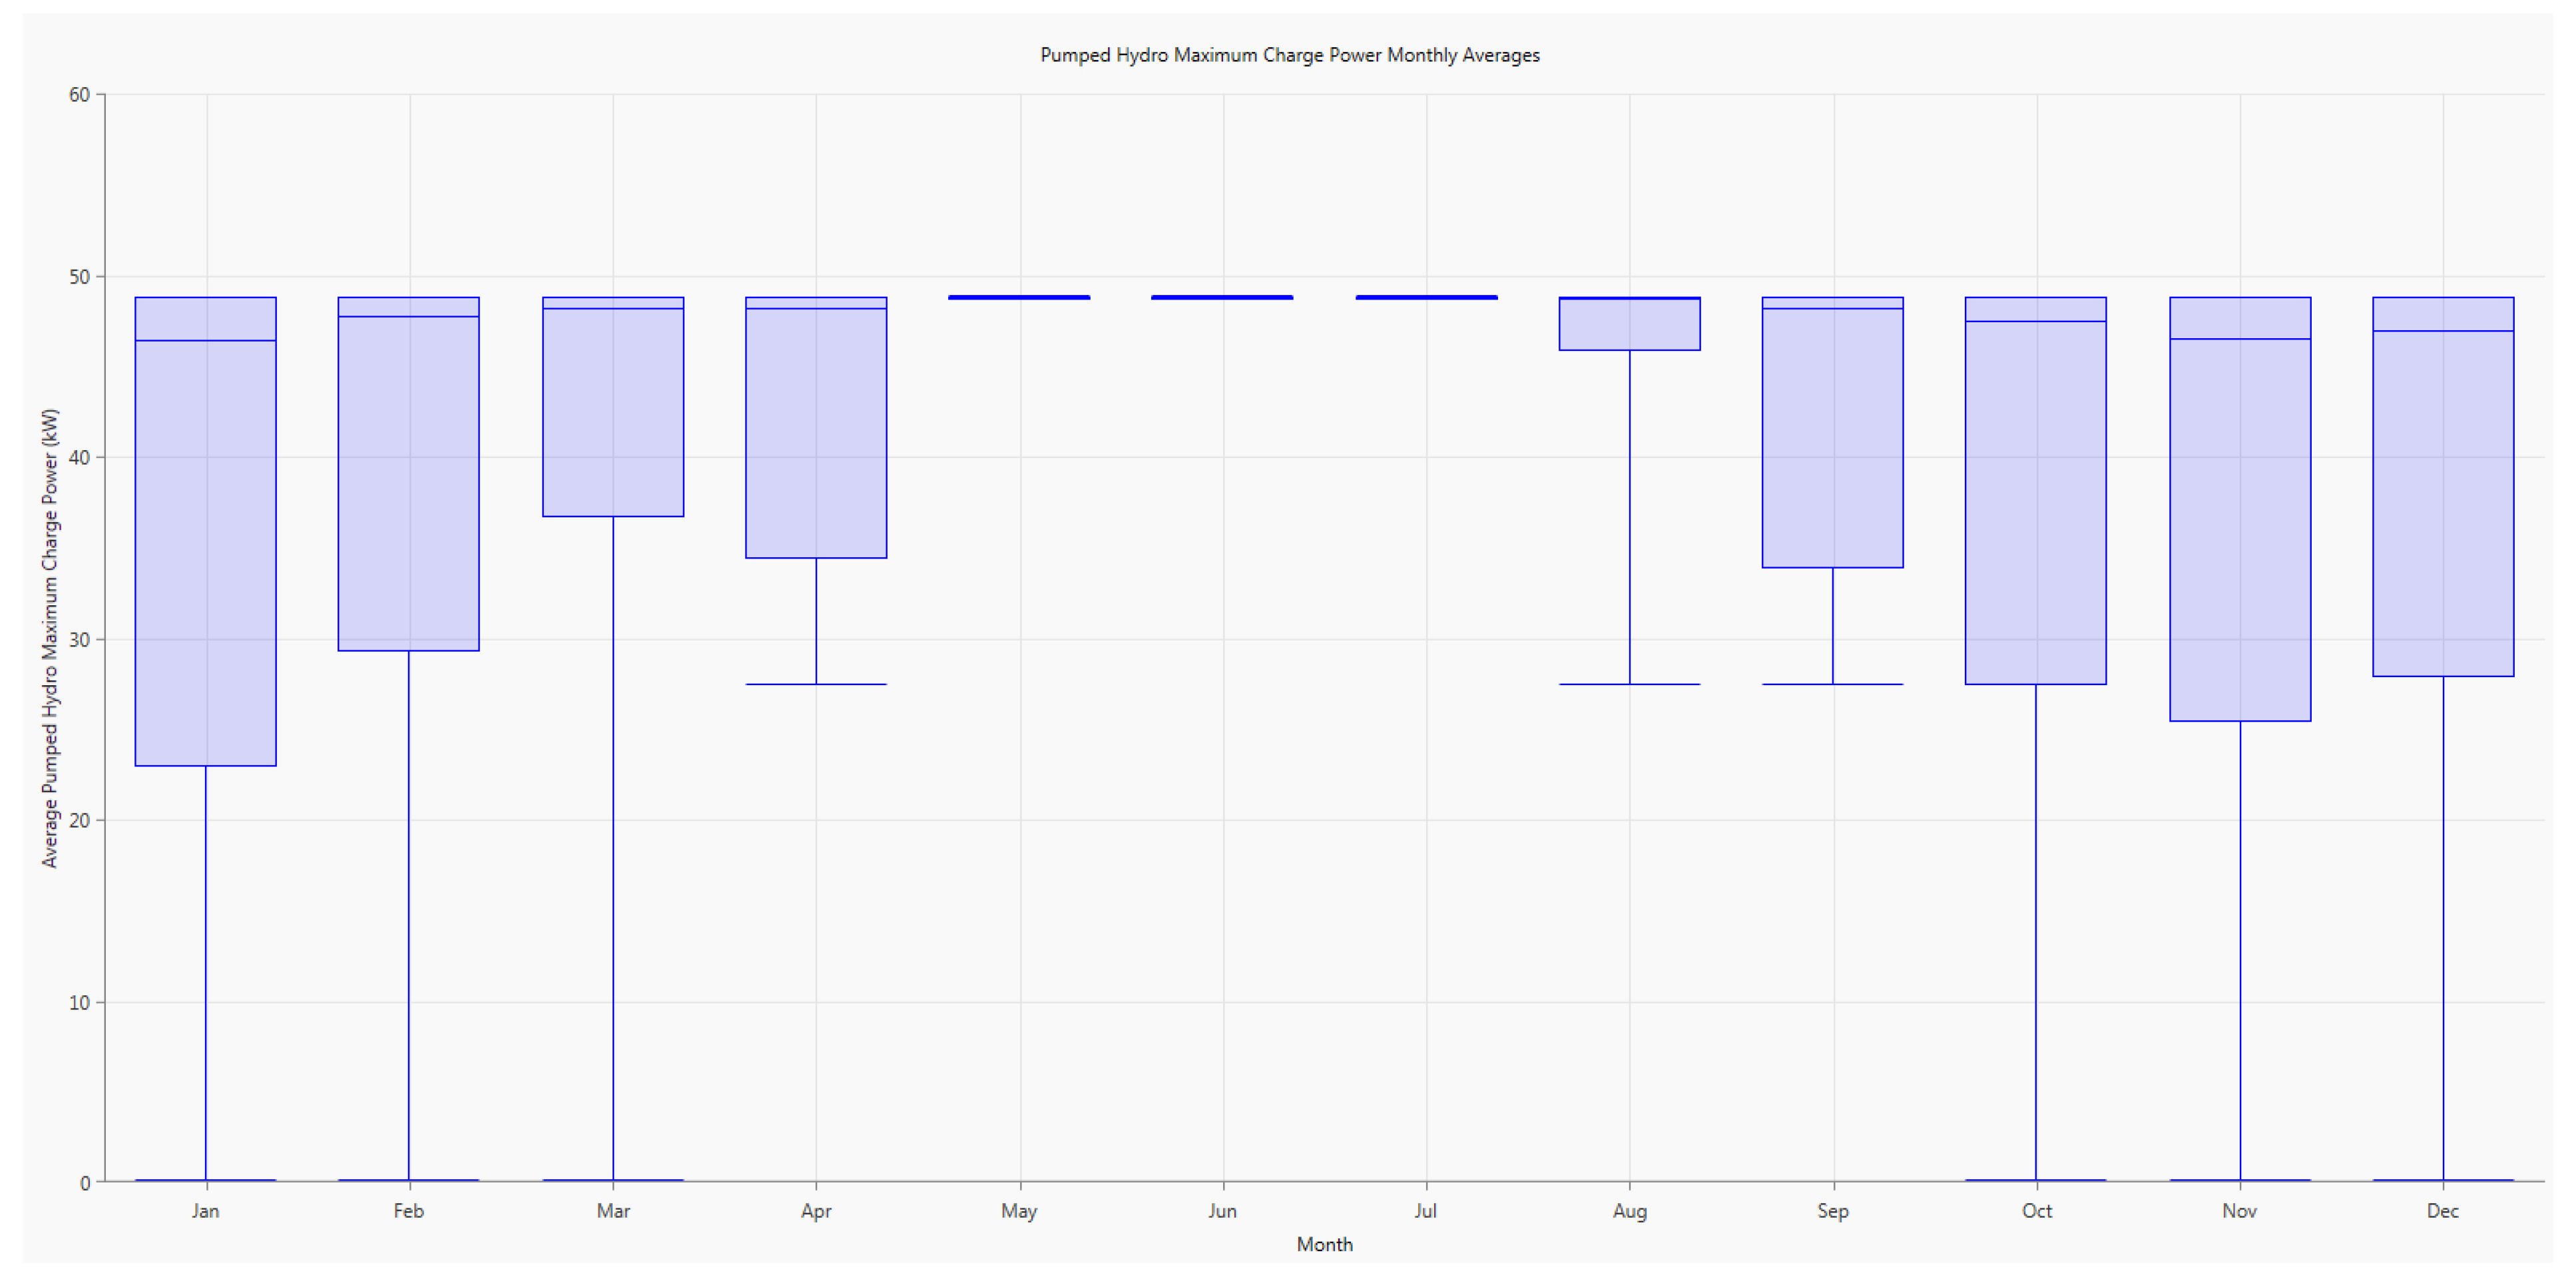
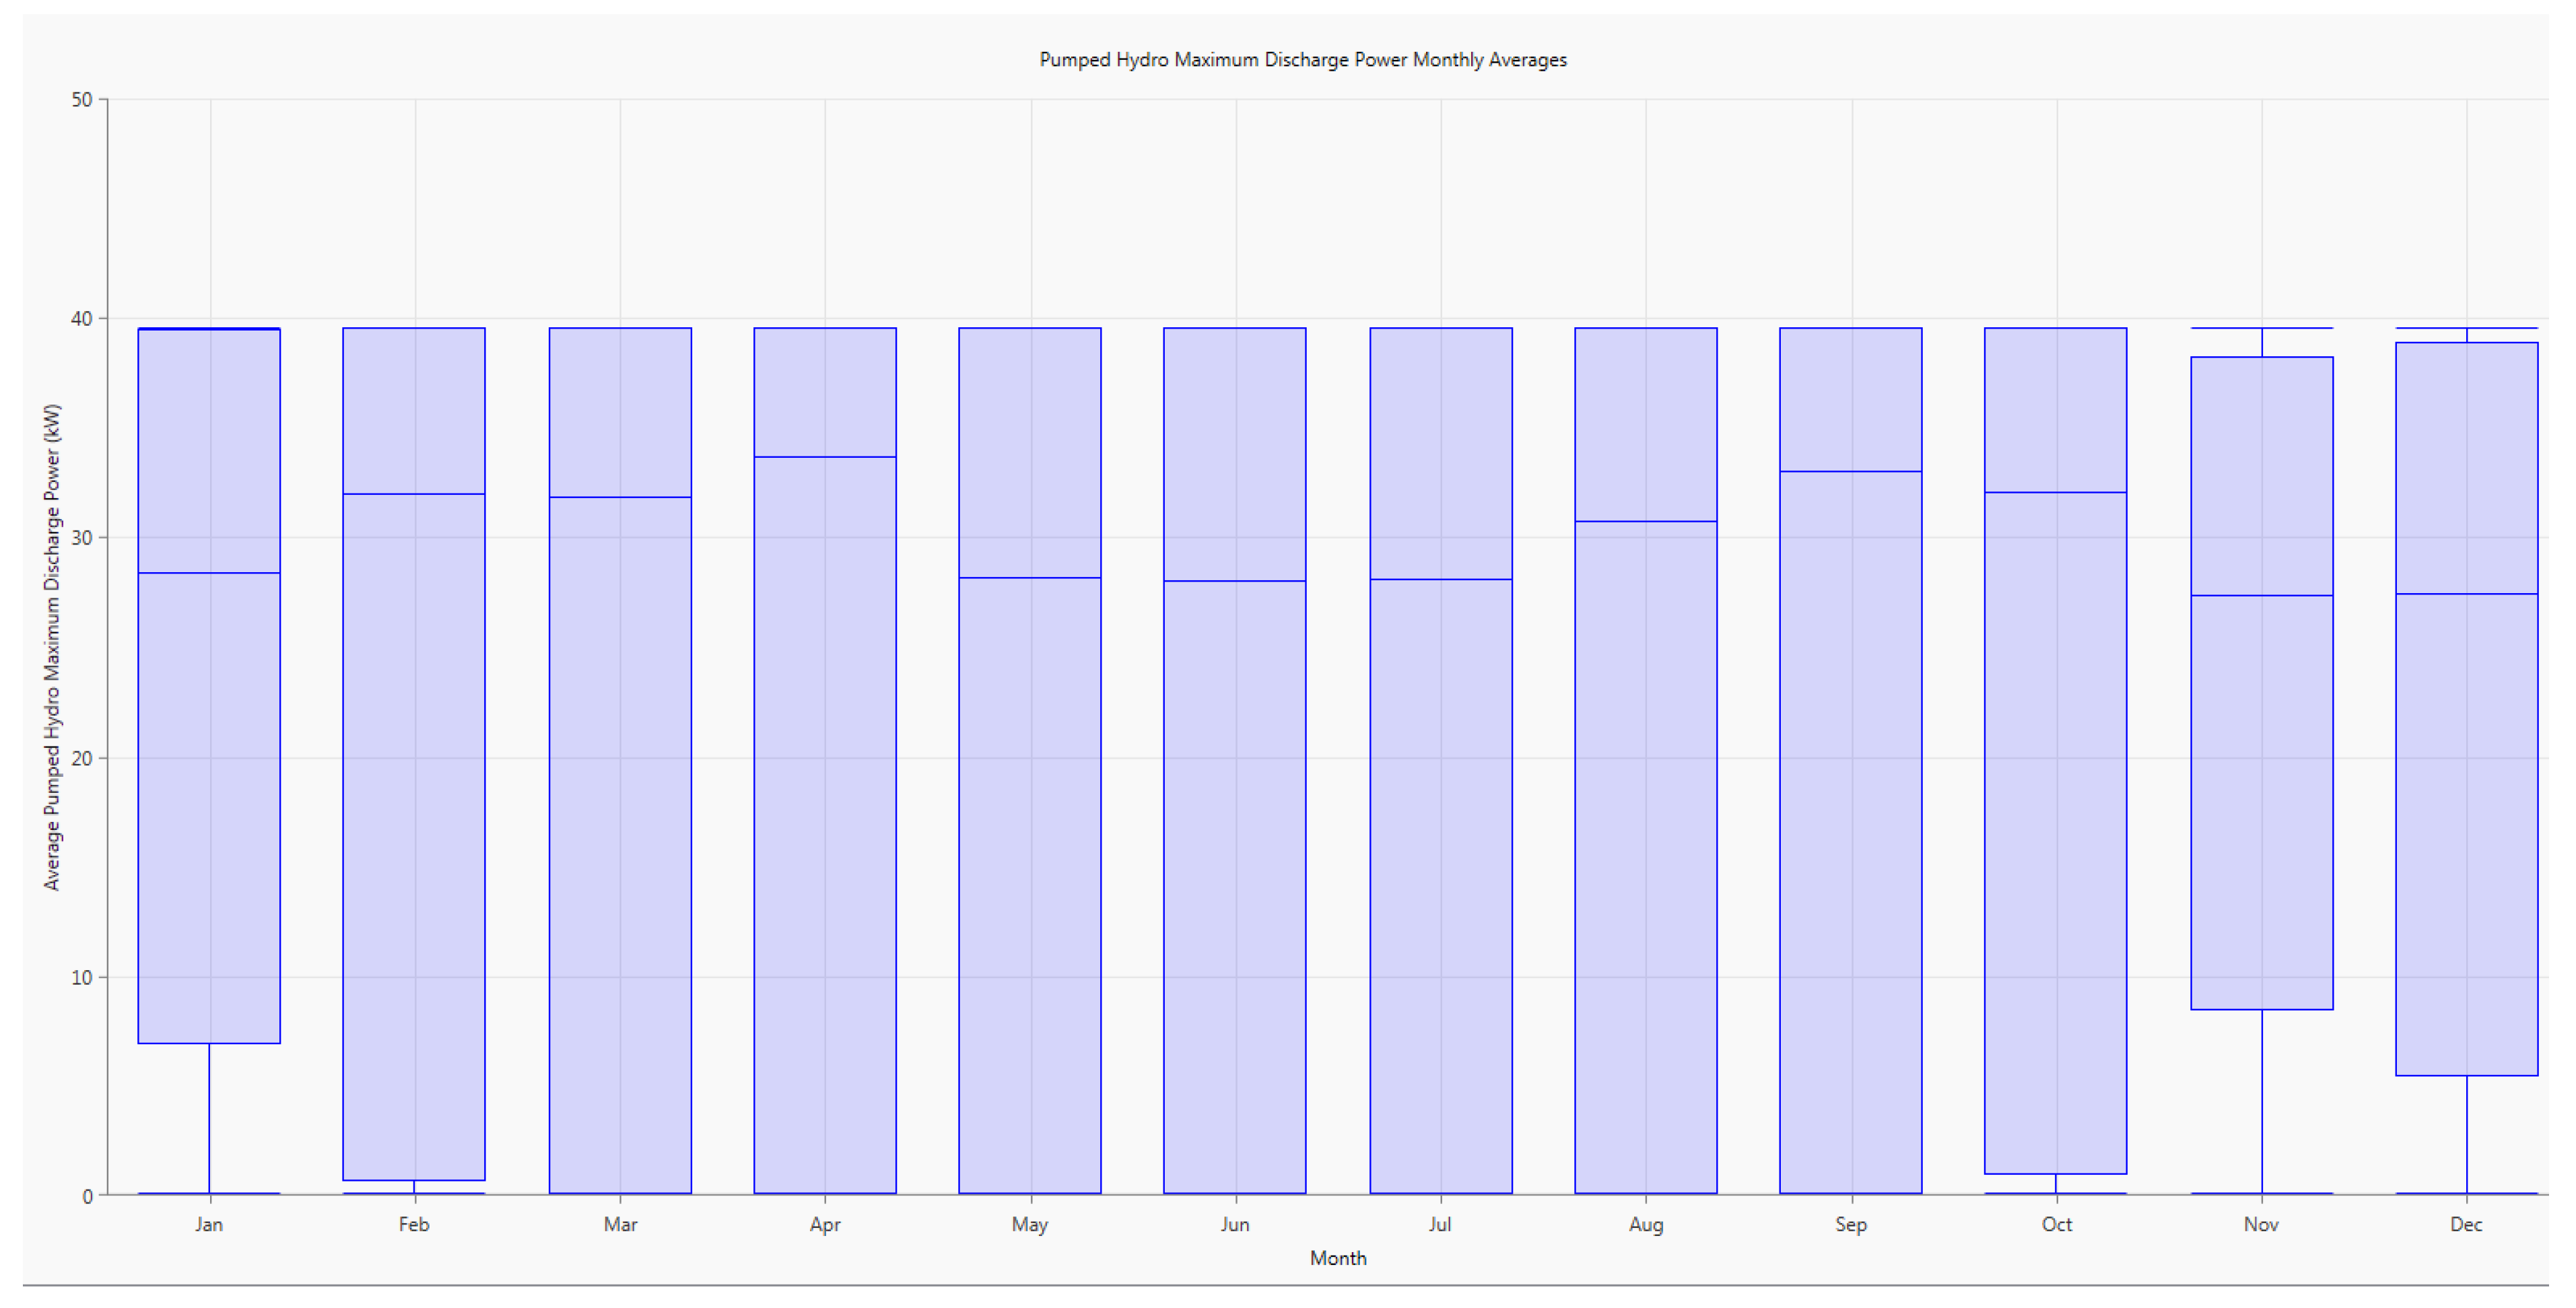
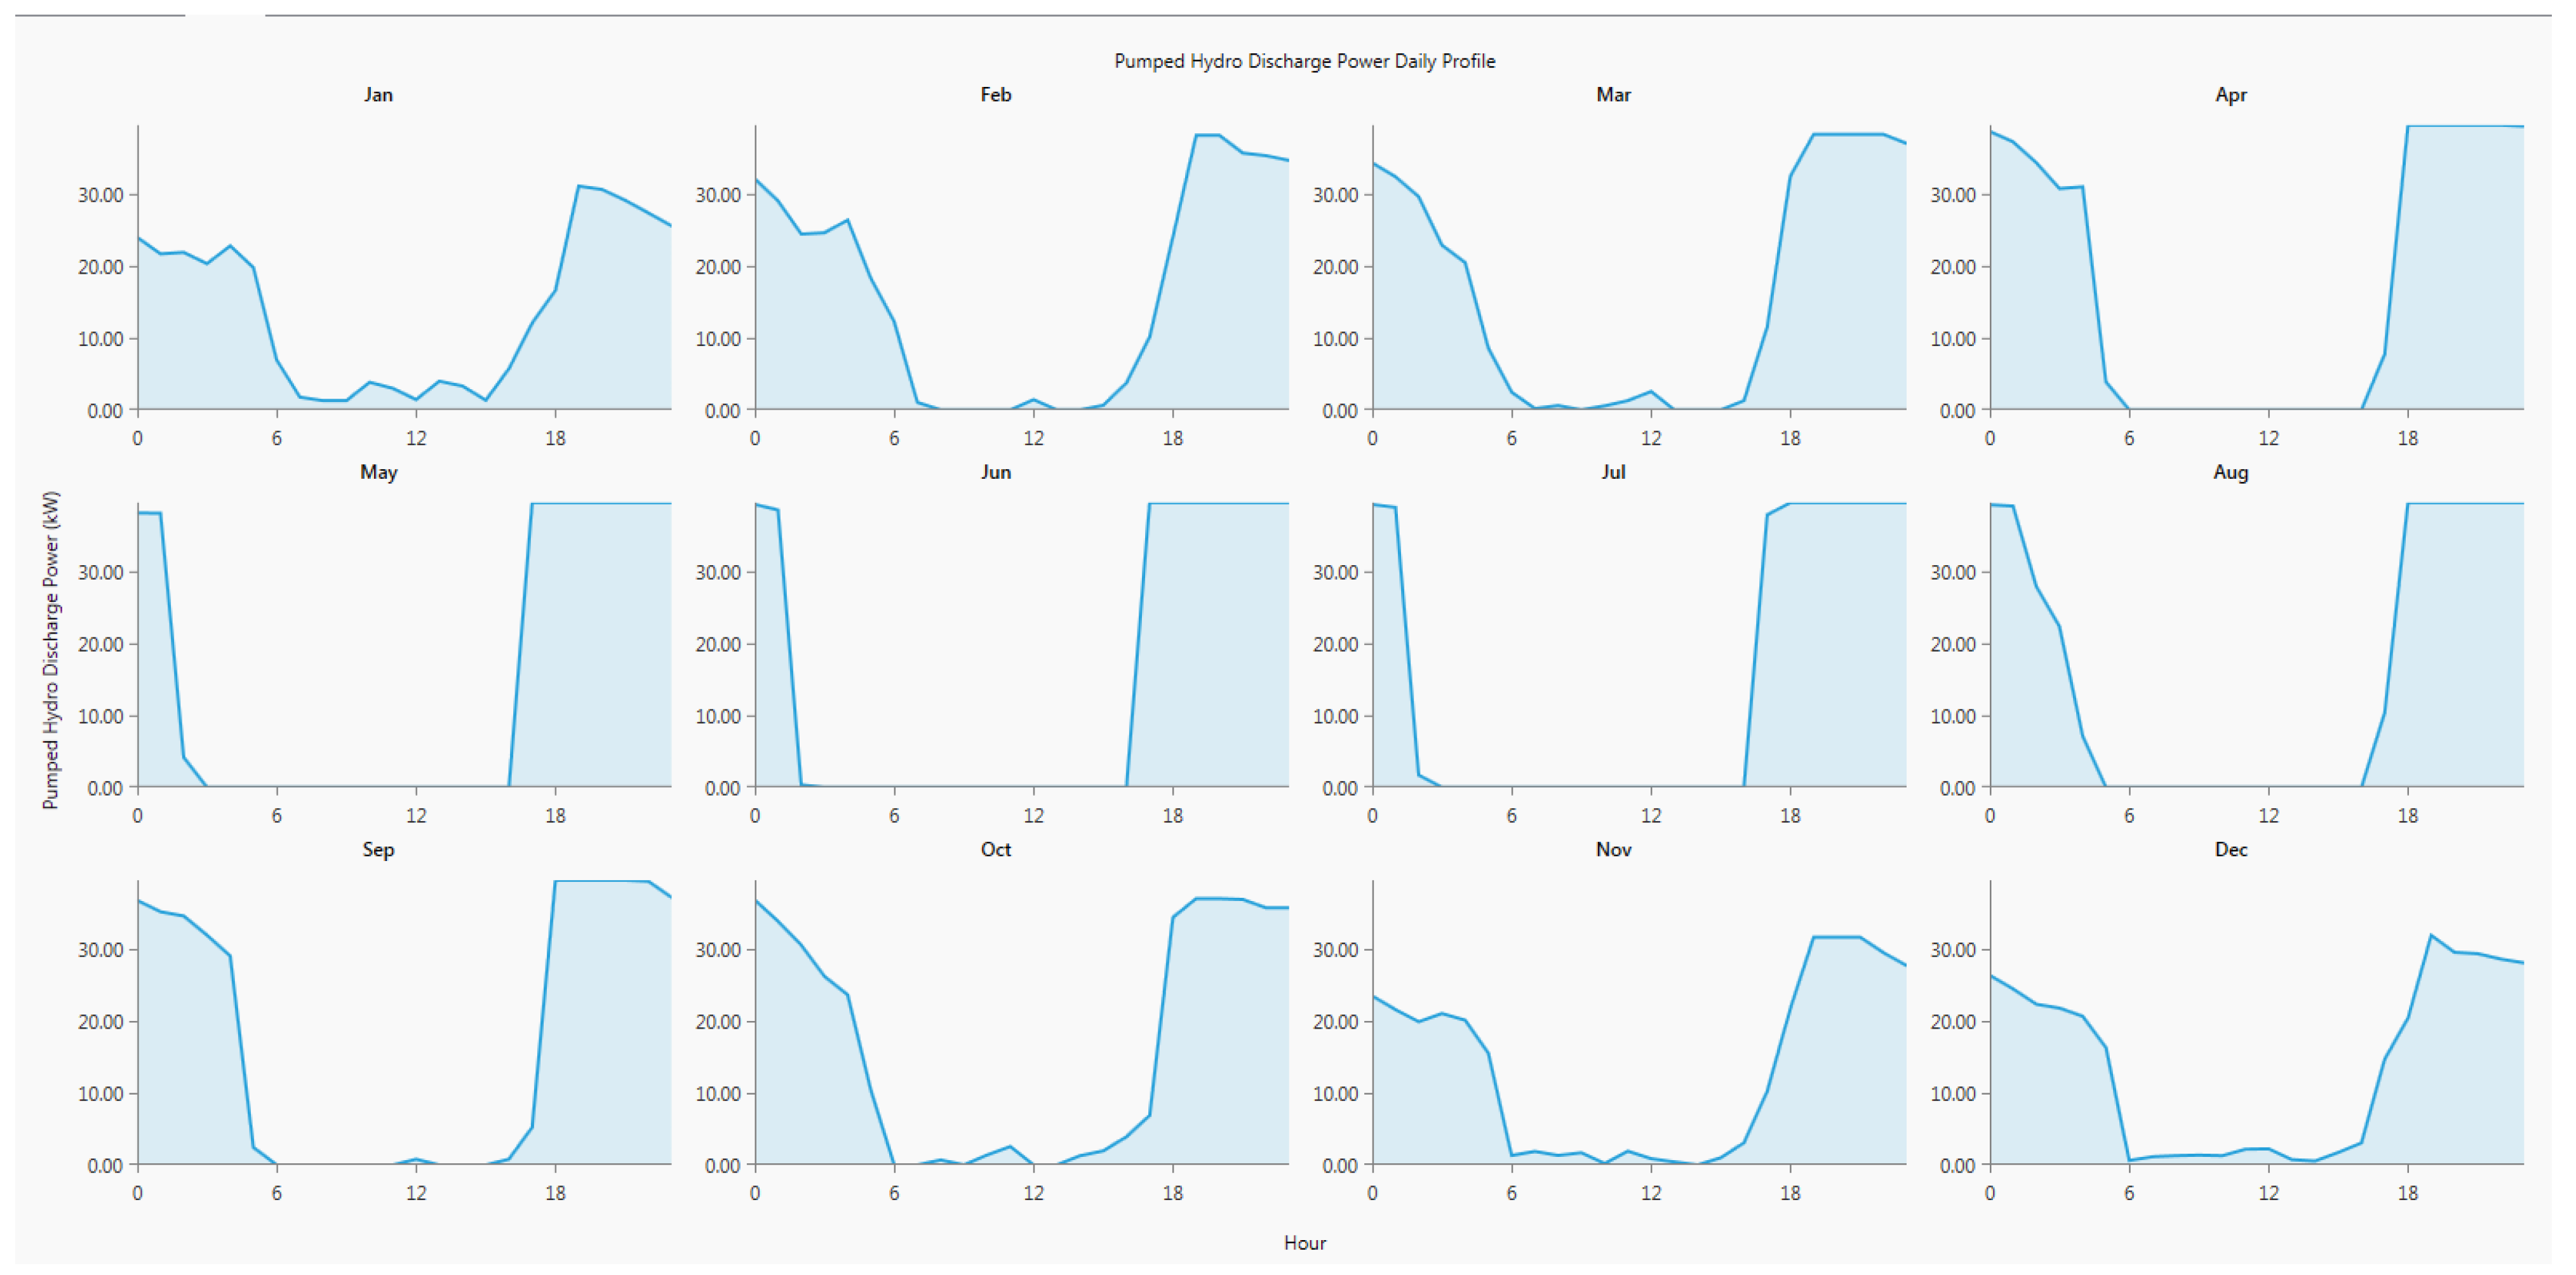
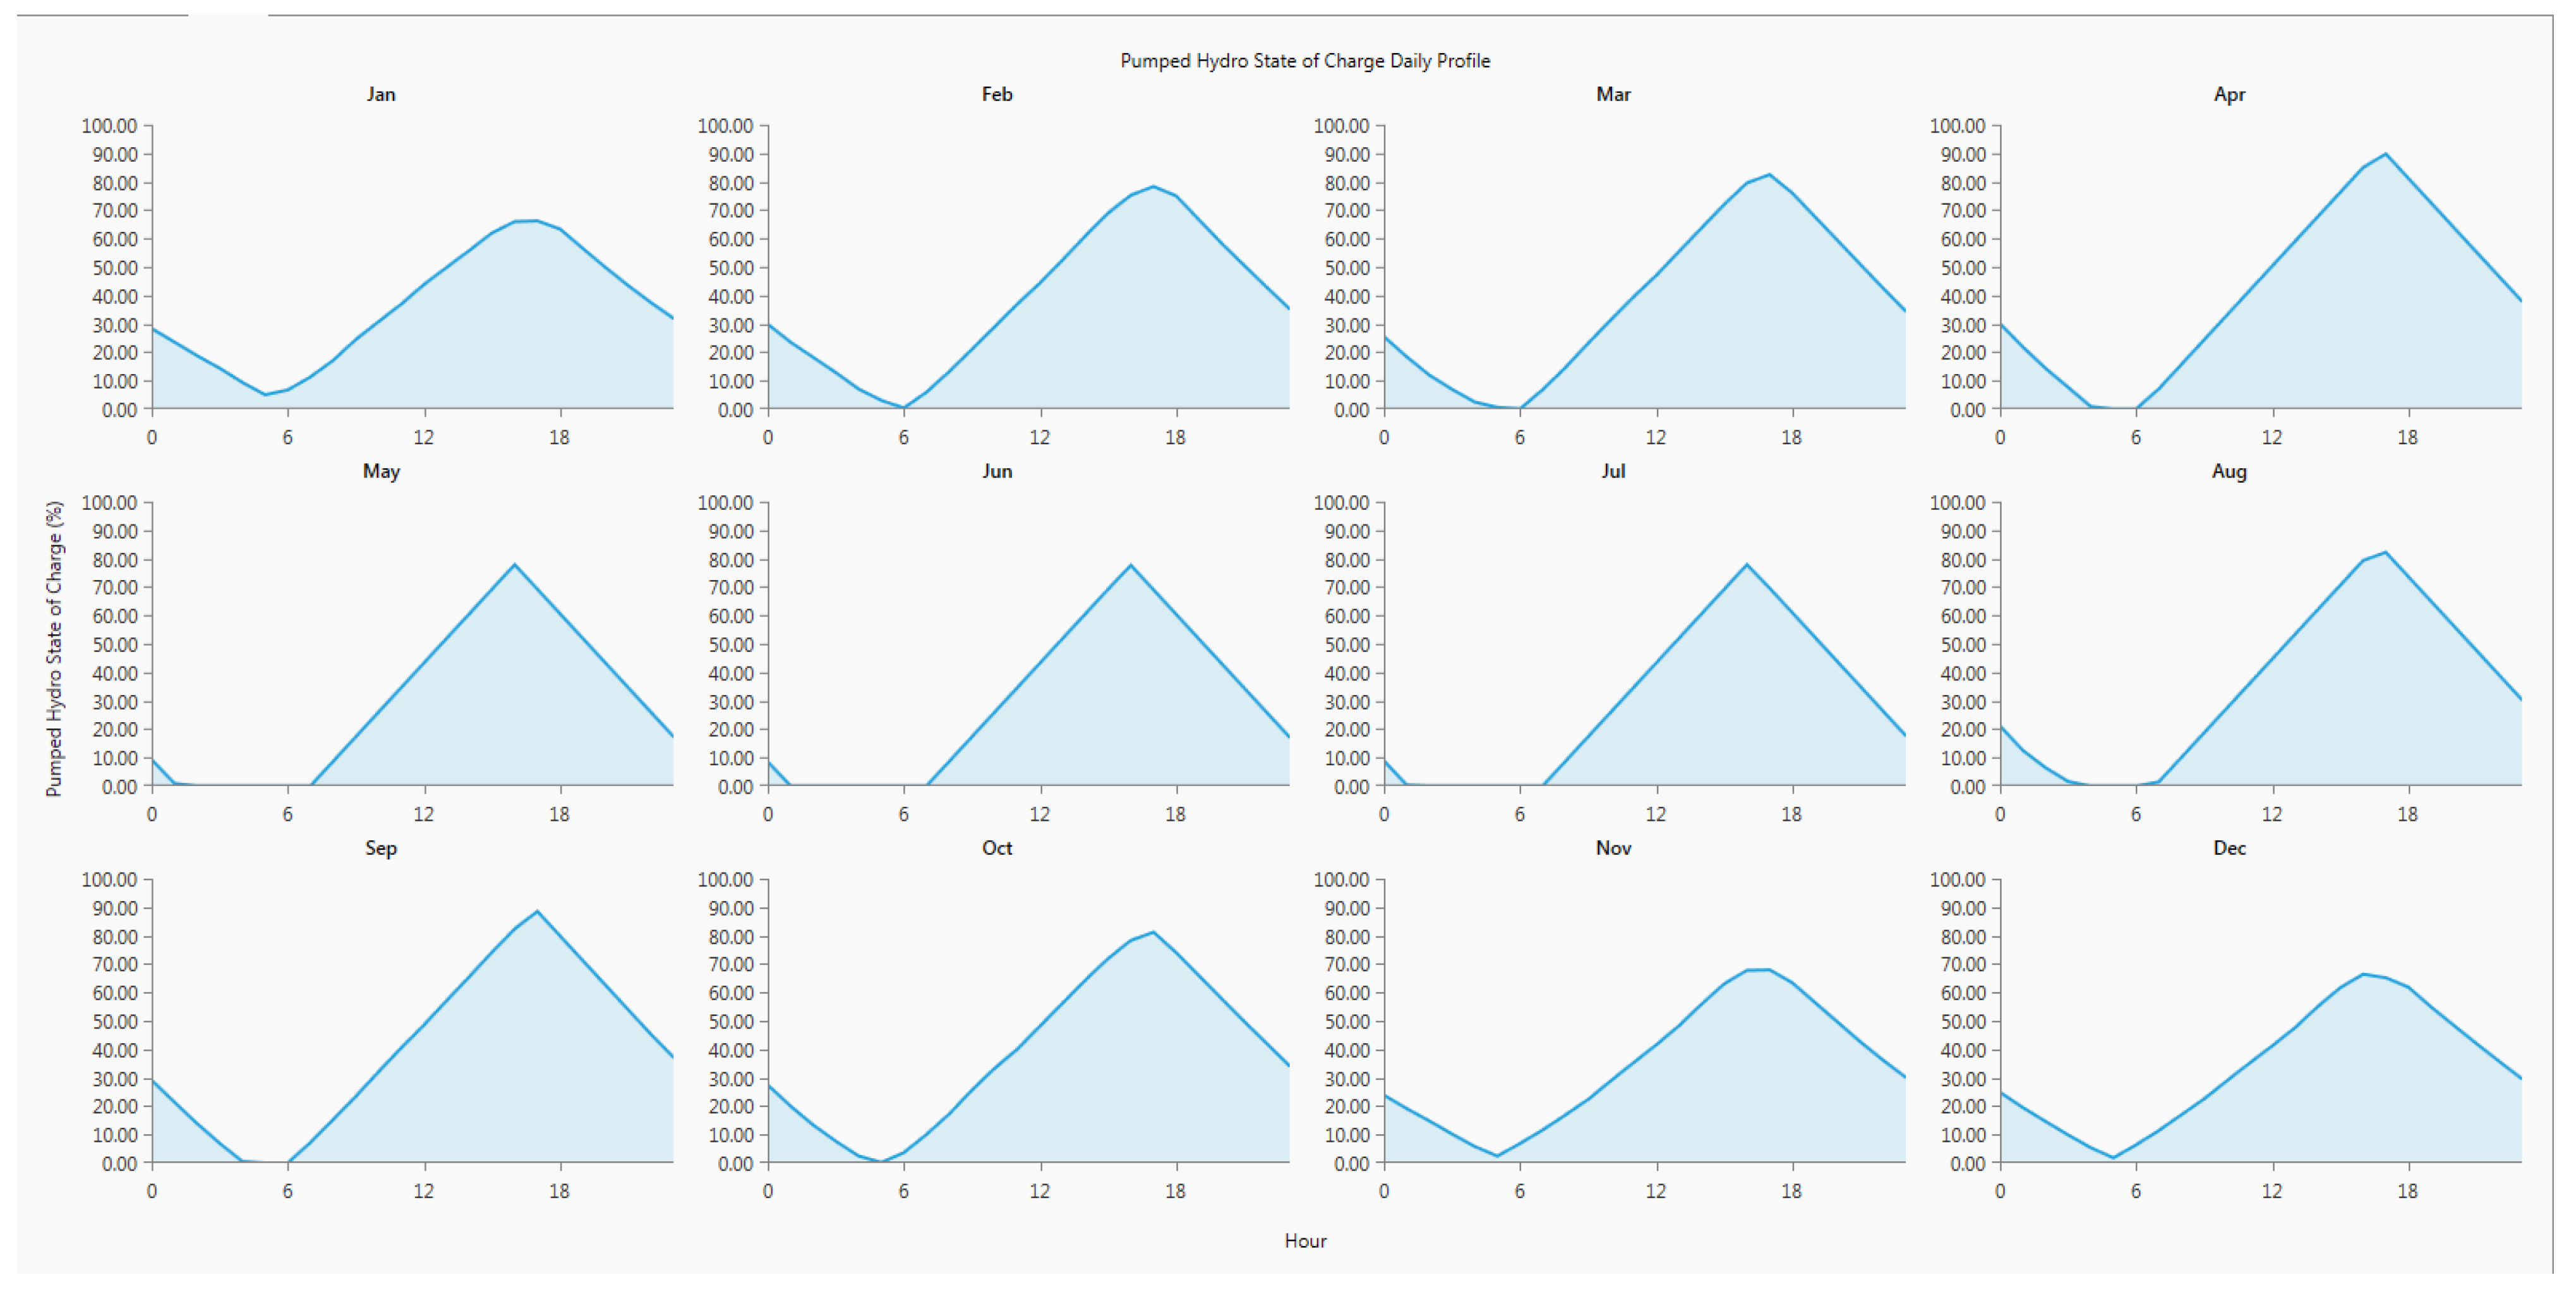
Figure 45, Figure 46, Figure 47 and Figure 48 These figures indicate more charge and discharge power of PPS throughout the year. It can be seen that during the month of May, June and July the rainfall in the country is less and it is thus difficult to depend on PPS up until August when it starts raining again. Even though pumped storage relies on stored water, this water is subject to evaporation and can be lost in other forms.
Figure 48 shows the loading per hour on the PV plant and the peak times at which PPS will be required. It can be seen that different types of loading are experienced for each month and peak times change according to the month.
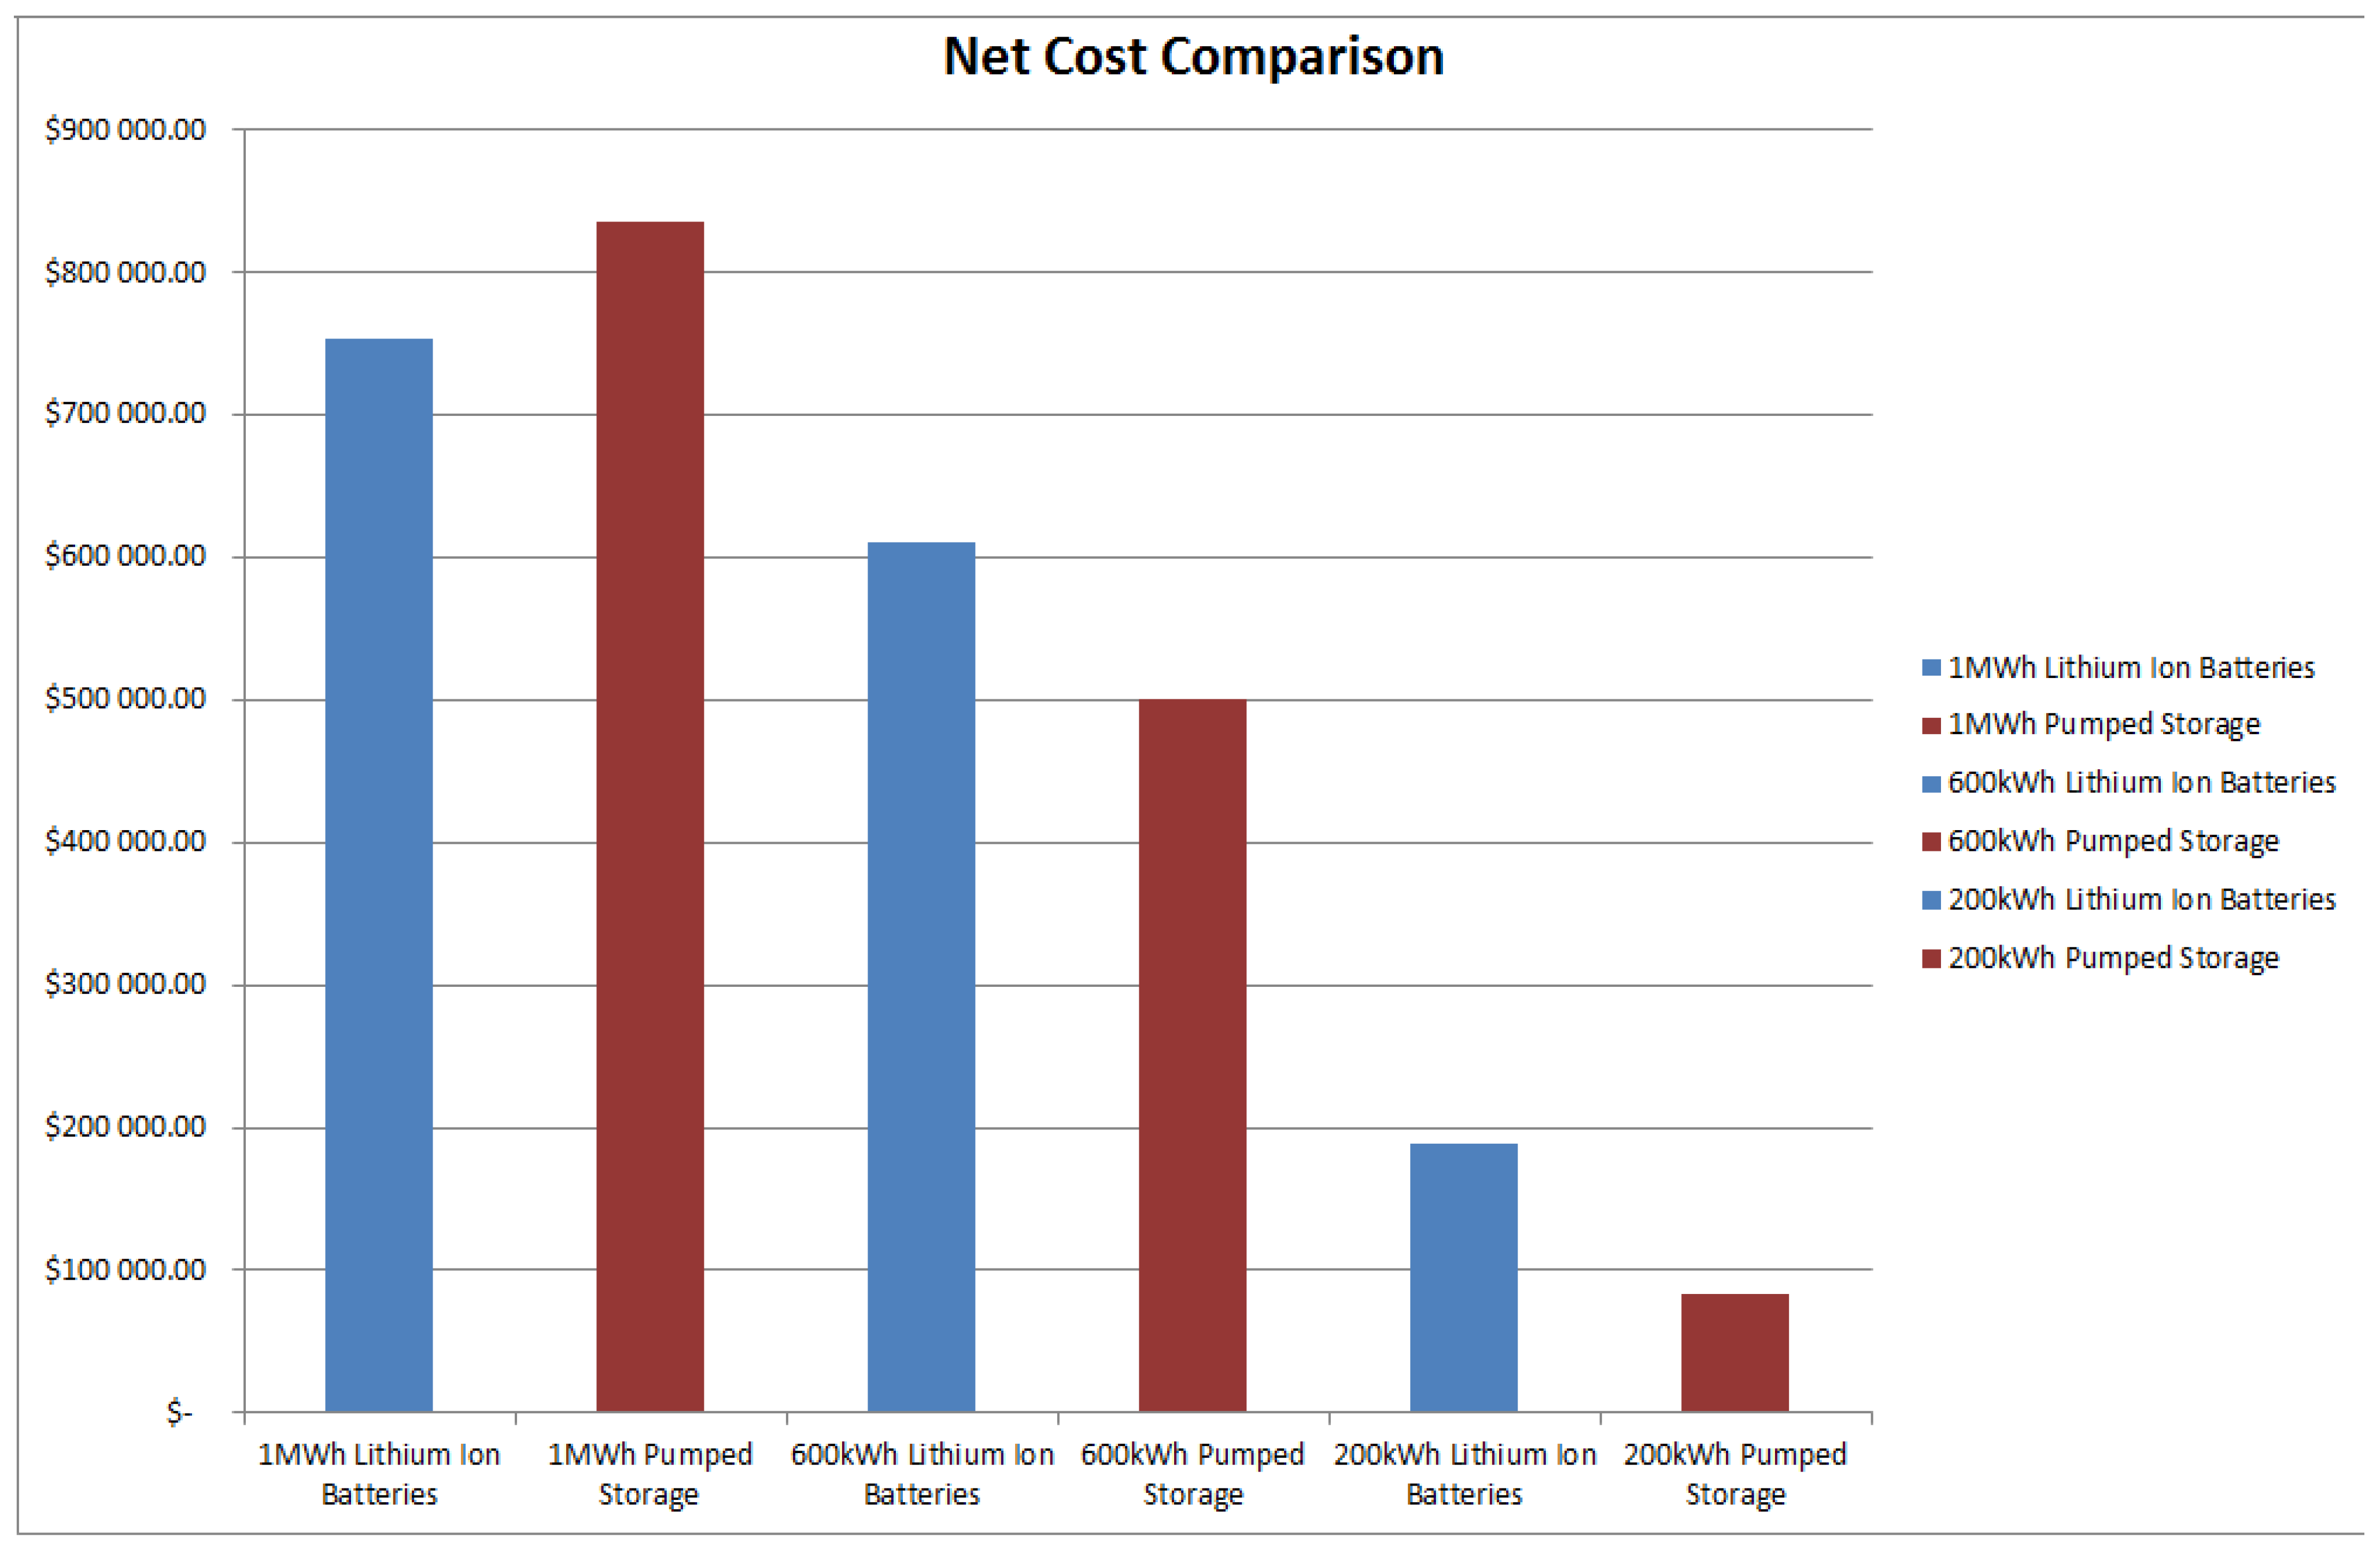
Table 7 and Figure 49 below summarise the cost of storage for different power ratings; these exclude the PV plant and other components connected to the plant, such as converters. It can be seen that pumped storage is more expensive as the storage capacity increase and the battery becomes cheaper. For lower storage requirements, pumped storage is suitable and for higher load requirements batteries are the preferred or better option, cost-wise.
5. Conclusions
To achieve the objectives of the study which include finding the economic and technical solution to renewable energy storage, the following design process was implemented—development of a PV model and its integration with storage batteries using lithium-ion; a pumped storage model was designed as well as its integration with the PV model. Comparison of the battery and PPS model was carried out and finally a developed model arising from the results obtained at different stages of design implementation and efficacy was realised. The model development and simulations were carried out in HomerPro® environments, Version 64x3.10.0 (Pro Edition). Analysis of the results were also carried to accentuate the impact and contribution of the various scenarios, factors and storage systems. Storage batteries and PPS were simulated and compared using 3 scenarios, which are 200 kWh, 600 kWh and 1 MWh storage capacities.
From the results obtained, it can be inferred that both storages are significant to PV output stabilisation as required. They both can be used to supplement PV in times of high demand and times where PV is not sufficient due to weather conditions or fluctuations. These storages have capacities to discharge anytime when required, although PPS has very rapid response and can be used where there are large loads or emergency loading is required. When operated in a hybrid system with PV, it was proven that for lower storage requirements such as 200 kWh storage bank, PPS is a cheaper option compared to storage batteries by almost half the cost. As storage capacity increases to 600 kWh then the gap is closing down and PPS is approximately 16% cheaper than batteries. The difference becomes lesser as storage capacity increase to 1 MWh.
The research has proven that when storage costs go higher than 1 MWh, then batteries can be selected. The assumption was made that both storage resources can be available at the same place.
The research gives the utility the option to select which storage to apply based on the resource at the area where PV is installed. This will improve and stabilise the output demand, increase generation capacity, and consumers will have access to power most of the time that in turn reduces the electricity usage cost. It contributes to socio-economic development in the country, by creating jobs. Companies will have more usage period for lighting activities and that generally increases production capacity. The solution is environmentally friendly and alleviates the present crisis of load shedding due to the unbalance and high demand as well as lower generations.
The research and technology trends indicated that lithium-ion is the future of energy storage. Pumped storage had a lower price per megawatt compared to batteries in 2016. Pumped storage costs ranged between $200–260 /MWh while batteries were $350–1000 /MWh. But the cost of batteries from 2016 to 2017 has also reduced by almost 25%. With the continued cost decline in lithium-ion batteries, pumped storage will be history. Reports indicate lithium-ion batteries may go lower to $120 /MWh in 2025. Taking into consideration equal long-life span (50–100 years) for pumped storage, battery costs may range between $200–300 /MWh.
The other point to consider is that cost comparison should be made not only on installed stored capacity. Most researchers tend to compare storage per MW using installed capacity and that is not necessarily usable capacity. The research was successful and proved that both pumped storage and batteries can be used depending on site location, it further proved that in future more batteries will be used and the size will continue to reduce making the transport cost lower. Also considering construction costs, batteries can be installed quicker than building a pumped storage plant.
Finally, it is proven that these storage facilities, i.e., lithium-ion batteries and pumped storage plants will stabilise the output demand; increase generation capacity; provide backup power; provide consumers with power for longer periods; and thus increase their production capacity and reduce the electricity cost since they will be using power from stable renewable energies instead of fossil fuels. The latter automatically contributes to socio-economic development in the country by creating jobs and saving the existing ones. Taking into consideration the construction and maintenance of the storage facility, some jobs will be created. Reducing the use of coal-fired stations will assist in the reduction of existing carbon emissions. The solution is environmentally friendly and alleviates the present crisis of load shedding due to the imbalance of high demand to lower generations. It is expected that other manufacturers will invest in cost-effective batteries instead of pumped storage as it has no real developmental future as water cannot be developed. With ever more strict rules regarding the care of the environment, it is expected that water usage can become restricted since every living species requires water.
Author Contributions
Conceptualization, S.P.D.C. and M.N.; Methodology, M.N. and S.P.D.C.; Software, M.N.; Validation, S.P.D.C. and M.N.; Formal Analysis, M.N. and S.P.D.C.; Investigation, M.N.; Resources, M.N.; Data Curation, M.N.; Writing—Original Draft Preparation, M.N.; Writing—Review and Editing, M.N., O.P., S.P.D.C.; Visualization, S.P.D.C., M.N., O.P.; Supervision S.P.D.C. and O.P.; Project Administration, M.N., S.P.D.C., O.P.; Funding Acquisition, O.P. and S.P.D.C.
Funding
This research was internally funded by the Tshwane University of Technology, Centre for Energy and Electric Power, Auto-X Pty Ltd. and F’SATI.
Acknowledgments
The authors would like to thankfully acknowledge the Tshwane University of Technology, Centre for Energy and Electric Power, Auto-X Pty Ltd. and F’SATI, Pretoria, South Africa for providing the research infrastructure for conducting this research.
Conflicts of Interest
The authors declare no conflict of interest.
References
- PPIAF. South Africa’s Renewable Energy IPP Procurement Program: Success Factors and Lessons; PPIAF: Washington, DC, USA, May 2014; Available online: http://www.gsb.uct.ac.za/files/ppiafreport.pdf (accessed on 25 July 2016).
- Harque, A.; Rahman, M.A. Study of a solar PV-powered mini-grid pumped hydroelectric storage & its comparison with battery storage. In Proceedings of the 2012 7th International Conference Electrical & Computer Engineering (ICECE), Dhaka, Bangladesh, 20–22 December 2012; pp. 626–629. [Google Scholar]
- Chen, G.Z.; Liu, D.Y.; Wang, F.; Ou, C.Q. Determination of installed capacity of pumped storage stations in WSP hybrid power supply system. In Proceedings of the Sustainable Power Generation and Supply (SUPERGEN’09), International Conference, Nanjing, China, 6–7 April 2009; pp. 1–29. [Google Scholar]
- Hill, C.A.; Such, M.C.; Chen, D.; Gonzalez, J.; Grady, W.M. Battery Energy Storage for Enabling Integration of Distributed Solar Power Generation. IEEE Trans. Smart Grid. 2012, 3, 850–857. [Google Scholar]
- Gong, X.; Huang, Z.; Li, L.; Lu, H.; Liu, S.; Wu, Z. A New State Of Charge Estimating For Lithium Ion Battery Based On Sliding-Mode Observer And Battery Status. In Proceedings of the 35th Chinese Control Conference, Chengdu, China, 27–29 July 2016; pp. 8693–8697. [Google Scholar]
- Pham, V.L.; Khan, A.B.; Nguyen, T.T.; Choi, W. A low cost, small ripple and fast balancing circuit for lithium-ion batteries strings. In Proceedings of the IEEE Transportation Electrification Conference and Expo, Asia-Pacific, (ITEC), Busan, Korea, 1–4 June 2016; pp. 861–865. [Google Scholar]
- Hemmati, R.; Saboori, H. Emergency of hybrid energy storage systems in renewable energy and transport applications—A review. Renew. Sustain. Energy Rev. 2016, 65, 11–23. [Google Scholar]
- Rodrigues, E.M.; Godina, R.; Osório, G.J.; Lujano-Rojas, J.M.; Matias, J.C.; Catalão, J.P. Assessing Lead-Acid Battery design parameters for energy storage applications on insular grids: A Case Study of Crete and Sao Miguel Islands. In Proceedings of the IEEE International Conference on Computer as Tool (EUROCON), Salamanca, Spain, 8–11 September 2015; pp. 1–6. [Google Scholar]
- Venkatesh, J.; Chen, S.; Tinnakornsrisuphap, P.; Rosing, T.S. Lifetime-dependent Battery Usage Optimization for Grid-Connected Residential Systems. In Proceedings of the Modelling and Simulation of Cyber-Physical Energy Workshop, Seattle, WA, USA, 13 April 2015; pp. 1–6. [Google Scholar]
- Serna-Suárez, I.D.; Ordóñez-Plata, G.; Petit-Suárez, J.F.; Caicedo, G.C. Storage systems scheduling effects on the life of lead-acid batteries. In Proceedings of the IEEE PES Innovative Smart Grid Technologies Latin America (ISGT LATAM), Montevideo, Uruguay, 5–7 October 2015; pp. 740–745. [Google Scholar]
- Yan, W.; Tian-ming, Y.; Bao-jie, L. Lead-acid Power Battery Management System Based on Kalman Filtering. In Proceedings of the IEEE Vehicle Power and Propulsion (VPPC), Harbin, China, 3–5 September 2008; pp. 1–6. [Google Scholar]
- Khayat, N.; Karami, N. Adaptive Techniques Used for Lifetime Estimation of Lithium-Ion Batteries. In Proceedings of the Third International Conference on Electrical, Electronics, Computer Engineering and their Applications (EECEA), Beirut, Lebanon, 21–23 April 2016; pp. 98–103. [Google Scholar]
- Khatibi, M.; Jazaeri, M. An analysis for increasing the Penetration of Renewable Energies by Optimal Sizing of Pumped-Storage Power Plants. In Proceedings of the IEEE Electrical Power & Energy Conference, Vancouver, BC, Canada, 6–7 October 2008; pp. 1–5. [Google Scholar]
- Seo, H.R.; Kim, G.H.; Kim, S.Y.; Kim, N.; Lee, H.G.; Hwang, C.; Park, M.; Yu, I.K. Power Quality Control Strategy for Grid-connected Renewable Energy Soures Using PV array and Supercapacitor. In Proceedings of the Electrical Machines and Systems (ICEMS) Conference, Incheon, Korea, 10–13 October 2010; pp. 437–441. [Google Scholar]
- Delimustafic, D.; Islambegovic, J.; Aksamovic, A.; Masic, S. Model of a hybrid renewable energy system: Control, supervision and energy distribution. In Proceedings of the 2011 IEEE International Symposium Industrial Electronics (ISIE), Gdansk, Poland, 27–30 June 2011; pp. 1081–1086. [Google Scholar]
- Belhadji, L.; Bacha, S.; Munteanu, I.; Roye, D. Control of a small variable speed pumped- storage power plant. In Proceedings of the 2013 Fourth International Conference Power Engineering, Energy and Electrical Drives (POWERENG), Istanbul, Turkey, 13–17 May 2013; pp. 787–792. [Google Scholar]
- Thounthong, P.; Sikkabut, S.; Sethakul, P.; Davat, B. Control Algorithm of Renewable Energy Power Plant Supplied By Fuel Cell/Solar Cell/ Supercapacitor Power Source. In Proceedings of the International Power Electronics Conference, Sapporo, Japan, 21–24 June 2010; pp. 1155–1162. [Google Scholar]
- Farhadi, M.; Mohammed, O. Energy Storage Systems for High Power Applications. In Proceedings of the Industry Applications Society, Annual Meeting, Addison, TX, USA, 18–22 October 2015; pp. 1–7. [Google Scholar]
- Alhamad, I.M. A feasibility study of rood mounted grid-connected PV solar system under Abu Dhabi net metering scheme using HOMER. In Proceedings of the Advances in Science and Engineering Technology International Conference, (ASET), Abu Dhabi, United Arab Emirates, 6 February–5 April 2018; pp. 1–4. [Google Scholar]
- Pan, C.; Liang, Y.; Chen, L.; Chen, L. Optimal Control for Hybrid Energy Storage Electric Vehicle to Achieve Energy Saving Using Dynamic Programming Approach. Energies 2019, 12, 588. [Google Scholar] [Green Version]
- Werkstetter, S. Existing and Future Ultra-capacitor Applications in the Renewable Energy Market. In Proceedings of the PCIM Europe International Exhibition and Conference for Power Electronics, Intelligent Motion, Renewable Energy and Energy Management, Nuremberg, Germany, 20–22 May 2014; pp. 1–7. [Google Scholar]
- Chotia, I.; Chowdhury, S. Battery Storage and Hybrid battery supercapacitor storage systems: A Cooperative critical review. In Proceedings of the Smart Grid Technologies–Asia (ISGT ASIA) Innovative, Bangkok, Thailand, 3–6 November 2015; pp. 1–6. [Google Scholar]
- Zhou, H.; Bhattacharya, T.; Tran, D.; Siew, T.S.T.; Khambadkone, A.M. Composite Energy Storage System Involving Battery and Ultra Capacitor with Dynamic Energy Management in Microgrid Applications. IEEE Trans. Power Electron. 2011, 26, 923–930. [Google Scholar]
- Harpool, S.; von Jouanne, A.; Yokochi, A. Supercapacitor Performance Characterization for Renewable Applications. In Proceedings of the IEEE Conference on Technologies for Sustainability, (SusTech), Portland, OR, USA, 24–26 July 2014; pp. 160–164. [Google Scholar]
- Keshan, H.; Thornburg, J.; Ustun, T.S. Comparison of Lead-Acid and Lithium Ion Batteries for Stationery Storage in Off-Grid Energy. In Proceedings of the IET Clean Energy and Technology Conference, (CEAT 2016), Kuala Lumpur, Malaysia, 14–15 November 2016. [Google Scholar]
- Dutt, D. Life cycle analysis and recycling techniques of batteries used in renewable energy applications. In Proceedings of the International Conference on New Concepts in Smart Cities: Fostering Public and Private Alliances (Smart MILE), Gijon, Spain, 11–13 December 2013; pp. 1–7. [Google Scholar]
- Tian, Y.; Li, D.; Tian, J.; Xia, B. A comparative study of state of charge estimation algorithms for lithium ion batteries in wireless charging electric vehicles. In Proceedings of the 2016 IEEE PELS Workshop on Emerging Technologies: Wireless Power Transfer (WoW), Knoxville, TN, USA, 4–6 October 2016; pp. 186–190. [Google Scholar]
- Rivera-Barrera, J.; Muñoz-Galeano, N.; Sarmiento-Maldonado, H. Sarmiento-Maldonado. SOC Estimation for Lithium-ion Batteries: Review and Future Challenges. Electronics 2017, 6, 102. [Google Scholar]
- He, H.; Xiong, R.; Fan, J. Evaluation of Lithium-Ion Battery Equivalent Circuit Models for State of Charge Estimation by and Experimental Approach. Energies 2011, 4, 582–589. [Google Scholar]
- Zhang, C.; Jiang, J.; Zhang, L.; Liu, S.; Wang, L.; Loh, P.A. Generalized SOC-OCV Model for Lithium-Ion Batteries and the SOC Estimation for LNMCO Battery. Energies 2016, 9, 900. [Google Scholar]
- Eckhouse, B.; Pogkas, D.; Chediak, M. How Batteries Went from Primitive Power to Global Domination. 13 June 2018. Available online: https://www.bloomberg.com/news/articles/2018-06-13/how-batteries-went-from-primitive-power-to-global-domination (accessed on 20 July 2018).
- Curry, C. Lithium-ion Battery Costs and Market. 5 July 2017. Available online: https://data.bloomberglp.com/bnef/sites/14/2017/07/BNEF-Lithium-ion-battery-costs-and-market.pdf (accessed on 4 August 2018).
- Independent, Tesla’s Giant Battery Reduces Cost of Power Outages by 90 per cent in South Australia. 12 May 2018. Available online: https://www.independent.co.uk/news/world/australasia/tesla-giant-battery-south-australia-reduce-cost-power-outage-backup-system-fcas-a8348431.html (accessed on 16 July 2018).
- Asif, A.; Singh, R. Further Cost Reduction of Battery Manufacturing. Batteries 2017, 3, 17. [Google Scholar]
- Nko, M.; Chowdhury, S.P.D. Storage Batteries the Future for Energy Storage. In Proceedings of the 2018 IEEE PES/IAS Power Africa, Cape Town, South Africa, 28–29 June 2018; pp. 705–709. [Google Scholar]
- Diouf, B.; Pode, R. Potential of Lithium-Ion Batteries in Renewable Energy. Renew. Energy 2015, 76, 375–380. [Google Scholar]
- Mirsaeidi, S.; Gandomkar, M.; Miveh, M.R.; Gharibdoost, M.R. Power system Load Regulation by Pumped Storage Power Plants. In Proceedings of the 17th Conference on Electrical Power Distribution Networks (EPDC), Tehran, Iran, 2–3 May 2012; pp. 1–5. [Google Scholar]
- Banshwar, A.; Sharma, N.K.; Sood, Y.R.; Srivastava, R. Determination of Optimal Capacity of Pumped Storage Plant by Efficient Management of Renewable Energy Sources. In Proceedings of the IEEE Students Conference on Engineering and Systems (SCES), Allahabad, India, 6–8 November 2015; pp. 1–5. [Google Scholar]
- Koussa, D.S.; Koussa, M. HOMER Analysis for Integrating Wind Energy into the Grid in Southern of Algeria. In Proceedings of the International Renewable and Sustainable Energy Conference (IRSEC), Ouarzazate, Morocco, 17–19 October 2014; pp. 360–366. [Google Scholar]
- Kumari, J.; Subathra, P.; Moses, J.E.; Shruthi, D. Economic analysis of hybrid energy system for rural electrification using HOMER. In Proceedings of the International Conference on Innovations in Electrical, Electronics, Instrumentation and Media Technology, Coimbatore, India, 3–4 February 2017; pp. 151–156. [Google Scholar]
- Sureshkumar, U.; Manoharan, P.S.; Ramalakshmi, A.P.S. Economic cost analysis of hybrid renewable energy system using HOMER. In Proceedings of the IEEE-International Conference on Advances in Engineering, Science and Management (ICAESM-2012), Nagapattinam, Tamil Nadu, India, 30–31 March 2012; pp. 94–99. [Google Scholar]
Figure 1.
Equivalent circuit of lithium-ion (Li-ion) battery (Courtesy of [5]).
Figure 1.
Equivalent circuit of lithium-ion (Li-ion) battery (Courtesy of [5]).

Figure 2.
Typical pumped storage plant (PPS) (courtesy of Eskom).

Figure 3.
Daily and seasonal profile per household.

Figure 4.
Scenario 1–5 MW photovoltaic (PV) plant, Li-ion batteries, and load connected—off-grid.

Figure 5.
1 MWh Li-ion battery bank properties.

Figure 6.
5 MW PV plant performance supplying load without storage.

Figure 7.
5 MW PV plant output without storage hourly basis.

Figure 8.
5 MW PV plant output without storage battery month preview.

Figure 9.
5 MW PV and Li-ion output on summer day.

Figure 10.
5 MW PV plant net present cost without storage using ABB PSV800-1000 solar panels.

Figure 11.
5 MW PV plant net present cost—batteries.

Figure 12.
5 MW PV plant annualised cost—batteries off-grid.

Figure 13.
Pumped storage (PPS) vs. 5 MW PV plant schematic.

Figure 14.
5 MW PV plant net cost analysis—pumped storage plant.

Figure 15.
5 MW PV plant annualised cost analysis—pumped storage plant.

Figure 16.
Hourly performance of PPS on 5 MW PV plant.

Figure 17.
PPS monthly technical analysis on 5 MW PV plant.

Figure 18.
Case study—3 MW PV plant with 20% Li-ion bank, and load connected—off-grid.

Figure 19.
3 MW PV plant output without storage yearly performance.

Figure 20.
3 MW PV plant output without storage day analysis.

Figure 21.
3 MW PV plant output with storage battery month preview.

Figure 22.
3 MW PV plant and Li-ion output on summer day.

Figure 23.
3 MW PV plant net present cost—batteries.

Figure 24.
3 MW PV plant annualised cost—batteries off-grid.

Figure 25.
Pumped storage (PPS) vs. 3 MW PV plant.

Figure 26.
3 MW PV plant net cost analysis—pumped storage plant.

Figure 27.
3 MW PV plant annualised cost analysis—pumped storage plant.

Figure 28.
Hourly performance of PPS on 3 MW PV plant.

Figure 29.
Daily performance of PPS on 3 MW PV plant.

Figure 30.
PPS monthly technical analysis on3 MW PV plant.

Figure 31.
Case Study 5—1 MW PV plant, Li-ion bank, and load connected—off-grid.

Figure 32.
1 MW PV plant output with battery storage yearly performance.

Figure 33.
1 MW PV plant output with battery storage day analysis.

Figure 34.
1 MW PV plant output with storage battery month preview.

Figure 35.
1 MW PV plant and Li-ion output on October spring day.

Figure 36.
1 MW annual load profile.

Figure 37.
200 kWh battery discharge power per hour profile for a year.

Figure 38.
1 MW PV plant net present cost PV—batteries.

Figure 39.
1 MW PV plant annualised cost—batteries off-grid.

Figure 40.
Pumped storage (PPS) vs. 1 MW PV plant.

Figure 41.
1 MW PV plant net cost analysis—pumped storage plant.

Figure 42.
1 MW PV plant annualised cost analysis—pumped storage plant.

Figure 43.
Hourly performance of PPS on 1 MW PV plant.

Figure 44.
Daily performance of PPS on 1 MW PV system.

Figure 45.
200 kW PPS monthly maximum charge power.

Figure 46.
200 kW PPS monthly maximum discharge power.

Figure 47.
200 kW PPS hourly discharge power profile.

Figure 48.
200 kW PPS hourly state of charge profile.

Figure 49.
Net cost summary and comparison of storage plants.


Table 1.
Storage cost comparison on 5 MW PV plant.
| Cost Type | Storage Batteries System (Case Study 1) | PPS System (Case Study 2) | System Difference = (Battery − PPS) |
|---|---|---|---|
| Net Present Cost | USD 13,737,697.00 | USD 14,372,363.34 | USD −6,346,666.34 |
| Annualised Cost | USD 1,403,618.41 | USD 1,468,463.77 | USD −64,845.3 |
Table 2.
Storage cost comparison of individual components on 5 MW PV plant.
| Cost Type | Storage Battery Bank | PPS Storage Bank | Component Difference = (Battery − PPS) |
|---|---|---|---|
| Net Present Cost | USD 753,703.22 | USD 835,018.73 | USD −81,315.51 |
| Annualised Cost | USD 77,007.95 | USD 85,316.16 | USD −8,308.71 |
Table 3.
Storage cost comparison on 3 MW PV plant.
| Cost Type | Storage Batteries (Case Study 3) | PPS (Case Study 4) | Difference = (Battery − PPS) |
|---|---|---|---|
| Net Present Cost | USD 8,732,832.81 | USD 8,623,418.01 | USD 109,414.80 |
| Annualised Cost | USD 892,257.59 | USD 881,078.38 | USD 11,179.21 |
Table 4.
Storage cost comparison of individual components on 3 MW PV plant.
| Cost Type | Storage Battery Bank | PPS Storage Bank | Component Difference = (Battery − PPS) |
|---|---|---|---|
| Net Present Cost | USD 610,426.04 | USD 501,011.24 | USD 109,414.80 |
| Annualised Cost | USD 62,368.91 | USD 51,189.70 | USD 11,196.4 |
Table 5.
Storage cost comparison on 1 MW PV plant.
| Cost Type | Storage Batteries (Case Study 5) | PPS (Case Study 6) | Difference = (Battery − PPS) |
|---|---|---|---|
| Net Present Cost | USD 1,601,392.37 | USD 2,732,246.73 | USD −1,130,854.36 |
| Annualised Cost | USD 163,618.67 | USD 279,161.18 | USD −115,542.51 |
Table 6.
Storage cost comparison of individual components on 1 MW PV plant.
| Cost Type | Storage Battery Bank | PPS Storage Bank | Component Difference = (Battery − PPS) |
|---|---|---|---|
| Net Present Cost | USD 188,295.87 | USD 83,501.87 | USD 104,794.00 |
| Annualized Cost | USD 19,238.71 | USD 8,531.62 | USD 10,707.09 |
Table 7.
Storage cost summary.
| Scenario Type | Net Cost | Annualised Cost |
|---|---|---|
| 1 MWh Lithium Ion Batteries | USD 753,703.32 | USD 77,007.95 |
| 1 MWh Pumped Storage | USD 835,018.73 | USD 85,316.16 |
| 600 kWh Lithium Ion Batteries | USD 610,426.04 | USD 62,368.91 |
| 600 kWh Pumped Storage | USD 501,011.24 | USD 51,189.70 |
| 200 kWh Lithium Ion Batteries | USD 188,295.87 | USD 19,238.71 |
| 200 kWh Pumped Storage | USD 83,501.87 | USD 8,531.62 |
© 2019 by the authors. Licensee MDPI, Basel, Switzerland. This article is an open access article distributed under the terms and conditions of the Creative Commons Attribution (CC BY) license (http://creativecommons.org/licenses/by/4.0/).
Share and Cite
MDPI and ACS Style
Nko, M.; Chowdhury, S.P.D.; Popoola, O. Application Assessment of Pumped Storage and Lithium-Ion Batteries on Electricity Supply Grid. Energies 2019, 12, 2855. https://doi.org/10.3390/en12152855
AMA Style
Nko M, Chowdhury SPD, Popoola O. Application Assessment of Pumped Storage and Lithium-Ion Batteries on Electricity Supply Grid. Energies. 2019; 12(15):2855. https://doi.org/10.3390/en12152855
Chicago/Turabian StyleNko, Macdonald, S.P. Daniel Chowdhury, and Olawale Popoola. 2019. "Application Assessment of Pumped Storage and Lithium-Ion Batteries on Electricity Supply Grid" Energies 12, no. 15: 2855. https://doi.org/10.3390/en12152855
Note that from the first issue of 2016, this journal uses article numbers instead of page numbers. See further details here.