1. Introduction
The challenge of global warming and strict regulations make the development of new power generation technologies and the improvement of current technologies a necessity. Oxyfuel combustion is one of these technologies, and enables the separation of high purity carbon dioxide from coal and gas power plants as industrial feed-stock or for sequestration. This is accomplished by using pure oxygen instead of air in the combustion process. For moderation of the flame temperature, a part of the exhaust gas stream is recirculated, making the main constituents of the combustion atmosphere carbon dioxide, oxygen and water. This change in chemical environment and the complex mix of volatile species emitted by the coal particles challenge state-of-the-art reaction mechanisms and necessitate their validation. To assess the effect of Oxyfuel atmosphere on light coal volatile combustion, speciation studies have been conducted on an axisymmetric counterflow burner [
1]. While the full speciation studies are performed using probe-taking time-of-flight mass spectrometry, capturing temperature profiles for the full characterization of the operating points can still be a challenging problem. Conducting in-flame measurements with thermo-couples (TC) requires intricate calibration of the TC, characterization of its radiative properties for radiation corrections and promises high degradation rates for the TC. Additionally, the influence of a TC present in the reaction zone on measured temperatures has to be addressed carefully.
Spectroscopic methods circumvent these difficulties and do not influence the combustion process. While state-of-the-art spectroscopic methods like Coherent Anti-Stokes Raman facilitate accurate point measurements in flames, the complexity, size and cost of the required setup are off-putting and sometimes not applicable to the measurement object. Absorption spectroscopy on the other hand is a mature technique requiring only a minimum of measurement equipment, but in itself only allows for line integrated values [
2]. This lack of spatial resolution can be overcome by combining absorption spectroscopy with tomographic reconstruction methods. This spectrally resolved absorption tomography has already been proposed and applied to different processes [
3,
4,
5]. For axissymmetric flames it has just recently been shown [
6] using fitted absorption line areas of selected transitions and a tomographic onion peeling scheme. In spite of yielding good results, this method requires computationally expensive preprocessing of the absorbance data by fitting Voigt line profiles to absorption features which are only an approximate solution to the complex superposition of line profiles of different width in the beam path. The method of linear hyperspectral absorption tomography (LHAT), initially presented by Wood et al. [
7] and summarized and benchmarked by Grauer et al. [
8], performs the tomographic reconstruction on the absorbance spectra themselves, yielding local absorption coefficient spectra for each location and thus does not require spectroscopic models (e.g., Voigt line shapes), greatly reducing the computational effort. The availability of full local spectra also allows for giving local signal-to-noise ratios (SNR) for measuring the trustworthiness of the results. Hence, we employ LHAT in conjunction with an onion peeling grid and second order Tikhonov regularization for the reconstruction of temperature and water mole fraction profiles in the counterflow flames investigated in the speciation studies [
1].
For the choice of the Tikhonov regularization parameter we introduce a new method based on the residuals of a spectroscopic model fitted to the local absorption coefficient spectra: for too low regularization parameters the amplified white noise in the residua will dominate. For too high regularization parameters the spectroscopic line shapes and line strength ratios will be distorted, yielding similarly high residua. The optimum regularization parameter balances both effects and its determination is demonstrated on measurement data.
For measuring the required absorbance spectra we use tunable diode laser absorption spectroscopy (TDLAS) [
2,
9], as it allows for a stable wavenumber tuning, compensation of thermal radiation and a high measurement speed.
The following sections will first introduce the employed measurement, reconstruction, and evaluation techniques before explaining the burner and measurement setup. After that, the new residual based method to find the optimum regularization parameter is demonstrated. Finally, the measurement results of temperature and water mole fraction are presented and compared to the results of numerical simulations employing the ITV reaction mechanism [
10].
2. Methods
The base for the measurements discussed in this work is absorption spectroscopy which is briefly introduced in the following. Next, the principle of linear hyperspectral absorption tomography is explained and the new regularization parameter determination method is outlined. Finally, the practical implementation of the tomographic measurement system and its application to the burner is described.
2.1. Absorption Spectroscopy
The absorption of monochromatic light by a medium can be described by the Beer-Lambert law,
Here
is the absorbance at wavenumber
,
is the incident spectral intensity before absorption,
the spectral intensity after absorption,
the absorption coefficient and
l the absorption length. For water vapor, the absorption coefficient can, similar to many other molecules, be modeled as a superposition of several absorption transitions with line parameters taken from e.g., HITRAN [
11] or HITEMP [
12]
Equation (
2) describes the absorption coefficient as a superposition of a set of relevant absorption transitions. While mole fraction
X and pressure
P are applied for all absorption lines, the nonlinear dependency of line intensity
on temperature
T as well as the Gaussian line width
and Lorentzian line width
of the Voigt line shape
are line specific. This model of the absorption coefficient allows for absorption spectroscopic measurements to be evaluated by fitting this theoretical model to the measurement data.
Due to the high temperatures to be expected in the flame we use HITEMP [
12] line data for the evaluation in this work. Although HITEMP lists several collisional broadening coefficients for calculating the Lorentzian line width, they are not sufficient to model the complex gas composition in combustion. Hence the Lorentzian line width needs to be fitted freely to the measurement data. As a free width parameter for each transition would greatly increase the computational effort needed for the fit of the model, a global, freely fitted scaling factor
for the Lorentzian width calculated for air atmospheres is used in this work.
Of the many absorption spectroscopic techniques, TDLAS is chosen in this work for its capability to compensate thermal radiation of the flame and its high measurement speed. In TDLAS, a tunable diode laser is used as light source and it shines through the measurement volume. A photo diode detects the transmitted intensity of the laser and the thermal radiation due to combustion. The diode current is modulated with a ramp signal such that during a short interval at the beginning of the ramp the current is below the laser threshold and the laser is turned off. Hence, the intensity detected during this interval is a measure of the thermal radiation which can be assumed constant during a ramp period, enabling the compensation of thermal radiation by subtraction of said value.
During the interval of the current ramp with laser emission, the modulated current not only leads to a change in emitted intensity, but also the emission wavelength of the diode laser changes. This way, several absorption transitions are scanned by the laser during a ramp period.
As TDLAS only records the transmitted intensity and the tomographic algorithm employed in this work relies on measured absorbances, the absorbance spectra need to be derived from the intensity spectra. This is achieved by fitting a polynomial incident intensity model and two superimposed homogeneous absorption spectrum models to the measured intensity. The two superimposed spectrum models facilitate the representation of hot and cold absorption lines simultaneously. This way the inhomogeneous temperature in the absorption path does not distort the incident intensity, , estimated in the fit. Additionally, the residuum of this fit is used to estimate the noise of the absorbance spectrum which is employed in the tomographic reconstruction as explained in the following section.
2.2. Tomography
We employ the LHAT algorithm as presented in [
8] and hence give only a short overview of the algorithm. The goal of tomography is to reconstruct a spatial distribution in a reconstruction domain from
M integrating measurements along beams through this reconstruction domain. For this purpose, the spatial reconstruction domain is discretized in
N volume elements or nodes. Each of these volumes or nodes has a scalar property
, which describes the absorption coefficient at wavenumber
of the node. All absorption coefficients of the spatial distribution are summarized in the vector l
. Based on this variable vector,
, a forward model
of the resulting integrated absorbance measurements
is defined for each beam
i. By conducting a piecewise constant discretization of Equation (
1), this model can be written
Here
describes the section lengths of the
i th beam inside of node
j. In matrix form, the full measurement model for all measurement beams is
The axisymmetry of the burner is exploited in the choice of the discretization grid by applying an onion peeling scheme: each node represents a ring around the burner center, rendering the two-dimensional reconstruction domain to a single dimension. This is detailed further in
Section 2.3.2.
Based on the model
, the most probable distribution
is reconstructed under consideration of the measurement results
and their uncertainty
as well as prior knowledge about the distribution in
. This reconstruction can be explained in a Bayesian framework:
Here
is the posterior probability density function of
being the true distribution given the measured values
. The model likelihood
describes the probability density of the measurement values
given the distribution
. The prior information about the distribution is described by the prior probability density
. The denominator
is only a constant scaling factor. Thus, in order to find the most probable spatial distribution, the maximum of the posterior likelihood has to be found which is equal to finding the maximum of
.
In order to do so, the probability densities of model likelihood and prior have to be modeled first. For the model likelihood, a multi-variate-normal (MVN) distribution is commonly applied:
This assumes uncorrelated Gaussian noise with a standard deviation of for the measurement of each beam i. Analogously, the prior distribution is modeled as a MVN distribution
The prior information in this MVN prior is defined by the mean values and the covariance matrix . Especially the off-diagonal elements, which define the correlation between the nodes or volume elements, are important in order to model the expectation of smoothness due to diffusion.
The reconstruction is defined by the point of maximum likelihood
of the posterior distribution in Equation (
5). It can be shown in [
8] that this maximum a posteriori is given by the least-squares problem
This linear least-squares problem is solved for all measured wavenumbers
and therefore reconstructs local absorption coefficient spectra for all nodes. The absorption coefficient model in Equation (
2) is then fitted to each local absorption coefficient spectrum
with wavenumbers
to
(considering a free global Lorentz broadening factor
), yielding temperature and mole fraction values for each node:
Regularization Parameter Choice
Before solving the tomographic reconstruction, the prior has to be defined. Due to the laminar flow in the burner, a second order Tikhonov prior is chosen for the reconstructions. Hence the prior matrix is defined as
For the onion-peeling discretization used here, the
×
N Tikhonov matrix
calculates the second derivative of the distribution in radial direction. It therefore penalizes strong curvature (resulting e.g., from noise peaks) in the least-squares problem. The strength of this regularization is adjusted by the parameter
. Too low values for
lead to undesired noise amplification in the reconstruction, while too high values oversmooth the distribution, distorting the true shape. For a proper choice of
, different methods like Morozov’s discrepancy principle [
13] for the L-Curve citerion [
14] have been introduced. The reconstruction of local absorption coefficient spectra with LHAT allows for another approach: too low values for
result in increased white noise in the reconstructed spectra, increasing the residua of the spectroscopic fit in Equation (
9). Too high
values on the other hand lead to distorted line shapes and line strength ratios that cannot be explained by the Boltzmann distribution in the molecular energy levels, thus also increasing the residua of the spectroscopic fit. Hence, there is an optimum value for
that balances both effects. To find it, we propose conducting reconstructions for a set of
values and summing the squared residua of the spectroscopic fits for each
value. The
value with the minimum sum of squared residua is the optimum value. After explaining the experimental setup in the next section, this new method to determine
is demonstrated in the results section.
2.3. Experimental Setup
The experimental setup consists of the counterflow burner and the TDLAS measurement setup. The counterflow burner has already been studied in [
1].
2.3.1. Burner Configuration
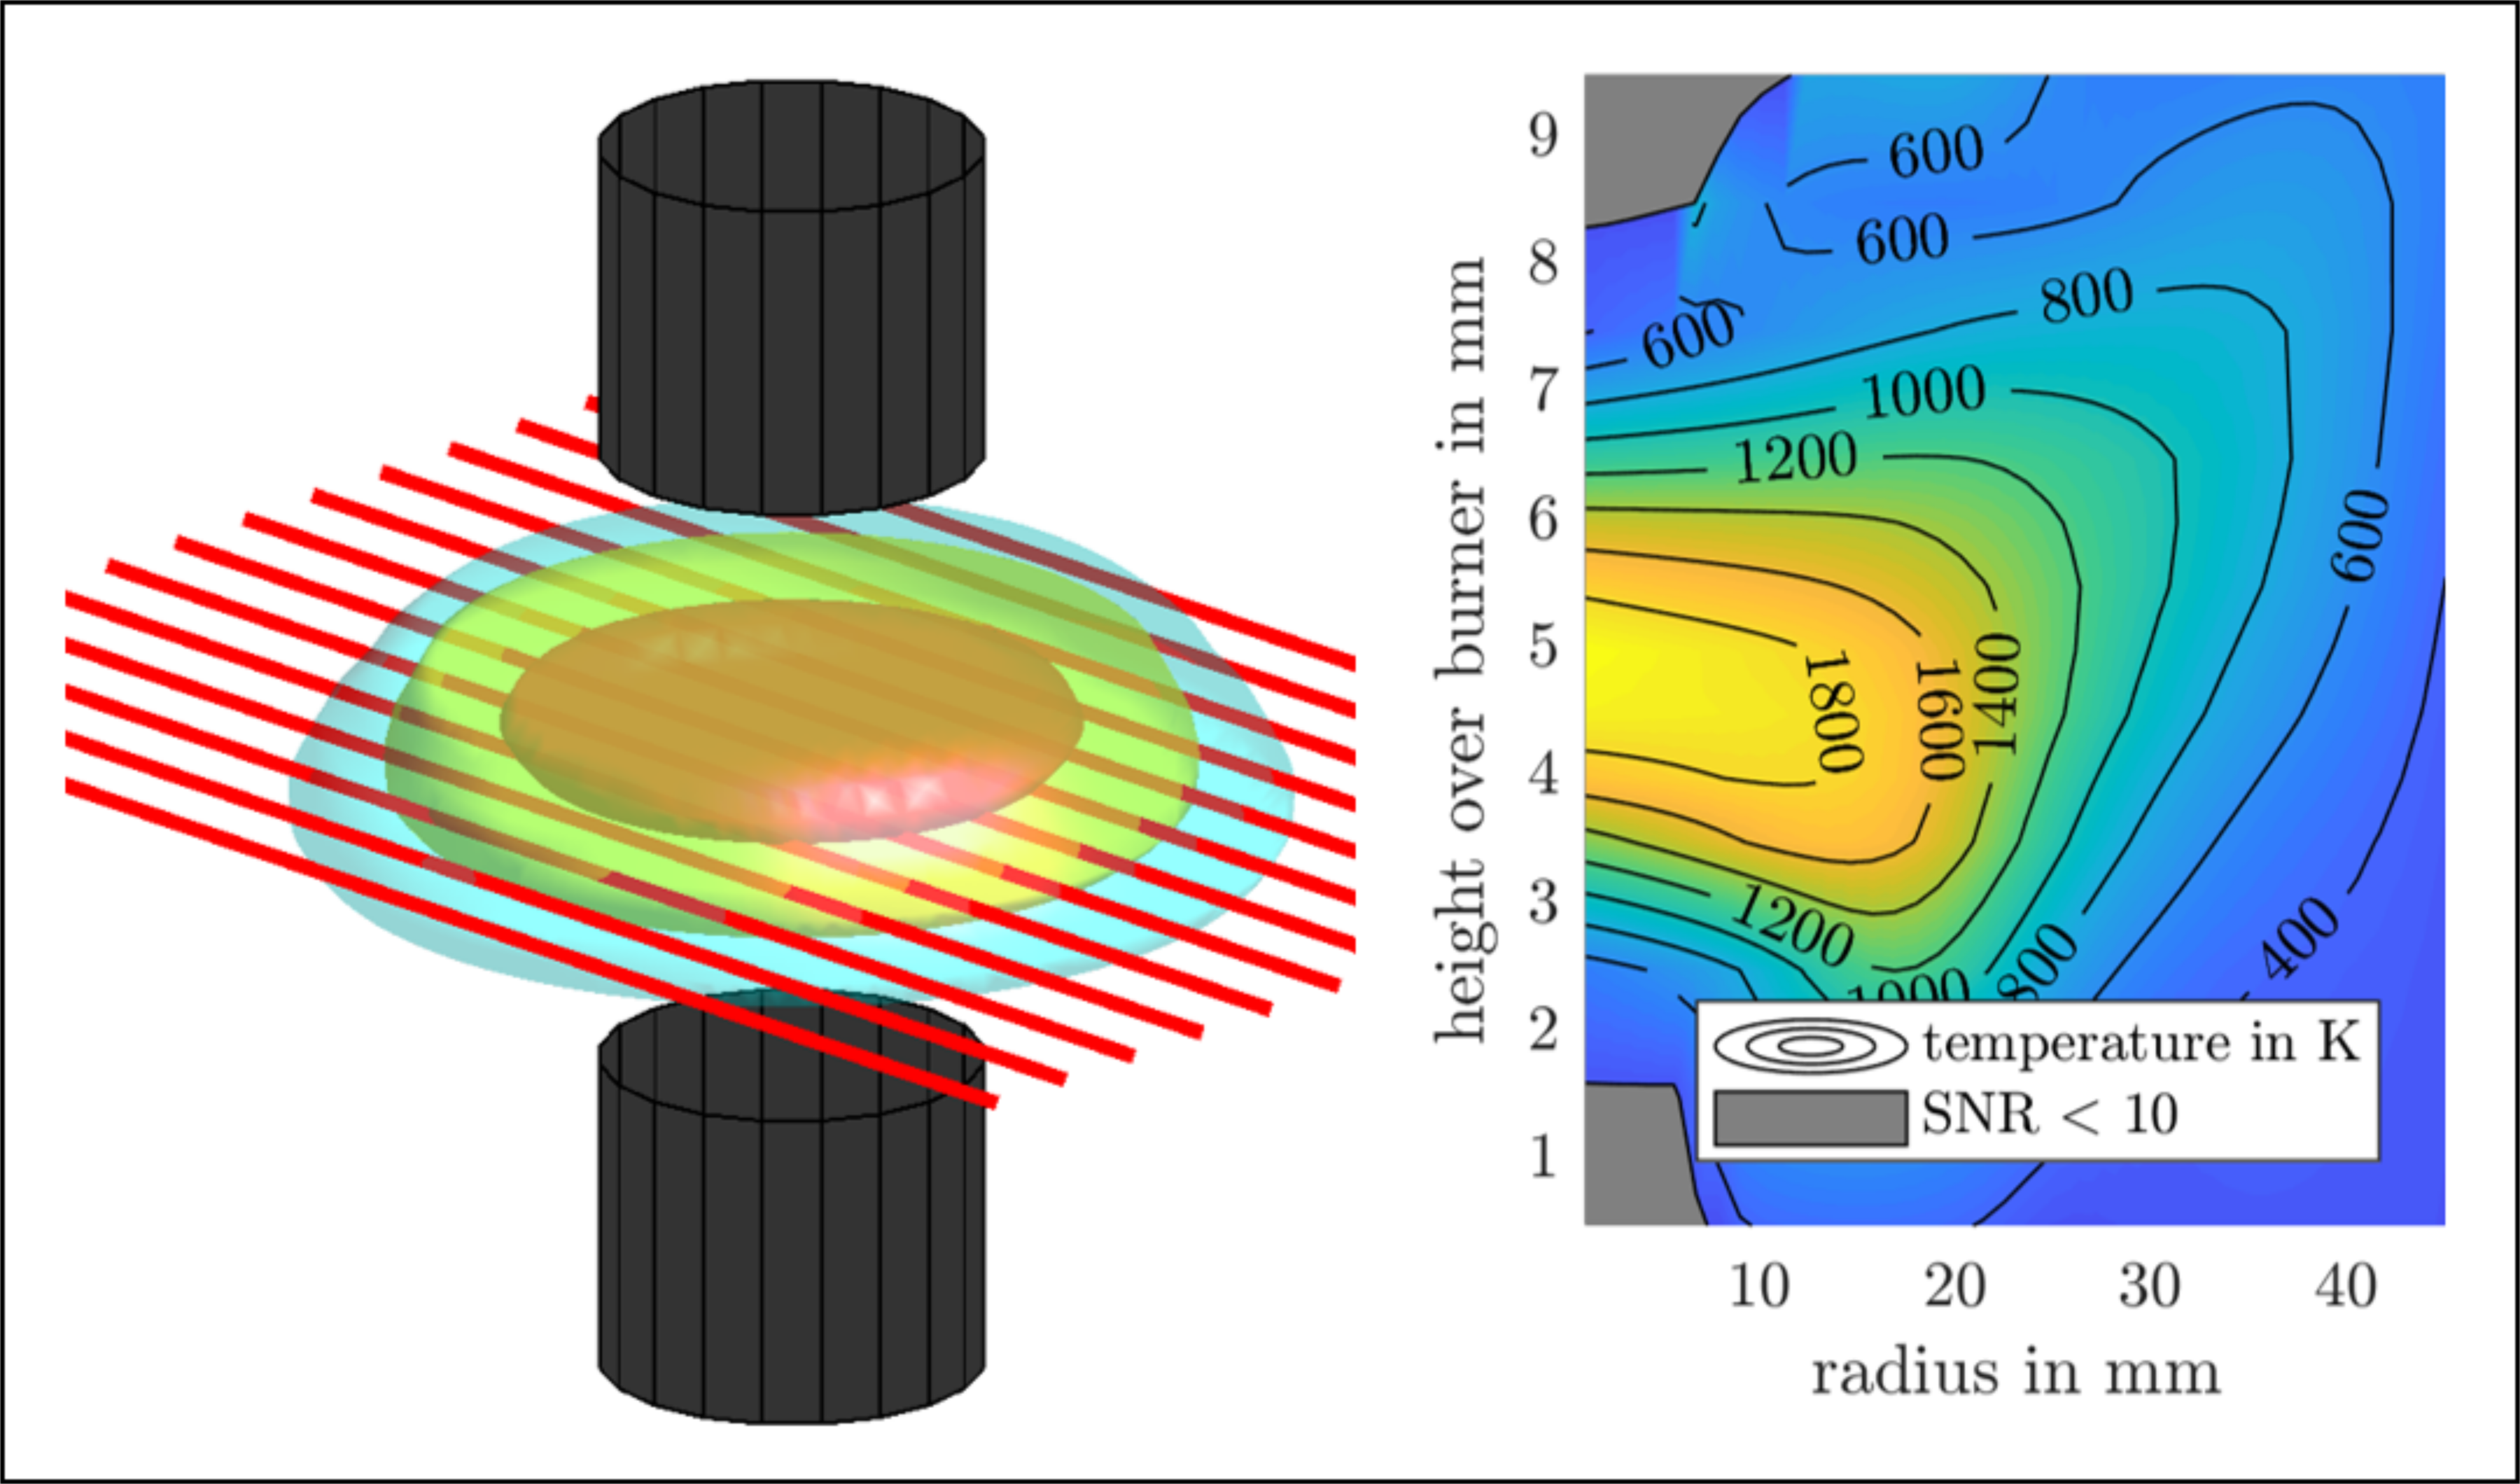
The burner consists of a fuel nozzle from the top and an opposing oxidizer nozzle from the bottom. The round nozzles have diameters of 20 mm and a distance of 10 mm (see
Figure 1). A detailed description of the burner design is given in [
1]. A stable, axissymmetric, flat flame forms approximately mid-way between both nozzles. Several operating points with different atmospheres were studied. A list of the six operating points is given in
Table 1.
2.3.2. Measurement Setup
As the flame is axisymmetric and stationary, the measurement setup is simplified accordingly: similar to onion peeling or Abel inversion, the tomographic grid is defined by equidistant concentric rings around the center axis of the burner, yielding a ring width of 1.13 mm. The outermost ring is expanded to fill the rectangular area that is scanned. The beam pattern consists of beams with the same direction and different distances from the center axis. As the investigated system is stationary, time resolution is not important and the beams are acquired in series by parallel scanning a single TDLAS measurement beam from mm to mm relative to burner center. Each scanning period of 20.3 s covers one horizontal plane in the burner. The laser tuning ramps are binned together and phase averaged according to the position of the scanning arm at the time of their acquisition. For the evaluation presented here, the ramps were assigned to bins of 1 mm width, which effectively results in 90 beams for the tomographic reconstruction.
In order to get a three dimensional reconstruction of the distributions, the burner is manually traversed on the vertical axis such that 13 measurement heights
h are acquired separately (see
Figure 1). The burner and the scanning TDLAS setup are schematically depicted in
Figure 1.
The TDLAS setup utilizes a vertical cavity surface emitting laser diode that is tuned with 1 kHz from 7179 cm to 7192 cm across several water absorption transitions. The absorption length between emitter and detector probe was measured to be 121.3 mm and the beam diameter was determined to be 0.4 mm full width at half maximum (FWHM).
While water mole fraction and temperature were determined tomographically, the pressure can be assumed approximately homogeneous and is thus measured using a Keller XHTC 0-10 bar absolute pressure transducer.
After finding the incident intensity distributions by fitting a polynomial intensity model and two absorbance models to the measured traces, as described previously, the resulting absorbance spectra are fed into the tomographic reconstruction. The results of these reconstructions are described in the following section.
3. Results
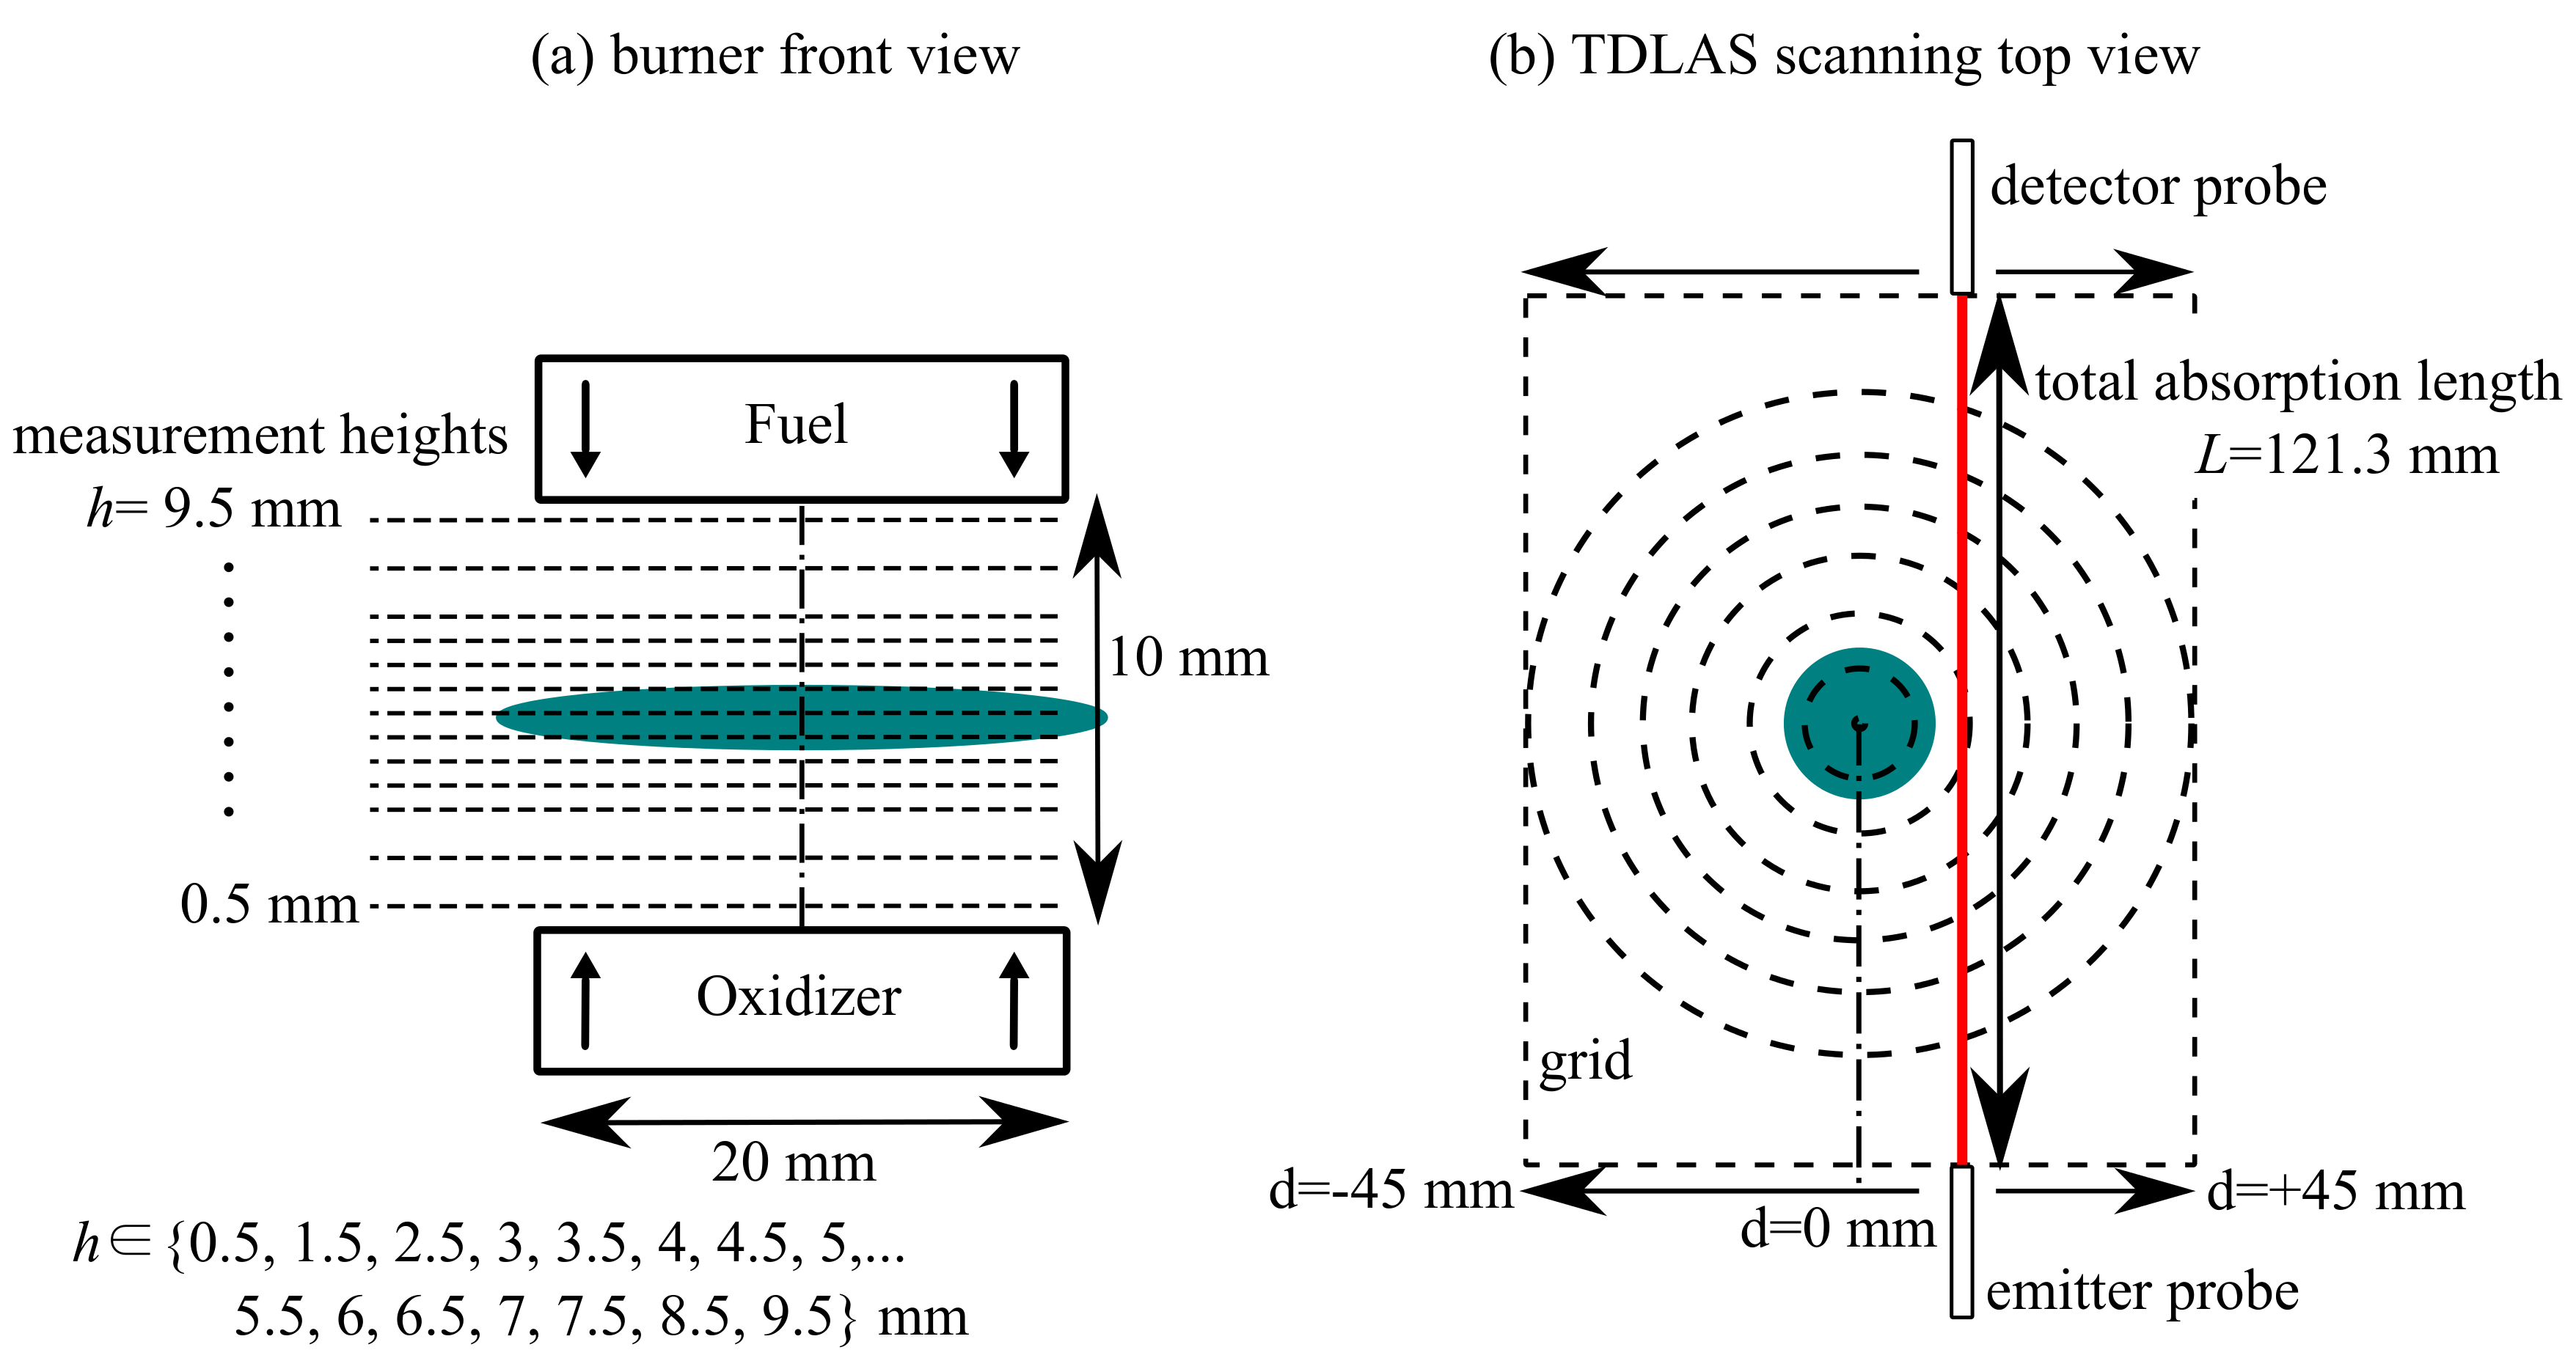
Before conducting a meaningful reconstruction of temperature and water mole fraction profiles, the optimum value for the regularization parameter
needs to be found. As explained previously, we employ a new method that finds the optimum
based on the sum of squared residua of the spectroscopic regression in the second step of the tomographic inversion. Hence, the local absorption coefficient spectra are reconstructed for a set of
values. Then the spectroscopic regression in Equation (
9) is conducted and for each
the sum of squared residua for all local absorption coefficient spectra is calculated. As the spectroscopic regression is the computationally most expensive part of the reconstruction, this procedure is not performed on all data sets, but only on the center level (
mm) of the Me
operating point. The results are shown in
Figure 2.
The optimum value
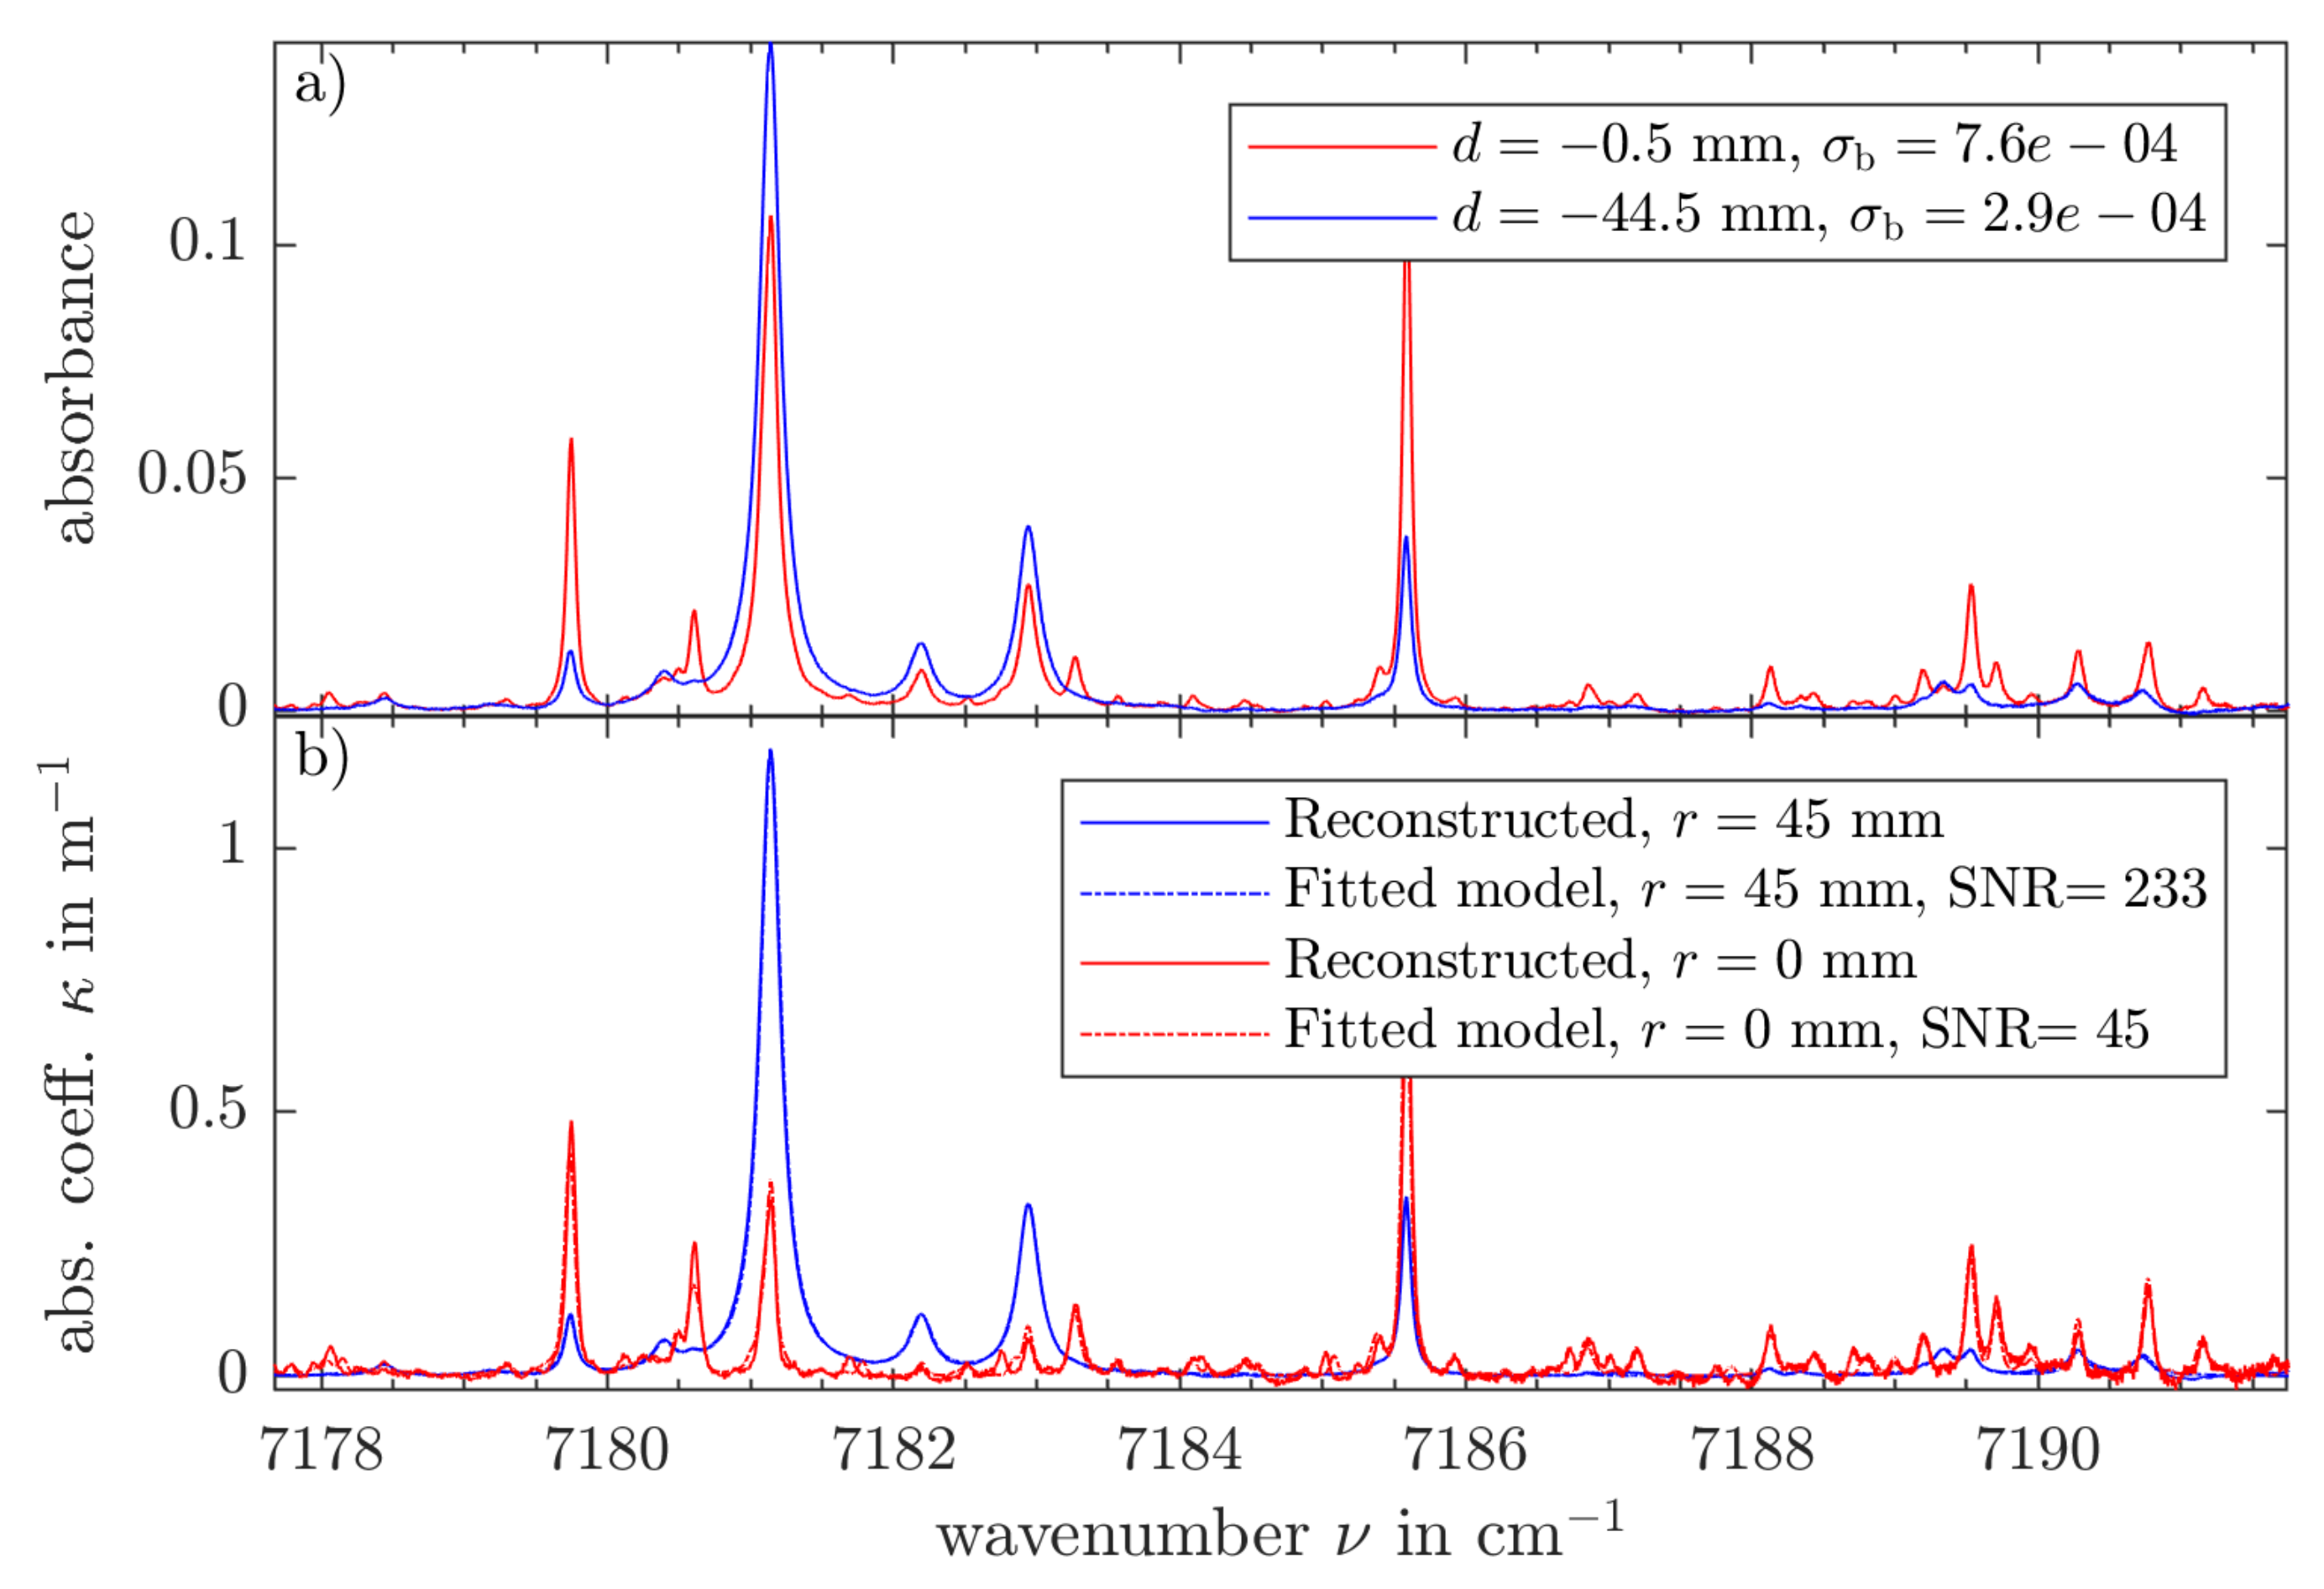
is used in the following reconstructions of all operating points. In the first step of LHAT, the local absorption coefficient spectra are reconstructed. As an example, the reconstructed spectra of the innermost and outermost ring of the
mm level in the Me
measurements are shown in
Figure 3b in comparison to the input absorbance spectra of the center beam and one of the outermost measurement beams in
Figure 3a.
The reconstructed spectrum for the outer, ambient ring at
mm shows prominent cold absorption features at 7181 cm
, while the spectrum at
mm (flame center) shows significant hot absorption features between 7188 cm
and 7191 cm
and only weak cold absorption features. Comparing the measured absorbance spectrum at
mm in
Figure 3a to the reconstructed absorption coefficient spectrum at
mm in
Figure 3b shows that the algorithm is able to clearly resolve the narrow high temperature part of the line at 7181 cm
from the measured absorbance with the dominating, wide, low temperature absorption line. Furthermore, the fitted models prove that the reconstructed spectra still follow the shapes of realistic absorption lines.
To quantify signal quality, the peak signal to noise ratio (SNR) defined as the maximum absorption coefficient value divided by the standard deviation of the residuum is used. The low SNR of the spectrum at mm compared to the one at mm is explained by the low cumulative absorption length of all beams in the center region. Put differently, only very few beams pass through the innermost rings and the ones that do only have a very short absorption length in the inner rings (due to the small diameter of the rings). Thus, less information about the inner rings is provided by the measurement, which results in a smaller SNR of the reconstructed spectra. Nonetheless, the spectra of the inner rings facilitate the determination of temperature and water mole fraction in the center.
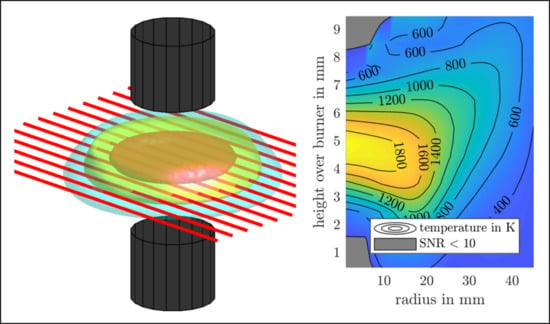
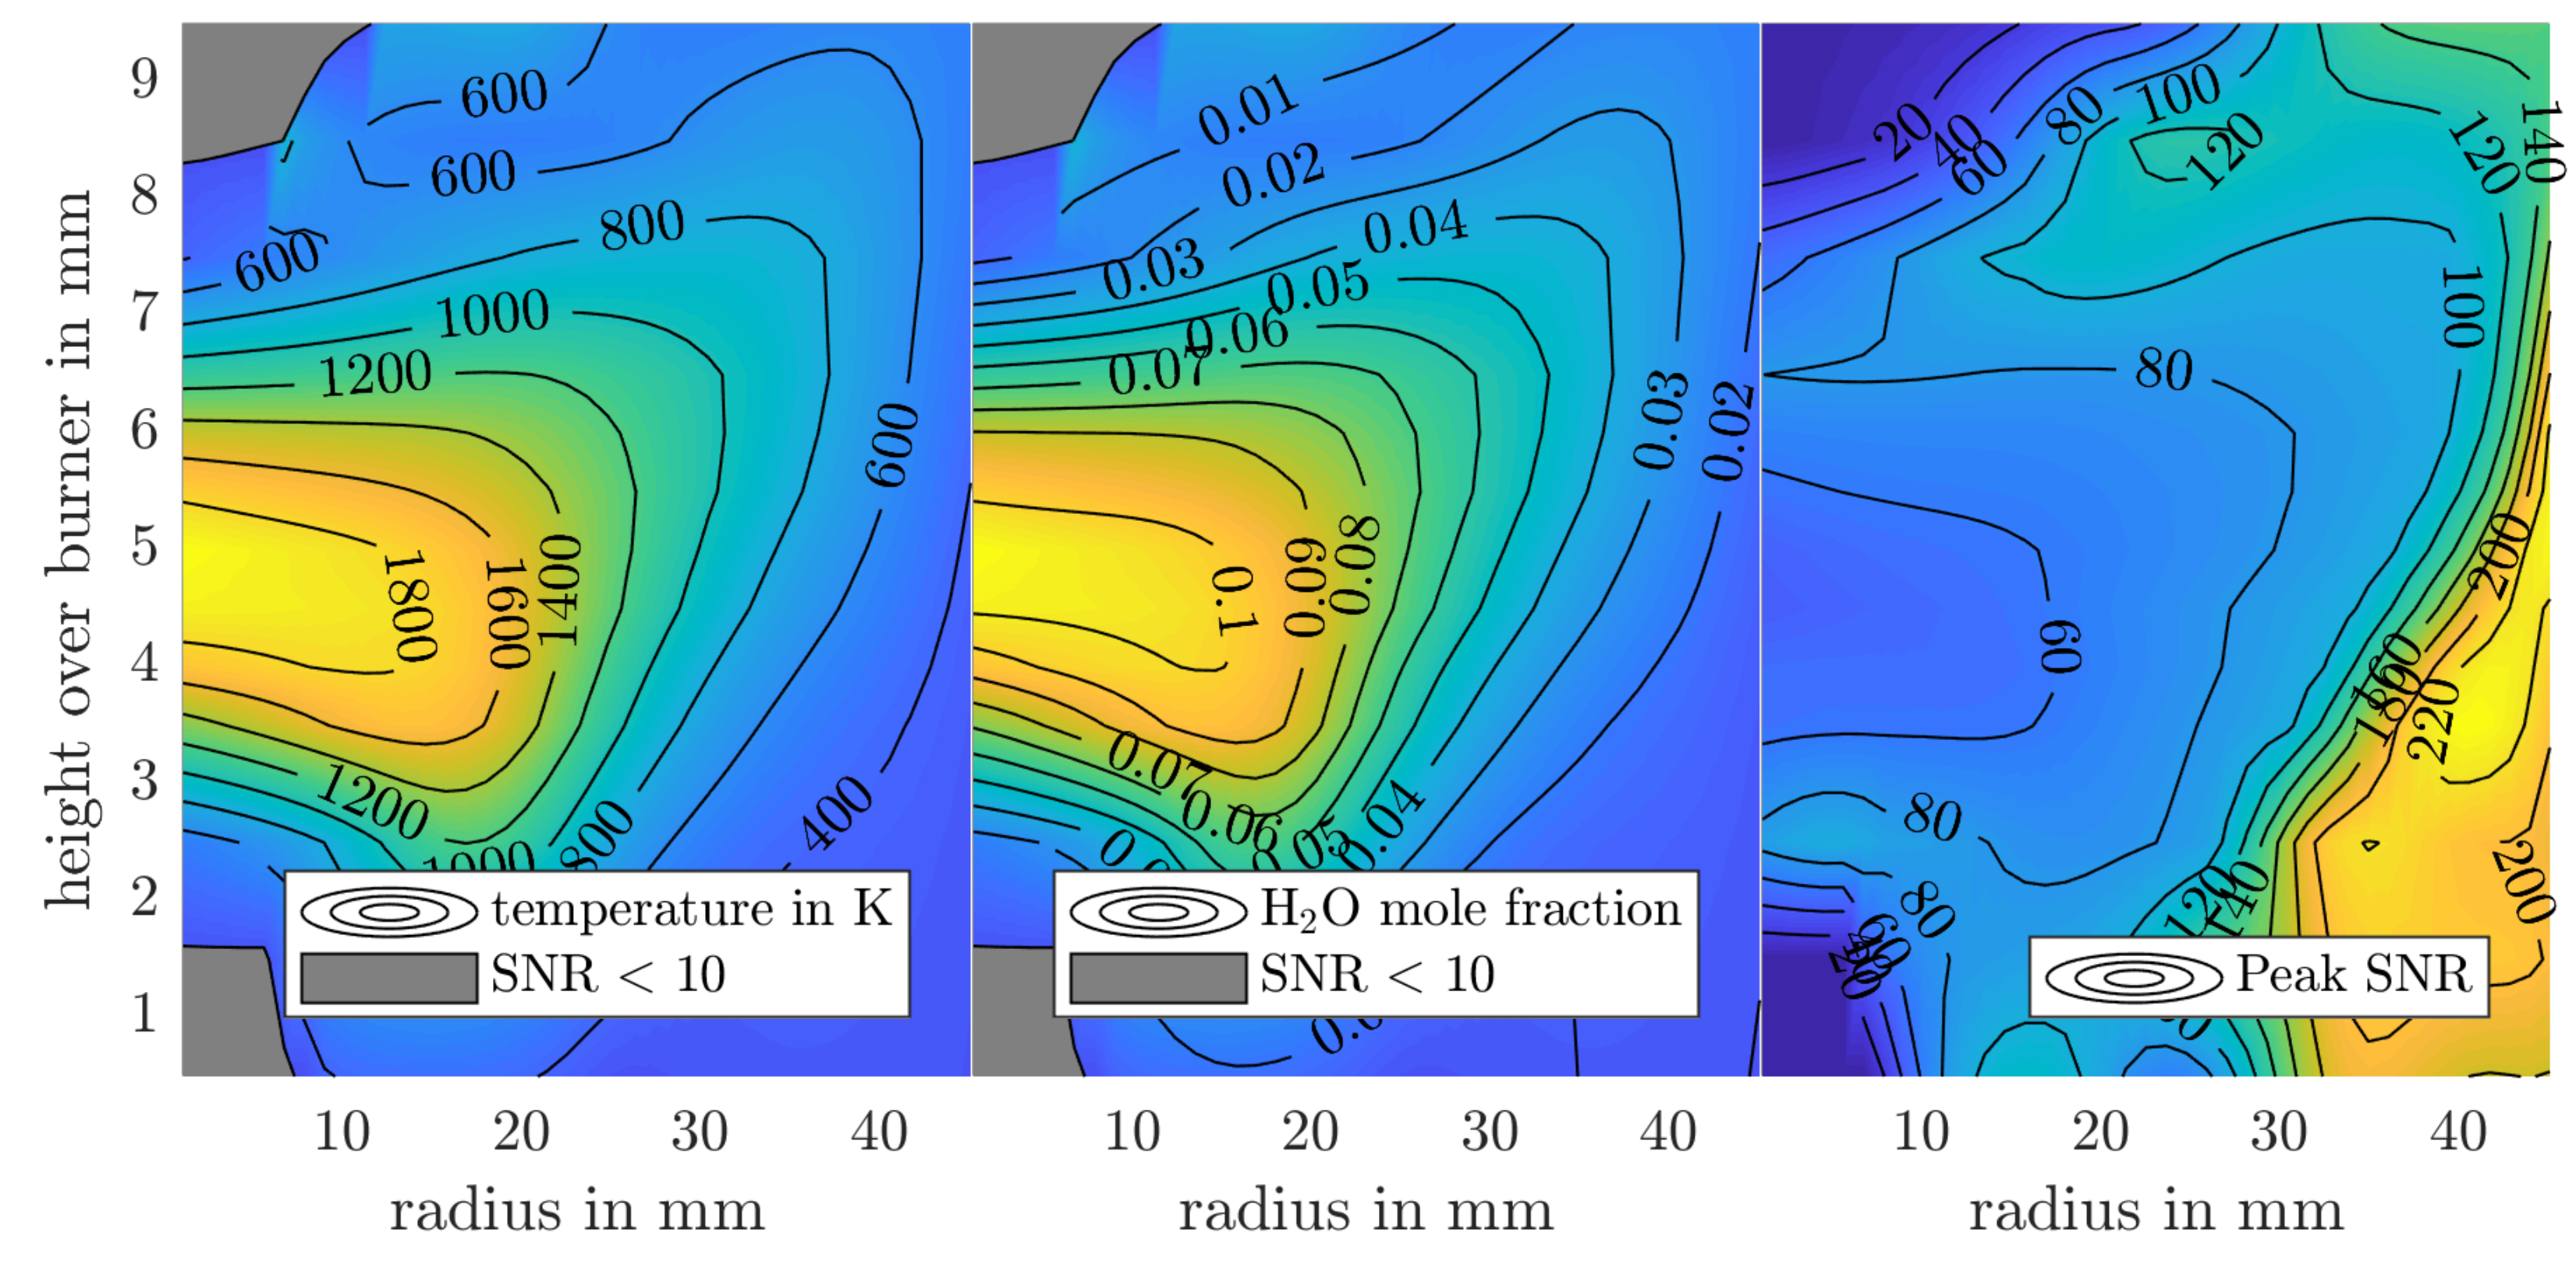
After spectroscopic regression, full radial and axial temperature and water mole fraction profiles of the burner are available, as is demonstrated in
Figure 4 for the Me
operating point.
Due to the lack of water in the fuel and oxidizer streams, the SNR in the respective regions is small and leads to unreasonable results especially in temperature regression. Hence, regions with a SNR below 10 are masked in
Figure 4. For reference, the full SNR map for the Me
reconstruction is given in
Figure 4 as well. As expected, the SNR increases with distance from the center axis due to the better coverage in the beam array and the high absorbance signal of ambient air. The availability of localized SNR data is a unique feature of LHAT with its capability to reconstruct full absorption coefficient spectra.
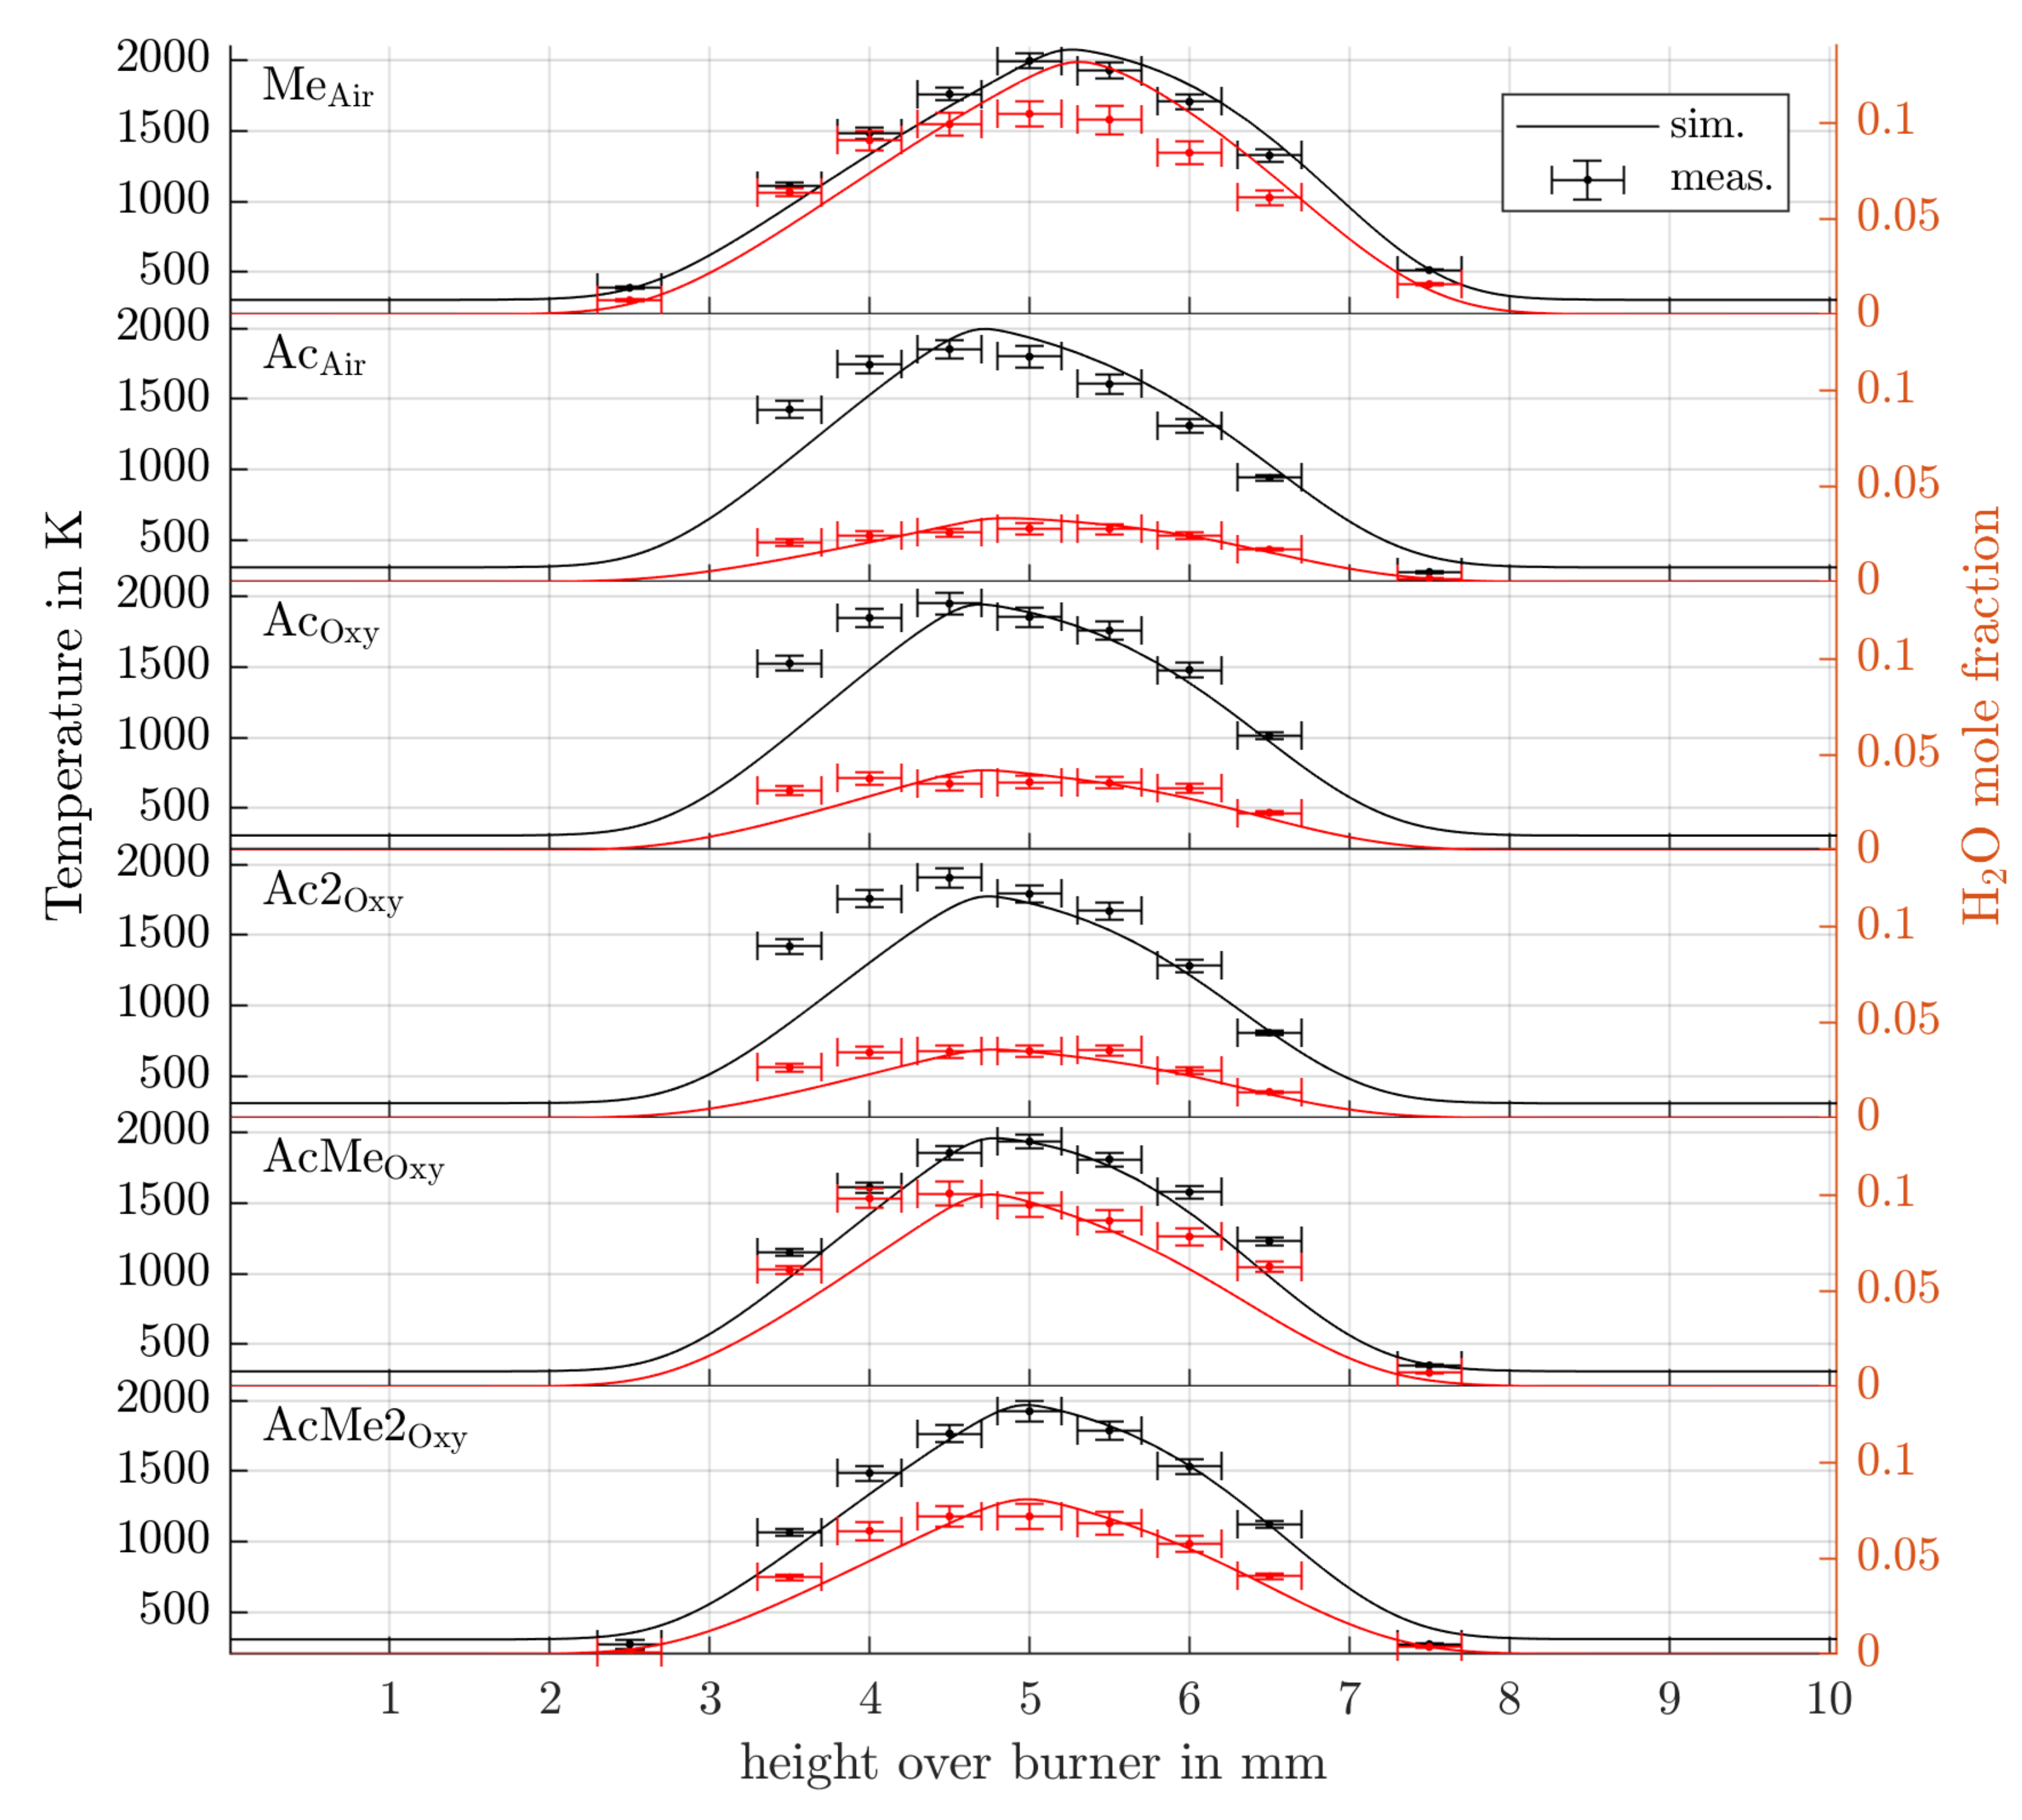
The tomography results are compared to temperature and water mole fraction retrieved from simulations using the ITV reaction mechanism presented in [
10]. The simulations were performed with the in-house code FlameMaster [
16]. The comparison to the tomography results on the burner center line is given in
Figure 5.
The error bars in axial direction refer to the measured laser beam width at half maximum. The vertical error bars in temperature and mole fraction represent a
-interval and are calculated in a nonlinear error propagation through the local spectroscopic regression (Equation (
9)) using the method described in [
17]. Similar to the procedure in [
18], only the measurement noise estimated from the residuum of the local spectroscopic regression is considered in the error propagation. Hence, the given error bars only account for the precision of the measurement. The decrease in accuracy arising from uncertain line data and prior information is not regarded here as the analysis is beyond the scope of this work. Realistically, the total error bounds of temperature including systematic errors are estimated to be in the order of 100 K. A detailed discussion of systematic errors arising from tomographic reconstruction and spectroscopic modelling is postponed for future work. Except for the mole fraction peak of the Me
operating point, the peak values in temperature and mole fraction match the simulations well. Similar to the mass spectrometry study [
1], the water mole fraction profiles often are wider than the simulations predict. Part of this effect is most probably due to the limited spatial resolution of the 0.4 mm FWHM laser beam, respectively the probe in [
1], but as the horizontal error bars suggest, the beam diameter does not sufficiently explain the broadening of the axial profile. Nonetheless, we need to emphasize that this broadening cannot be introduced by the choice of regularization as all height levels in the burner were reconstructed separately. Hence, the regularization could only have an influence on the radial resolution. In consequence, the observed deviations can only be explained by inaccuracies in the simulation or inaccuracies not regarded in the error analysis yet.
4. Discussion & Conclusions
In this work, we demonstrate LHAT on an axissymmetric counterflow burner for the non-invasive measurement of flame temperatures and water mole fraction. The local absorption coefficient spectra reconstructed by LHAT allow for a better assessment of measurement uncertainty in tomography, by giving a local SNR value and spectroscopic residuum for each node. By applying a nonlinear error propagation on each local spectroscopic regression, a stochastic measurement uncertainty for each temperature and mole fraction value is given. Nonetheless, for a full measurement error assessment, the systematic uncertainty in the assumed prior as well as in the line data would need to be considered. This full uncertainty assessment is beyond the scope of this work but is a promising research topic for future work.
For the determination of the regularization parameter we introduce a new method based on the residua of the local spectroscopic regressions. It balances the effects of increased white noise due to under-regularization and the unphysical distortion of line shapes due to over-regularization.
The regularization parameter determined with this method is successfully employed in the reconstructions of several operating points of the counterflow burner. The resulting reconstruction gives plausible temperature and water mole fraction profiles for the full 2D field. Numerical simulations performed for the burner center axis match the tomographic reconstructions sufficiently well. The observed deviations between experiment and simulation cannot yet be attributed unambiguously to inaccuracies in experiment or simulation. As aforementioned, this demands additional research effort in the error analysis for these tomographic measurements or further reference measurements.
Nonetheless, the capability of LHAT as a non-invasive measurement method for reference data with the potential for reliable uncertainty estimations in tomographic reconstructions has been demonstrated.


