3D Evolutionary Reconstruction of Scalar Fields in the Gas-Phase


Institute for Combustion and Gas Dynamics, Fluid Dynamics, University of Duisburg-Essen, 47057 Duisburg, Germany
*
Author to whom correspondence should be addressed.
Energies 2019, 12(11), 2075; https://doi.org/10.3390/en12112075
Submission received: 12 April 2019
/
Revised: 17 May 2019
/
Accepted: 21 May 2019
/
Published: 30 May 2019
(This article belongs to the Special Issue Tomographic and Volumetric Diagnostics in Flames)
Abstract
:An evolutionary reconstruction technique (ERT) was developed for three-dimensional (3D) reconstruction of luminescent objects, in particular turbulent flames for the first time. The computed tomography (CT) algorithm is comprised of a genetic algorithm (GA) and a ray-tracing software. To guide the reconstruction process, a mask is introduced. It uses a Metropolis algorithm (MA) to sample locations where specific genetic operators can be applied. Based on an extensive parameter study, performed on several types of phantoms, the ability of our algorithm for 3D reconstructions of fields with varying complexities is demonstrated. Furthermore, it was applied to three experiments, to reconstruct the instantaneous chemiluminescence field of a bunsen flame, a highly turbulent swirl flame and the turbulent Cambridge-Sandia stratified flame. Additionally, we show direct and quantitative comparison to an advanced computed tomography of chemiluminescence (CTC) method that is based on an algebraic reconstruction technique (ART). The results showed good agreement between CTC and ERT using both phantom data from flame simulations, and experimental data.
1. Introduction
In the last decades 3D computed tomography (CT) methods have seen widespread use in numerous areas of engineering and physical sciences research. The methods have combined CT with various different measurement techniques such as laser absorption spectroscopy [1,2,3], schlieren [4,5], chemiluminescence [6,7,8,9,10,11,12,13,14,15,16,17] and particle image velocimetry [18,19]. Generally, projection measurements that are obtained at different angles around the probed volume are used for reconstructions.
Several forms of algorithms exist to deal with the inversion problem of tomography. The classical filtered back projection (FBP) algorithm is based on the Radon transform and the Fourier slice theorem [20]. The FBP can generally be applied when a large number of projections is available to facilitate the Fourier transformations. Therefore, the algorithm is not useful when (optical) access to the target is limited, which is the case in most engineering applications.
For solving a discrete formulated inversion problem in the form of a linear system of equations, iterative methods were developed, such as the algebraic reconstruction technique (ART) [21]. Diverse variants of the ART were established for computed tomography of chemiluminescence (CTC) [6,8,9,11,12,13,15,16,17].
Typical engineering applications allow only a moderate number of projections to be taken and the resulting linear system of equations is rank-deficient, which leads to a set of non-unique solutions [22]. To get closer to the true solution, prior information can be incorporated in the reconstruction scheme. This can be achieved for example by a constrained first order Tikhonov regularization, which imposes non-negativity and smoothness [23]. Another approach casts the inversion problem into a Bayesian framework to consider prior information [24,25].
The application of genetic algorithms (GAs) was first introduced to tomography by Kihm et al. [26], Kihm and Lyons [27], and is still in its early stages of development. Wu et al. [28] presented a method for addressing multiphase flows in fluidized beds with a GA using binary images. In the same context, Yang et al. [29,30] compares a simultaneous algebraic reconstruction technique (SART) with an adaptive genetic algorithm (AGA) and proposes a hybrid version. Additionally, GAs were used in the reconstruction of binary matrices in discrete tomographic problems e.g., by Batenburg [31], Valenti [32] and Di Gesù et al. [33], and reconstruction of the resistivity distribution in inhomogeneous objects, called electrical impedance tomography (EIT), was performed by Olmi et al. [34].
Our application of the GA is very different to the previously cited problems as we reconstruct directly in 3D rather than slice-wise as done up to now, which neglects the perspective effect in the projections. We have applied the evolutionary reconstruction technique (ERT) in the first stage to premixed flames. A premixed flame is a thin reaction zone separating unburned reactants from burned products. In most practical cases the structure is a highly complex deformed thin manifold due to turbulence, see Figure 1, but could be statistically symmetric. Reconstructions of such kind will help to determine important flame geometry information, such as wrinkling, vortex shedding and breakdown and regions of local extinction.
Evolutionary methods entail probabilistic algorithms and try to mimic the evolutionary processes observed in nature [37,38]. In our ERT program, an individual (chromosome) of a population is a 3D scalar field that is implemented as an array of voxels representing the discretized reconstruction domain. Projections of the field, which are needed for fitness evaluation, are generated in the form of 2D images, with the help of a pin-hole camera-rendering algorithm. We used an open source code [39,40,41,42] in the first stage and later developed an in-house ray-tracing algorithm, which improved the total run-time of the ERT algorithm.
Continuous and direct ray-tracing of the reconstruction domain during the evolutionary process will allow us in later applications to implement more complex measurement models. These can be, e.g., particle interaction, multi-phase flows or accounting for beam steering. Additionally, a calibration free reconstruction method is feasible with this method by optimizing the cameras parameters simultaneously while reconstructing. This is generally not possible for our CTC method [8,9,16,17], as the matrix to be inverted is formed in a one-time ray-tracing step.
The dimensionality of the ERT optimization problem is proportional to the total number of voxels, such that the size of the reconstruction domain is limited by the available computational power. To alleviate the computational cost, we introduce an Metropolis algorithm (MA)-based masking method, which helps achieve a faster convergence. The stochastic mask chooses random locations/voxels for the genetic operators.
We conducted an extensive parameter study on generic phantoms (e.g., a torus, a hollow sphere and a Gaussian-shaped intensity profile), which are exactly known fields, to determine the sensitivity of the ERT to its parameters. The capability of the ERT to reconstruct complex structures was tested in more depth using three different flame phantoms that were generated by large eddy simulations (LES) and direct numerical simulations (DNS) of available laboratory burners. These were a Bunsen flame, a swirl flame and the Cambridge–Sandia stratified burner. Furthermore, we present experimental reconstructions of these flames using a multi-camera setup. The camera setup was tested in previous experiments [16,17] and we compare the ERT results to ART-based reconstructions using a CTC method [8,9] that features an advanced camera model.
2. The Evolutionary Reconstruction Scheme
The main part of the program is coded in Fortran 90 and sub-parts related to the vlib ray-tracing algorithm in C. The code is fully parallelized on the chromosome level, i.e., the population is divided between the number of available CPU’s.
The algorithm uses either projections of a 3D phantom or experimental reference images. First a stochastic mask is created based on the reference images. Following this, the GA starts to initialize a population and each individual is evaluated for its fitness by ray-tracing. Subsequently, the evolution step can be performed iteratively and the individuals can be re-evaluated for their fitness. After a certain number of generations the stochastic mask is re-calculated in a second stage, based on the individual with the highest fitness. The algorithm terminates when either a threshold value for the fitness, or the maximum number of generations is reached. In Algorithm 1 the structure of the ERT is given as a pseudo-code.
| Algorithm 1 Evolutionary reconstruction technique. | |
| 1: Start | |
| 2: | ▹ Read GA and image settings |
| 3: | ▹ Read reference images |
| 4: | ▹ Create stochastic mask |
| 5: | ▹ Initialize population |
| 6: | ▹ Evaluate Fitness |
| 7: | ▹ Calculate ranks |
| 8: | ▹ Get best chromosome |
| 9: while and do | |
| 10: | ▹ Perform evolution step |
| 11: | ▹ Evaluate fitness |
| 12: | ▹ Calculate ranks |
| 13: | ▹ Get best chromosome |
| 14: if and then | |
| 15: | ▹ Re-create stochastic mask |
| 16: end if | |
| 17: | |
| 18: end while | |
| 19: End | |
2.1. Ray-Tracing
For creating projections of the reconstruction domain, size by by voxels, we have firstly used the open-source API vlib [39,40,41,42]. Vlib is written in C and provides several functions and methods to set up a ray-tracing program that suits the user’s needs. It is volume-based by design, which means that a scene constitutes objects that occupy a volume in world space. The properties of the objects can be assigned via scalar fields [41].
The standard left-handed coordinate system used in computer graphics was implemented. The cameras look at the origin by default and their positions are given in spherical coordinates, defined by a distance R from the origin, an azimuth angle and an inclination angle .
The camera is modelled as a simple pin-hole. The viewport has the size of the reconstruction domain dimensions NX by NY. The distance of the image plane to the pin-hole is set to with the opening angle , such that the camera view covers one side of the box completely. This ensures that we see all the data. Figure 2 shows the setup of the camera view, which was chosen for the phantom reconstructions. For experimental reconstructions the viewport needs to be scaled properly in accordance with the physical sensor specifications, and taking into consideration if any binning is used in the reference images.
To speed-up the rendering process two modifications were made to the vlib source code. Firstly, a rendering function was implemented which returns an image directly as an array of floating point numbers with pixel values in the range without outputting an image file. Secondly, the fields are passed to vlib as arrays, saving considerable computation time.
We also developed a run-time-optimized volumetric ray-tracer. Its basic setup is shown in Figure 2. A camera pixel’s intensity I corresponds to the integrated line-of-sight (LOS) value sampled at discrete steps :
The start and end points of the summation are given by intersection of the LOS with the reconstruction domain. The field value at location is calculated by trilinear interpolation of the probed volume. All results presented in Section 3, which are related to the parameter study, were calculated with the vlib ray-tracer. Our in-house ray-tracer was used for reconstructions of the flame phantom fields and in the experimental section. The results of the parameter study are not affected by the ray-tracing scheme, since we solely focused on the features of the GA.
2.2. The Genetic Algorithm
The number of individuals, PopSize, of the population is fixed for the run-time of our algorithm. A box of a defined size comprising NX by NY by NZ voxels is identified for an individual, and this box is the tomographic reconstruction domain. The individual’s box is referred to as a chromosome and the voxels are the genes. The genes of a chromosome initially contain an intensity value of zero.
Each chromosome has an associated Z value, which is a fitness marker that can be calculated via different fitness functions. To measure the fitness between the reference images x and the rendered images y of the reconstruction we use a distance metric. For a high-dimensional data, like in this application, it is not directly obvious which distance measure is the most appropriate. The general norm is defined as
where x and y are elements of the vector space . Reference [43] show that the meaningfulness of goes down with increasing dimensionality for higher values of p. This means that it gets harder to discriminate between the nearest and the furthest neighboring element. Therefore, in general, an norm (Manhattan distance) should be the first choice, followed by an norm (Euclidean distance) for high values of d. They suggest using a fractional norm for high dimensional data mining problems.
In our algorithm, we implemented a Manhattan distance and the Z value is the average of the calculated error distance values of all the views. The Manhattan-distance-based Z value is given by
where w and h are the image width and height of the reference and rendered images, respectively, and N is the number of views. The absolute fitness is calculated as , and the relative fitness is deduced by rescaling Z to a range from zero to one and inverting it:
Here max(Z) is the largest and min(Z) the smallest Z value of the current population. Thus, the chromosome with the lowest absolute fitness value has a relative fitness of zero and the chromosome with the highest absolute fitness has a relative fitness of one.
The GA evolution step for forming a new generation is shown in Algorithm 2. A member of the new generation is obtained by selecting two members of the old generation by a selection scheme. This function induces a selection bias towards chromosomes with a higher fitness, which ultimately leads to convergence of the solution. Here, we use the simple method of fitness proportional selection that was originally proposed by Holland [37]. The selection procedure corresponds to a roulette wheel design. The population size equals the number of bins on the roulette wheel. Each bin has a size that is proportional to the fitness value. It follows that a member of the population is selected with a probability . Here is the relative fitness value.
The selected chromosomes are merged (crossover) by forming a voxel-wise average. Subsequently a mutation operator, an annihilation operator and a local filter operator are applied on the resulting chromosome with predefined probabilities (mutation rate, annihilation rate and filter rate). Mutation is carried out by randomly selecting a defined number of voxels (mutation intensity) and changing their values randomly. These voxels are chosen from an array of random coordinates that are sampled by a Metropolis algorithm in a previous step (stochastic mask). The assigned intensity value for a selected voxel is drawn from a normal distribution. A Fortran 90 implementation of a random number generator with a truncated normal distribution has been taken from Burkhardt [44] for this purpose. The mean of the normal distribution is taken as the average intensity of the voxel that has to be mutated and its neighbouring voxels. The standard deviation is a free parameter and has to be specified. The normal distribution is always cut off for values outside of the interval .
| Algorithm 2 Evolution Step | |
| 1: function Evolution_Step(POP, MSK) | ▹ Input is the population and mask |
| 2: for do | |
| 3: | ▹ Select two chromosomes |
| 4: | ▹ Merge to offspring |
| 5: | |
| 6: if then | |
| 7: | ▹ Apply mutation operator |
| 8: end if | |
| 9: if then | |
| 10: | ▹ Apply annihilation operator |
| 11: end if | |
| 12: if then | |
| 13: | ▹ Apply filter operator |
| 14: end if | |
| 15: end for | |
| 16: | ▹ Copy to new population |
| 17: return POP | |
| 18: end function | |
The annihilation operator randomly sets the intensity value of a defined number of voxels (annihilation intensity) to zero, with a certain probability (annihilation rate). Similarly, the local filter operator, applied with the filter rate probability, sets the intensity values of a defined number of voxels (filter intensity) to a value which is determined by filtering at a specific location. The filter kernel has weights of 1/2 for the central voxel and 1/12 for the six nearest neighbours. Locations where annihilation or filtering takes place are determined in a similar fashion as for mutation. The selection procedure continues until the new population size equals the preceding one.
For an improved convergence behaviour elitism was implemented. Two notions of elitism were used: a weak form and a strong form. Weak elitism ensures that the best chromosome is selected with a probability of in the selection process. The second chromosome to pair it with for offspring-formation is randomly selected. By selecting one chromosome randomly, the merged and mutated/annihilated individual might not be optimal anymore. The strong form is a classical elitism, meaning that the best individual is copied untouched to the next generation without alterations. Both types of elites can influence the selection process and lead to an increased convergence rate.
2.3. The Stochastic Mask
The ERT optimization task can be more efficient by identifying the voxels that are present within a region of interest to reduce the search space rather than probing all the available voxels, so that a solution is reached within a shorter run-time. To achieve this, we have implemented a stochastic mask using a Metropolis algorithm (MA). The MA stems from the Markov chain-Monte–Carlo methods (MCMC) family. Usually, the MA is used to sample random numbers of arbitrary density functions, or as a tool in Monte–Carlo integration. The idea is to create a Markov chain which has the desired target density as a stationary distribution. After a certain number of iterations the chain generates random numbers which are distributed according to the target density with a good approximation. The original MA was developed by Metropolis et al. [45], and Hastings [46] refined it to a more general method in 1970. An introduction to the topic is given, e.g., by Chib and Greenberg [47].
In the first stage, the MA uses the reference images as prior information to sample random numbers for the mutation and annihilation process as a preparation step before the GA starts. The pixel intensities within an image represent a 2D function from which the MA can draw random numbers.
In our adaptation of the MA a new candidate of the Markov-Chain, which is a voxel, is determined by tracing a ray through a voxel in the domain to a pixel on the image plain. The Metropolis method divides the image intensity of this pixel by the pixel intensity value corresponding to the previous voxel of the Markov chain. A voxel is accepted or rejected as a new member of the Markov-Chain based on a consensus decision with the acceptance probability for each camera i. In Algorithm 3, the pseudo-code of a Metropolis sampling step is given. The function getPixel() returns the location of a point in world space on the camera sensor in pixel coordinates , and is the intensity stored at pixel for the image of camera i. The upper index 0 indicates the actual position of the chain and p is the new candidate. The scheme is expanded to include all available information, by iterating over all projections. This method of sampling leads to a distribution of values in 3D world space which can be used as locations at which the GA mutates a voxel’s intensity. It shows similarities to a factorized MA [48], where a new member of the chain can be accepted on a consensus basis. Here the 3D target distribution is obviously not available and neither are its factors, but its projections. In Figure 3, an example is given for a mask generated from 15 rendered images of a downsampled DNS dataset [35,36] of the Cambridge-Sandia stratified flame.
| Algorithm 3 First stage Metropolis sampling step. | |
| 1: function MetropolisStep1() | ▹ input is a start location |
| 2: | ▹ |
| 3: | ▹ |
| 4: for do | |
| 5: | |
| 6: | |
| 7: if then | |
| 8: if then | |
| 9: return | |
| 10: end if | |
| 11: else | |
| 12: return | |
| 13: end if | |
| 14: end for | |
| 15: end function | |
For the second stage, after the reconstruction has reached an advanced state and the population has evolved over a certain number of generations, the best fitting chromosome is used to sample random mutation locations according to its intensity field. Alternatively, the magnitude of the gradient of the intensity field can be used as a marker. This helps sharpen regions with large gradients in the intensity field, i.e., the edges of the reconstructed object, like the flame front. The gradient is calculated by using a central difference scheme. We interchangeably sample from both, the intensity and the gradient fields, while keeping the obtained random locations for a certain number of generations before re-calculating them with a different field. For the second stage sampling the acceptance probability is given by the fraction of the intensity stored at a randomly drawn voxel and the previous voxel of the Markov chain, , see the pseudo-code in Algorithm 4.
| Algorithm 4 Second stage Metropolis sampling step. | |
| 1: function MetropolisStep2() | ▹ input is a start location |
| 2: | ▹ |
| 3: | ▹ |
| 4: if then | |
| 5: return | |
| 6: else | |
| 7: return | |
| 8: end if | |
| 9: end function | |
3. Phantom Study on Numerical Data
3.1. Parameter Study on Canonical Phantom Data
Before applying the ERT to complicated turbulent flame phantoms (LES and DNS data), we conducted a thorough parameter study on all relevant parameters, using simpler phantoms: a torus, a hollow sphere and a Gaussian-shaped intensity profile. We investigated the sensitivities of the ERT with respect to the population size, number of generations, mutation rate/intensity, , annihilation rate/intensity, filter rate/intensity and elites. The tomography scene was numerically set by placing the cameras with an equiangular spacing of in a semicircular plane () around the origin of the coordinate system.
The angular spacing between the cameras was calculated such that the camera at is omitted to avoid opposite views, as shown in Figure 4. Opposed views are correlated on a large part and hence add limited new information to the system for an integrated LOS measurement, for the optically thin flames that have been targeted in this work. For the torus phantom 8 cameras were used, and for the hollow sphere/Gaussian profile phantom 10 cameras. The reconstruction domain was chosen to be by by . Accordingly, projections of the phantoms were created, with a resolution of 40 by 40 pixels, at the camera locations to generate the reference images. Reasonable dependencies between the parameters were observed. For example lowering the mutation rate results in higher fitness values and at the same time, the number of generations might be adjusted to account for the slower convergence rate at the beginning, see Figure 5a.
Here we want to highlight three major aspects, as they are very special to our GA, namely the annihilation operator, the filter operator and the (second stage) stochastic mask. In Figure 5b the evolutionary path (absolute fitness of the best fitting chromosome) of a torus reconstruction with and without a second stage MA sampling is displayed. The sudden improvement in the fitness value is clearly visible, which indicates that providing gradients as a source for mutation locations is valuable for the reconstruction process to get to higher fitness values within the same runtime.
For studying the effect of the annihilation operator we used the hollow sphere phantom. In Figure 6a the evolutionary paths for different annihilation rates are shown and in (b) the mean of the squared Manhattan distance of the images, mean SqMD (2D), and the squared Manhattan distance of the fields, SqMD (3D) are given. The manhattan distance is normalized by the phantom field, similar to the error distance used by Mohri et al. [16].
Here is the reconstructed field and the phantom field, respectively.
The algorithm converges on a higher fitness level and both distance measures decrease with an increased annihilation rate, see Figure 6. The mutation rate was set to 0.30 in these reconstructions and must be reasonably balanced against the annihilation rate. Figure 5a and Figure 6b indicate that picking an annihilation rate above the mutation rate is a good choice.
In Section 4.1 we show the reconstruction of an averaged chemiluminescence field of a bunsen flame, which has flat intensity gradients in the images. The reconstruction of large regions with homogenous intensities can also be challenging, since our genetic operators are applied voxel-wise. This might amplify salt and pepper noise in the reconstructions. Therefore, we want to attenuate possible artefacts by the application of a local filter to smooth the field where it is necessary. Figure 7 shows different filter rates for the reconstruction of a gaussian shaped intensity profile. The fitness values and error distances clearly improve with the filter applied.
3.2. Phantom Study on Three Generic Flame Types
The phantoms used in the parameter study are of limited complexity when compared to real flame chemiluminescence fields. For example, the torus is a uniform distribution of intensity values with no internal structures. Flames may exhibit arbitrary shapes with gradients, lean regions and hollow zones due to local extinction or the burner geometry. Therefore, for a more stringent validation of the algorithm we rely on flame simulation data since they will provide a numerical field that represents the flame very closely. All the flame phantoms used were generated by our in-house code ‘PsiPhi’ [49,50]. The synthetic CT setup generated for reconstructing the flame phantoms was equivalent to the real CT experiment in terms of number of cameras and their angular spacing. The high-resolution phantoms are downsampled to a smaller size in order to save the computational time required by the ERT. The correlation values and the normed error measure SqMD (3D) of the reconstructed field and the phantom field were calculated for all the flame phantom studies.
3.3. The Bunsen Flame Phantom
A standard premixed natural gas/air laboratory Bunsen flame was considered here, which on average has a conical shape. The Bunsen simulation was previously generated for testing our background-oriented schlieren tomography (BOST) code [5]. The HRR was cropped and downsampled to a size of by by voxels by cubic interpolation, resulting in a voxel resolution of 2 mm after binning. The synthetic CT setup consisted of 23 cameras, arranged in one plane with an equiangular spacing of . The resolution of the images was set in accordance with the domain size to 50 by 60 pixels. The Bunsen phantom and correlation values (Pearson correlation coefficient) between the original phantom and its reconstruction are displayed in Figure 8. The ERT is able to reconstruct the geometry of the flame with very good accuracy and in agreement with the CTC reconstruction. The CTC reconstruction gives higher correlation values for the slices, as shown here, and for the 3D field (not shown). For the 3D field, the correlation from CTC was 0.9855 and from ERT was 0.9792. Here the 3D error distance of the ERT gave slightly better values than for the CTC. The values were and .
3.4. The Swirl Flame Phantom
The TECFLAM swirl burner provides a premixed methane/air flame through an annular slot that is shielded by a co-flow of air emanating from an outer annular slot [51,52]. The LES [16] was generated for an equivalence ratio of 0.83, a swirl number of 0.75 and cold flow Reynolds number of 10,000. The LES ran on a grid containing 30 million cells, with a premixed generated manifold combustion model, in combination with an artificial flame thickening method [50]. Mohri et al. [16] used the simulation as a phantom for the first time in a high resolution CTC study, and Grauer et al. [5] used it as well for validation purposes. We cropped and downsampled the HRR field to a size of by by voxels by cubic interpolation. The resulting field had a voxel resolution of . The synthetic CT setup consisted of 24 cameras with an equiangular spacing of and images of size 66 by 43 pixels were rendered. In the displayed slices, see Figure 9, it can be observed that the ERT was able to reconstruct the v-shaped flame with similar accuracy as the CTC method. The 3D correlation for the CTC reconstruction was 0.9778 and for the ERT it was 0.8911. The 3D error distances were and .
3.5. The Cambridge–Sandia Stratified Flame Phantom
The Cambridge-Sandia stratified burner is operated with premixed methane/air mixtures emanating from an inner and outer annular slot. Stabilization of the flame is achieved by a central ceramic bluff body and a co-flow of air. Different fuel to air ratios, and , for the inner and outer flame can be used to investigate various modes of stratification. A sketch of the burner is given in Figure 10. Details of the flame conditions used in the current work are presented in Table 1. The flame has been well studied experimentally [53,54] and numerically [35,36,50,55,56].
The simulation by Proch et al. [35,36] was carried out on a grid with 1.6 billion cells with a resolution of 100 . A premixed flamelet generated manifold (PFGM) was used for combustion modelling, and the domain covered a region of 12 mm to 82 mm above the burner exit. The data was downsampled by cubic interpolation and cropped to a field of by by voxels.
The dimensions of the reconstruction domain were chosen equivalently, and the pixel/voxel resolution was mm. Fifteen cameras were placed in a half-circle in one plane with equiangular spacing of and image resolution of 52 by 55 pixels. The results of the reconstruction are shown in Figure 11. The 3D spatial correlation from CTC was 0.9688 and from ERT was 0.9007, and the 3D error distances were and . Both reconstructions clearly capture the shape of the flame and its internal structure.
To assess the stability of the reconstruction algorithm, we conducted 15 independent runs using the same synthetic setup and phantom. The mean of the squared 3D Manhattan distance was 0.2676 with a standard deviation of 0.0046. The mean of the 3D correlation was 0.8831 with a standard deviation of 0.0014.
4. Applications to Experimental Data
Our generic experimental setup [16] constitutes an array of Basler acA645-100 gm GigE cameras that are mounted on an aluminium plate in a semicircle with equiangular spacing of degrees. The arrangement around the Cambridge–Sandia stratified flame is shown as an example in Figure 12a. Five Bronkhorst mass-flow-controllers were used to regulate the flow-rates, and flame arresters were installed for safety.
Each camera was connected via an Ethernet cable and a common multi-port network hub (Gigabit smart TL-SG2424P) to the computer. Simultaneous triggering was achieved by a single signal generator at 5 Hz. The cameras feature a Sony ICX414 monochrome sensor with 659 by 494 pixels of size . A Kowa C-mount lens with a focal length of 12 mm was used on all cameras, and the aperture was kept at its largest opening for all.
First, the entire emission spectrum of the flame within the cameras’ spectral response, which is in the visible range, was captured. The hot blurred the images and we used filters to eliminate the signal, similar to our previous work [16]. Figure 12b shows a sample image of the Cambridge-Sandia stratified flame from one camera view. All cameras were carefully aligned with the help of a checkerboard calibration target, which was mounted on the burner.
4.1. The Bunsen Flame
For the standard Bunsen flame the setup was comprised of 23 cameras with an equiangular spacing of . We recorded 150 images at 5 Hz with an exposure time of 300 s. After background subtraction, the images were averaged to give the mean chemiluminescence intensity from a camera perspective. The challenge with reconstructing such averaged flame fields is to deal with both smooth gradients and sharp edges at the same time. We croppped and downsampled the images to a size of 45 by 78 pixels. Accordingly, the reconstruction domain was by by voxels in size, with a voxel resolution of mm. The ERT has resolved the expected conical flame shape to a good degree, exhibiting more salt and pepper noise than the CTC, see Figure 13.
4.2. The Swirl Flame
The CTC setup for the swirl flame consisted of 24 cameras with an angular spacing of , see Mohri et al. [16] for more details on the experiment. The cropped and downsampled images for this reconstruction had a resolution of 60 by 48 pixels. A domain of by by voxels was chosen, which had a voxel resolution of mm. The reconstructions show a very complex deformed flame structure, and the ERT resolved the key features, in good agreement with the CTC, see Figure 14.
4.3. The Cambridge-Sandia Stratified Flame
Here, 15 cameras were used with an angular spacing of . The images, recorded with an exposure time of 350 s, were cropped and downsampled to a size of 50 by 65 pixels. Accordingly, the reconstruction domain was discretized using by by voxels with a resolution of mm per voxel.
The reconstruction result is shown in Figure 15. The main shape and structure of the flame, as well as the central hollow region was recovered well by the ERT. As in the previous cases, more salt and pepper noise is visible in the ERT result. Compared to the instantaneous DNS field, Figure 11, the structures in the experimental reconstruction are thicker. This is partly due to motion blurring in the flame images (dictated by the camera exposure time), and partly due to other factors such as the reconstruction domain resolution. Nonetheless, this experimental demonstration shows that the ERT is capable of resolving the flame chemiluminescence field with good qualitative accuracy compared to the CTC.
5. Quantitative Comparisons—Phantoms and Experiments
In Figure 16a detailed overview of the correlation values for all three flame phantoms (left column) and experimental reconstructions (right column) is given. The graphs (a), (c) and (e) show the correlation between the original and reconstructed phantom using the CTC (CTC-PHA) and the ERT (ERT-PHA), and the correlation between the CTC and ERT (CTC-ERT), respectively. The data from the ERT is clearly more volatile and on a lower level than the CTC. The phantom studies show that the correlation decreases with increased height above the burner for both reconstruction techniques, although it is less pronounced for the CTC. A reason for this could be that when the flame covers a larger region at an increased height above the burner exit, the fan of rays of a perspective camera is less densly distributed across the voxels, compared to regions close to the central up-axis of the reconstruction domain. This is supported by Figure 16a, where the correlation data of the Bunsen flame does not decrease with increased height above the burner. The slices for this case, see Figure 8, show that the main structures of the flame are close to the central up axis of the reconstruction domain. For the experimental reconstructions the best agreement between ERT and CTC is obtained for the slices in the middle of the domain.
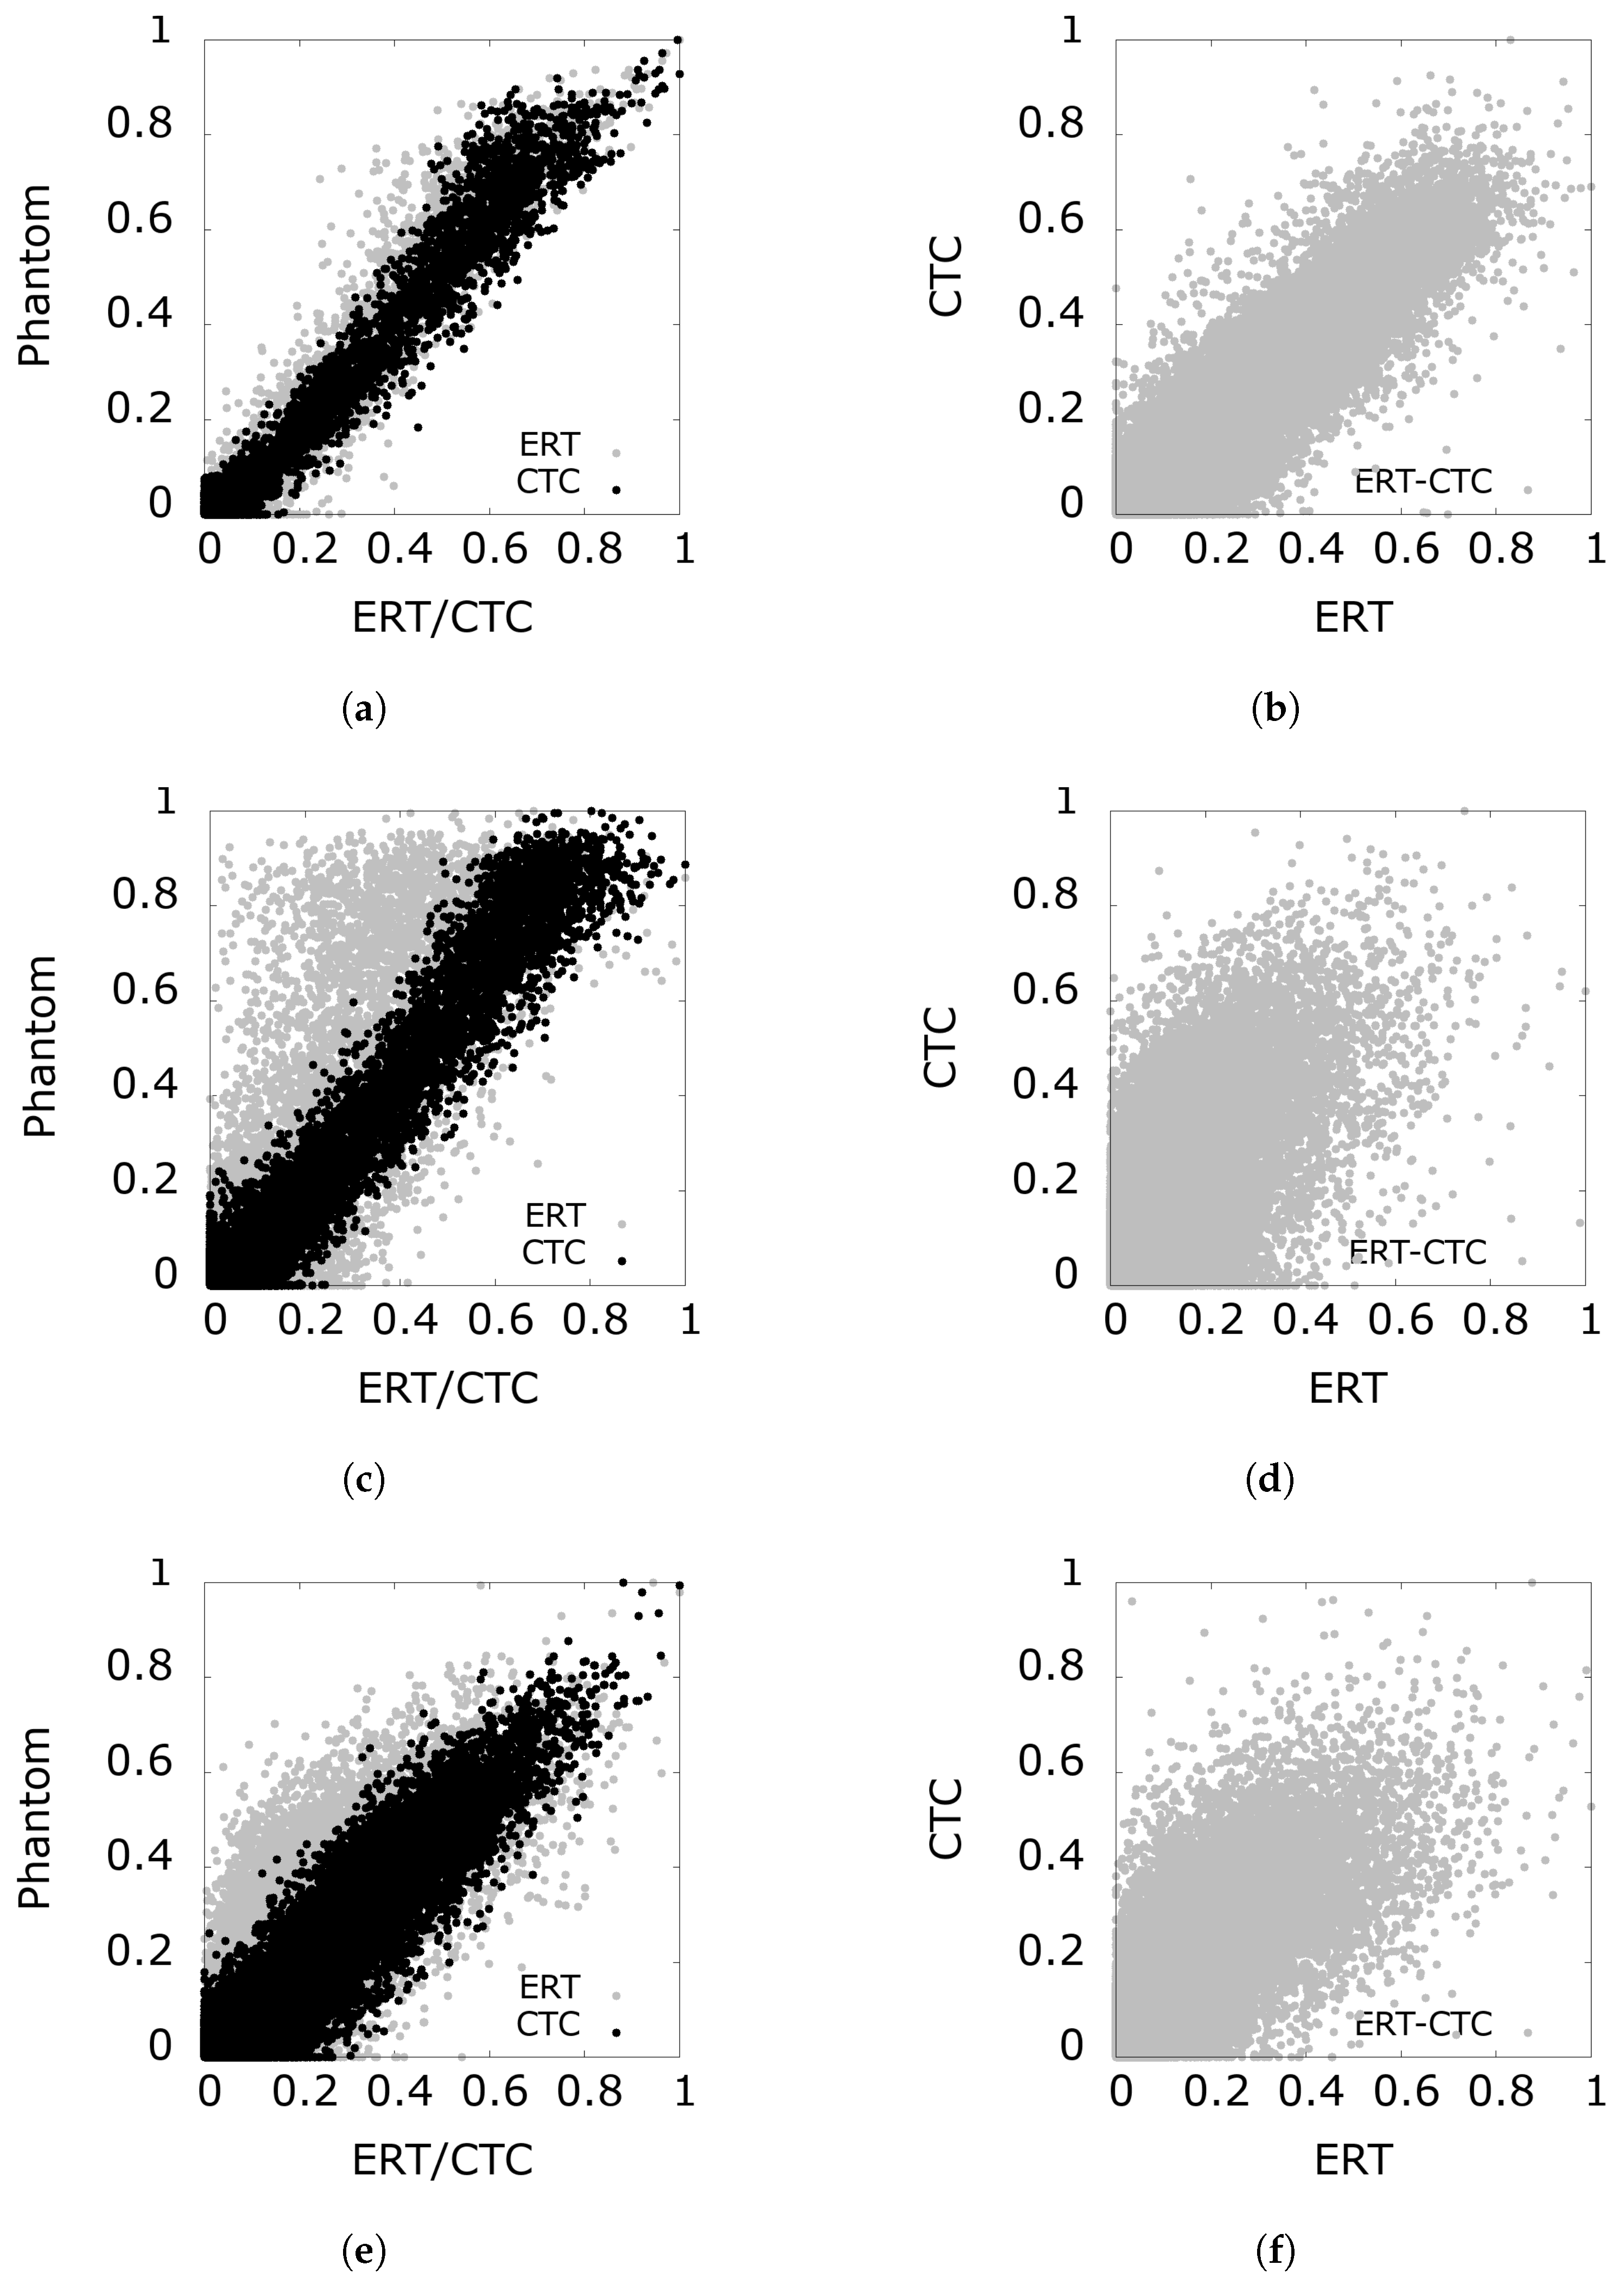
In Figure 17 scatter plots for the phantom and experimental reconstructions are given (normalized data). For two identical data sets, the value would lie on a -line through the origin of the coordinate system. The CTC method shows a narrower distribution in the phantom studies. The highest degree of similarity is achieved for the Bunsen phantom study and experiment.
6. Conclusions
We have successfully demonstrated that a reconstruction scheme based on an evolutionary program is able to reconstruct 3D scalar fields (flame chemiluminescence) and gave a proof of concept for the ERT. Genetic operators such as selection, crossover mutation, annihilation and filtering were tailored for the needs of the ERT. Additionally, a stochastic mask based on a Metropolis algorithm was introduced to reduce the dimensionality of the search space.
We have outlined the concept of the ERT and presented the fundamentals of our reconstruction algorithm. The sensitivities of the most important parameters were discussed. The algorithm was applied to several phantom fields derived from simulations, representing the true structure of a chemiluminescent flame. The reconstructions showed good overall agreement with the phantom data in terms of correlations and error distance measures, and were in line with our established CTC reconstructions. Additionally, we performed reconstructions with real flame chemiluminescence data. Three different flame types were investigated by the ERT and the CTC method. Visual inspection and correlation numbers showed that both methods give comparable results.
For the phantom studies, our CTC technique gave mainly better results, quantified in terms of correlation and error distances. This stems partly from the more advanced camera model that is used in CTC, but also from the fact that the ERT’s parameters were tuned such that we get results in an acceptable run-time for all of our reconstructions. The run-time is substantially dependent on the image rendering-time, although the program is executed as a parallel application. Massive parallelization which is available on GPUs will help to improve this aspect.
Author Contributions
Conceptualization, A.U., A.K. and K.M.; methodology, A.U., A.K. and K.M.; software, A.U.; validation, A.U., K.M.; formal analysis, A.U., K.M.; investigation, A.U., K.M.; resources, A.U., A.K. and K.M.; data curation, A.U., A.K. and K.M.; writing—original draft preparation, A.U.; writing—review and editing, A.U., A.K. and K.M.; visualization, A.U.; supervision, K.M.; project administration, K.M.; funding acquisition, A.K. and K.M.
Funding
This research received no external funding.
Acknowledgments
We would like to thank S. Hochgreb from Cambridge University for lending the Cambridge–Sandia stratified burner to us, and we are greatful for the the funding from the Ministerium für Innovation, Wissenschaft und Forschung des Landes Nordrhein-Westfalen. We thank Jan Menser for his assistance in measurements with the Cambridge–Sandia burner.
Conflicts of Interest
The authors declare no conflict of interest.
References
- Sivathanu, Y.; Lim, J.; Joseph, R. Statistical absorption tomography for turbulent flows. J. Quant. Spectrosc. Radiat. Transf. 2001, 68, 611–623. [Google Scholar] [CrossRef]
- Liu, C.; Cao, Z.; Lin, Y.; Xu, L.; McCann, H. Online cross-sectional monitoring of a swirling flame using TDLAS tomography. IEEE Trans. Instrum. Meas. 2018, 67, 1338–1348. [Google Scholar] [CrossRef]
- Liu, C.; Xu, L. Laser absorption spectroscopy for combustion diagnosis in reactive flows: A review. Appl. Spectrosc. Rev. 2019, 54, 1–44. [Google Scholar] [CrossRef]
- Agrawal, A.K.; Butuk, N.K.; Gollahalli, S.R.; Griffin, D. Three-dimensional rainbow schlieren tomography of a temperature field in gas flows. Appl. Opt. 1998, 37, 479–485. [Google Scholar] [CrossRef]
- Grauer, S.; Unterberger, A.; Rittler, A.; Daun, K.J.; Kempf, A.; Mohri, K. Instantaneous 3D flame imaging by background-oriented schlieren tomography. Combust. Flame 2018, 196, 284–299. [Google Scholar] [CrossRef]
- Hertz, H.M.; Faris, G.W. Emission tomography of flame radicals. Opt. Lett. 1988, 13, 351–353. [Google Scholar] [CrossRef] [PubMed] [Green Version]
- Ishino, Y.; Ohiwa, N. Three-Dimensional Computerized Tomographic reconstruction of instantaneous distribution of chemiluminescence of a turbulent premixed flame. JSME Int. J. Ser. Fluids Therm. Eng. 2005, 48, 34–40. [Google Scholar] [CrossRef]
- Floyd, J.; Kempf, A.M. Computed Tomography of Chemiluminescence (CTC): High resolution and instantaneous 3D measurements of a matrix burner. Proc. Combust. Inst. 2011, 33, 751–758. [Google Scholar] [CrossRef]
- Floyd, J.; Geipel, P.; Kempf, A.M. Computed Tomography of Chemiluminescence (CTC): 3D time resolved measurements of a turbulent opposed jet flame. Combust. Flame 2011, 158, 376–391. [Google Scholar] [CrossRef]
- Anikin, N.B.; Suntz, R.; Bockhorn, H. Tomographic reconstruction of 2D-OH*-chemiluminescence distributions in turbulent diffusion flames. Appl. Phys. B 2012, 107, 591–602. [Google Scholar] [CrossRef]
- Hossain, M.; Lu, G.; Yan, Y. Optical fiber imaging based tomographic reconstruction of burner flames. IEEE Trans. Instrum. Meas. 2012, 61, 1417–1425. [Google Scholar] [CrossRef]
- Worth, N.A.; Dawson, J.R. Tomographic reconstruction of OH* chemiluminescence in two interacting turbulent flames. Meas. Sci. Technol. 2012, 24, 024013. [Google Scholar] [CrossRef]
- Hossain, M.M.; Lu, G.; Sun, D.; Yan, Y. Three-dimensional reconstruction of flame temperature and emissivity distribution using optical tomographic and two-colour pyrometric techniques. Meas. Sci. Technol. 2013, 24, 074010. [Google Scholar] [CrossRef]
- Li, X.; Ma, L. Capabilities and limitations of 3D flame measurements based on computed tomography of chemiluminescence. Combust. Flame 2015, 162, 642–651. [Google Scholar] [CrossRef]
- Wang, J.; Song, Y.; Li, Z.H.; Kempf, A.; He, A.Z. Multi-directional 3D flame chemiluminescence tomography based on lens imaging. Opt. Lett. 2015, 40, 1231–1234. [Google Scholar] [CrossRef] [PubMed]
- Mohri, K.; Görs, S.; Schöler, J.; Rittler, A.; Dreier, T.; Schulz, C.; Kempf, A. Instantaneous 3D imaging of highly turbulent flames using computed tomography of chemiluminescence. Appl. Opt. 2017, 56, 7385–7395. [Google Scholar] [CrossRef]
- Unterberger, A.; Röder, M.; Giese, A.; Al-Halbouni, A.; Kempf, A.; Mohri, K. 3D instantaneous reconstruction of turbulent industrial flames using Computed Tomography of Chemiluminescence (CTC). J. Combust. 2018, 2018, 5373829. [Google Scholar] [CrossRef]
- Schröder, A.; Geisler, R.; Elsinga, G.E.; Scarano, F.; Dierksheide, U. Investigation of a turbulent spot and a tripped turbulent boundary layer flow using time-resolved tomographic PIV. Exp. Fluids 2008, 44, 305–316. [Google Scholar] [CrossRef]
- Weinkauff, J.; Michaelis, D.; Dreizler, A.; Böhm, B. Tomographic PIV measurements in a turbulent lifted jet flame. Exp. Fluids 2013, 54, 1624. [Google Scholar] [CrossRef]
- Herman, G.T. Fundamentals of Computerized Tomography: Image Reconstruction from Projections, 2nd ed.; Springer: New York, NY, USA, 2009. [Google Scholar]
- Gordon, R. A tutorial on art (algebraic reconstruction techniques). IEEE Trans. Nucl. Sci. 1974, 21, 78–93. [Google Scholar] [CrossRef]
- Hansen, P.C. Rank-Deficient and Discrete Ill-Posed Problems: Numerical Aspects of Linear Inversion; SIAM: Philadelphia, PA, USA, 1998. [Google Scholar]
- Cai, W.; Kaminski, C.F. Tomographic absorption spectroscopy for the study of gas dynamics and reactive flows. Prog. Energy Combust. Sci. 2017, 59, 1–31. [Google Scholar] [CrossRef]
- Daun, K.J.; Grauer, S.J.; Hadwin, P.J. Chemical species tomography of turbulent flows: Discrete ill-posed and rank deficient problems and the use of prior information. J. Quant. Spectrosc. Radiat. Transf. 2016, 172, 58–74. [Google Scholar] [CrossRef]
- Grauer, S.J.; Hadwin, P.J.; Daun, K.J. Bayesian approach to the design of chemical species tomography experiments. Appl. Opt. 2016, 55, 5772–5782. [Google Scholar] [CrossRef]
- Kihm, K.D.; Okamoto, K.; Tsuru, D.; Ko, H.S. Adoption of a genetic algorithm (GA) for tomographic reconstruction of line-of-sight optical images. Exp. Fluids 1996, 22, 137–143. [Google Scholar] [CrossRef]
- Kihm, K.D.; Lyons, D.P. Optical tomography using a genetic algorithm. Opt. Lett. 1996, 21, 1327–1329. [Google Scholar] [CrossRef] [PubMed]
- Wu, C.; Cheng, Y.; Ding, Y.; Wei, F.; Jin, Y. A novel X-ray computed tomography method for fast measurement of multiphase flow. Chem. Eng. Sci. 2007, 62, 4325–4335. [Google Scholar] [CrossRef]
- Yang, X.; van Ommen, J.R.; Mudde, R.F. Comparison of genetic algorithm and algebraic reconstruction for X-ray tomography in bubbling fluidized beds. Powder Technol. 2014, 253, 626–637. [Google Scholar] [CrossRef]
- Yang, X.; Van Ommen, J.R.; Schoormans, J.; Mudde, R.F. A hybrid tomographic reconstruction algorithm for high speed X-ray tomography. Comput. Phys. Commun. 2015, 196, 27–35. [Google Scholar] [CrossRef]
- Batenburg, K.J. An evolutionary algorithm for discrete tomography. Discret. Appl. Math. 2005, 151, 36–54. [Google Scholar] [CrossRef] [Green Version]
- Valenti, C. A genetic algorithm for discrete tomography reconstruction. Genet. Prog. Evol. Mach. 2008, 9, 85–96. [Google Scholar] [CrossRef]
- Di Gesù, V.; Lo Bosco, G.; Millonzi, F.; Valenti, C. A memetic approach to discrete tomography from noisy projections. Pattern Recogn. 2010, 43, 3073–3082. [Google Scholar] [CrossRef]
- Olmi, R.; Bini, M.; Priori, S. A genetic algorithm approach to image reconstruction in electrical impedance tomography. IEEE Trans. Evol. Comput. 2000, 4, 83–88. [Google Scholar] [CrossRef]
- Proch, F.; Domingo, P.; Vervisch, L.; Kempf, A.M. Flame resolved simulation of a turbulent premixed bluff-body burner experiment. Part I: Analysis of the reaction zone dynamics with tabulated chemistry. Combust. Flame 2017, 180, 321–339. [Google Scholar] [CrossRef]
- Proch, F.; Domingo, P.; Vervisch, L.; Kempf, A.M. Flame resolved simulation of a turbulent premixed bluff-body burner experiment. Part II: A-priori and a-posteriori investigation of sub-grid scale wrinkling closures in the context of artificially thickened flame modeling. Combust. Flame 2017, 180, 340–350. [Google Scholar] [CrossRef]
- Holland, J.H. Adaptation in Natural and Artificial Systems, 2nd ed.; University of Michigan Press: Ann Arbor, MI, USA, 1992. [Google Scholar]
- Michalewicz, Z. Genetic Alogrithms + Data Structures = Evolution Programs, 3rd ed.; Springer: New York, NY, USA, 1996. [Google Scholar]
- Winter, A. vlib API (Version1.2) [Computer Software]. 2001. Available online: http://vg.swan.ac.uk/vlib/ (accessed on 24 December 2017).
- Chen, M.; Winter, A.; Rodgman, D.; Treavett, S. Enriching volume modelling with scalar fields. In Data Visualization: The State of The Art; Post, F., Bonneau, G.P., Nielson, G., Eds.; Kluwer Academic Publishers: Boston, MA, USA, 2003. [Google Scholar]
- Winter, A.; Chen, M. vlib: A Volume Graphics API. In Volume Graphics 2001; Springer: New York, NY, USA, 2001. [Google Scholar]
- Winter, A.; Chen, M. Image-Swept Volumes. Comput. Graph. Forum 2002, 21, 441–450. [Google Scholar] [CrossRef]
- Aggarwal, C.C.; Hinneburg, A.; Keim, D.A. On the surprising behavior of distance metrics in high dimensional space. In Database Theory—ICDT 2001; Van den Bussche, J., Vianu, V., Eds.; Springer: Berlin/Heidelberg, Germany, 2001; pp. 420–434. [Google Scholar]
- Burkhardt, J. TRUNCATED_NORMAL The Truncated Normal Distribution (Version 03.04.2015) [Computer Software]. 2015. Available online: https://people.sc.fsu.edu/~jburkardt/f_src/truncated_normal/truncated_normal.html (accessed on 20 December 2017).
- Metropolis, N.; Rosenbluth, A.; Rosenbluth, M.; Teller, A.; Teller, E. Equations of State Calculations by Fast Computing Machines. J. Chem. Phys. 1953, 21, 1087–1092. [Google Scholar] [CrossRef]
- Hastings, W. Monte Carlo sampling methods using Markov chains and their applications. Biometrika 1970, 57, 97–109. [Google Scholar] [CrossRef]
- Chib, S.; Greenberg, E. Understanding the Metropolis-Hastings algorithm. Am. Stat. 1995, 49, 327–335. [Google Scholar]
- Michel, M. Irreversible Markov Chains by the Factorized Metropolis Filter: Algorithms and Applications in Particle Systems and Spin Models. Ph.D. Thesis, PSL Research University, Paris, France, 2016. [Google Scholar]
- Pettit, M.; Coriton, B.; Gomez, A.; Kempf, A. Large-Eddy Simulation and experiments on non-premixed highly turbulent opposed jet flows. Proc. Combust. Inst. 2011, 33, 1391–1399. [Google Scholar] [CrossRef]
- Proch, F.; Kempf, A.M. Numerical analysis of the Cambridge stratified flame series using artificial thickened flame LES with tabulated premixed flame chemistry. Combust. Flame 2014, 161, 2627–2646. [Google Scholar] [CrossRef]
- Meier, W.; Keck, O.; Noll, B.; Kunz, O.; Stricker, W. Investigations in the TECFLAM swirling diffusion flame: Laser Raman measurements and CFD calculations. Appl. Phys. B 2000, 71, 725–731. [Google Scholar] [CrossRef]
- Schneider, C.; Dreizler, A.; Janicka, J. Fluid dynamical analysis of atmospheric reacting and isothermal swirling flows. Flow Turbul. Combust. 2005, 74, 103–127. [Google Scholar] [CrossRef]
- Sweeney, M.S.; Hochgreb, S.; Dunn, M.J.; Barlow, R.S. The structure of turbulent stratified and premixed methane/air flames I: Non-swirling flows. Combust. Flame 2012, 159, 2896–2911. [Google Scholar] [CrossRef]
- Sweeney, M.S.; Hochgreb, S.; Dunn, M.J.; Barlow, R.S. The structure of turbulent stratified and premixed methane/air flames II: Swirling flows. Combust. Flame 2012, 159, 2912–2929. [Google Scholar] [CrossRef]
- Nambully, S.; Domingo, P.; Moureau, V.; Vervisch, L. A filtered-laminar-flame PDF sub-grid-scale closure for LES of premixed turbulent flames: II. Application to a stratified bluff-body burner. Combust. Flame 2014, 161, 1775–1791. [Google Scholar] [CrossRef]
- Nambully, S.; Domingo, P.; Moureau, V.; Vervisch, L. A filtered-laminar-flame PDF sub-grid scale closure for LES of premixed turbulent flames. Part I: Formalism and application to a bluff-body burner with differential diffusion. Combust. Flame 2014, 161, 1756–1774. [Google Scholar] [CrossRef]
Figure 1.
Cambridge–Sandia stratified flame, instantaneous heat-release-rate from a direct numerical simulations (DNS) data set by Proch et al. [35,36].
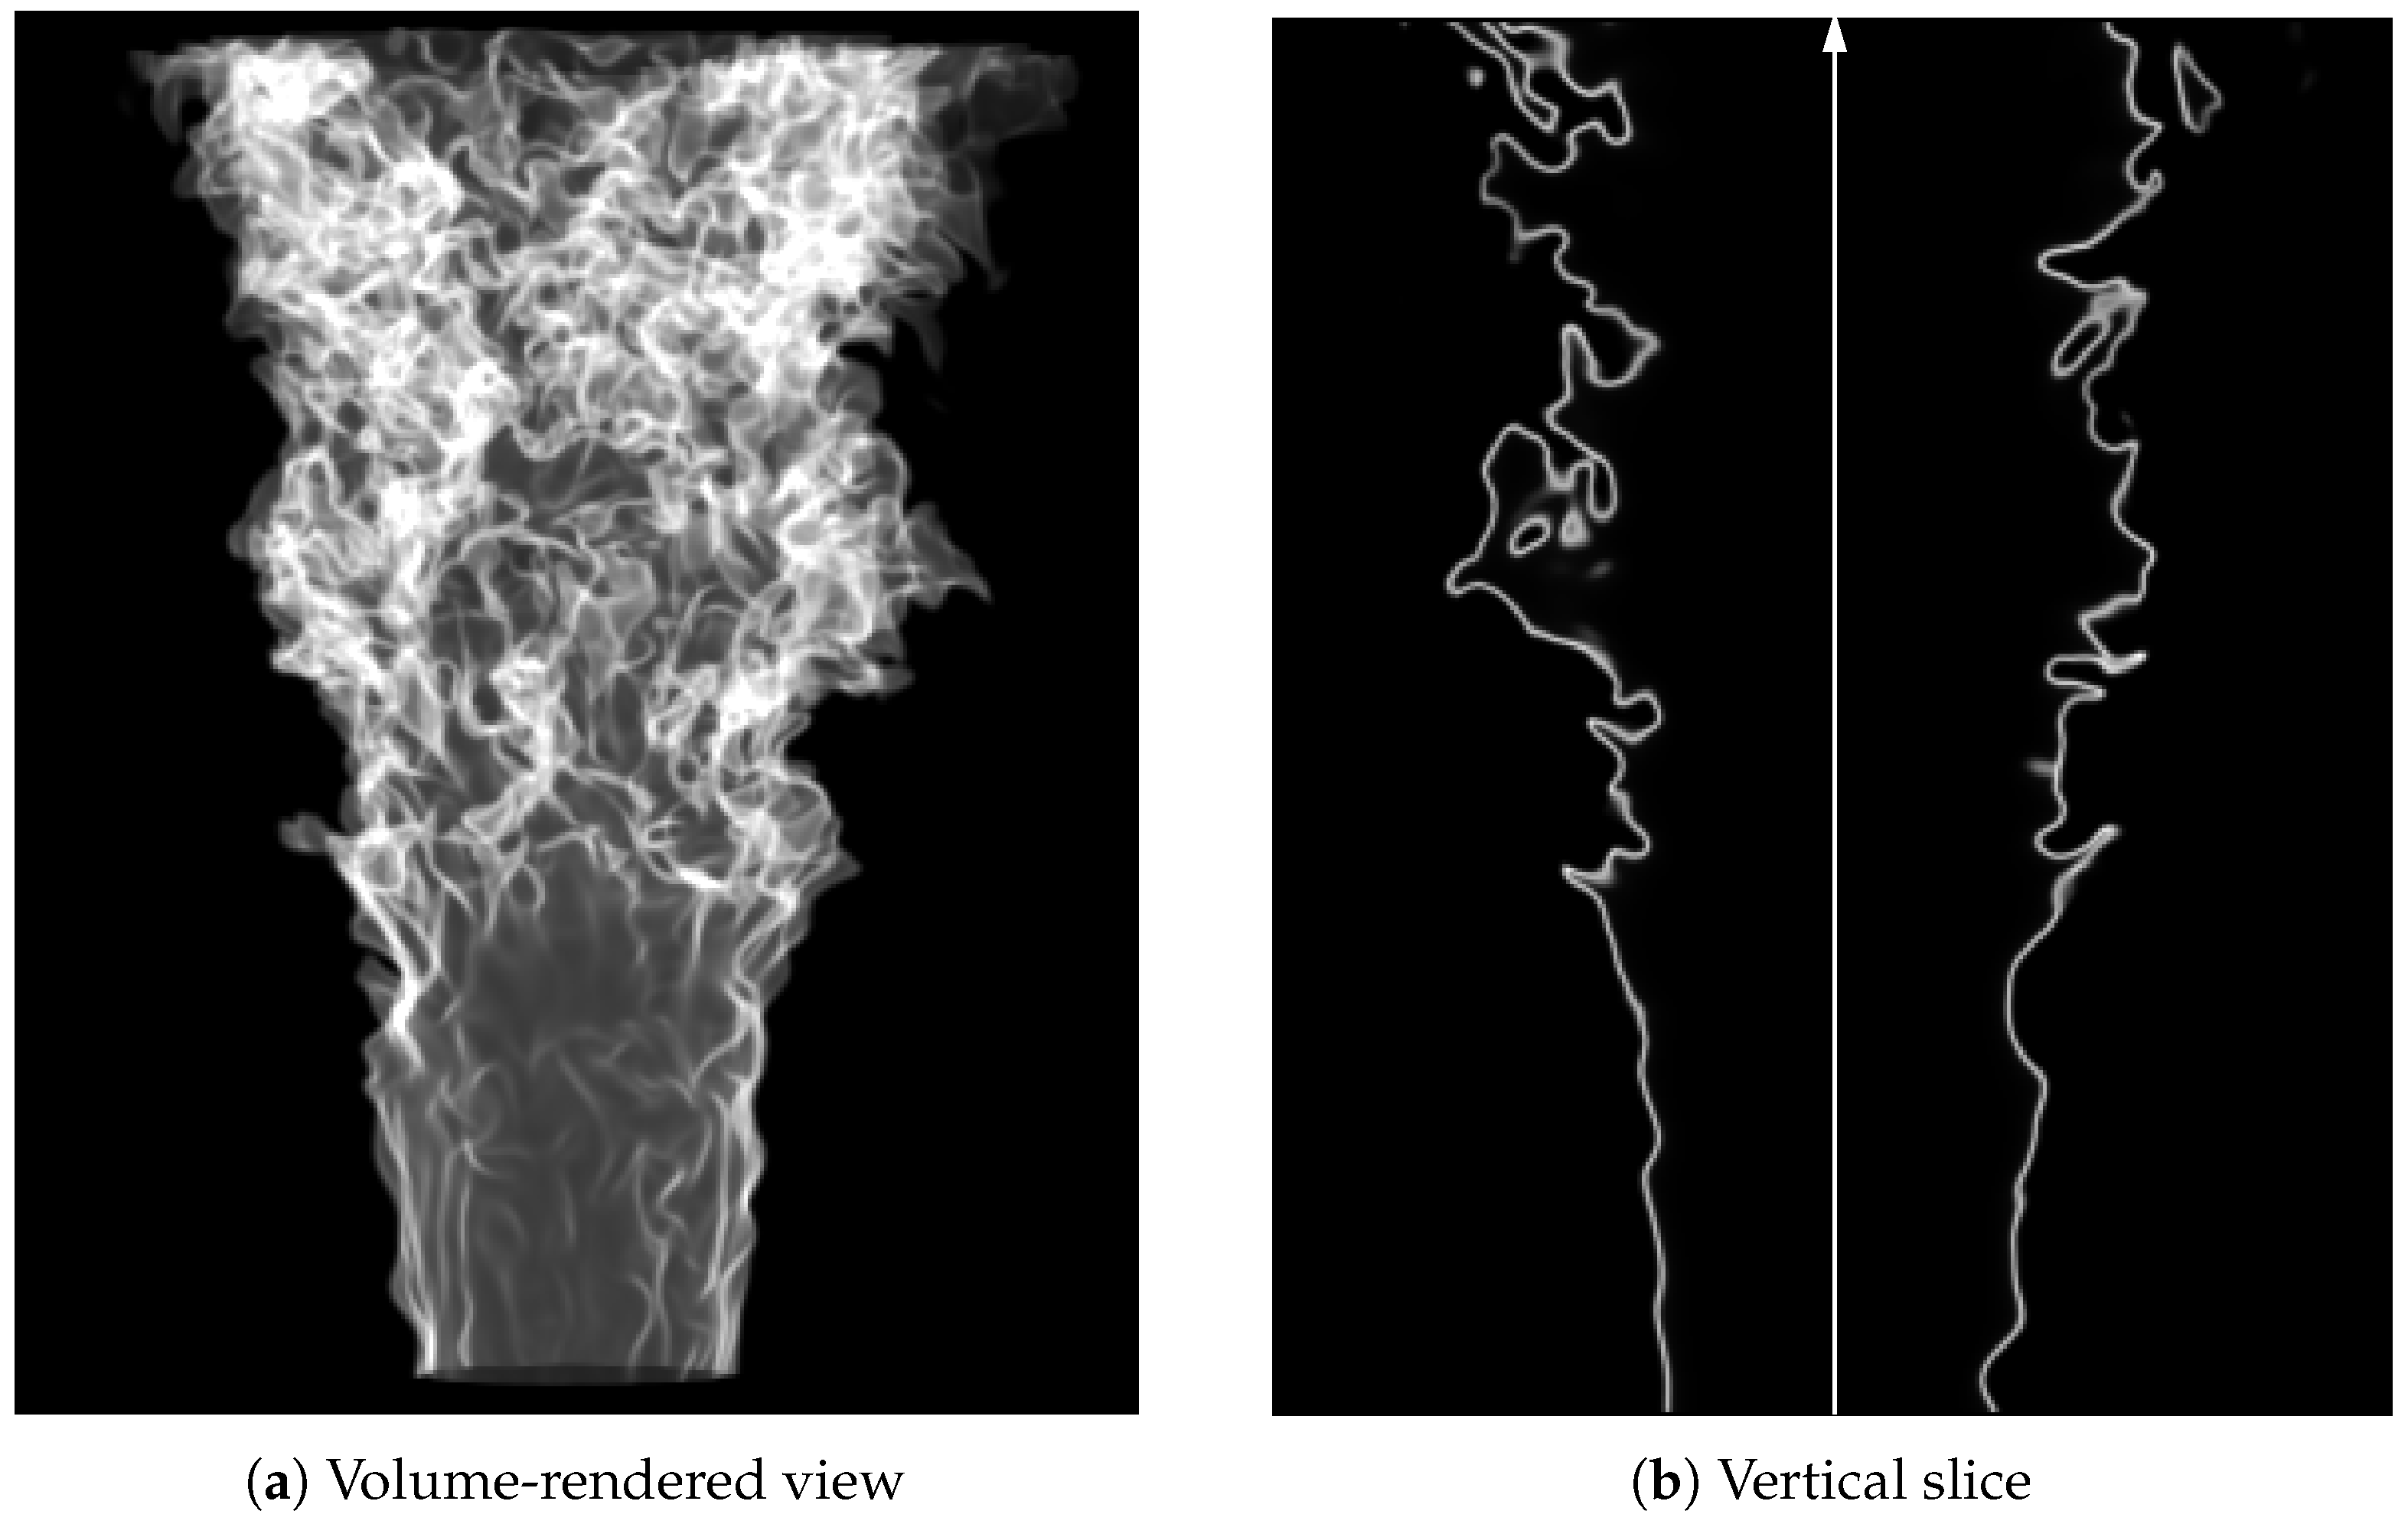
Figure 2.
Ray-tracing setup.
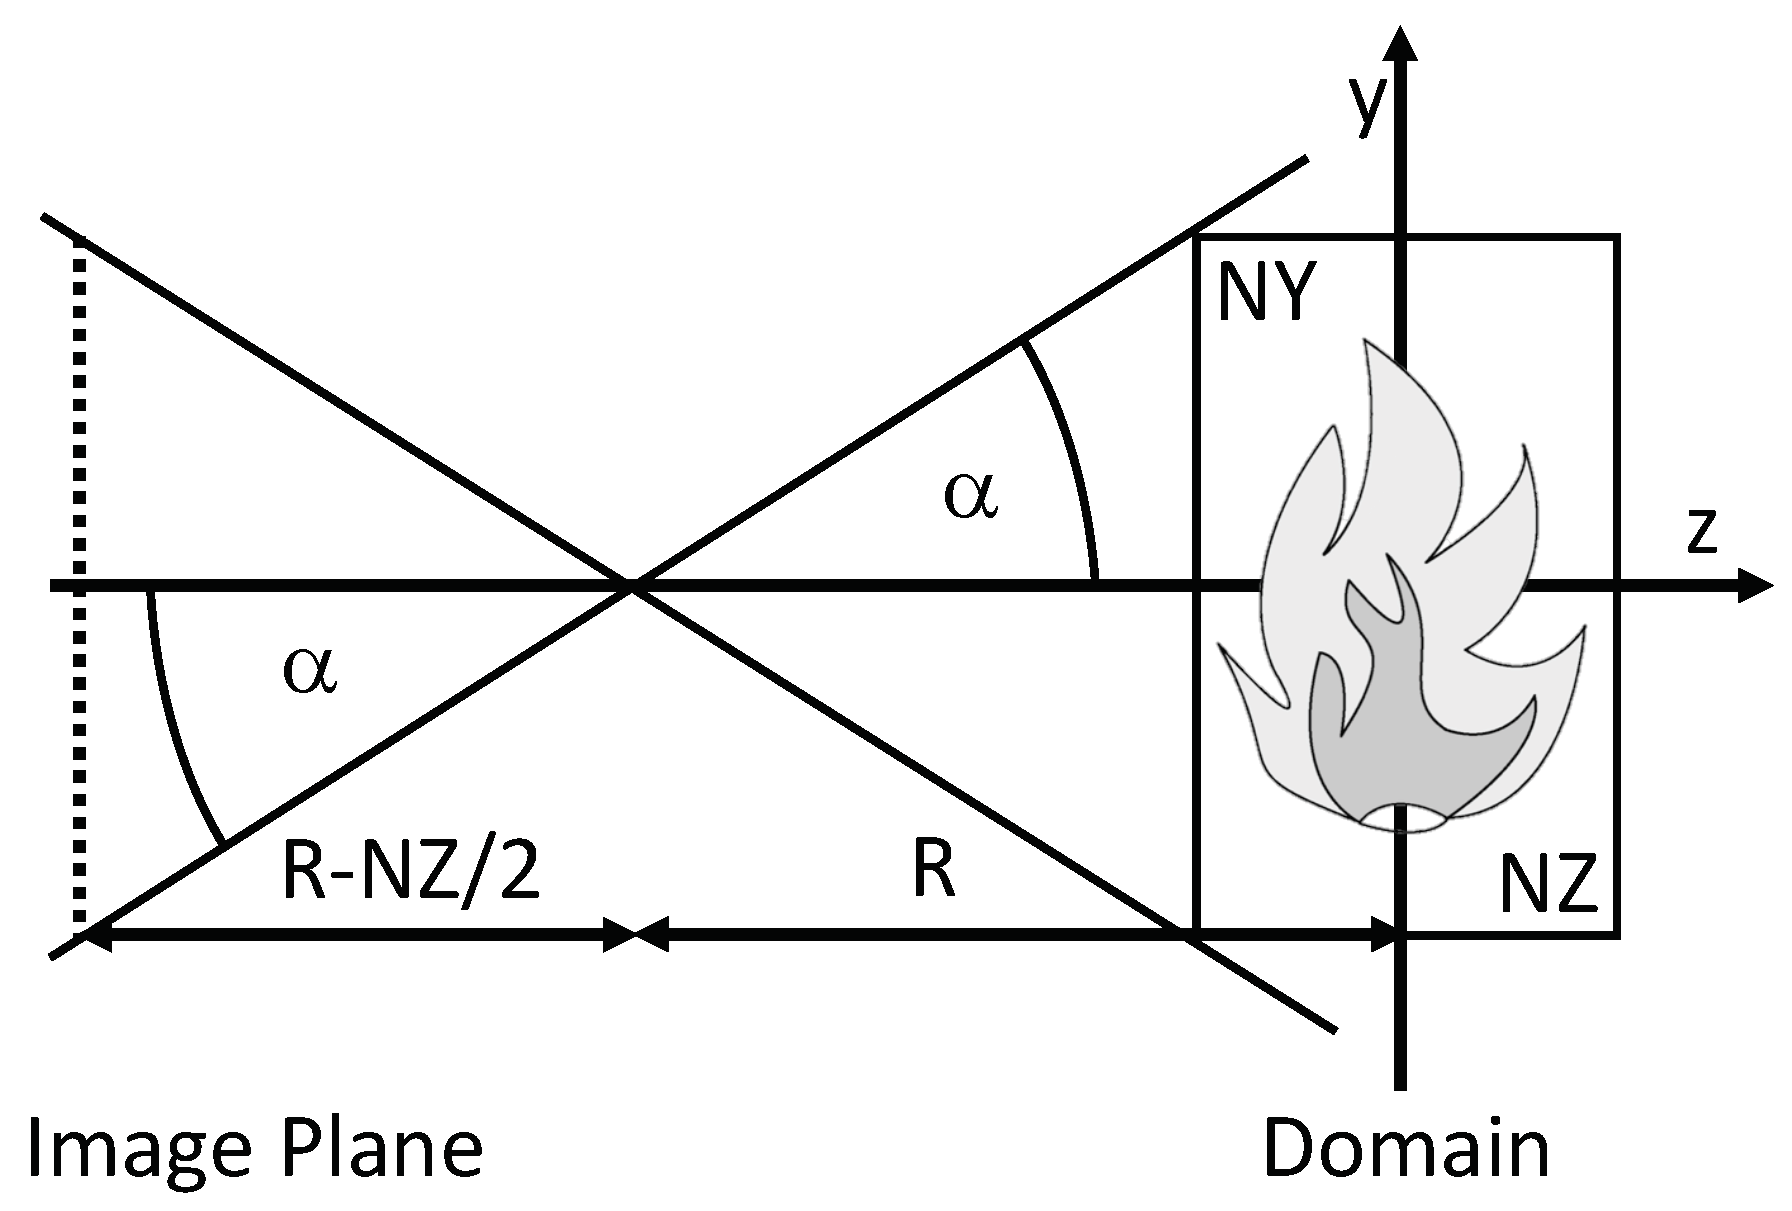
Figure 3.
First stage stochastic mask generated with 15 rendered images, image size is 52 by 55 pixels, three million samples were drawn.
Figure 3.
First stage stochastic mask generated with 15 rendered images, image size is 52 by 55 pixels, three million samples were drawn.
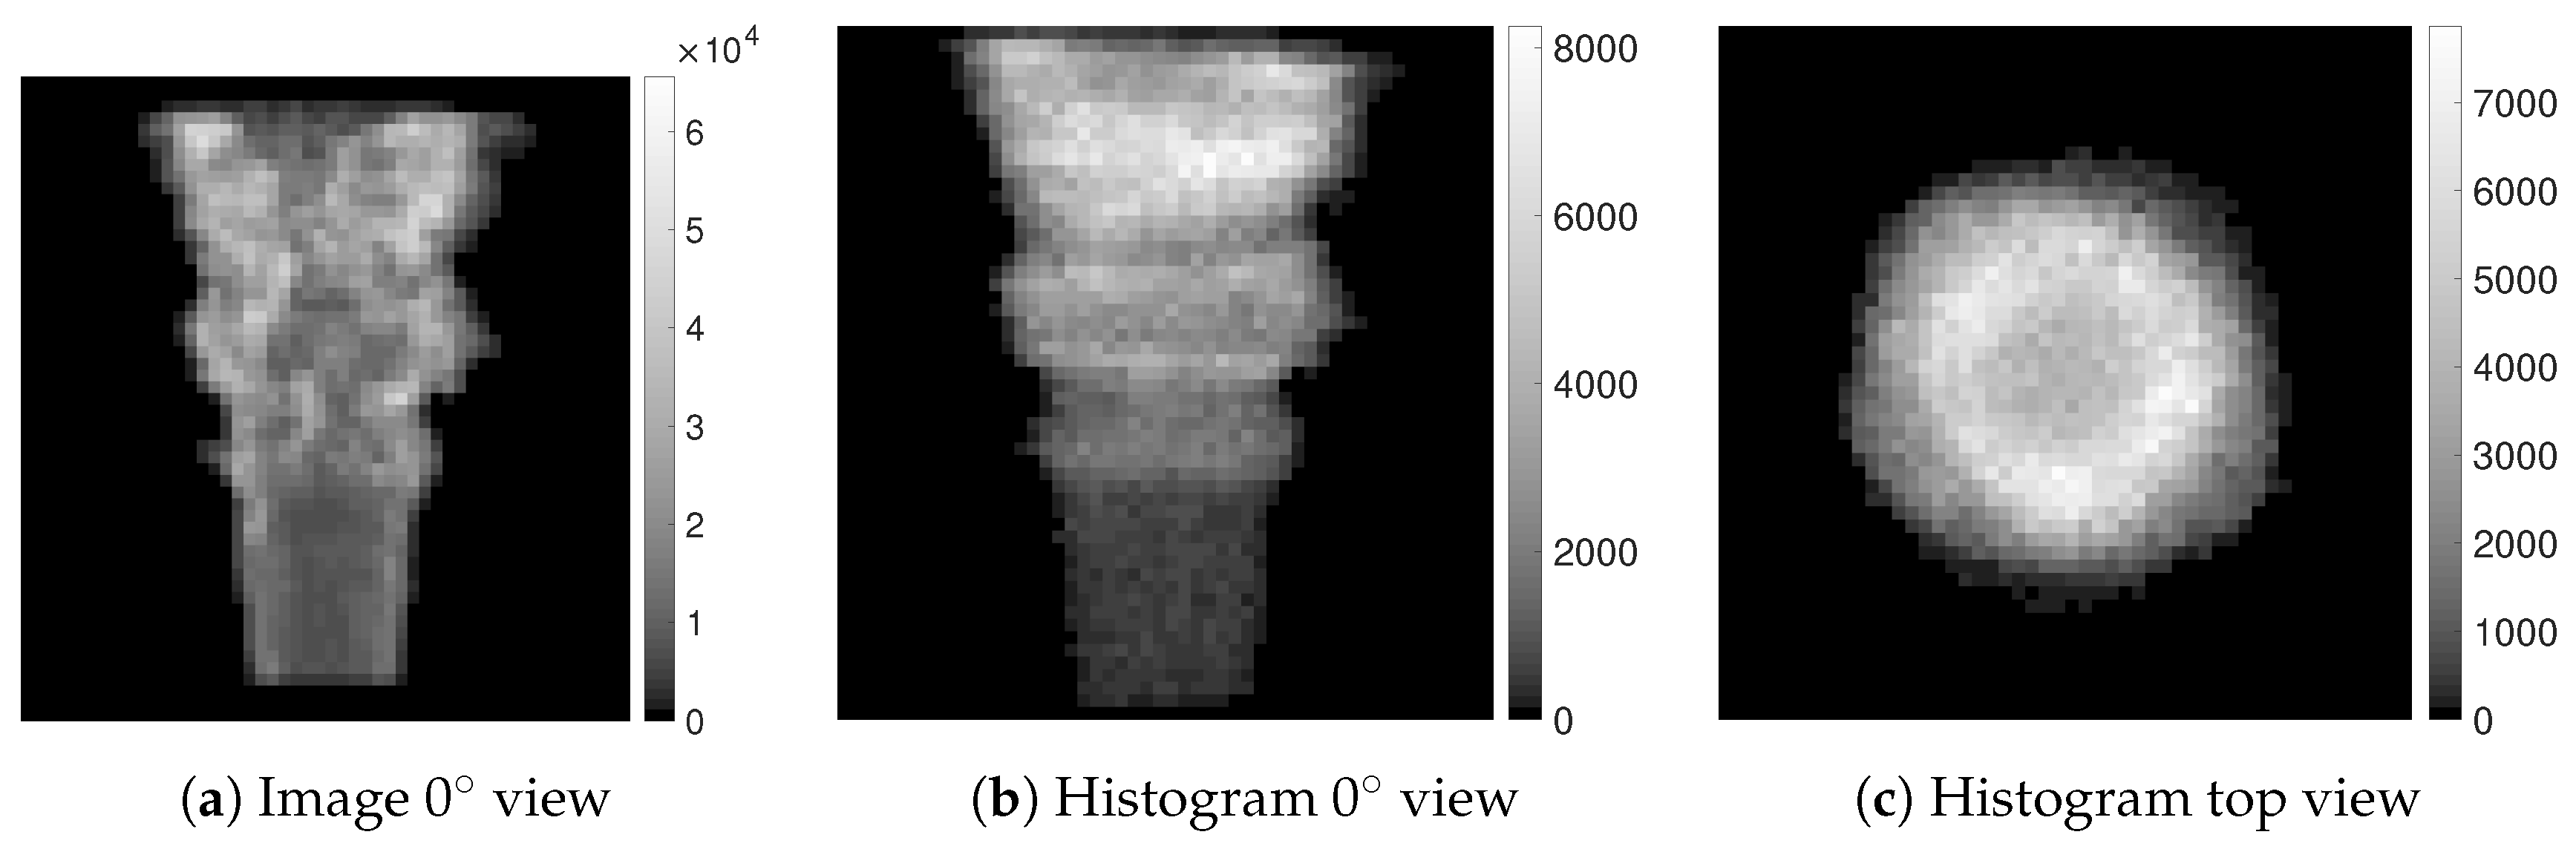
Figure 4.
Camera setup (8 views).
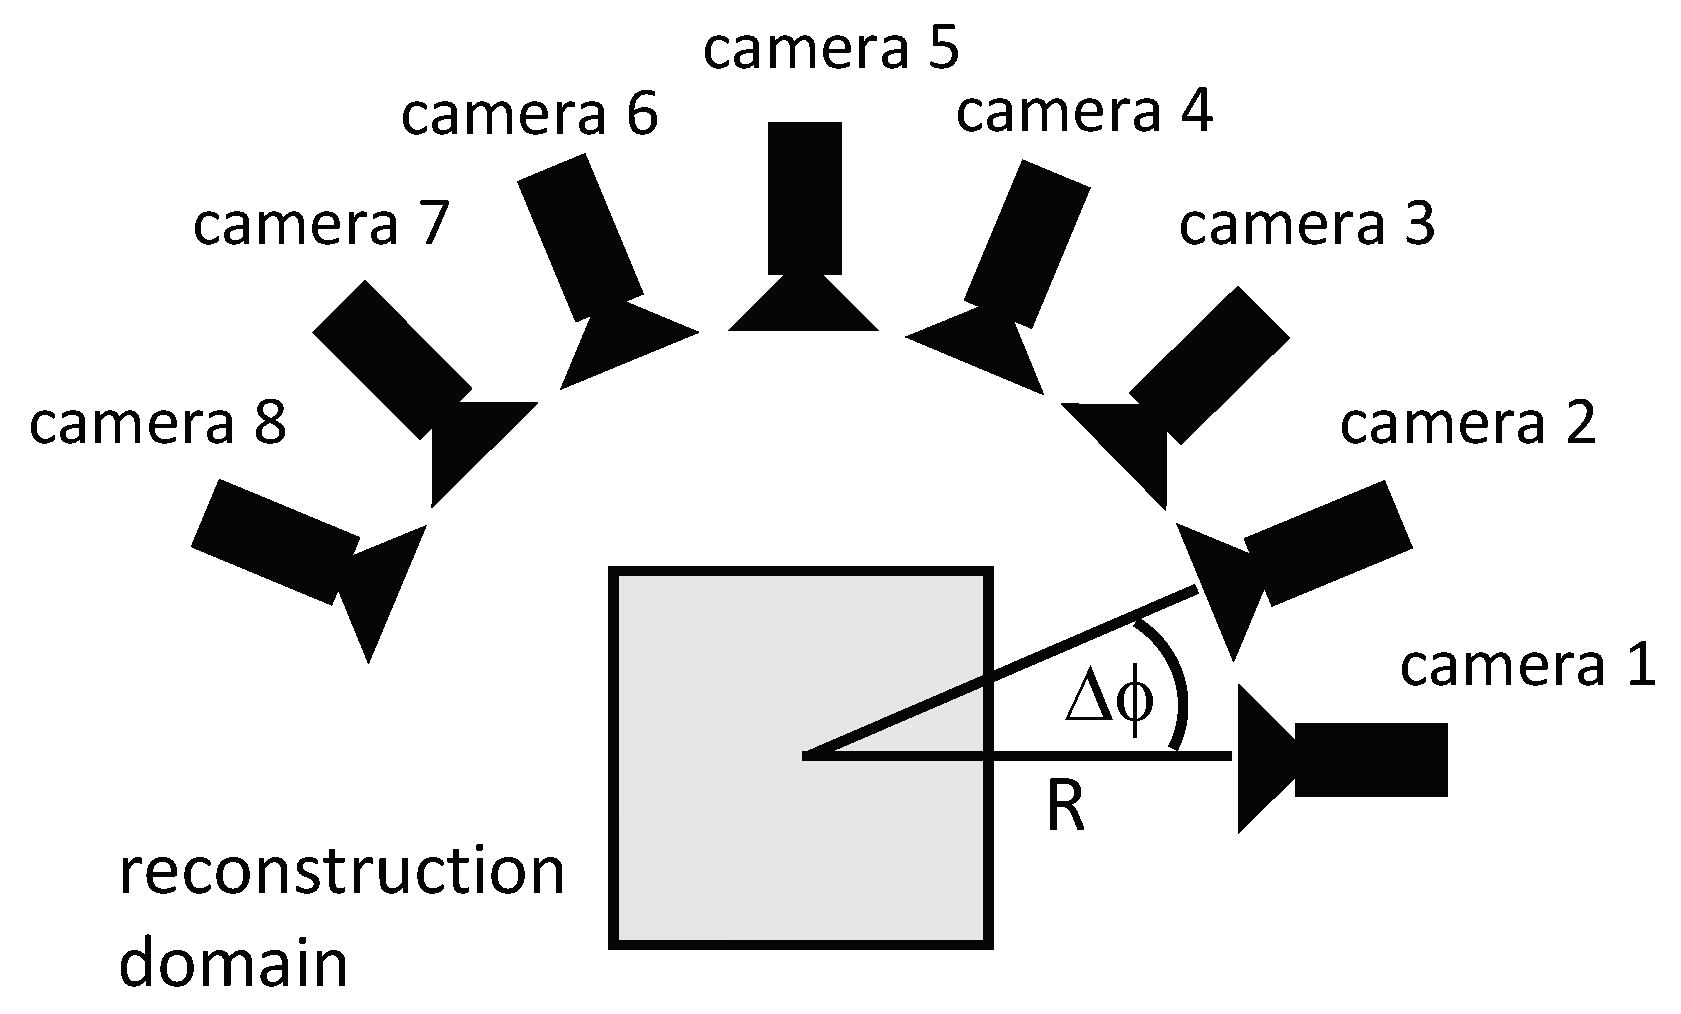
Figure 5.
Evolutionary paths, torus phantom.
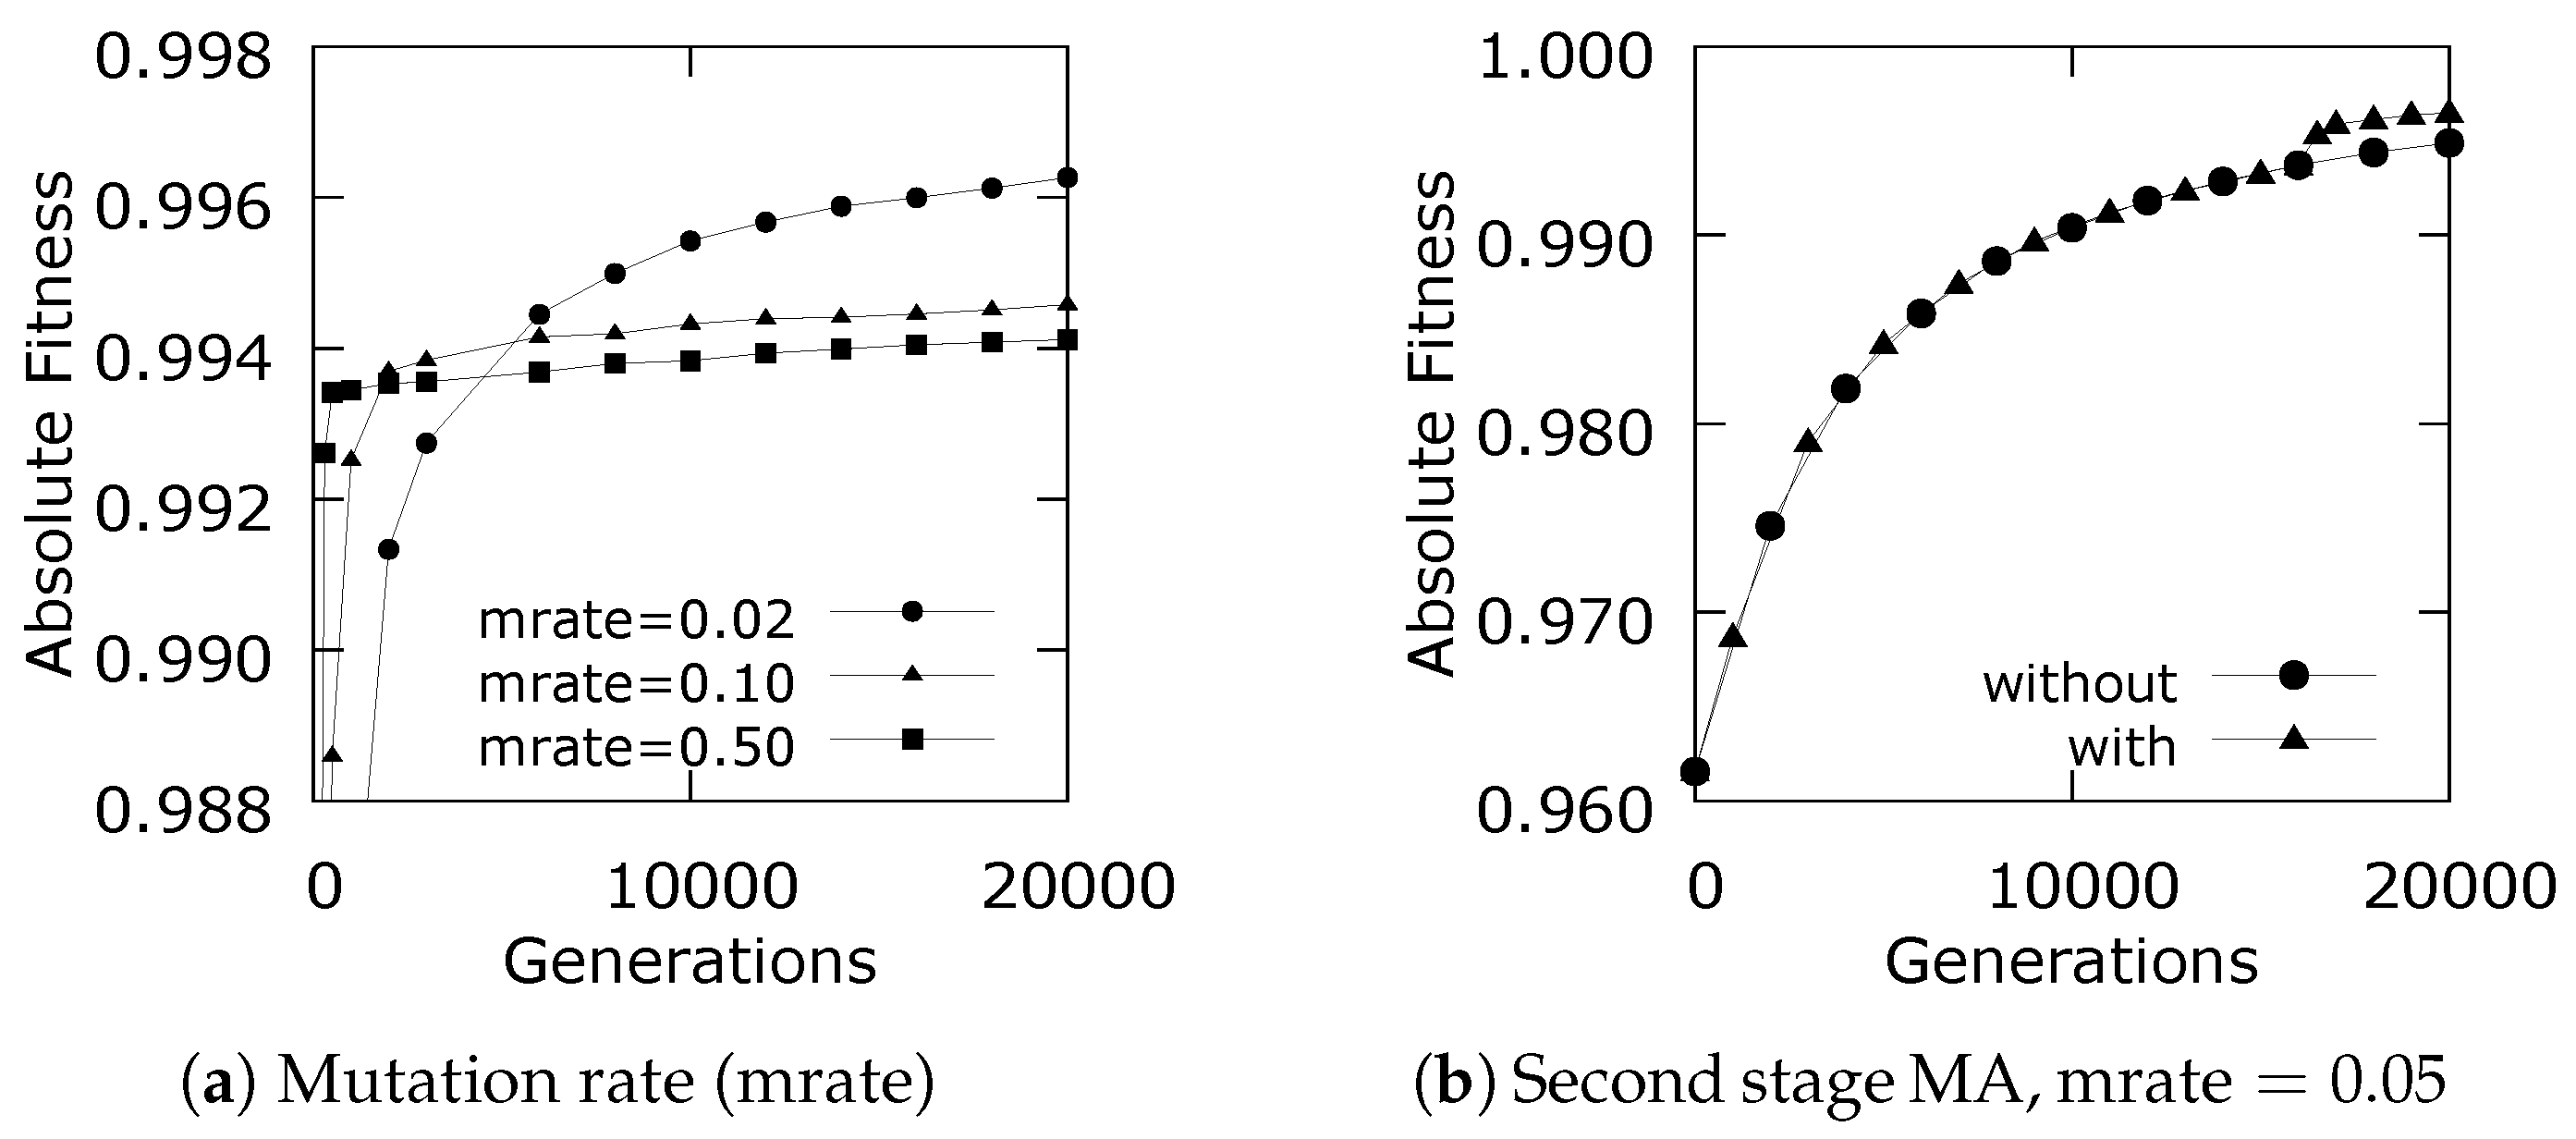
Figure 6.
Effect of the annihilation rate (arate), hollow sphere phantom.

Figure 7.
Effect of the filter rate (frate), Gaussian profile phantom.
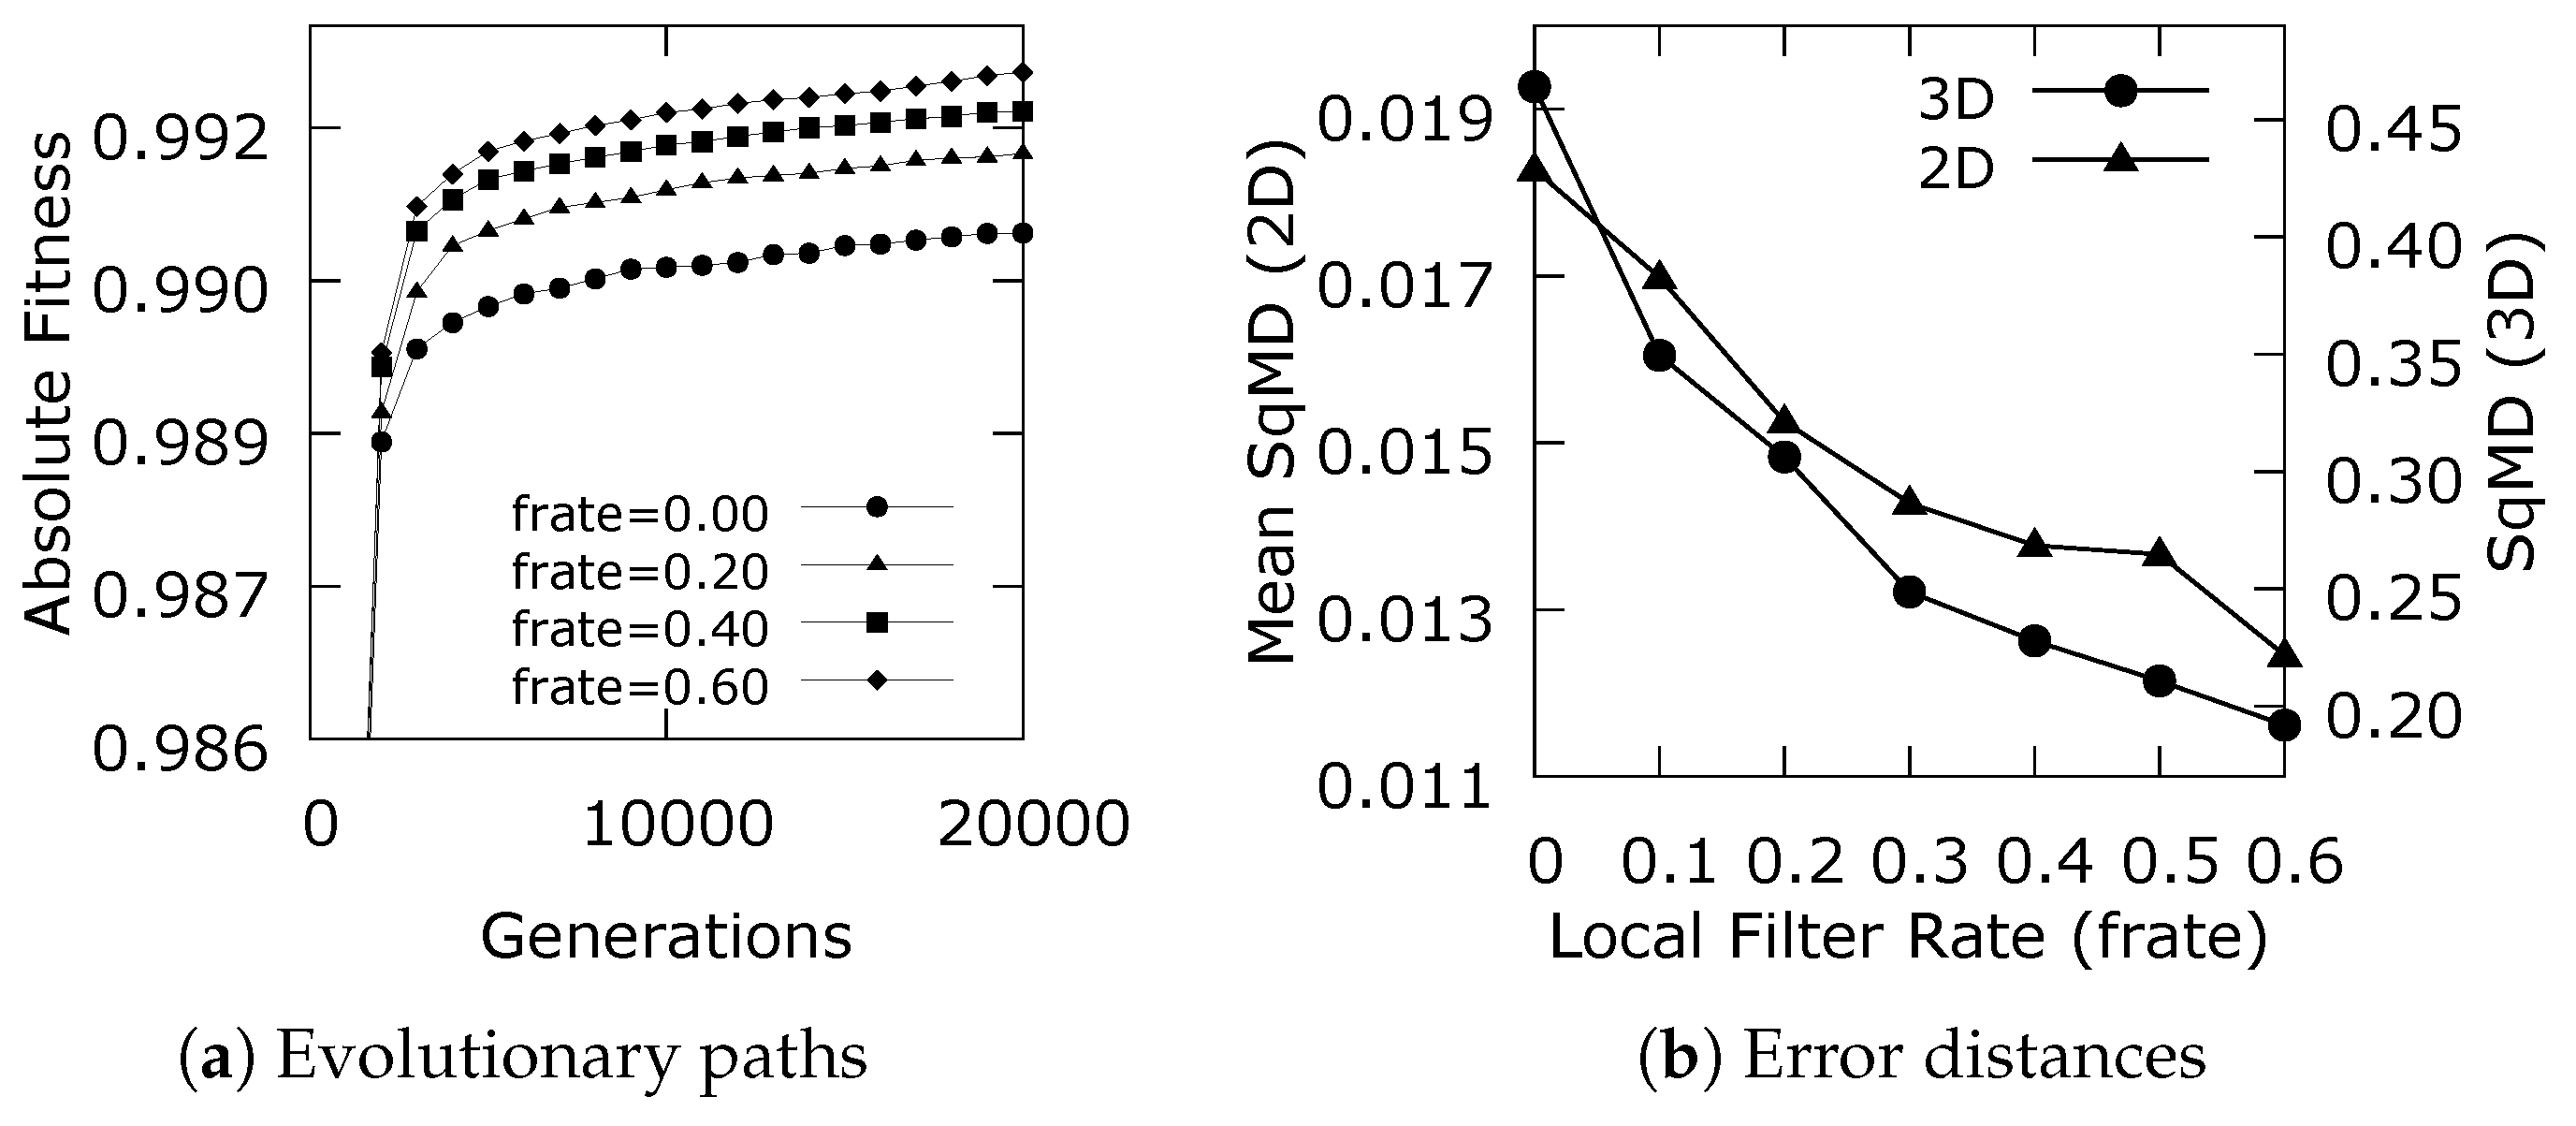
Figure 8.
Slices normal to each spatial axis and height above burner exit (in mm), the correlation/normalized Manhattan distance to the phantom of each pair of slices is displayed between the images.
Figure 8.
Slices normal to each spatial axis and height above burner exit (in mm), the correlation/normalized Manhattan distance to the phantom of each pair of slices is displayed between the images.
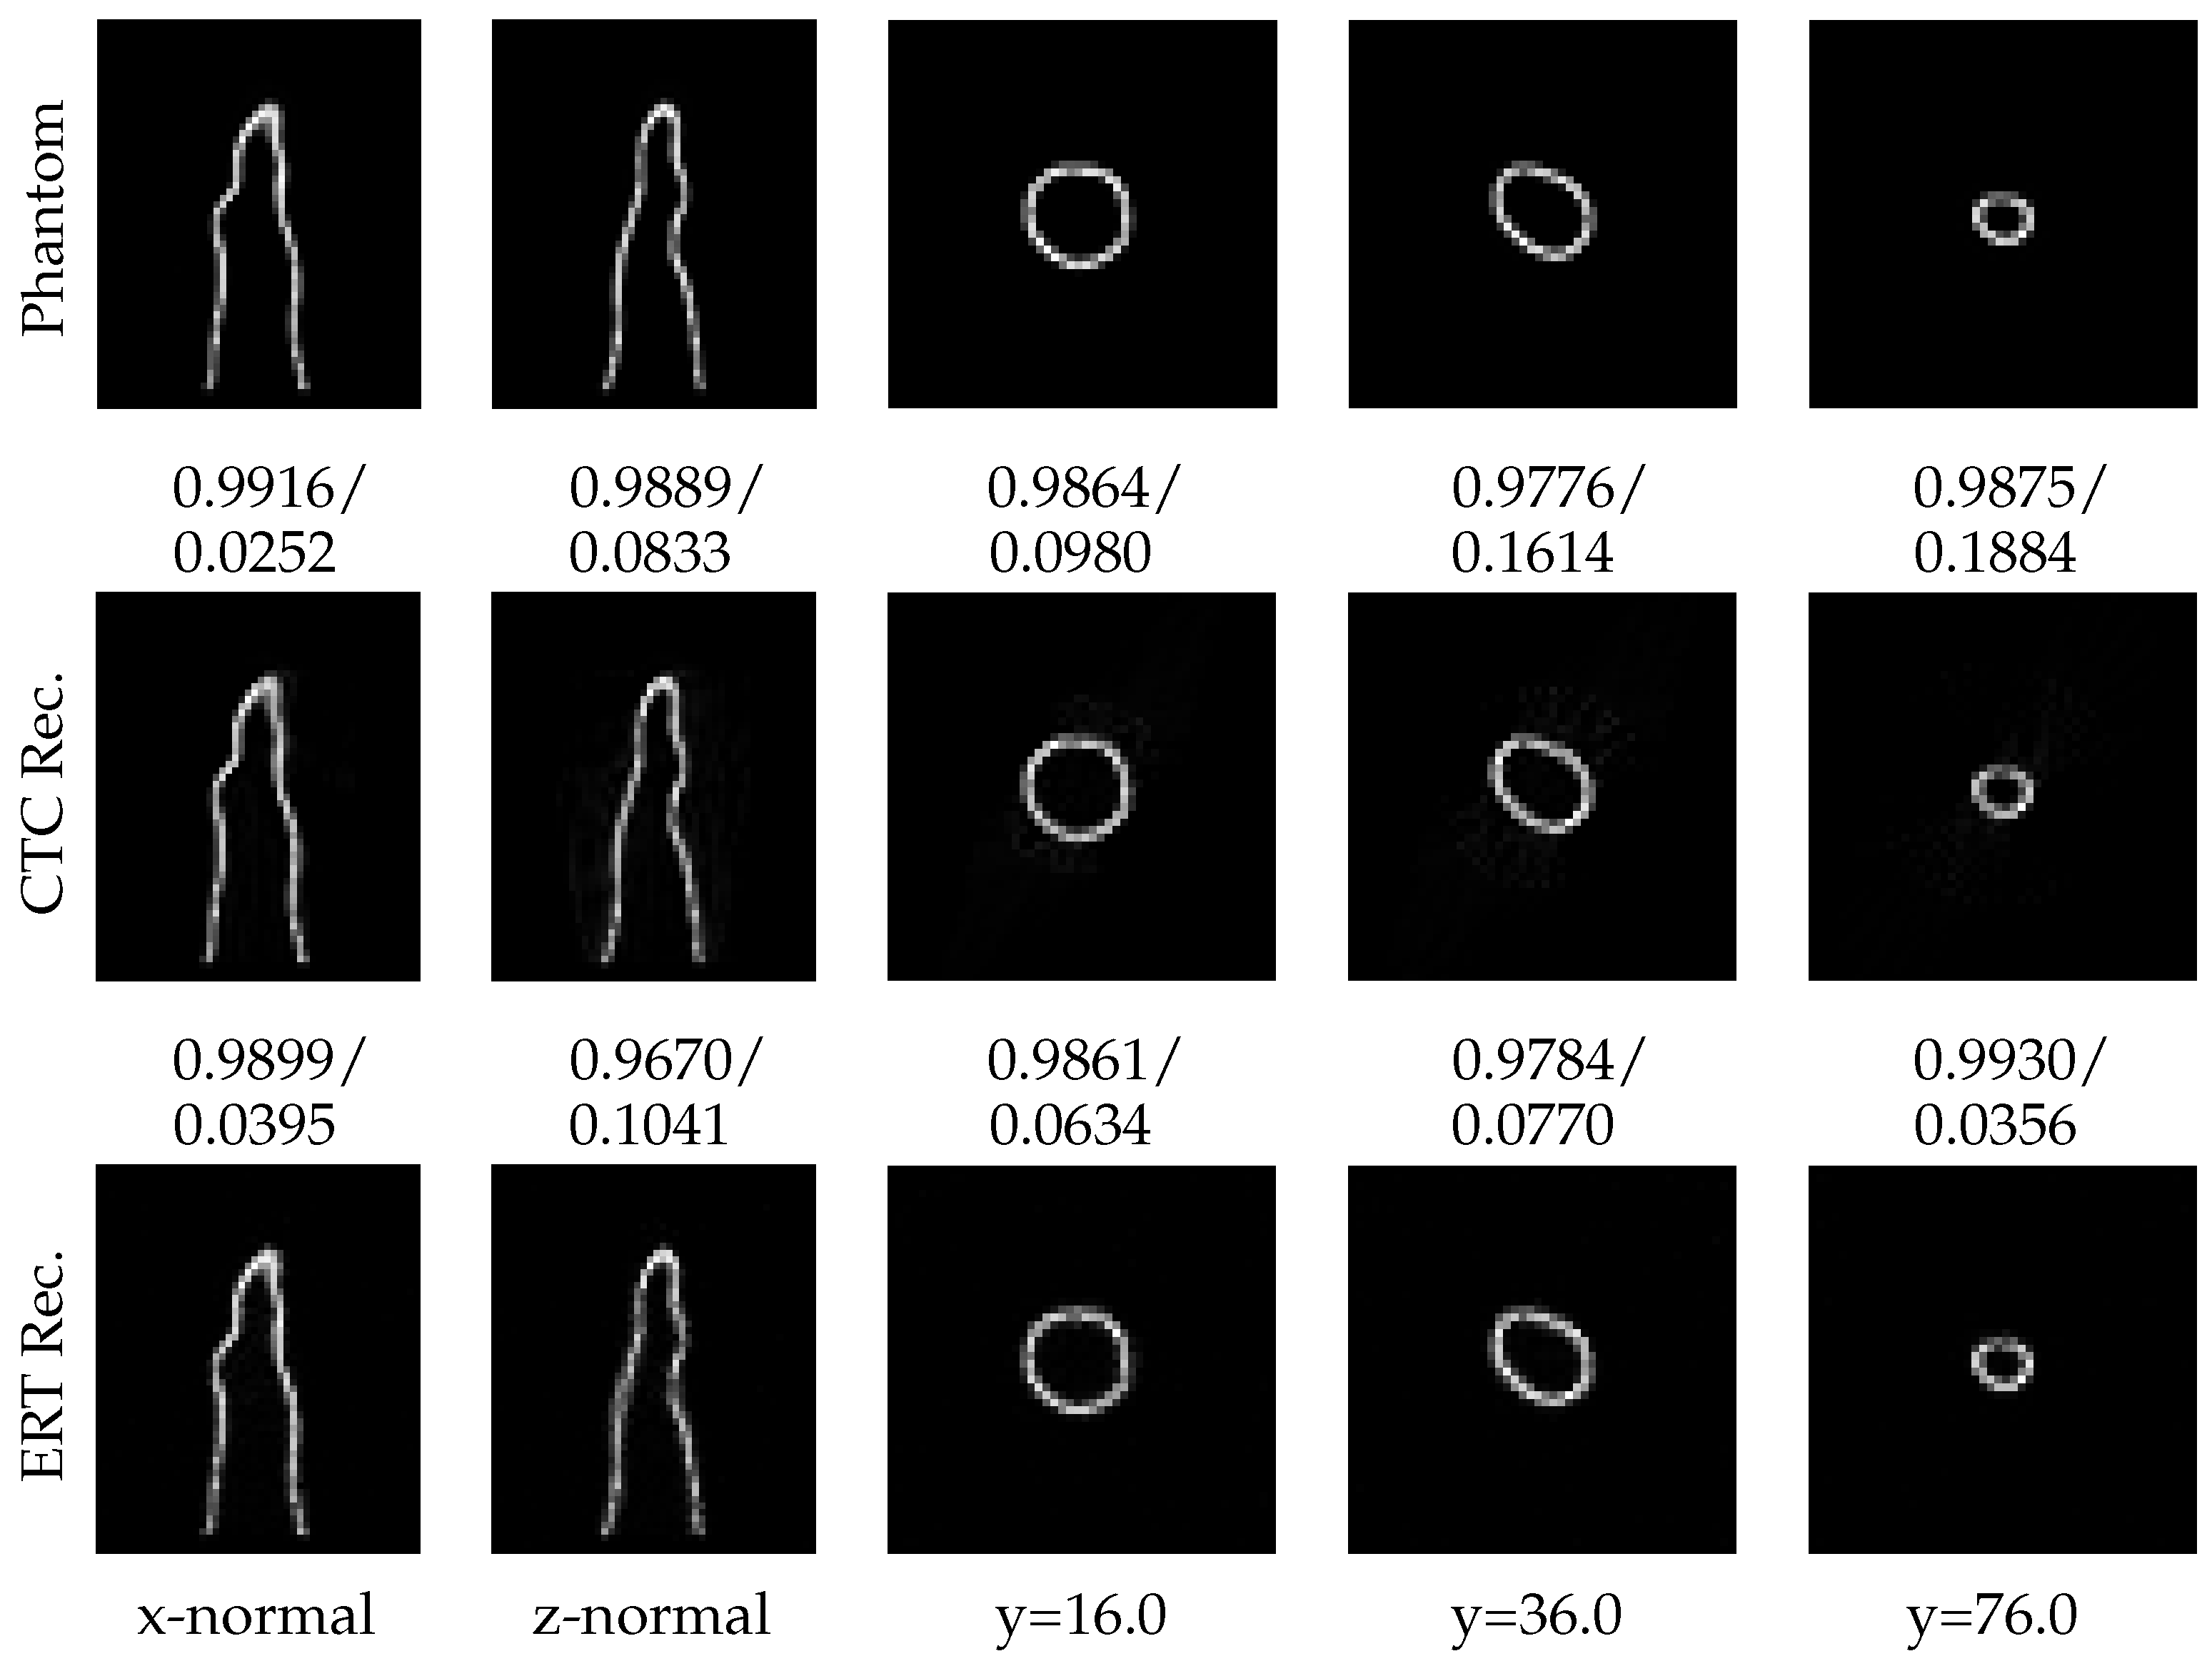
Figure 9.
Slices normal to each spatial axis and height above burner exit (in mm), the correlation/normalized Manhattan distance to the phantom of each pair of slices is displayed between the images.
Figure 9.
Slices normal to each spatial axis and height above burner exit (in mm), the correlation/normalized Manhattan distance to the phantom of each pair of slices is displayed between the images.

Figure 10.
Top-view sketch of the Cambridge–Sandia stratified burner, dimensions in mm.

Figure 11.
Slices normal to each spatial axis and height above burner exit (in mm), the correlation/normalized Manhattan distance to the phantom of each pair of slices is displayed between the images.
Figure 11.
Slices normal to each spatial axis and height above burner exit (in mm), the correlation/normalized Manhattan distance to the phantom of each pair of slices is displayed between the images.

Figure 12.
Experimental setup and flame image (Cambridge–Sandia stratified flame).
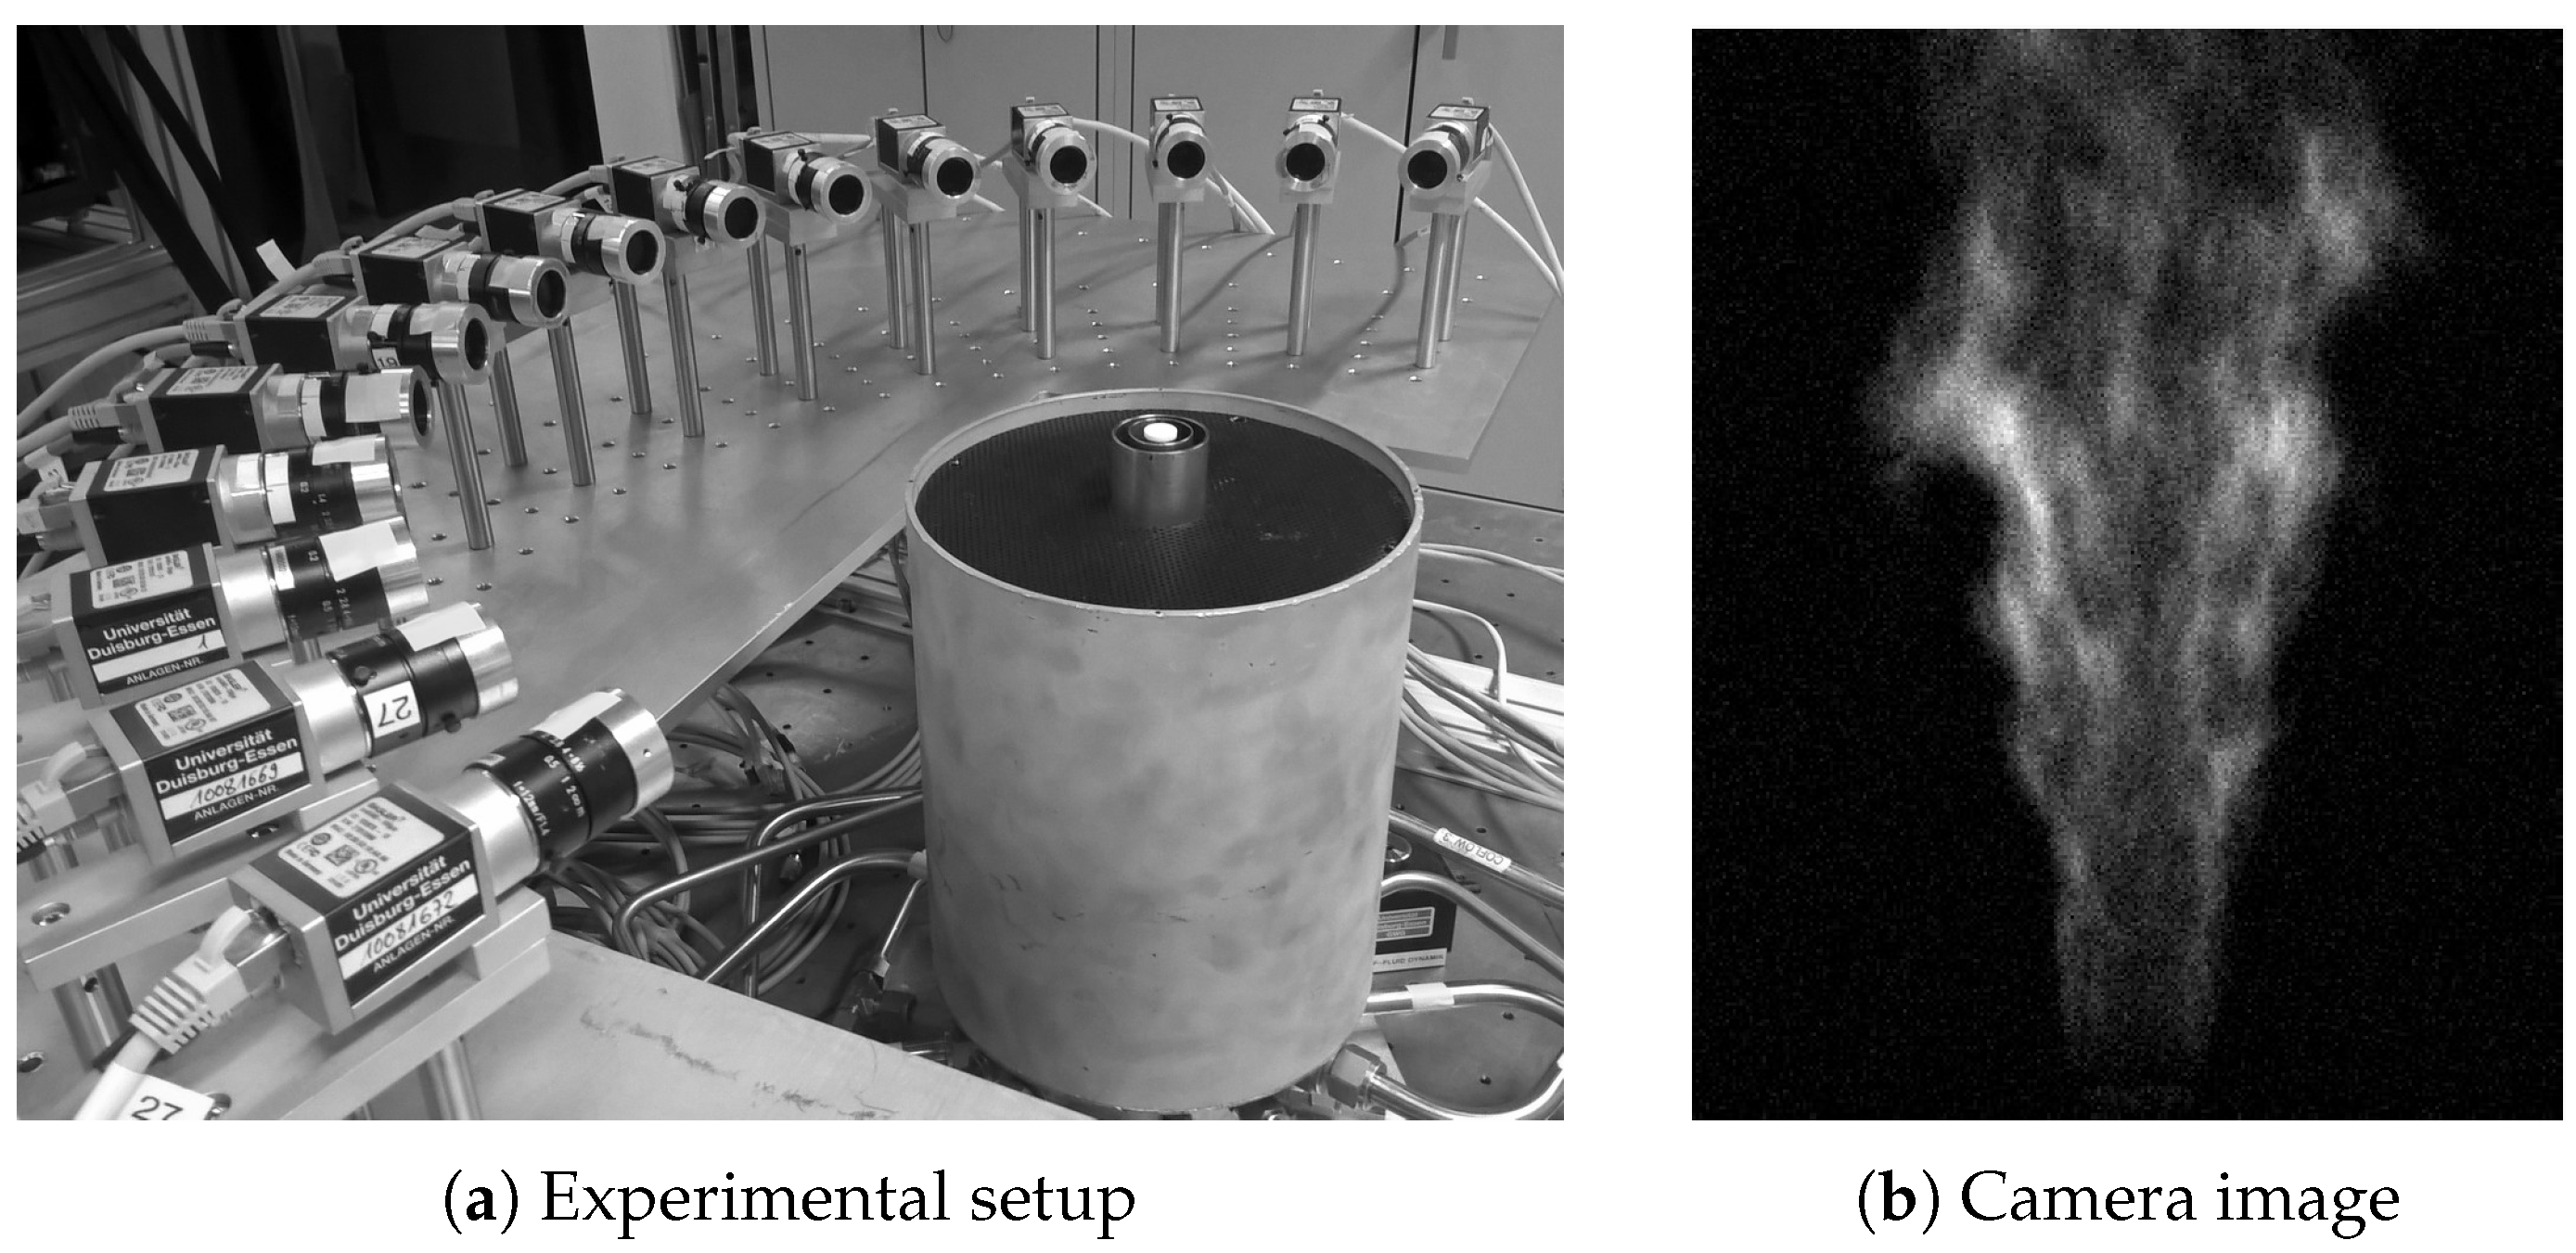
Figure 13.
Vertical slices at the flame center (x-normal and z-normal), and horizontal slices at different heights above burner exit (in mm).
Figure 13.
Vertical slices at the flame center (x-normal and z-normal), and horizontal slices at different heights above burner exit (in mm).
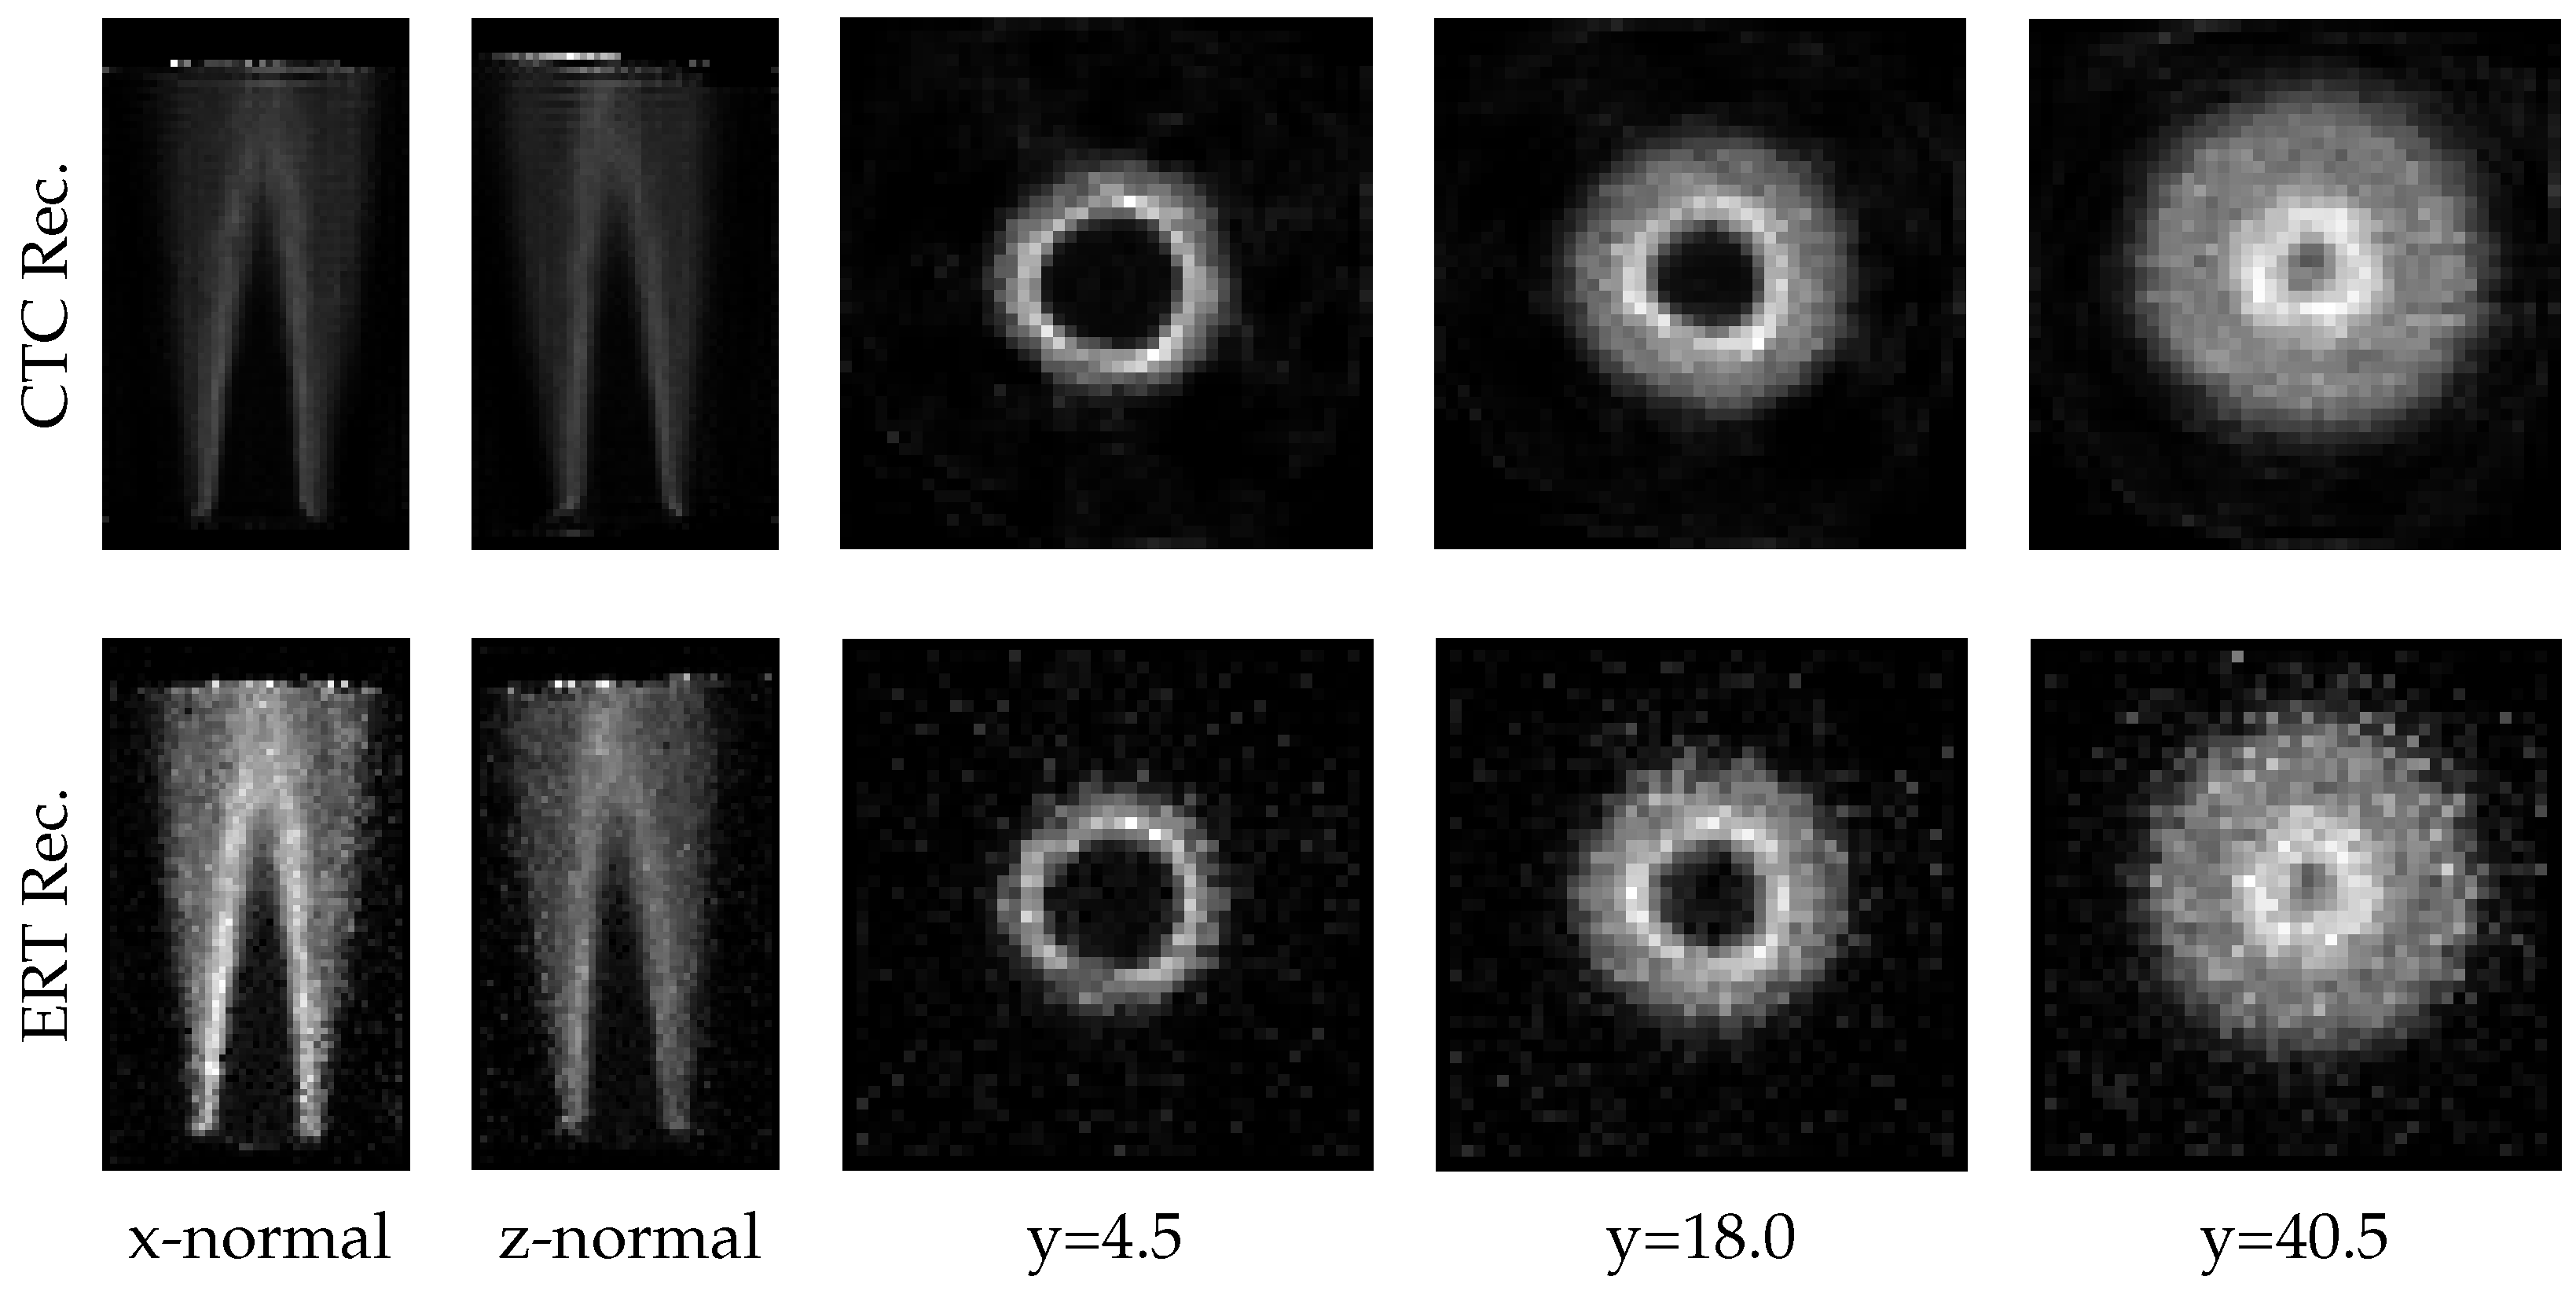
Figure 14.
Vertical slices at the flame center (x-normal and z-normal), and horizontal slices at different heights above burner exit (in mm).
Figure 14.
Vertical slices at the flame center (x-normal and z-normal), and horizontal slices at different heights above burner exit (in mm).
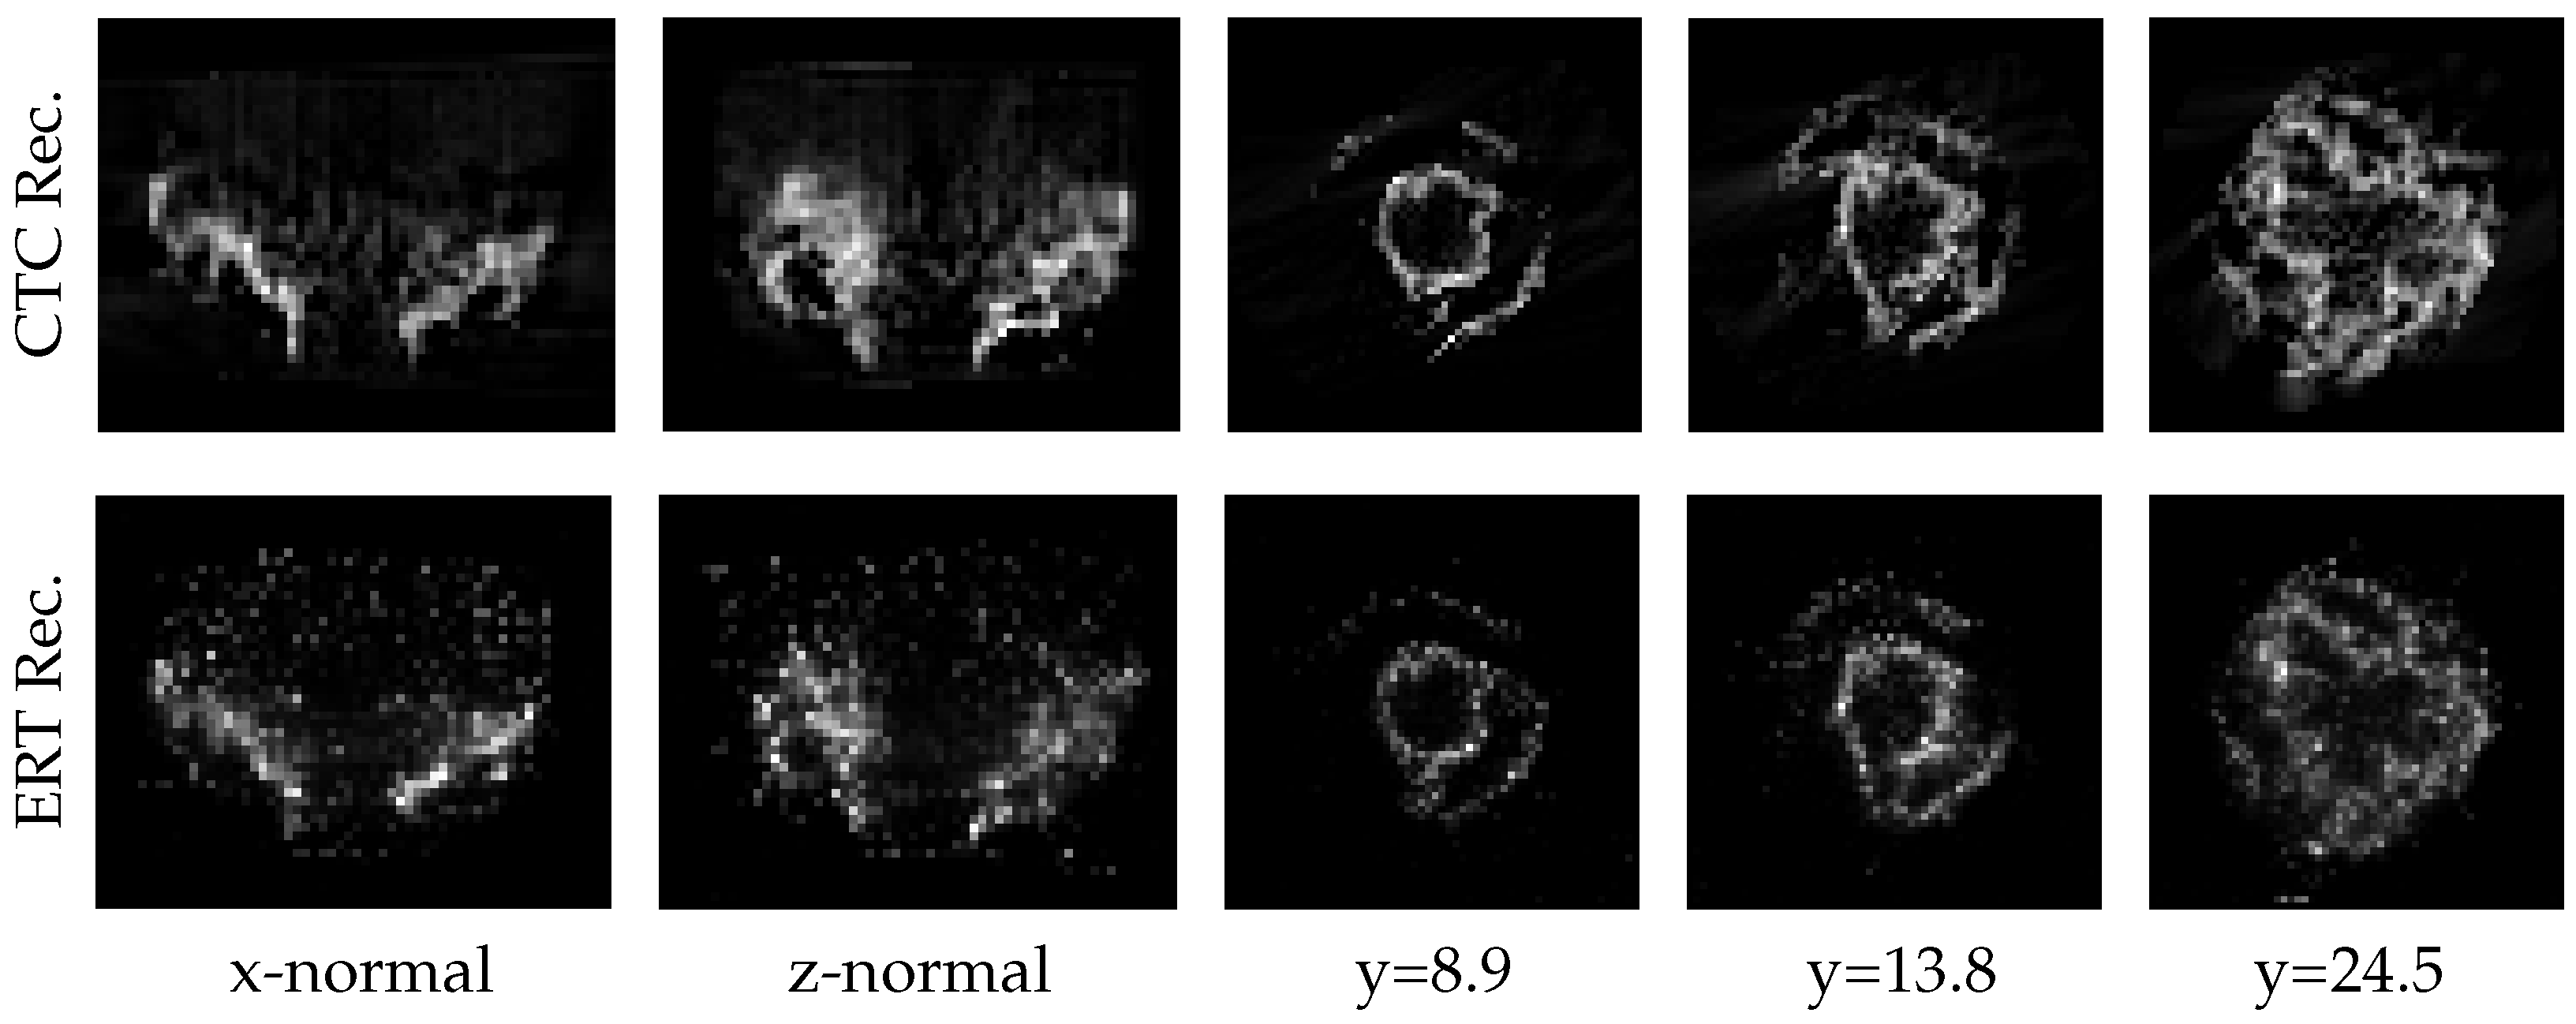
Figure 15.
Vertical slices at the flame center (x-normal and z-normal), and horizontal slices at different heights above burner exit (in mm).
Figure 15.
Vertical slices at the flame center (x-normal and z-normal), and horizontal slices at different heights above burner exit (in mm).
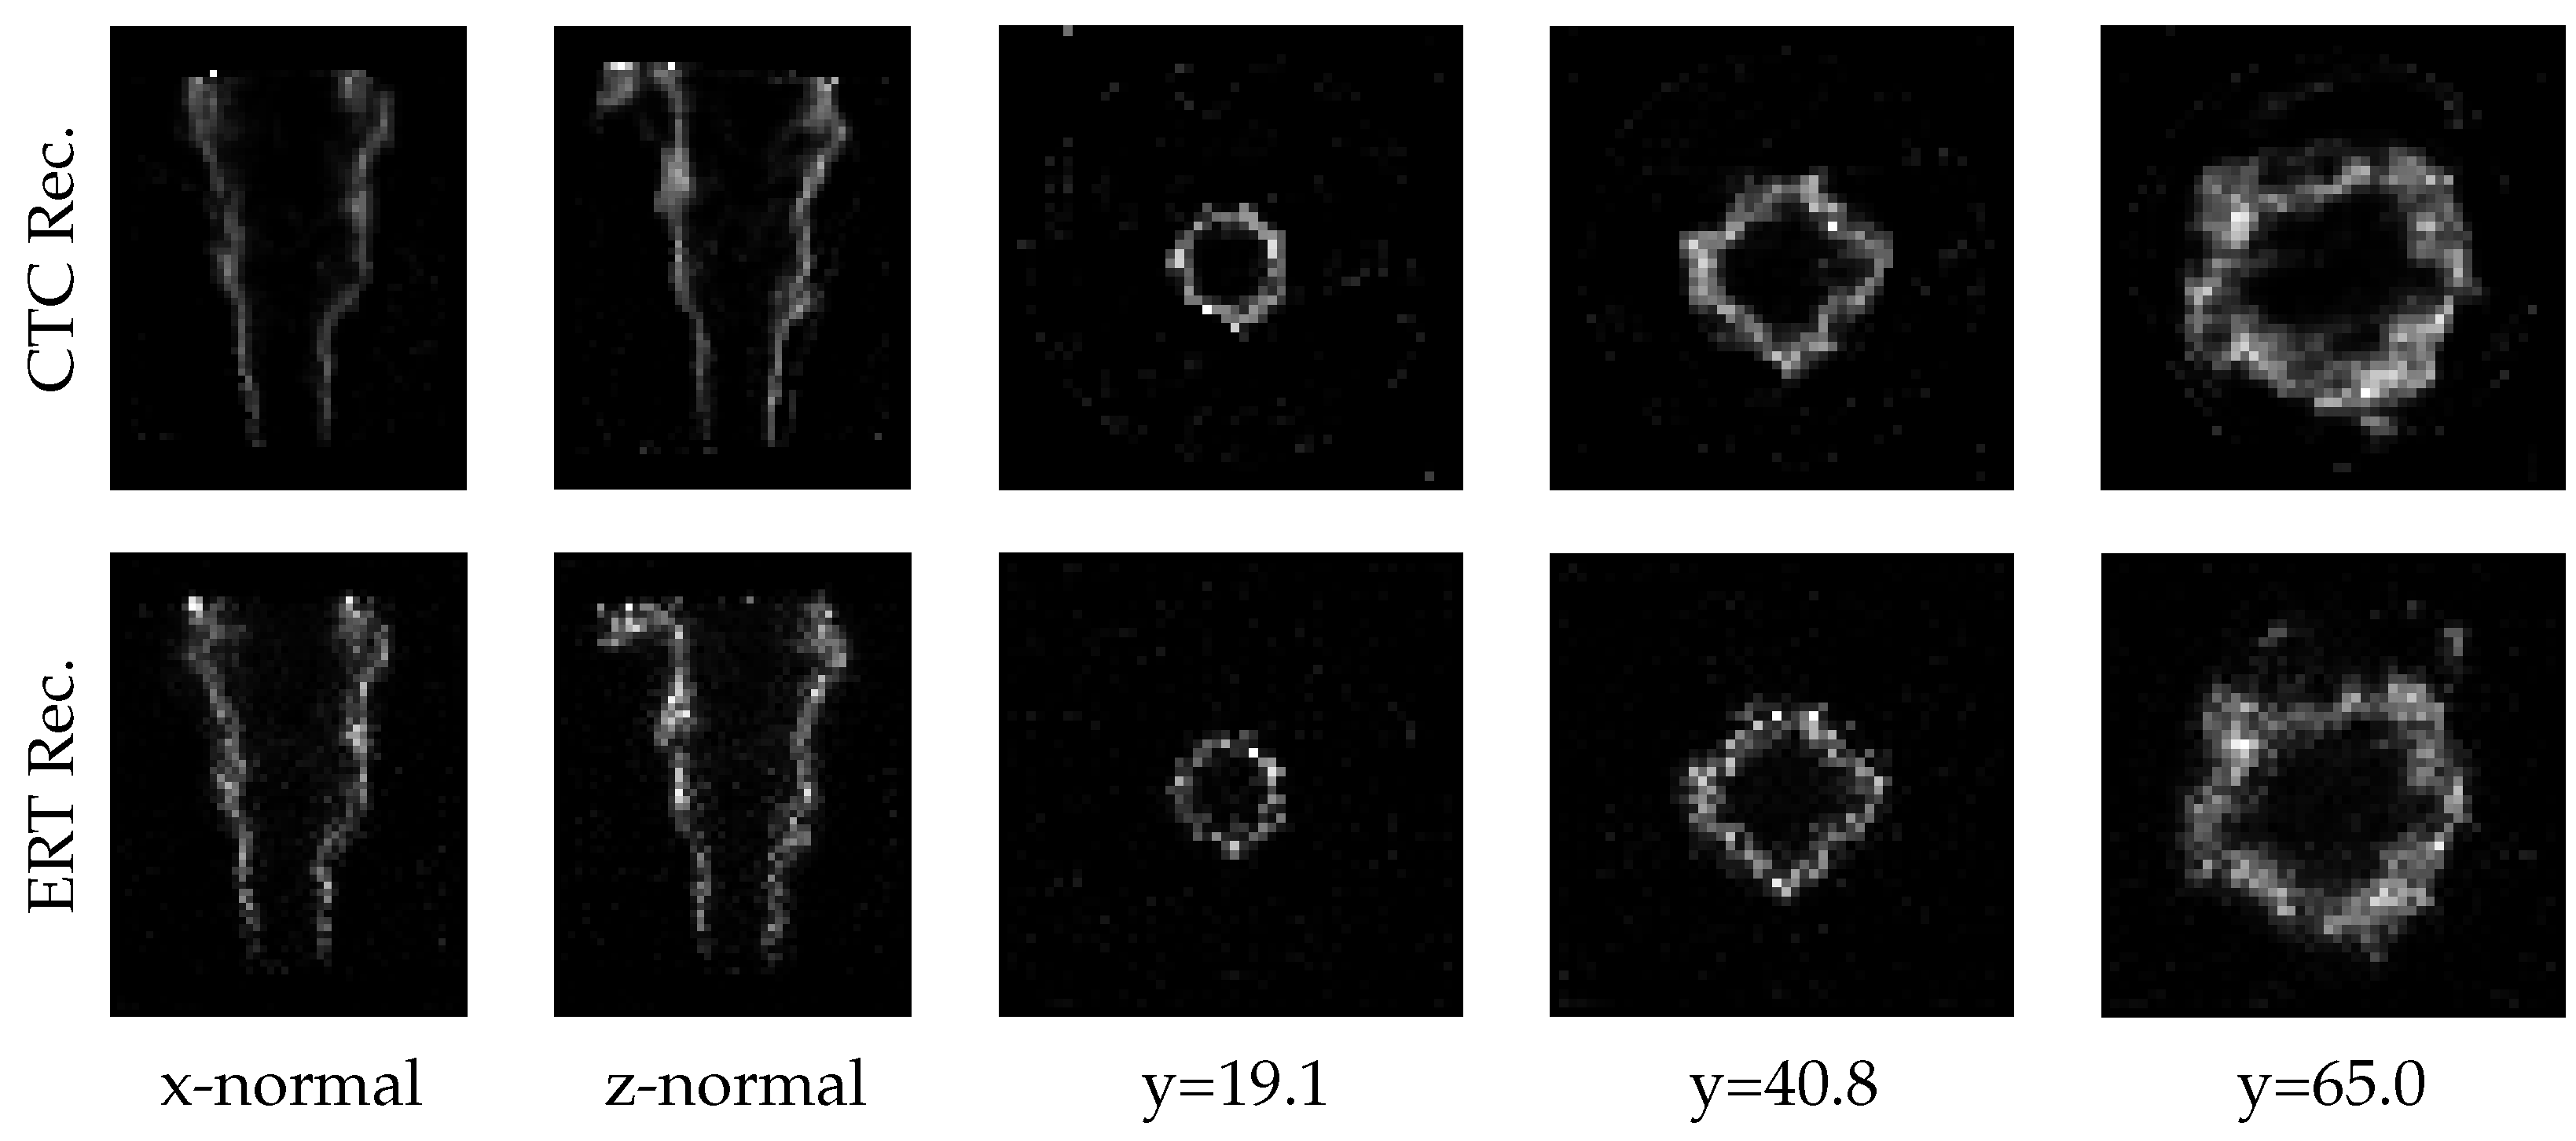
Figure 16.
Calculated correlations based on horizontal slices. (a) Bunsen flame phantom; (b) Bunsen flame experiment; (c) Swirl flame phantom; (d) Swirl flame experiment; (e) Cambridge-Sandia stratified flame phantom; (f) Cambridge–Sandia stratified flame experiment.
Figure 16.
Calculated correlations based on horizontal slices. (a) Bunsen flame phantom; (b) Bunsen flame experiment; (c) Swirl flame phantom; (d) Swirl flame experiment; (e) Cambridge-Sandia stratified flame phantom; (f) Cambridge–Sandia stratified flame experiment.
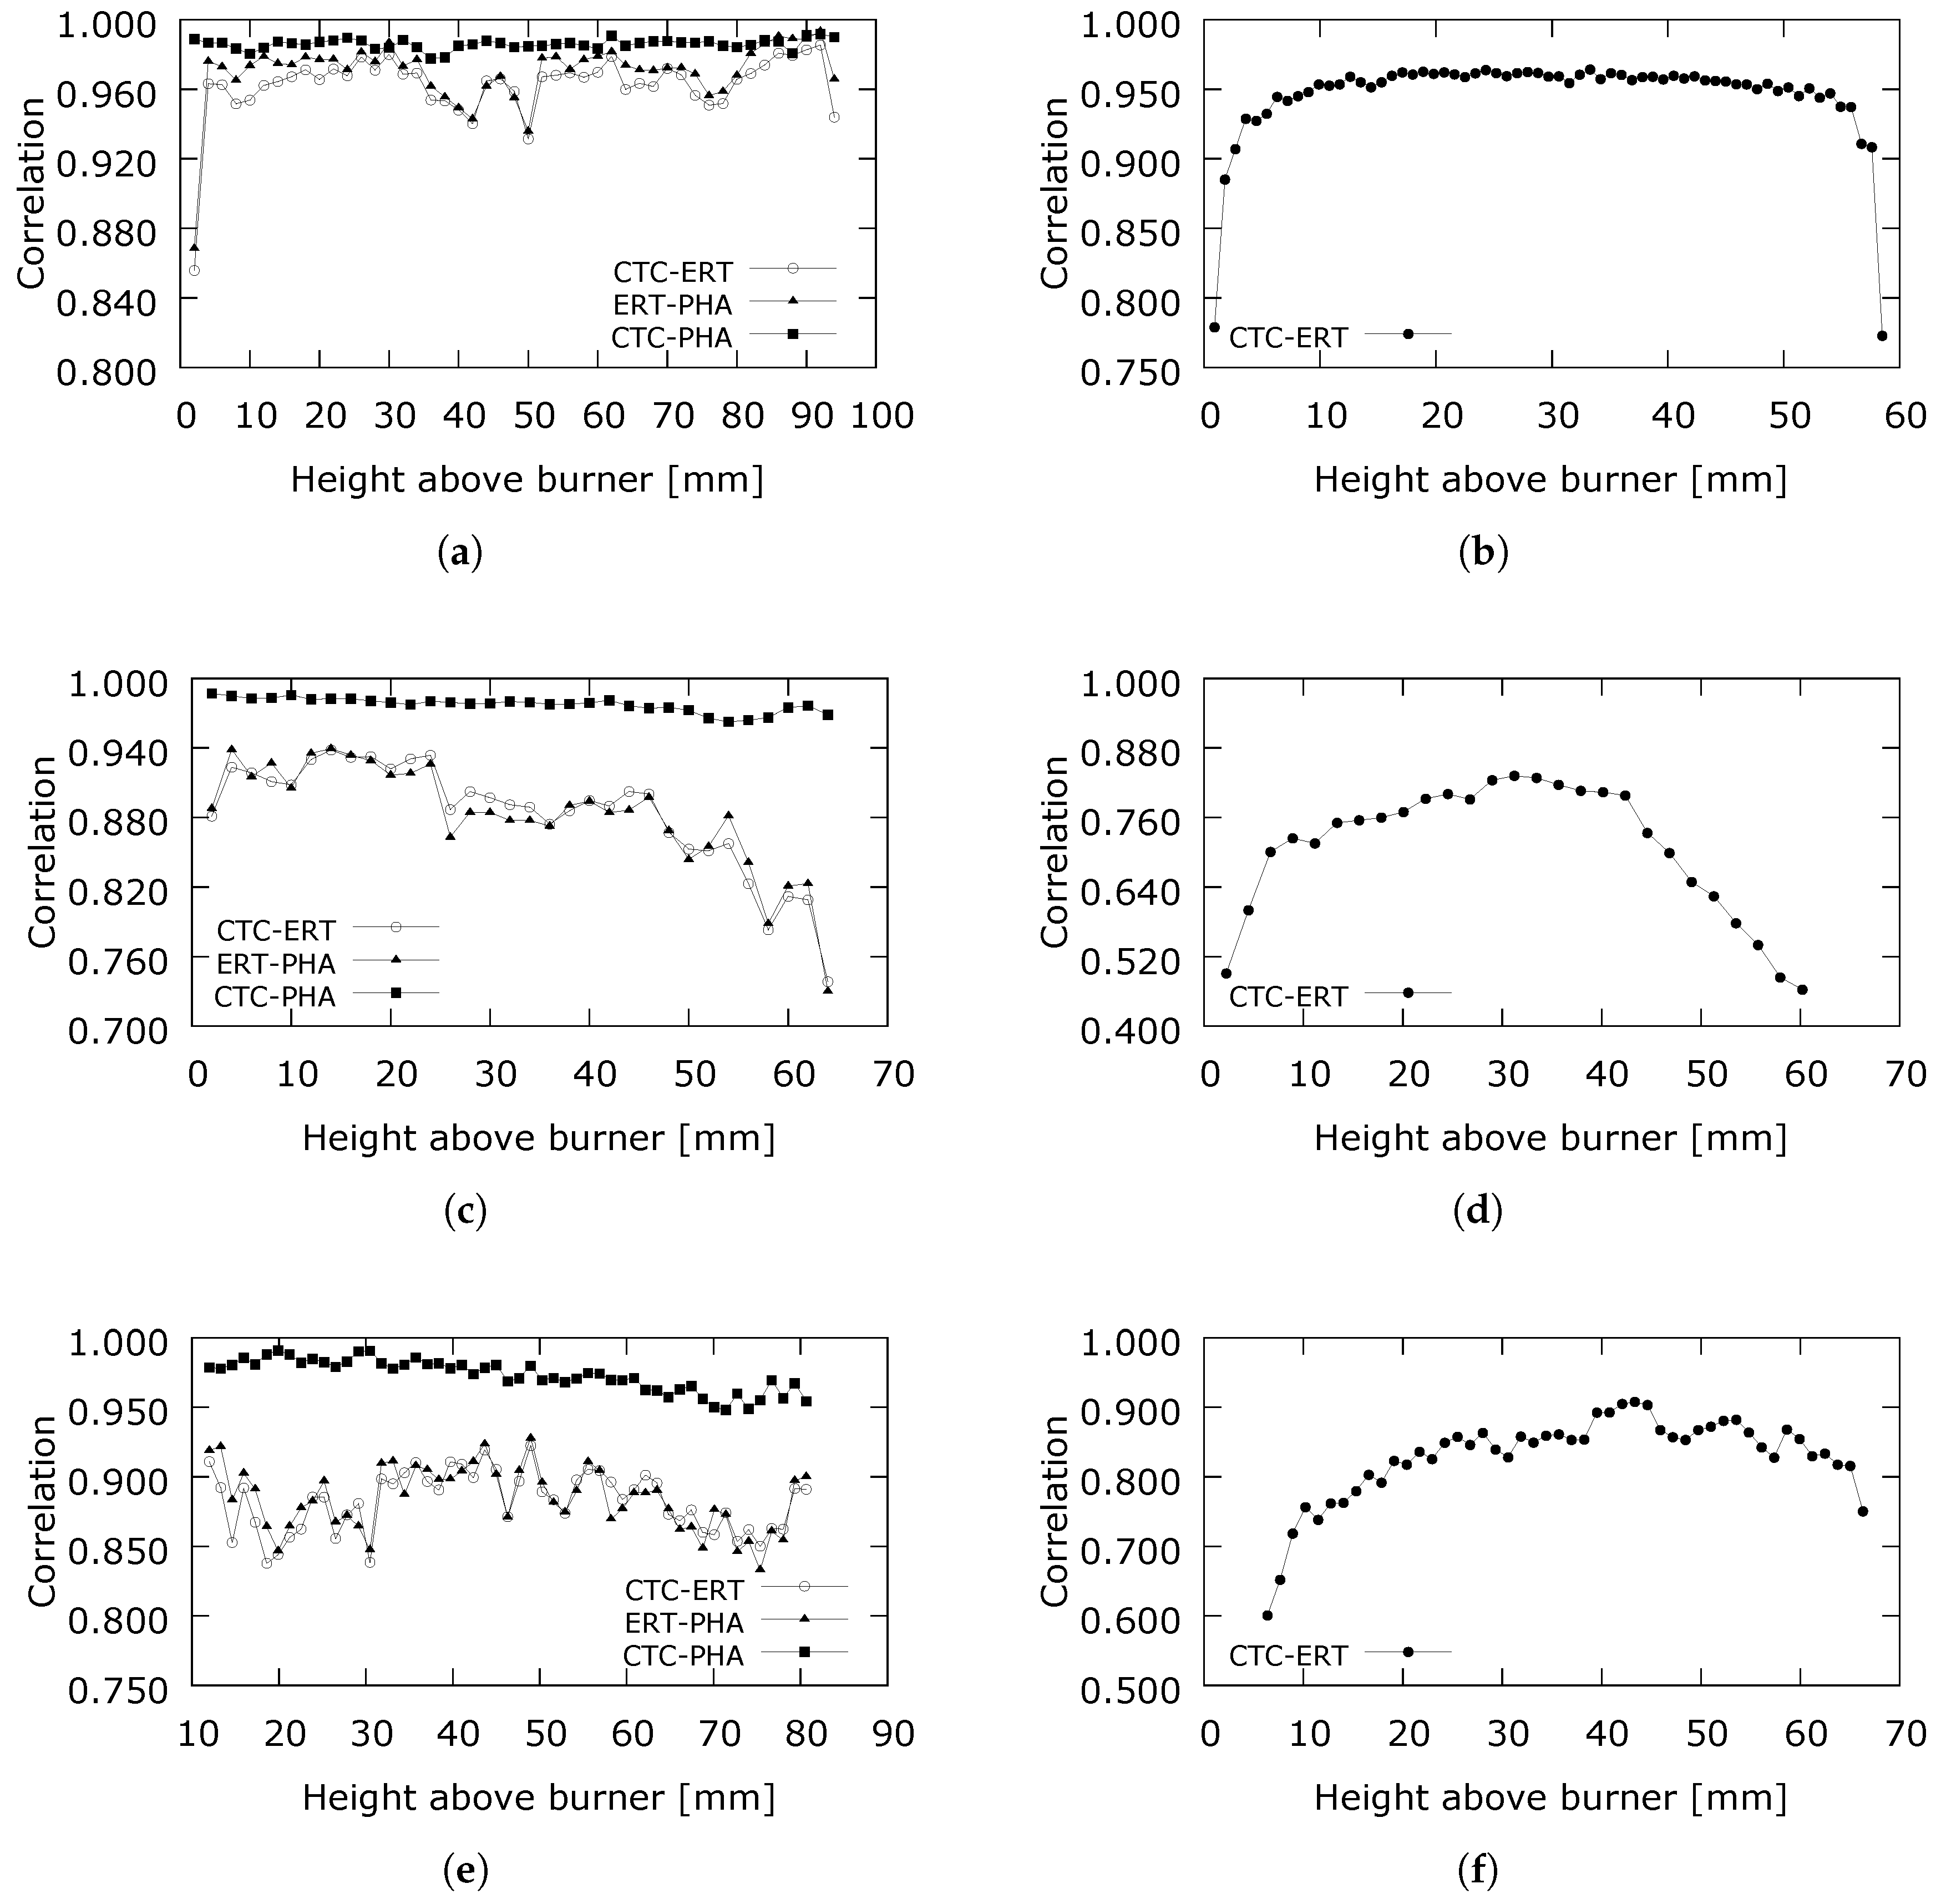
Figure 17.
Scatter plots of the phantom (left) column and experimental (right) column reconstructions. (a) Bunsen flame phantom; (b) Bunsen flame; (c) Swirl flame phantom; (d) Swirl flame; (e) Cambridge–Sandia stratified flame phantom; (f) Cambridge–Sandia stratified flame.
Figure 17.
Scatter plots of the phantom (left) column and experimental (right) column reconstructions. (a) Bunsen flame phantom; (b) Bunsen flame; (c) Swirl flame phantom; (d) Swirl flame; (e) Cambridge–Sandia stratified flame phantom; (f) Cambridge–Sandia stratified flame.

Table 1.
Flow rates (in SLPM) and equivalence rations of the Cambridge–Sandia stratified burner for the SwB1 non swirling operating condition.
Table 1.
Flow rates (in SLPM) and equivalence rations of the Cambridge–Sandia stratified burner for the SwB1 non swirling operating condition.
| Parameter | Air | / | |
|---|---|---|---|
| outer-flow | 441.7 | 34.8 | 0.75 |
| inner-flow | 144.0 | 11.4 | 0.75 |
| co-flow | 765.6 |
© 2019 by the authors. Licensee MDPI, Basel, Switzerland. This article is an open access article distributed under the terms and conditions of the Creative Commons Attribution (CC BY) license (http://creativecommons.org/licenses/by/4.0/).
Share and Cite
MDPI and ACS Style
Unterberger, A.; Kempf, A.; Mohri, K. 3D Evolutionary Reconstruction of Scalar Fields in the Gas-Phase. Energies 2019, 12, 2075. https://doi.org/10.3390/en12112075
AMA Style
Unterberger A, Kempf A, Mohri K. 3D Evolutionary Reconstruction of Scalar Fields in the Gas-Phase. Energies. 2019; 12(11):2075. https://doi.org/10.3390/en12112075
Chicago/Turabian StyleUnterberger, Andreas, Andreas Kempf, and Khadijeh Mohri. 2019. "3D Evolutionary Reconstruction of Scalar Fields in the Gas-Phase" Energies 12, no. 11: 2075. https://doi.org/10.3390/en12112075
Note that from the first issue of 2016, this journal uses article numbers instead of page numbers. See further details here.