The Symptoms of Illness: Does Israel Suffer from “Dutch Disease”?


1
Department of Economics and Management, The Max Stern Yezreel Valley College, Emek Yezreel 19300, Israel
2
SEED—The Sustainable Economic and Environmental Development Research Center, The Max Stern Yezreel Valley College, Emek Yezreel 19300, Israel
3
NRERC—Natural Resource and Environmental Research Center, University of Haifa, Haifa 31905, Israel
*
Author to whom correspondence should be addressed.
Energies 2019, 12(14), 2752; https://doi.org/10.3390/en12142752
Submission received: 8 May 2019
/
Revised: 1 July 2019
/
Accepted: 12 July 2019
/
Published: 18 July 2019
(This article belongs to the Collection Energy Economics and Policy in Developed Countries)
Abstract
:The natural gas revolution in Israel started about two decades ago. Its numerous social impacts include moving to cleaner energy, improving energy security and the balance of trade, tightening international relations, and increasing tax revenue. However, “Dutch disease” phenomena—where the accelerated export of natural gas leads to the strengthening of the local currency, the subsequent weakening of other exporting industries, and rising unemployment—might suck Israel into the economic slowdown. This study examines whether the strengthening of the New Israeli Shekel (ILS) in recent years is a symptom of “Dutch disease”. It is expected that the large-scale export of natural gas will start in 2021 with the development of the major offshore field “Leviathan”. Notably, ILS has been appreciating for several years already. We employed the event study approach to analyze the fluctuations of the daily ILS/USD real exchange rate in the years 2009–2017, combined with the media announcements related to the gas discoveries published during this period. The results revealed that gas-related news does affect the exchange rate and appreciate ILS. GARCH analysis confirms the results.
1. Introduction
The past recent years have seen tremendous turmoil in regional and global energy markets, with volatile oil prices, geopolitical tensions over oil and natural gas (NG) supply, and tightened environmental regulation.
Up until recently, Israel was considered a resource-deprived country, especially with regard to fossil fuels. While traditionally relying on coal and oil imports, the last two decades have seen Israel diversifying its energy sources with the usage of NG. Israel only had its first commercially recoverable discovery of fossil fuel in 1999, with natural gas discoveries at the Noa and Mari-B fields in the Mediterranean. These fields are collectively known as Yam Tetis [1]. A major source of Israel’s NG originated in Egypt, covering some 40% of Israeli demand. On the advent of civil unrest in Egypt in 2011, the el-Arish-Ashkelon pipeline, which delivered NG to Israel, was repeatedly sabotaged, effectively bringing imports to a halt [2]. This supply disruption inflicted heavy economic and environmental burden due to the need to switch to costly oil-based fuels in its electricity generation. However, by this time, significant NG discoveries (TAMAR field) gave Israel a foreseeable continuation of supply channels. In addition, the commissioning of liquefied natural gas (LNG) receiving capability in early 2013 (capable of supplying 1–3 billion cubic meters (BCM) a year) was able to negate the supply shortage from the depleted Yam Tetis and Egyptian gas to some extent. More significantly, a development rush of the Tamar field in 2013 allowed meeting the majority of current Israeli NG demand, and was set to supply between 50–80% of Israel’s future consumption needs. The sharp increase in gas reserves enables Israel to pursue a new and unexpected path to energy independence [3].
In June 2010, the Leviathan structure located in deep water, 30 km west of Tamar, was found to contain the same gas-bearing Tamar Sands. The analysis indicated recoverable reserves of 500 BCM of gas in the Leviathan field. The giant Leviathan field was the largest discovery worldwide during the first decade of the 21st century. Exploration activity in the northern part of the Israeli Exclusive Economic Zone (EEZ) continued from 2011 to 2013. Additional amounts of NG were discovered in the Karish, Tanin, Dolphin, Tamar SW, and Aphrodita-Ishai fields (The Ministry of Energy).
Consequently, long a resource-poor country, Israel is now evaluated as having more natural gas than it needs for the next 30 years. As Israel’s primary energy import bill before the NG discoveries was about $10 billion—more than 5% of gross domestic product (GDP)—NG is expected to sharply improve the country’s trade balance.
Debates about the nation’s rights over its natural resources, as well the right of ownership by foreign entities, surround the economic dilemmas that the national revenue policy faces. The Sheshinski committee was given a charter to recommend changes in fiscal policy for Israel’s natural-resource sector. The key committee recommendations [4] that were accepted by the government (Government decision 2762, 2011) included retaining the enacted 12.5% government royalties over oil and gas production, and the establishment of an excess profits tax of up to 50%. Hence, the maximum government take (GT)—i.e., the government share in the natural resources sales revenues—rose from about 30% to 62.5%.
The NG fields of Tamar, Leviathan, Karish, and Tanin were discovered and controlled by the United States (US)-based Noble Energy and Israel’s Delek Group, effectively creating a cartel over the vast majority of the country’s gas reserves. The issue of the gas cartel and the price of NG have become highly contentious [5]. The “Gas Framework” approved by the Knesset in 2016 called for Delek to divest itself of Tamar and for Noble to reduce its stake from 36% to 25% in six years. Following the “Gas Framework”, Noble Energy and Delek sold the control of two smaller fields: Karish and Tanin. However, the two companies retain their holdings in the much bigger Leviathan field, while the government assured that it would not impose price supervision or annul contracts for NG already signed. Most importantly, the government committed to observing these terms for as long as 15 years.
The owners of Tamar field conditioned the investment in its development on a long-term contract with the Israeli Electric Corporation (IEC), which was a government-owned regulated monopoly at that time. This much-disputed contract served as an anchor for the entrepreneurs, assuring the demand for NG. With the discovery of Leviathan Field, it was clear that the largest fraction of domestic demand was already locked for Tamar field. The owners of Leviathan argued that the field would be developed in the nearby future only if exporting the NG would be allowed. Based on the Tzemach Committee’s recommendations [6], the government set out the quantity of NG that would remain for domestic consumption in order to achieve energy security over time.
During 2018, an inter-ministerial team re-examined the gas export policy. The recommendations of this team included setting the amount of NG secured for the domestic market at about 500 BCM [7] while the remaining amount, estimated at about 340 BCM, would be available for export, and were adopted by government decision 4442. NG exports already underway or agreed with Jordan and Egypt total over 110 BCM (3.9 TCF).
The way the economy exploits the windfall of natural resources might adversely affect the pertained sectors, as well as the economy as a whole. One of several well-known studies on the subject of natural resources economics showed evidence to the relationship between countries’ dependency on natural resources exports and their growth rates [8]. The study examined a sample of 97 developing economies and compared their natural resources exports to gross domestic product (GDP) ratio with growth per capita over the span of 20 years (1970–1989). The results showed that economies with a high ratio of natural resource exports to GDP tended to have low growth rate, even when controlling for other determinants of economic growth such as initial GDP, inequality, trade policy, government efficiency, and investment rates, which when combined form a phenomenon called the “Resource Curse”. Such findings raise a debate regarding whether or not resource-abundant countries should be encouraged to exploit their resource bases.
The Dutch Disease is arguably the hallmark of the natural “Resource Curse” phenomenon. The Dutch disease is a scenario that can occur in small countries with an important resource extraction sector. The large-scale expansion of this sector generates large export revenues that are exchanged in domestic currency [9]. This demand appreciates the domestic currency, causing domestic goods to become expensive compared to foreign goods. Consequently, the country’s international competitiveness suffers, hampering its exports of other goods and services [10]. Nevertheless, it is difficult to separate Dutch disease effects from the domestic and international macroeconomic conditions prevailing at the time of the shock. This is all the more so in the case of price-led energy booms, which might be accompanied by cross-economies recessions.
The question arises of whether this is actually a problem. [11] noted that some economists have claimed that the “disease” is merely an adaptation process that the economy goes through in light of its newfound wealth, all the more so when the source of increased inflows is permanent. At the same time, she noted that other economists argue that the damage caused by the transition of capital and labor between sectors is by itself a risk to economies’ growth potential, requiring adequate policy measures to deal with such implications. When the booming sector is NG, oil, or minerals, the declining tradable sectors, according to the theory, would include manufacturing and agriculture [12]. In principle, such changes in the structure of production should be welfare improving, reflecting changes in demand associated with an improvement in national income [12]. However, they may be a matter of concern for policy makers if the declining sectors are thought to have some special characteristics that would stimulate growth and welfare in the long-term, such as increasing returns to scale, learning by doing, or positive technological externalities. This might be the source of concern for the Israeli economy, in which export comprises about 30% of the GDP, and is mainly composed of technology and labor-intensive goods and services (high-tech, medicine).
Recent empirical evidence and theoretical work provide strong support to a negative link between resource abundance and long-term growth [13,14]. The methodology for empirically assessing “Dutch Disease” usually involves the econometric analysis of time-series or panel data [15] for researching the correlation between resource abundance and the share of tradable sectors in the overall economy [16]. As Israel has only recently started the low-scale export of NG, this approach cannot be applied yet. However, expectations for major NG exports have been accumulating since 2010 with the discovery of the major offshore field “Leviathan”.
The framework of this research aimed at investigating the much debated yet little explored effects of the newly introduced NG resources over the Israeli economy. Specifically, we estimated the implications of expected NG exports, as expressed through the media announcements, on the foreign exchange rate.
The aim of this paper was to analyze whether the Israeli economy showed symptoms of “Dutch Disease”: an appreciation of local currency caused by massive natural resource exports. The export of NG started on a small scale only in 2017, but the expectations for large export potential have been escalating since 2010. Therefore, we employed the Event Study methodology instead of the commonly used econometric analysis of actual data, as it is not available yet. We investigated NG industry-related announcements and the fluctuations in the real exchange rate. Although this paper focused on the NG industry in Israel, both the methodology and the empirical results are of general interest. Technology advances allow discovering and developing natural reservoirs that previously were unknown or considered unprofitable. Moreover, shale oil and gas technologies revert the energy markets. Countries that were considered resource-deprived energy importers become net exporters. The implications of these transformations in terms of trade and economic growth are still ambiguous.
2. Materials and Methods
2.1. Data
The present research considers 639 announcements published during the years 2008–2017 with regard to NG discoveries in Israel. The announcements were obtained from leading Israeli Internet news sites and from the publications of corporations and entities related to the energy sector and the NG industry in particular. Included among them are Ynet, Globes, Calcalist, Walla News, Bizportal, and Energy News. Each announcement in the database was classified according to a subtopic that characterizes it. The subtopic categories are Drilling, Exploration, Import, Export, Development, Infrastructure, Electricity, Companies, and Regulation. The announcements were also categorized according to the date and time of publication in order to prevent duplication from different sources of publication and maintain compatibility with the Event Study Methodology. The results of that methodology rely upon the examination of time periods.
For each announcement, 316 items of data regarding daily and intraday returns for the ILS to USD exchange rate were obtained from the Reuters system for the estimation window and the event window time periods. Our focus on the ILS to USD exchange rate is because all the NG contracts in Israel are signed in terms of USD per MMBTU (Measure of the energy content in a fuel). In addition, USD has the highest weight in Nominal Effective Exchange Rate in Israel [17]
Duplicate publications from different sources were removed from the initial collection of announcements, as were repeated announcements that had previously been published. After the additional screening, 296 “pure” articles remained. These were defined as announcements that were not additionally published with regard to the content of the initial publication during the 16 days preceding and the 16 days following.
The public awareness of the importance of NG in Israel began early in 2009 with the discovery of the Tamar gas field. The number of announcements published in 2010 was the largest in comparison to other years (53 pure announcements in 2010 versus on average 30 a year in 2009, 2011–2017). Most of the announcements that year concerned the Leviathan field, which was discovered at the time, and the Tamar field, which was discovered in the preceding year.
The database is divided into the four following analysis groups. (1) The first group is a general group including all 296 pure announcements in the sample. (2) Second, there is a group in which the sample is divided according to the subject area of the article. This second group included Panel A (68 Export announcements), Panel B (78 Exploration and Drilling announcements), Panel C (47 Companies and Development announcements), Panel D (72 Electricity and Infrastructure announcements), and Panel E (38 Import and Regulation announcements). In the second group, the research investigates whether announcements in specific areas have greater influence than those in other areas. (3) The third group consists of single announcements including 243 articles, as compared to multiple announcements including 43 articles. In this group, the research analyzed the influence of the announcements according to their frequency of publication. (4) The last group was divided according to the time period of publication. The sample is separated into two periods: old announcements (146 articles) and new announcements (150 articles). In this group, the research examines whether the announcements from recent years have a stronger impact on the real exchange rate than old announcements that were published prior to 1 January 2013. As mentioned above, the year 2013 is a focal point in the energy sector of Israel with the connection of Tamar field and the beginning of the local NG supply. The purpose of the division according to analysis groups is to characterize the influence of the publications on the exchange rate separately for each group, and to investigate the significance of the impact in each group.
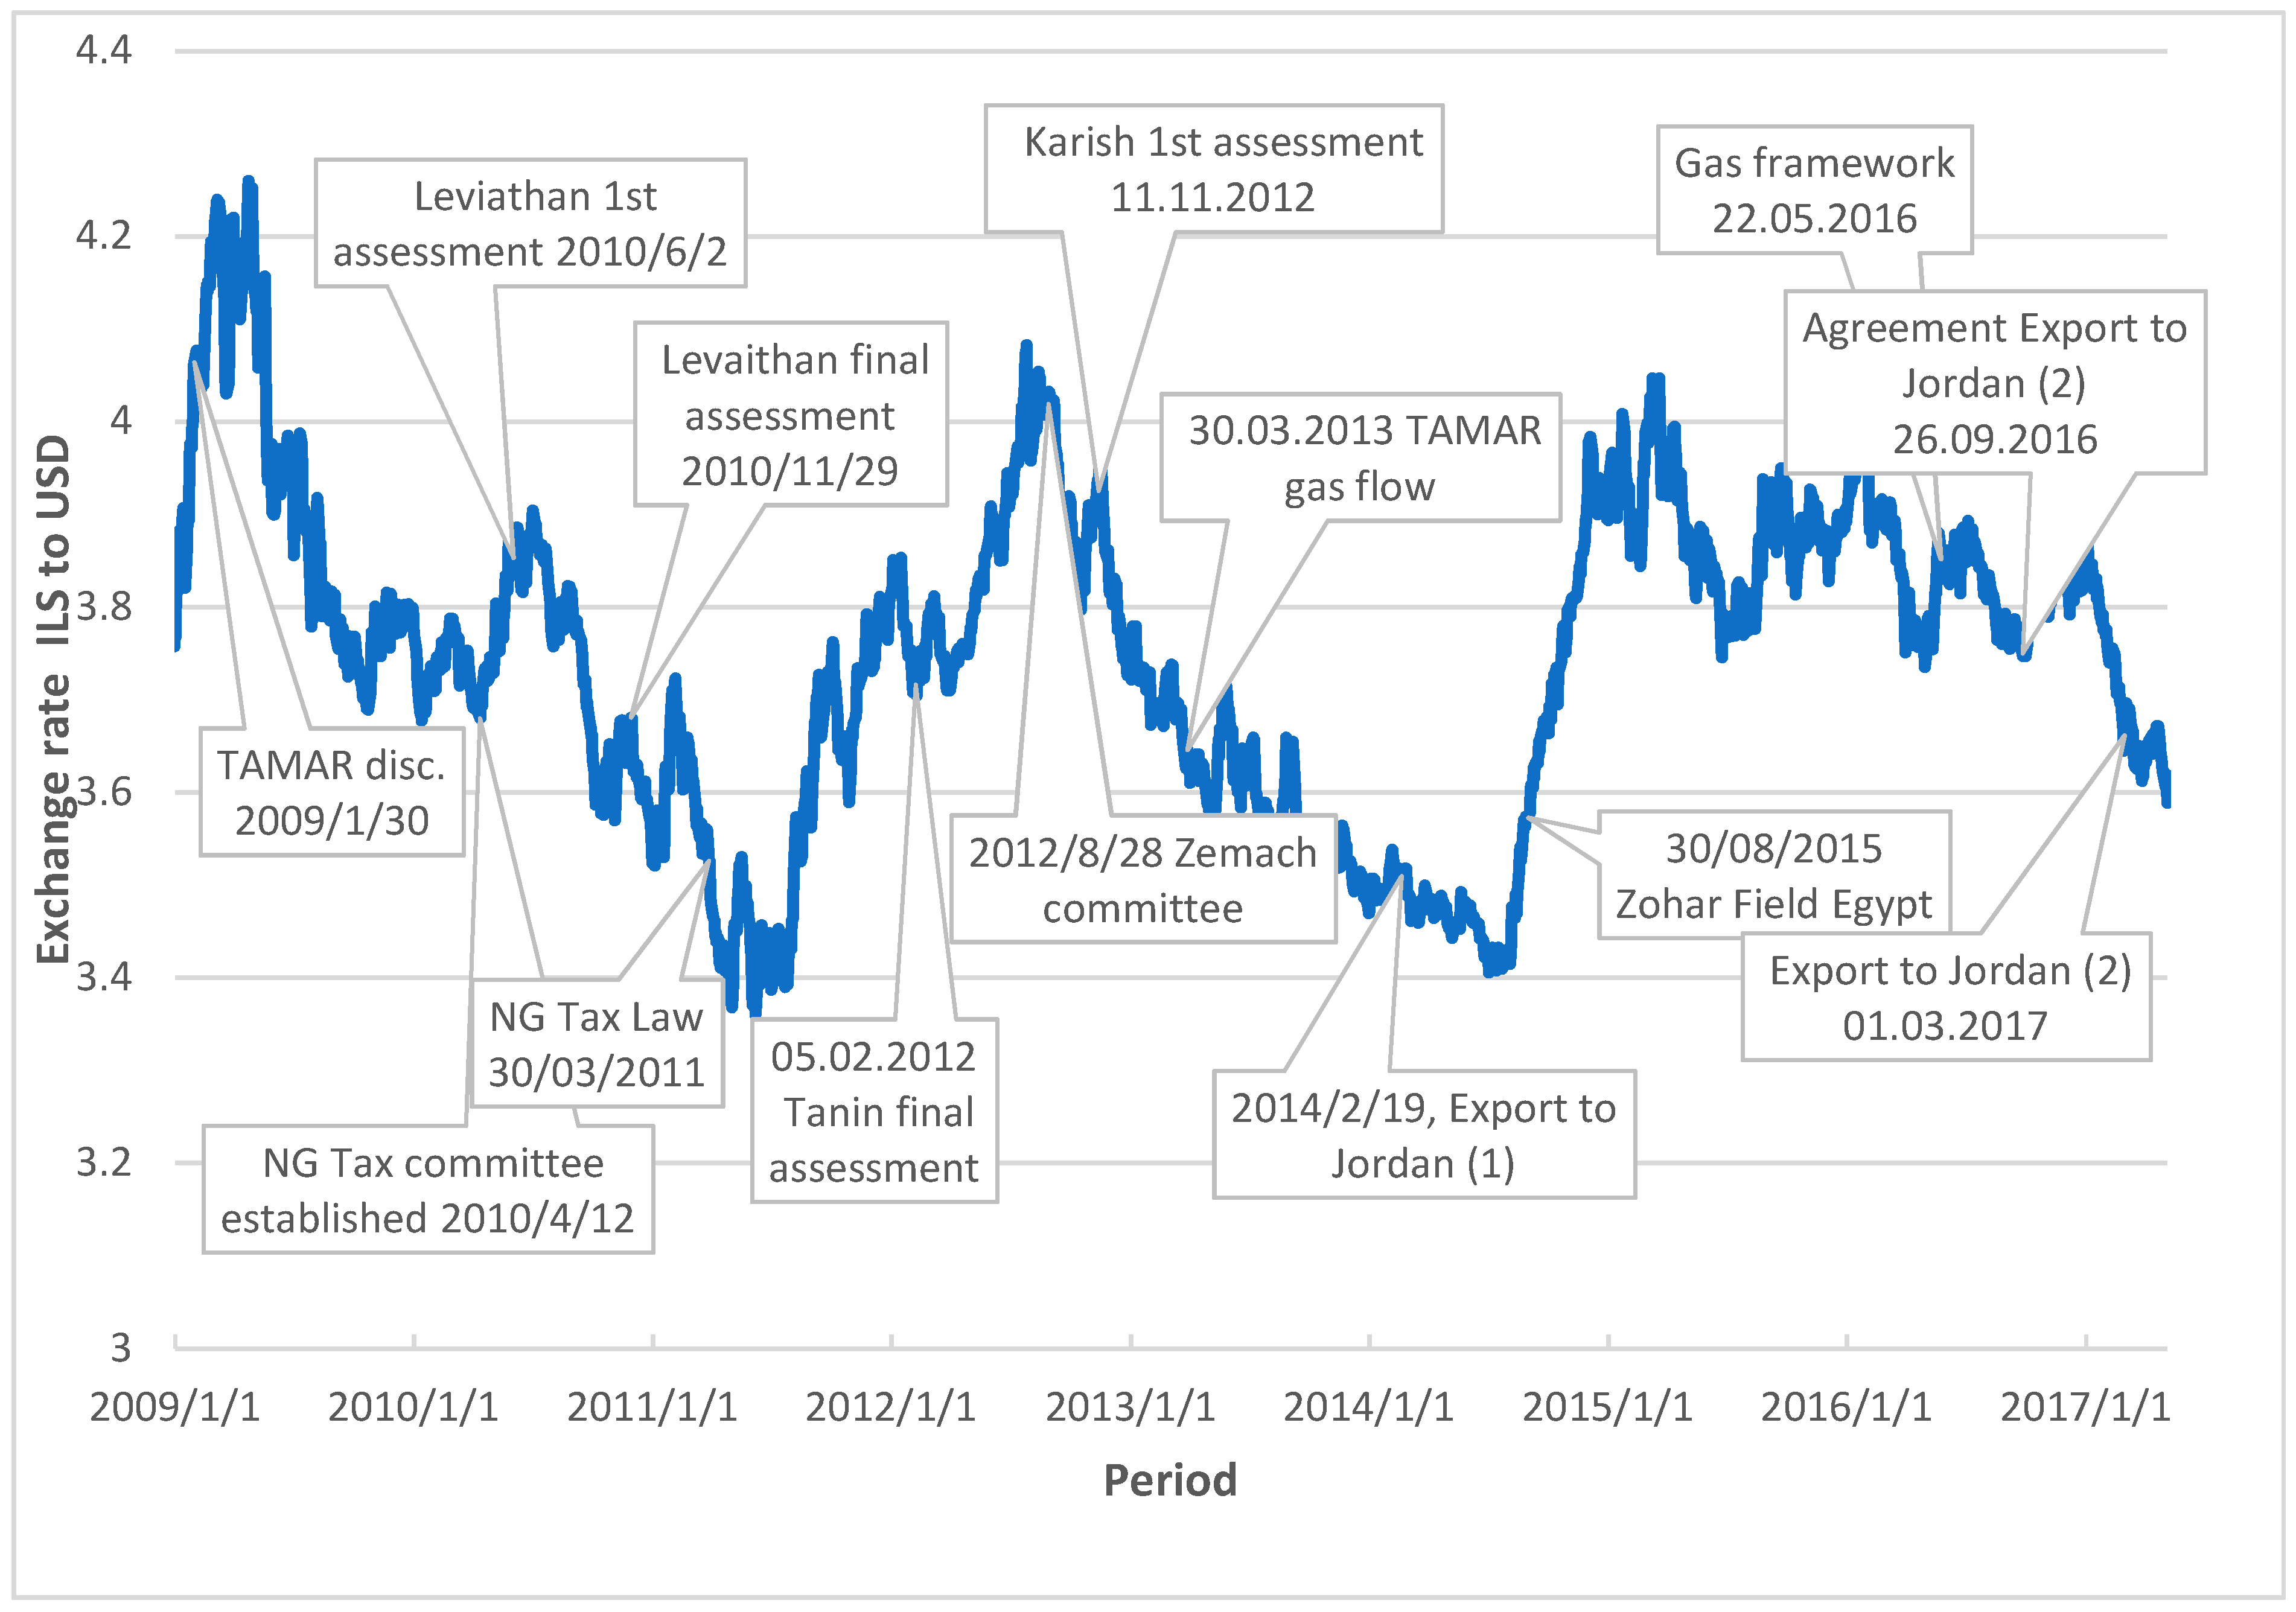
Figure 1 presents the fluctuation in the daily ILS to USD representative exchange rate and some of the major events concerning the NG industry in Israel. The exchange rate policy of the Bank of Israel is based on the free movement of ILS’s exchange rate against other currencies. With that, the bank maintains the option for “dirty float”, i.e., to intervene in foreign currency trading in situations of extraordinary movements in the exchange rate that are not in line with fundamental economic conditions, or when the foreign exchange market is not functioning appropriately [18]
Evidently, between January 2009 and May 2017, the daily ILS against USD exchange rate reached as high as 4.30 ILS/USD on 23 April 2009 and as low as 3.35 ILS/USD on 7 June 2011. Notably, the former governor of the Bank of Israel claimed that the exchange rate decline in 2013–2014 was partly due to expectations of future trade balance increase due to NG exports: expectations that, in her opinion, overappreciated the currency [19].
2.2. Methodology
This study employed the Event Study Methodology followed by Generalized Auto-Regressive Conditional Heteroscedasticity (GARCH) analysis. The event study is commonly used in the literature regarding the stock market in order to examine the impact of newly published information on the stock rates. The present research adapts it to the area of macroeconomics and investigates whether and how the exchange rate is affected by the publication of announcements concerning NG in Israel.
For each event, the expected return was estimated by calculating the average exchange rate return over the estimation period. The expected return was used as the benchmark return in the normal situation to compare with the actual exchange rate return during the event window. The benchmark return represents the return that was not related to the event of interest. Next, we calculated the abnormal exchange rate return, which represents the difference between the actual return and the expected return. Afterwards, we calculated the average abnormal exchange rate return and aggregated the result. Then, the mean adjusted return (MAR) methodology was applied to analyze whether the announcement causes a statistically significant abnormal return.
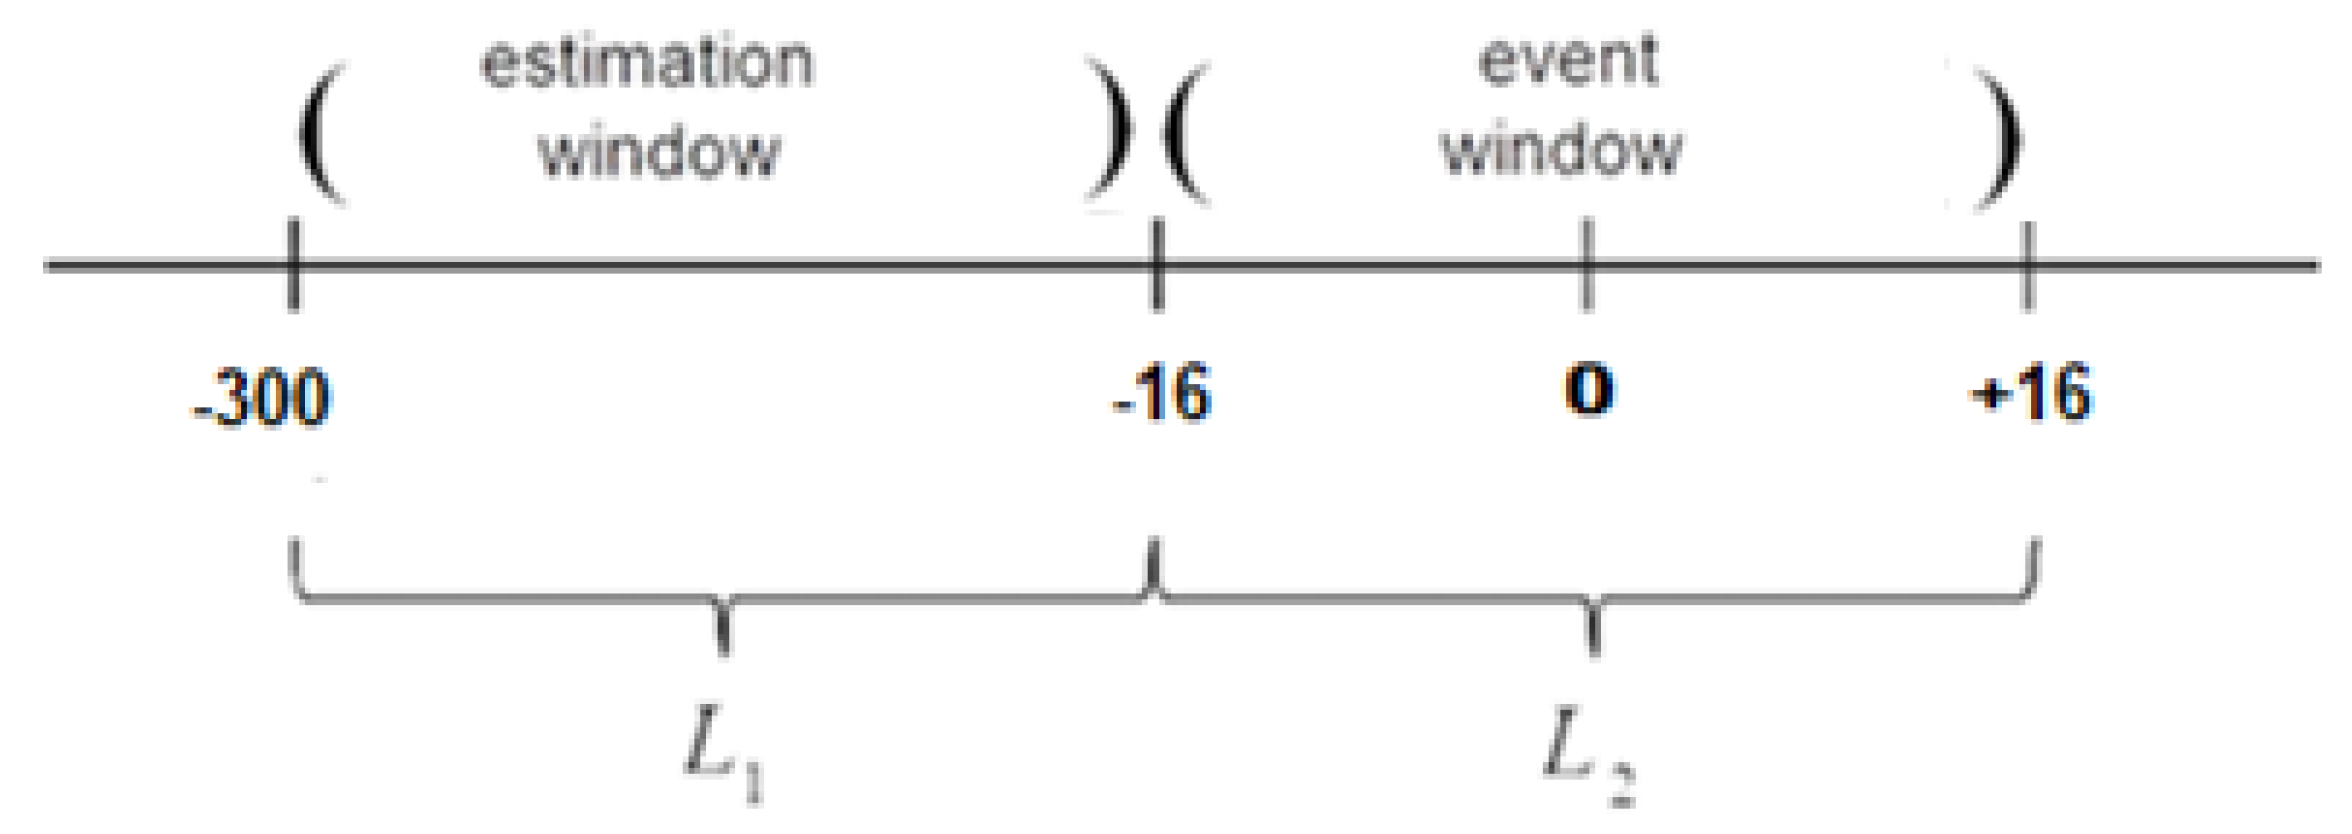
In the present research, the estimation window begins 300 days before the publication of the article, and ends 17 days prior to its publication. The event window is defined from 16 days before publication of the article until 16 days subsequent to its publication. In the event study methodology, there is no universal rule on the lengths of the event windows. Over the years, many articles used the event study methodology and changed the size of the event window according to the research needs [20,21,22,23,24,25].
In addition, in the present method, the “event day” is defined as day zero: the day on which the announcement is published (Figure 2).
The development of the method used today began in the classic articles of [20,21]. They examined the publications of reports that focused on the influence of share splits, after taking into consideration the influence of a concurrently increased dividend. In order to study the influence, they compared the actual stock returns surrounding the date of the notice of the split to the expected return without the event. The role of the event study method in the present paper is to examine whether the rate of change in the ILS to USD exchange rate surrounding the publication of the announcement is identical to the normally expected return without the publication. The study follows the mean adjusted return (MAR) method based upon statistical expectations during the estimation period [22,26,27], so that the average exchange rate that will be obtained will also continue in the event window, and any change from the calculated rate will be called the abnormal real exchange rate.
The underlying hypothesis is that the expected change in the real exchange rate is equivalent to the actual real exchange rate. The present research tests the hypothesis using the t-test. The methodology in the present research is based on [28] and adapted to the calculation of the abnormal return of the real exchange rate. The detailed mathematical notation is presented in Appendix A.
Empirical work indicates that exchange-rate volatility behaves according to a GARCH )Generalized Auto-Regressive Conditional Heteroscedasticity) model that was developed by [29].According to the model, fluctuations in the exchange rate during a given period depend on fluctuations in the exchange rate in the preceding periods [30,31,32,33].
Recent studies confirmed that the GARCH(1,1) model is the most appropriate measure of exchange-rate volatility [34,35]. Additionally, research by [36] revealed that the exchange-rate series exhibits empirical regularities such as clustering volatility, non-stationarity, non-normality, and serial correlation, which justify the application of the GARCH methodology. Another recent study by [37] that used GARCH(1,1) found that exchange rate volatility affects both international trade and foreign direct investment (FDI) significantly but negatively in countries engaged in OBOR (One Belt One Road is a global development strategy adopted by the Chinese government involving infrastructure development and investments in 152 countries and international organizations in Asia, Europe, Africa, the Middle East, and the Americas). [38] showed that the GARCH(1,1) model was more effective than other complicated GARCH models when they took 330 ARCH-type specifications into consideration. Therefore, the GARCH(1,1) was utilized for the volatility measurement of exchange rate in the present study.
Then, the abnormal return for the real exchange rate of an announcement i on day t is defined as the difference between the actual return and the normal one.
where:
- Aeit—The abnormal return for real exchange rate of an announcement i on day t.
- eit—The actually return for real exchange rate of an announcement i on day t.
- E(eit|It)—The expected normal return for exchange rate of an announcement i, given information I known at time t.
The expected normal return for exchange rate and its volatility are presented in equations (2) and (3) as follows:
where is the constant term, is the error term, is the coefficient for the lagged squared error at lag 1, and is the coefficient for the lagged conditional variance at lag 1.
3. Results
The present research investigated whether an investor can utilize this information and yield an abnormal return during the period following the publication of the announcement. In this section, we present the results of event study analyses for the entire sample and for different groups of announcements, as well as the GARCH(1,1) estimation, to examine how the exchange rate was influenced by subjective evaluations of investors.
3.1. The Effect of Gas Discoveries on the Real Exchange Rate for the Entire Sample
First, the research used a MAR to examine the influence of NG discovery announcements on the real exchange rate in general, for the entire sample of 296 pure announcements. Table 1 and Figure 3 describe the cumulative average abnormal exchange rate return CAAe−16,+16 during the 33 days surrounding the time of the announcement, beginning from day (−16) prior to publication, and until day (16) following publication.
Table 1 describes the effect of gas discoveries on the abnormal real exchange rate for the entire sample. In the table, the cumulative average abnormal exchange rate return (CAAe), median cumulative abnormal exchange rate return (CAe), percentage of positive abnormal real exchange rate return, t-statistics, and number of observations are reported for the six event windows.
Table 1 and Figure 3 show that during the period prior to publication of the announcement, the CAAe−16,−1 did not significantly decrease, which indicates that in general during this period, there was no leakage of information regarding the content of the announcement. Alternatively, the influence of publication of the announcement occurred a long time before the actual publication of the exchange rate. During this period, the Median CAe−16,−1 was almost unchanged, and 47% of the announcements had a positive CAe. On the day that the announcement was published, there was a significant decrease of 0.06% AAe0 in the exchange rate. This indicates that the announcements generally strengthened the ILS. The Median CAe0 decreased on this day by 0.09%, and 43.38% of the announcements had a positive CAe. Thus, it may be concluded that generally, the announcements provided new information to the investors on the day of publication and contributed to the appreciation of the shekel.
During the first three days (+1,+3) following the announcement, the abnormal appreciation increased and the CAAe+1,+3 decreased by an additional 0.11%. During this period, investors that were exposed to the first announcement were able to use a profit strategy by shorting the real exchange rate on the day of publication and closing the position at the end of the trading day on the third day following publication of the announcement. During this period, the Median CAe+1,+3 decreased by 0.24%, and 44.93% of the announcements had a positive CAe. In the subsequent period (+4,+16), the publication of announcements did not show a statistically significant impact on the exchange rate.
3.2. Analysis by Type of Announcement
This section examines the impact of NG-related announcements on the real exchange rate according to five groups of announcements: Panel A (Export), Panel B (Exploration and Drilling), Panel C (Companies and Development), Panel D (Electricity and Infrastructure), and Panel E (Import and Regulation), as presented in Section 2.1.
Table 2 and Figure 4 describe the CAAe−16,+16 by group during the 33 days surrounding the announcement, from day (−16) prior to publication and until day (16) following publication.
The following table describes the effect of gas discoveries on the abnormal exchange rate by five announcement types: Panel A (Export), Panel B (Exploration and Drilling), Panel C (Companies and Development), Panel D (Electricity and Infrastructure), and Panel E (Import and Regulation).
In each panel, the cumulative average abnormal exchange rate (CAAe), median cumulative abnormal real exchange rate (CAe), percentage of positive abnormal real exchange rate, t-statistics, and number of observations are reported for the six event windows.
Figure 4 and Table 2 show that there was no information leakage in any of the groups except for the Electricity and Infrastructure group. In that group, the information leakage began three days before the publication of the announcement and continued until one day before publication of the announcement, which was accompanied by a decrease in CAAe−3,−1 by 0.22% (t-statistics = −2). This provides an indication that investors, who had inside information concerning the decisions in the area of electricity and infrastructure, were able to short the exchange rate three days before the information was exposed to the rest of the investors in the market. They potentially could close the position at the end of the trading day prior to publication of the announcement.
Also of interest in this period is that the Percent Positive shows the tendencies of the groups in Figure 4. In the Exploration and Drilling group and the Import and Regulation group, approximately 47% of the announcements yielded an increase in the real exchange rate. Therefore, the two graphs remained stable and without change in the real exchange rate. In the Companies and Development and Electricity and Infrastructure groups, approximately 39% of the announcements yielded devaluation; thus, there was a negative trend in the exchange rate in those two groups.
In the Export group and the Companies and Development group, there was a statistically significant decrease in AAe0 by 0.12% (t-statistics = −2.13) and 0.15% (t-statistics = −2.12) in the exchange rate. More importantly, the statistically significant abnormal appreciation of ILS on the day of announcements related to the prospects of exports and development of the reserves provides direct evidence for investors’ strategy in view of the expected NG export and future currency appreciation.
In the Electricity and Infrastructure group during the first three days following the announcement (+1,+3), there was a statistically significant decline in the exchange rate, and the CAAe+1,+3 decreased by 0.27% (t-statistics = −2.43). During this period, investors who were exposed to the first announcement were able to use a profit strategy by shorting the exchange rate on the day of the announcement and closing the position at the end of the trading day on the third day following the publication of the announcement. During this period, the Median CAe+1,+3 decreased by 0.25%, and 34.72% of the announcements had a positive CAe.
In the Exploration and Drilling group, the statistically significant impact on the exchange rate occurred only during the first few days (+4,+6) after the announcement. Here, the exchange rate decreased, and the CAAe+4,+6 decreased by 0.21% (t-statistics = −1.70). During this period, the Median CAe+4,+6 decreased by 0.27%, and 32.86% of the announcements had a positive CAe.
In the Companies and Development group, the greatest influence was during the period following the announcement. During the 16 days following the announcement (+1, +16), the real exchange rate decreased and the CAAe+1,+16 decreased by 0.93% (t-statistics = −3.19). During this period, investors who were exposed to the first announcement were able to use a profit strategy by shorting the real exchange rate on the day of the announcement and closing the position at the end of the trading day on the 16th day following the publication. In this period, the Median CAe+1,+16 decreased by 0.93%, and 30.12% of the announcements had a positive CAe.
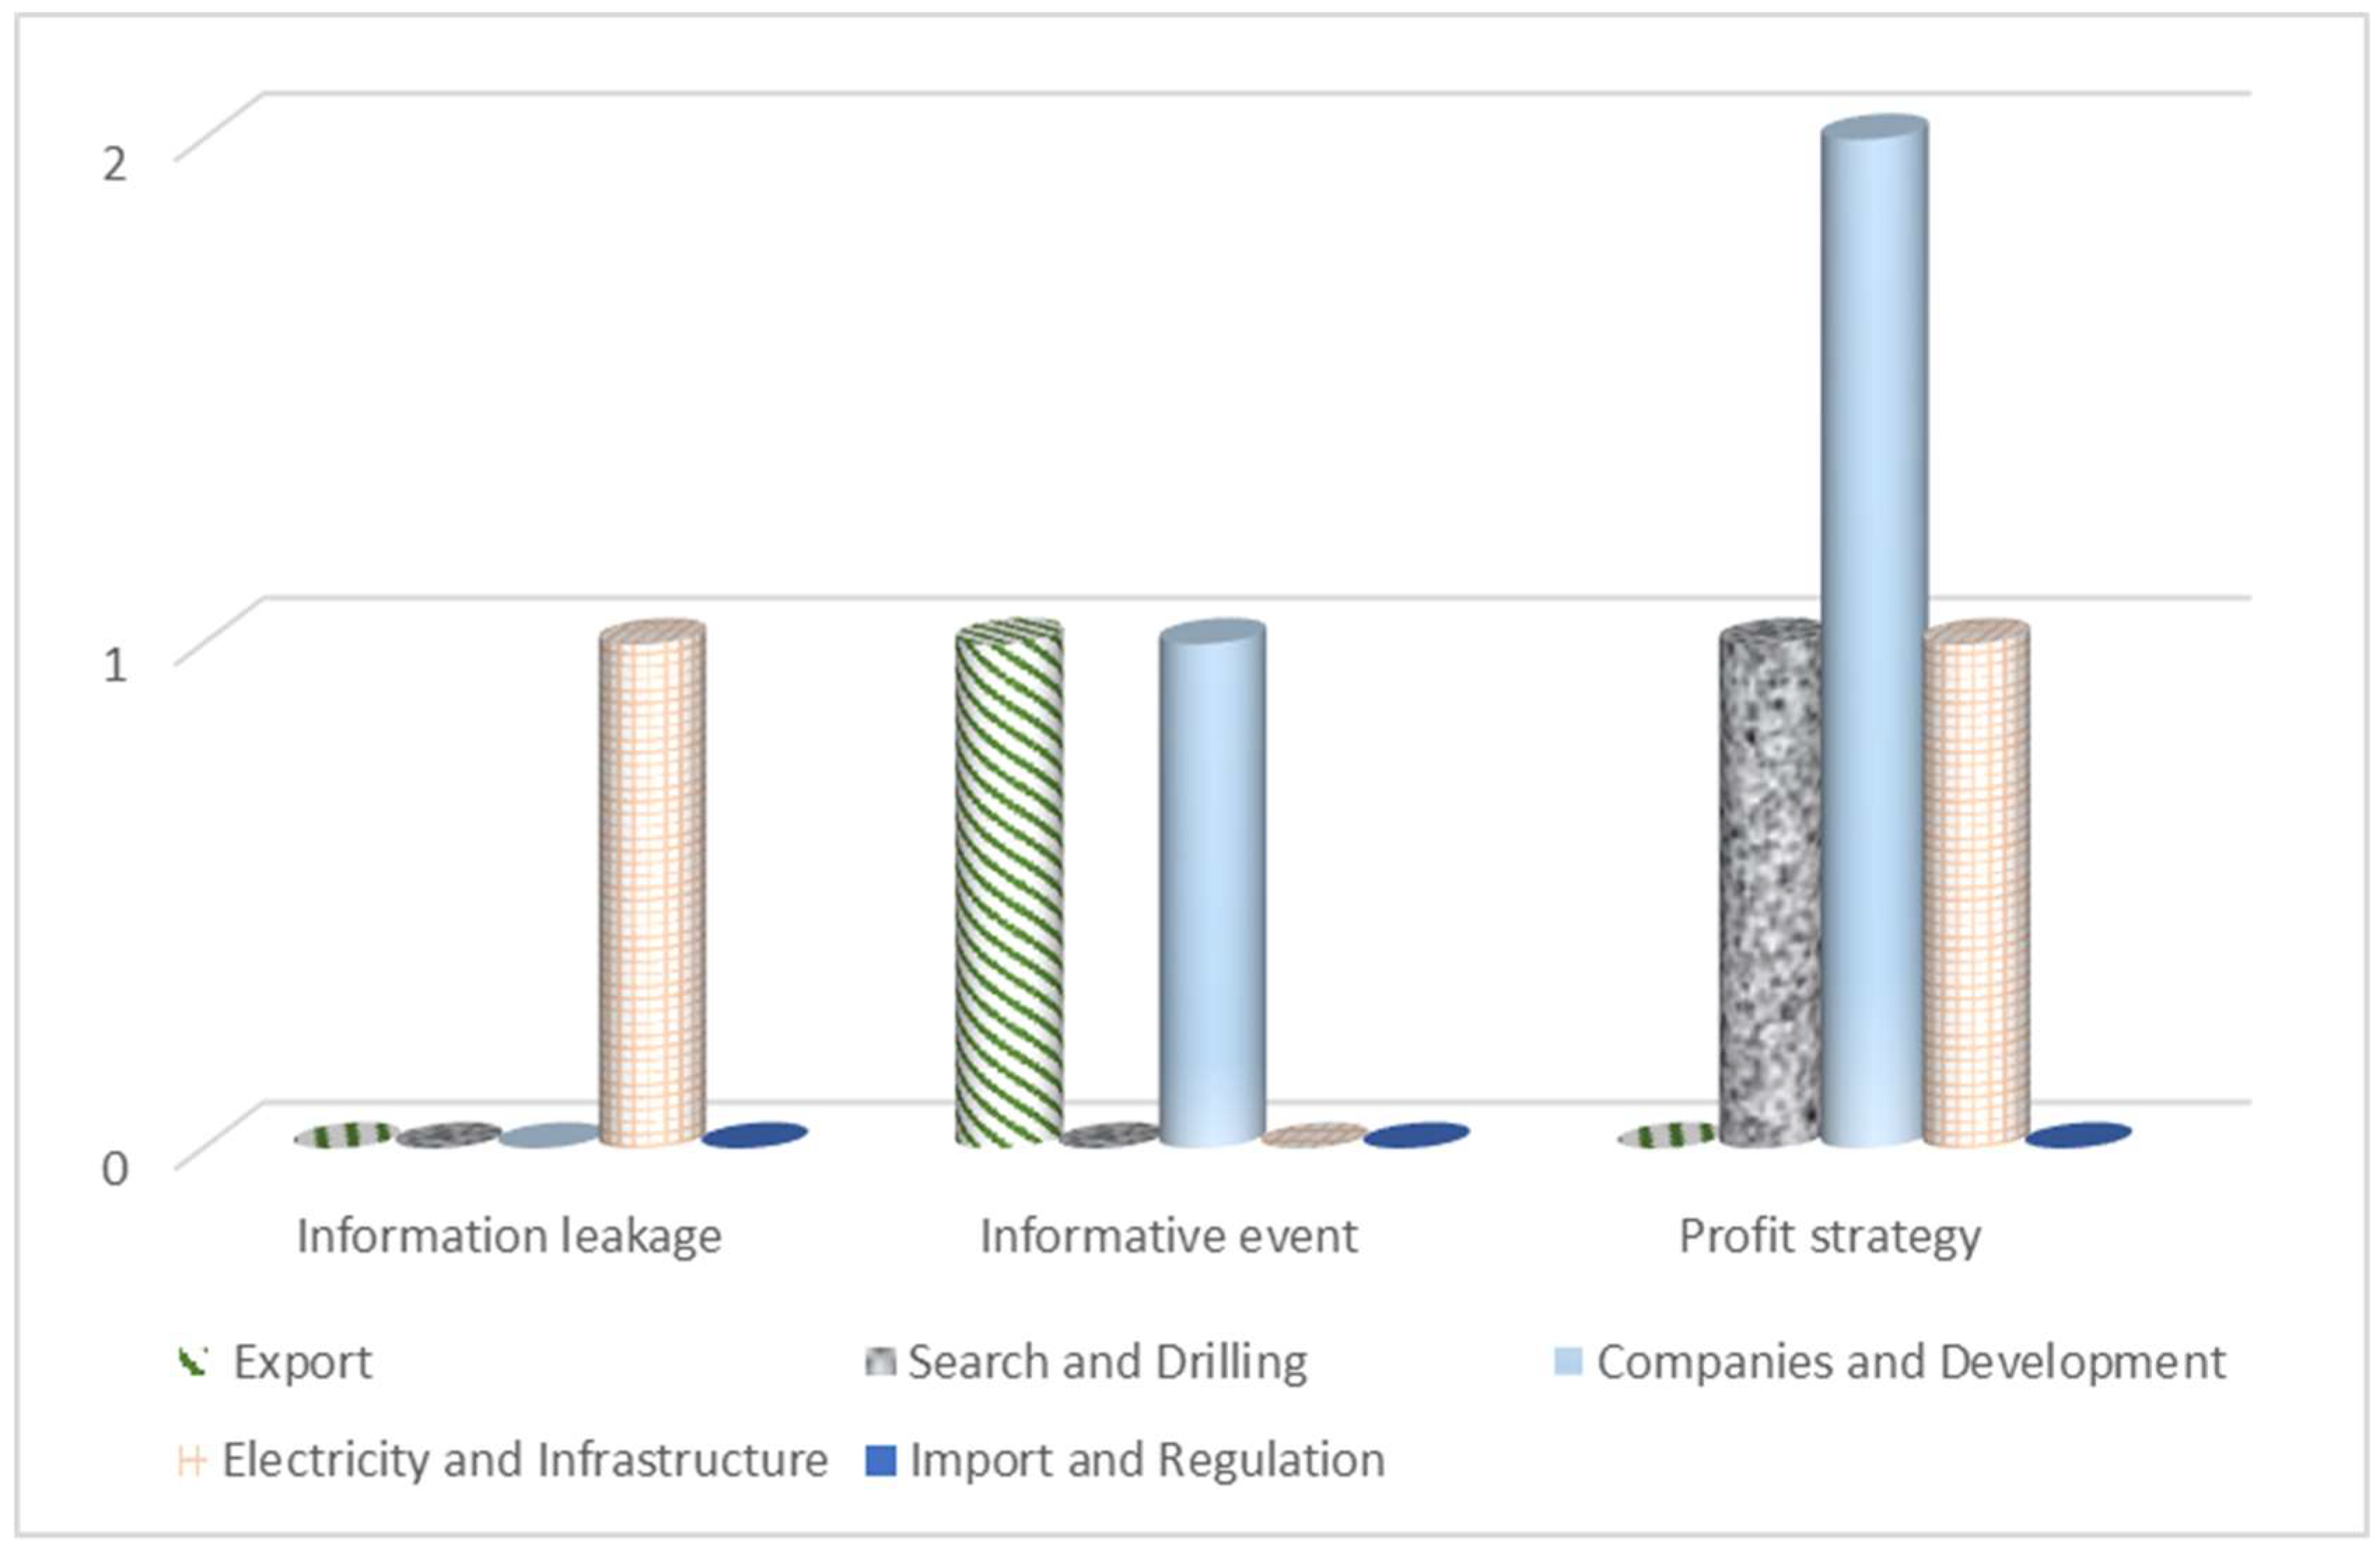
Figure 5 summarizes the results for the five groups surrounding the event day. The present research examined whether there was information leakage to investors who were insiders and associated with the decision makers during the period preceding the event. Figure 5 shows the information leakage only in the Electricity and Infrastructure group. The research further considers whether the announcement brought new information to investors on the event day. In the Export group and the Companies and Infrastructure group, the new information had a statistically significant impact and appreciated the ILS. During the period following the publication, investors sought a profit strategy. At that time, three groups had a statistically significant influence on the exchange rate. These were the Electricity and Infrastructure group, Exploration and Drilling group, and the group that had the most influence on profit strategy: Companies and Development.
3.3. Old vs. New Announcements
This section examines whether announcements published in recent years influenced the exchange rate differently than announcements published earlier. For the purpose of this analysis, the sample was divided into two groups. The first group, referred to as Old, includes 146 old announcements that were published between 15 December 2008 and 31 December 2012. The second group, referred to as New, includes 150 announcements that were published between 1 January 2013 and 6 May 2017. In 2013, the Tamar gas field was connected and began delivering NG to Israel. Therefore, this group analyses whether the impact of the announcements became stronger after the supply of domestic NG began.
Figure 6 and Table 3 describe the CAAe−16,+16 during the 33 days surrounding the announcement, beginning from day (−16) prior to and until day (16) following the publication.
The following table describes the effect of gas discoveries on the abnormal exchange rate for two announcement types: Panel A (Old) and Panel B (New).
In each panel, the cumulative average abnormal real exchange rate (CAAe), median cumulative abnormal real exchange rate (CAe), percentage of positive abnormal real exchange rate, t-statistics, and number of observations are reported for the six event windows.
Figure 6 and Table 3 show that there was no information leakage in any of the old and the new groups. Therefore, it may be concluded that there was no information leakage and that investors who were corporate insiders reacted similarly to new information and to old information before it was published for the general public. On the day of publication, old announcements had no influence on the exchange rate. However, in the group of new announcements, the AAe0 decreased significantly by 0.09% (t-statistics = −3.67). This indicates that the new announcements created an appreciation of the ILS. The Median CAe0 decreased in this group by 0.12%, and 44% of the announcements had a positive CAe. It may be concluded that since the connection of the Tamar gas field in 2013 for the supply of domestic NG to the Israeli economy, the potential for export became more realistic. Every announcement regarding NG strengthened the expectations for a future appreciation, and brought about a stronger reaction of the investors on the day of the publication. This influence also continued during the first six days following the announcement (+1,+6), so that the exchange rate decreased and the CAAe+1,+6 decreased by 0.20% (t-statistics = −2.41). During this period, investors that were exposed to the first announcement were able to use a profit strategy by shorting the exchange rate on the day of publication of the announcement and closing the position at the end of the trading day on the sixth day following publication. During this period, the Median CAe+1,+6 decreased by 0.29%, and 39.36% of the announcements had a positive CAe.
3.4. Single vs. Multiple Announcements
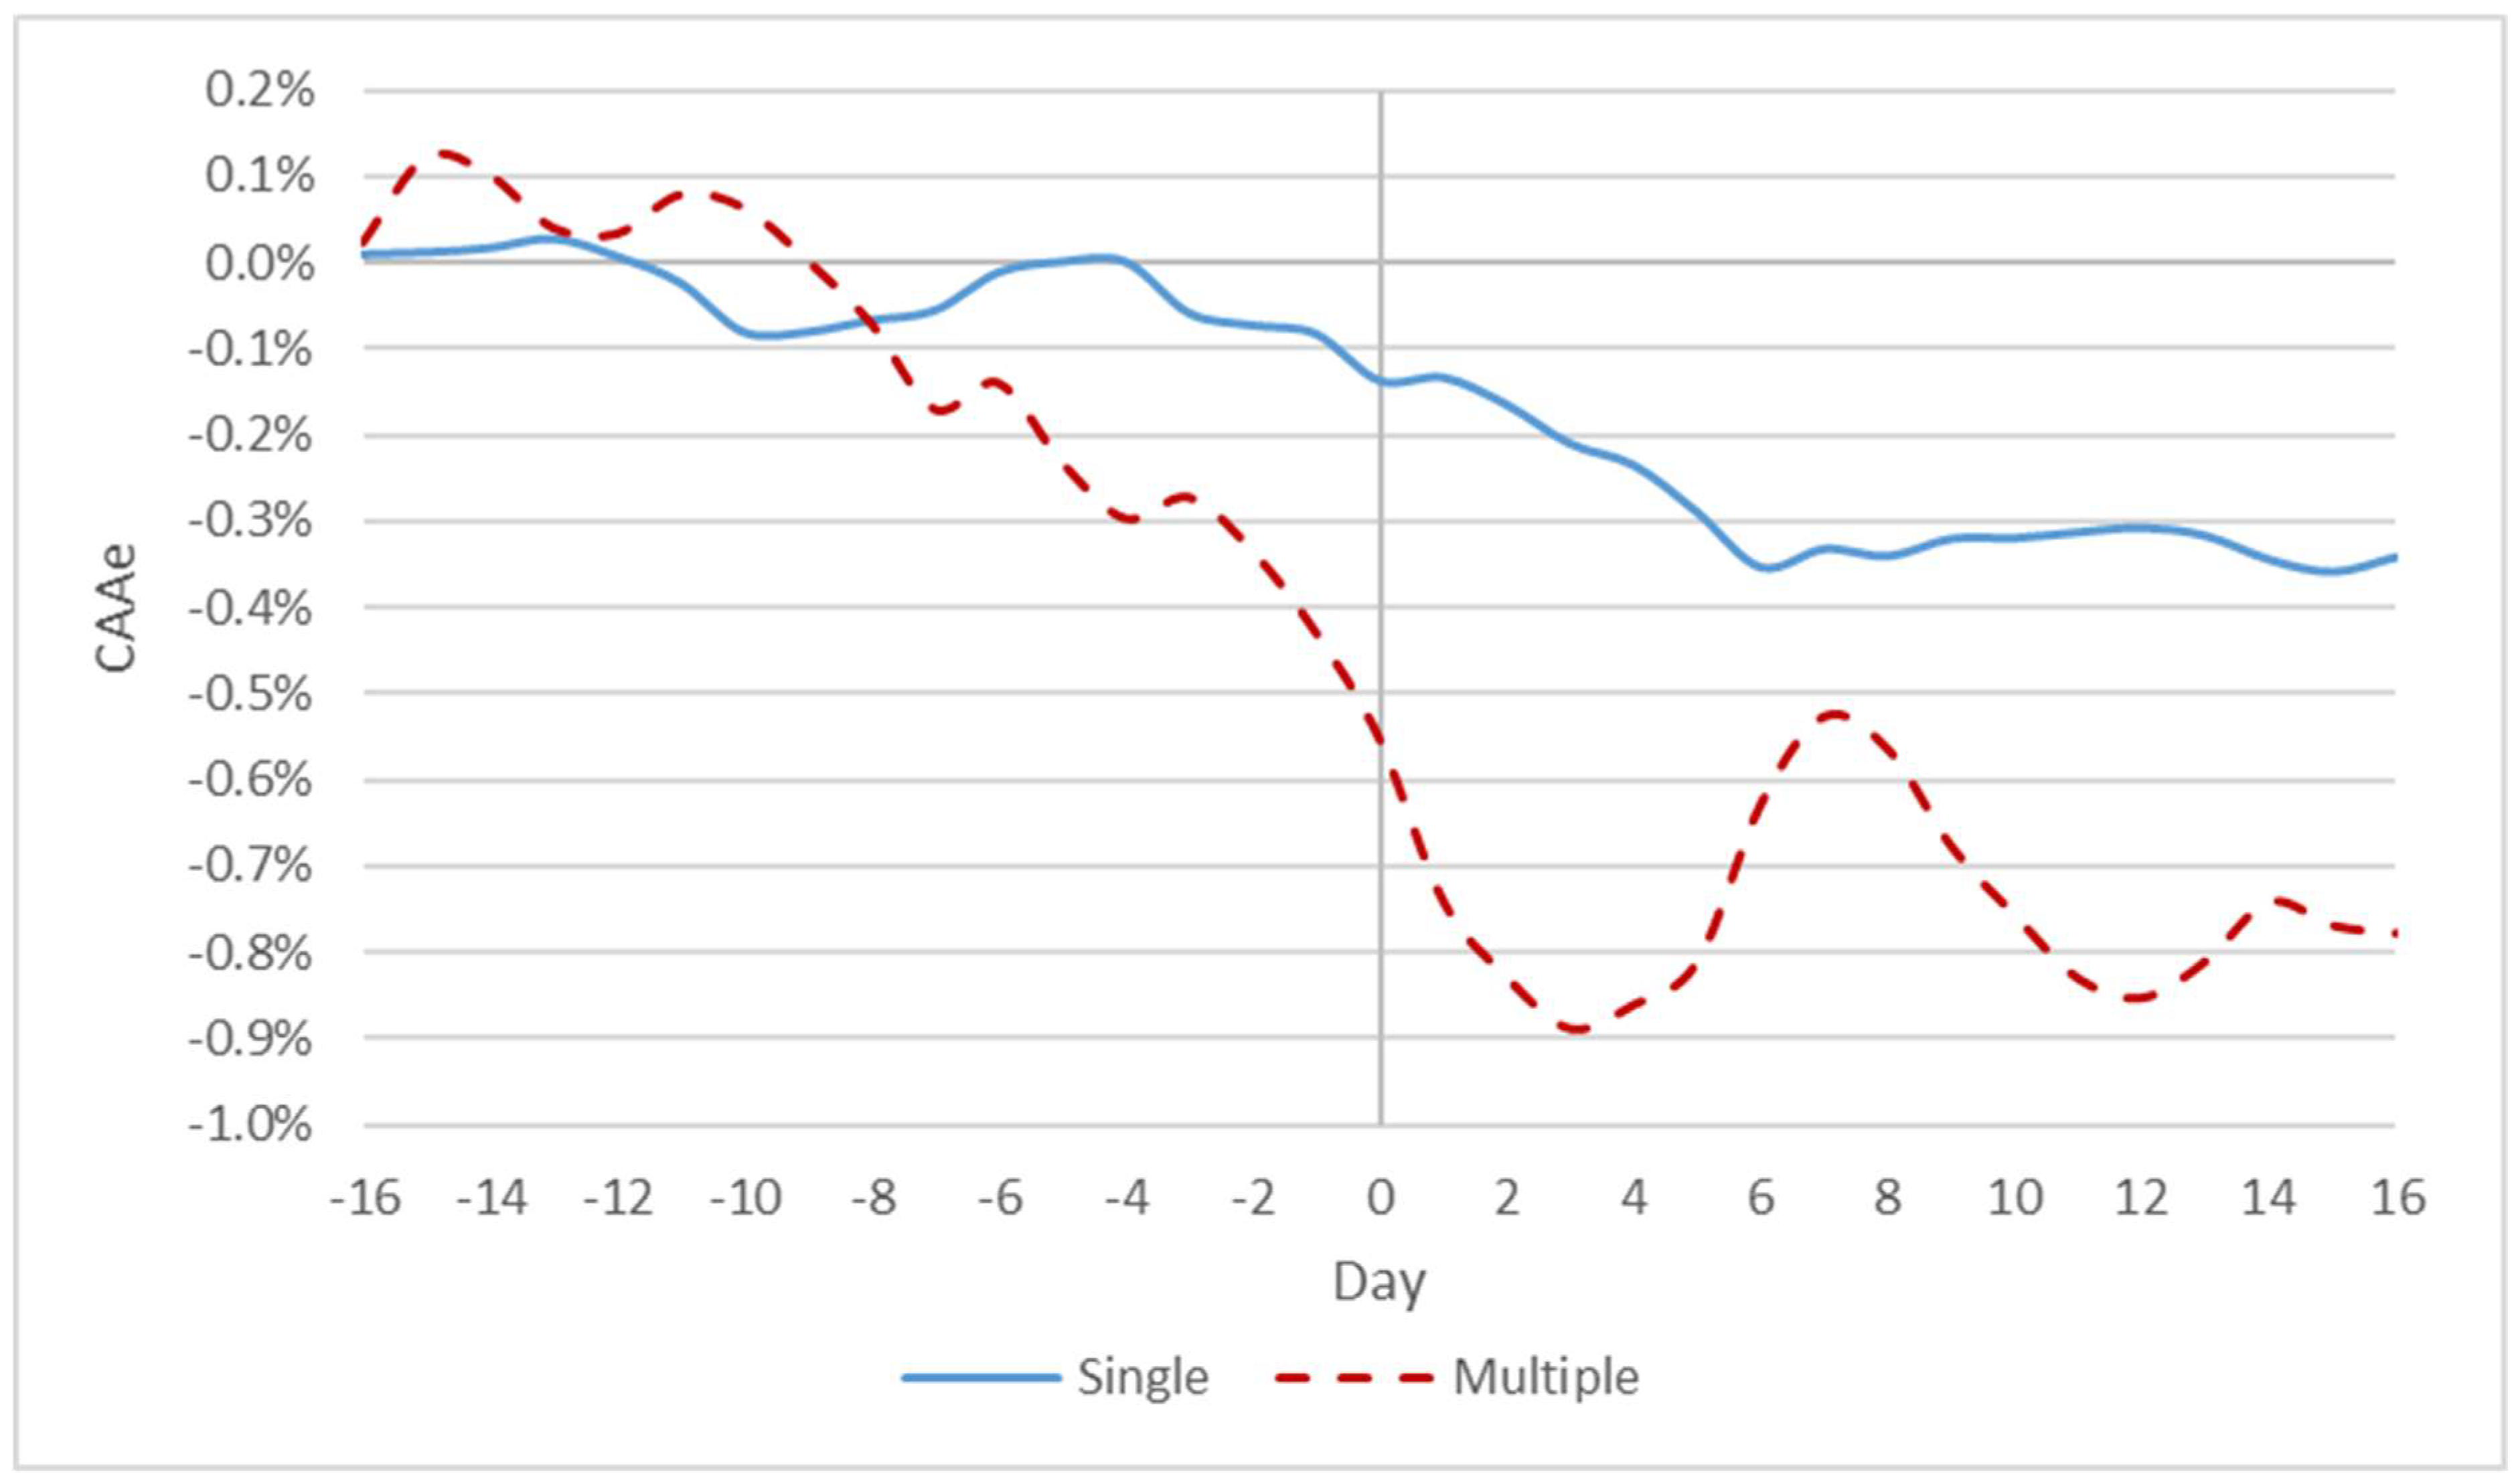
When the market has expectations for additional information, it is likely that investors’ reactions will strengthen when given continuous information rather than a single information item. This section examines the difference in the behavior of investors toward announcements that appear only once, which are referred to as single announcements, versus those that appear a number of times, which are referred to as multiple announcements. The analysis was made on the first announcement in the series of multiple announcements. The group of single announcements includes 243 announcements, which were not republished during the period of three months from publication of the first announcement. In contrast, the group of multiple announcements includes 43 announcements, for which an additional announcement was issued within three months after the initial publication.
Table 4 and Figure 6 describe the CAAe−16,+16 during the 33 days surrounding the announcement, beginning from day (−16) before publication and continuing until day (16) following publication.
The following table describes the effect of gas discoveries on the abnormal exchange rate for two announcement types: Panel A (Single) and Panel B (Multiple).
In each panel, the cumulative average abnormal exchange rate (CAAe), median cumulative abnormal exchange rate (CAe), percentage of positive abnormal exchange rate, t-statistics, and number of observations are reported for the six event windows.
Table 4 and Figure 7 show no influence of single announcements on the exchange rate, whereas for multiple announcements, information leakage began from the second day before the event and was accompanied by currency appreciation. The decrease continued on the day of publication of the announcement, as well as during the first three days following the event. It may be concluded that investors were able to identify initial single announcements and initial continuing announcements. Therefore, they were able to attain abnormal profits in the multiple announcements group. The profit strategy could be shorting the exchange rate either two days prior to the publication for investors with inside information, or on the day of the publication for the rest of the investors, and closing the position at the end of the third trading day following the event. A possible reason for this phenomenon is that the investors had expectations for future information that would be published in additional announcements.
3.5. GARCH Regression Results
The validity of our results based is on GARCH modeling of exchange rate returns and the parametric test statistic. Table 5 describes the estimation of the parameters according to the expected normal return of exchange rate volatility (Equation (3)) during the period of the estimation window.
The results in Table 5 show that the model is significant (F = 6.35), as well as the explanatory variables: change in the square exchange rate in day t − 1, and the variance in day t − 1).
Using the estimations from GARCH(1,1) regression, MAR was examined to reveal the influence of NG announcements on the exchange rate for the entire sample of 296 pure announcements. Table 6 and describes the CAAe−16,+16 during 33 days surrounding the time of the announcement, beginning from day (−16) prior to publication, and until day (16) following publication.
The table describes the effect of gas discoveries on the abnormal real exchange rate for the entire sample with the GARCH model. In the table, the cumulative average abnormal real exchange rate (CAAe), median cumulative abnormal real exchange rate return (CAe), percentage of positive abnormal real exchange rate return, t-statistics, and number of observations are reported for the six event windows.
Table 6 reveals that during the period prior to publication of the announcement, the CAAe−16,−1 did not significantly decrease, indicating that in general during this period, there was no leakage of information regarding the content of the announcement. Alternatively, the influence of publication of the announcement occurred a long time before the actual publication of the real exchange rate. During this period, the Median CAe−16,−1 was almost unchanged, and 46.5% of the announcements had a positive CAe. On the day of the announcement, there was a statistically significant decrease of 0.08% in AAe0 (t-statistics = −2.31) in the exchange rate. This indicates that the announcements generally strengthened the ILS. The Median CAe0 decreased on this day by 0.11%, and 42.91% of the announcements had a positive CAe. Thus, it may be concluded that generally, the announcements provided new information to the investors on the day of publication and contributed to the appreciation of ILS.
During the first three days (+1,+3) following the announcement, the abnormal appreciation increased and the CAAe+1,+3 decreased by an additional 0.15% (t-statistics = −2.45). During this period, investors that were exposed to the first announcement were able to use a profit strategy by shorting the real exchange rate on the day of publication and closing the position at the end of the trading day on the third day following publication of the announcement. During this period, the Median CAe+1,+3 decreased by 0.10%, and 44.59% of the announcements had a positive CAe. To summarize, the GARCH regression results confirm the general outcome of event study evaluation and confirm the hypothesis that NG-related announcements strengthened ILS.
4. Discussion
The ongoing developments in the hydrocarbon discoveries in Israel’s Exclusive Economic Zone (EEZ), as well as in the broader region, are taking front stage in the agendas of policy makers, politicians, and corporations. While there is a raging debate over all aspects of policy concerned with the present and future of these valuable resources, there seems to be a growing interest in understanding the magnitude of implications over Israel’s economy, environment, and geopolitics. It is clear that NG will play a leading role in the foreseeable future of Israel’s energy market. Moreover, its share of the country’s economy is growing, influencing the industrial, transportation, and financial sectors among others, as well as macro factors of growth and employment rates.
The possible adverse effects of foreign exchange windfalls on the tradable sector have been a recurring theme in the literature on the Dutch disease and the resource curse [16] There are alternative windows through which researchers can get a view on the issues. Such effects can be associated with observable variations in the production structure or data from the balance of trade and payments. This approach is not yet possible to apply for investigating the NG impact on the Israeli economy. Hence, we analyze the impact of recent developments in the NG sector on the Israeli economy through NG-related announcements and the exchange rate fluctuations.
In the investigated time period of the years 2008–2017, major NG reserves were discovered, and fiscal and export policies were adjusted. In addition, the energy flow has changed dramatically, crowding out imported fuels in favor of domestic NG and renewable energy in the supply mix. The share of NG as the core feedstock for electricity increased rapidly. The pipelines to connect the local industry to NG have been built. Contracts for Israeli NG export have been negotiated, and some have already been approved. The announcements reflected these transformations.
We found significant evidence indicating that investors already adjust the profit strategy according to the expectations of the large-scale export of NG. The appreciation of ILS on the day of announcements that related to the prospects of exports and development of the NG fields provides direct evidence for investors’ strategy in view of the expected NG export, which will lead to foreign currency inflow and real exchange rate appreciation. Moreover, since the connection of the Tamar gas field in 2013, the announcements regarding NG strengthened the expectations for a future currency appreciation, and brought about a stronger reaction of foreign currency markets.
It may seem that the evidence for local currency appreciation that has occurred in relation to a potential increase in the export of NG supports non-governmental organizations (NGOs)’ demand for a larger share of NG to be preserved for future generations. The argument is that fast NG depletion compromises the possibility for sustainable development. However, economic theory provides another path for sustainable economic development. The Hartwick rule for weak sustainability states that instead of natural resource preservation, the profit from the resource, if invested in the development of alternative energy sources, infrastructure, education, and research, can ensure sustainable development [39].In other words, rather than being used for consumption purposes in the public budget, the government take from NG should be transferred to what is known as Sovereign Wealth Fund (SWF). The SWF should be designed not only to implement the Hartwick rule, but also to insulate the public budget from the volatilities of NG prices, and protect the economy from Dutch disease. When invested in foreign financial markets, SWF offsets the foreign currency inflow caused by natural resource export and mitigates domestic currency appreciation.
Pursuant to the Sovereign Wealth Fund Law 5774-2014, a fund was established for the management of the proceeds that Israel receives from the impost on profits from NG. However, the government income from NG has not reached the fund yet, and the political pressure to use most of the revenue to cover public debt is high.
To summarize, the present study has shown that the classic symptom of the Dutch Disease—exchange rate appreciation—is already in place, even though the NG export has not yet reached its expected potential. In terms of policy implications, our research provides insights for policy makers to embark on strategic institutional reforms and develop regulations for efficient and sustainable natural gas extraction and utilization. Our findings indicate that the development of an optimal strategy for the government and the central bank is a key issue. The role of SWF in mitigating the foreign currency inflow is of high importance. Moreover, Israeli policy makers should not overlook lessons learned from the Dutch experience (and that other small developed countries) regarding the management of NG windfall. Appendix A: Adaptation of Events study methodology to estimation of abnormal return for exchange rate.
Author Contributions
Conceptualization, R.R.P.; Data curation, L.V.; Formal analysis, T.T., L.V. and R.R.P.; Investigation, L.V.; Methodology, T.T.; Validation, T.T.; Writing—original draft, R.R.P., T.T. and L.V.
Funding
This research received no external funding.
Conflicts of Interest
The authors declare no conflict of interest.
Appendix A. Adaptation of Events Study Methodology to Estimation of Abnormal Return for Exchange Rate
First we calculate , the average of the daily change in the exchange rate in the estimation window for event i, (−300,−17) when is defined as the actual daily change in the ILS to USD exchange rate on day t of event i.
Next we calculate the abnormal return for exchange rate , that represents the difference between the actual exchange rate and the average daily exchange rate calculated in the estimation window on day t of event i.
The average abnormal return for real exchange rate for the entire sample of events at time t, is calculated, where N represents the number of events examined at time t.
The cumulative average abnormal real exchange rate return in the event window (−16,16) is calculated as:
Most of the customary methods in the literature that use Event Study Methodology utilize t-tests in order to examine the significance of the cumulative abnormal return obtained in the previous section [22,40].
The classic test of Brown and Warner (1985) assumes the following null hypothesis:
where in our study is the abnormal real exchange rate return in the event window. The estimation of the variance on the event day ( is based on the data deviations in the event window, when the classic model assumes that the variance in the event window is equivalent to the variance in the estimation window. In order to calculate the standard deviation of the sample:
where K is defined as the number of observations during the estimation period, and represents the average abnormal exchange rate return during the estimation period.
Therefore, a t-test can be formulated to analyze the average abnormal exchange rate return in the sample of N days as follows:
where represents a statistical t-test of the average abnormal real exchange rate return during the continuous period. In addition, represents the average abnormal real exchange rate return during the continuous period, represents the standard deviation of the average abnormal return in the estimation window, and N represents the number of days in the subperiod. According to the results obtained from the t-test for each of the subperiods in the different subgroups, the present research examined whether there is statistically significant abnormal return.
References
- Shaffer, B. Israel—New natural gas producer in the Mediterranean. Energy Policy 2011, 39, 5379–5387. [Google Scholar] [CrossRef]
- Liebes, I. Economic Implications of Natural Gas Exports: A Case Study Analysis for Israel (Master’s thesis). 2015. Available online: https://haifa.userservices.exlibrisgroup.com/view/delivery/972HAI_MAIN/12143945520002791?language=en (accessed on 1 June 2019).
- Michaels, L.; Tal, A. Convergence and conflict with the ‘National Interest’: Why Israel abandoned its climate policy. Energy Policy 2015, 87, 480–485. [Google Scholar] [CrossRef]
- Sheshinski, E.; Kandel, E.; Tzemach, S.; Mimran, Y.; Naserdishi, Y.; Nissan, U. Committee on Gas and Oil Royalties. Ministry of Finance: Jerusalem. 2011. Available online: http://mof.gov.il/Committees/PreviouslyCommittees/Pages/PhysicsPolicyCommittee.aspx (accessed on 11 November 2018).
- IntelligenceUnit. Gas Framework Details Revealed. Retrieved January 2019. Available online: http://country.eiu.com/article.aspx?articleid=233308807&Country=Israel&topic=Economy&subtopic=Forecast&subsubtopic=Policy+trends&u=1&pid=903382274&oid=903382274&uid=1# (accessed on 6 July 2015).
- Zemach, S.K.-Y. The Inter-Ministerial Committee to Examine the Government’s Policy Regarding Natural Gas in Israel; Ministry of National Infrastructure: Jerusalem, Israel, 2012. [Google Scholar]
- Adiri, U. Conclusions of the Professional Team for the Periodic Examination of the Recommendations of the Committee on Examining the Government’s Policy in the Natural Gas Market Adopted in Government Decision 442 Dated 23 June 2013; Ministry of Energy: Jerusalem, Israel, 2018.
- Sachs, J.D.; Warner, A.M. Natural Resource Abundance and Economic Growth; No. w5398; National Bureau of Economic Research: Cambridge, MA, USA, 1995; Available online: https://www.nber.org/papers/w5398 (accessed on 18 July 2019).
- Ramírez-Cendrero, J.M.; Wirth, E. Is the Norwegian model exportable to combat Dutch disease? Resour. Policy 2016, 48, 85–96. [Google Scholar] [CrossRef]
- Zweifel, P.; Praktiknjo, A.; Erdmann, G. Energy Economics: Theory and Applications; Texts in Business and Economics; Springer: Berlin, Germany, 2017. [Google Scholar]
- Ebrahim-zadeh, C. Back to Basics Dutch Disease: Too much wealth. Finance and Development, March 2003; Volume 40. [Google Scholar]
- Brahmbhatt, M.; Canuto, O.; Vostroknutova, E. Dealing with Dutch disease. In Economic Premise, No 16, June; The World Bank: Washington, DC, USA, 2010; Available online: http://documents.worldbank.org/curated/en/794871468161957086/Dealing-with-Dutch-disease (accessed on 18 July 2019).
- Frankel, J.A. The Natural Resource Curse: A Survey; NBER Working Paper 15836; National Bureau of Economic Research, Inc.: Cambridge, MA, USA, 2010; Available online: https://www.nber.org/papers/w15836 (accessed on 18 July 2019).
- Papyrakis, E.; Raveh, O. An Empirical Analysis of a Regional Dutch Disease: The Case of Canada. Environ. Resour. Econ. 2014, 58, 179–198. [Google Scholar] [CrossRef]
- Van der Ploeg, F. Natural resources: Curse or blessing? Econ. Lit. 2011, 49, 366–420. [Google Scholar] [CrossRef]
- Harding, T.; Venables, A.J. Exports, Imports and Foreign Exchange Windfalls; Oxcarre Research Paper; University of Oxford: Oxford, UK, 2010. [Google Scholar]
- Friedman, A.; Galo, L. The Effective Exchange Rate in Israel. Retrieved 2019, from Bank of Israel. Available online: https://www.boi.org.il/en/NewsAndPublications/PressReleases/Documents/2015-10%20The%20Effective%20Exchange%20Rate%20in%20Israel.pdf (accessed on 18 July 2019).
- BOI. Bank of Israel. Available online: https://www.boi.org.il/en/Markets/Pages/ForeignCurrency.asp (accessed on 1 June 2019).
- Flug, K. Remarks by the Governor of the Bank of Israel, Dr. Karnit Flug, at the Israel Economic Association’s Annual Conference; Israeli Economic Society: Jerusalem, Israel, 20 May 2014. [Google Scholar]
- Ball, R.; Brown, P. An Empirical Evaluation of Accounting Income Numbers. J. Account. Res. 1968, 6, 159–178. [Google Scholar] [CrossRef]
- Fama, E.; Fisher, C.; Jensen, M.; Roll, R. The Adjustment of Stock Prices to New Information. Int. Econ. Rev. 1969, 10, 1–21. [Google Scholar] [CrossRef]
- Brown, S.J.; Warner, J.B. Using daily stock returns: The Case of Event Studies. J. Financ. Econ. 1985, 14, 3–31. [Google Scholar] [CrossRef]
- Alkhatib, A.; Harasheh, M. Performance of Exchange Traded Funds during the Brexit referendum: An event study. Int. J. Financ. Stud. 2018, 6, 64. [Google Scholar] [CrossRef]
- Jacobs, B.W.; Singhal, V.R. The effect of the Rana Plaza disaster on shareholder wealth of retailers: Implications for sourcing strategies and supply chain governance. J. Opera. Manag. 2017, 49, 52–66. [Google Scholar] [CrossRef]
- Loipersberger, F. The effect of supranational banking supervision on the financial sector: Event study evidence from Europe. J. Bank. Financ. 2018, 91, 34–48. [Google Scholar] [CrossRef] [Green Version]
- Lambertides, N. Sudden CEO vacancy and the long-run economic consequences. Manag. Financ. 2009, 35, 645–661. [Google Scholar] [CrossRef]
- Shah, P.; Parvinder, A. M&A Announcements and Their Effect on Return to Shareholders: An Event Study. Account. Financ. Res. 2014, 3, 170–190. [Google Scholar]
- Elad, F.I.; Bongbee, N.S. Event study on the Reaction of stock returns to Acquisition News. Int. Financ. Bank. 2017, 4, 33–43. [Google Scholar] [CrossRef]
- Bollerslev, T. Generalized Autoregressive Conditional Heteroskedasticity. J. Econ. 1986, 31, 307–327. [Google Scholar] [CrossRef]
- Hsieh, D.A. The Statistical Properties of Daily Foreign Exchange Rates: 1974–1983. J. Int. Econ. 1988, 24, 129–145. [Google Scholar] [CrossRef]
- Milhoj, A. A Conditional Variance Model of Daily Deviations of an Exchange Rate. J. Bus. Econ. Stat. 1987, 5, 99–103. [Google Scholar]
- Engle, R.F.; Bollerslev, T. Modeling the Persistence of Conditional Variances. Econ. Rev. 1986, 5, 1–50. [Google Scholar] [CrossRef]
- Baillie, R.T.; Bollerslev, T. The Massage in Daily Exchange Rates: A Conditional-Variance Tale. J. Bus. Econ. Stat. 1989, 7, 297–305. [Google Scholar]
- Chit, M.M.; Rizov, M.; Willenbockel, D. Exchange rate volatility and exports: New empirical evidence from the emerging East Asian economies. World Econ. 2010, 33, 239–263. [Google Scholar] [CrossRef]
- Tulin, E.; Katz, M.L.; Sun, B. A simple test for distinguishing between internal reference price theories. Quant. Mark. Econ. 2010, 8, 303–332. [Google Scholar]
- Epaphra, M. Modeling Exchange Rate Volatility: Application of the GARCH and EGARCH Models. J. Math. Financ. 2017, 7, 121–143. [Google Scholar] [CrossRef] [Green Version]
- Latief, R.; Lin, L. The effect of exchange rate volatility on international trade and foreign direct investment (FDI) in developing countries along “one belt and one road”. Int. J. Financ. Stud. 2018, 6, 86. [Google Scholar] [CrossRef]
- Hansen, P.R.; Asger, L. A forecast comparison of volatility models: Does anything beat a GARCH(1,1)? Appl. Econ. 2005, 20, 873–889. [Google Scholar] [CrossRef]
- Hartwick, J.M. International equity and the investing of rents from exhaustible resources. Am. Econ. Rev. 1977, 67, 972–974. [Google Scholar]
- Barber, B.; Lyon, J.D. Detecting long-run abnormal stock returns: The empirical power and specification of test statistics. J. Financ. Econ. 1997, 43, 341–372. [Google Scholar] [CrossRef] [Green Version]
Figure 1.
Timeline of natural gas (NG)-related events and the daily New Israeli Shekel (ILS) to United States dollar (USD) real exchange rate.
Figure 1.
Timeline of natural gas (NG)-related events and the daily New Israeli Shekel (ILS) to United States dollar (USD) real exchange rate.
Figure 2.
Estimation window (L1) for the period of time preceding the event (L2).
Figure 3.
The cumulative average abnormal exchange rate return (CAAe) behavior during the 33-day event window surrounding the event day for the entire sample of 296 announcements.
Figure 3.
The cumulative average abnormal exchange rate return (CAAe) behavior during the 33-day event window surrounding the event day for the entire sample of 296 announcements.

Figure 4.
The CAAe behavior during the 33-day event window surrounding the event day for the entire sample of 296 announcements by five announcement types.
Figure 4.
The CAAe behavior during the 33-day event window surrounding the event day for the entire sample of 296 announcements by five announcement types.
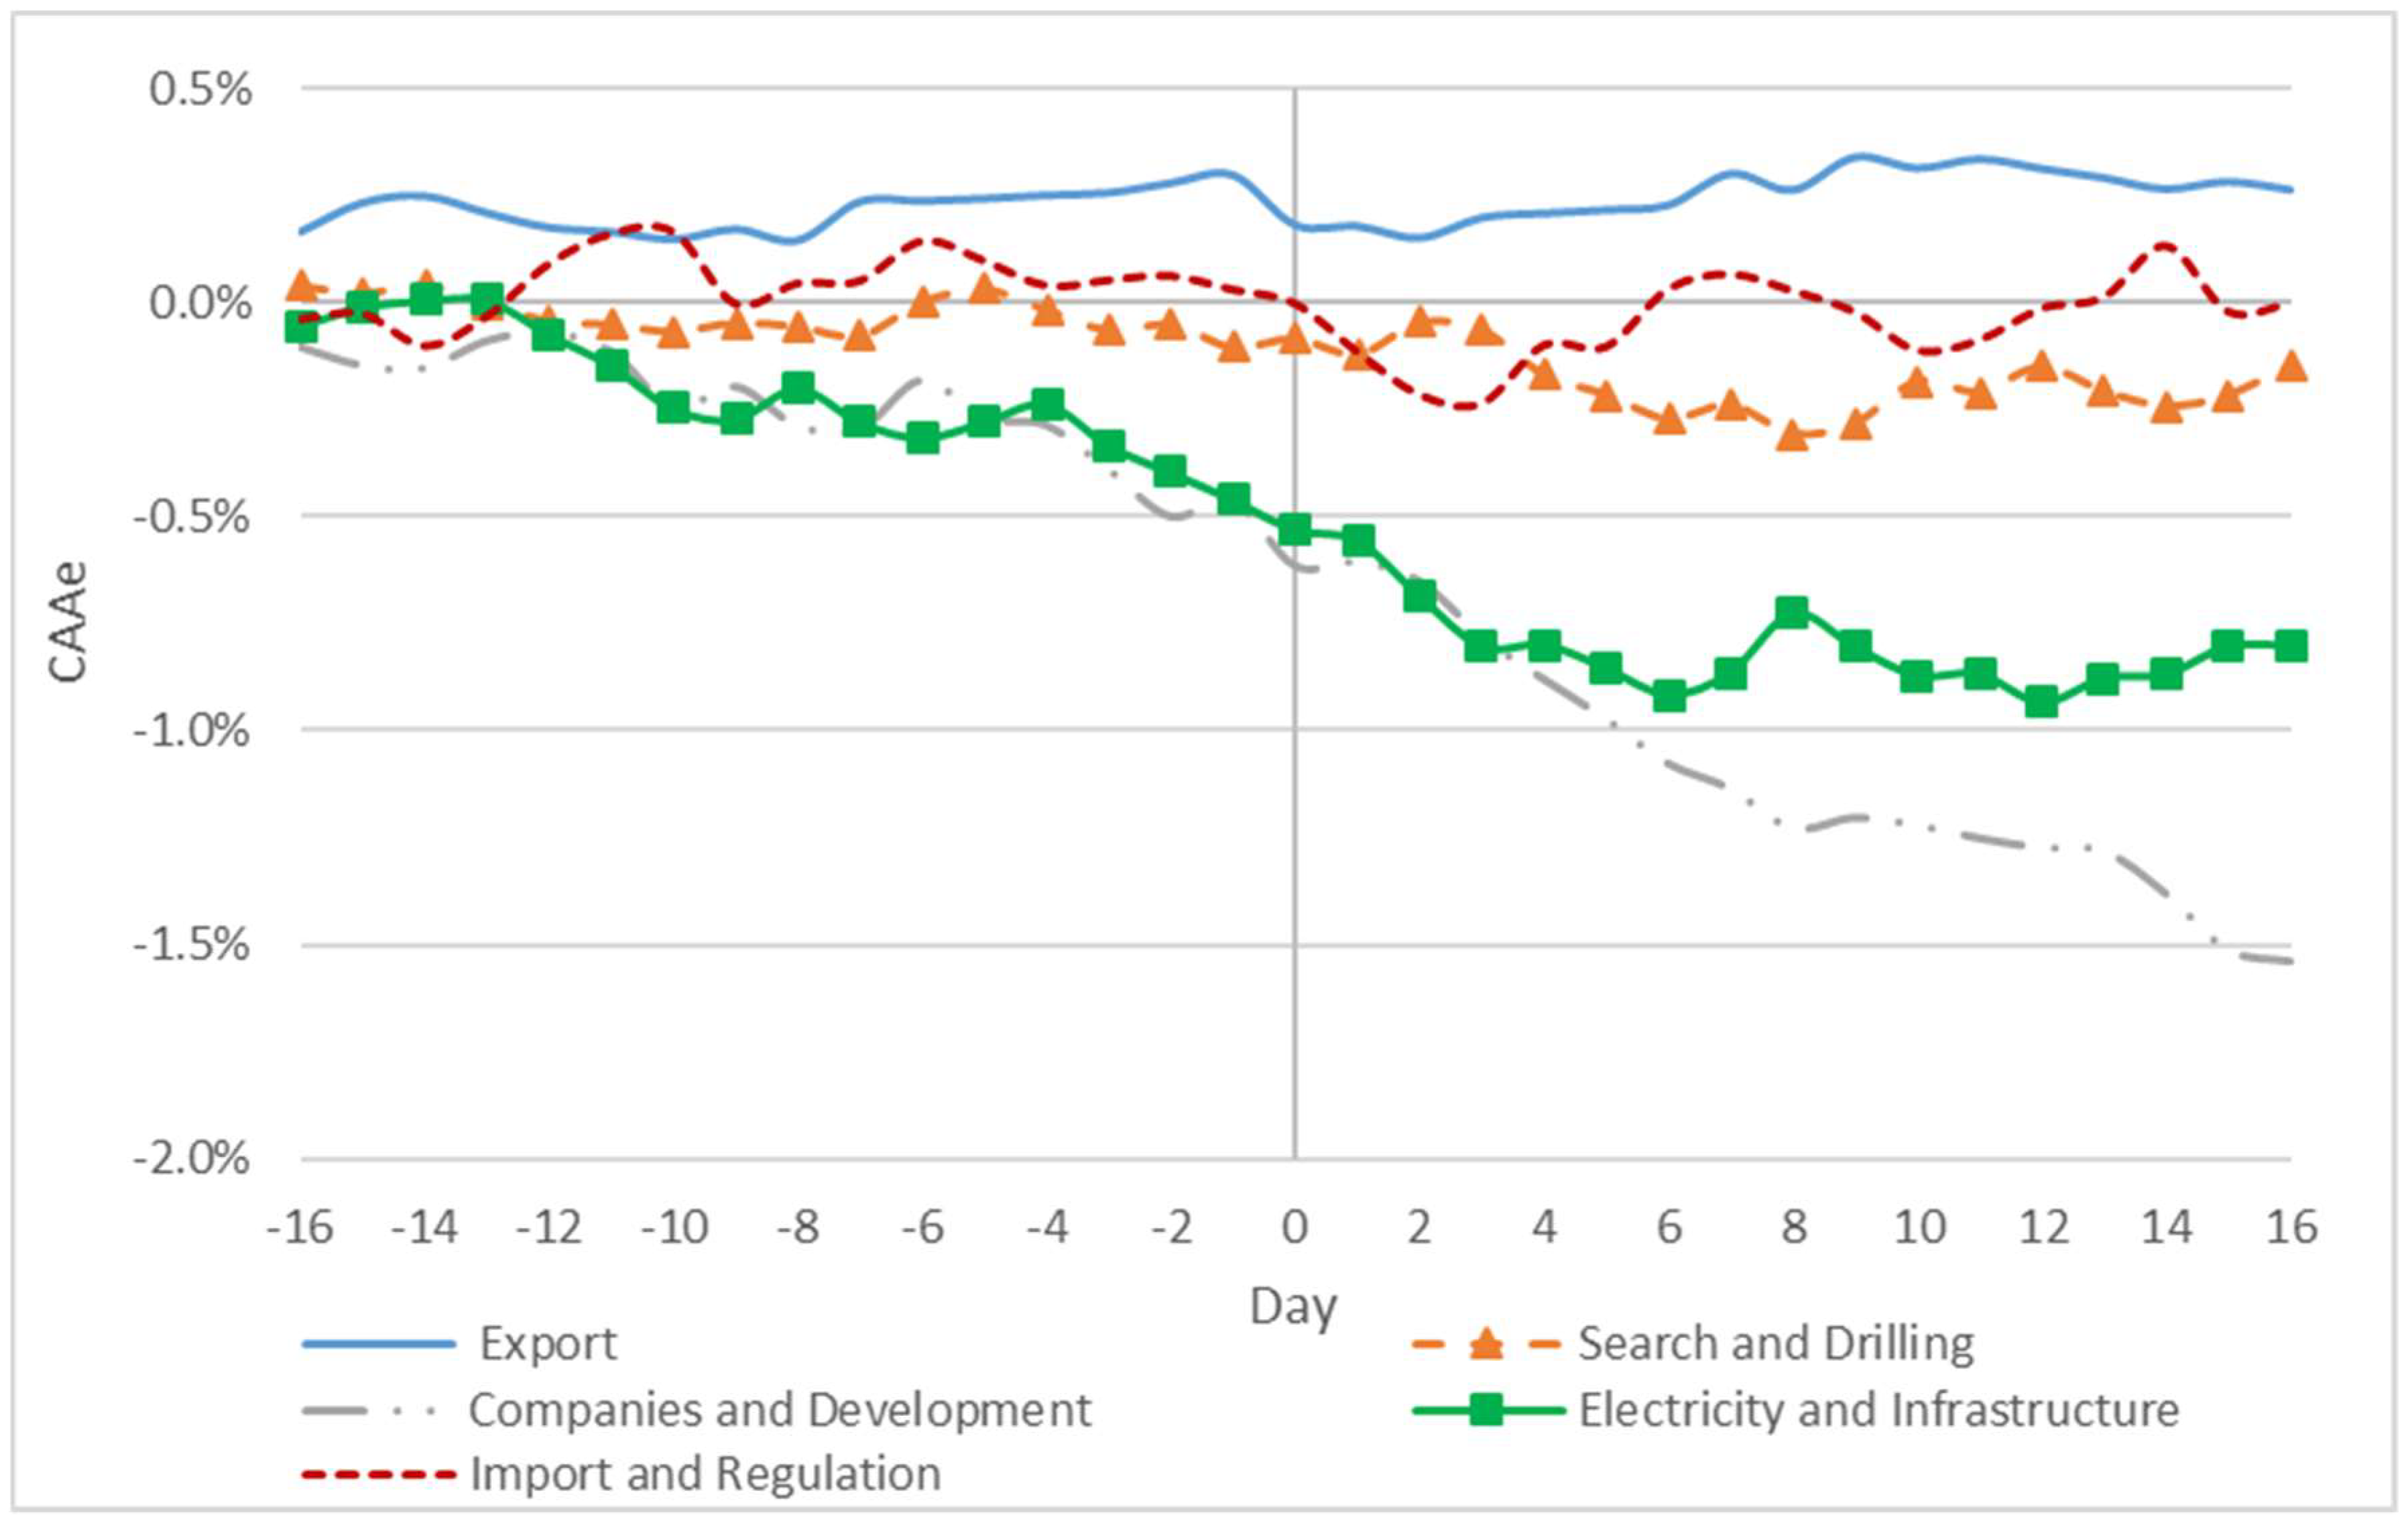
Figure 5.
Summary of results according to five groups of announcements.
Figure 6.
The CAAe behavior during the 33-day event window surrounding the event day for old and new announcements.
Figure 6.
The CAAe behavior during the 33-day event window surrounding the event day for old and new announcements.

Figure 7.
The CAAe behavior during the 33-day event window surrounding the event day for single and multiple announcements.
Figure 7.
The CAAe behavior during the 33-day event window surrounding the event day for single and multiple announcements.

Table 1.
The effect of gas discoveries on the real exchange rate for the entire sample of 296 pure announcements. CAAe: cumulative average abnormal exchange rate return, CAe: median cumulative abnormal exchange rate return.
Table 1.
The effect of gas discoveries on the real exchange rate for the entire sample of 296 pure announcements. CAAe: cumulative average abnormal exchange rate return, CAe: median cumulative abnormal exchange rate return.
| (−16,−4) | (−3,−1) | (0) | (+1,+3) | (+4,+6) | (+7,+16) | |
|---|---|---|---|---|---|---|
| CAAe | −0.04% | −0.09% | −0.06% * | −0.11% * | −0.08% | −0.01% |
| Median CAe | 0.00% | −0.04% | −0.09% | −0.24% | −0.16% | 0.18% |
| Percent Positive | 49.66% | 44.59% | 43.58% | 44.93% | 40.88% | 49.32% |
| t-statistics | −0.33 | −1.53 | −1.87 | −1.87 | −1.42 | −0.11 |
| N | 296 | 296 | 296 | 296 | 296 | 296 |
* 90% significance level.
Table 2.
The effect of gas discoveries on the exchange rate by announcement type.
| (−16,−4) | (−3,−1) | (0) | (+1,+3) | (+4,+6) | (+7,+16) | |
|---|---|---|---|---|---|---|
| Panel A: Export | ||||||
| CAAe | 0.25% | 0.05% | −0.12% ** | 0.02% | 0.03% | 0.04% |
| Median CAe | 0.31% | 0.00% | −0.10% | 0.00% | 0.09% | 0.34% |
| Percent Positive | 61.76% | 50.00% | 45.59% | 50.00% | 51.47% | 57.35% |
| t-statistics | 1.28 | 0.50 | −2.13 | 0.18 | 0.31 | 0.21 |
| N | 68 | 68 | 68 | 68 | 68 | 68 |
| Panel B: Exploration and Drilling | ||||||
| CAAe | −0.02% | −0.09% | 0.02% | 0.02% | −0.21% * | 0.13% |
| Median CAe | 0.01% | −0.06% | −0.03% | 0.02% | −0.27% | 0.06% |
| Percent Positive | 50.00% | 45.71% | 50.00% | 52.86% | 32.86% | 50.00% |
| t-statistics | −0.07 | −0.71 | 0.29 | 0.17 | −1.70 | 0.57 |
| N | 70 | 70 | 70 | 70 | 70 | 70 |
| Panel C: Companies and Development | ||||||
| CAAe | −0.29% | −0.18% | −0.15% ** | −0.17% | −0.30% ** | −0.46% ** |
| Median CAe | −0.33% | −0.17% | −0.16% | −0.08% | −0.30% | −0.55% |
| Percent Positive | 36.17% | 31.91% | 31.91% | 42.55% | 31.91% | 31.91% |
| t-statistics | −1.11 | −1.40 | −2.12 | −1.32 | −2.36 | −2.02 |
| N | 47 | 47 | 47 | 47 | 47 | 47 |
| Panel D: Electricity and Infrastructure | ||||||
| CAAe | −0.24% | −0.22% ** | −0.07% | −0.27% *** | −0.11% | 0.12% |
| Median CAe | −0.34% | −0.12% | −0.10% | −0.25% | −0.15% | 0.36% |
| Percent Positive | 47.22% | 43.06% | 44.44% | 34.72% | 41.67% | 52.78% |
| t-statistics | −1.01 | −2.00 | −1.08 | −2.43 | −1.01 | 0.57 |
| N | 72 | 72 | 72 | 72 | 72 | 72 |
| Panel E: Import and Regulation | ||||||
| CAAe | 0.04% | −0.01% | −0.03% | −0.23% | 0.27% | −0.03% |
| Median CAe | −0.14% | −0.03% | −0.12% | −0.16% | −0.03% | 0.19% |
| Percent Positive | 46.15% | 48.72% | 38.46% | 41.03% | 46.15% | 48.72% |
| t-statistics | 0.12 | −0.06 | −0.34 | −1.41 | 1.61 | −0.11 |
| N | 39 | 39 | 39 | 39 | 39 | 39 |
*** 99% significance level; ** 95% significance level; * 90% significance level.
Table 3.
The effect of gas discoveries on the exchange rate for old and new announcements.
| (−16,−4) | (−3,−1) | (0) | (+1,+3) | (+4,+6) | (+7,+16) | |
|---|---|---|---|---|---|---|
| Panel A: Old | ||||||
| CAAe | −0.16% | −0.10% | −0.04% | −0.16% | −0.03% | 0.01% |
| Median CAe | −0.01% | −0.03% | −0.11% | −0.24% | −0.14% | −0.04% |
| Percent Positive | 62.33% | 54.79% | 54.11% | 55.48% | 51.37% | 61.64% |
| t-statistics | −0.75 | −1.03 | −0.40 | −1.58 | −0.31 | 0.03 |
| N | 146 | 146 | 146 | 146 | 146 | 146 |
| Panel B: New | ||||||
| CAAe | 0.07% | −0.08% | −0.09% *** | −0.07% | −0.14% ** | −0.03% |
| Median CAe | −0.02% | −0.06% | −0.12% | −0.08% | −0.21% | −0.14% |
| Percent Positive | 49.33% | 46.00% | 44.00% | 42.67% | 40.00% | 48.00% |
| t-statistics | 0.58 | −1.34 | −3.67 | −1.10 | −2.31 | −0.26 |
| N | 150 | 150 | 150 | 150 | 150 | 150 |
*** 99% significance level; ** 95% significance level.
Table 4.
The effect of gas discoveries on the real exchange rate for single and multiple announcements.
Table 4.
The effect of gas discoveries on the real exchange rate for single and multiple announcements.
| (−16,−4) | (−3,−1) | (0) | (+1,+3) | (+4,+6) | (+7,+16) | |
|---|---|---|---|---|---|---|
| Panel A: Single | ||||||
| CAAe | 0.00% | −0.08% | −0.05% | −0.06% | −0.08% | −0.11% |
| Median CAe | −0.11% | −0.04% | −0.10% | −0.24% | −0.22% | 0.29% |
| Percent Positive | 28.40% | 28.40% | 27.98% | 26.75% | 23.05% | 32.51% |
| t-statistics | 0.02 | −1.38 | −1.55 | −1.00 | −1.35 | −0.96 |
| N | 243 | 243 | 243 | 243 | 243 | 243 |
| Panel B: Multiple | ||||||
| CAAe | −0.30% | −0.13% | −0.12% | −0.34% ** | 0.26% | −0.15% |
| Median CAe | −0.44% | −0.02% | −0.12% | −0.16% | 0.12% | −0.43% |
| Percent Positive | 46.51% | 44.19% | 41.86% | 39.53% | 55.81% | 44.19% |
| t-statistics | −0.88 | −0.82 | −1.33 | −2.08 | 1.62 | −0.51 |
| N | 43 | 43 | 43 | 43 | 43 | 43 |
** 95% significance level.
Table 5.
Estimation of expected normal return for exchange rate and its volatility according to the GARCH(1,1) model during the period of the estimation window.
Table 5.
Estimation of expected normal return for exchange rate and its volatility according to the GARCH(1,1) model during the period of the estimation window.
| Log Likelihood | F | ||||
|---|---|---|---|---|---|
| GARCH | 1.345 × 10⁻⁷ | 0.062 | 0.901 | 1851.774 | 6.35 |
| p-value | 0.099 | 0.050 | 0.000 |
Table 6.
The effect of gas discoveries on the real exchange rate for the entire sample of 296 pure announcements with the GARCH model.
Table 6.
The effect of gas discoveries on the real exchange rate for the entire sample of 296 pure announcements with the GARCH model.
| (−16,−4) | (−3,−1) | (0) | (+1,+3) | (+4,+6) | (+7,+16) | |
|---|---|---|---|---|---|---|
| CAAe | −0.12% | −0.06% | −0.08% ** | −0.15% ** | −0.03% | −0.13% |
| Median Cae | −0.01% | −0.06% | −0.11% | −0.10% | −0.17% | −0.03% |
| Percent Positive | 49.18% | 44.23% | 42.91% | 44.59% | 41.22% | 49.66% |
| t-statistics | −1.00 | −1.05 | −2.31 | −2.45 | −0.51 | −1.20 |
| N | 296 | 296 | 296 | 296 | 296 | 296 |
** 95% significance level.
© 2019 by the authors. Licensee MDPI, Basel, Switzerland. This article is an open access article distributed under the terms and conditions of the Creative Commons Attribution (CC BY) license (http://creativecommons.org/licenses/by/4.0/).
Share and Cite
MDPI and ACS Style
Palatnik, R.R.; Tavor, T.; Voldman, L. The Symptoms of Illness: Does Israel Suffer from “Dutch Disease”? Energies 2019, 12, 2752. https://doi.org/10.3390/en12142752
AMA Style
Palatnik RR, Tavor T, Voldman L. The Symptoms of Illness: Does Israel Suffer from “Dutch Disease”? Energies. 2019; 12(14):2752. https://doi.org/10.3390/en12142752
Chicago/Turabian StylePalatnik, Ruslana Rachel, Tchai Tavor, and Liran Voldman. 2019. "The Symptoms of Illness: Does Israel Suffer from “Dutch Disease”?" Energies 12, no. 14: 2752. https://doi.org/10.3390/en12142752
Note that from the first issue of 2016, this journal uses article numbers instead of page numbers. See further details here.