The Effects of Environmental Regulations on the Manufacturing Industry’s Performance: A Comparison of Green and Non-Green Sectors in Korea


Department of Economics, Sogang University, Seoul 04107, Korea
*
Author to whom correspondence should be addressed.
Energies 2019, 12(12), 2296; https://doi.org/10.3390/en12122296
Submission received: 11 May 2019
/
Revised: 12 June 2019
/
Accepted: 12 June 2019
/
Published: 16 June 2019
(This article belongs to the Collection Energy Economics and Policy in Developed Countries)
Abstract
:This study examines the effects of strengthened environmental regulations on employment and labor productivity in the Korean manufacturing industry using panel data from 2004 to 2015. It divides the industry into environmental (green and non-green) and carbon dioxide emitting (polluting and non-polluting) sectors to investigate the industrial sector’s response heterogeneity to tightened regulations. We draw several conclusions on the basis of our empirical results. Firstly, environmental policies measured by enacting the LCGG (Low-carbon green growth) Act led to negative effects on labor productivity and employment in polluting industries. These negative effects show that the polluting industries take a higher cost burden because of the environmental policies as compared to the less-polluting industries; this finding is in line with previous studies in literature. Secondly, the green sector is experiencing higher labor productivity and employment as compared to the non-green sector after the tightened environmental regulations. Thirdly, the regulation-related negative effects anticipated in polluting industries are off-set if a firm is also included in the green sector which produces environment-related products. Hence, this result suggests that in terms of labor productivity and employment, it is possible that the manufacturing industry enables the achievement of sustainable development targets. While regulations negatively affect the performance of non-green firms by increasing the costs of highly contaminated ones, in the case of the green sector the regulations promote labor productivity and employment. This shows that a firm in the green sector which has high carbon dioxide emissions can adapt faster than its counterparts in a non-environmental sector in the polluting industry to the constraints imposed by strengthened environmental regulations. These empirical results imply that there will be labor reallocation from non-green to green sectors.
1. Introduction
A frequently asked question is, do environmental regulations reduce a firm’s productivity and employment? While no strong conclusion has emerged, countries have strengthened their domestic and international environmental regulations. Although studies on the effects of environmental regulations on a firm’s employment and productivity have increased [1], they mainly focus on the effects of polluting industries and do not consider the heterogeneity effects among different sectors. The debate on environmental regulations should be analyzed by distinguishing between green and non-green sectors. The two sectors are defined as industries producing goods and services related to the environment or resource recycling.
One segment that is the focus of policy is the green sector. Environmental regulations can create employment or so-called green jobs in this sector; this is important as these industries are regarded as the drivers of sustainable development.
This study examines how manufacturers respond to regulations measured by the Low-Carbon Green Growth (LCGG) strategy. Korea’s environmental regulations were strengthened in the 2000s according to international standards. After 2010, the Government of Korea intended to simultaneously achieve both environmental and economic goals through the LCGG project [2]. Environmental regulations were strengthened after President Lee proclaimed ‘Low-Carbon Green Growth,’ as the government’s goal for reducing greenhouse gas (GHG) emissions by 27–20 percent by 2020 relative to the ‘business as usual’ scenario of 2005. The Act on Low-Carbon Green Growth was enacted on 13 January 2010 to promote the development of the national economy by laying down the necessary foundation for low carbon, green growth and by utilizing green technologies and green industries as new engines of growth. This research is interested in the effects that these regulations had on economic outcomes defined as employment and labor productivity.
Greenstone [3] reviewed the effects of CAAA (Clean Air Act Amendment) on economic growth and industrial activities using US manufacturing plant-level data. US counties received non-attainment or attainment designations according to the air quality standards after CAAA was implemented. His study suggests that environmental regulations led to emitters in non-attainment counties who were subject to stricter regulatory oversight (treatment groups) losing output, jobs, and capital investments as compared to emitters in attainment counties. His results also suggest that there was a trade-off between environmental and economic outcomes. This is contrary to Porter’s [4] argument that environmental regulations can promote investments and technology development. Morgenstern et al. [5] and Lanoie et al. [6] confirm the positive effects of regulations on employment and productivity respectively. The effects of environmental regulations on a firm’s performance are still controversial because in addition to the enterprises’ extensive margins of entry and exit the regulations also lead to labor reallocations between regulated and non-regulated firms asymmetrically depending on the type of regulation [7]. So, the total economic outcomes in the general equilibrium framework depend on the characteristics of the industries and the applied environmental policy.
In this study, we test three hypotheses. First, the Porter Hypothesis (PH) is tested in terms of labor productivity and employment in the polluting industry. The polluting industry’s performances will decrease more than that of the less-polluting industry under environmental regulations in keeping with Greenstone [3] and Walker [8]. Second, dividing the firms by another criterion, namely whether they produce environmental goods, the green sector might benefit from the regulations. Lastly, this paper tests whether the negative effects of the regulations on a polluting establishment can be off-set if it is included in the green sector. We use Korea Statistics’ manufacturing surveys from 2004 to 2015, which include the periods before and after LCGG’s implementation. Manufacturing is identified as the major emitter of harmful substances in the production and processing of paper, rubber, chemicals, and petroleum refining. Hence, it responds sensitively and differently, depending on the emissions in the processes and the types of products produced. In addition, green manufacturers account for about 20 percent of this industry so it is useful to examine cross-sectional variations between these establishments as well.
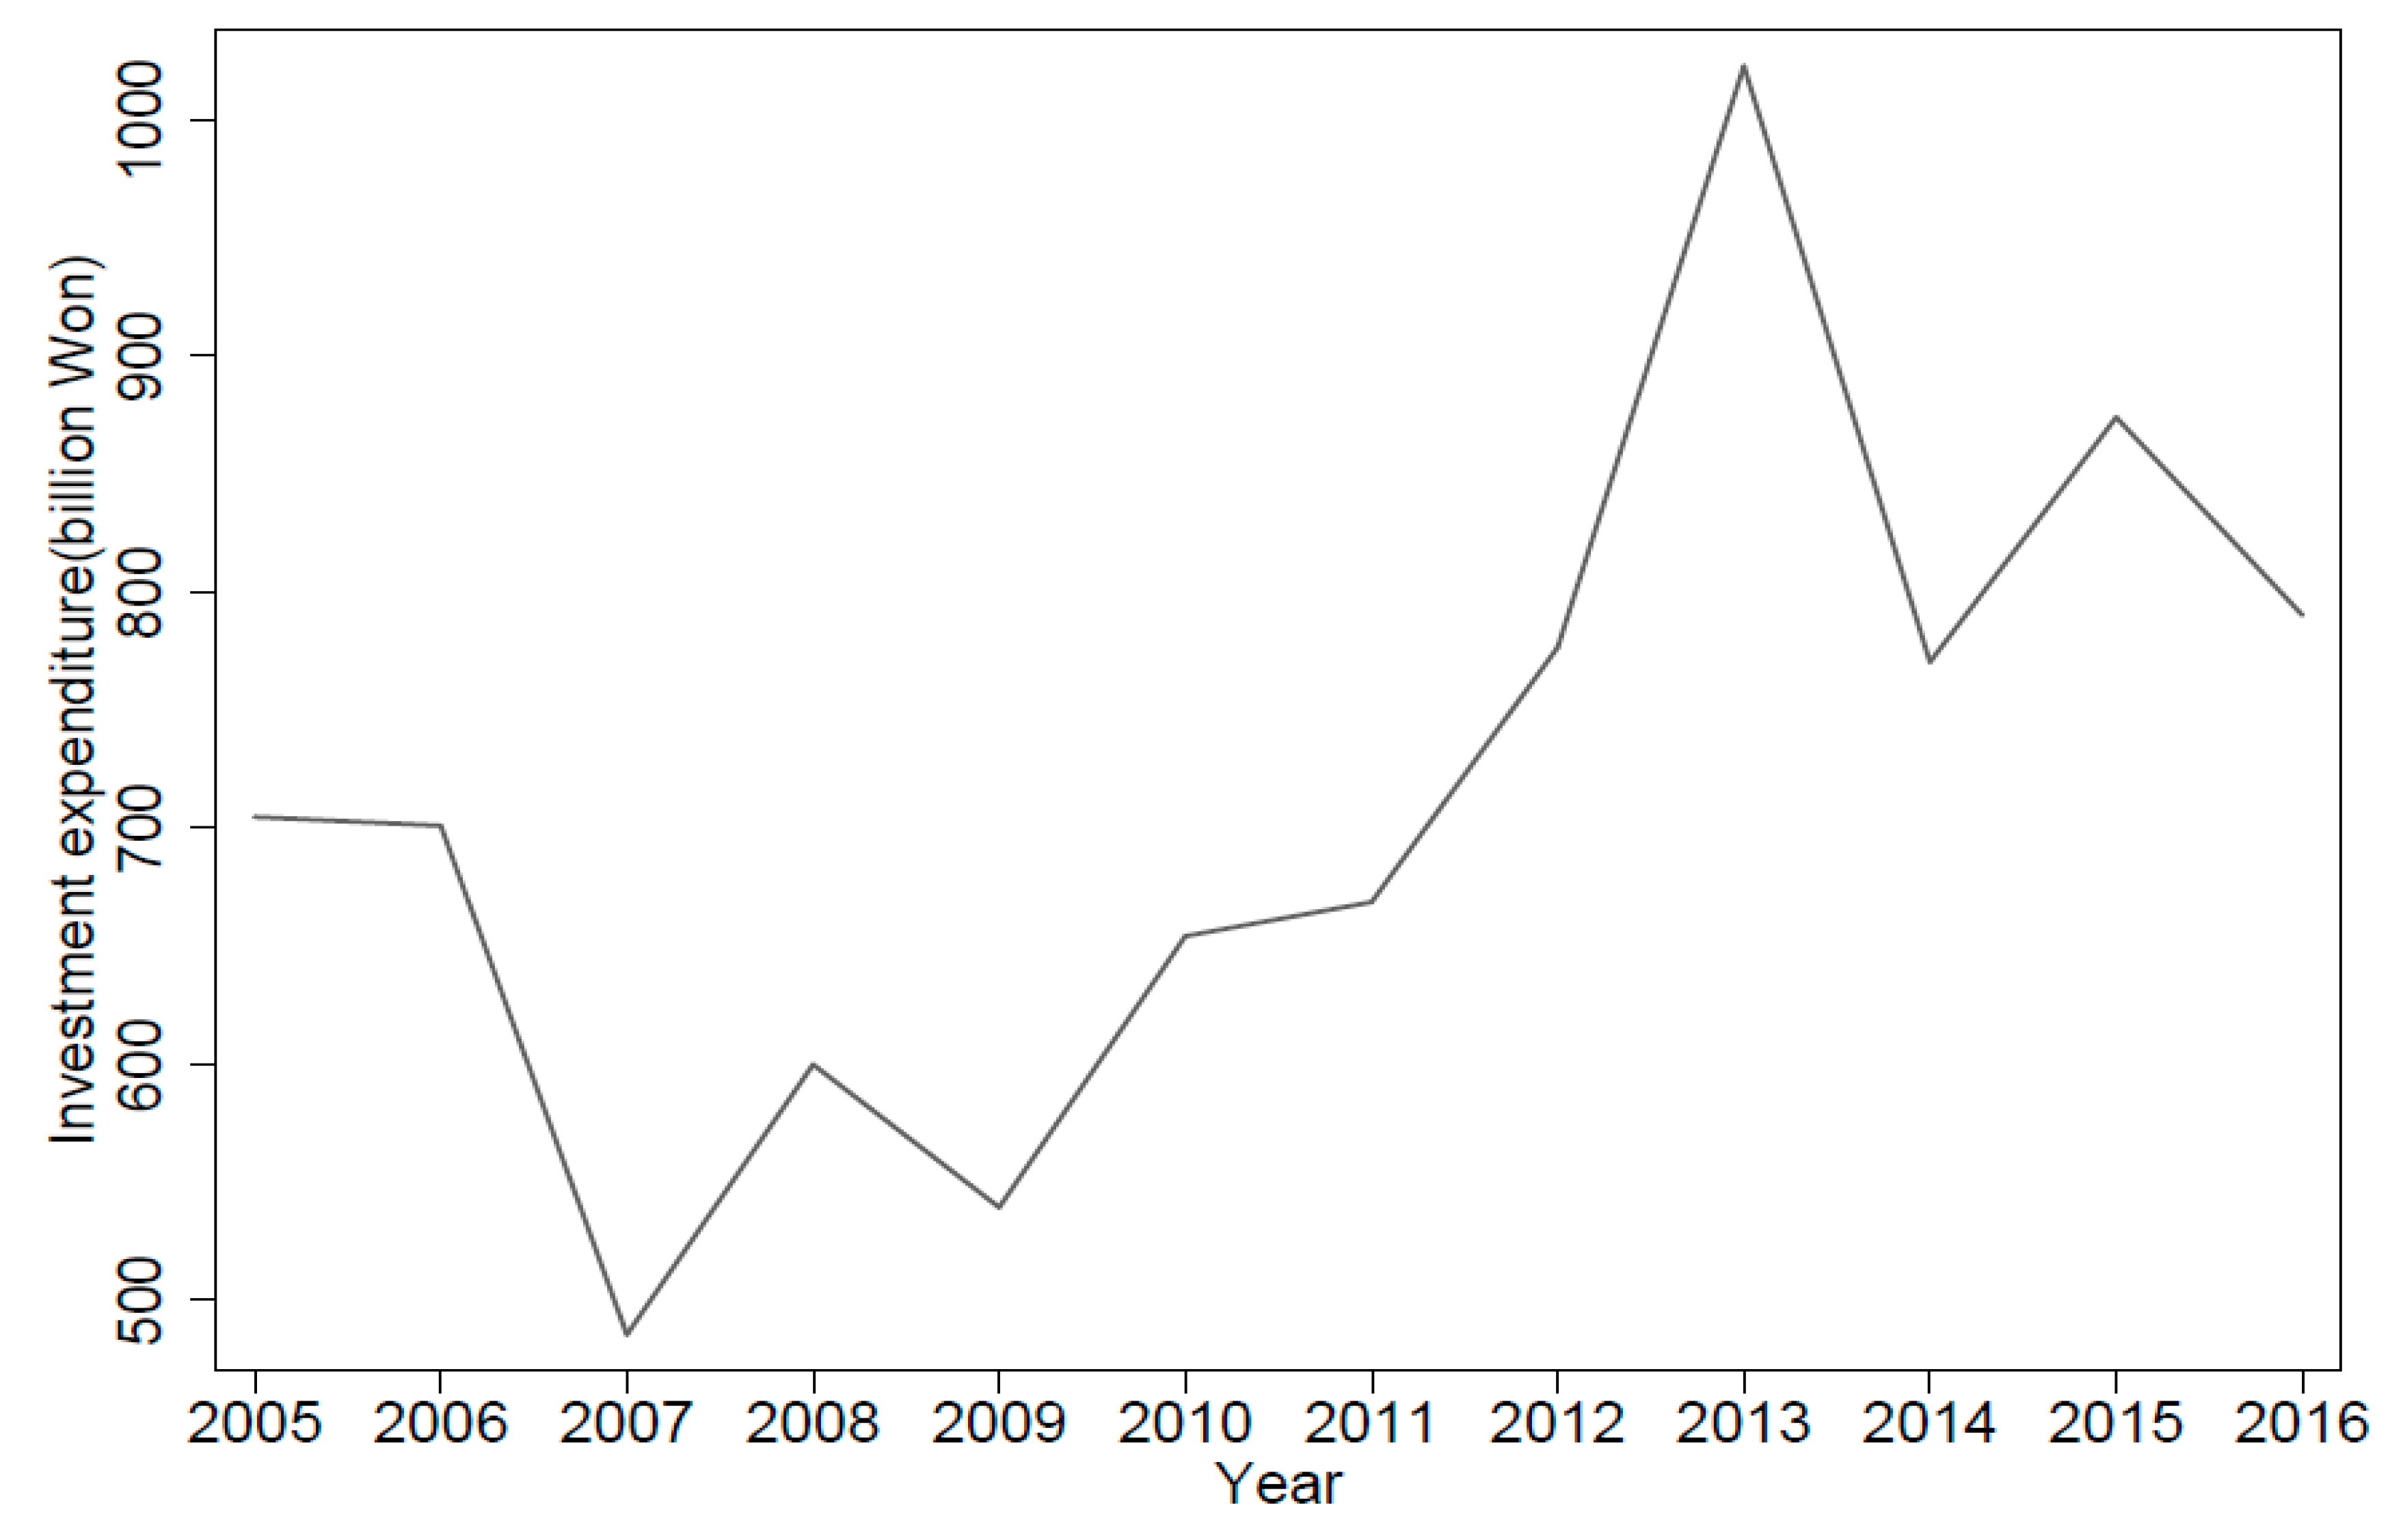
Figure 1 shows the increased energy and environmental expenditure in the manufacturing industry from 2004 to 2016. The energy and environmental expenditure includes pollution abatement and control expenditure (PACE) and is a proxy for domestic environmental regulations since the expenditure is not directly related to the firms’ profit maximization behavior but to environmental pressures by the authorities [9]. Expenditure increased sharply during the LCGG project period after 2010. This trend is useful for examining the effects of environmental regulations on economic growth over time using the difference-in-differences method.
This study contributes to the environmental economic field in which studies that inspect the link between environmental policies and their effect on the economy are scarce outside the US. Environmental policies covered in literature using US data include Clean Water and Clean Air Acts [10,11], Clean Air Act Amendment [7], and Cross-State Air Pollution Rule [12]. Our empirical results suggest that employment and labor productivity were impacted by stricter environmental standards under LCGG in Korea and their effects were asymmetric depending on the industry’s features. These findings have policy implications for ‘the environment versus jobs’ debate and the possibility of sustainable development in terms of productivity.
The rest of this study is organized as follows. Section 2 reviews previous studies on environmental regulations and firms’ competitiveness. Section 3 documents the characteristics of industries according to CO2 emissions and environmental classifications. Section 4 explains the theoretical framework of the relationship between regulations and a firm’s performance and sets the empirical equation. Section 5 reports the results of the estimation analysis for employment and labor productivity. The conclusion is given in Section 6.
2. Literature Review
In the literature, the effect of regulations on a firm’s economic outcomes has been examined in terms of productivity, investments, employment, and international trade [1]. Several studies also focus on the manufacturing industry since it is regarded as the main culprit responsible for emitting toxic substances and as such is a target of environmental regulations. After the famous Porter Hypothesis [4] researchers have tested whether this hypothesis can hold.
The following studies imply that the Porter Hypothesis holds at least weakly: Lanoie et al. [6] found the hypothesis to be consistent with Quebec manufacturing data. Their findings suggest that the direct effect of regulations on total factor productivity (TFP) growth was negative, but the lagged regulatory variable had a positive productivity effect. They also confirm that this effect was stronger when the industries were more exposed to international competition. Jaffe and Palmer [13] and Johnstone et al.’s [14] studies focus on investment activities in industries. Jaffe and Palmer [13] suggest that lagged stringency of environmental regulations measured by pollution control expenditure spurred R&D activities by using a three-digit industry level and a fixed effects model. Their results were the opposite when the model was estimated using the pooled ordinary least squares (POLS) method neglecting industry heterogeneity. Johnstone et al. [14] and Rubashkina et al. [15] found that innovations based on patents and R&D were not obstructed by environmental policies.
Yang et al. [16] support the Porter Hypothesis using data for Taiwanese manufacturing plants by using pollution abatement fees and R&D expenditure. In their study, capital expenditure was not significantly related to R&D in the case of pollution abatement. Molina-Azorín et al. [17] analyzed the relationship between a firm’s performance and environmental practices in the Spanish hotel industry and found that a strong commitment to environmental practices was linked to the hotels’ higher performance levels.
Greenstone [3] used US manufacturing data with fixed effects models like Jaffe and Palmer’s [13] study, but his results are the opposite. Ozone regulations had the strongest contemporaneous negative effect and the overall effect of the regulations on the industry’s TFP was also negative. The dynamic effects of regulations captured by the variations between attainment and non-attainment counties under CAAA were negative and the opposite of PH. According to Wagner et al. [18] the hypothesis did not hold in the European paper industry. Yuan and Xiang [19] maintain that the hypotheses for both weak and strong versions were not supported by data on Chinese manufacturing industries, but in the short term environmental regulations improved labor productivity and environmental and energy efficiency. Using German data, Rexhäuser and Rammer [20] show that PH held only in those innovations which increased a firm’s energy efficiency. Thus, empirical research on environmental regulations’ effects on a firm’s competitiveness has reached no conclusive results [21].
The crowding-out effect in investments between clean and dirty industries is one of the reasons why it is hard to predict the net effect of regulations in an economy. Wang and Shen [22] examined the effects of environmental regulations in China, separating the industries on the basis of clean- and pollution-intensive production. They concluded that clean production industries had higher environmental productivity under regulations than dirty industries. Using the system generalized methods of moment (GMM) and threshold regression estimation methods, they also found that environmental regulations and environmental productivity had an inverted U-shaped relation. Gray and Shadbegian [10] and Kneller and Manderson [23] concentrated on the crowding-out effect between green and traditional investments (technology). According to them, environmental regulations promoted green investments while increased investments in green technology crowded-out existing investment activities. Gray and Shadbegian [10] explored investment decisions of US paper plants using a multinomial logit model. They found that pollution abatement costs and expenditure (PACE) used as a proxy of environmental investments crowded-out productive investments. Kneller and Manderson [23] also found this substitution in UK’s manufacturing industry data using the two-step system, GMM. More pollution abatement pressures increased environmental research and development (R&D) and investments in environmental capital, but an increase in environmental R&D tended to crowd-out non-environmental R&D.
These asymmetric effects of environmental regulations occur not only at the industry or plant level but also at the common border between countries. Alpay et al. [24] used data from the food manufacturing industry in the US and Mexico during the North American Free Trade Agreement (NAFTA) to capture the effects of environmental regulations on each country’s productivity under free trade. They argue that stricter environmental regulations in Mexico enhanced the industry’s productivity growth thus corroborating PH, while US pollution regulations had an insignificant effect on the US food industry.
When it comes to employment, the impact of green innovations in literature is ambiguous. Kunapatarawong and Martínez-Ros [25] investigated the relationship between innovation activities and employment using firm-level Spanish panel data. They suggest that green innovations and employment were positively linked, especially in a dirty industry. Morgenstern et al. [5] found a weak positive relationship between stringent environmental regulations measured by PACE and jobs using a structural model in four polluting manufacturing industries. They used aggregated data from pulp and paper mills, plastic manufacturers, petroleum refiners, and iron and steel mills to estimate the structural model based on a translog cost functional form. Yamazaki [26] and Walker [8] focused on the re-allocative effects of regulations. Yamazaki [26] showed that in British Colombia employment fell in carbon-intensive and trade-sensitive industries, but jobs increased in clean service industries with the revenue-neutral carbon tax. Walker [8] found that workers reallocated from the regulated sector to other industries within the same labor market under CAAA. Aldy and Pizer [12] investigated power sector regulations and found that these affected jobs negatively, but they raised electricity rates and led to higher production costs in all US firms.
Previous research using Korean data includes that by Kang and Lee [27], Kim and Ha [9], Kang and Jo [28], Jung [29], and Lee and Choi [30]. According to Kang and Jo [28] the enforcement of the Indoor Air Quality Control Act enabled about 652 people to find jobs during 2015-19. The following papers show that the PH holds using proxies for environmental variables; Kang and Lee [27] concluded that PACE, a proxy for environmental regulations, increased R&D and this effect was more significant in the stringent regulation period (1992–2001) than during the less stringent regulation period in 1982-91. They also used industry-level manufacturing data and fixed-effects estimation. Kim and Ha’s [9] research is similar to ours in terms of data. They used the ratio of energy and environmental expenditure to measure environmental pressures. The effects of environmental pressures on TFP were positive, especially in polluting industries through a lagged regulation proxy.
Studies assessing the effects of environmental regulations not the proxy variables are scarce in case of Korea, because domestic environmental regulations are not strict. The Low-Carbon Green Growth (LCGG) Act sets the fundamentals of environmental policies including the Emission Trading Scheme (ETS). Article 46 of the Act states that the introduction of a cap and trade system for emissions of GHG [2] and the pilot project for ETS was undertaken in January 2010. The carbon market will stimulate incentives for firms to reduce their emissions; as previously announced the Act was implemented in 2015. The GHG Inventory and Research Center was also established to construct GHG data and manage emissions according to Article 45 [2,31]. Lee and Choi [30] show that ETS implemented in 2015 promoted technical changes in the manufacturing industry, but this top-down approach by the government may have limits in enhancing environmental efficiency. Jung [29] suggests that LCGG was based on economic growth rather than ecological modernization and green jobs were only created in traditional environmental protection and pollution reduction areas. While this government-initiated project for achieving both economic growth and environmental conservation has been controversial [32], environmental and energy expenditure in the country reflects increased investments in the environmental parts (see Figure 1). We can directly analyze the effects of environmental regulations by dividing periods into before and after LCGG.
This study contributes to literature in two ways. First, it extends the field by shedding light on the relationship between regulations and firms’ economic performance by distinguishing the sectors within the polluting industry. Second, it uses LCGG for measuring stringent environmental regulations which should be helpful in assessing policy. Therefore, the results suggest new academic research and important policy implications according to the types of sectors.
3. Data
For the empirical analysis, this study mainly uses data from the Survey on the Mining and Manufacturing Industry from 2004 to 2015 provided by the Korea National Statistical Office’s (KOSTAT) Microdata Integrated Service (MDIS). The mining and manufacturing surveys cover establishment level data for firms with 10 or more employees. The surveys include the industry code at the five-digit level and financial information such as assets, capital stock and flow, output, value added, number of employees, wages, and the regional code.
Korea’s Ministry of Environment classifies environmental industries at a five digit-level; this is in accordance with OECD’s environment industry standards and we mainly call it the green sector in this paper. The classification of environmental industries in Korea is consistent with ‘the Environmental Goods and Services Industry’ as defined by the OECD. The definition of the environmental industry is: activities to design, manufacture, and install environmental facilities and measuring equipment for environmental conservation and management such as climate, air, water, environmental restoration, environmental safety, health, resource circulation, sustainable environmental resources or services for environmental techniques [33].
The environmental industry (or the green sector) is matched with the Korea Standard Industry Code (KSIC9); KOSTAT provides the matching code. The environmental industry is a comprehensive concept and is different from an eco-friendly or less-polluting industry. By definition, an industry belongs to the environmental sector if its production is environment related. This is why this paper uses two standards to divide establishments. For example, a plant that produces air purifiers may generate harmful substances but it is classified as an environmental industry because the air purifiers provide environmental services. Under this classification, retreatment of rubber tires (code 22112) and manufacture of other industrial glass—waste glass products (code 23129)—become green and polluting industries. Therefore, manufacturers who belong to the environmental industry are subject to regulations. However, as the degree of regulations increases, the demand for environmental goods and facilities also increases and this can lead to an improvement in a firm’s performance.
To identify a polluting industry that would be sensitive to regulations, this paper uses CO2 emissions data from the National GHG (Green House Gas) Emission Total Information System. The data is constructed at the 3-digit level and is only available for 2012–15. Because of this data limitation, we define polluting industries as those industries which are above the median of green gas emissions every year during the period. The criteria, 2nd and 3rd groups in terciles, are also used to see whether the main results are robust when the definition varies.
Summary statistics of the data are presented in Table 1. The results of the mean equality test (t-test) show that the mean variables between the green and non-green sectors in each industry differed statistically. The average size of green businesses such as output, capital, and age was larger than that of non-green businesses. In terms of the number of establishments, the businesses in the green sector accounted for about 21 percent of the manufacturing industry. Although the number of green establishments is relatively small, the average number of workers is similar or higher than in the non-green sector. The average wage of each group in the green sector is also higher. This higher salary reflects higher human capital and production technology levels.
This paper uses the capital variable as capital stock values at the beginning and end of the year. For calculating capital stock, we generally use the year-early data. However, there are some limitations with the 2010 and 2015 surveys since capital stock was omitted at the establishment level (financial and capital assets were surveyed at the firm level, so establishment level data was not reported). Hence, because of this missing data for 2010 and 2015 this paper uses capital stock at the end of 2009 and 2014 respectively. All nominal variables such as sales, value-added, and wages are converted to real values. In the case of sales and value added, the paper uses GDP deflators calculated by KOSTAT. We use the capital deflators and the consumer price index (CPI) obtained from the Bank of Korea to transform capital assets and wages to real values. The paper measures productivity using labor productivity, which is real value-added divided by the number of workers. Workers include full-time and irregular employees except dispatched employees. Age of the firm is measured in years from its date of establishment. The concentration index is measured as the Herfindahl Hirschman Index (HHI)—a square sum of shares of all establishments in the five-digit industries. The paper uses HHI for controlling the level of competition in the industry that affects firms’ performance such as employment and labor productivity.
In particular, the production and employment in automobiles accounts for a large portion of the green sector such as manufacture of passenger motor vehicles (hydrogen, hybrid, photovoltaic, and natural gas automobiles) (code 30121), manufacture of other new parts and accessories for motor vehicles (exhaust gas reduction devices, DPF, diesel oxidation catalysts, and DOC devices) (code 30399), and manufacture of parts and accessories for motor engines (code 30310). This is consistent with the fact that domestic automobile manufacturing, which is highly dependent on exports increases investments in eco-friendly product development such as electric vehicles due to the strengthening of environmental regulations by importing countries. In the non-green sector, manufacture of semi-conductors and electronic components (codes 26110 and 26211), building ships and boats (codes 31114 and 31111), manufacture of plastic products for fabricating machines (code 22240), and manufacture of parts and accessories for motor vehicle bodies (code 30320) have soaring employment and output levels.
4. Methodology
4.1. Theoretical Framework
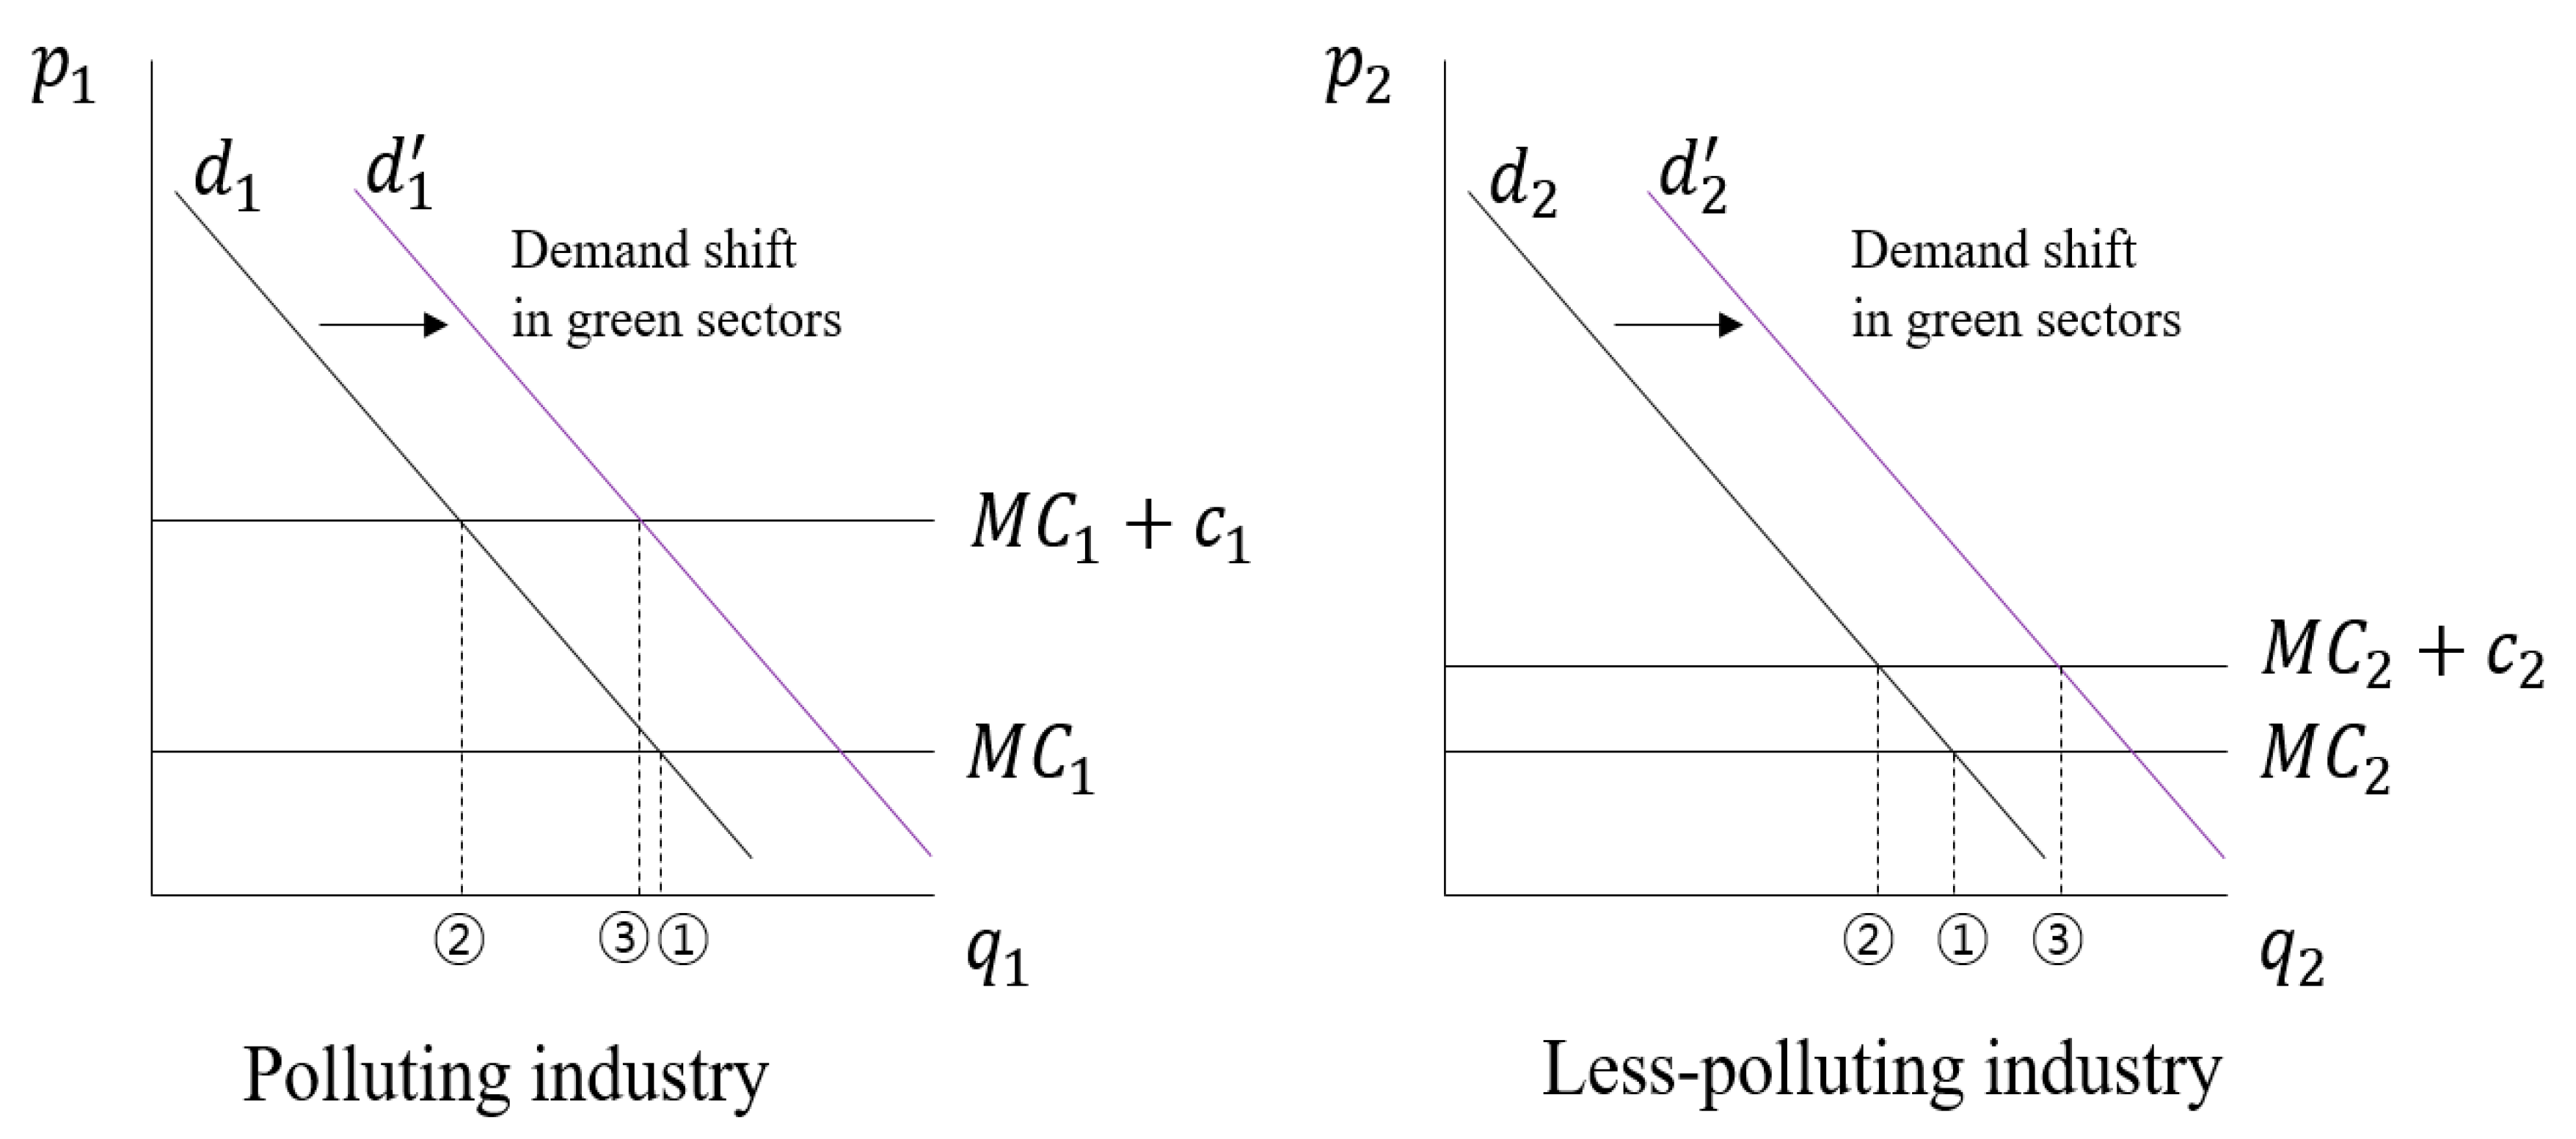
This section examines the mechanisms of how regulations affect a firm’s performance and the related hypotheses. It is obvious that environmental policies increase firms’ production costs directly. But this impact is asymmetric to economic units and depends on the differences in their production functions and the demand that they face. This means that besides divisions between regulation-targeting groups and others, systematic differences between the entities also lead to changes in relative costs. The Pollution Haven Hypothesis is also based on the asymmetric effects of environmental regulations between countries [24]. Figure 2 illustrates the asymmetric effects of environmental policies on a firm (or industry). Here and indicate each sector’s compliance costs brought on by environmental regulations. Since the polluting industries have a higher cost burden of environmental regulations as compared to the less-polluting industries, they have higher compliance costs ().
Although the contemporaneous effects of regulations on firms will be negative for their competitiveness (point ② in Figure 2), firms take optimal decisions to react to stricter environmental regulations. In this process, firms have the incentive to invest and develop new cost-efficient techniques which can reduce emissions at lower costs and subsequently off-set the direct negative effects of the policies (PH holds). Then increased pressure of the regulations in the past can have a positive impact on economic growth.
In research, the directions that indirect effects take in productivity, investments, and jobs have been controversial. However, if firms recover enough then their output will increase based on their improved productivity. In particular, strengthening regulations in the case of the green sector can lead to an increase in demand for environment-related goods and services over time by stimulating the need for green outputs in all the sectors. This is represented in Figure 2 by point ③. This upward demand shift (from to ) should lead to an increase in output and employment.
If the industries can off-set their compliance costs (if PH holds), the regulation-induced losses in output and employment will dissolve. The green sector, in particular, could recover its losses faster than the non-green sector even in the polluting industries. It has an opportunity to expand its market under environmental regulations as compared to its non-green counterparts. Figure 2 explains this phenomenon with a demand shift excluding the price effect.
4.2. Empirical Model
This study categorizes the establishments into the environmental sector (green and non-green) and carbon dioxide emitting (polluting and non-polluting) industries for examining the effects of strengthened environmental regulations on employment and labor productivity. It allows estimation of the industrial sector’s heterogeneity in response to tightened regulations in the Korean manufacturing industry. It estimates difference-in-differences regressions with three different specifications to shed light on the effects of tightened environmental regulations on the performance of the establishments.
The dependent variables () are the logarithms of employment and labor productivity. Employment and labor productivity are often used for measuring a firm’s performance. For calculating labor productivity, we use both output and value–added variables. The subscripts , j, r, and t denote establishment, industry, region, and year of observations respectively. The main estimated equation is specified as:
The purpose of the reduced form estimation is identifying the effects of environmental regulations in the context of LCGG using the DDD (difference-in-differences-in-differences) term. The variable is an indicator of whether the year is after 2010 since the LCGG Act was enacted in January 2010. The Act on Low-Carbon Green Growth includes the following provisions: Reduction in the consumption of fossil fuels; reduction of GHG emissions by 27–30 percent by 2020 relative to the ‘business as usual’ of 2005; and increasing energy independence by using new and renewable energy sources. represents the polluting industry dummy variable and is another dummy variable which has a value of one if the establishment is included in the green sector or zero otherwise. So, the estimated coefficient of captures the asymmetric effects of environmental regulations between industries.
This study used three specifications. First, we did the DD (difference-in-differences) regression using interaction to confirm the effects of regulations on polluting industries; this has also been done by previous studies. Then, we compared the green and non-green sectors using . And lastly, we applied Equation (1) to identify the regulations’ effects on the dependent variables through an interaction among these three variables. The first and second terms of the DD term are all included and DD specifications are also saturated.
is a vector of other control variables such as . is a concentration index measuring the degree of competition within the five-digit industries and is control for the size of a plant. is the logarithm of capital intensity calculated by capital stock of labor and it is included in the labor productivity equation. We also use which is the logarithm of average wages of employees when estimating the employment equation. , , and are industry, region, and time fixed effects. These fixed effects capture the unobservable industry, region, and time-specific characteristics. is robust standard errors.
5. Results
This analysis focuses on examining how a plant responds to the adoption of new environmental regulations through the interaction term between the policy period’s indicator and industry variables. Table 2 shows the results of labor productivity and employment estimations for polluting industries. Columns 1–3 give the results comparing six years before and after LCGG and Columns 4–six compare four-year effects. The DD terms in the table show significantly negative effects with the magnitude of the effects becoming larger when we consider a longer period. Labor productivity decreased about 5–6 percent and employment decreased 3 percent during the six years. These significantly negative effects were consistent when 2nd and 3rd groups in terciles were used instead of median to define the polluting industries. This implies that the increased costs induced by strengthened regulations led to a decrease in employment and productivity and this was not a temporary effect. This is consistent with previous studies [3,8,18].
In Table 3, we divide establishments into green and non-green sectors since we expect a positive demand shift to the green sector. This classification focuses on the product a plant supplies while polluting industries are defined as a sensitive group by the policy because of the emissions in their production processes. The estimated coefficients of interaction are positive and significant except for Column 6. This means that the green sector relatively experienced enhanced productivity and employment as compared to the non-green sector after LCGG.
Table 4 gives the results of the estimation of Equation (1). In terms of labor productivity, the DD terms show highly statistically significant effects. The green and non-green sectors in the polluting industries responded differently to the imposed regulations considering labor productivity. An establishment in a polluting industry had a decrease of about 6–7 percent in productivity after the regulations (Columns 1 and 2). However, these negative effects were off-set if the establishment was included in the green sector in the polluting industries. It also seems that there were a few productivity gains in this establishment. These positive effects on labor productivity in the green sector came from demand effects because we control the substitution between capital and labor using capital intensity. Hence, our results confirm that environment related industries are a key to understanding the consequences of environmental regulations. Although polluting industries face a higher burden because of the relatively higher compliance costs of the regulations, however, if they produce environment related goods or use environment related processes in their production, then these negative impacts could be canceled out.
In Columns 3 and 6, we use total employment as the dependent variable. The estimated coefficients of the DD terms are negative and not significant. This means that the green and non-green sectors in the polluting industries are not different considering the intensity of the regulations’ effects. Plants in polluting industries reduce their employment but this reduction is not recovered within the industry and jobs increase in plants, including those in green and less polluting industries. This evidence implies a trade-off between green and non-green sectors within the brown industries only in labor productivity. And establishments in the green sector in less-polluting industries have a marginal increase in employment (Column 3). The main results are consistent when another criterion is used for a Poll indicator, but the off-set to a loss captured by DDD terms diminishes.
6. Conclusions
This study examined the effects of strengthened environmental regulations on employment and labor productivity by dividing the industries based on two criteria: environmental classification (green and non-green sectors) and carbon dioxide emissions (polluting and less-polluting industries). It used establishment-level panel data from 2004 to 2015 including the period in which the Government of Korea implemented the Low-Carbon Green Growth Act. Our empirical results lead to several conclusions. First, environmental regulations have negative effects on economic outcomes in polluting industries. Second, these effects are asymmetric between green and non-green sectors and this taxonomy is as important as whether a firm emits a larger quantity of CO2 emissions which has been the main focus of previous studies. Finally, the positive effects in the green sector can off-set a part of the negative effects of the polluting industries. This suggests that plants producing environmental goods in polluting industries were not hit hard by the environmental regulations.
This study contributes to environmental policy related research as it not only considers the effects of the regulations on the manufacturing industry but also considers the asymmetric effects between the green and non-green sectors. In Korea, the environmental industry has attracted attention as the driving force for new growth in the low-carbon green growth policy [34]. As environmental regulations have been strengthened internationally, the need for eco-friendly processes and environmental goods has increased. Environmental regulations or pressures could stimulate job creation and labor productivity in the green sector or at least these will not hinder the performance of this group even though it emits substantial greenhouse gases. Nonetheless, the emitters in the non-green sector suffered because of the regulations and their productivity reduced. Therefore, restrictions and subsidies should be applied to firms considering their specific characteristics and GHG emissions.
This research has some limitations. First, it does not capture labor reallocations between industries or within local areas. Second, it uses 2–3 digit level data during 2012–15 to define polluting industries based on their CO2 emissions. Accounting for other pollutants, such as SO2 and use of an expanded dataset at the firm level will be informative. These limitations of the dataset may have hampered an accurate estimation of the effects. The empirical method in the paper was conducted without consideration of the firm dynamics accounting for the entry and exit of establishments. If future researches can capture input reallocation and decompose it between intensive and extensive margins, this enables distinguishing the differences in the regulations’ effects on environmental and non-environmental sectors more clearly. In an attempt to reduce uncertainty, given data availability, future research can conduct more systematic sensitivity analysis of the results by accounting for the weaknesses listed above.
Author Contributions
Conceptualization, S.Y. and A.H.; methodology, S.Y. and A.H.; STATA software, S.Y.; validation, S.Y. and A.H.; formal analysis, S.Y. and A.H.; investigation, S.Y.; resources, S.Y.; data curation, S.Y.; writing—original draft preparation, S.Y.; writing—review and editing, A.H.; visualization, S.Y.; supervision, A.H.; project administration, A.H.; no funding acquired.
Funding
This research received no external funding.
Acknowledgments
The authors are grateful to the Department of Economics, Sogang University for facilitating access to industry data. We are grateful to the three anonymous referees and an editor of the journal for their comments and suggestions on an earlier version of this paper.
Conflicts of Interest
The authors declare no conflict of interest.
References
- Dechezleprêtre, A.; Sato, M. The impacts of environmental regulations on competitiveness. Rev. Environ. Econ. Policy 2017, 11, 183–206. [Google Scholar] [CrossRef]
- Ministry of Government Legislation. Framework Act on Low Carbon, Green Growth. Available online: http://www.moleg.go.kr/english/korLawEng?pstSeq=54792 (accessed on 20 May 2019).
- Greenstone, M. The impacts of environmental regulations on industrial activity: Evidence from the 1970 and 1977 clean air act amendments and the census of manufactures. J. Polit. Econ. 2002, 110, 1175–1219. [Google Scholar] [CrossRef]
- Porter, M.E.; van der Linde, C. Green and competitive: Ending the stalemate. Harv. Bus. Rev. 1995, 73, 120–134. [Google Scholar]
- Morgenstern, R.D.; Pizer, W.A.; Shih, J.S. Jobs versus the environment: An industry-level perspective. J. Environ. Econ. Manag. 2002, 43, 412–436. [Google Scholar] [CrossRef]
- Lanoie, P.; Patry, M.; Lajeunesse, R. Environmental regulation and productivity: Testing the porter hypothesis. J. Prod. Anal. 2008, 30, 121–128. [Google Scholar] [CrossRef]
- Coglianese, C.; Carrigan, C. The Jobs and Regulation Debate. In Does Regulation Kill Jobs? University of Pennsylvania Press: Philadelphia, PA, USA, 2014; pp. 1–30. [Google Scholar]
- Walker, W.R. The transitional costs of sectoral reallocation: Evidence from the clean air act and the workforce. Q. J. Econ. 2013, 128, 1787–1835. [Google Scholar] [CrossRef]
- Kim, J.H.; Ha, B.C. The Effects of Environmental Regulations on the Industrial Productivity: An Empirical Analysis of the Korean Case. J. Ind. Econ. Bus. 2012, 25, 1711–1727. Available online: https://www.kci.go.kr/kciportal/ci/sereArticleSearch/ciSereArtiView.kci?sereArticleSearchBean.artiId=ART001655613 (accessed on 31 May 2019).
- Gray, W.B.; Shadbegian, R.J. Environmental regulation, investment timing, and technology choice. J. Ind. Econ. 1998, 46, 235–256. [Google Scholar] [CrossRef]
- Popp, D. Pollution control innovations and the Clean Air Act of 1990. J. Policy Anal. Manag. 2003, 22, 641–660. [Google Scholar] [CrossRef]
- Aldy, J.E.; Pizer, W.A. The competitiveness impacts of climate change mitigation policies. J. Assoc. Environ. Resour. Econ. 2015, 2, 565–595. [Google Scholar] [CrossRef]
- Jaffe, A.B.; Palmer, K. Environmental regulation and innovation: A panel data study. Rev. Econ. Stat. 1997, 79, 610–619. [Google Scholar] [CrossRef]
- Johnstone, N.; Haščič, I.; Popp, D. Renewable energy policies and technological innovation: Evidence based on patent counts. Environ. Resour. Econ. 2010, 45, 133–155. [Google Scholar] [CrossRef]
- Rubashkina, Y.; Galeotti, M.; Verdolini, E. Environmental regulation and competitiveness: Empirical evidence on the Porter Hypothesis from European manufacturing sectors. Energy Policy 2015, 83, 288–300. [Google Scholar] [CrossRef] [Green Version]
- Yang, C.H.; Tseng, Y.H.; Chen, C.P. Environmental regulations, induced R&D, and productivity: Evidence from Taiwan’s manufacturing industries. Resour. Energy Econ. 2012, 34, 514–532. [Google Scholar]
- Molina-Azorín, J.F.; Claver-Cortés, E.; Pereira-Moliner, J.; Tarí, J.J. Environmental practices and firm performance: An empirical analysis in the Spanish hotel industry. J. Clean. Prod. 2009, 17, 516–524. [Google Scholar] [CrossRef]
- Wagner, M.; Van Phu, N.; Azomahou, T.; Wehrmeyer, W. The relationship between the environmental and economic performance of firms: An empirical analysis of the European paper industry. Corp. Soc. Responsib. Environ. Manag. 2002, 9, 133–146. [Google Scholar] [CrossRef]
- Yuan, B.; Xiang, Q. Environmental regulation, industrial innovation and green development of Chinese manufacturing: Based on an extended CDM model. J. Clean. Prod. 2018, 176, 895–908. [Google Scholar] [CrossRef]
- Rexhäuser, S.; Rammer, C. Environmental innovations and firm profitability: Unmasking the Porter hypothesis. Environ. Resour. Econ. 2014, 57, 145–167. [Google Scholar] [CrossRef]
- KozIuk, T.; Zipperer, V. Environmental Policies and Productivity Growth: A Critical Review of Empirical Findings. OECD J. Econ. Stud. 2015, 2014, 155–185. [Google Scholar]
- Wang, Y.; Shen, N. Environmental regulation and environmental productivity: The case of China. Renew. Sustain. Energy Rev. 2016, 62, 758–766. [Google Scholar] [CrossRef]
- Kneller, R.; Manderson, E. Environmental regulations and innovation activity in UK manufacturing industries. Resour. Energy Econ. 2012, 34, 211–235. [Google Scholar] [CrossRef]
- Alpay, E.; Kerkvliet, J.; Buccola, S. Productivity growth and environmental regulation in Mexican and US food manufacturing. Am. J. Agric. Econ. 2002, 84, 887–901. [Google Scholar] [CrossRef]
- Kunapatarawong, R.; Martínez-Ros, E. Towards green growth: How does green innovation affect employment? Res. Policy. 2016, 45, 1218–1232. [Google Scholar] [CrossRef]
- Yamazaki, A. Jobs and climate policy: Evidence from British Columbia’s revenue-neutral carbon tax. J. Environ. Econ. Manag. 2017, 83, 197–216. [Google Scholar] [CrossRef]
- Kang, M.O.; Lee, S.Y. A panel data analysis of the effects of environmental regulation on competitiveness of the Korean manufacturing sector. J. Environ. Policy Adm. 2006, 14, 169–193. Available online: https://www.kci.go.kr/kciportal/ci/sereArticleSearch/ciSereArtiView.kci?sereArticleSearchBean.artiId=ART001011530 (accessed on 31 May 2019).
- Kang, M.O.; Jo, Y.H. Effects of environmental policies on the creation of jobs in Korea. Korean Environment Institute. 2015. Available online: http://kiss.kstudy.com/thesis/thesis-view.asp?key=3425980 (accessed on 31 May 2019).
- Jung, Y.M. Is South Korea’s Green Job Policy Sustainable? Sustainability 2015, 7, 8748–8767. [Google Scholar] [CrossRef]
- Lee, H.S.; Choi, Y. Environmental Performance Evaluation of the Korean Manufacturing Industry Based on Sequential DEA. Sustainability 2019, 11, 874. [Google Scholar] [CrossRef]
- Greenhouse Gas Inventory and Research Center. 2018 National Inventory Report (NIR). 2018. Available online: http://www.gir.go.kr/home/board/read.do?pagerOffset=0&maxPageItems=10&maxIndexPages=10&searchKey=&searchValue=&menuId=36&boardId=43&boardMasterId=2&boardCategoryId= (accessed on 20 May 2019).
- Yun, S.J. The Ideological Basis and the Reality of “Low Carbon Green Growth”. Korean Assoc. Environ. Sociol. 2009, 13, 219–266. Available online: https://www.kci.go.kr/kciportal/ci/sereArticleSearch/ciSereArtiView.kci?sereArticleSearchBean.artiId=ART001361435 (accessed on 31 May 2019).
- Statistics Korea. Report on the Environment Industry Survey. 2015. Available online: http://www.me.go.kr/home/web/policy_data/read.do;jsessionid=SX4NjLTdCU8q5dq7UX3d-3-b.mehome1?pagerOffset=150&maxPageItems=10&maxIndexPages=10&searchKey=&searchValue=&menuId=10259&orgCd=&condition.orderSeqId=6643&condition.rnSeq=417&condition.deleteYn=N&seq=7148 (accessed on 20 May 2019).
- Jones, R.S.; Yoo, B. Korea’s Green Growth Strategy: Mitigating Climate Change and Developing New Growth Engines; OECD Economic Department Working Papers; OECD Publishing: Paris, France, 2011. [Google Scholar]
Figure 1.
Energy and Environmental Expenditure of Korean Manufacturing (Source: Statistics Korea).

Figure 2.
The effects of environmental regulations in industries differentiated by the level of pollution.
Figure 2.
The effects of environmental regulations in industries differentiated by the level of pollution.


Table 1.
Summary statistics of the data (by green sector and polluting industries).
| A. Less-polluting Industries | |||||||
| Green Sector | Non-Green Sector | t-test | |||||
| Variable | Obs | Mean | Standard Deviation | Obs | Mean | Standard Deviation | Mean Difference |
| CO2 | 40,676 | 3,400 | 7,121 | 155,374 | 3,782 | 13,655 | −382 *** (70.08) |
| Output | 112,930 | 13,918 | 97,069 | 459,676 | 13,249 | 250,934 | 668 (760.32) |
| Value added | 112,924 | 4,746 | 37,956 | 459,667 | 4,850 | 91,291 | −104 (277.37) |
| Total Employment | 112,930 | 35 | 100 | 459,676 | 35.8 | 196 | −0.80 (0.60) |
| Labor productivity (Output/Labor) | 112,930 | 267 | 611 | 459,676 | 214 | 1,188 | 56 *** (3.65) |
| Labor productivity (Vadd/Labor) | 112,924 | 95.4 | 169 | 459,667 | 80.4 | 315 | 15.1 *** (0.97) |
| Average Wage | 112,745 | 26.2 | 11.3 | 458,985 | 23.1 | 10.7 | 3.2 *** (0.36) |
| Capital | 107,459 | 4,659 | 34,217 | 439,110 | 4,263 | 63,609 | 396 ** (200.79) |
| Age | 112,930 | 10.7 | 9.0 | 459,676 | 10.3 | 9.1 | 0.41 *** (0.03) |
| HHI | 112,930 | 0.045 | 0.083 | 459,676 | 0.056 | 0.090 | −0.011 *** (0.0003) |
| B. Polluting Industries | |||||||
| Green Sector | Non-Green Sector | t-test | |||||
| Variable | Obs | Mean | Standard Deviation | Obs | Mean | Standard Deviation | Mean Difference |
| CO2 | 17,805 | 8,605 | 111,72 | 49,554 | 13,109 | 26,910 | −4504 *** (207.8) |
| Output | 42,089 | 60,918 | 606,650 | 116,041 | 38,030 | 608,978 | 22,888 *** (3461.6) |
| Value added | 42,089 | 18,050 | 198,400 | 116,041 | 12,752 | 226,866 | 5298 *** (1249.8) |
| Total Employment | 42,089 | 80 | 570 | 116,041 | 59 | 365 | 20.7 *** (2.44) |
| Labor productivity (Output/Labor) | 42,089 | 382 | 704 | 116,041 | 281 | 580 | 101 *** (3.50) |
| Labor productivity (Vadd/Labor) | 42,089 | 118 | 178 | 116,041 | 97 | 150 | 20.8 *** (0.90) |
| Average Wage | 41,994 | 29.2 | 12.5 | 115,925 | 27.2 | 10.6 | 1.9 *** (0.06) |
| Capital | 41,567 | 18,543 | 151,677 | 114,424 | 15,116 | 258,743 | 3426 ** (1346) |
| Age | 42,089 | 13.2 | 9.9 | 116,041 | 12.5 | 9.4 | 0.66 *** (0.05) |
| HHI | 42,089 | 0.038 | 0.076 | 116,041 | 0.041 | 0.062 | −0.003 *** (0.0004) |
Source: The Mining and Manufacturing Survey in Korean Statistics and National GHG Emission Total Information System. Notes: Employment is in units of people, the amount is one million won, and CO2 is 1,000 tons. The asterisks *** and ** indicate significant at the 1% and 5% levels of significance respectively. Standard errors are in parenthesis and HHI is the Herfindahl Hirschman Index.
Table 2.
Estimation results based on labor productivity and employment as dependent variables for polluting industries.
Table 2.
Estimation results based on labor productivity and employment as dependent variables for polluting industries.
| Dependent Variable | 2004–2009 vs. 2010–2015 | 2006–2009 vs. 2010–2013 | ||||
|---|---|---|---|---|---|---|
| ln(Vadd/L) | ln(Y/L) | ln(L) | ln(Vadd/L) | ln(Y/L) | ln(L) | |
| Models | (1) | (2) | (3) | (4) | (5) | (6) |
| Post × Poll | −0.055 *** | −0.052 *** | −0.029 *** | −0.019 *** | −0.011 ** | −0.012 ** |
| (0.003) | (0.004) | (0.004) | (0.004) | (0.005) | (0.005) | |
| ln(K/L) | 0.181 *** | 0.249 *** | 0.182 *** | 0.249 *** | ||
| (0.001) | (0.001) | (0.001) | (0.001) | |||
| ln(wage) | 0.357 *** | 0.360 *** | ||||
| (0.002) | (0.003) | |||||
| Age | 0.004 *** | 0.004 *** | 0.018 *** | −0.023 | −0.02 | 0.045 |
| (0.0001) | (0.0001) | (0.0001) | (0.027) | (0.032) | (0.030) | |
| HHI | −0.024 | −0.019 | 0.001 | 0.004 *** | 0.005 *** | 0.019 *** |
| (0.018) | (0.022) | (0.022) | (0.0001) | (0.0001) | (0.0001) | |
| Constant | 3.433 *** | 4.206 *** | 2.226 *** | 3.515 *** | 4.319 *** | 2.185 *** |
| (0.019) | (0.027) | (0.019) | (0.023) | (0.033) | (0.024) | |
| Observations | 702,553 | 702,560 | 729,649 | 469,347 | 469,347 | 483,937 |
| R-squared | 0.324 | 0.392 | 0.264 | 0.315 | 0.389 | 0.267 |
| Industry FE | yes | yes | yes | yes | Yes | yes |
| Year FE | yes | yes | yes | yes | Yes | yes |
| Region FE | yes | yes | yes | yes | Yes | yes |
Notes: The robust standard errors are in parenthesis. Five-digit-level industry, region, and year fixed effects are used for all columns. Columns 1–3 give the results comparing the 2004–2009 and 2010–2015 periods and Columns 4–6 compare 4 years before and after LCGG. HHI is the Herfindahl Hirschman Index and K/L is capital intensity. Post indicates period after 2010 and Poll means polluting industry at the 2–3 digits level. The asterisks *** and ** indicate significant at the 1% and 5% levels of significance respectively.
Table 3.
Estimation results based on labor productivity and employment as dependent variables for the green sector.
Table 3.
Estimation results based on labor productivity and employment as dependent variables for the green sector.
| Dependent Variable | 2004–2009 vs. 2010–2015 | 2006–2009 vs. 2010–2013 | ||||
|---|---|---|---|---|---|---|
| ln(Vadd/L) | ln(Y/L) | ln(L) | ln(Vadd/L) | ln(Y/L) | ln(L) | |
| Models | (1) | (2) | (3) | (4) | (5) | (6) |
| Post × Green | 0.037 *** | 0.019 *** | 0.011 *** | 0.023 *** | 0.013 ** | 0.007 |
| (0.004) | (0.004) | (0.004) | (0.005) | (0.005) | (0.005) | |
| ln(K/L) | 0.183 *** | 0.252 *** | 0.185 *** | 0.252 *** | ||
| (0.001) | (0.001) | (0.001) | (0.001) | |||
| ln(wage) | 0.378 *** | 0.381 *** | ||||
| (0.002) | (0.003) | |||||
| Age | 0.004 *** | 0.005 *** | 0.019 *** | −0.025 | −0.02 | 0.046 |
| (0.0001) | (0.0001) | (0.0001) | (0.027) | (0.032) | (0.030) | |
| HHI | −0.025 | −0.017 | 0.01 | 0.004 *** | 0.005 *** | 0.019 *** |
| (0.018) | (0.022) | (0.022) | (0.0001) | (0.0001) | (0.0001) | |
| Constant | 3.421 *** | 4.186 *** | 2.135 *** | 3.499 *** | 4.297 *** | 2.096 *** |
| (0.019) | (0.027) | (0.019) | (0.023) | (0.033) | (0.024) | |
| Observations | 702,553 | 702,560 | 729,649 | 469,347 | 469,347 | 483,937 |
| R-squared | 0.322 | 0.39 | 0.252 | 0.312 | 0.386 | 0.255 |
| Industry FE | Yes | yes | yes | yes | Yes | yes |
| Year FE | Yes | yes | yes | yes | Yes | yes |
| Region FE | Yes | yes | yes | yes | Yes | yes |
Notes: The robust standard errors are in parenthesis. Five-digit level industry, region, and year fixed effects are used for all columns. Columns 1–3 give the results comparing the 2004–2009 and 2010–2015 periods and Columns 4–6 compare four years before and after LCGG. HHI is the Herfindahl Hirschman Index and K/L is capital intensity. Post indicates the period after 2010 and Green means environmental industry at the five-digit level. The asterisks *** and ** indicate significant at the 1% and 5% levels of significance respectively.
Table 4.
Estimation results based on labor productivity and employment as dependent variables for the green sector in polluting industries.
Table 4.
Estimation results based on labor productivity and employment as dependent variables for the green sector in polluting industries.
| Dependent Variable | 2004–2009 vs. 2010–2015 | 2006–2009 vs. 2010–2013 | ||||
|---|---|---|---|---|---|---|
| ln(Vadd/L) | ln(Y/L) | ln(L) | ln(Vadd/L) | ln(Y/L) | ln(L) | |
| Models | (1) | (2) | (3) | (4) | (5) | (6) |
| Post × Green × Poll | 0.040 *** | 0.069 *** | −0.008 | 0.025 ** | 0.044 *** | −0.004 |
| (0.008) | (0.009) | (0.010) | (0.010) | (0.011) | (0.012) | |
| Post × Poll | −0.068 *** | −0.071 *** | −0.028 *** | −0.027 *** | −0.023 *** | −0.012 ** |
| (0.004) | (0.005) | (0.005) | (0.005) | (0.006) | (0.006) | |
| Post × Green | 0.029 *** | 0.002 | 0.012 *** | 0.017 *** | −0.0001 | 0.006 |
| (0.004) | (0.005) | (0.004) | (0.005) | (0.006) | (0.005) | |
| ln(K/L) | 0.181 *** | 0.249 *** | 0.182 *** | 0.249 *** | ||
| (0.001) | (0.001) | (0.001) | (0.001) | |||
| ln(wage) | 0.356 *** | 0.360 *** | ||||
| (0.002) | (0.003) | |||||
| Age | 0.004 *** | 0.004 *** | 0.018 *** | −0.027 | −0.022 | 0.043 |
| (0.0001) | (0.0001) | (0.0001) | (0.027) | (0.032) | (0.030) | |
| HHI | −0.029 | −0.021 | −0.0005 | 0.004 *** | 0.005 *** | 0.019 *** |
| (0.018) | (0.022) | (0.022) | (0.0001) | (0.0001) | (0.0001) | |
| Constant | 3.435 *** | 4.206 *** | 2.227 *** | 3.517 *** | 4.319 *** | 2.186 *** |
| (0.019) | (0.027) | (0.019) | (0.023) | (0.033) | (0.024) | |
| Observations | 702,553 | 702,560 | 729,649 | 469,347 | 469,347 | 483,937 |
| R-squared | 0.324 | 0.393 | 0.264 | 0.315 | 0.389 | 0.267 |
| Industry FE | yes | yes | Yes | yes | Yes | Yes |
| Year FE | yes | yes | Yes | yes | Yes | Yes |
| Region FE | yes | yes | Yes | yes | Yes | Yes |
Notes: The robust standard errors are in parenthesis. Five-digit level industry, region, and year fixed effects are used for all columns. Columns 1–3 give the results comparing the 2004–2009 and 2010–2015 periods and Columns 4–6 compare 4 years before and after LCGG. HHI is the Herfindahl Hirschman Index and K/L is capital intensity. Post indicates the period after 2010 and Green means environmental industry at the five-digit level. Poll is dummy of polluting industry at the 2–3 digit level. The asterisks *** and ** indicate significant at the 1% and 5% levels of significance respectively.
© 2019 by the authors. Licensee MDPI, Basel, Switzerland. This article is an open access article distributed under the terms and conditions of the Creative Commons Attribution (CC BY) license (http://creativecommons.org/licenses/by/4.0/).
Share and Cite
MDPI and ACS Style
Yoo, S.; Heshmati, A. The Effects of Environmental Regulations on the Manufacturing Industry’s Performance: A Comparison of Green and Non-Green Sectors in Korea. Energies 2019, 12, 2296. https://doi.org/10.3390/en12122296
AMA Style
Yoo S, Heshmati A. The Effects of Environmental Regulations on the Manufacturing Industry’s Performance: A Comparison of Green and Non-Green Sectors in Korea. Energies. 2019; 12(12):2296. https://doi.org/10.3390/en12122296
Chicago/Turabian StyleYoo, Seulgi, and Almas Heshmati. 2019. "The Effects of Environmental Regulations on the Manufacturing Industry’s Performance: A Comparison of Green and Non-Green Sectors in Korea" Energies 12, no. 12: 2296. https://doi.org/10.3390/en12122296
Note that from the first issue of 2016, this journal uses article numbers instead of page numbers. See further details here.