Analysis of the Current Electric Battery Models for Electric Vehicle Simulation
by
 , ,
, ,
Gaizka Saldaña
1,
José Ignacio San Martín
1,
Inmaculada Zamora
2,
Francisco Javier Asensio
1,* and 
Oier Oñederra
2 1
Department of Electrical Engineering, University of the Basque Country (UPV/EHU), Avda. Otaola 29, 20600 Eibar, Spain
2
Department of Electrical Engineering, University of the Basque Country (UPV/EHU), Pza. Ingeniero Torres Quevedo s/n, 48013 Bilbao, Spain
*
Author to whom correspondence should be addressed.
Energies 2019, 12(14), 2750; https://doi.org/10.3390/en12142750
Submission received: 3 June 2019
/
Revised: 11 July 2019
/
Accepted: 16 July 2019
/
Published: 18 July 2019
(This article belongs to the Section E: Electric Vehicles)
Abstract
:Electric vehicles (EVs) are a promising technology to reduce emissions, but its development enormously depends on the technology used in batteries. Nowadays, batteries based on lithium-ion (Li-Ion) seems to be the most suitable for traction, especially nickel-manganese-cobalt (NMC) and nickel-cobalt-aluminum (NCA). An appropriate model of these batteries is fundamental for the simulation of several processes inside an EV, such as the state of charge (SoC) estimation, capacity and power fade analysis, lifetime calculus, or for developing control and optimization strategies. There are different models in the current literature, among which the electric equivalent circuits stand out, being the most appropriate model when performing real-time simulations. However, impedance models for battery diagnosis are considered very attractive. In this context, this paper compares and contrasts the different electrical equivalent circuit models, impedance models, and runtime models for battery-based EV applications, addressing their characteristics, advantages, disadvantages, and usual applications in the field of electromobility. In this sense, this paper serves as a reference for the scientific community focused on the development of control and optimization strategies in the field of electric vehicles, since it facilitates the choice of the model that best suits the needs required.

1. Introduction
Nowadays, electric vehicles (EVs) are booming, due to the existing environmental problems. Among the different storage technologies in electromobility, batteries stand out the most. Although there are other alternatives such as hydrogen storage, a battery is also required for DC bus voltage stabilization and switching on of other essential or auxiliary devices of the fuel cell system [1]. High capital costs, limited lifetime, and relatively poor performance at low temperatures are the most important issues in EVs [2,3,4,5]. Therefore, the development of efficient storage technologies is an essential part for electromobility [6].
Lithium technology is highlighted for electromobility among the studied batteries options [7]. Its specific power and energy density are the highest, with the lowest self-discharge ratio [8]. In addition, voltage by cell is higher, which is the major drawback of the low overcharging tolerance. Therefore, a specifically designed charging system is required for this type of battery.
Lithium is the material basis of this type of battery, since lithium ions are carried from cathode to anode (charging) through a separator, and vice versa (discharging). However, lithium-ion (Li-Ion) batteries can be classified among different categories based on other elements, mainly those corresponding to the cathode chemical composition. Figure 1 shows a comparative summary of the best-known lithium ion batteries.
Specific energy is a key factor in storage, as it defines the driving range of an EV. As it can be seen in Figure 1, lithium-cobalt-oxide (LCO), nickel-cobalt-aluminum (NCA), and nickel-manganese-cobalt (NMC) technologies stand out within specific energy, but LCO can practically be discarded due to Solid Electrolyte Interphase (SEI) problems and toxicity [9]. Figure 2 shows the expected advances in specific energy for different types of battery [10].
The average lifetime of batteries in EVs tends to be approximately 8 to 10 years, which is defined by a 20–30% degradation in battery capacity compared to its initial capacity [3]. In practice, the lifetime of a battery is reduced due to the high-power profile of the vehicle during acceleration and braking, which can be more than ten times higher than the average power. To overcome this drawback, not only innovation in battery technology to increase the specific energy is required, but also advanced control and optimization techniques are necessary. In this context, the use of a reliable model of the battery becomes a key factor when improving the techno-economic efficiency of the system. The Battery Management System (BMS) is responsible for the correct management of the energy stored in the batteries, and indirectly for the safety of the passengers of the vehicle [11].
The choice of the adequate battery model according to the purpose or application for which it will be used is essential. Some of the most common applications are battery design, their characterization, state of charge (SoC) or state of health (SoH) estimation, and thermal analysis or mechanical stress studies in specific applications. Depending on the field of study, there are several battery models, which are gathered in Table 1.
Models usually known as electrochemical models, as presented in [12], are aimed at describing the electrochemical reactions that occur within cell level. Thus, they are the most detailed models, but also the costliest in terms of developing and suiting. Besides, they require many computing resources.
Electrical models, however, are commonly based on an equivalent circuit to reproduce the effects of the batteries under operation, being faster than electrochemical ones by neglecting some high levels of detail.
Mathematical or analytical models depict operation effects by complex differential equations of second or greater order. Considering that many parameters are not necessary, they are sufficiently fast. However, these models do not have physical correspondence, so they are not appropriate either. Abstract models use several analysis tools such as artificial intelligence to predict the batteries performance. Accuracy depends majorly on data amount at training stage. Interpretability is practically impossible since only experimental results are used.
Combined models are composed by several sub-models to depict effects of variables from different nature. Thermoelectric models stand out within these models as their effects are related to each other.
Thus, electrical and combined models are predominant in electromobility studies, as electrochemical ones are too complex, and mathematical ones do not have physical correspondence. Therefore, they are not suitable for real-time control. In this sense, this paper focuses on the analysis and description of the most relevant existing electrical models that are suitable to be implemented in a BMS of an EV. In this paper, simple models, Thevenin models, partnership for a new generation of vehicles (PNGV) models, impedance models, and runtime models are considered.
Simple models are the most basic models, which are only appropriate for steady-state analysis, Thevenin and PNGV models are suitable for transient state simulation, Impedance models focus on AC behavior, and runtime models depict DC behavior while runtime of the battery is predicted. These applications are collected in Table 2 [13].
This paper is organized as follows: Section 2 analyzes several electrical models currently applied to Li-Ion batteries within electromobility. These models are subcategorized as simple models, Thevenin models, PNGV models, and Noshin model, arranged from the simplest, which considers only ideal elements, to the most complex, which could be a third-order model or a model considering a large number of elements. Section 3 explains impedance models, which can also be useful for other models’ parameter definition. Section 4 introduces runtime models, and V-I performance of the models is explained in Section 5. Finally, conclusions are shown in Section 6.
2. Equivalent Circuit Models
In this section, several equivalent circuit models (ECMs) available in the literature that are used in electromobility applications are described, arranged from simpler to more complex.
2.1. Simple Models
2.1.1. Ideal Battery Model
The first electrical model of a battery was developed in PSpice by Hageman in [14], which allows the simulation of Pb-acid, nickel-cadmium, and alkaline batteries. Later, Gold developed a similar model for Li-Ion models with errors of up to 12% [15].
An ideal model is the simplest model, with only a constant voltage source and neglecting other internal parameters. Terminal voltage matches the open-circuit voltage in every moment. Thus, this model does not consider voltage variation under load variation, SoC changes, or any other transient phenomena.
General specifications of an ideal battery are given in capacity (Ah) and voltage (V). Stored amount of energy is given by their product (Wh). This model maintains a constant voltage independently from other factors until it is fully discharged, when the voltage drops to zero [16]. However, in real batteries, voltage is affected by the SoC, since the capacity lowers when the load is increased.
Results of this model are acceptable for steady-state analyses where the battery performance is not the scope. The most common application is the feeding of power devices, usually converters.
An improvement of this model could be the replacement of the voltage source by a SoC-controlled voltage source. Thus, voltage is varied depending on the SoC based on a look-up table, which improves the accuracy while its simplicity is maintained.
2.1.2. Simple or Linear Battery Model
The simple model, linear battery model, or internal resistance model (IR) [17], contains a resistance Rint, apart from the voltage source, Voc (Figure 3).
The resistance Rint represents the energy losses, which make batteries heat up. Terminal voltage VT matches up with open-circuit voltage VOC only when it is in open circuit. However, when a load is connected, this voltage is given by:
Therefore, this model can emulate the instantaneous voltage drop when the circuit is completed, which is directly proportional to the circulating current. The higher the internal resistance in a battery, the greater the losses, and the lower the available maximum power.
The main drawback of this model, as well as of the previous one, is that neither the terminal voltage VT nor the open-circuit voltage Voc vary according to the SoC or others, as this can be electrolyte concentration. Resistance is constant too, independent from SoC or temperature. In this sense, it has to be noted that, in a real battery, the resistance is highly dependent on battery type, SoC and SoH state, and temperature (Figure 4 [18,19]). Generally, resistance increases when SoC lowers (Figure 4a), SoH lowers (degradation increases) (Figure 4b), and temperature lowers (Figure 4c).
Applicability of this model is restricted to studies where the battery operates at the middle range of SoC, where the internal resistance and temperature are almost constant. At low SoC, however, resistance varies too much. Available energy to be released, that is, capacity, cannot be depicted, and it is supposed to be unlimited [20]. The most common application is the feeding of power devices as converters or inverters [21].
Within EVs applications, this model is used in maintenance studies, as battery preheating at cold environment [22], and dynamic simulations of hybrid and electric vehicles. Dynamic simulation can be improved by considering a SoC-controlled voltage source [23,24].
Resistance from Figure 3, Rint, differs in charging or discharging mode, as shown in Figure 5a. Therefore, different resistances can be considered for better accuracy, RC for charging and Rd for discharging, as shown in Figure 5.
Diodes shown in Figure 5 are supposed to be ideal and are aimed at activating the correct resistance. Thus, terminal voltage is given by:
When charging, the diode associated with Rc is directly polarized and will conduct, but the diode associated with Rd is reversely polarized, avoiding current circulation. When discharging, Rd will be activated and Rc blocked, so that only one resistance will be activated in each process. This model has the same drawbacks as the previous one, but improves accuracy, and is used in hybrid and EVs [25].
2.1.3. Enhanced Simple Battery Model
Figure 6 shows the enhanced simple battery model, which considers the effect of the SoC in the resistance.
In this model, terminal voltage is given by:
where internal resistance can be expressed as [26]:
where R0, SoC, and k are initial internal resistance, current SoC, and a capacity factor calculated from manufacturer load curves, respectively. The current SoC is given as:
where A is the equivalent demanded current, h is the operation time in hours, and C10 is capacity for 10 hours operation at reference temperature. Since actual capacity is dependent on the current, it also will be the error.
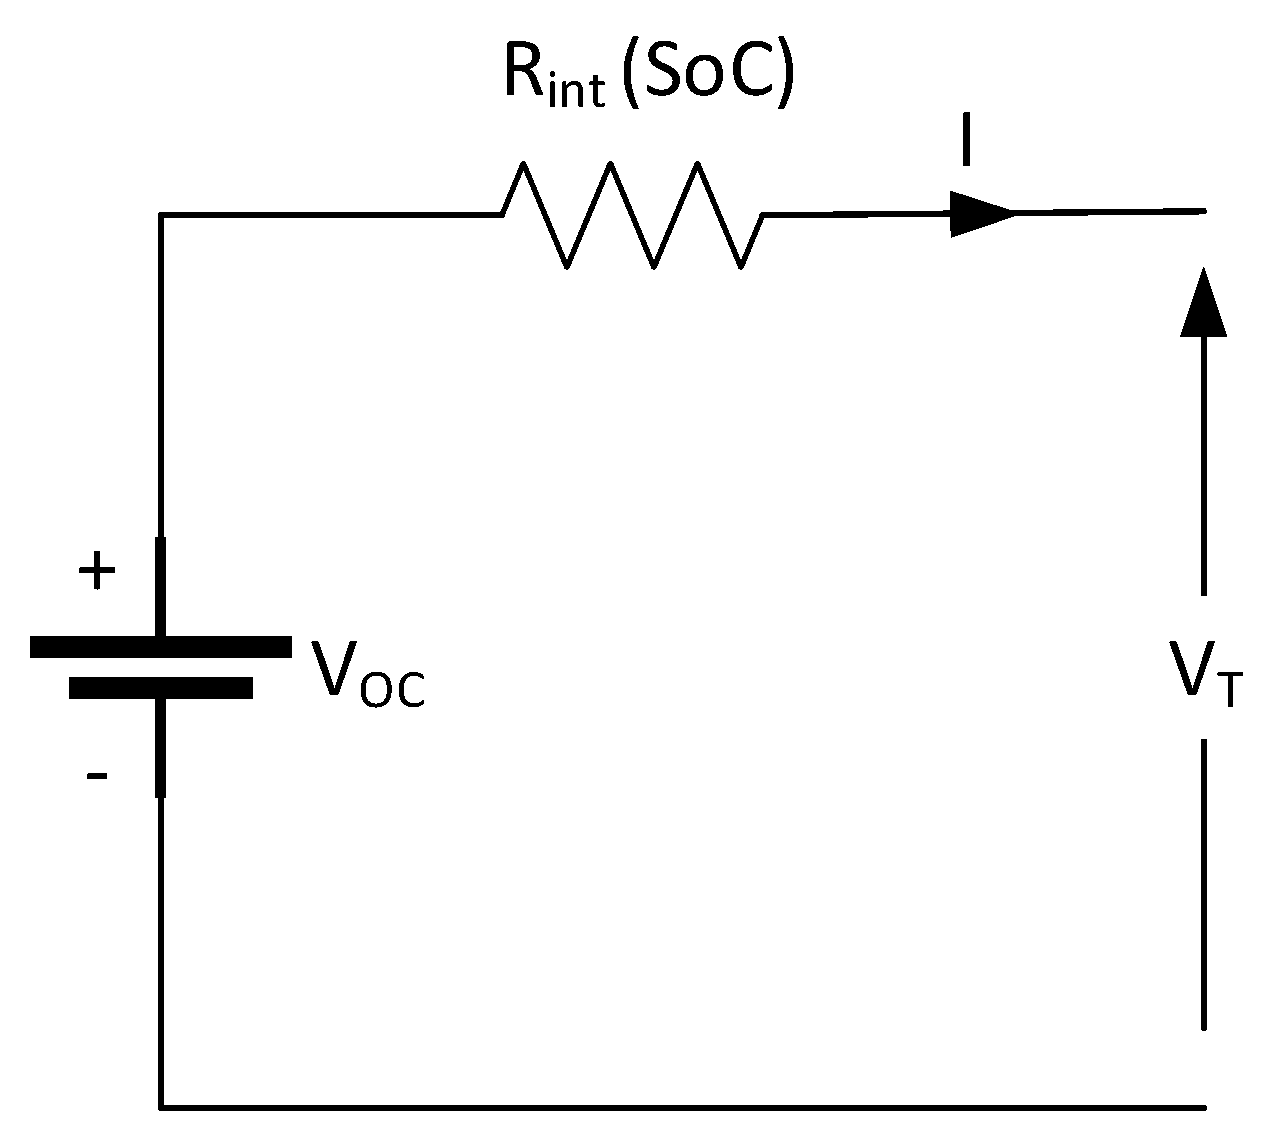
However, some authors change the internal resistance calculation method while maintaining the same schematic model, but including a resistance with non-linear behavior, given as:
where Rint (SoC) is the variable internal resistance, k is a polarization constant, and SoC is the state of charge.
This model has been historically used by several manufacturers for batteries monitoring purposes in stationary stages, as well as for traction simulation in Pb-acid batteries [27]. Additionally, it can also be applied to lithium batteries. Among drawbacks, it does not reduce capacity when load increases, so it is not valid for dynamic systems or transient states. Although resistance varies, it does not vary as a function of the temperature, which is one of the major drawbacks of EVs.
This model can be improved in case a SoC-controlled voltage source VOC is considered. Real battery VOC variation is shown in Figure 7, which includes the usual hysteresis effect between charging and discharging.
Terminal voltage is given by [29]:
where VOC (SoC) is the SoC-dependent open-circuit voltage, Rint (SoC) is the SoC-dependent resistance, I is the current, VO is the open-circuit voltage when the battery is fully charged, Rint is the internal resistance when the battery is fully charged, SoC is the state of charge, and k and kR are empirically obtained constants.
Even though this model improves accuracy, it is very limited in terms of energy released, temperature consideration, and is not valid for simulation of transient states. To improve the accuracy, temperature and SoH can be considered in the voltage source and resistance, but only for steady-state analyses [17].
2.1.4. Voltage Sources-Based Model
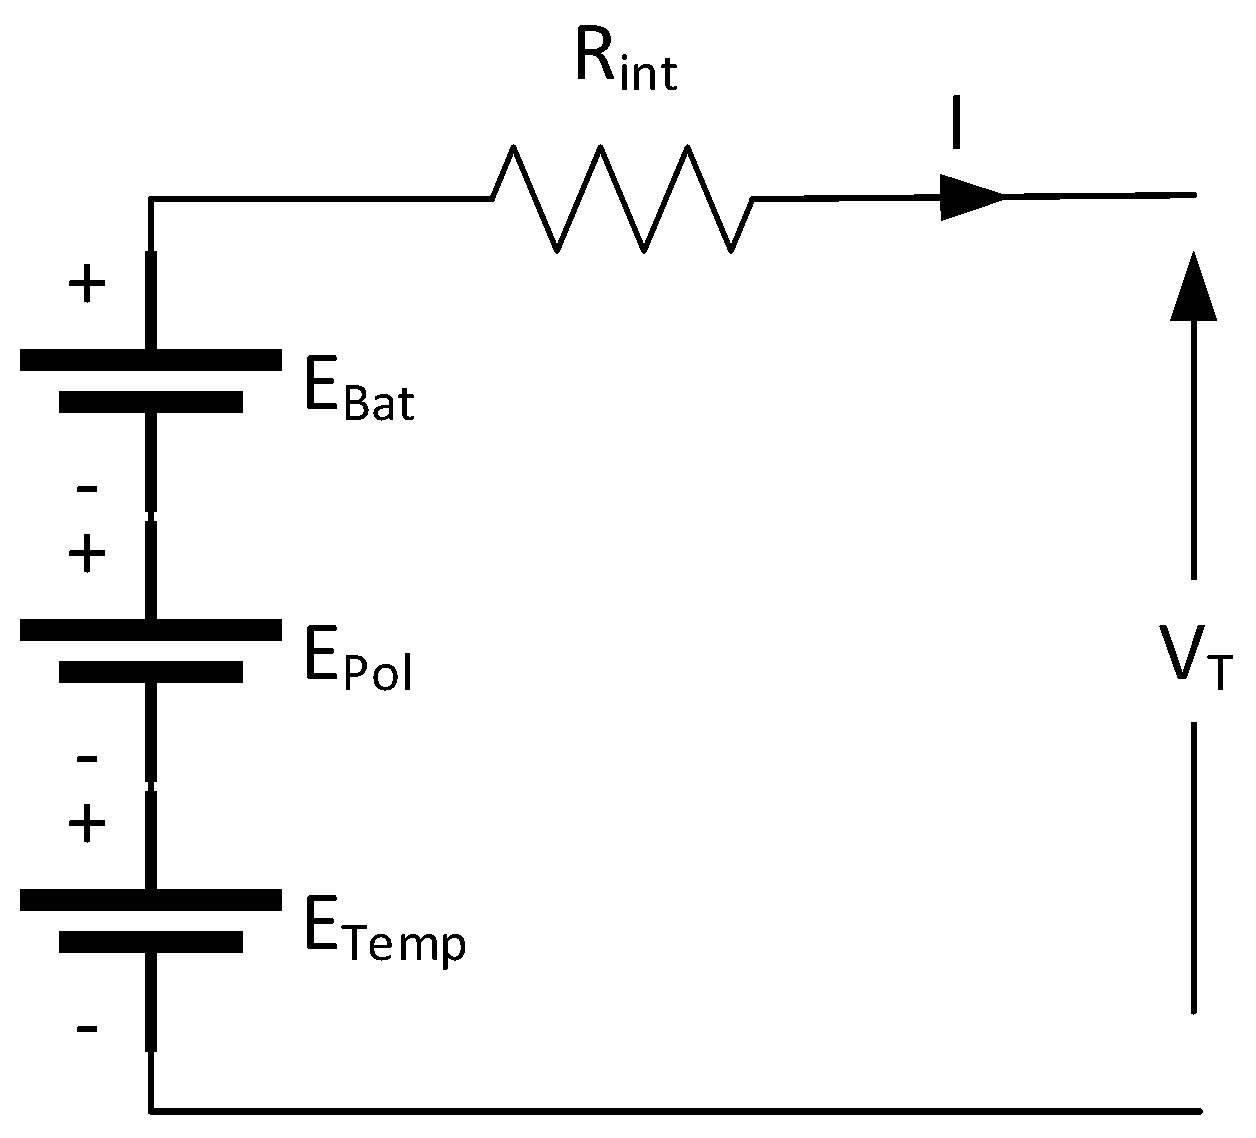
The voltage sources-based model is based on the connection of several voltage sources, which represent different phenomena. The general scheme for this model is shown in Figure 8.
The terminal voltage VT is given by:
where EBat is a voltage source representing cells internal voltage, EPol is a voltage source representing polarization effect caused by the active material, ETemp is a voltage source representing temperature effect, Rint is the internal resistance, and I is the current.
Each voltage source value is experimentally determined by the relation between each effect and voltage, at each SoC value. This model can be applied to Pb-acid, Ni-Cd, and Li-Ion batteries, and is used in EV and hybrid vehicles driving simulation [30].
On one hand, the accuracy of this model relies on the accuracy of the relation specified in each voltage source. On the other hand, there is an inherent error by the consideration of each variable separately instead of considering them in a coupled manner.
2.1.5. Resistor-Capacitor (RC) or Dynamic Model
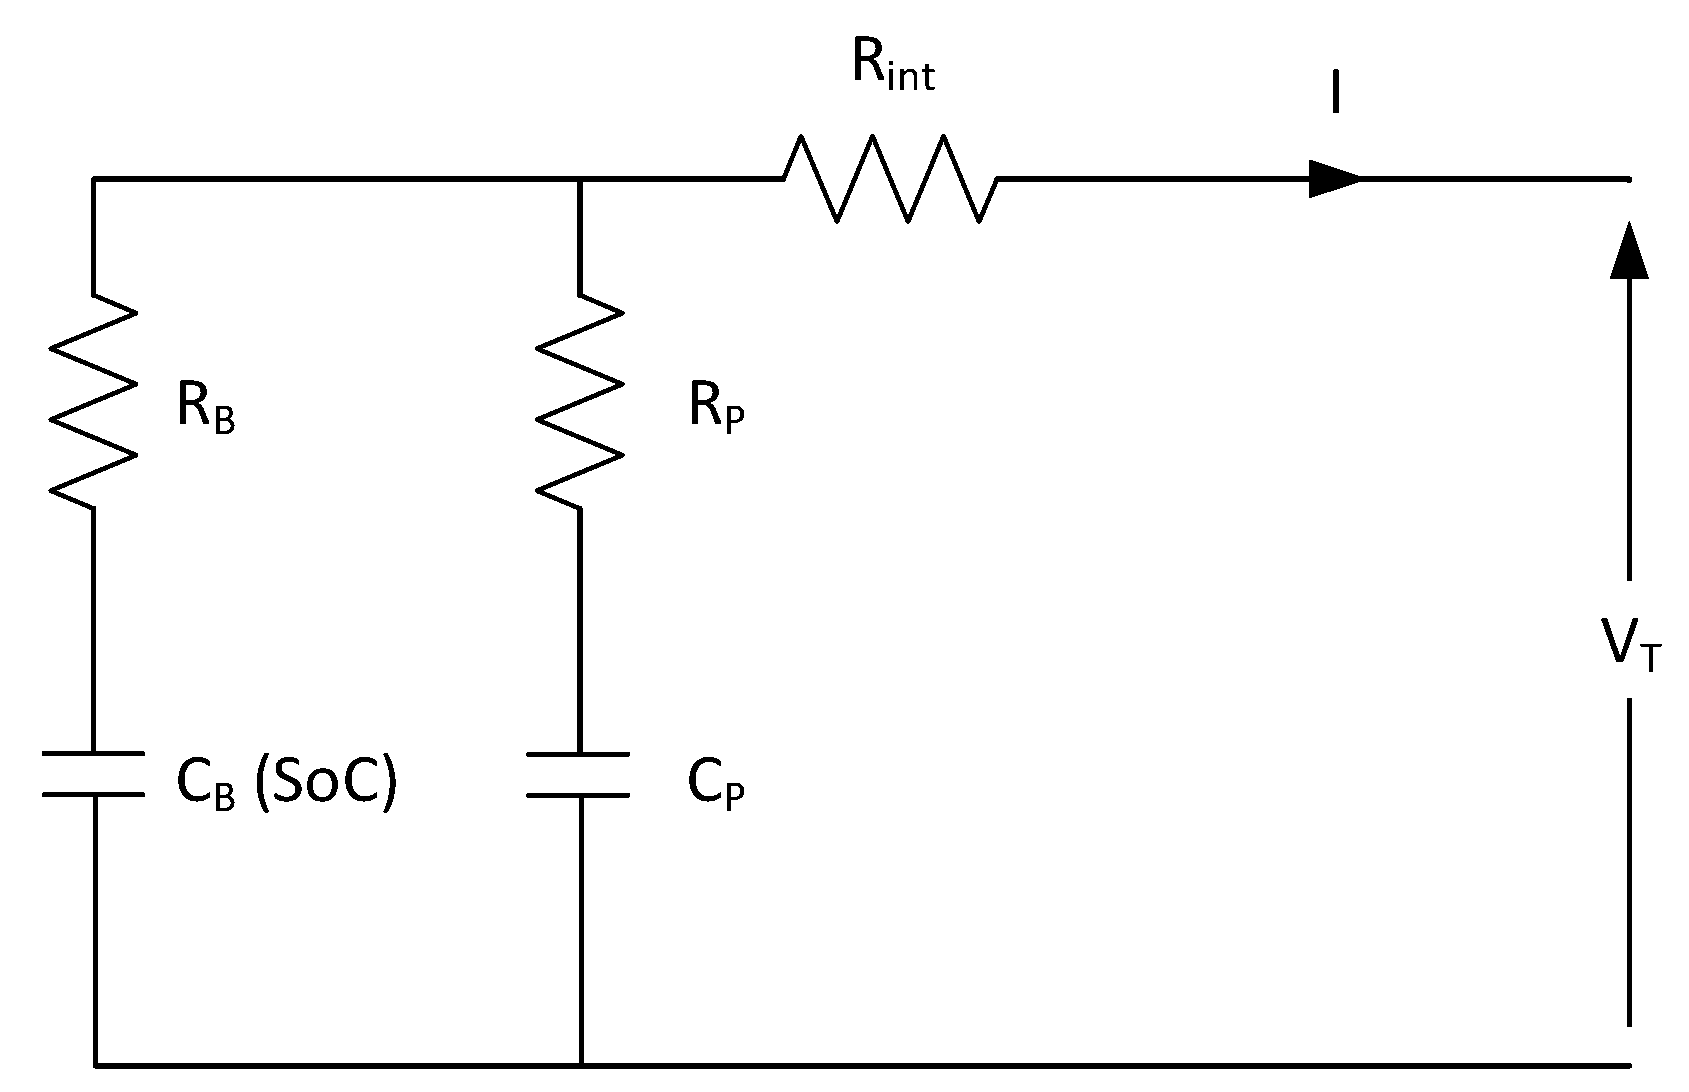
The RC or dynamic model is shown in Figure 9. It was first developed in 2000 by SAFT Battery Company for the NREL.
This model includes a capacitor CB, which represents the stored capacity, a series resistance RB, which represents the propagation effect, a capacitor CP, and a current dependent resistance RP, which represent the polarization and diffusion effects, respectively, and an internal resistance Rint. The value of CP is very small, while the value of CB usually takes very large values. Generally, the self-discharge resistance is neglected in Li-Ion batteries [31,32]. SoC value is represented in the voltage variation through the capacitor CB. The equations that govern its operation are:
2.2. Thevenin-Based Battery Models
None of the models presented above are valid for transient state simulations. In order to simulate transients, some phenomena as polarization must be considered. In this subsection, some of the most used models for transient state simulation are explained.
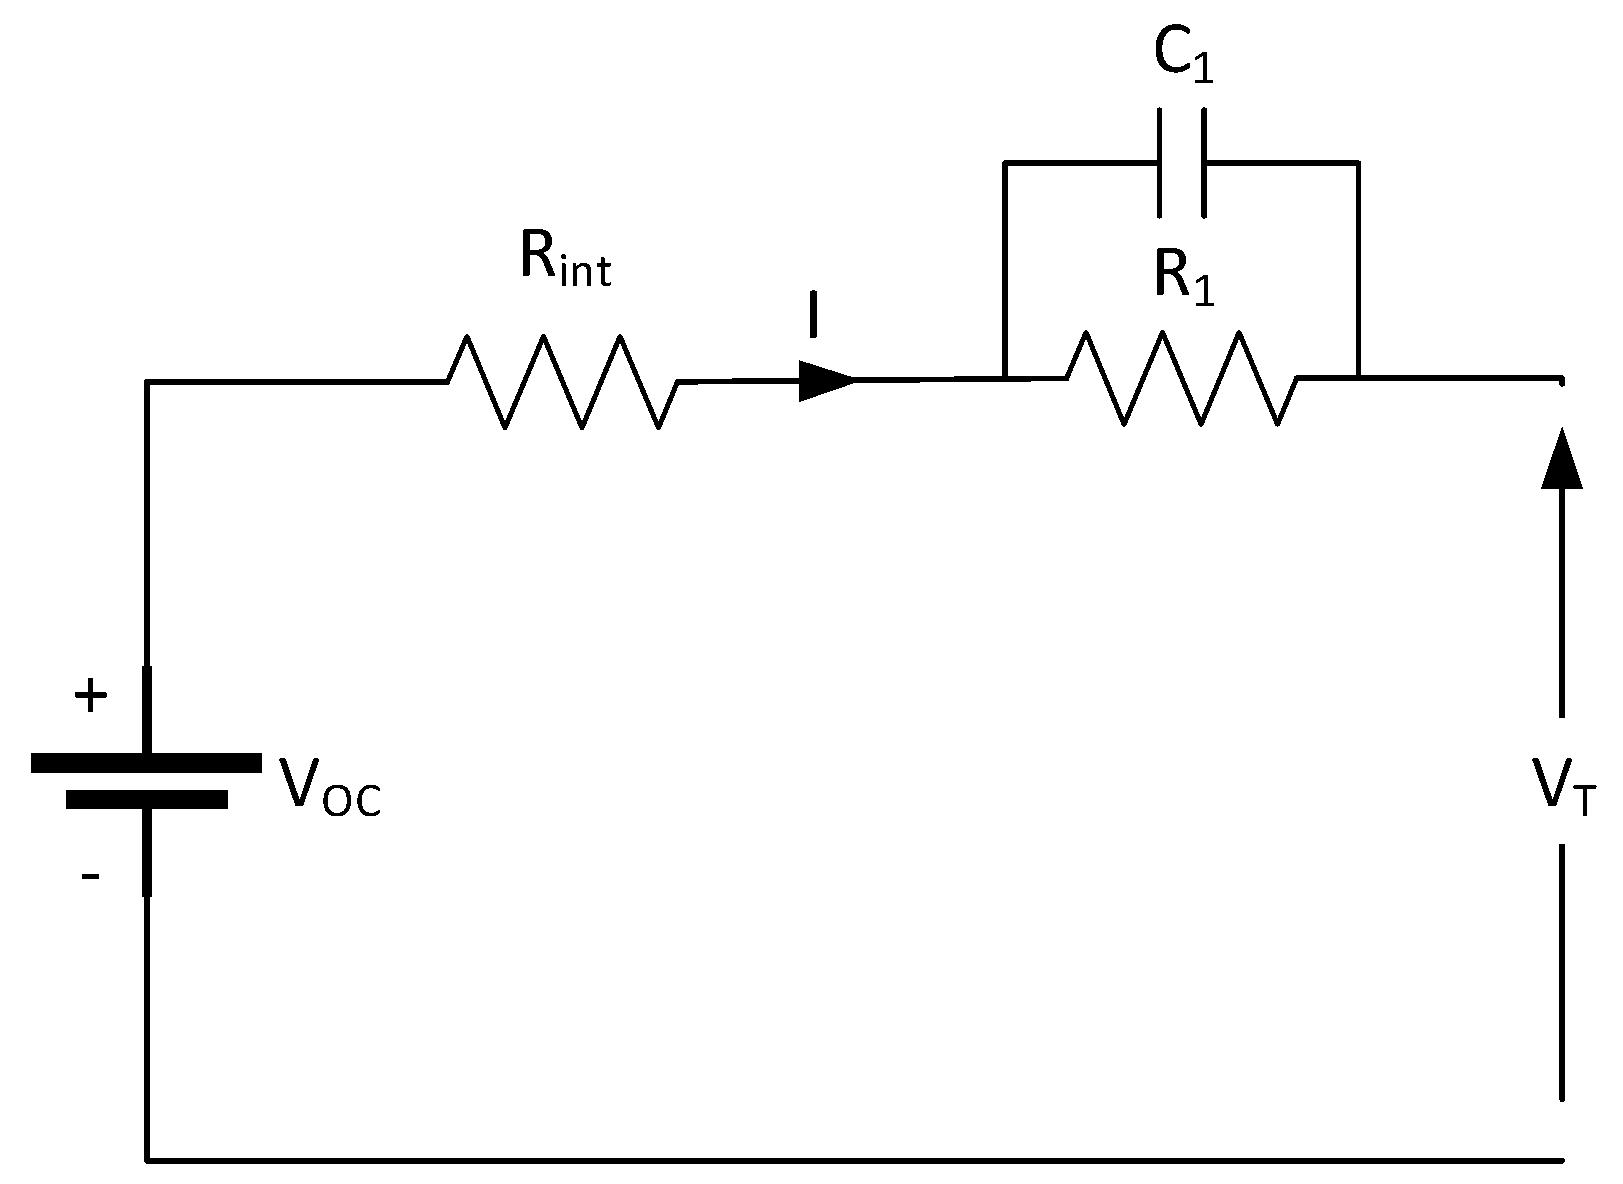
2.2.1. (First-Order) Thevenin Model
The simplest Thevenin model, commonly called first order or one time constant (OTC) [17], is composed by a voltage source VOC, an internal resistance Rint, and a RC pair (R1 and C1) representing the capacitance effect between two parallel plates and the contact resistance. This model is shown in Figure 10.
The aim of adding a RC pair to the simple linear model is to represent transient phenomena. The main drawback of the Thevenin model is that all the parameters are considered to be constant. However, it is known that parameters are dependent on SoC, C-Rate, temperature, SoH, etc.
An improvement for transient state simulation can be made by considering SoC in the voltage source VOC, that is, the open-circuit voltage VOC is related to the SoC of the cell. Among classic applications of this model are dynamic voltage resistor (DVR) [36] with Pb-acid batteries, but it can also be used in Li-Ion batteries.
An application of this model can be found in [32], where authors present a SoC estimation method for an LCO battery. The self-discharge resistance is neglected, as these losses are minimum in Li-Ion technology (2–10% per month). Authors of [37] apply this model in their stability analysis and SoC estimation method design for a Li-Ion battery. Authors of [38], however, apply this model in their study of batteries parallelization. In [39], in addition to the SoC, a SoH estimation method in Li-Ion cells is also proposed.
Some authors consider the SoC influence in all the parameters, which improves the results accuracy. The authors of [40], for example, apply it in their study of a power train of an EV.
It is also possible to derive this model in the so-called “EP-Thevenin”, as developed in [41]. In this paper, authors consider the polarization effect in a deeper way and validate their model in LIFEPO cells.
Among the characteristics of Li-Ion cells, their low hysteresis effect can be highlighted. In [42], a model development considering this hysteresis effect, as well as the effect of the temperature and the SoC, can be found. Although considering hysteresis improves model accuracy, this type of model is surpassed by the second-order Thevenin model [42].
The correct adjustment of the parameters involved is a key factor when comes to achieve a good precision in the model, for which it is common to use different tests. In [43], a set of charge-discharge pulses are used, and a prediction error-minimization (PEM) algorithm is applied. Although the SoC is discretely estimated online using a neuro-fuzzy inference method, the model obtained is fast enough for real-time operation. In [44], however, moving-window least-square method is used for parameter estimation in frequency domain. In both papers, only SoC is considered, and other relevant variables, such as temperature and aging effects, are neglected in their estimation. In this sense, the models obtained still show some room for improvement.
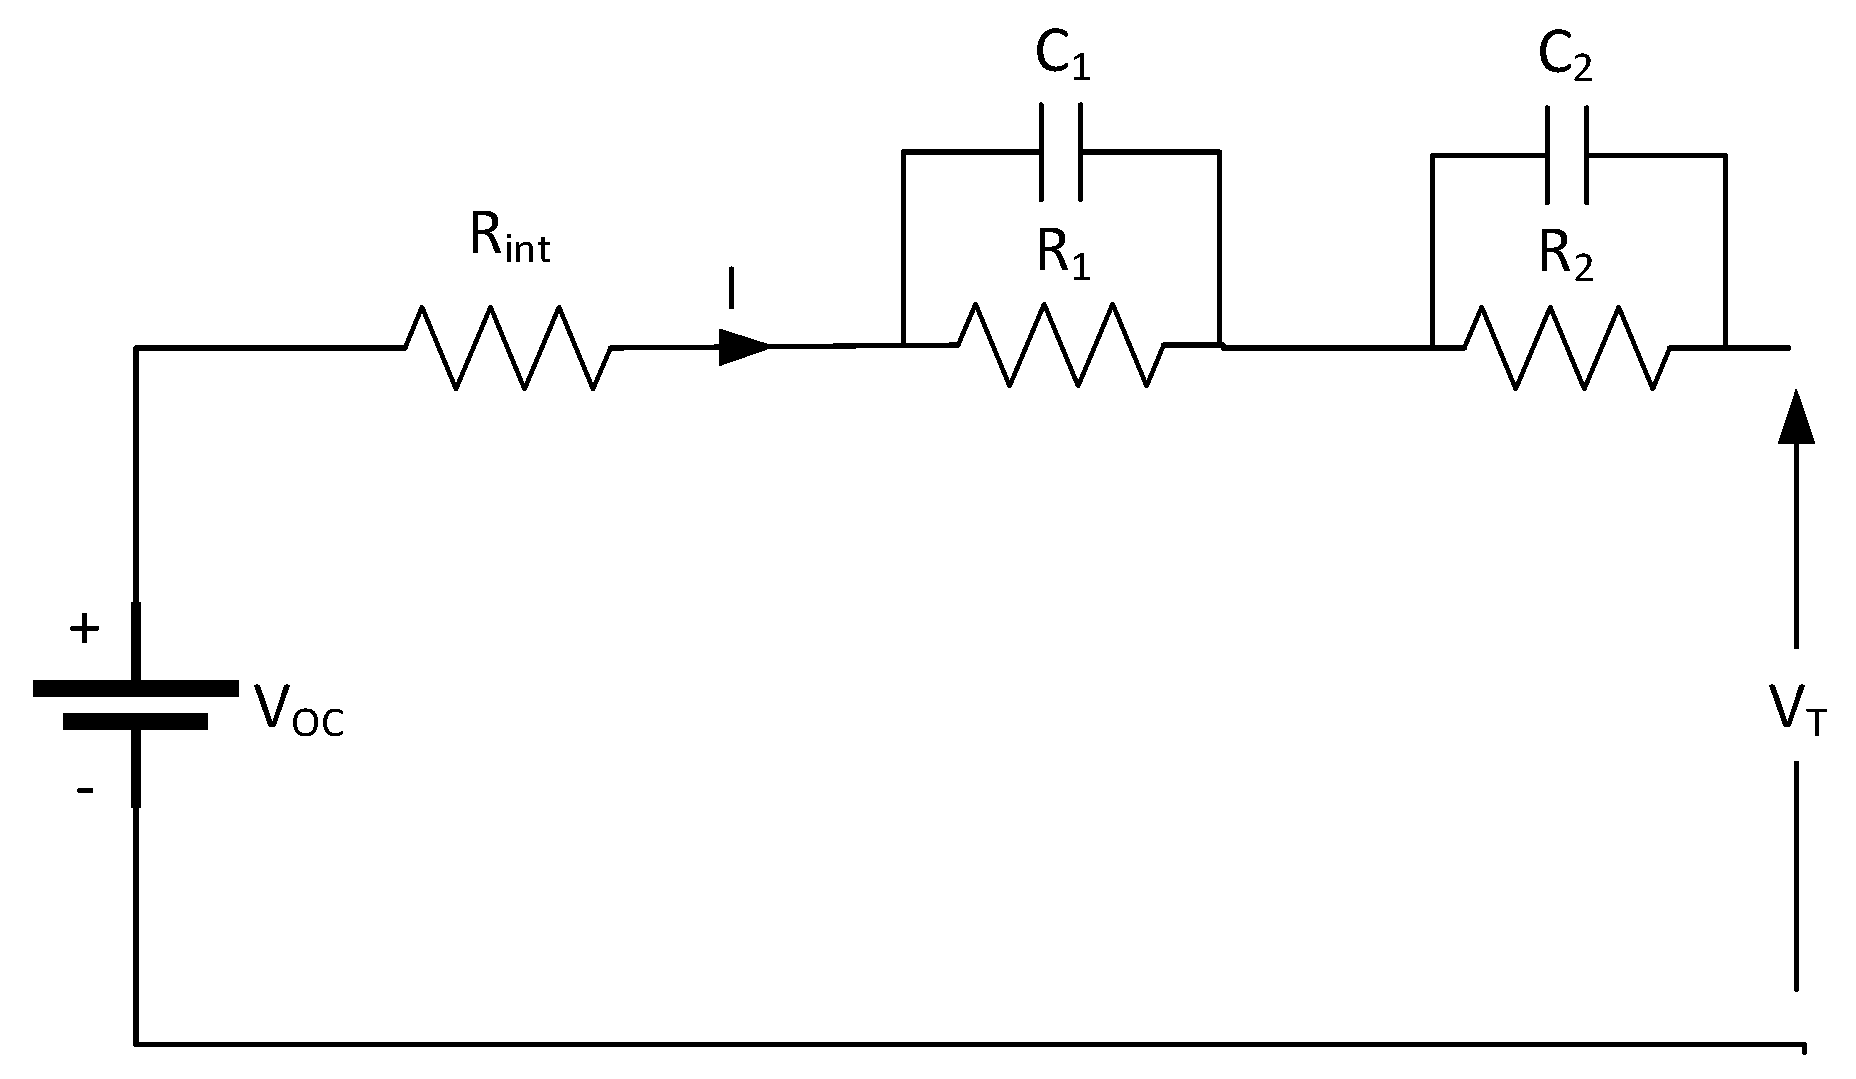
2.2.2. Second-Order Thevenin Model
The second-order model, two time constants (TTC), or dual polarization model, adds a second RC pair (R2 and C2) with a larger time constant (Figure 11) to the previous model. Thus, it is possible to accurately represent the terminal voltage when the current is zero, which was not possible for the OTC [17].
Therefore, the first RC pair has a low time constant for describing short-term transient effects, while the second RC pair has a larger time constant for describing long-term transient effects. These transient effects are related to electrochemical and concentration polarization effects, including charge transfer effect, diffusion, and other factors.
Equations that govern its operation are:
where:
A development of this model can be found in [45], where a second-order Thevenin model is used for capacity fading (CF) characterization. In this, Rint is divided into two elements, the original resistance Rseries, and the resistance Rcycling, which considers the cycling of the cell. All parameters are defined considering the SoC and temperature.
The authors of [46] apply this model in their SoC estimation method based on a combination of the least-squares method and an extended Kalman filter. They only consider the SoC, neglecting temperature and SoH. In [47], however, SoC, SoH, and SoF are considered.
Thevenin models can be used in combination with others to create a multidisciplinary model. The study performed in [48] develops a model considering three aspects: (i) Electrical model, (ii) thermal model, and (iii) degradation model for Li-Ion batteries installed in EVs. Authors apply a modified particle swarm optimization (PSO) for parameter defining and results are validated experimentally. In [49], an online parameter identification method is proposed based on several offline tests. Since temperature is considered to be a great source of error, a temperature compensation is added as an offset. SoH is calculated according to the rate of change of several parameters but is not used for the parameters identification.
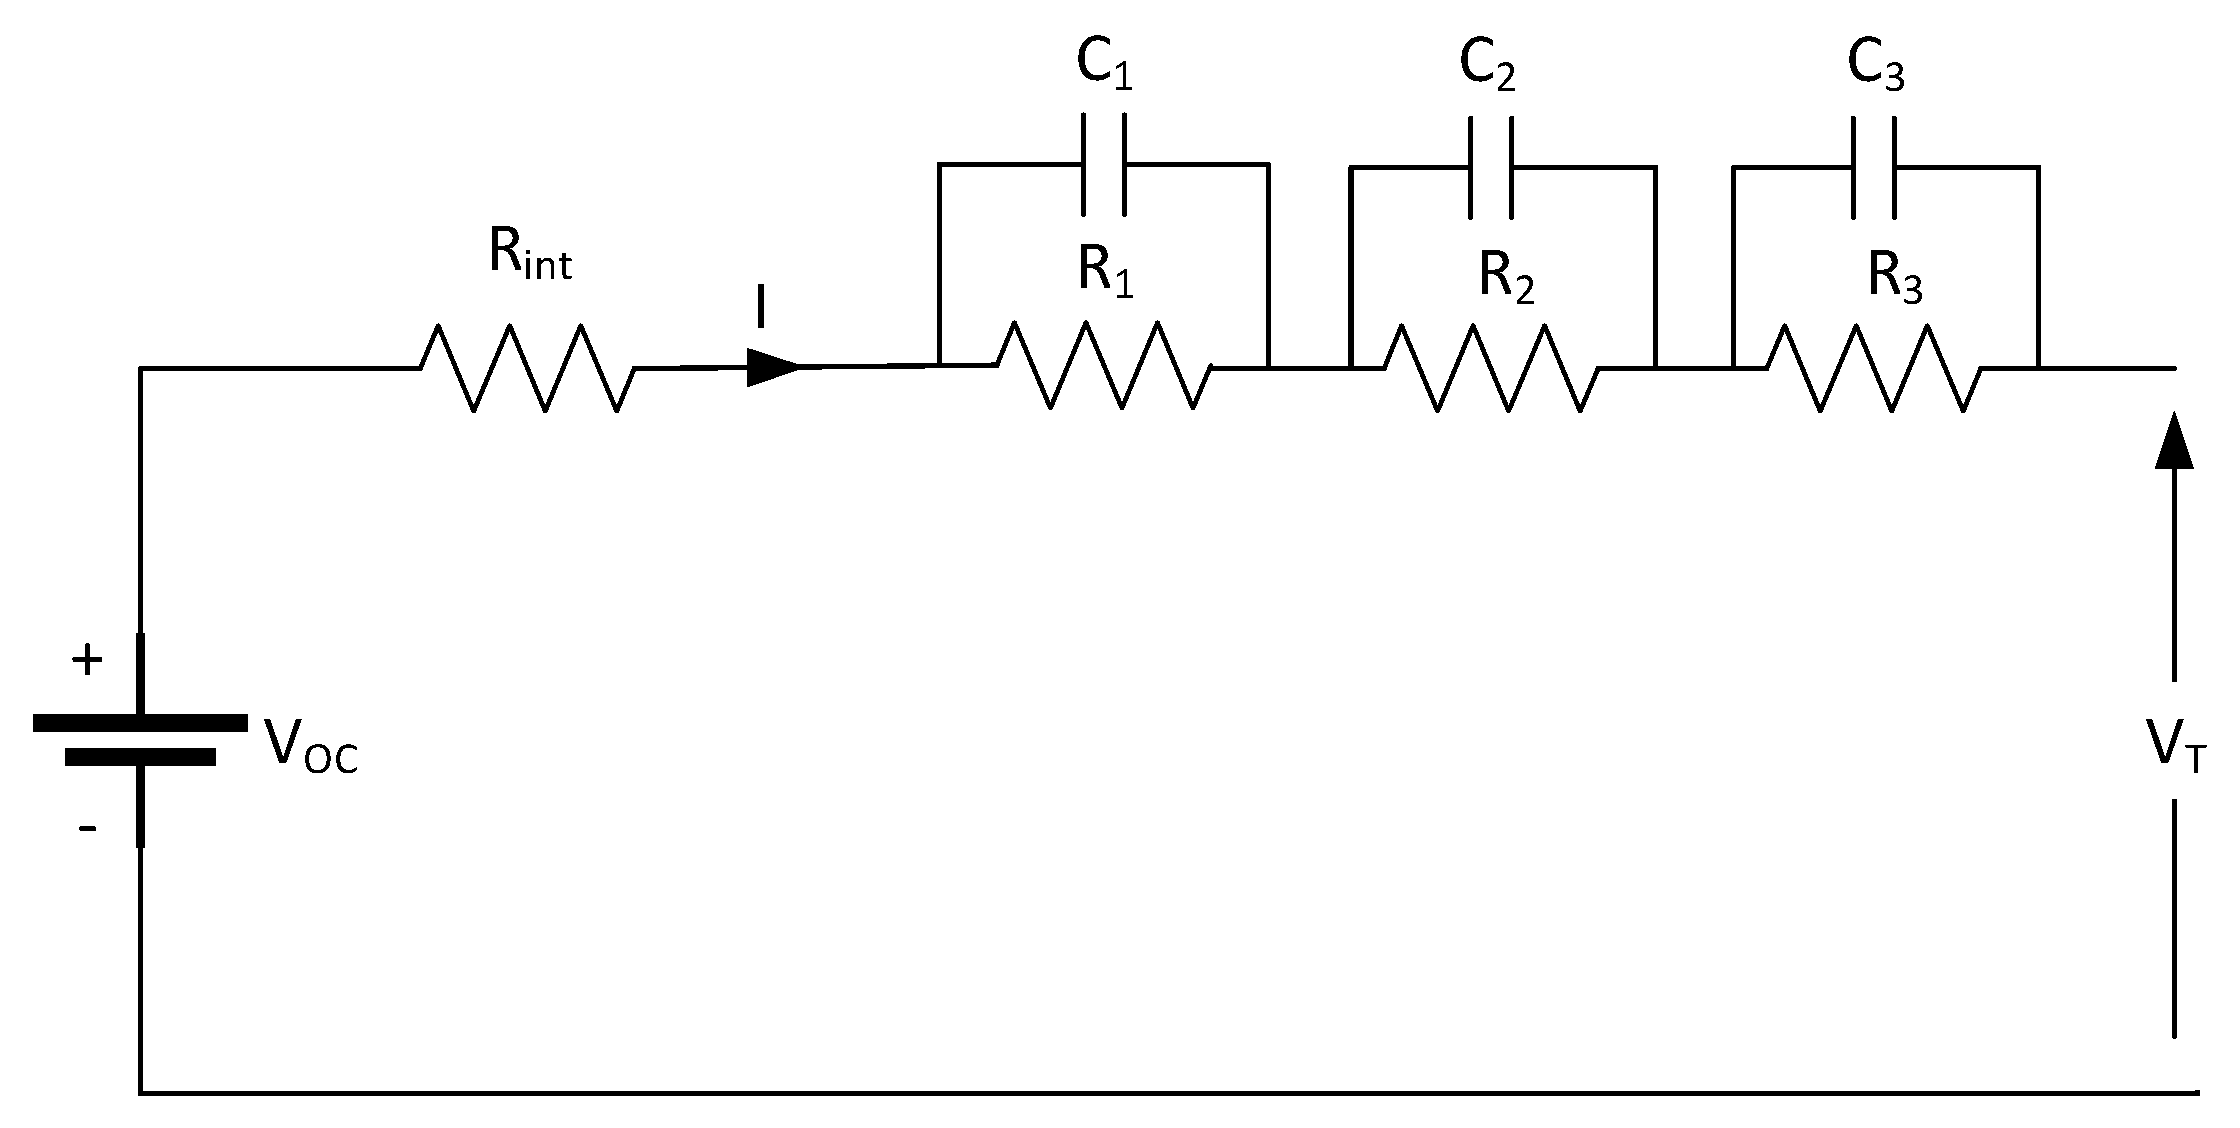
2.2.3. Third-Order Thevenin Model
The third-order Thevenin model is obtained by adding a third RC pair, as can be shown in Figure 12.
Terminal voltage is given by:
where:
The most interesting applications of the third-order Thevenin model within electromobility include the parametric modelling of the battery [50] and the Vehicle-to-Grid (V2G) operation studies [51].
It is possible to increase the complexity of the model for higher accuracy, but the computation cost is not worth the improvement. Therefore, it is not usual to find higher order models, assuming that their application in electromobility would be unfeasible for real-time control.
2.3. PNGV Models
2.3.1. (First-Order) PNGV Model
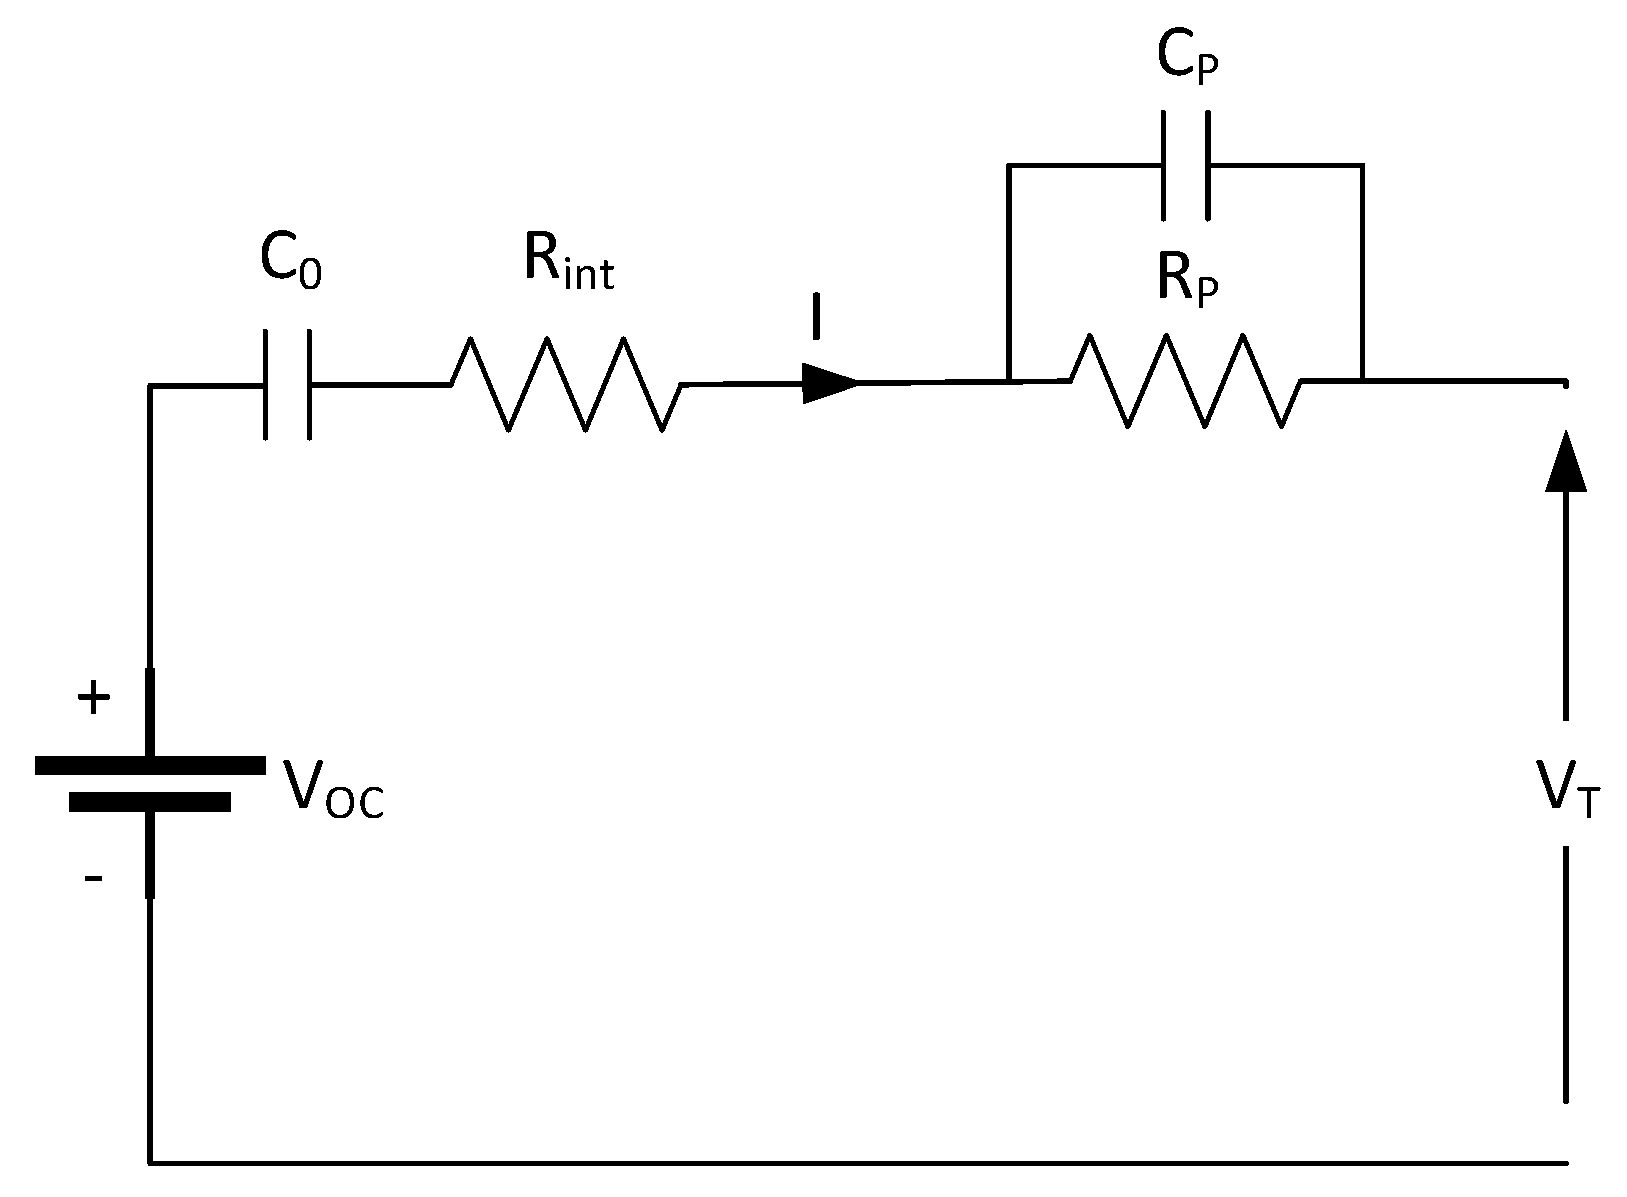
A partnership for a new generation of vehicles (PNGV), composed of a cooperative research program between U.S. government and the three major domestic auto corporations (DaimlerChrysler, Ford, and General Motors), proposed the PNGV model, which is shown in Figure 13.
This model is obtained by adding a series capacitance C0 to the Thevenin model. Here, VOC is the open-circuit voltage source, Rint is the internal ohmic resistance, RP and CP are the polarization resistance and the capacitance given by polarization (due to the gradient concentration), respectively, and C0 is the capacitance that represents the changes in the open-circuit voltage (OCV) due to the integration of the current I.
When the Li-Ion battery is in a charging or discharging state, the integration of current with time causes the SoC to change, which in turn, changes the OCV of the battery, which is represented by the voltage changes on the capacitor C0. In this model, the capacitance C0 not only represents the capacity of the Li-Ion battery, but also its direct current response. In addition, the effect of hysteresis is partly described by C0, thereby compensating some of the deficiencies of the Thevenin model. Parameter identification experiments based on current pulses can easily be conducted, with this model being among the most frequently adopted models.
Terminal voltage in this model is given by:
where:
However, the PNGV standard model does not consider the cycle number or C-rate effects. In turn, polarization effect, polarization, and activation as a whole, are considered. The OCV only depends on total current throughout, which conducts to an increasing error with time [52].
An improvement of this model can be found in [55]. In this, authors have related the parameters to SoC and temperature to improve its accuracy. They also consider the hysteresis effect and the non-linearity when operating under high currents.
2.3.2. Second-Order PNGV Model
The first-order PNGV model, as the first-order Thevenin model, is not very accurate when the cell is fully charged or fully discharged [56]. The PNGV model can be extended to a second-order one, which is shown in Figure 14.
In this model, Rp and Cp represent polarization effects by concentration, as in classic PNGV, but Ra and Ca are added to represent polarization effects by activation. The general equation that governs its operation is:
where:
An advantage of this second-order model is the accuracy improvement in transient and stationary state compared to the first-order PNGV and first-order Thevenin [57], but considering that computational requirements are too high, it is poorly used.
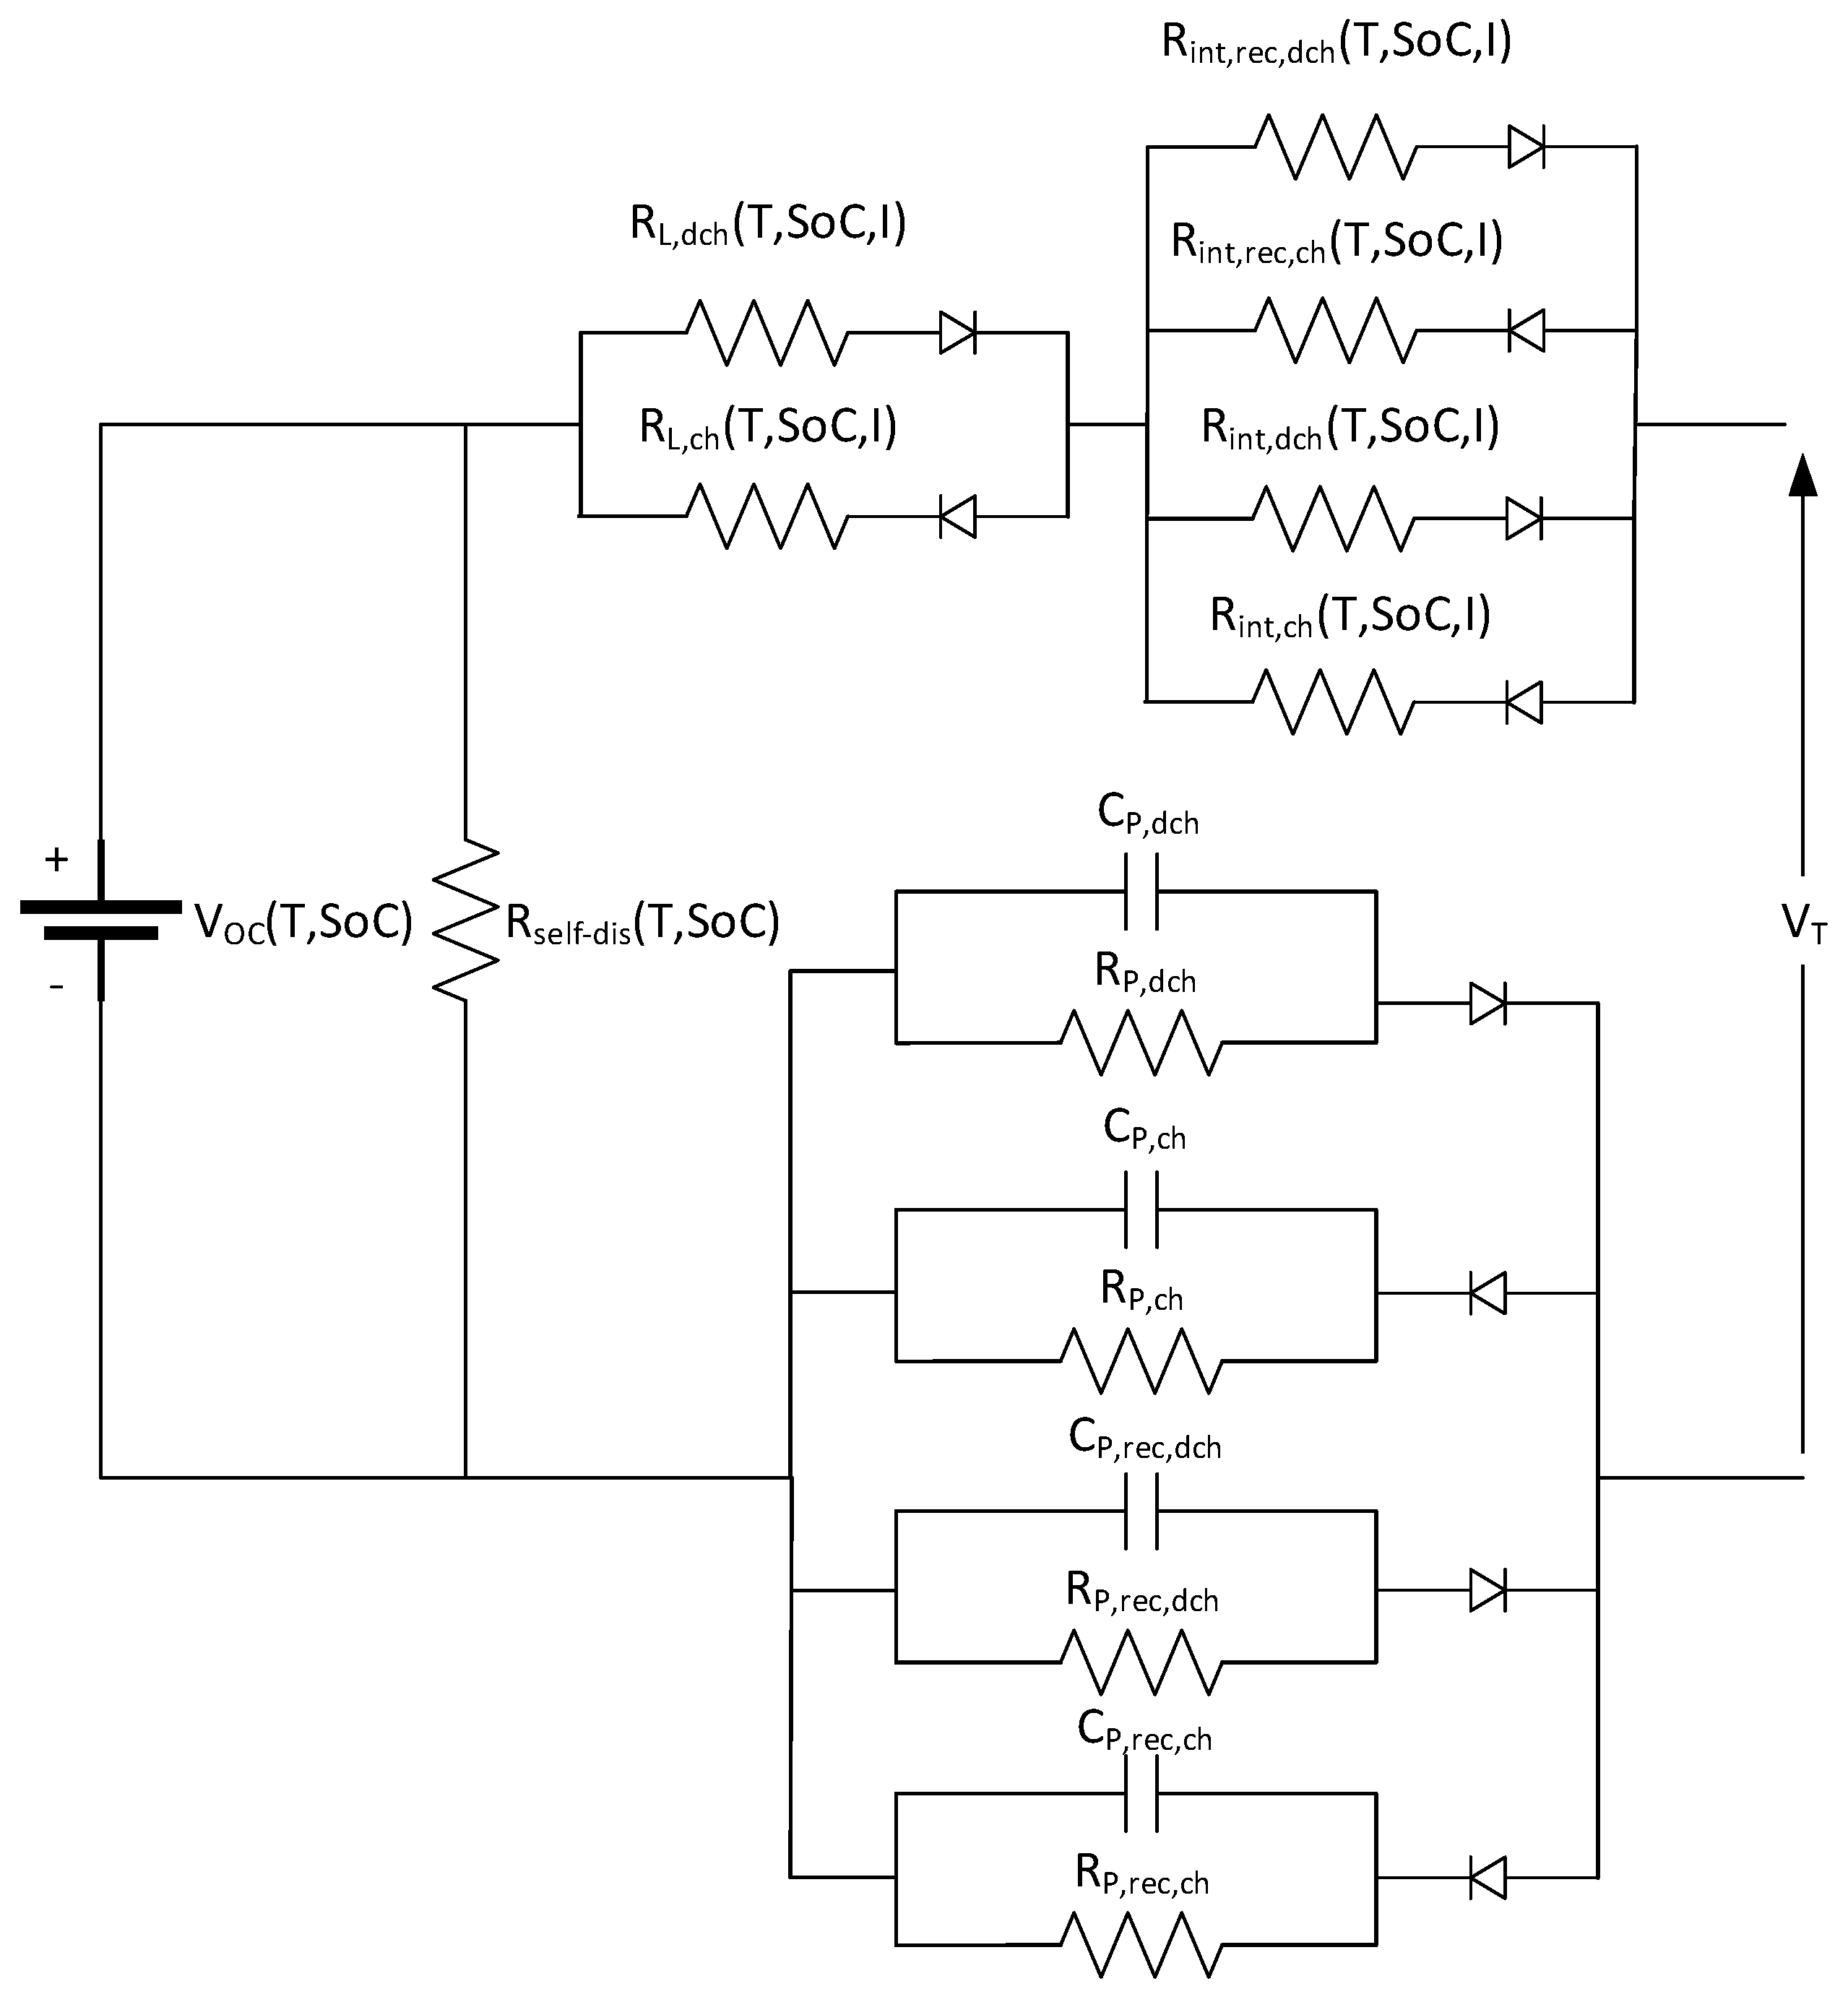
2.4. Noshin’s Battery Models
Generally, battery models do not consider the hysteresis effect. Noshin’s model is a derivation from the Thevenin model, which considers this hysteresis effect and the nonlinearity of the internal parameters.
Parameters of the Thevenin and PNGV models are obtained by a hybrid pulse power characterization (HPPC) test [58] and, generally, making several assumptions, such as same charging and discharging resistances, or same charging and standing resistances. However, these resistances do vary in a real battery, and therefore, it may be necessary to consider all them to obtain a high accuracy model. Figure 15 shows the Noshin’s model electrical scheme.
In this model, the internal resistance during charging Rint,ch, is different from the internal resistance during discharging Rint,dch. Furthermore, RL,ch and RL,dch are added to represent the resistance increase due to the cycle aging, and four RC pairs, which represent the polarization effects, two during cycling and two during resting. Finally, a self-discharge resistance Rself-dis can be considered for more accuracy. A development of this model can be found in [58].
3. Impedance Models
One of the most commonly used techniques for parameter determination in ECM refers to electrochemical impedance spectroscopy (EIS) [59]. The electrochemical impedance is defined as the response of an electrochemical system to an applied voltage. In this technique, an impedance sweep in frequency spectrum is performed, easing a model definition. Therefore, an impedance is got at each frequency value. Test results are graphed in a Nyquist diagram, depicting the resistance in abscise axis and the reactance in y-axis.
In frequency spectrum, it is common to find constant phase elements (CPEs). These elements have a constant phase independent from frequency value and are commonly used in Li-Ion battery modelling [60,61,62,63].
The impedance of a CPE can be expressed in fractional calculus as:
where ZCPE is the impedance of the CPE; s is the Laplace operator; W is the fractional coefficient; and α is the fractional order, 0 ≤ α ≤ 1. Note that the CPE represents a resistance when α = 0 and represents a capacitance when α = 1.
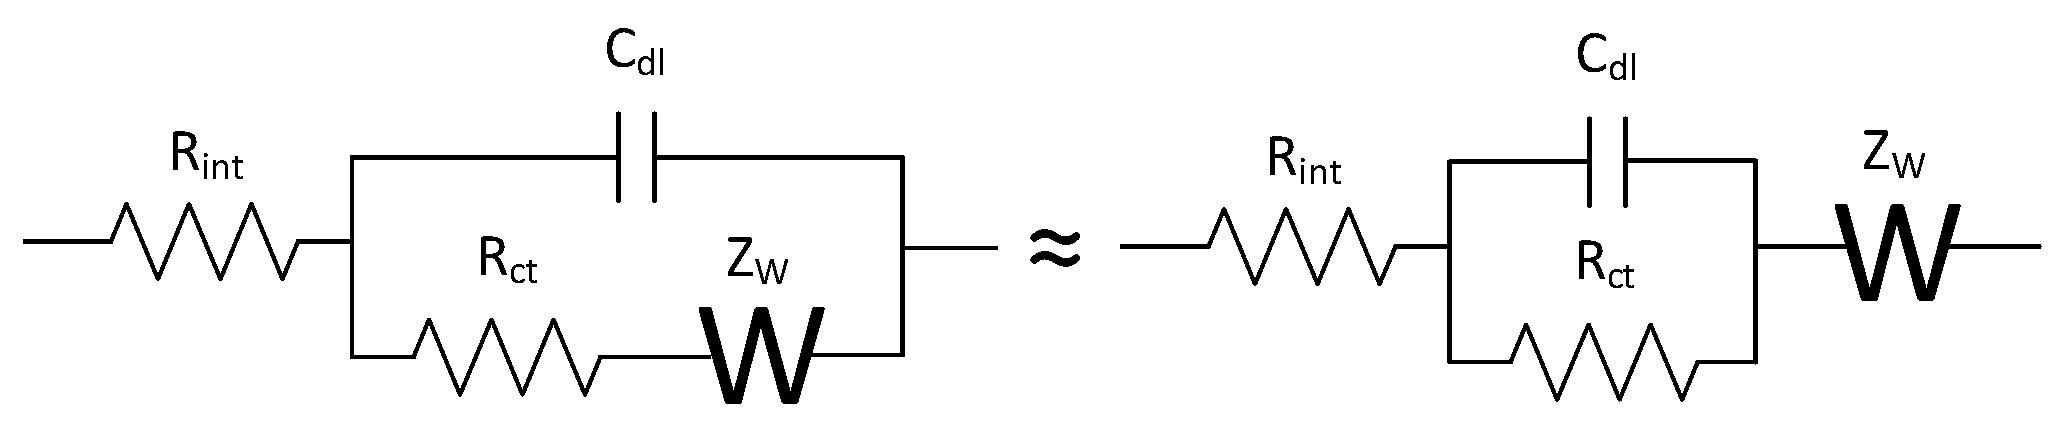
A typical circuit obtained though EIS tests for Li-Ion batteries is the so-called Randle’s Circuit, which is shown in Figure 16. Some authors prefer to draw the Warburg impedance ZW out of the parallel branch, in series with Rint, but the difference between these two models is negligible [64].
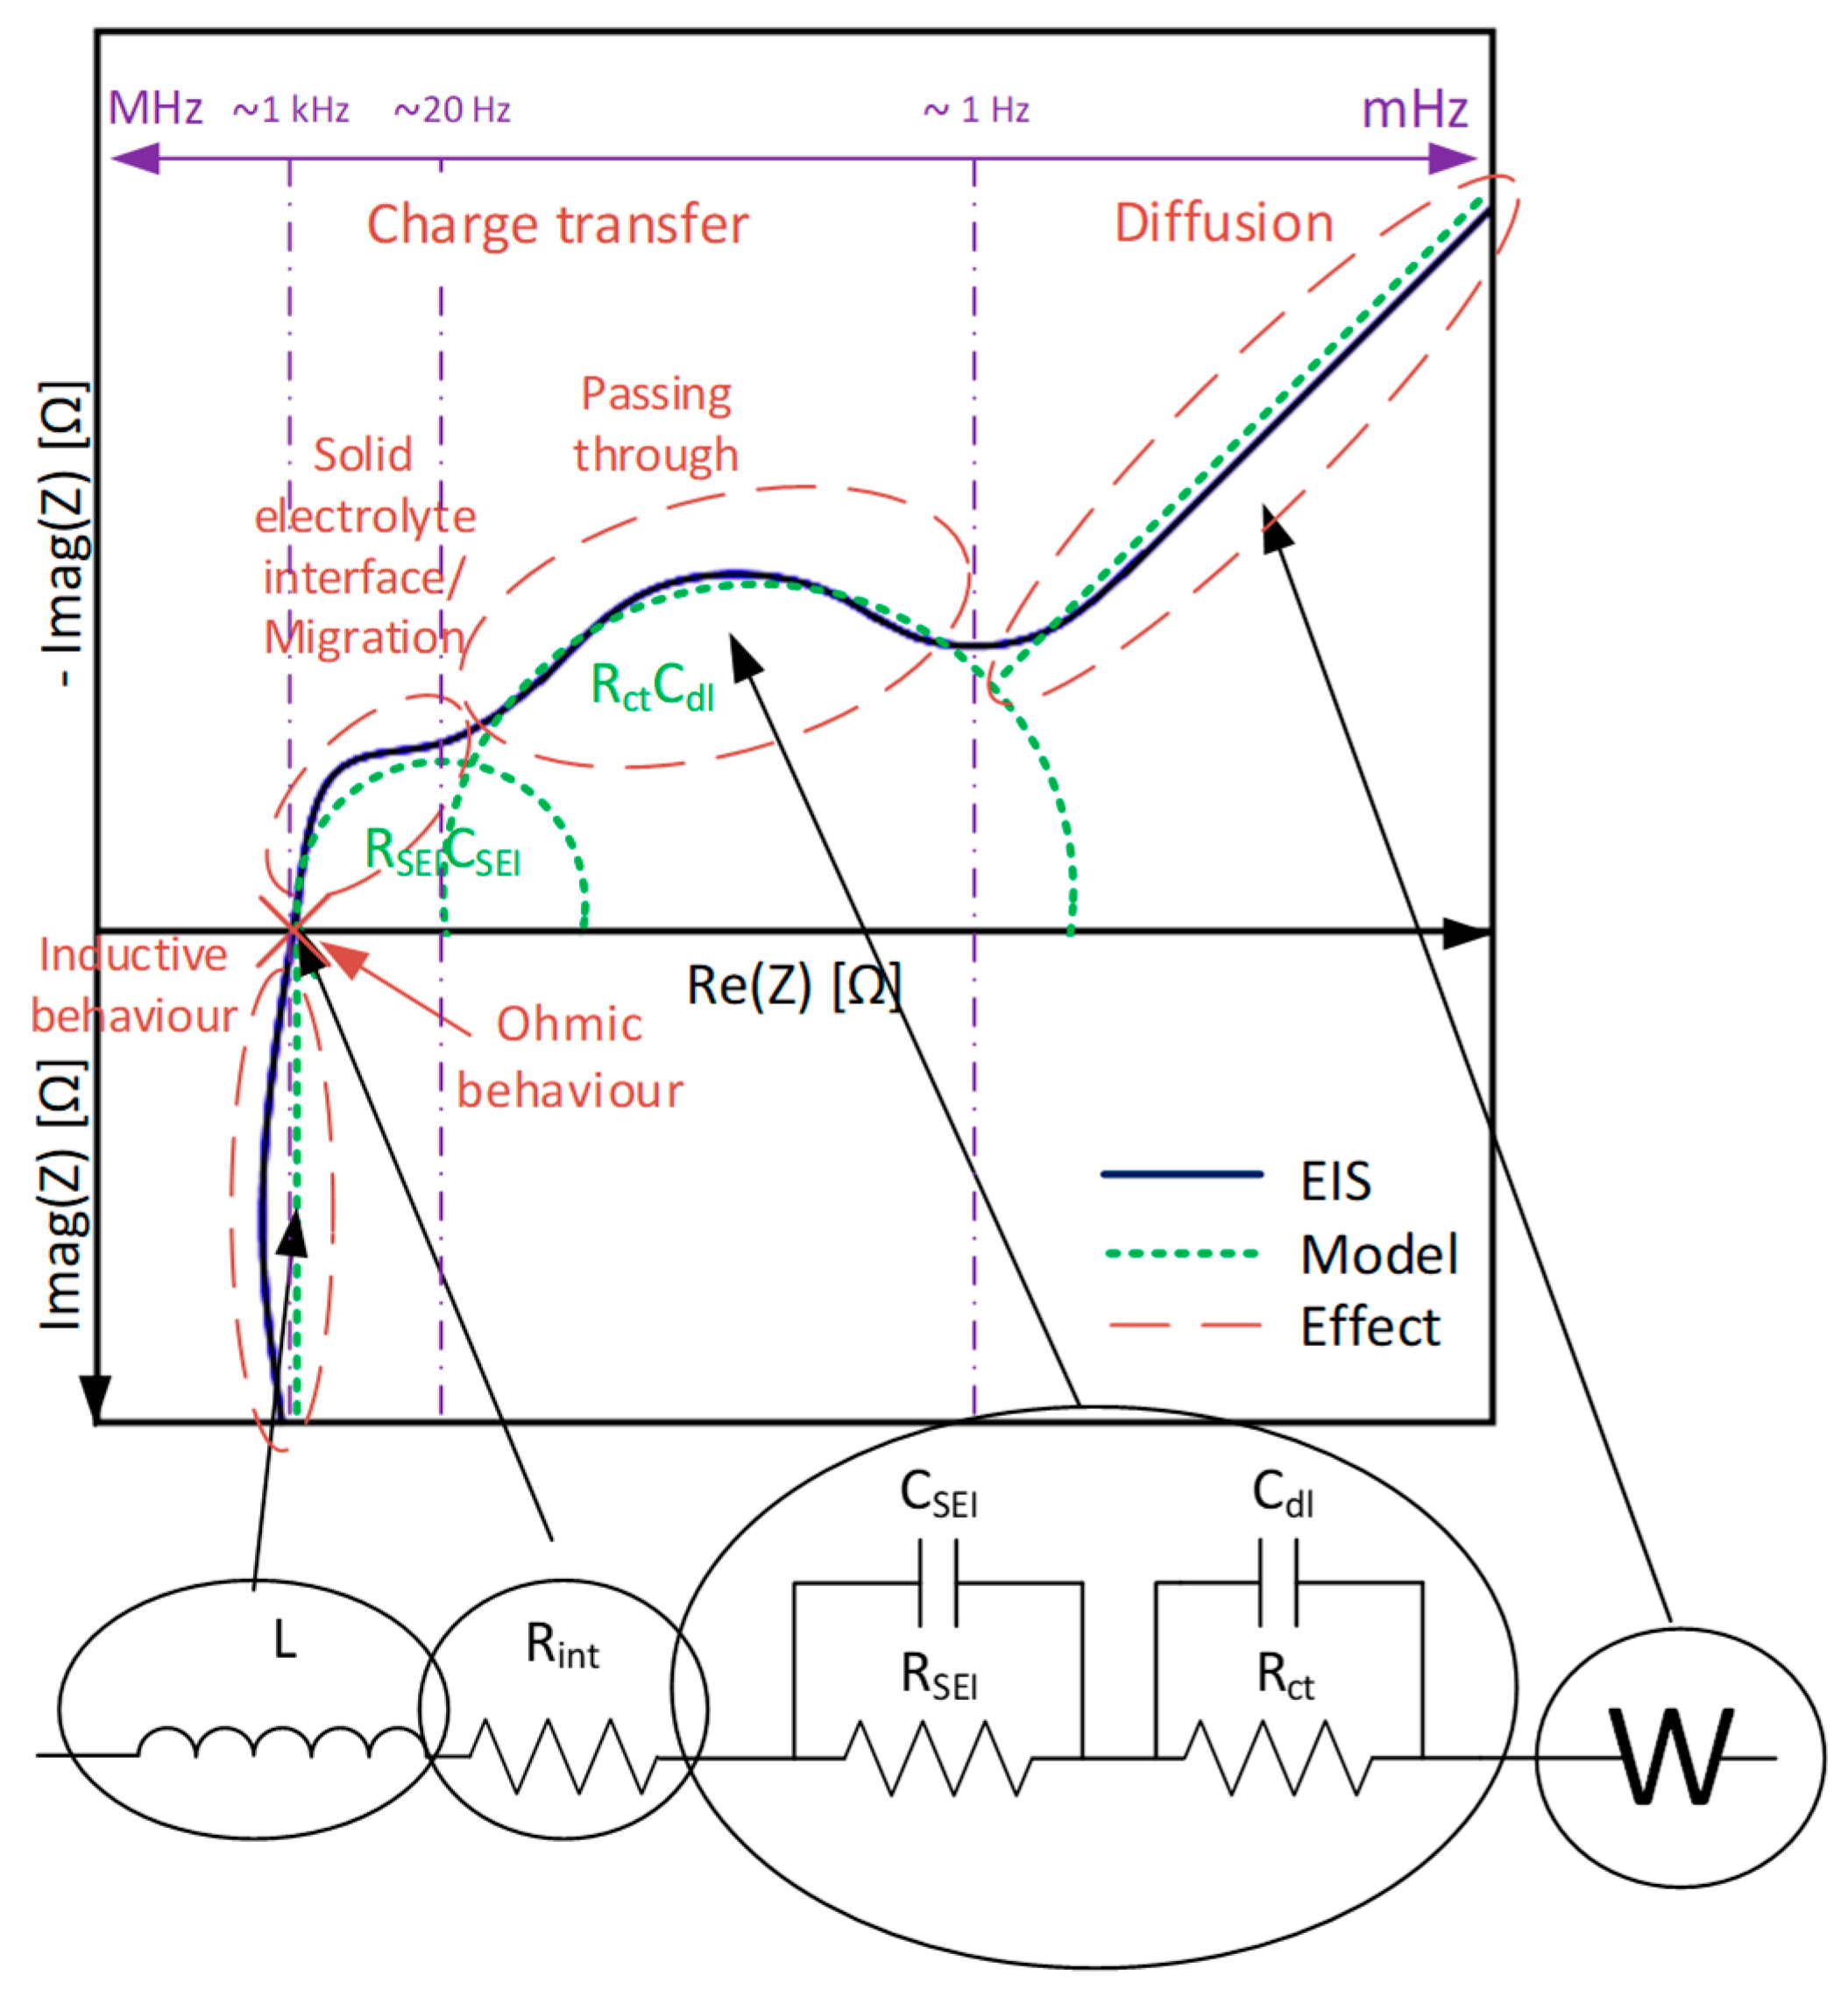
The internal resistance Rint used to represent the electric conductivity of the electrolyte, separator, and electrodes, matches with horizontal displacement, that is, where the curve meets the x-axis. The ZARC impedance element is composed of a parallel association of the charge transfer resistance Rct and the double-layer capacitance Cdl, which represent the activation polarization voltage drop, and is graphed as a semicircle, while ZW is a specific CPE, which models the diffusion effects, and is graphed as a line with 45-degree slope at very low frequencies [59]. These parameters are shown in Figure 17, in a commonly used circuit in these studies, and its Nyquist diagram with its corresponding physical interpretation.
The analytical expression is as follows:
where Zmodel denotes the impedance of the equivalent circuit model; L and Rint are the inductance and resistance in the high-frequency region, respectively; RSEI and Rct are the resistances in the middle-frequency region; CSEI is a CPE modelled as a capacitor; Cdl is another CPE modelled as a capacitor; and QW is the fractional coefficient of the Warburg impedance.
The effects of this Warburg impedance can also be reproduced by using multiple resistor–capacitor (RC) networks in series [65]. Although for an exact equivalence an infinite RC pairs network is needed, the circuit can often be modelled precise enough over some frequency range by using a small number of RC pairs. In addition, double layer capacitance Cdl is often omitted, as its impact is predominant only at very high frequencies [66]. If Cdl is removed and Warburg impedance is replaced by a small finite number of RC pairs, the cell model becomes the Thevenin model explained in Section 2.2.
EIS is recommended to be performed in stationary state and considering low input signal to avoid non-linearity effects. Besides, very low currents must not be used to avoid noise in results. This test must be repeated for each case of interest (SoC, temperature, current, etc.), as it is necessary to wait until stationary state. Some EIS analysis can be found in [67,68]. Figure 18 [69,70,71] shows the results dependency on temperature, SoC, and SoH.
The direct effect that the temperature has on all the parameters can be observed, greater in ZARC, enlarging the radius of the circle in Nyquist diagram. The SoC has its larger effect in Rint, while the SoH affects all the parameters similarly.
Impedance models can be very useful in Li-Ion cell diagnosis. Thus, identifying the cell-aging reason is possible by observing the larger variation parameter. Rint is a contact or an ohmic resistance, and its variation means conductivity loss, collector corrosion, or side reactions in electrolyte. An increase in RSEI and CSEI means an increase in the solid electrolyte interface, which together with an increase of the RCT, means a loss of lithium in the cell. A variation in Warbug impedance, in turn, is normally due to a loss of active material [72]. The number of semi-circles before the Warburg tail depends on the usage history of the cell as they are originated from SEI and the electronic properties of materials [73].
4. Runtime Models
4.1. Simple Runtime Models
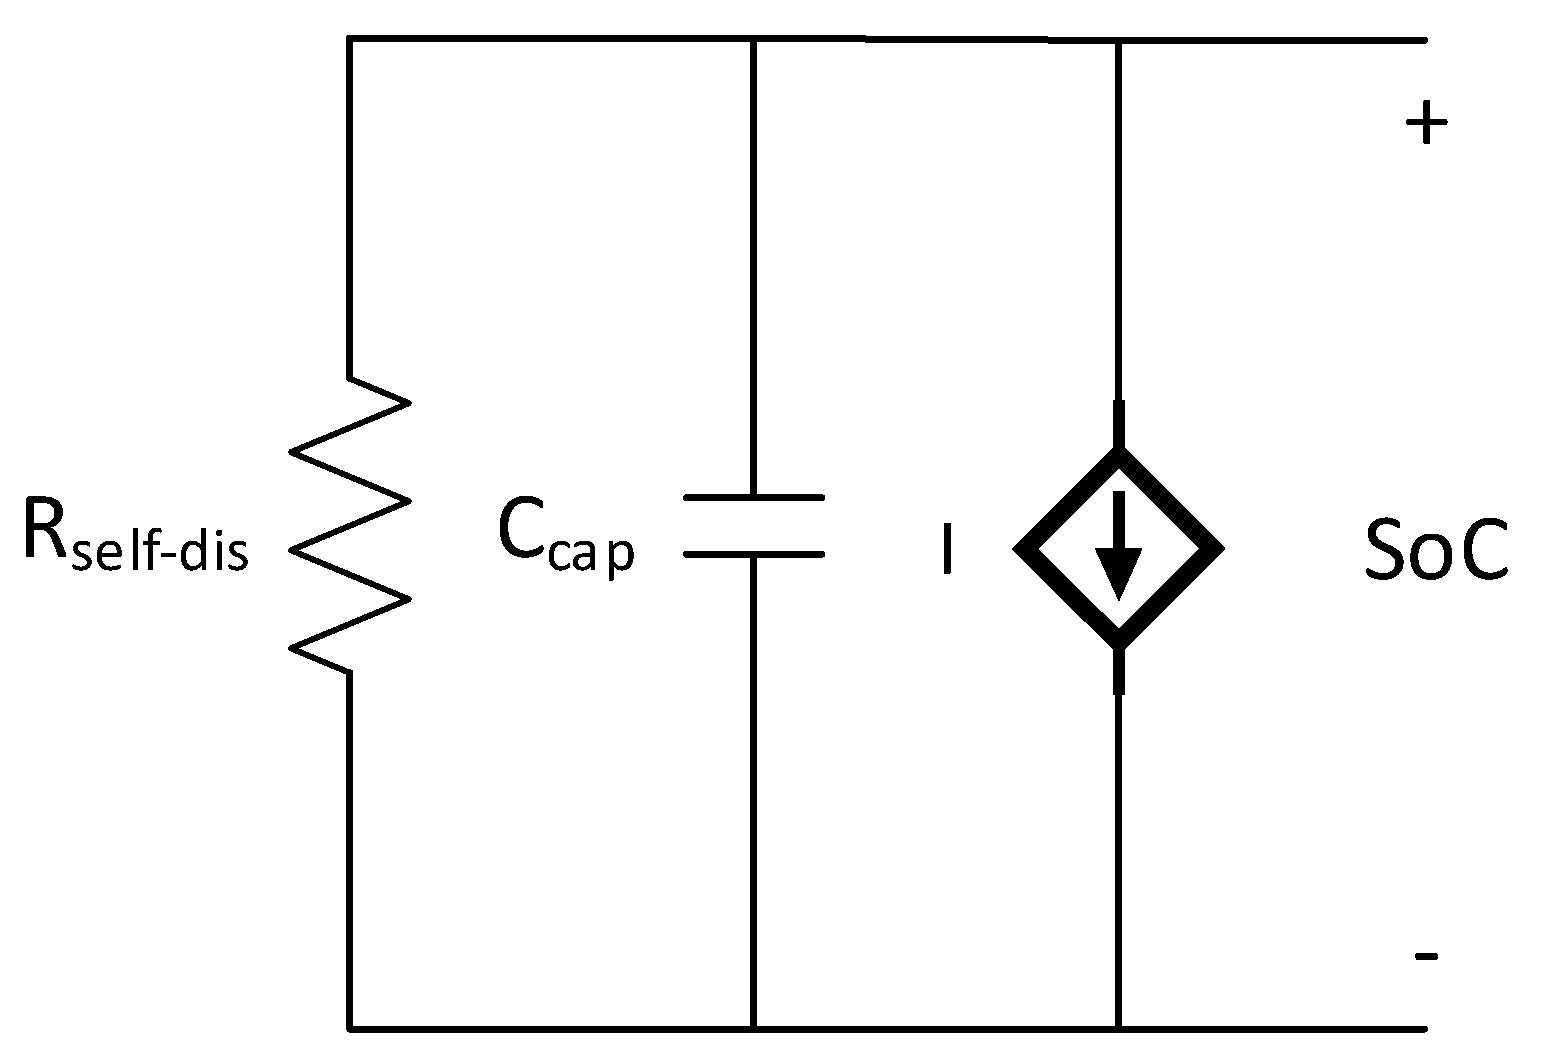
The models introduced above are able to represent the voltage and current evolution. However, runtime data are not provided. Figure 19 shows a runtime model, which is commonly used for runtime simulation of a battery under a fixed average current.
where Rself-dis is the self-discharge resistance, CCap is the capacitor that represents the charge stored in the battery (capacity), and I(t) is a current source that represents the operating current.
Since the voltage of a battery is dependent on the SoC, this model simulates the SoC and is commonly used in combination with other models.
4.2. Runtime-Combined Models
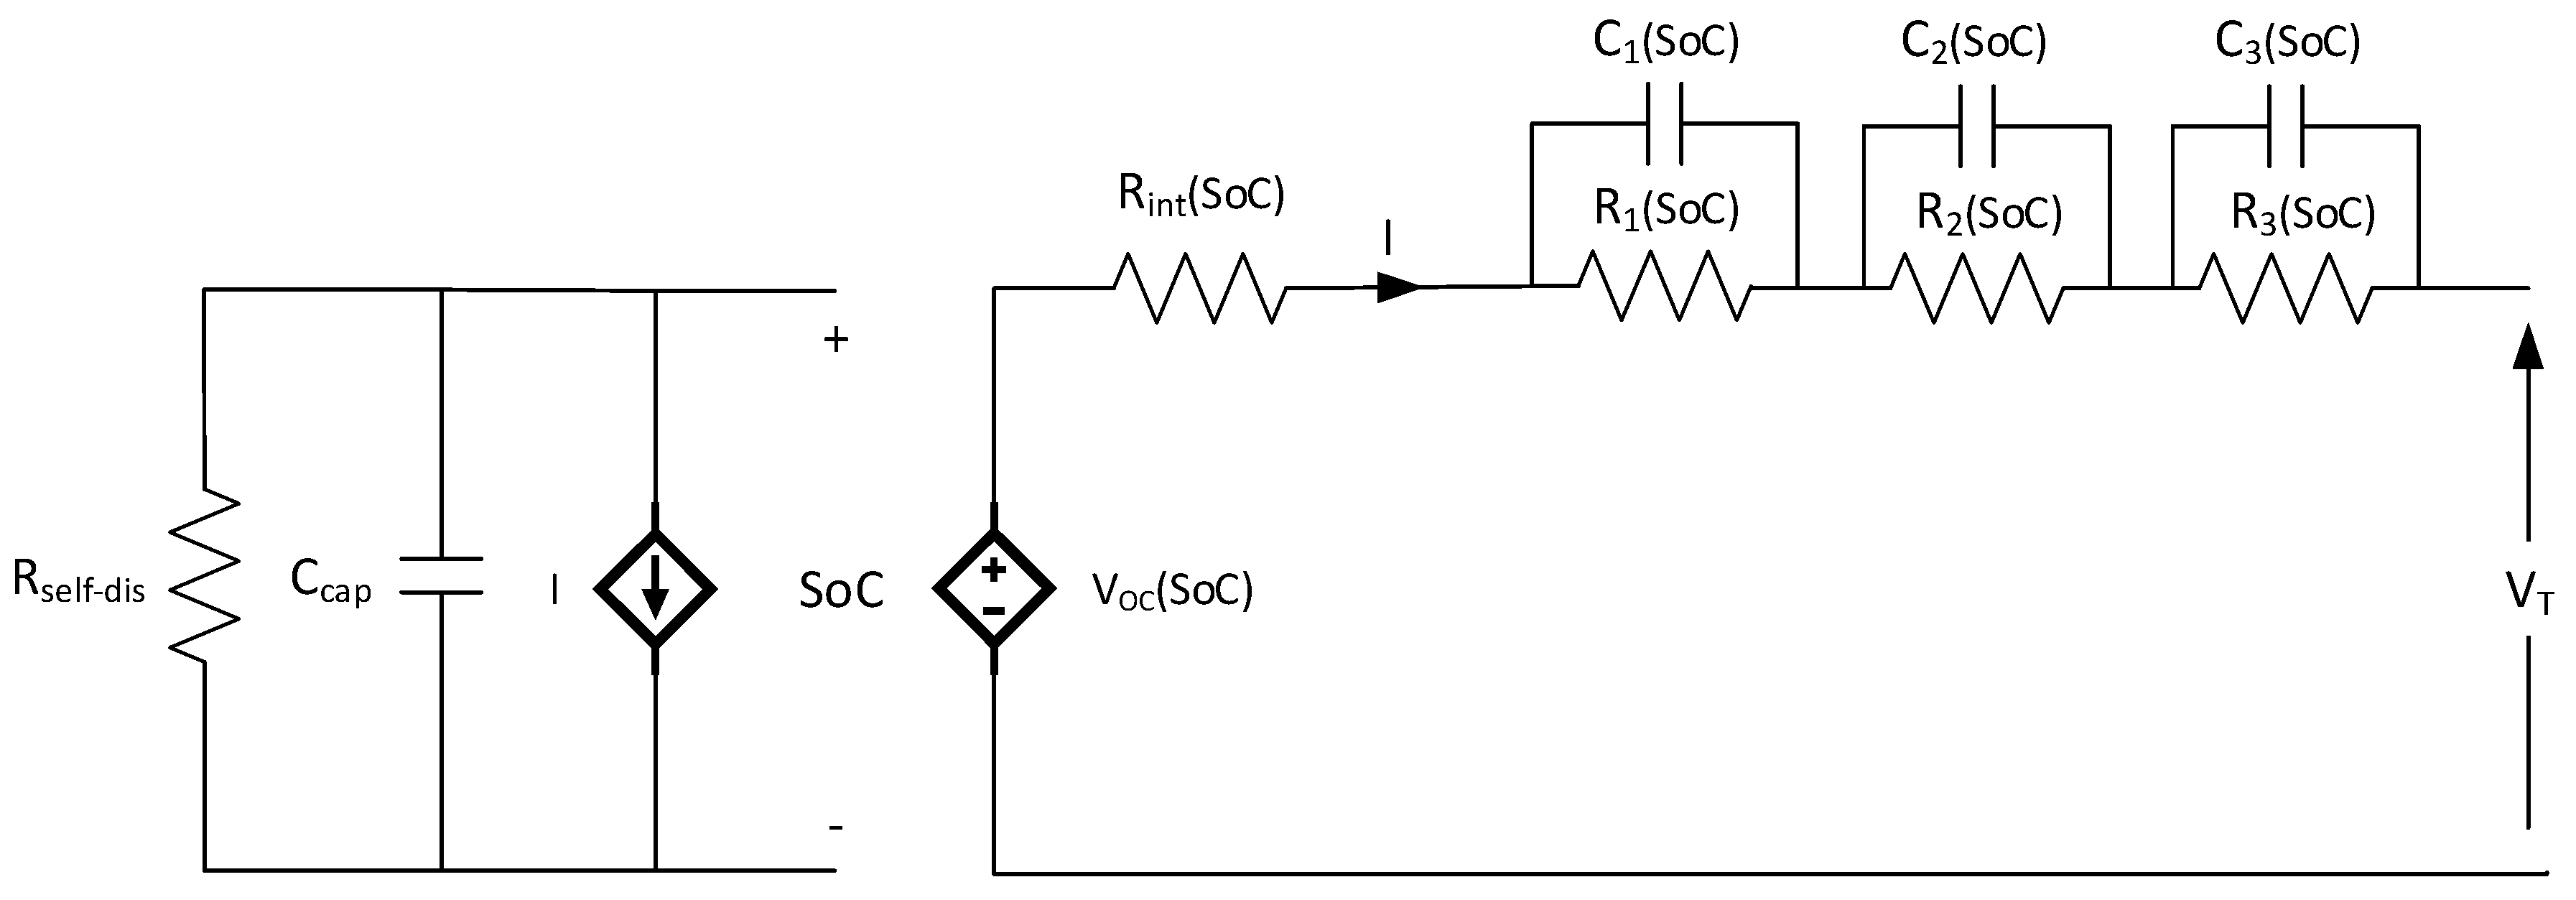
Runtime-combined models are generally composed by two sub-circuits connected to each other. Generally, a runtime model combined with a Thevenin one is widely used. In Figure 20, a typical circuit based on the third-order Thevenin is shown.
In the first sub-circuit, Rself-dis is a self-discharge resistance, CCap is a capacitor representing the charge stored in battery, and I(t) is a current controlled current source, measuring the current flowing in sub-circuit 2. The first sub-circuit is designed for energetic considerations, such as SoC measurement, remaining capacity, or self-discharge ratio. The second sub-circuit is composed of a third-order Thevenin model but replacing the voltage source by a voltage-controlled voltage source, measuring voltage (SoC-dependent) from the first sub-circuit. The second sub-circuit is designed for simulating I-V performance.
5. V-I Performance
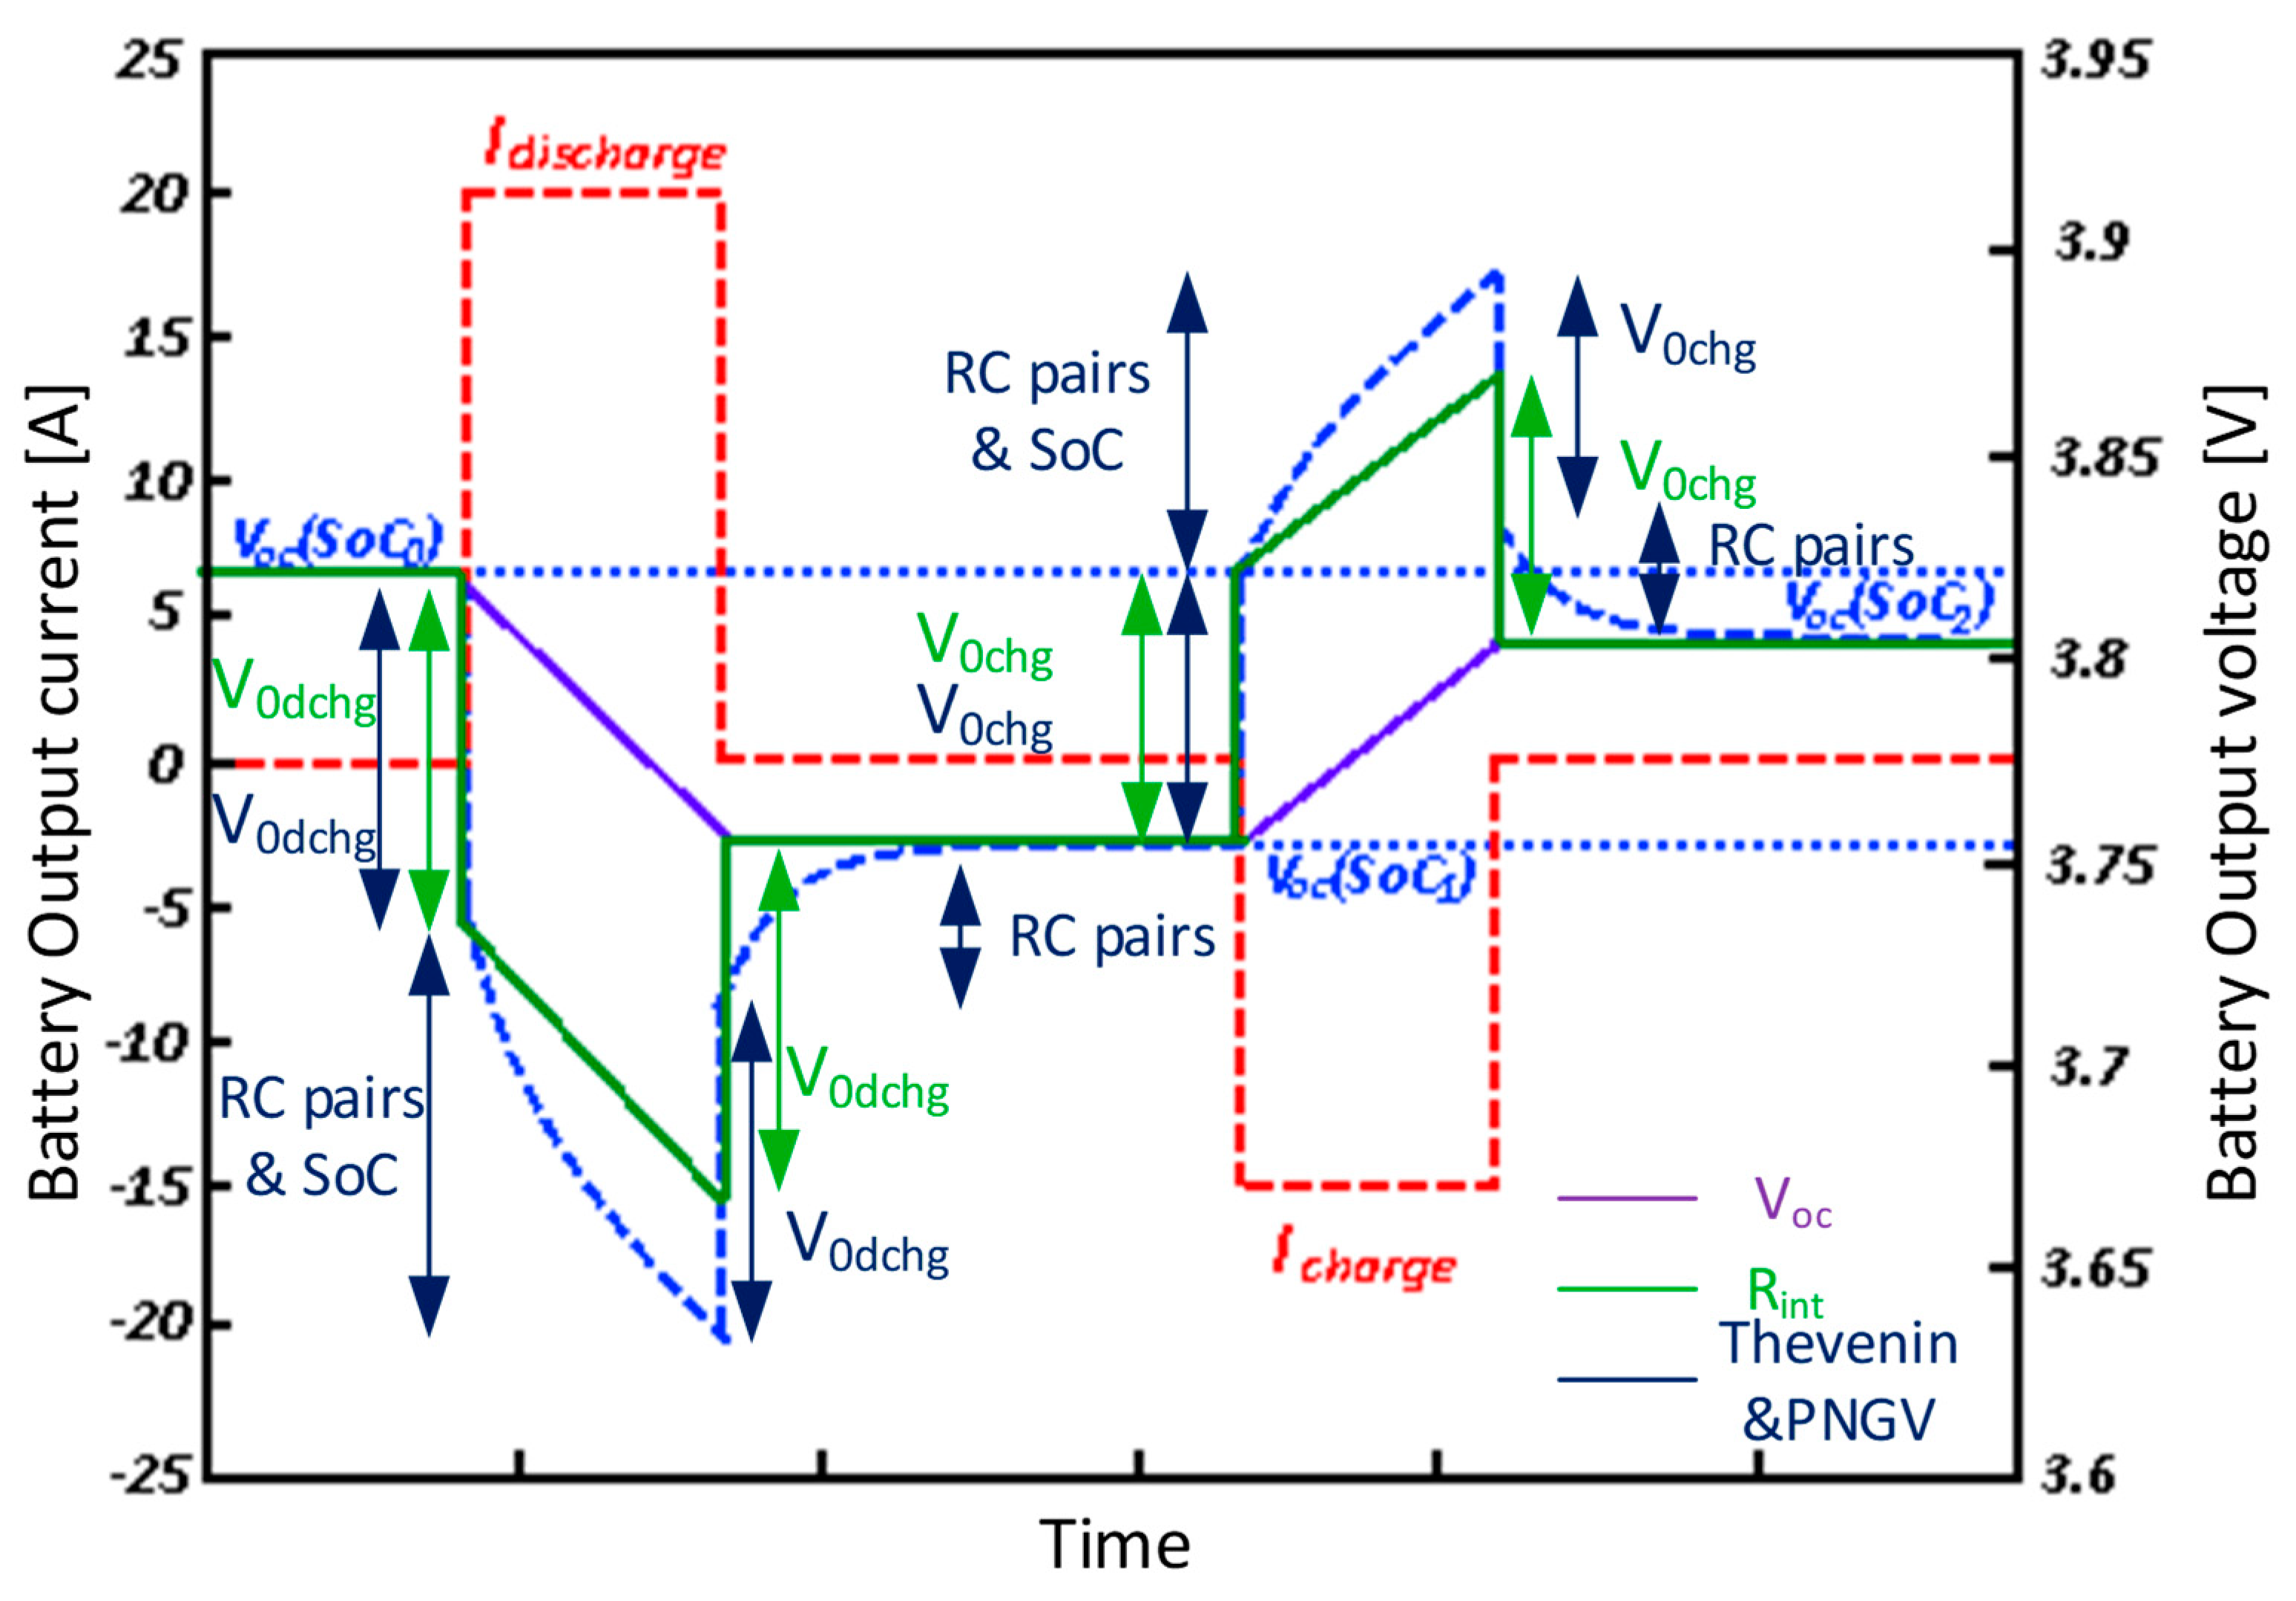
For better comprehension, below are the performance differences from the main ECMs analyzed in Section 3 are explained. Figure 21 shows the typical behavior of a Li-Ion cell during a discharge-charge cycle.
Starting from SoC0, an instantaneous voltage drop V0dch happens when the discharge is started due to Rint (Electrolyte resistance majorly). Then, voltage goes on decreasing exponentially, due to a combination of RC pairs (diffusion and surface reactions) and SoC decrease in the voltage source. Voltage drop V0dch is recovered instantaneously when current falls to zero, and due to RC pairs, voltage needs some time to be stabilized in a new SoC state, SoC1. When the charging state starts, an instantaneous voltage increase V0chg happens due to Rint, followed by an exponential increase due to RC pairs and SoC variation in voltage source. Finally, when the charging stops, an instantaneous voltage drop happens due to Rint, and an exponential decrease due to RC pairs, until final SoC is reached, SoC2. Thevenin and PNGV models are more accurate when RC pairs are increased and can model these effects. However, when using an ideal model with SoC consideration, as it can be seen in Figure 21, Voc graphed in purple only considers part of the dynamic: Voltage variation with SoC variation. The enhanced simple model with SoC consideration is more accurate, since it considers the instantaneous voltage drops too, graphed in green in Figure 21. Therefore, a linear model cannot be considered for SoC direct measurement, as it does not consider SoC in the voltage variation [17]
Consequently, Thevenin and PNGV models are best considered for most applications. Based on the characteristics of the study, the most-used RC pairs number in Thevenin and PNGV models are between 1 and 2. Its waveform is graphed in blue. A greater number of RC pairs increases computational effort without providing a reasonable enough accuracy increase [81]. In design or diagnosis applications, where simulation speed is not important, it is common to use three RC pairs. Therefore, the number of RC pairs is defined by accuracy and complexity dilemma [59]. The values of the elements of the RC pairs are usually obtained by experimental results.
Within Thevenin and PNGV models, the first-order one can represent transient state approximately and it is enough for most studies, especially those where simulation speed is a priority. Second-order models can represent transient state fairly accurate, and therefore, it is applicable in SoC estimation. Within electromobility, a second-order model is considered appropriate, even better if it is combined with a runtime model [78]
Although all the models are very accurate under standard fixed conditions (5–90% Depth of Discharge (DoD)), results depend on operating current, but, overall, on DoD, reaching an error of 58%.
The batteries are operated typically with a 60% DoD when cycled near the middle of the SoC. In these applications, the Thevenin or PNGV models are usually accurate enough, while maintaining a high computational speed. In case large computation resources are available and if the application would demand a charging/discharging profile more similar to dynamic discharging profile (DDP), a third-order PNGV model would be the most accurate, as well as RC model for the pulse test profile.
Nevertheless, batteries operating in deep cycles are a critical application for current models. The Noshin model seems to offer better results in those tests that aim to measure the capacity of a battery, independently from the DoD.
Table 4 gathers analyzed literature with electromobility application.
Power variation studies, so-called power fade (PF), and capacity variation studies, so-called CF, are within the most usual and interesting current applications of battery models in electromobility. These studies represent the capacity or power variation when a battery is aged. It is known that average current, temperature, DoD, and average SoC are most influent variables in battery degradation by cycling [93]. However, an adequate model is required to know the performance differences, as can be a runtime-combined model with a first-order Thevenin considering hysteresis, second-order Thevenin, or Noshin model. This model should not only consider the current and the SoC, but also the SoH and the temperature in its parameters (Rint, VOC, etc.). Therefore, it would be possible to predict a battery performance when it is degraded by the use and charging events. Indeed, charging events can be optimized if degradation is foreseen.
The definition of the parameters is, perhaps, the most expensive process in terms of time and effort. For this purpose, experimental tests to analyze the evolution of the parameters depending on the behavior to be characterized are necessary. These tests may consist of cycling a series of cells at different currents, temperatures, and DoDs, as well as in the continuous recording of their behavior until the end of their lifetime.
While Voc and Rint are easily characterized by measuring the open-circuit voltage and the instantaneous voltage drop when the cells start discharging, characterizing their capacity at different SoH points requires specific capacity tests. Since these tests are carried out discretely, it may be necessary to interpolate the values obtained to calculate intermediate solutions.
An analysis of the contribution of each variable to the evolution of each parameter would allow a greater accuracy when extrapolating the results of the tests. Although these tests are carried out at constant current, it would be possible to apply the superposition method to emulate a real variable cycle.
Although these tests may involve a large time and computational cost, they are worth it since it would be possible to optimize the BMS of the vehicle that incorporates the tested cells.
6. Conclusions
Battery models can be classified into several categories; generally, these categories are electrochemical models, mathematical models, and electrical models.
Electrochemical model are the most accurate ones in emulating all the internal phenomena. However, they consume excessive computational resources and are very slow. Therefore, they are suitable for battery design, but not for real-time control or emulation purposes.
Mathematical models are appropriate for certain calculus or prediction parameters, such as statistical cycle life based on experimental tests.
Finally, electrical models are the most appropriate for real-time control or emulation purposes and are the best solution to be implemented in actual battery management systems (BMSs), chargers, or similar devices. These models are composed of simple elements, such as resistances and capacitors, which are characterized based on the influence of several parameters (temperature, current, etc.).
In this paper, several Li-Ion battery electric models available for automotive applications have been analyzed and categorized, showing their advantages and drawbacks.
Simple models are sufficient for those studies where the battery is not the focus. Thevenin and PNGV models are adequate when the battery works in a certain SoC range, however they are not suitable for DC response analysis or runtime prediction. It is common to use variable resistances and capacitors, which consider SoC or temperature for improving these deficiencies, but it increases the computational requirement. These models are appropriate for transient state analysis, but AC response is limited. Impedance models, in turn, are appropriate for AC response analysis, as they are developed in the impedance domain. However, their transient state response is very limited. Runtime models offer a DC and runtime response simultaneously with an average fixed current. At last, combined models also combine the models’ advantages, improving accuracy by decreasing simulation speed.
The estimation of the parameters is another key aspect. While variables such as SoC or SoH have to be measured online, the estimation of the parameters can be done offline, and adjusted online if desired. In case an offline estimation of SoC or SoH based on laboratory tests is performed, and therefore not relating the parameters to the actual cycling of the battery, a high error in the results would be obtained.
An optimal model to be implemented in an EV must match a series of considerations:
- Accuracy: An accurate model, and with consideration of enough general aspects is required. These general aspects can be:
- Electrical model: Knowing the I-V behavior of a battery is essential for any study associated with its operation.
- Thermal model: Since a battery resistance varies inversely with temperature, it is common to have accuracy errors in performance simulation and runtime estimation when temperature is neglected.
- Runtime model: Necessary for those studies considering battery runtime, capacity increasing, or effects derived.
- Computational simplicity: A simpler model is preferred easing real-time operation as simulation speed is increased.
- Configuration simplicity: A simple model to be configured is preferred, with the lowest parameters to be identified and defined.
- Interpretability: An interpretable model would ease the identification of the origin if any issue would appear in the battery.
Author Contributions
Conceptualization, G.S. and F.J.A.; formal analysis, G.S.; writing—original draft preparation, G.S.; writing—review and editing, F.JA. and O.O; visualization, O.O.; supervision, J.I.S.M. and I.Z.; project administration, J.I.S.M and I.Z.; funding acquisition, J.I.S.M. and I.Z.
Funding
The authors thank the support from the Gipuzkoa Provincial Council (project Etorkizuna Eraikiz 2019 DGE19/03), the Basque Government (GISEL research group IT1083-16), as well as from the University of the Basque Country UPV/EHU (PES16/31 and PES17/08).
Conflicts of Interest
The authors declare no conflict of interest.
References
- Zamora, I.; San Martín, J.I.; García, J.; Asensio, F.J.; Oñederra, O.; San Martín, J.J.; Aperribay, V. PEM fuel cells in applications of urban public transport. Renew. Energy Power Qual. J. 2011, 1, 599–604. [Google Scholar] [CrossRef]
- Yan, J.; Li, C.; Xu, G.; Xu, Y. A novel on-line self-learning state-of-charge estimation of battery management system for hybrid electric vehicle. In Proceedings of the 2009 IEEE Intelligent Vehicles Symposium (IVS), Xi’an China, 3–5 June 2009; pp. 1161–1166. [Google Scholar]
- Shen, J.; Dusmez, S.; Khaligh, A. An advanced electro-thermal cycle-lifetime estimation model for LiFePO4 batteries. In Proceedings of the 2013 IEEE Transportation Electrification Conference and Expo (ITEC), Detroit, MI, USA, 16–19 June 2013; pp. 1–6. [Google Scholar]
- Eddahech, A.; Briat, O.; Vinassa, J. Real-Time SOC and SOH Estimation for EV Li-Ion Cell Using Online Parameters Identification. In Proceedings of the 2012 IEEE Energy Conversion Congress and Exposition, Raleigh, NC, USA, 15–20 September 2012. [Google Scholar]
- Hentunen, A.; Lehmuspelto, T.; Suomela, J. Electrical battery model for dynamic simulations of hybrid electric vehicles. In Proceedings of the 2011 IEEE Vehicle Power and Propulsion Conference (VPPC), Chicago, IL, USA, 6–9 September 2011; pp. 1–6. [Google Scholar]
- Lombardi, L.; Tribioli, L.; Cozzolino, R.; Bella, G. Comparative environmental assessment of conventional, electric, hybrid, and fuel cell powertrains based on LCA. Int. J. Life Cycle Assess. 2017, 22, 1989–2006. [Google Scholar] [CrossRef]
- Thomas, C.E. Fuel cell and battery electric vehicles compared. Int. J. Hydrogy Energy 2009, 34, 6005–6020. [Google Scholar] [CrossRef] [Green Version]
- Hu, X.; Zou, C.; Zhang, C.; Li, Y. Technological Developments in Batteries: A Survey of Principal Roles, Types, and Management Needs. IEEE Power Energy Mag. 2017, 15, 20–31. [Google Scholar] [CrossRef]
- Wang, Y.; Ying, H.; Huang, S. Comparison of lithium-ion battery cathode materials and the internal stress development. In Proceedings of the ASME 2011 International Mechanical Engineering Congress & Exposition IMECE2011, Denver, CO, USA, 11–17 November 2011. [Google Scholar]
- An, Z.; Jia, L.; Ding, Y.; Dang, C.; Li, X. A Review on Lithium-ion Power Battery Thermal Management Technologies and Thermal Safety. J. Therm. Sci 2017, 26, 391–412. [Google Scholar] [CrossRef]
- Cheng, K.W.E.; Divakar, B.P.; Wu, H.; Ding, K.; Ho, H.F. Battery-Management System (BMS) and SOC Development for Electrical Vehicles. IEEE Trans. Veh. Technol. 2011, 60, 76–88. [Google Scholar] [CrossRef]
- Chaturvedi, N.A.; Klein, R.; Christensen, J.; Ahmed, J.; Kojic, A. Algorithms for Advanced Battery-Management Systems. CSM 2010, 30, 49–68. [Google Scholar]
- Chen, M.; Rincon-Mora, G.A. Accurate electrical battery model capable of predicting runtime and I-V performance. TEC 2006, 21, 504–511. [Google Scholar] [CrossRef]
- Hageman, S.C. Simple PSpice models let you simulate common battery types. Electron. Des. News 1993, 38, 117. [Google Scholar]
- Gold, S. A PSPICE macromodel for lithium-ion batteries. In Proceedings of the Twelfth Annual Battery Conference on Applications and Advances (BCAA), Long Beach, CA, USA, 14–17 January 1997; pp. 215–222. [Google Scholar]
- Jongerden, M.R.; Haverkort, B.R. Which battery model to use? IET Softw. 2009, 3, 445–457. [Google Scholar] [CrossRef] [Green Version]
- Rahmoun, A.; Biechl, H. Parameters identification of equivalent circuit diagrams for li-ion batteries. In Proceedings of the 11th International Symposium PÄRNU “Topical Problems in the Field of Electrical and Power Engineering” and “Doctoral School of Energy and Geotechnology”, Pärnu, Estonia, 16–21 January 2012. [Google Scholar]
- Zhang, R.; Xia, B.; Li, B.; Lai, Y.; Zheng, W.; Wang, H.; Wang, W.; Wang, M. Study on the Characteristics of a High Capacity Nickel Manganese Cobalt Oxide (NMC) Lithium-Ion Battery—An Experimental Investigation. Energies 2018, 11, 2275. [Google Scholar] [CrossRef]
- Nikolian, A.; Firouz, Y.; Gopalakrishnan, R.; Timmermans, J.; Omar, N.; van den Bossche, P.; van Mierlo, J. Lithium Ion Batteries—Development of Advanced Electrical Equivalent Circuit Models for Nickel Manganese Cobalt Lithium-Ion. Energies 2016, 9, 360. [Google Scholar] [CrossRef]
- Ceraolo, M. New dynamical models of lead-acid batteries. IEEE Trans. Power Syst. 2000, 15, 1184–1190. [Google Scholar] [CrossRef] [Green Version]
- Puleston, P.F.; Valenciaga, F.; Battaiotto, P.E.; Mantz, R.J. Passivity/sliding mode control of a stand-alone hybrid generation system. IEE Proc. Control Theory Appl. 2000, 147, 680–686. [Google Scholar]
- Zhu, T.; Min, H.; Yu, Y.; Zhao, Z.; Xu, T.; Chen, Y.; Li, X.; Zhang, C. An Optimized Energy Management Strategy for Preheating Vehicle-Mounted Li-ion Batteries at Subzero Temperatures. Energies 2017, 10, 243. [Google Scholar] [CrossRef]
- Tremblay, O.; Dessaint, L.; Dekkiche, A. A Generic Battery Model for the Dynamic Simulation of Hybrid Electric Vehicles. In Proceedings of the 2007 IEEE Vehicle Power and Propulsion Conference (VPPC), Arlington, TX, USA, 9–12 September 2007; pp. 284–289. [Google Scholar]
- Baboselac, I.; Hederić, Z.; Bensić, T. MatLab simulation model for dynamic mode of the Lithium-Ion batteries to power the EV. Teh. Glas. 2017, 11, 7–13. [Google Scholar]
- Pang, S.; Farrell, J.; Du, J.; Barth, M. Battery state-of-charge estimation. In Proceedings of the 2001 American Control Conference. (Cat. No. 01CH37148), Arlington, VA, USA, 25–27 June 2001; Volume 2, p. 1649. [Google Scholar]
- Cun, J.P.; Fiorina, J.N.; Fraisse, M.; Mabboux, H. The experience of a UPS company in advanced battery monitoring. In Proceedings of the Intelec’96-International Telecommunications Energy Conference, Boston, MA, USA, 6–10 October 1996; pp. 646–653. [Google Scholar]
- Chan, H.L. A new battery model for use with battery energy storage systems and electric vehicles power systems. In Proceedings of the 2000 IEEE Power Engineering Society Winter Meeting. Conference Proceedings (Cat. No.00CH37077), Singapore, 23–27 January 2000; p. 475. [Google Scholar]
- Berrueta, A.; Irigaray, V.; Sanchis, P.; Ursua, A. Lithium-ion battery model and experimental validation. In Proceedings of the 17th European Conference on Power Electronics and Applications (EPE’15 ECCE-Europe), Geneva, Switzerland, 8–10 September 2015; pp. 1–8. [Google Scholar]
- Kim, Y.H.; Ha, H.D. Design of interface circuits with electrical battery models. IEEE Trans. Ind. Electron. 1997, 44, 81–86. [Google Scholar] [CrossRef]
- Marcos, J.; Lago, A.; Penalver, C.M.; Doval, J.; Nogueira, A.; Castro, C.; Chamadoira, J. An approach to real behaviour modeling for traction lead-acid batteries. In Proceedings of the 2011 IEEE 32nd Annual Power Electronics Specialists Conference (IEEE Cat. No.01CH37230), Vancouver, BC, Canada, 17–21 June 2001; p. 624. [Google Scholar]
- Sen, C.; Kar, N.C. Battery pack modeling for the analysis of battery management system of a hybrid electric vehicle. In Proceedings of the Battery pack modeling for the analysis of battery management system of a hybrid electric vehicle, Dearborn, MI, USA, 7–10 September 2009; pp. 207–212. [Google Scholar]
- Ali, M.; Kamran, M.; Kumar, P.; Himanshu; Nengroo, S.; Khan, M.; Hussain, A.; Kim, H. An Online Data-Driven Model Identification and Adaptive State of Charge Estimation Approach for Lithium-ion-Batteries Using the Lagrange Multiplier Method. Energies 2018, 11, 2940. [Google Scholar] [CrossRef]
- Kim, D.; Koo, K.; Jeong, J.; Goh, T.; Kim, S. Second-Order Discrete-Time Sliding Mode Observer for State of Charge Determination Based on a Dynamic Resistance Li-Ion Battery Model. Energies 2013, 6, 5538–5551. [Google Scholar] [CrossRef] [Green Version]
- Kim, I.S. Nonlinear State of Charge Estimator for Hybrid Electric Vehicle Battery. IEEE Trans. Power Electron. 2008, 23, 2027–2034. [Google Scholar]
- Ting, T.O.; Man, K.L.; Lim, E.G.; Leach, M. Tuning of Kalman Filter Parameters via Genetic Algorithm for State-of-Charge Estimation in Battery Management System. Sci. World J. 2014, 2014, 176052. [Google Scholar] [CrossRef] [PubMed]
- Zhan, C.; Wu, X.G.; Kromlidis, S.; Ramachandaramurthy, V.K.; Barnes, M.; Jenkins, N.; Ruddell, A.J. Two electrical models of the lead–acid battery used in a dynamic voltage restorer. IEE Proc. Gener. Transm. Distrib. 2003, 150, 175. [Google Scholar] [CrossRef]
- Yuan, S.; Wu, H.; Ma, X.; Yin, C. Stability Analysis for Li-Ion Battery Model Parameters and State of Charge Estimation by Measurement Uncertainty Consideration. Energies 2015, 8, 7729–7751. [Google Scholar] [CrossRef] [Green Version]
- Bruen, T.; Marco, J. Modelling and experimental evaluation of parallel connected lithium ion cells for an electric vehicle battery system. J. Power Sources 2016, 310, 91–101. [Google Scholar] [CrossRef]
- Jonghoon, K.; Cho, B.H. State-of-Charge Estimation and State-of-Health Prediction of a Li-Ion Degraded Battery Based on an EKF Combined With a Per-Unit System. IEEE Trans. Veh. Technol. 2011, 60, 4249–4260. [Google Scholar]
- Hegazy, O.; Barrero, R.; Van Mierlo, J.; Lataire, P.; Omar, N.; Coosemans, T. An Advanced Power Electronics Interface for Electric Vehicles Applications. IEEE Trans. Power Electron. 2013, 28, 5508–5521. [Google Scholar] [CrossRef]
- Xiong, R.; He, H.; Guo, H.; Ding, Y. Modeling for Lithium-Ion Battery used in Electric Vehicles. Procedia Eng. 2011, 15, 2869–2874. [Google Scholar] [CrossRef] [Green Version]
- Han, H.; Xu, H.; Yuan, Z.; Zhao, Y. Modeling for lithium-ion battery used in electric vehicles. In Proceedings of the 2014 IEEE Conference and Expo Transportation Electrification Asia-Pacific (ITEC Asia-Pacific), Beijing, China, 31 August–3 September 2014. [Google Scholar]
- Fotouhi, A.; Propp, K.; Auger, D.J. Electric vehicle battery model identification and state of charge estimation in real world driving cycles. In Proceedings of the 2015 7th Computer Science and Electronic Engineering Conference, Colchester, UK, 24–25 September 2015; p. 243. [Google Scholar]
- Rahimi-Eichi, H.; Chow, M.Y. Adaptive parameter identification and State-of-Charge estimation of lithium-ion batteries. In Proceedings of the IECON 2012-38th Annual Conference on IEEE Industrial Electronics Society, Montreal, QC, Canada, 25–28 October 2012; pp. 4012–4017. [Google Scholar]
- Erdinc, O.; Vural, B.; Uzunoglu, M. A dynamic lithium-ion battery model considering the effects of temperature and capacity fading. In Proceedings of the 2009 International Conference on Clean Electrical Power, Capri, Italy, 9–11 June 2009; pp. 383–386. [Google Scholar]
- Guo, X.; Kang, L.; Yao, Y.; Huang, Z.; Li, W. Joint Estimation of the Electric Vehicle Power Battery State of Charge Based on the Least Squares Method and the Kalman Filter Algorithm. Energies 2016, 9, 100. [Google Scholar] [CrossRef]
- Shen, P.; Ouyang, M.; Lu, L.; Li, J.; Feng, X. The Co-estimation of State of Charge, State of Health, and State of Function for Lithium-Ion Batteries in Electric Vehicles. IEEE Trans. Veh. Technol. 2018, 67, 92–103. [Google Scholar] [CrossRef]
- Mesbahi, T.; Rizoug, N.; Bartholomeus, P.; Sadoun, R.; Khenfri, F.; Le Moigne, P. Dynamic Model of Li-Ion Batteries Incorporating Electrothermal and Ageing Aspects for Electric Vehicle Applications. IEEE Trans. Ind. Electron. 2018, 65, 1298–1305. [Google Scholar] [CrossRef]
- Chaoui, H.; El Mejdoubi, A.; Gualous, H. Online Parameter Identification of Lithium-Ion Batteries With Surface Temperature Variations. IEEE Trans. Veh. Technol. 2017, 66, 2000–2009. [Google Scholar] [CrossRef]
- Cheng, X.; Yao, L.; Xing, Y.; Pecht, M. Novel Parametric Circuit Modeling for Li-Ion Batteries. Energies 2016, 9, 539. [Google Scholar] [CrossRef]
- Guenther, C.; Barillas, J.K.; Stumpp, S.; Danzer, M.A. A dynamic battery model for simulation of battery-to-grid applications. In Proceedings of the 2012 3rd IEEE PES Innovative Smart Grid Technologies Europe (ISGT Europe), Berlin, Germany, 14–17 October 2012; pp. 1–7. [Google Scholar]
- Dong, B.; Tian, Y.; Zhou, C. One Estimating Method of the State of Charge of Power Battery for Electronic Vehicle. In Proceedings of the 2014 Sixth International Conference on Measuring Technology and Mechatronics Automation, Zhangjiajie, China, 10–11 January 2014; pp. 439–442. [Google Scholar]
- Liu, X.; Li, W.; Zhou, A. PNGV Equivalent Circuit Model and SOC Estimation Algorithm for Lithium Battery Pack Adopted in AGV Vehicle. Access 2018, 6, 23639–23647. [Google Scholar] [CrossRef]
- Ozkurt, C.; Camci, F.; Atamuradov, V.; Odorry, C. Integration of sampling based battery state of health estimation method in electric vehicles. Appl. Energy 2016, 175, 356–367. [Google Scholar] [CrossRef]
- Uddin, K.; Picarelli, A.; Lyness, C.; Taylor, N.; Marco, J. An Acausal Li-Ion Battery Pack Model for Automotive Applications. Energies 2014, 7, 5675–5700. [Google Scholar] [CrossRef]
- U.S. Department Secretary of Energy FreedomCAR Battery Test Manual for IDAHO. Available online: https://avt.inl.gov/sites/default/files/pdf/battery/freedomcar_manual_04_15_03.pdf (accessed on 5 May 2019).
- Omar, N.; Widanage, D.; Abdel Monem, M.; Firouz, Y.; Hegazy, O.; Van den Bossche, P.; Coosemans, T.; Van Mierlo, J. Optimization of an advanced battery model parameter minimization tool and development of a novel electrical model for lithium-ion batteries. Int. Trans. Electr. Energy Syst. 2014, 24, 1747–1767. [Google Scholar] [CrossRef]
- Omar, N.; Daowd, M.; Bossche, P.v.d.; Hegazy, O.; Smekens, J.; Coosemans, T.; Mierlo, J.v. Rechargeable Energy Storage Systems for Plug-in Hybrid Electric Vehicles—Assessment of Electrical Characteristics. Energies 2012, 5, 2952–2988. [Google Scholar] [CrossRef]
- Fotouhi, A.; Auger, D.J.; Propp, K.; Longo, S.; Wild, M. A review on electric vehicle battery modelling: From Lithium-ion toward Lithium-Sulphur. Renew. Sustain. Energy Rev. 2016, 56, 1008–1021. [Google Scholar] [CrossRef]
- Deng, Z.; Zhang, Z.; Lai, Y.; Liu, J.; Li, J.; Liu, Y. Electrochemical Impedance Spectroscopy Study of a Lithium/Sulfur Battery: Modeling and Analysis of Capacity Fading. J. Electrochem. Soc. 2013, 160, A558. [Google Scholar] [CrossRef]
- Alavi, S.M.M.; Birkl, C.R.; Howey, D.A. Time-domain fitting of battery electrochemical impedance models. J. Power Sources 2015, 288, 345–352. [Google Scholar] [CrossRef]
- Troxler, Y.; Wu, B.; Marinescu, M.; Yufit, V.; Patel, Y.; Marquis, A.J.; Brandon, N.P.; Offer, G.J. The effect of thermal gradients on the performance of lithium-ion batteries. J. Power Sources 2014, 247, 1018–1025. [Google Scholar] [CrossRef]
- Dai, H.; Jiang, B.; Wei, X. Impedance Characterization and Modeling of Lithium-Ion Batteries Considering the Internal Temperature Gradient. Energies 2018, 11, 220. [Google Scholar] [CrossRef]
- Huang, J.; Li, Z.; Liaw, B.Y.; Zhang, J. Graphical analysis of electrochemical impedance spectroscopy data in Bode and Nyquist representations. J. Power Sources 2016, 309, 82–98. [Google Scholar] [CrossRef]
- Kollmeyer, P.; Hackl, A.; Emadi, A. Li-ion battery model performance for automotive drive cycles with current pulse and EIS parameterization. In Proceedings of the 2017 IEEE Transportation Electrification Conference and Expo (ITEC), Chicago, IL, USA, 22–24 June 2017; pp. 486–492. [Google Scholar]
- Plett, G. Battery Management Systems, Volume I: Battery Modeling; Artech House: Norwood, UK, 2015. [Google Scholar]
- Jespersen, J.L.; Tønnesen, A.E.; Nørregaard, K.; Overgaard, L.; Elefsen, F. Capacity Measurements of Li-Ion Batteries using AC Impedance Spectroscopy. World Electr. Veh. J. 2009, 3, 127–133. [Google Scholar] [CrossRef] [Green Version]
- Birkl, C.R.; Howey, D.A. Model identification and parameter estimation for LiFePO4 batteries. In Proceedings of the IET Hybrid and Electric Vehicles Conference 2013 (HEVC 2013), London, UK, 6–7 November 2013. [Google Scholar]
- Schmalstieg, J.; Sauer, D.U. Full Cell Parameterization of a High-Power Lithium-Ion Battery for a Physico-Chemical Model: Part II. Thermal Parameters and Validation. J. Electrochem. Soc. 2018, 165, A3819. [Google Scholar] [CrossRef]
- Xu, J.; Mi, C.C.; Cao, B.; Cao, J. A new method to estimate the state of charge of lithium-ion batteries based on the battery impedance model. J. Power Sources 2013, 233, 277–284. [Google Scholar] [CrossRef]
- Eddahech, A.; Briat, O.; Vinassa, J. Performance comparison of four lithium–ion battery technologies under calendar aging. Energy 2015, 84, 542–550. [Google Scholar] [CrossRef]
- Pastor-Fernández, C.; Uddin, K.; Chouchelamane, G.H.; Widanage, W.D.; Marco, J. A Comparison between Electrochemical Impedance Spectroscopy and Incremental Capacity-Differential Voltage as Li-ion Diagnostic Techniques to Identify and Quantify the Effects of Degradation Modes within Battery Management Systems. J. Power Sources 2017, 360, 301–318. [Google Scholar] [CrossRef]
- Barai, A.; Chouchelamane, G.H.; Guo, Y.; McGordon, A.; Jennings, P. A study on the impact of lithium-ion cell relaxation on electrochemical impedance spectroscopy. J. Power Sources 2015, 280, 74–80. [Google Scholar] [CrossRef]
- Heubner, C.; Schneider, M.; Michaelis, A. Investigation of charge transfer kinetics of Li-Intercalation in LiFePO4. J. Power Sources 2015, 288, 115–120. [Google Scholar] [CrossRef]
- Olofsson, Y.; Groot, J.; Katrašnik, T.; Tavcčar, G. Impedance spectroscopy characterisation of automotive NMC/graphite Li-ion cells aged with realistic PHEV load profile. In Proceedings of the 2014 IEEE International Electric Vehicle Conference (IEVC), Florence, Italy, 17–19 December 2014; pp. 1–6. [Google Scholar]
- Osaka, T.; Momma, T.; Mukoyama, D.; Nara, H. Proposal of novel equivalent circuit for electrochemical impedance analysis of commercially available lithium ion battery. J. Power Sources 2012, 205, 483–486. [Google Scholar] [CrossRef]
- Li, S.E.; Wang, B.; Peng, H.; Hu, X. An electrochemistry-based impedance model for lithium-ion batteries. J. Power Sources 2014, 258, 9–18. [Google Scholar] [CrossRef]
- Zhang, H.; Chow, M.H. Comprehensive dynamic battery modeling for PHEV applications. In Proceedings of the IEEE PES General Meeting, Providence, RI, USA, 25-29 July 2010; pp. 1–6. [Google Scholar]
- Kroeze, R.C.; Krein, P.T. Electrical battery model for use in dynamic electric vehicle simulations. In Proceedings of the 2008 IEEE Power Electronics Specialists Conference, Rhodes, Greece, 15–19 June 2008; pp. 1336–1342. [Google Scholar]
- Cao, Y.; Kroeze, R.C.; Krein, P.T. Multi-timescale Parametric Electrical Battery Model for Use in Dynamic Electric Vehicle Simulations. IEEE Trans. Transp. Electr. 2016, 2, 432–442. [Google Scholar] [CrossRef]
- Huria, T.; Ceraolo, M.; Gazzarri, J.; Jackey, R. High fidelity electrical model with thermal dependence for characterization and simulation of high power lithium battery cells. In Proceedings of the 2012 IEEE International Electric Vehicle Conference, Greenville, SC, USA, 4–8 March 2012; pp. 1–8. [Google Scholar]
- Blanco, C.; Sánchez, L.; Gonzalez, M.; Anton, J.C.; Gacia, V.; Viera, J.C. An Equivalent Circuit Model With Variable Effective Capacity for LiFePO4 Batteries. IEEE Trans. Veh. Technol. 2014, 63, 3592–3599. [Google Scholar] [CrossRef]
- Mathew, M.; Kong, Q.H.; McGrory, J.; Fowler, M. Simulation of lithium ion battery replacement in a battery pack for application in electric vehicles. J. Power Sources 2017, 349, 94–104. [Google Scholar] [CrossRef]
- Gao, L.; Liu, S.; Dougal, R.A. Dynamic lithium-ion battery model for system simulation. IEEE Trans. Compon. Packag. Technol. 2002, 25, 495–505. [Google Scholar]
- Verbrugge, M.; Koch, B. Generalized Recursive Algorithm for Adaptive Multiparameter Regression. J. Electrochem. Soc. 2006, 153, A187. [Google Scholar] [CrossRef]
- Nikolian, A.; Jaguemont, J.; de Hoog, J.; Goutam, S.; Omar, N.; Van Den Bossche, P.; Van Mierlo, J. Complete cell-level lithium-ion electrical ECM model for different chemistries (NMC, LFP, LTO) and temperatures (−5 °C to 45 °C)—Optimized modelling techniques. Int. J. Electr. Power Energy Syst. 2018, 98, 133–146. [Google Scholar] [CrossRef]
- Mesbahi, T.; Khenfri, F.; Rizoug, N.; Chaaban, K.; Bartholomeüs, P.; Le Moigne, P. Dynamical modeling of Li-ion batteries for electric vehicle applications based on hybrid Particle Swarm-Nelder-Mead (PSO-NM) optimization algorithm. Electr. Power Syst. Res. 2016, 131, 195–204. [Google Scholar] [CrossRef]
- de Hoog, J.; Jaguemont, J.; Abdel-Monem, M.; Van Den Bossche, P.; Van Mierlo, J.; Omar, N. Combining an Electrothermal and Impedance Aging Model to Investigate Thermal Degradation Caused by Fast Charging. Energies 2018, 11, 804. [Google Scholar] [CrossRef]
- Sidhu, A.; Izadian, A.; Anwar, S. Adaptive Nonlinear Model-Based Fault Diagnosis of Li-Ion Batteries. IEEE Trans. Ind. Electron. 2015, 62, 1002–1011. [Google Scholar] [CrossRef]
- Yuksel, T.; Litster, S.; Viswanathan, V.; Michalek, J.J. Plug-in hybrid electric vehicle LiFePO4 battery life implications of thermal management, driving conditions, and regional climate. J. Power Sources 2017, 338, 49–64. [Google Scholar] [CrossRef] [Green Version]
- Omar, N.; Monem, M.A.; Firouz, Y.; Salminen, J.; Smekens, J.; Hegazy, O.; Gaulous, H.; Mulder, G.; Van den Bossche, P.; Coosemans, T.; et al. Lithium iron phosphate based battery—Assessment of the aging parameters and development of cycle life model. Appl. Energy 2014, 113, 1575–1585. [Google Scholar] [CrossRef]
- Lam, L.; Bauer, P.; Kelder, E. A practical circuit-based model for Li-ion battery cells in electric vehicle applications. In Proceedings of the 2011 IEEE 33rd International Telecommunications Energy Conference (INTELEC), Amsterdam, Netherlands, 9–13 October 2011; pp. 1–9. [Google Scholar]
- Thompson, A.W. Economic implications of lithium ion battery degradation for Vehicle-to-Grid (V2X) services. J. Power Sources 2018, 396, 691–709. [Google Scholar] [CrossRef]
Figure 1.
Lithium-ion (Li-Ion) technology comparison. (a) LCO; (b) LMO; (c) LFP; (d) NMC; (e) NCA; (f) LTO.
Figure 1.
Lithium-ion (Li-Ion) technology comparison. (a) LCO; (b) LMO; (c) LFP; (d) NMC; (e) NCA; (f) LTO.

Figure 2.
Li Ion Battery roadmap.

Figure 3.
Simple or linear battery model.

Figure 4.
Rint variation in NMC with (a) state of charge (SoC); (b) state of health (SoH); and (c) temperature.
Figure 4.
Rint variation in NMC with (a) state of charge (SoC); (b) state of health (SoH); and (c) temperature.

Figure 5.
Simple battery model considering charging and discharging resistances.

Figure 6.
Simple battery model considering power fade (PF).

Figure 7.
VOC variation with SoC in NMC [28].
Figure 7.
VOC variation with SoC in NMC [28].

Figure 8.
Voltage sources-based model.

Figure 9.
Resistor-capacitor (RC) or dynamic model.

Figure 10.
(First-order) Thevenin model.

Figure 11.
Second-order Thevenin model.

Figure 12.
Third-order Thevenin model.

Figure 13.
(First-order) partnership for a new generation of vehicles (PNGV) model.
Figure 14.
Second-order PNGV model.

Figure 15.
Noshin’s model.

Figure 16.
Randle’s circuit and its approximation.

Figure 17.
An impedance model of Li-Ion battery.

Figure 18.
Nyquist plot of electrochemical impedance spectroscopy (EIS) measurements on (a) different temperatures; for each temperature, the 1 Hz point is marked; (b) different SoC state; (c) several ages.
Figure 18.
Nyquist plot of electrochemical impedance spectroscopy (EIS) measurements on (a) different temperatures; for each temperature, the 1 Hz point is marked; (b) different SoC state; (c) several ages.

Figure 19.
Runtime model.

Figure 20.
Runtime-combined typical model.

Figure 21.
Li-Ion voltage and current in a cycle.


Table 1.
General classification of battery models.
| Model Nature | Model | Data | Physical Interpretability | Analogy | Accuracy | Complexity | Suited Application | ||
|---|---|---|---|---|---|---|---|---|---|
| Electro-chemical | Pure Electro-Chemical | P | H | White box | VH | H | Battery design | ||
| ECM/Reduced order Electro-Chemical | SE | M | Grey box | H | M | ||||
| Electrical | Analytical | Peukert’s model | E | L | Black box | M | M | Prediction | |
| Rakhmatov and Vrudhula | SE | M | M | M | |||||
| Sheperd other iterations | SE | M | M | M | |||||
| State-Space | E | L | M | M | |||||
| ECM | Simples | Simple Rint | E | M | Grey box | L | L | Real time control, SoC estimation, … | |
| Enhanced Rint | SE | M | L | L | |||||
| RC | SE | M | L | L | |||||
| Thevenin | 1st order | SE | M | L–H | L–H | ||||
| 2nd order | SE | M | |||||||
| 3rd order | SE | M | |||||||
| nth order | SE | M | |||||||
| PNGV | 1st order | SE | M | L–H | L–H | ||||
| 2nd order | SE | M | |||||||
| nth order | SE | M | |||||||
| Noshin | SE | M | M | M | |||||
| Neural nets | E | L | H | H | |||||
| Impedance | Frequency domain | SE | L–M | Grey box | M | M | Characterization and real time operation | ||
| Thermal | Analytical Thermal | P–SE | H | White box | H | H | Real time | ||
| ECM Thermal | SE | M | Grey box | M | M | ||||
| Mechanical/Fatigue | Fatigue/Mechanical | P–SE | H | Grey box | H | Design | |||
| Abstract model | Artificial Intelligence | E | L | Black box | M | M | Offline analysis | ||
| Combined models | Electro-Thermal | SE | M | Grey box | M | Real time | |||
| Thermo-electrochemical | P | H | L–H | H | |||||
| Thermo-Mechanical | SE | H | H | ||||||
* E: Empirical, H: High, L: Low, M: Medium, P: Physical, SE: Semi-Empirical, VH: Very High.
Table 2.
Batteries electrical model classification.
| Predicting Capability | Thevenin Based/PNGV Models (ECM) | Impedance Based Models | Runtime-Combined Based Models |
|---|---|---|---|
| DC | No | No | Yes |
| AC | Limited | Yes | No |
| Transient | Yes | Limited | Limited |
| Battery Runtime | No | No | Yes |
Table 3.
Comparison of the error in percentage [%] among electrical equivalent circuits.
| Test | 50% SoC, 1C | Pulse Test | DDP Test | Capacity Test 1C | Capacity Test 5C | ||||||||
|---|---|---|---|---|---|---|---|---|---|---|---|---|---|
| DoD [%] | 0–5 | 5–90 | 90–100 | 0–5 | 5–90 | 90–100 | 0–5 | 5–90 | 90–100 | 0–5 | 5–90 | 90–100 | |
| Rint | 0.2 | 4.5 | 7 | 14 | 5 | 15 | 20 | 3 | 5 | 18 | 8 | 9 | 19.2 |
| RC | 0.3 | 8 | 2 | 55 | 5 | 5 | 46 | 7 | 2 | 58 | 6 | 5 | 50 |
| Thevenin | 0.2 | 3.5 | 5 | 17 | 4 | 4 | 15 | 2 | 1 | 20 | 2 | 7 | 19 |
| PNGV | 0.2 | 2 | 1.5 | 25 | 4 | 3.5 | 19 | 2 | 1.5 | 29 | 6 | 12 | 18 |
| 2nd order PNGV | 0.1 | 2 | 2 | 19 | 2.5 | 2 | 14 | 2 | 2 | 25 | 4 | 14 | 35 |
| 3rd order PNGV | 0.2 | 1.5 | 2 | 17 | 3 | 1 | 13 | 2 | 2 | 23 | 3 | 12 | 28 |
| Noshin | 0.2 | 2 | 1.5 | 13.5 | 2.5 | 3 | 14 | 2 | 1 | 16.5 | 2 | 2 | 12.5 |
Table 4.
Analyzed literature summary.
| Model | Objective | Considerations | Battery Type | Year | Ref | |||
|---|---|---|---|---|---|---|---|---|
| Effects | Parameters | |||||||
| ECM | Simple | Ideal | Model | VOC | Li-Ion | 1997 | [15] | |
| Linear | Energy management | SoC, T | VOC, Rint | LFP (Li-Ion) | 2017 | [22] | ||
| HEV Simulation | SoC | Li-Ion | 2007 | [23] | ||||
| 2017 | [24] | |||||||
| SoC estimation | Lead-Acid | 2001 | [25] | |||||
| Model | Ccap, Rint | LFP (Li-Ion) | 2013 | [82] | ||||
| RC | SoC estimation | Pol, Prop, SoC | CB, RB, Rint, RP, CP | Li-Ion | 2013 | [33] | ||
| 2014 | [35] | |||||||
| LIPO (Li-Ion) | 2008 | [34] | ||||||
| Thev | 1 Order | SoC estimation | Pol, SoC | VOC, Rint, RP, CP | LCO (Li-Ion) | 2018 | [32] | |
| Stability analysis and SoC estimation | Li-Ion | 2015 | [37] | |||||
| Batteries parallelization | 2016 | [38] | ||||||
| SoC and SoH model | Pol, SoC, SoH, T | 2011 | [39] | |||||
| Power Electronic | Pol, SoC, | 2013 | [40] | |||||
| EP-Thevenein model | LFP (Li-Ion) | 2011 | [41] | |||||
| Life model | Pol, SoC, T | LFP (Li-Ion) | 2017 | [83] | ||||
| System design | Li-Ion | 2002 | [84] | |||||
| Parameter regression | Pol, SoC, T, Hyst | Pb-acid, NiMH, Li-ion | 2006 | [85] | ||||
| 2 order | Model | T, CF | VOC, Rint, 2RC | Li-Ion | 2009 | [45] | ||
| SoC estimation | Pol, SoC | 2016 | [46] | |||||
| SoC, SoH, and SoF estimation | SoC, SoH, SoF | 2018 | [47] | |||||
| Model | Pol, SoC, SoH, T | NMC (Li-Ion) | 2018 | [48] | ||||
| Characterization | [18] | |||||||
| Model | Pol, SoC, T | NMC, LFP, LTO (Li-Ion) | 2018 | [86] | ||||
| NMC (Li Ion) | 2016 | [87] | ||||||
| 2018 | [88] | |||||||
| Fault diagnosis | Pol, SoC | Li-Ion | 2013 | [89] | ||||
| Life model | Pol, SoC, T, SoH | 2017 | [90] | |||||
| 3 order | Model | SoC,Pol | VOC, Rint, 3RC | Li-Ion | 2016 | [50] | ||
| Model for V2G | SoC, Pol, T, Hyst | 2012 | [51] | |||||
| PNGV | 1 order | SoH estimation | Pol, ID, SoC, | LFP (Li-Ion) | 2018 | [53] | ||
| Pol, ID, SoH, SoC, T | VOC, Rint, C0, RC | 2016 | [54] | |||||
| Model | Pol, ID, Hyst, SoC, T | LFP and NMC (Li-Ion) | 2014 | [55] | ||||
| 2 order | Life model | Pol, SoC, T | VOC, Rint, C0,2RC | LFP (Li-Ion) | 2014 | [91] | ||
| Noshin | Model | Pol, SoC, SoH, T | VOC, Rint, RP, CP | Li-Ion | 2012 | [58] | ||
| Freq | 2 order | Kinetics Study | Pol | VOC, Rint, 2ZArc | LFP (Li-Ion) | 2015 | [74] | |
| Characterization | Pol, SoC, T | NMC (Li-Ion) | 2014 | [75] | ||||
| Model | Pol, SoC | VOC, L, Rint, 2ZArc | Li-Ion | 2014 | [77] | |||
| 3 order | Model | Pol | VOC, L, Rint, 3ZArc | Li-Ion | 2012 | [76] | ||
| RT | Thev | 2 order | Model | Pol, SoC, T, cycles | VOC, Rint, 2RC, Ccap | Li-Ion, Ni-MH | 2006 | [13] |
| Model for EV | LFP (Li-Ion) | 2011 | [92] | |||||
| 3 order | Model for EV | Pol, SoC, T, cycles | VOC, Rint, 3RC, Ccap | Li-Ion | 2011 | [5] | ||
| Li-Ion, Ni-MH | 2008 | [79] | ||||||
| SoC, Pol, T | Li-Ion, Lead acid, Ni-MH | 2016 | [80] | |||||
CF: Capacity fade, ECM: Equivalent circuit model; Freq: Frequency, Hyst: Hysteresis, ID: Ion-diffusion, Pol: Polarization, Prop: Propagation, RT: Runtime, SoC: State of charge, SoF: State of function, SoH: State of health, T: Temperature, Thev: Thevenin.
© 2019 by the authors. Licensee MDPI, Basel, Switzerland. This article is an open access article distributed under the terms and conditions of the Creative Commons Attribution (CC BY) license (http://creativecommons.org/licenses/by/4.0/).
Share and Cite
MDPI and ACS Style
Saldaña, G.; San Martín, J.I.; Zamora, I.; Asensio, F.J.; Oñederra, O. Analysis of the Current Electric Battery Models for Electric Vehicle Simulation. Energies 2019, 12, 2750. https://doi.org/10.3390/en12142750
AMA Style
Saldaña G, San Martín JI, Zamora I, Asensio FJ, Oñederra O. Analysis of the Current Electric Battery Models for Electric Vehicle Simulation. Energies. 2019; 12(14):2750. https://doi.org/10.3390/en12142750
Chicago/Turabian StyleSaldaña, Gaizka, José Ignacio San Martín, Inmaculada Zamora, Francisco Javier Asensio, and Oier Oñederra. 2019. "Analysis of the Current Electric Battery Models for Electric Vehicle Simulation" Energies 12, no. 14: 2750. https://doi.org/10.3390/en12142750
Note that from the first issue of 2016, this journal uses article numbers instead of page numbers. See further details here.