A Study of Energy Simulation Integrated Process by Automated Extraction Module of the BIM Geometry Module


1
Smart Greenbuilding Lab, EAN Technology, 06159 Seoul, Korea
2
Department of Architectural Engineering, Dong-Eui University, Busan 47340, Korea
3
Smart Greenbuilding Lab, EAN Technology, 06159 Seoul, Korea
4
Department of Architectural Engineering, ERI, Gyeongsang National University, Jinju 52828, Korea
5
Architectural Engineering Major, Division of Urban, Architecture and Civil Engineering, Dong-Eui University, Busan 47340, Korea
*
Author to whom correspondence should be addressed.
Energies 2019, 12(13), 2461; https://doi.org/10.3390/en12132461
Submission received: 29 May 2019
/
Revised: 13 June 2019
/
Accepted: 23 June 2019
/
Published: 26 June 2019
Abstract
:Despite the international trend of actively utilizing BIM in the field of energy simulation, it is difficult to actively utilize BIM in domestic certification-related practice. As a result, the work process is not integrated and the work efficiency is reduced, such as the occurrence of redundant tasks. In this paper, the integrated process based on the BIM geometry information automated extraction module was presented and its effectiveness was reviewed and verified through self-developed automation module and uniformity and error-causing analysis. The construction of an integrated process through automatic configuration information extraction has the advantages of reducing the workload, enabling additional tasks through module function expansion, sharing information through the web, and ease of service manufacture. In addition, an experiment comparing the data of automatic and manual calculations with three subjects confirmed that automatic calculation database through automation module can produce a more reliable and uniform database with a lower proportion of human error than the manual calculation module. This not only improves the reliability of the energy simulation itself, but also reduces the human and temporal loads that occur during the post-simulation data verification process.
1. Introduction
1.1. Research Background
Building information modeling (BIM) is digitalized knowledge to represent physical and functional characteristics of a building and an intellectual resource for sharing information to establish a basis for a reliable decision-making process throughout the whole life-cycle of a building (from the conception to the destruction) [1]. The terms virtual building by Graphisoft and integrated project models by Bentley System used to represent the same concept until Autodesk published the white paper named Building Information Model [2] in 2002. Since then, the term BIM has been popular and standardized. Currently, the use of BIM in the field of energy simulation focuses mostly on automated input of the geometry. Especially, while performing dynamic energy simulation, variables, except the geometry data, determining energy performance such, as the material property, the air conditioning, and heating system and the tenant schedule of a building, can be influenced by a subjective judgment of the user. In other words, individual biases can cause differences in the outcome and the uncertainty of the simulation procedure [3]. Because of such uncertainty with the BIM neutral format, such as IFC (industry foundation class) and gbXML (green building XML), it is difficult for all energy simulation variables to be included in the simulation process. Especially, uncertainty in energy simulation increases with existing buildings [4]. In contrast, due to its relatively low uncertainty, a simple geometry module leaves less room for a subjective judgment by the user-guided by modeling instructions.
Presently, under current practical circumstances, the major purpose of energy simulation is to acquire various domestic and global certificates related to green buildings. However, each certification institution has its own qualification standards for energy simulation and hence the client is required to perform energy simulation for each institution. For example, LEED (Leadership in Energy and Environmental Design) of the US Green Building Council is based on dynamic energy simulation and does not specify any simulation program [5]. However, the National Energy Conservation Plan requires performing simulations using a comprehensive program designed to evaluate heating, cooling, hot water, lights and ventilation of a building based on international standards, such as ISO 13790 [6]. In line with this, the Korea Energy Agency encourages the use of ECO2, which was designed to meet the domestic standards.
For this reason, in the field of the dynamic simulation meeting the global standards, automated input of the geometry based on BIM is encouraged and collaborative efforts have been made across various fields, as shown in some examples: The integration of BIM and GBS (green building assessment) [7], the Internet of things [8,9] and the combination of GIS (geographic information system) and simulation methods [10]. With simulation programs designed to meet the domestic standards, the geometry input is only manually operated, not through BIM due to their exclusive characteristics. The aforementioned differences in the input method among simulation programs inevitably lead to a separated work process, causing the occurrence of redundancy in the phase of the geometry data input, decrease of work productivity, and an increase in human error rates.
This study aims to present an integrated process with the minimum of a manual input process through an automated extraction module of the BIM geometry and to examine and verify its effectiveness.
1.2. Research Scope and Method
To design an integrated process of energy simulation through an automated extraction module of the BIM geometry and to verify its effectiveness, this study (1) analyzed a practical process currently performed for certification-related practice, (2) presented an integrated process model to which an existing automated module was applied, (3) examined the effectiveness of the integrated process, and (4) compared the databases constructed through an integrated process with the ones constructed through the current process and analyzed errors occurring in the process of the experiment.
2. Literature Review
In the field of energy including dynamic energy simulation [11,12], such as Energy Plus and Trnsys, research on information exchange through BIM can be divided into two types: (1) Research on the construction of a database by directly converting neutral files and (2) research on the improvement of the compatibility of the neutral file format. Among these, the extraction of the geometry data belongs to the direct conversion of the neutral file format, and there have been studies on the extraction of the geometry data through the IFC file format for the calculation of the energy load and the evaluation of the energy performance of a building [13,14]. However, most of the recently reported studies on the geometry extraction exclude the concept of reconstructing the geometry focused on spatial information. The problem is that if a building consists of more than one thermal space (thermal space: a basic unit for energy simulation (areas of the same thermal space have the same air conditioning system)) unit, spatially overlapping objects can cause false recognition in the simulation process [15]. Hence, the geometry database extracted with the existing technology is not considered to be fit for energy simulation in the practical process. Although there have been studies on natural language-based classification techniques in an attempt to overcome the uncertainty of BIM [16,17], the classification techniques cannot be practically used in the field due to their insufficient accuracy.
Although there have been studies on the improvement of the compatibility including a study on the compatibility between the IFC and the IDF file format of Energy Plus [18] and a study between the IFC and the BTA file format [19], those studies hardly have the utility with programs allowing manual data input only.
3. Analysis of Work Process and Automated Extraction of Geometry Data Module
3.1. Analysis of Work Process
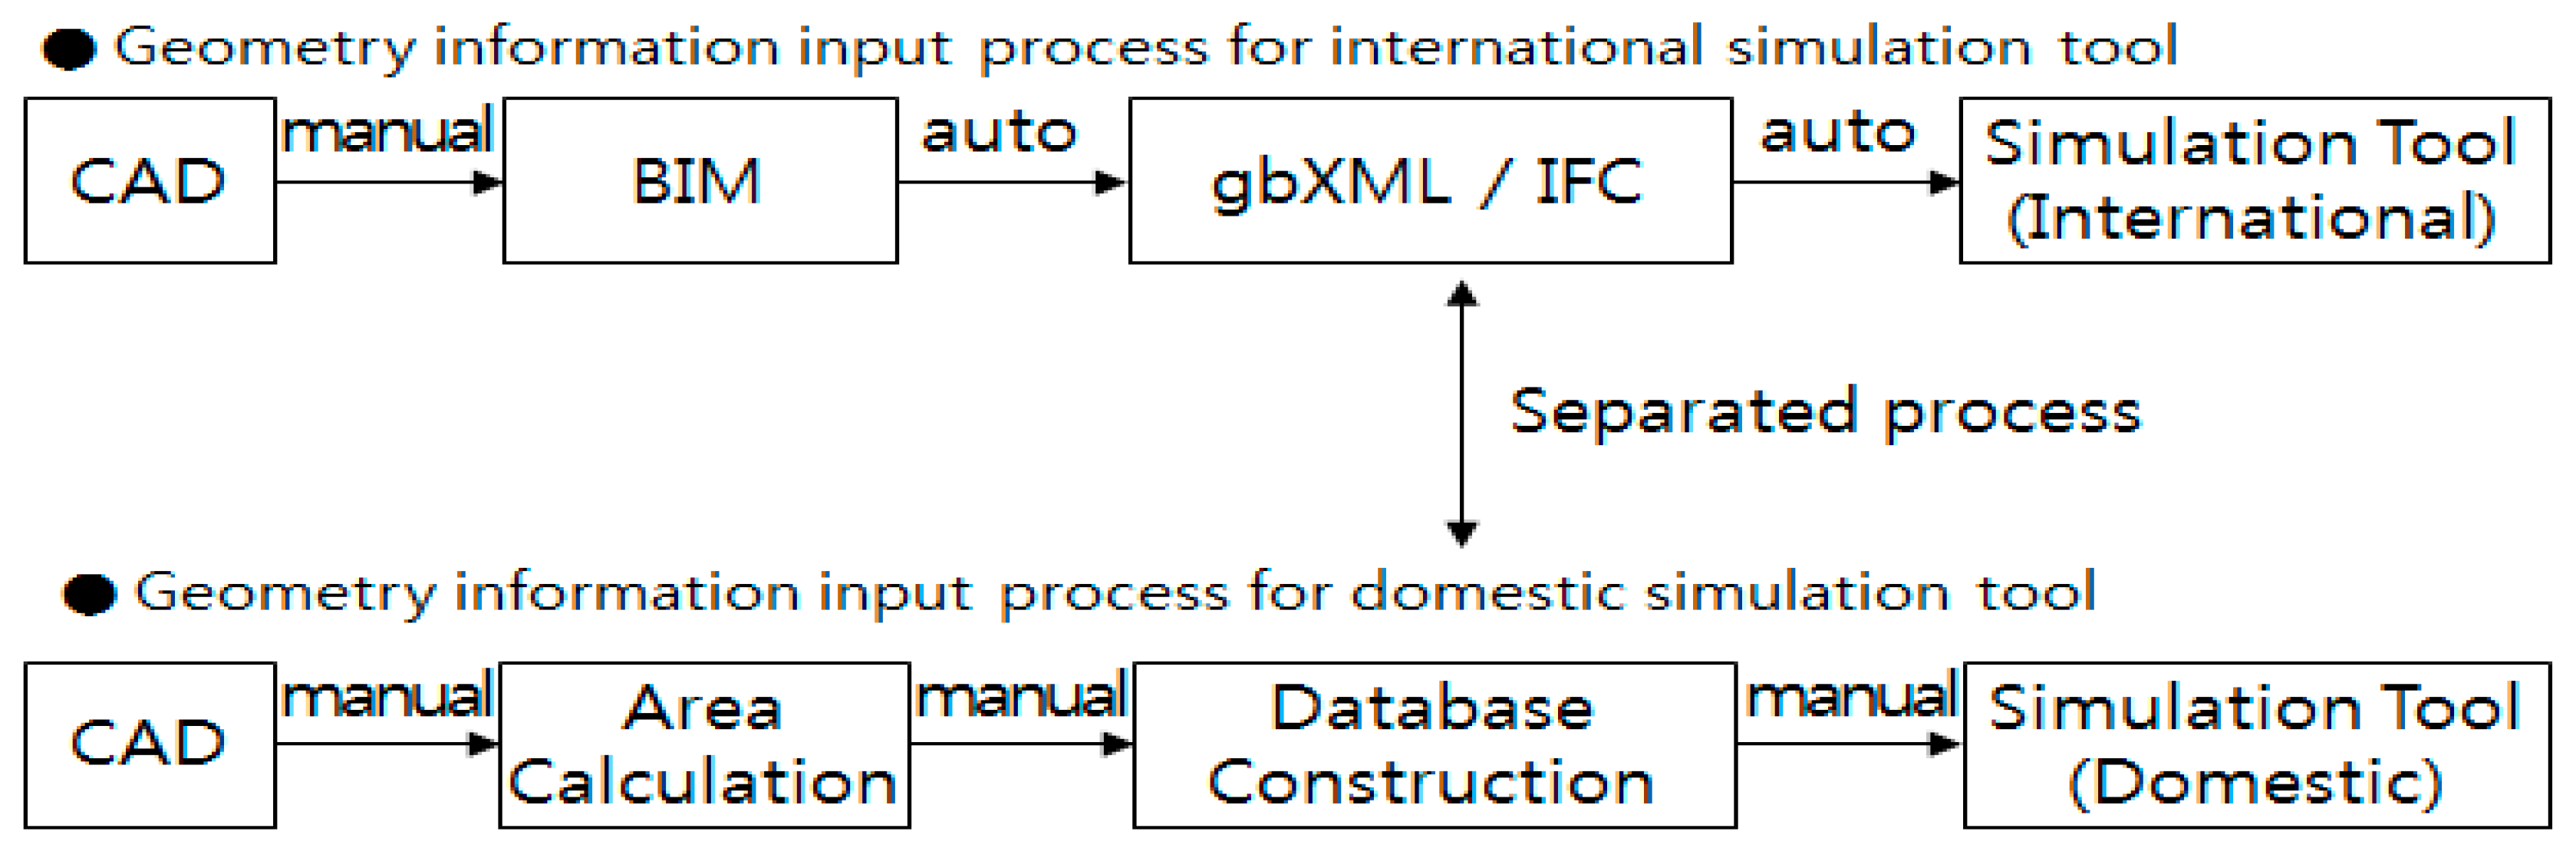
In the current work environment, purposes of the energy simulation for the environmentally friendly certification are divided into two: One that is to meet the global standards such as LEED and the other to meet the domestic standards for energy-saving design.
LEED requires the use of dynamic simulation programs for energy simulation, and currently, various BIM modeling software programs (Autodesk Revit, ArchiCAD, etc.) are used to create neutral files (IFC and gbXML) which are compatible with the dynamic simulation file format. Moreover, some BIM modeling software programs designed for energy simulation including OpenStudio provide conversion service into the IDF file format for users of the software such as Energy Plus, which does not allow input of the neutral file format. GBS (Green Building Studio) [20], too, provides conversion service which makes the gbXML file format function in eQuest.
As mentioned above, in an attempt to reduce work redundancy of geometry data input for energy simulation and to facilitate sharing and reuse of construction information, efforts have been made by international certification institutions. In contrast, ECO2, which is distributed by the Korea Energy Agency for the energy efficiency rating and the energy consumption evaluation of a building described in an energy conservation plan and a design review letter, does not provide conversion service among programs and does not automatically extract the geometry data sent in the form of the neutral file format. Because of this, the user has to construct the geometry data through manual calculation before data input. The database which needs manual calculation includes measures of wall surface, window, floor areas, the height, and the direction of each room.
Therefore, for the certification process of LEED and energy efficiency rating certification, the construction of both a 3D model through a modeling program and the geometry database through manual calculation should be carried out separately. Figure 1 shows the two work processes which were conducted separately, and simulation for the domestic standards is carried out manually throughout the whole process.
Hence, this study represents an integrated process shown in Figure 2. The integrated process automates, except for the data input process, the area calculation and the database construction, both of which have been manually carried out, by using the automated extraction module described in Section 3.2 to process the neutral files created by BIM.
In Section 4, practical advantages expected by constructing the integrated process are examined. In Section 5, to compare the credibility of the integrated process with that of the existing process, the conformity was obtained by ensuring that each database constructed by multiple users is the same as one another regardless of the user traits, and the causes of the errors occurring during the whole process were analyzed.
3.2. An Automated Extraction of the Geometry Module Based on BIM
In a previous study [15], using Python, a geometry extraction module (Figure 3) that focused on spatial information was created and verified in terms of accuracy.
The features of the module are as follows:
- ①
- The increased utility in the field of energy simulation by extracting from IFC files the physical geometry data focused on spatial information;
- ②
- The maximization of the utility in the work process by realizing the information processing procedure in the module including the determination of boundaries between the internal and external area, the recalculation of the area and the determination of the cardinal points;
- ③
- The establishment of relevance to domestic energy simulation programs for certification-related practice by providing the geometry database.
The module was developed as an automation module for the integrated process this study presented, and it was used as a tool for the comparison of the databases described in Section 5.
4. The Review of the Effectiveness of the Integrated Process
First, the construction of the integrated process influences the work process by reducing workload. Through the automated module, the process of area measure and the manual construction of a database are necessarily removed from the procedure due to the integration of the separated processes. That means reduced labor and work time is needed in the energy simulation process.
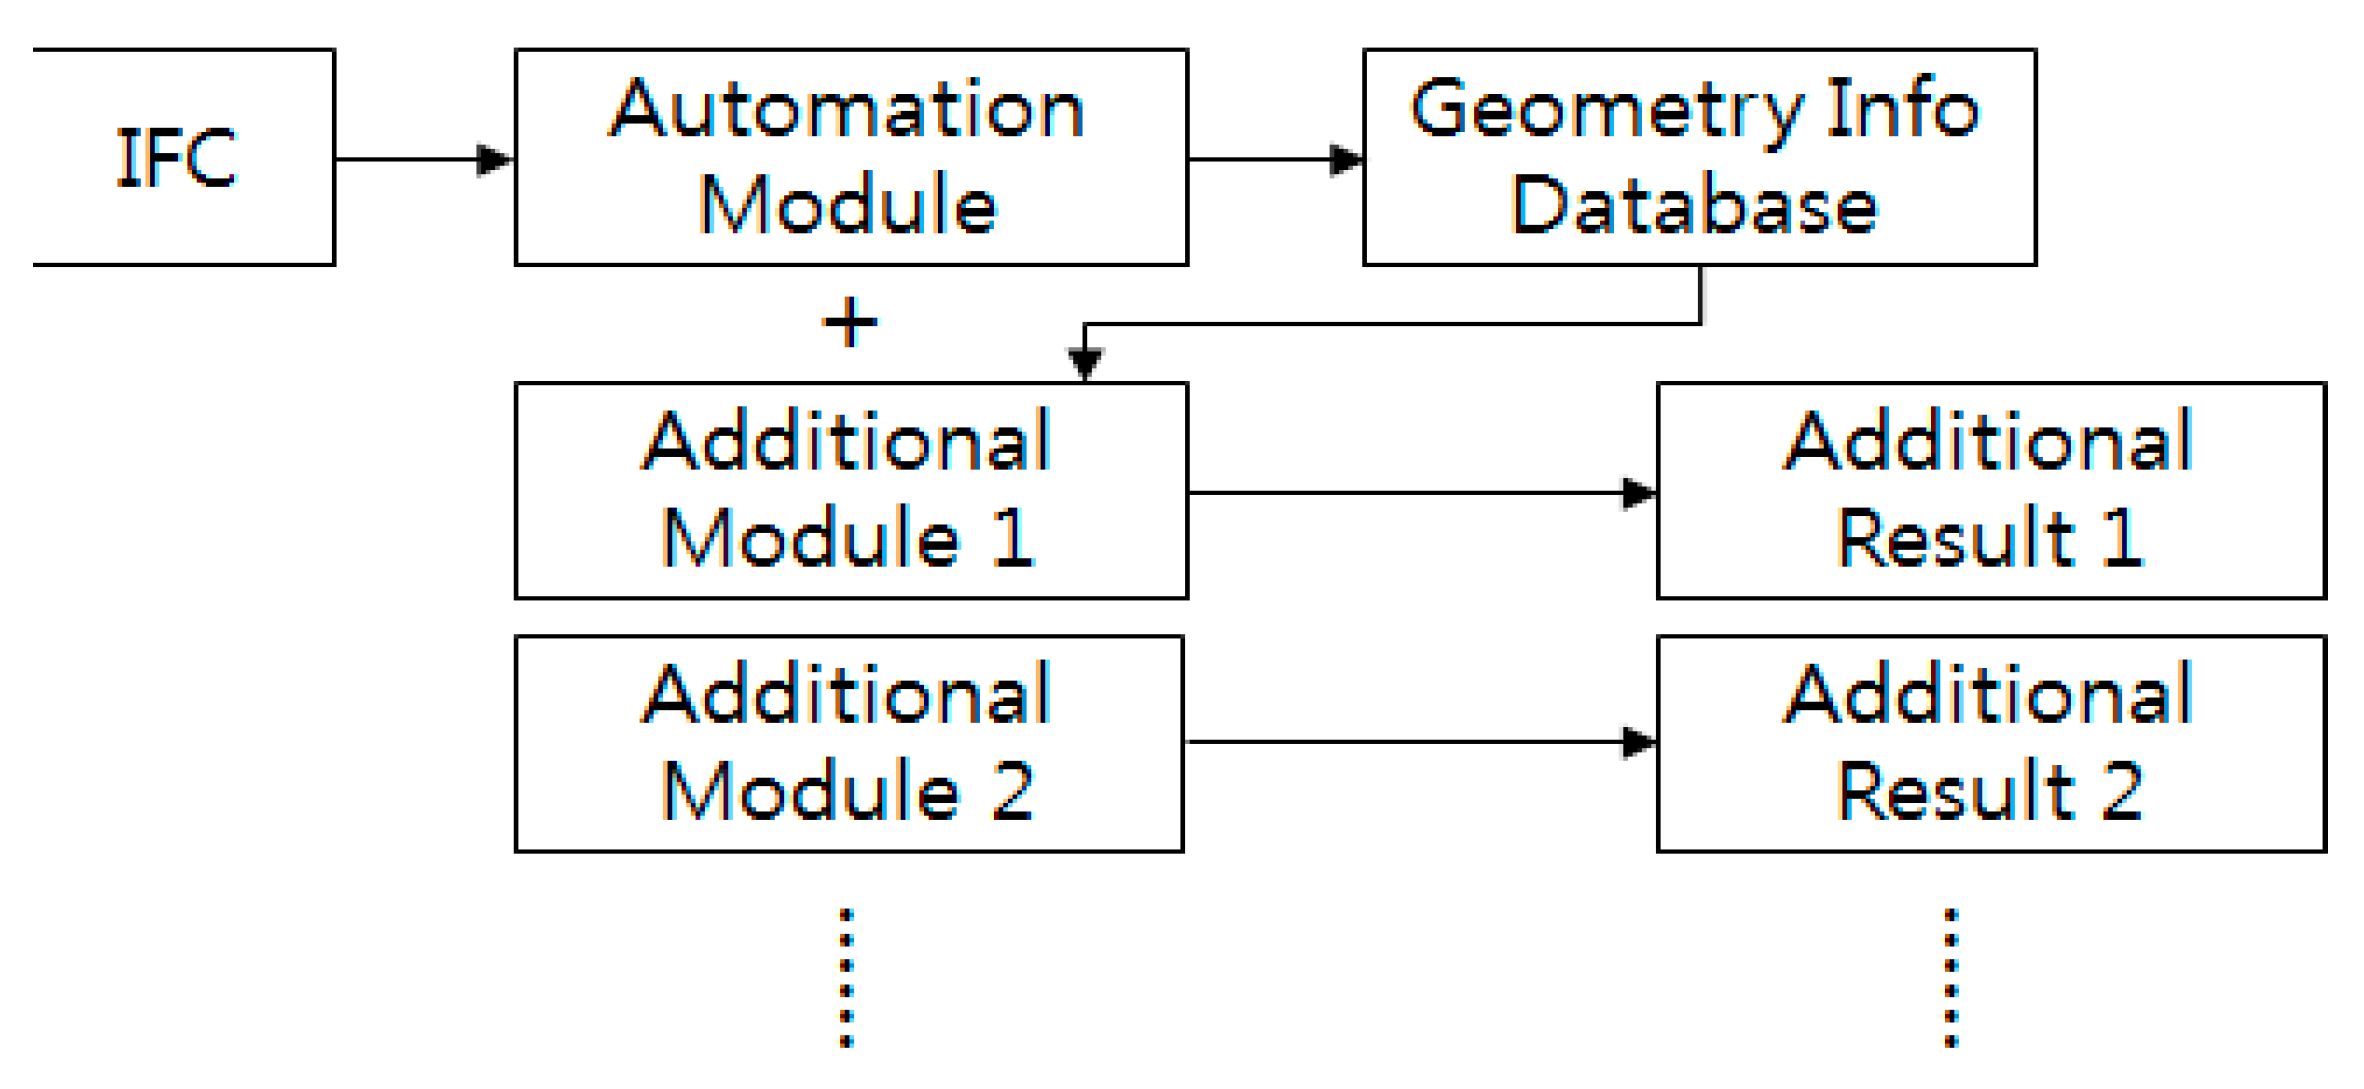
Second, it is easy to expand the functions of the module due to the expandability of an automated module. That means that performing additional work is possible through the database constructed in the automated extraction of the geometry module, as illustrated in Figure 4.
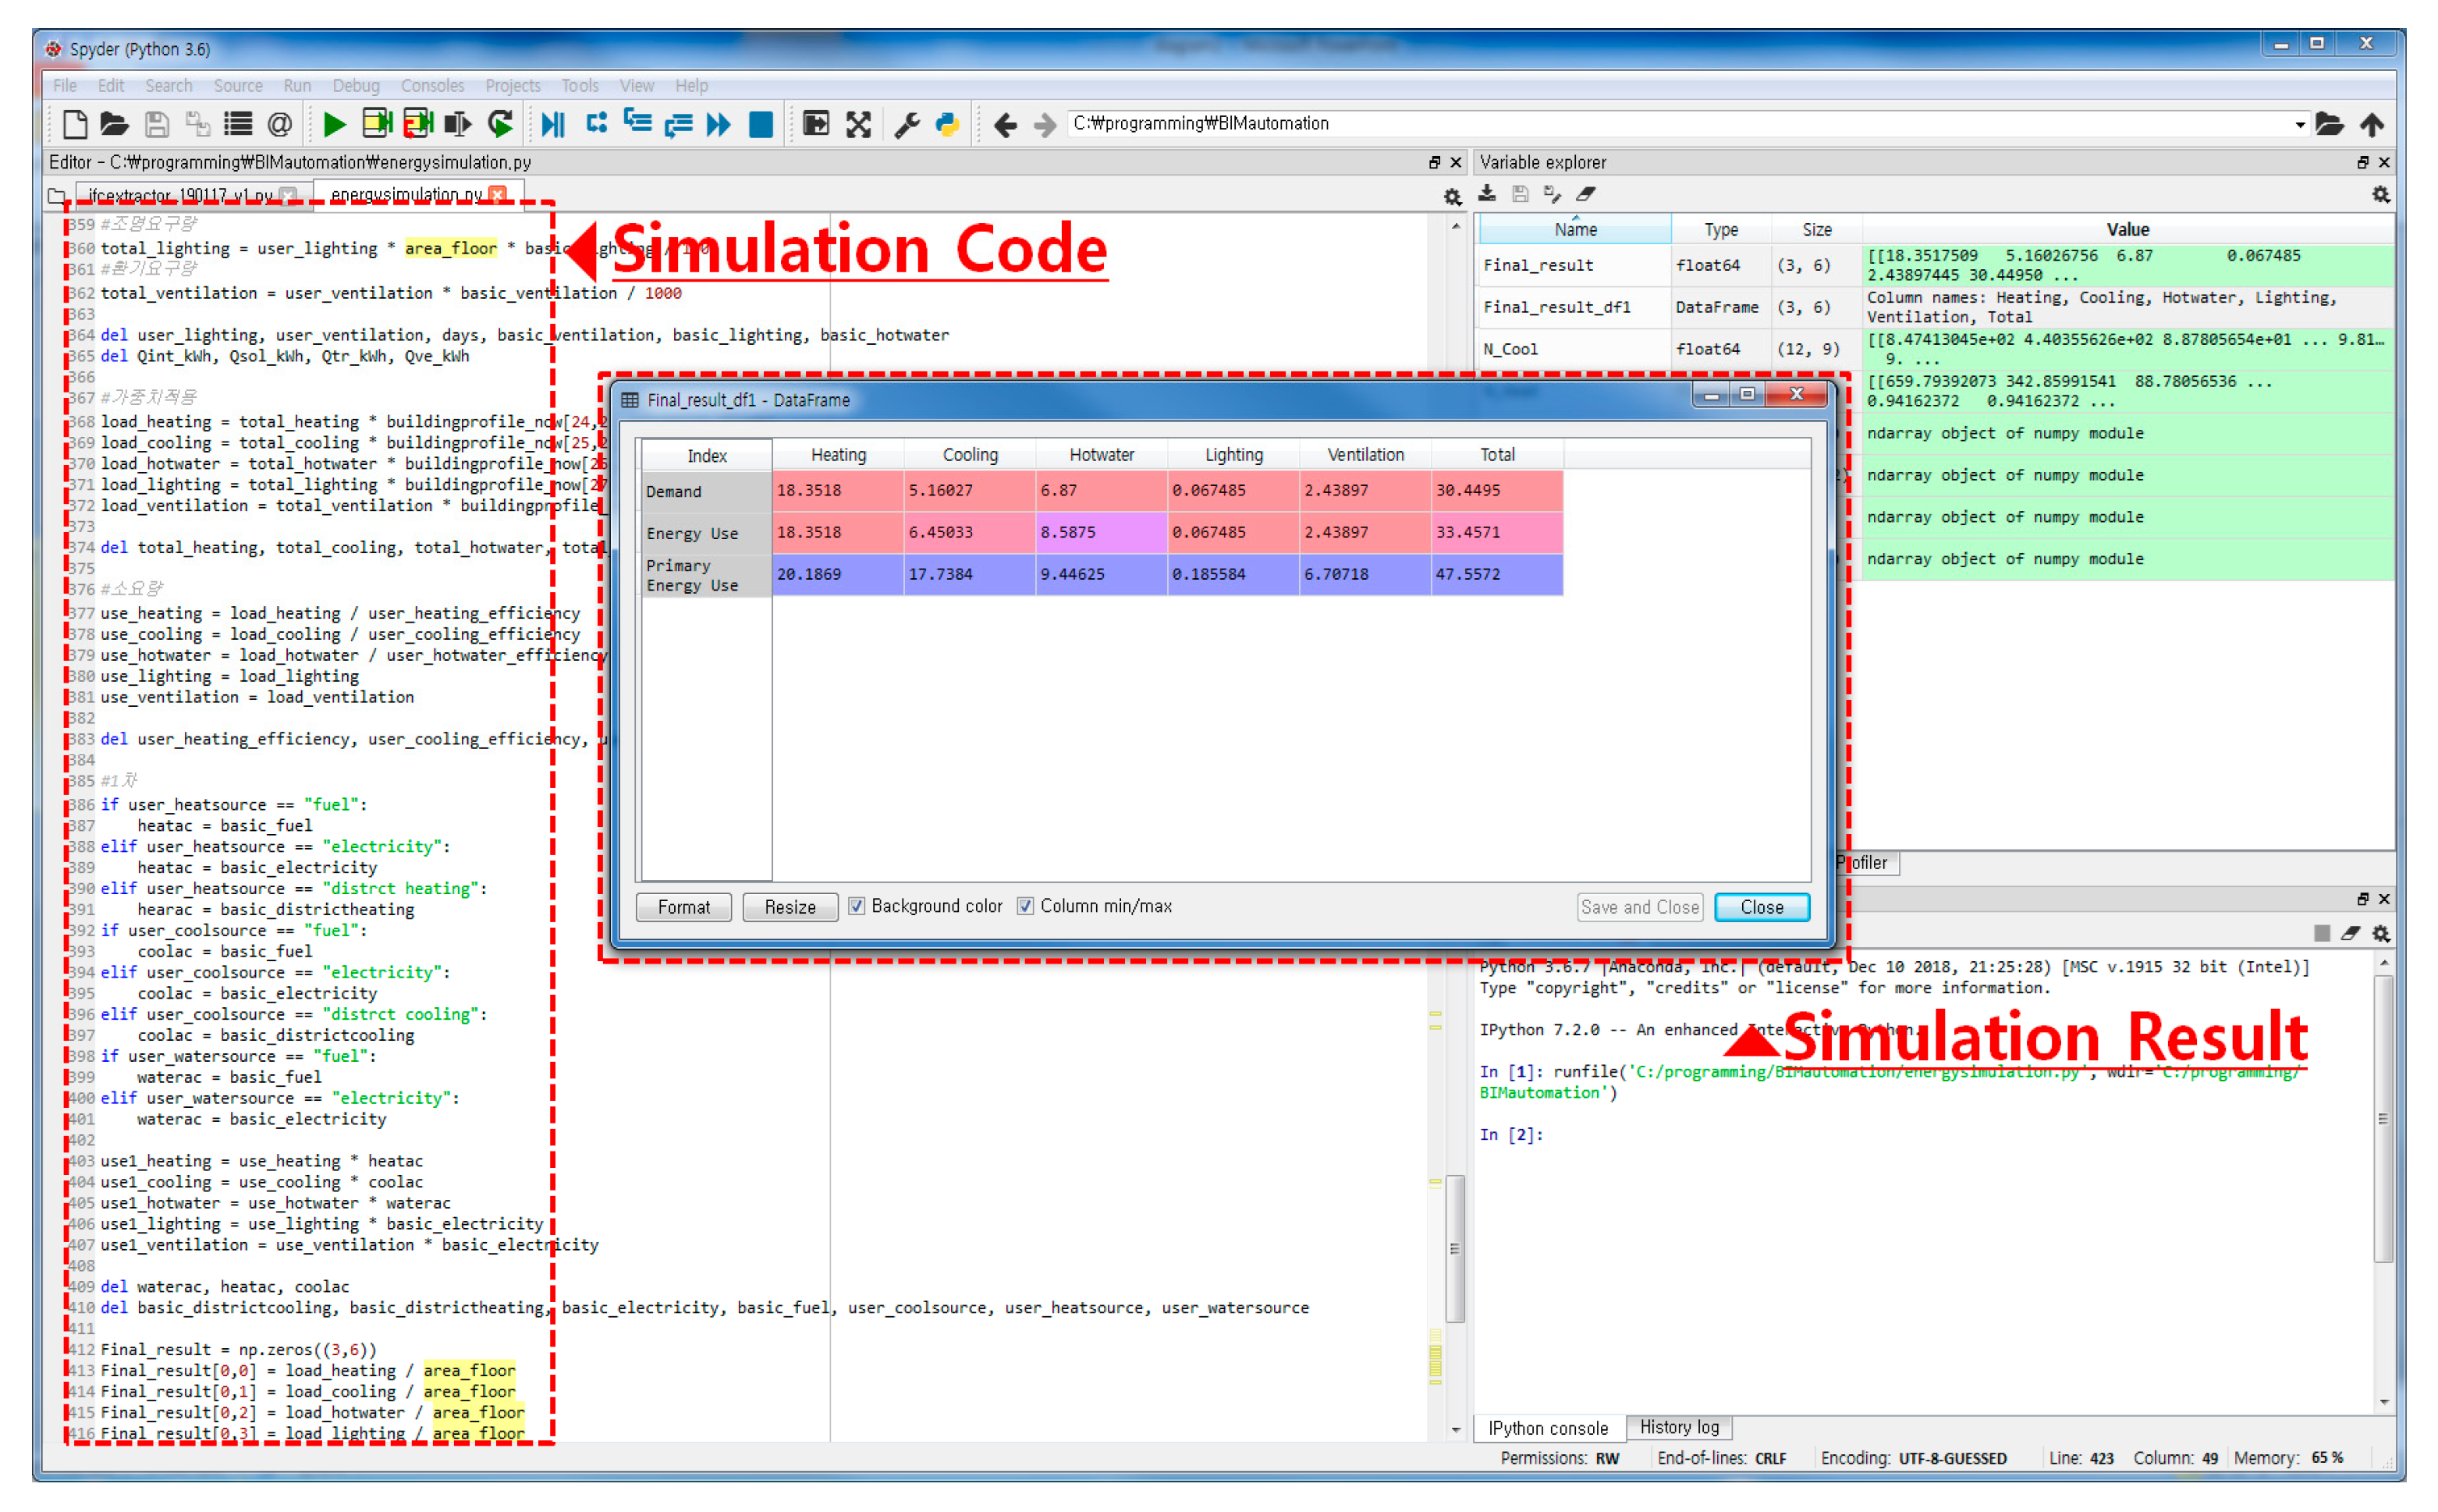
Heating and cooling load are calculated using ISO 13790 module (Figure 5) and the geometry database, both of which were created for the BIM-based automated extraction of the geometry reconstructed with primarily spatial information.
Third, it is convenient to share information through the Internet and to provide service. BIMkeeper (https://bimkeeper.com/) [21] and IFC WebServer (http://www.ifcwebserver.org/) [22] provide 3D viewer service by uploading IFC files on their web pages, and Green Building Studio. (n.d.) (https://gbs.autodesk.com/) [20] provides an energy simulation service using gbXML files based on the DOE-2 engine. Moreover, cases of a performance analysis of the construction environment based on BIM web service [23] and energy simulation [24] were reported in Korea. The aforementioned services make it possible to share the geometry data through the Internet, which ensures not only the convenience for users but the transparency of the simulation process.
5. The Examination of the Credibility of the Database Constructed by the Automated Extraction Module
5.1. Human Error Occurring during Manual Calculation
Wickens et al. [25] divided human error into three types according to human information processing [26].
- Errors of recognition: Errors occurring during the information input by a sensory organ, including identification mistakes.
- Errors of decision: Errors occurring during the decision-making of central nerves, including decision-making mistakes and memory failure.
- Errors of performance: Errors occurring when one fails to complete an order from the motor center.
The aforementioned errors can occur not only in the process of manually constructing the geometry database but also in most office work. However, in the case of the geometry data, as the size of a building gets bigger, and its structure gets more complex, the amount of data increases exponentially. The extraction of the geometry data is an initial phase of the simulation process, so it is challenging for the simulation performer to recognize the occurrence of errors during the procedure, causing decreased credibility of the outcome.
Especially, the construction of the geometry database is the phase in which subjective judgments of the user are less likely to happen, so if a human error does not happen in the construction process, a certain degree of uniformity should be secured regardless of who the user is.
This study recruited three subjects and had each of them do both manual calculation and automated calculation through BIM modeling on three buildings (the module described Section 3.2 paragraph was used). After this step, the degree of uniformity the two types of calculation methods represented was compared, and the causes of errors which lowers the degree of uniformity were examined.
5.2. Simulation Module, Recruitment of the Subjects and Experiment Method
The authors chose office buildings for which drawings were available and selected three of them with their sizes, as shown in Table 1 and Table 2 shows the images of modeling.
Model A is a two-story public building located in Daegu, and its total floor area is 551.84 m2. Model B is a mid-sized five-story office building located in Changwon, and its total floor area is 1696.95 m2. Model C is a five-story large-scale office building located in Gwangyang, and its total floor area is 6894.80 m2.
Three subjects were recruited to examine the degree of uniformity of the newly constructed databases from the three chosen models. The skill levels in CAD and BIM software of each subject were different from one another. Three individuals were recruited for the relative evaluation of the uniformity degree because a small group of subjects was believed to be better at thoroughly analyzing errors with an in-depth comparison than a large group of subjects.
Of the applicants working in the field of energy simulation for buildings, three individuals were chosen, and the skill level of each subject is shown in Table 3. Subject A is an employee with experience of less than one year and is less skillful in CAD and 3D modeling than the other two subjects. Subject B has three years’ experience in the field and has an intermediate level of mastery in CAD and 3D modeling. Subject C has a career of over eight years in the same area and a high level of skills in both CAD and 3D modeling.
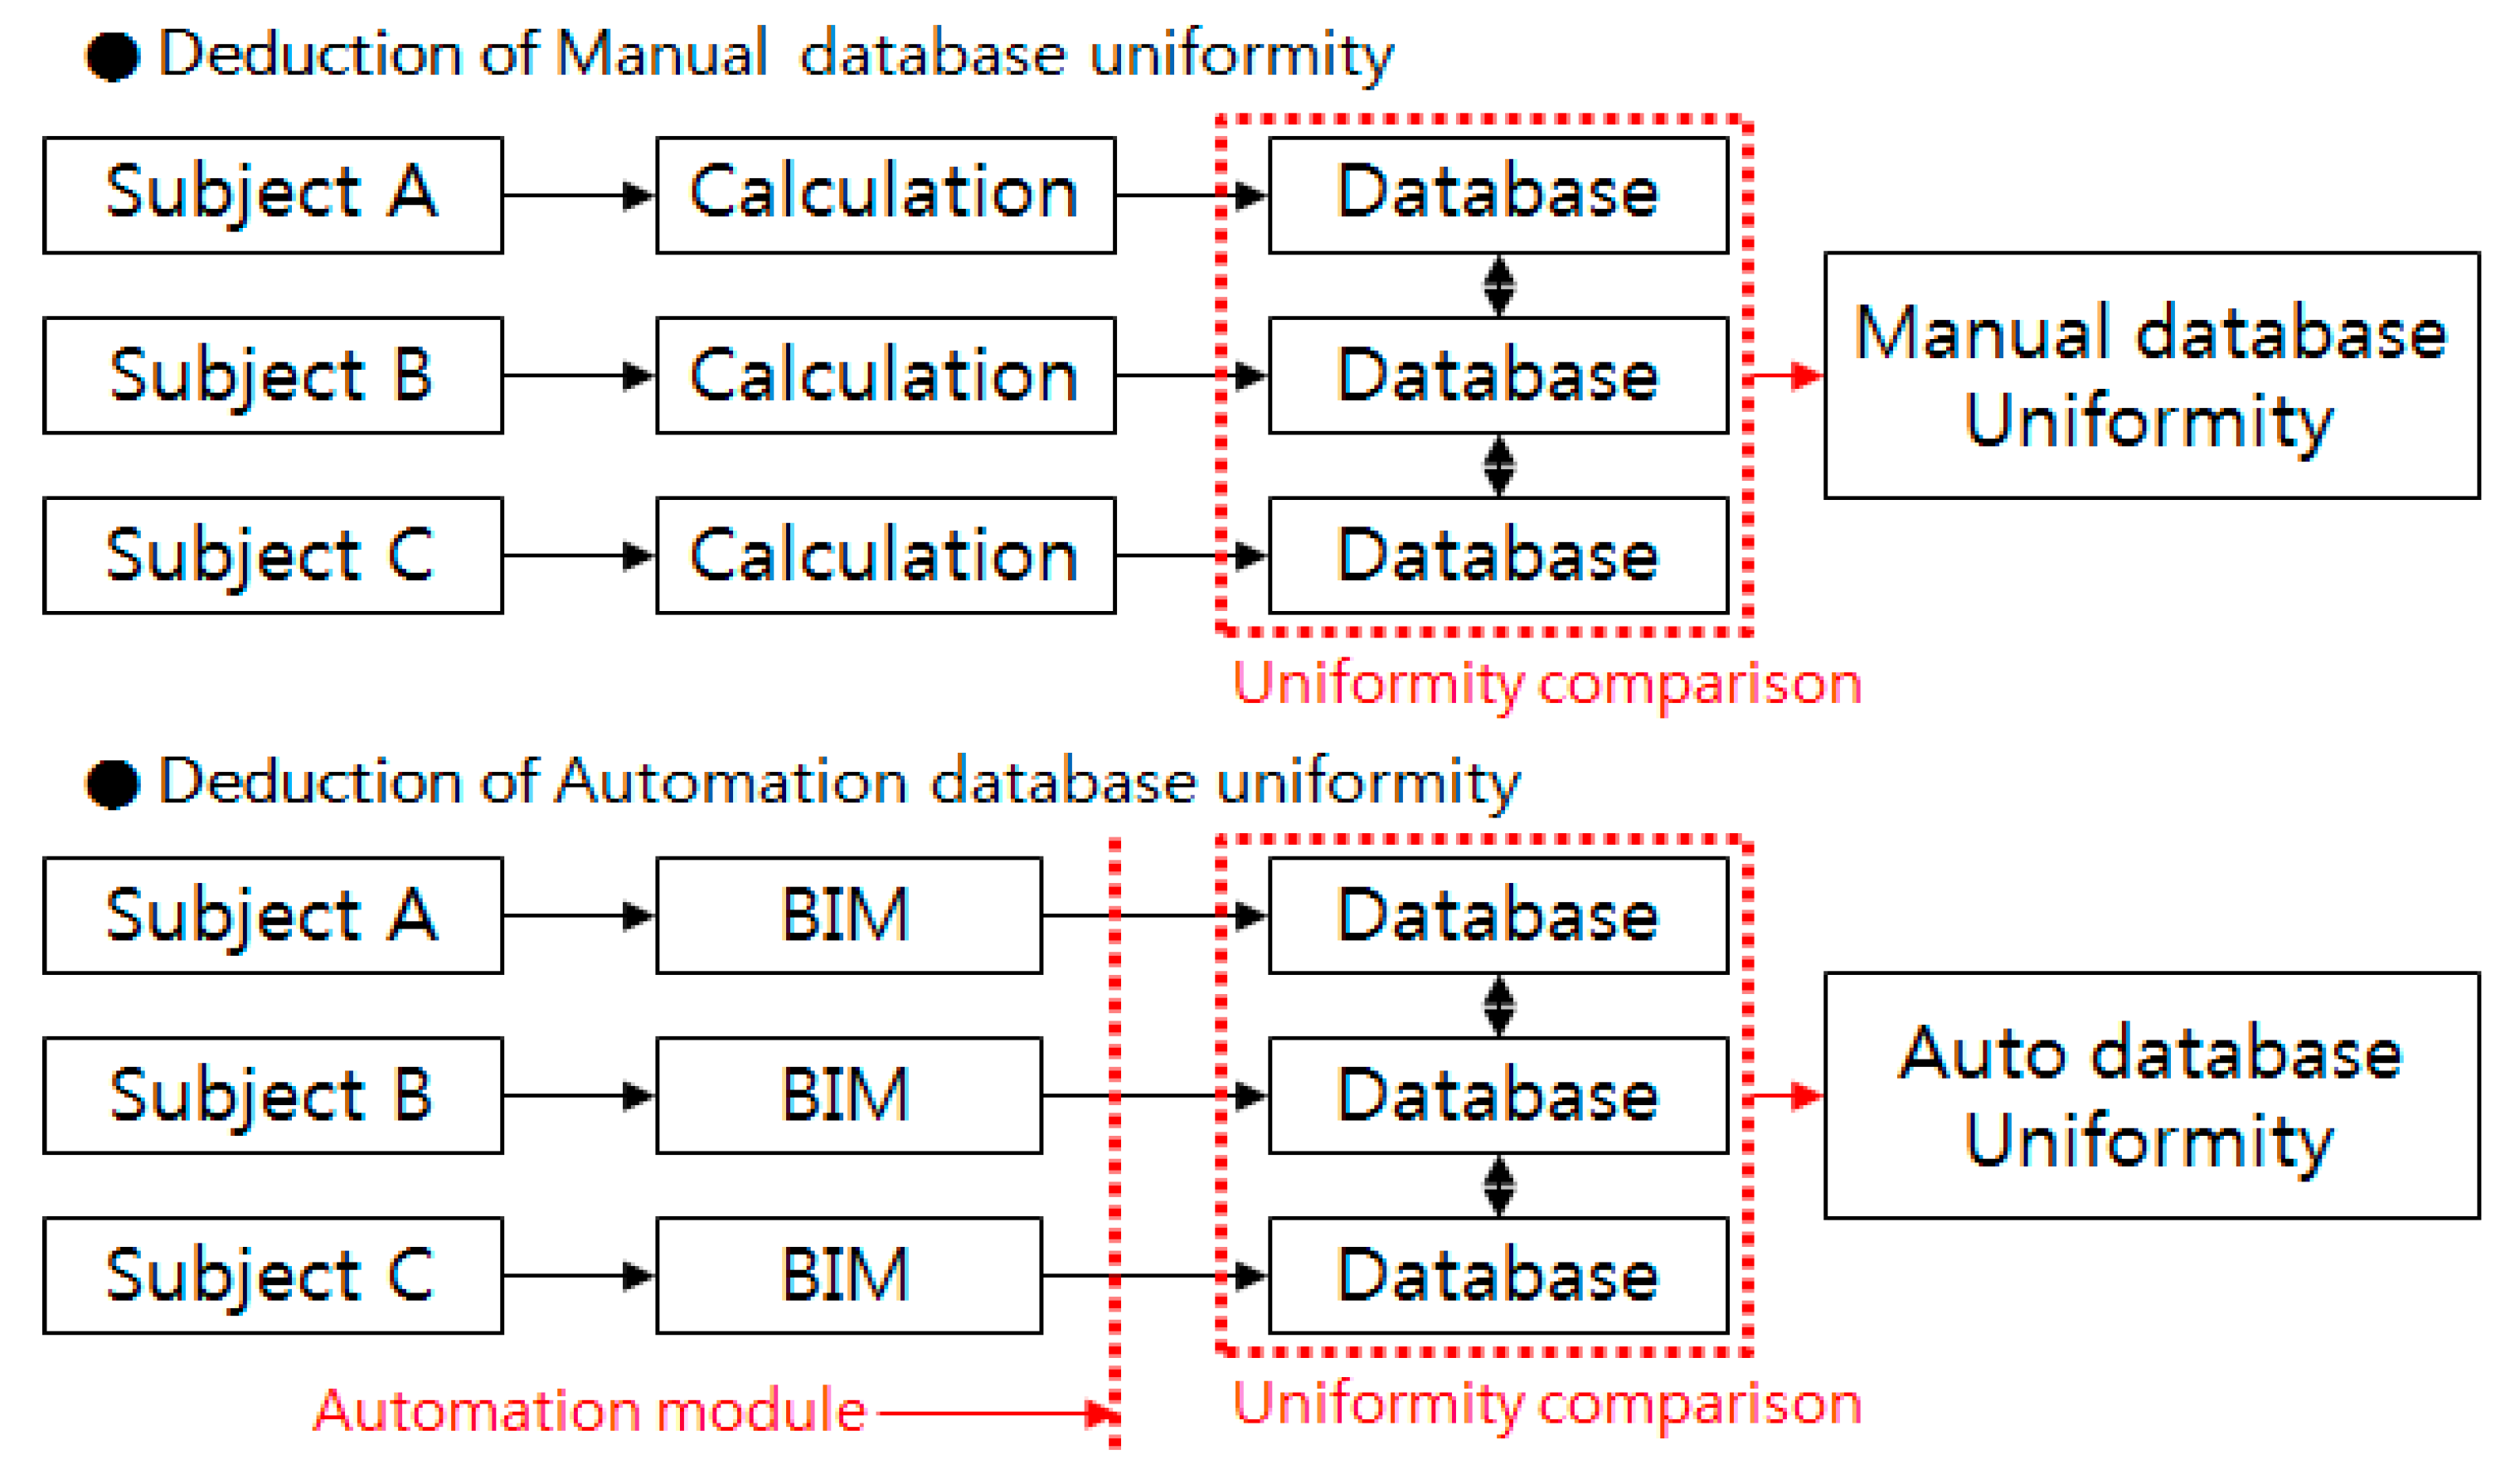
First, the three subjects are required to construct the geometry database on each model with manual calculations based on the drawings provided. Then, they compare the manually calculated database each subject constructed and calculate the uniformity of the three manual databases. In the next step, the three subjects create BIM models for automated calculation and calculate the uniformity of three automated databases (Figure 6).
Table 4 illustrates the construction procedure of the geometry database of model 2 constructed by Subject B with automation calculation. The database comprises the space names, the architectural elements including walls, windows, floors, roofs and doors, and the surface, the interior/ exterior location, and the cardinal points of each element.
Each subject was given enough time for the construction of both a manual calculation database and an automated calculation database, two days for each calculation of each model, comprising 12 days in total.
5.3. The Calculation of the Uniformity and the Analysis of Error Causes
After the completion of the databases, the number of rooms and the number of architectural elements which Subject B calculated on each model are illustrated in Table 5. The numbers of rooms of model A, model B and model C are 10, 38 and 63, respectively. The number of architectural elements increases with the number of rooms, 38, 145, and 221, respectively. This study considers that as the number of elements of each model increases, its complexity increases too, defining the complexities of model A, model B, and model C as low, middle, and high, respectively.
After the completion of the databases, the database each subject constructed was compared with those of the other two subjects to find if there was any inconsistency among the calculation outcomes of the element, the surface area. Such inconsistency was defined as an error.
The degree of uniformity was calculated by dividing the total number of elements into the number of elements having no errors, as shown in Table 6. The uniformity values of model A, one is a manual database, and the other an automated one, agreed with each other, 97.94%. The two uniformity values of model B varied with 83.82% for a manual database and 99.20% for an automated one. In the case of model C, 87.48% for a manual database, and 98.94% for an automated one were obtained. Both model B and model C have higher uniformity for an automation database than a manual one.
The model with the middle- and high-complexity had the uniformity of less than 90% when manually calculated. On the other hand, the uniformity of an automation database stayed over 97% regardless of the complexity.
To determine the causes of the lower uniformity of manually calculated data, the close comparison was carried out studying the drawings, and the types of errors were categorized, and the numbers of errors were counted. Table 7 shows the types and numbers of errors.
The errors were categorized into the human error type which was a mistake and the intended error which was caused by the subject’s subjective judgment. The human error type belongs to the error of recognition and the error of judgment, and the intended error includes the behavior where the subject arbitrarily decreased the number of rooms or altered the space boundary to minimize effort and time needed for the modeling task within limits where the behavior was judged not to influence the simulation outcome by the subject. In the manually calculated databases, human errors occurred due to error of data input, omission of data, calculation mistake and intended errors occurred due to disagreement of the number of rooms and disagreement of the space boundary. The automatically calculated database had human errors of missing element and intended errors of disagreement of the number of rooms.
The error of disagreement of the number of rooms occurred when the subject judged the thermal bridge effect would not occur between two rooms with the same usage and when two or more rooms were modeled as one. The error of disagreement of the space boundary occurred when space with high complexity and the space boundary were simplified for the ease of modeling.
The table above shows that the number of human errors occurring in the manually calculated database is 13.75 times that of the automation data and around 8.67 times more intended errors occurred in the manual calculation database than in the automatically calculated database. In addition, the total number of errors tends to increase rapidly at the point where the complexity of a model reached the middle level. That indicates that with the manual calculation, not only human errors occur in the database, but it is also easy for the intention of the user to intervene in a modeling activity.
Table 8 shows the number of errors each subject made. The number of intended errors increases with the level of skillfulness of the subject because they are caused by the subjective judgment of the user. The number of human errors, however, did not increase with the mastery level of the subject. The aforementioned cases have an unexpected impact on simulation, and manually calculated databases, which have high chances of human error occurrence, and may result in low credibility of the data and the simulation outcome.
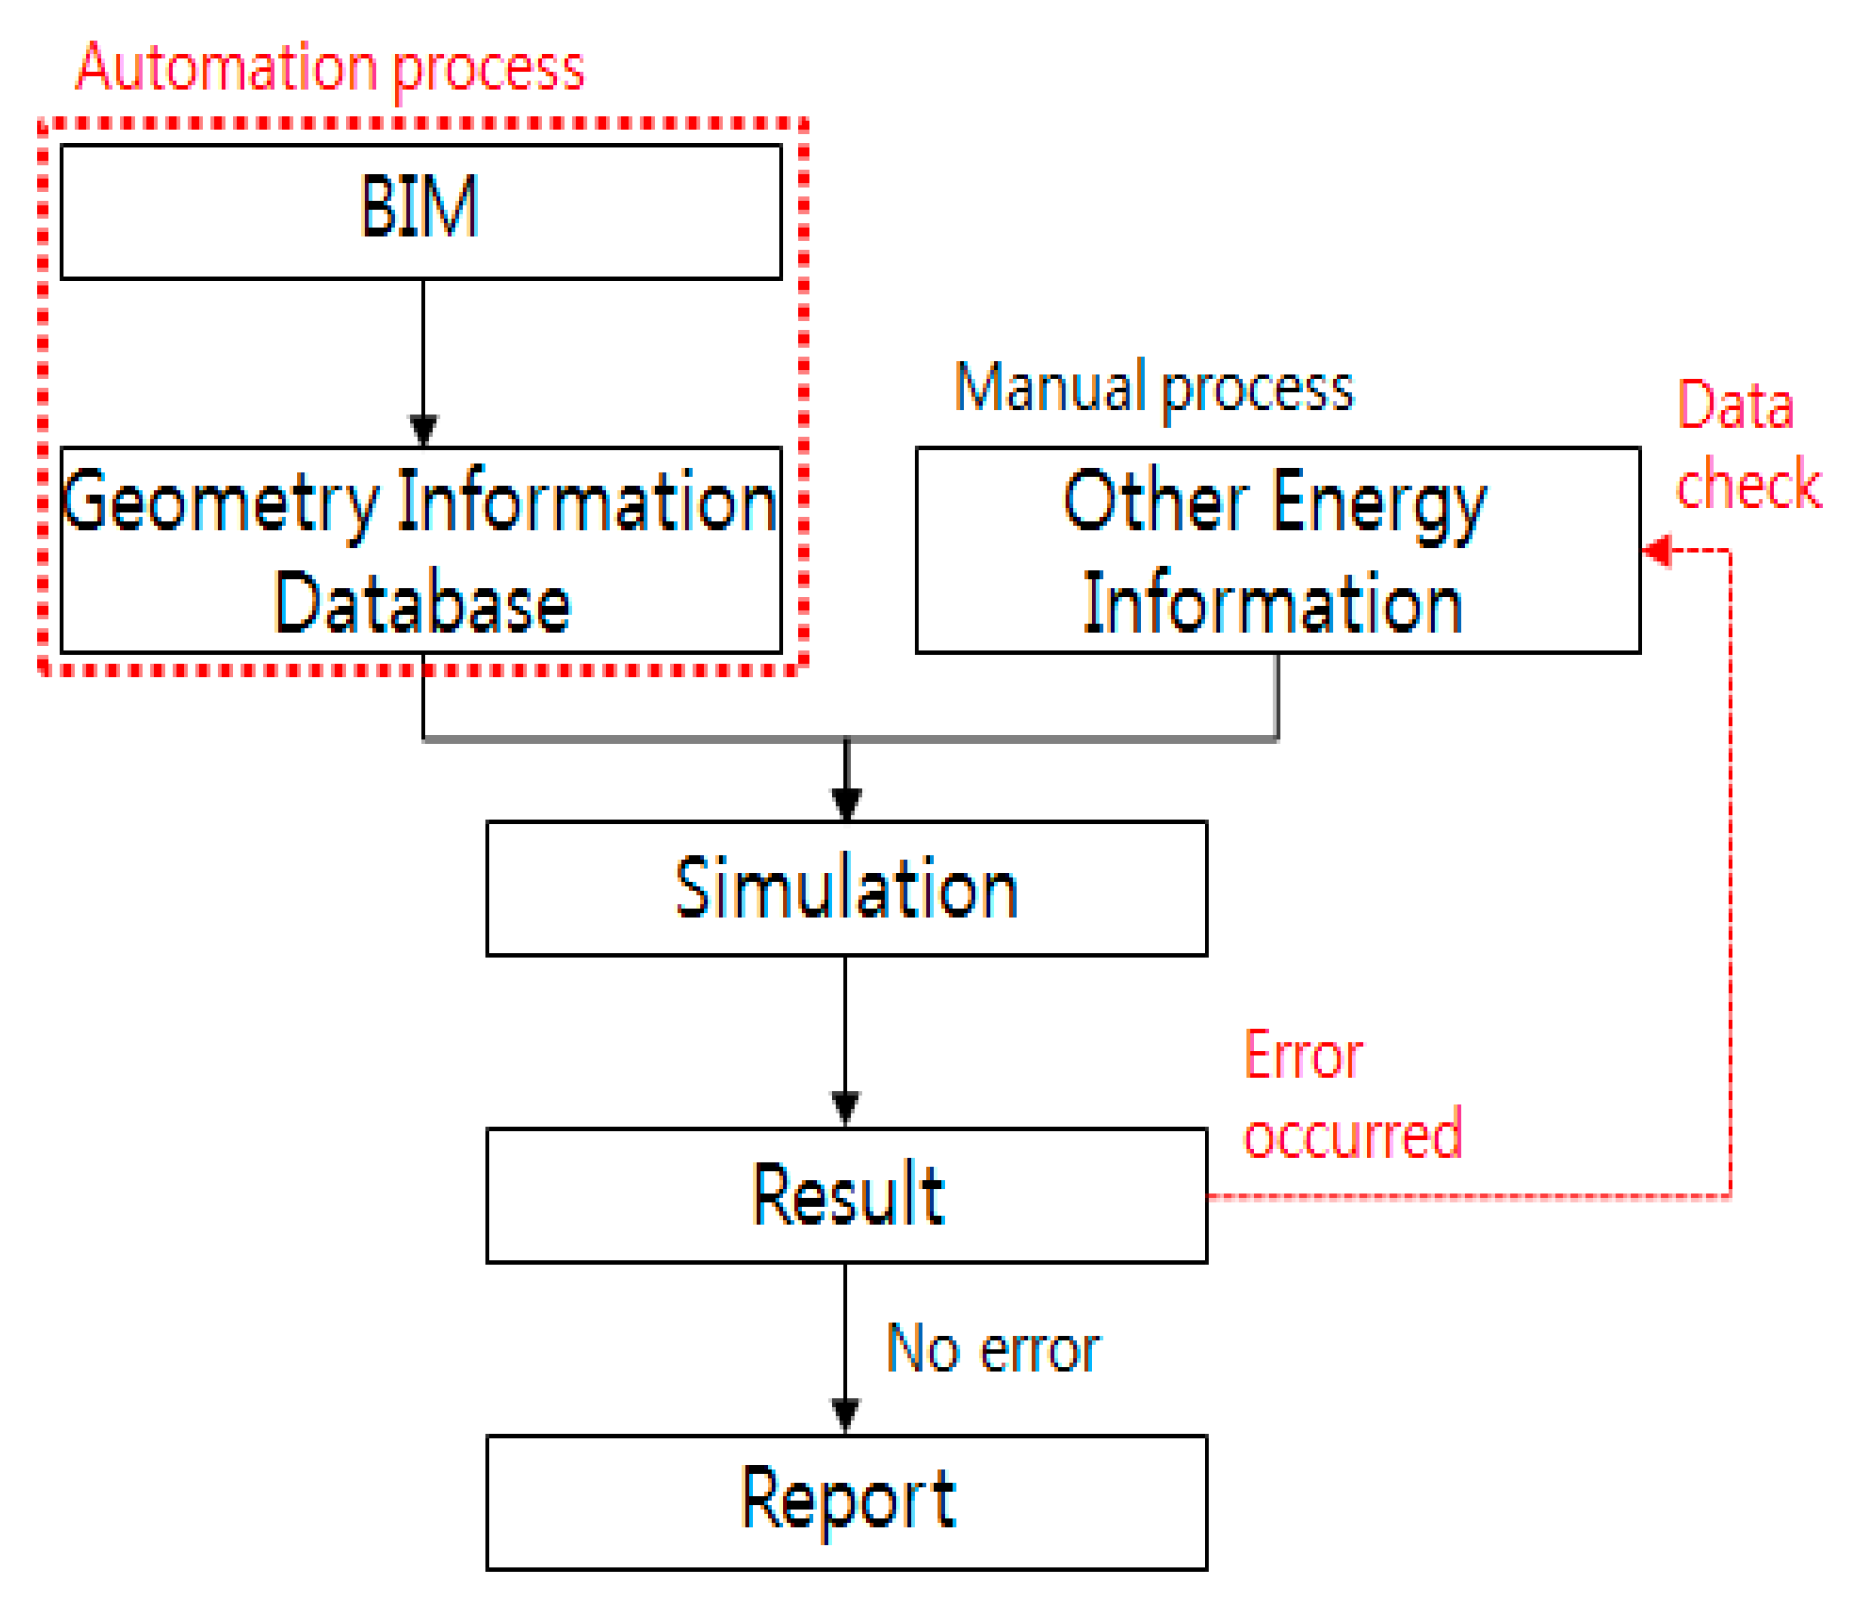
The construction of the geometry database automatically extracted with high credibility also decreases process load in the error checking phase.
Figure 7 shows the automatic energy simulation process of data checking the user carries out when an error occurs.
On the premise that the geometry database has a certain level of credibility when an error occurs, the user does not have to carry out data checking on the geometry data. All the user has to do is check manually input variables such as material property, cooling, and heating system and work schedule. As the size of a building increases and the structure becomes more complex, the number of architectural elements which constitute the geometry data increases exponentially. Hence, the exemption of the geometry data from the data checking list is expected to decrease the time and cost needed in energy simulation.
6. Conclusions
Despite the global trend in the field of energy simulation of BIM being actively used for the geometry input, in the domestic certification practice, BIM is not widely utilized due to its practical limitations. This makes the integration of the work process impossible, leading to low work efficiency, such as increased workload caused by work redundancy. In light of that, this study presented an integrated process based on automated extraction of the BIM geometry module and examined and verified its effectiveness. To do that, with a self-developed automated module, the uniformity and the causes of errors were analyzed.
The construction of the integrated process through the automated extraction of the geometry has the advantages of decreased workload, increased work productivity due to the expansion of the module functions and information sharing through the Internet and the ease of service provision. Moreover, through the experiment in which three subjects constructed automatically calculated databases and manually calculated ones and the outcomes were compared with each other, it was discovered that the automatically calculated database constructed with the automated module had higher uniformity and a lower portion of human errors than the manually calculated database. As a result, a database with higher credibility and uniformity is expected with the use of the module. This will bring about not only increased credibility of energy simulation itself but also decreased labor and working time needed in the data checking process.
To support the use of BIM and integrate work processes in the domestic field of simulation, the relevant laws and system should be fundamentally improved, which the authors do not expect to happen in the short-term. Therefore, this study tried not only to suggest an alternative to the current situation, but also examine the means of reducing workload in energy simulation tasks.
Author Contributions
Investigation, J.-W.C. and J.-h.Y.; Data curation, Y.-J.J.; Formal analysis, Y.-h.S.; Supervision, K.-S.P.
Funding
This research was supported by Basic Science Research Problem through the National Research Foundation of Korea(NRF) funded by the Ministry of Education(2016R1D1A1B03932661).
Conflicts of Interest
The authors declare no conflict of interest.
References
- National BIM Standard—United StatesTM Version 2. What Is a BIM. Available online: https://web.archive.org/web/20141016190503/http://www.nationalbimstandard.org/faq.php#faq1 (accessed on 11 June 2019).
- Autodesk. Autodesk White Paper—Building Information Modeling. 2002. Available online: http://www.laiserin.com/features/bim/autodesk_bim.pdf (accessed on 11 June 2019).
- Oh, S.M.; Park, C.S. Comparison of ISO 13790 Monthly Calculation Method with Dynamic Energy Simulation. J. Korean Inst. Archit. Sustain. Environ. Build. Syst. 2011, 139–142. [Google Scholar]
- Volk, R.; Stengel, J.; Schultmann, F. Building Information Modeling (BIM) for existing buildings—Literature review and future needs. Autom. Constr. 2014, 38, 109–127. [Google Scholar] [CrossRef]
- US Green Building Council. LEED Reference Guide for Design and Construction; US Green Building Council: Washington, DC, USA, 2013; p. 335. [Google Scholar]
- Ministry of Land Infrastructure and Transport of Korea. Standards for Energy Conservation in Building, Administrative Rule. 2017. Available online: http://www.law.go.kr/ (accessed on 15 Feburary 2019).
- Ansah, M.K.; Chen, X.; Yang, H.; Lu, L.; Lam, P.T. A review and outlook for integrated BIM application in green building assessment. Sustain. Cities Soc. 2019, 48, 101576. [Google Scholar] [CrossRef]
- Li, C.Z.; Xue, F.; Li, X.; Hong, J.; Shen, G.Q. An Internet of Things-enabled BIM platform for on-site assembly services in prefabricated construction. Autom. Constr. 2018, 89, 146–161. [Google Scholar] [CrossRef]
- Tang, S.; Shelden, D.R.; Eastman, C.M.; Pishdad-Bozorgi, P.; Gao, X. A review of building information modeling (BIM) and the internet of things (IoT) devices integration: Present status and future trends. Autom. Constr. 2019, 101, 127–139. [Google Scholar] [CrossRef]
- Zhu, J.; Wang, X.; Wang, P.; Wu, Z.; Kim, M.J. Integration of BIM and GIS: Geometry from IFC to shapefile using open-source technology. Autom. Constr. 2019, 102, 105–119. [Google Scholar] [CrossRef]
- Ferdyn-Grygierek, J.; Bartosz, D.; Specjał, A.; Grygierek, K. Analysis of Accuracy Determination of the Seasonal Heat Demand in Buildings Based on Short Measurement Periods. Energies 2018, 11, 2734. [Google Scholar] [CrossRef]
- Biserni, C.; Valdiserri, P.; D’Orazio, D.; Garai, M. Energy Retrofitting Strategies and Economic Assessments: The Case Study of a Residential Complex Using Utility Bills. Energies 2018, 11, 2055. [Google Scholar] [CrossRef]
- Kim, J.Y.; Kim, C.M.; Park, C.Y.; Park, Y.J.; Choi, C.H. Develop an IFC-Based Algorithm to Extract Required Information from Planar Figure of Envelope for Building Energy Performance Assessment. J. Kiaebs 2018, 12, 277–289. [Google Scholar]
- Kim, K.R.; Yu, J.H. A Method for Extracting Geometry Data from IFC File for Building Energy Load Analysis. J. Archit. Inst. Korean 2012, 28, 241–248. [Google Scholar]
- Choi, J.W.; Kim, S.; Song, Y.H.; Park, K.S. The development of module for automatic extraction and database construction of BIM based shape-information reconstructed on spatial information. J. Reg. Assoc. Archit. Inst. Korean 2018, 20, 81–87. [Google Scholar]
- Jung, N.C.; Lee, G. Automated classification of building information modeling (BIM) case studies by BIM use based on natural language processing (NLP) and unsupervised learning. Adv. Eng. Inform. 2019, 41, 100917. [Google Scholar] [CrossRef]
- Wu, S.; Deng, Y.; Cheng, J. Natural-language-based intelligent retrieval engine for BIM object database. Comput. Ind. 2019, 108, 73–88. [Google Scholar] [CrossRef]
- Choi, J.S.; Kim, I.H. A Study on the Space Boundary Information Interoperability Improvement of IFC Data for Building Energy Performance Assessment. Korean J. Comput. Des. Eng. 2014, 19, 129–137. [Google Scholar] [CrossRef]
- Kim, J.W.; Ock, J.H. A Study on the Development of the Problem Improvement Directions in Enhancing BIM Data Interoperability through IFC. Korean J. Constr. Eng. Manag. 2009, 10, 88–98. [Google Scholar]
- Green Building Studio. Autodesk Green Building Studio. Available online: https://gbs.autodesk.com/gbs (accessed on 20 Feburary 2019).
- BIMkeeper. Available online: http://www.bimkeeper.com (accessed on 20 Feburary 2019).
- IFCWebserver. Available online: http://www.ifcwebserver.org (accessed on 20 Feburary 2019).
- Moon, H.J.; Choi, M.S.; Ryu, S.H.; Park, J.W. Building Performance Analysis Interface based on BIM. J. Archit. Inst. Korean 2009, 25, 271–278. [Google Scholar]
- Yoon, S.M.; Woo, S.J.; Choi, J.W.; Moon, H.J. A Fundamental Study on BIM Based Energy Performance Assessment System in Early Design Stage- Focused on Interface for Building Energy Simulation. J. Archit. Inst. Korean 2013, 29, 187–197. [Google Scholar]
- Wickens, C.; Gordon, S.; Liu, Y. An Introduction to Human Factors Engineering, 2nd ed.; Pearson Prentice Hall: Upper Saddle River, NJ, USA, 2004. [Google Scholar]
- Kim, Y.C.; Jung, H.W.; Bae, C.H. Prevention of Human Error in Shipbuilding Industry. J. Ergon. Soc. Korean 2011, 30, 127–135. [Google Scholar] [CrossRef]
Figure 1.
Separated process for different simulation.

Figure 2.
Integrated process for different simulation modes.

Figure 3.
Geometry information extraction module.

Figure 4.
Expansion of automation module.

Figure 5.
Expansion module (heating and cooling load calculation).

Figure 6.
Deduction of database uniformity.

Figure 7.
Data check of automatic energy simulation process.


Table 1.
Simulation models information.
| Location | Use | Total Floor Area | Story | |
|---|---|---|---|---|
| model A | daegu | office | 551.84 m2 | 2 |
| model B | changwon | office | 1696.95 m2 | 5 |
| model C | gwangyang | office | 6894.80 m2 | 5 |
Table 2.
Simulation models sample images (subject B modeling).
| Model 1 | Model 2 | Model 3 |
|---|---|---|
 |  |  |
Table 3.
Skill level of subjects.
| Skill Level of CAD | Skill Level of BIM 3D Modeling | |
|---|---|---|
| subject A | poor | poor |
| subject B | fair | fair |
| subject C | good | good |
Table 4.
Database form example (model 2, subject B, automation).
| Space | Element | Area (m2) | EX/IN | Direction |
|---|---|---|---|---|
| MEETING1 | WALL | 52.52 | EX | WEST |
| MEETING1 | WINDOW | 18.9 | EX | WEST |
| MEETING1 | SLAB | 2446.28 | EX | HORIZONTAL |
| MEETING1 | WALL | 70.99 | IN | NONE |
| MEETING1 | WALL | 127.41 | IN | NONE |
| MEETING1 | WALL | 127.41 | IN | NONE |
| MEETING1 | WALL | 127.41 | IN | NONE |
| MEETING1 | WALL | 4.11 | IN | NORTH |
| MEETING1 | WALL | 4.11 | IN | SOUTH |
| MEETING1 | WALL | 1.88 | IN | EAST |
Table 5.
Room and element number (subject B).
| Room Number | Element Number | Complexity | |
|---|---|---|---|
| model A | 10 | 38 | low |
| model B | 38 | 145 | middle |
| model C | 63 | 221 | high |
Table 6.
Database uniformity.
| Classification | Uniformity | |
|---|---|---|
| model A | manual database | 97.94% |
| automation database | 97.94% | |
| model B | manual database | 83.82% |
| automation database | 99.20% | |
| model C | manual database | 87.48% |
| automation database | 98.94% | |
Table 7.
Error cause and number.
| Error Type | Error Cause | Error Number | ||||
|---|---|---|---|---|---|---|
| Model A | Model B | Model C | Total | |||
| manual database | human error | data input mistake | 2 | 10 | 21 | 110 |
| data omission | 0 | 42 | 28 | |||
| calculation mistake | 0 | 7 | 0 | |||
| intended error | different room number | 0 | 2 | 0 | 26 | |
| different space boundary | 0 | 2 | 22 | |||
| automation database | human error | element omission | 2 | 0 | 6 | 8 |
| intended error | different room number | 0 | 3 | 0 | 3 | |
| total | 4 | 66 | 77 | 147 | ||
Table 8.
Error number of each subject.
| Classification | Error Number | |
|---|---|---|
| subject A | human error | 17 |
| intended error | 4 | |
| subject B | human error | 80 |
| intended error | 12 | |
| subject C | human error | 21 |
| intended error | 13 | |
© 2019 by the authors. Licensee MDPI, Basel, Switzerland. This article is an open access article distributed under the terms and conditions of the Creative Commons Attribution (CC BY) license (http://creativecommons.org/licenses/by/4.0/).
Share and Cite
MDPI and ACS Style
Choi, J.-W.; Jun, Y.-J.; Yoon, J.-h.; Song, Y.-h.; Park, K.-S. A Study of Energy Simulation Integrated Process by Automated Extraction Module of the BIM Geometry Module. Energies 2019, 12, 2461. https://doi.org/10.3390/en12132461
AMA Style
Choi J-W, Jun Y-J, Yoon J-h, Song Y-h, Park K-S. A Study of Energy Simulation Integrated Process by Automated Extraction Module of the BIM Geometry Module. Energies. 2019; 12(13):2461. https://doi.org/10.3390/en12132461
Chicago/Turabian StyleChoi, Jun-Woo, Yong-Joon Jun, Jin-ha Yoon, Young-hak Song, and Kyung-Soon Park. 2019. "A Study of Energy Simulation Integrated Process by Automated Extraction Module of the BIM Geometry Module" Energies 12, no. 13: 2461. https://doi.org/10.3390/en12132461
Note that from the first issue of 2016, this journal uses article numbers instead of page numbers. See further details here.