Comparison among Three Groups of Solar Thermal Power Stations by Data Envelopment Analysis

1
New Mexico Institute of Mining & Technology, Department of Management, 801 Leroy Place, Socorro, NM 87801, USA
2
Tokyo Institute of Technology, Tokyo Tech World Research Hub Initiative, School of Environment and Society, 3-3-6 Shibaura, Minato-ku, Tokyo 108-0023, Japan
3
Tokyo Institute of Technology, School of Environment and Society, 3-3-6 Shibaura, Minato-ku, Tokyo 108-0023, Japan
*
Author to whom correspondence should be addressed.
Energies 2019, 12(13), 2454; https://doi.org/10.3390/en12132454
Submission received: 17 May 2019
/
Revised: 17 June 2019
/
Accepted: 24 June 2019
/
Published: 26 June 2019
(This article belongs to the Special Issue Data Envelopment Analysis (DEA) Applied to Energy and Environment)
Abstract
:To change an increasing trend of energy consumption, many counties have turned to solar thermal energy as a solution. Without greenhouse gas emissions, solar thermal power stations may play a vital role in the energy industry because they have a potential to produce electricity for 24 h per day. The goal of this study is to select solar thermal power stations from three regions (i.e., the United States, Spain and the other nations) throughout the world and to identify which region most efficiently produces solar thermal power energy. To measure their efficiencies, we use data envelopment analysis as a method to examine the performance of these power stations. Our empirical results show that the United States currently fields the most efficient solar thermal power stations. This study also finds that parabolic trough technology slightly outperforms the other two technologies (i.e., heliostat power tower and linear Fresnel reflector), but not at the level of statistical significance. In addition to the proposed efficiency assessment, we incorporate a new way of finding a possible existence of congestion. The phenomenon of congestion is separated into output-based and input-based occurrences. Output-based congestion implies a capacity limit (e.g., difficulties in transmission, voltage control and dispatch scheduling) in a grid network between generation and end users. Input-based congestion occurs when generators use “uncontrollable inputs” (e.g., sunlight hours). Renewable energy sources, such as solar thermal power, are indeed important for our future sustainability. However, this needs performance assessment on generation and transmission through which electricity generated by renewable energy is conveyed to end users. Such a holistic assessment, including both efficiency measurement and congestion identification, serves as a major component in evaluating and planning renewable energy generation.
1. Introduction
As the world population grows, so does the demand for electricity. To meet the demand, the power generation industry is constantly expanding, adding new power sources and generation capabilities as soon as new technologies are available. In 2018, the International Energy Agency (IEA) reported that 65.1% of all electricity in the world comes from fossil fuels [1]. However, electricity generation via fossil fuels produce emissions such as greenhouse gases (GHGs) that have an adverse effect on Earth’s environment. To combat the growing problem, many countries have adopted caps on harmful gas emissions. This trend has opened the energy market up to other forms of power generation. Solar thermal power generation is one of such promising new prospects.
The power generation is often called concentrated solar power (CSP) which works by reflecting sunlight and focusing it onto a small area. The area begins to heat as the concentrated sun light is converted to heat energy. The heat is then transported via a transfer fluid (e.g., molten salt or oil). The fluid is used to drive a steam turbine that produces electricity which may operate a generator to produce electricity 24 h per day along with the development of an efficient heat storage system. The energy source does not produce carbon dioxide (CO2) and other GHGs emissions in the electricity generation.
In this research, we examine the solar thermal power from a holistic perspective of electricity generation, through transmission and distribution, to consumers. For the purpose, this research proposes a new type of assessment to measure the performance of these power stations. The research task is the goal of this article.
While acknowledging that solar thermal power may have a high potential as an important renewable energy source for the future, however, power generation may have various difficulties in distributing electricity to end users. In the worst case, consumers cannot access electricity generated by the solar thermal power due to transmission difficulties that include voltage and frequency control, transmission limit, line balancing and/or dispatch scheduling. Such problems often occur with “congestion” on transmission and distribution in the electric grid network. To handle the difficulties, this study attempts to discuss how to examine the performance of these power stations by a holistic assessment that considers a possible occurrence of congestion on transmission.
This study uses data envelopment analysis (DEA) as a method for our empirical assessment. To attain the research objective, we link it to a possible existence of congestion, often occurring in a grid network for transmission. The concept is a widely observed phenomenon that leads to operational inefficiency in such a manner that an increase in an input(s) decreases an output(s) without worsening the other inputs and outputs. The type of inefficiency is different from the “operational inefficiency” which indicates an existence of an excess amount of input(s) and/or a shortfall of an output(s). A typical example of congestion can be found in a line limit occurring in an electric grid network. The book by [2] discussed an occurrence of congestion problem in the electric power industry.
As mentioned previously, the goal of this study is to apply DEA to the performance assessment of solar thermal power stations. This type of application toward renewable energy sources is important so that we can find the use of DEA in the previous works [3,4,5]. The prior efforts provide this study with an empirical basis. For example, Reference [3] compared the performance of photovoltaic (PV) power stations in Germany and the United States by DEA. The Reference [4] measured returns to scale on large PV power stations in the United States and Germany. The Reference [5] assessed large commercial rooftop PV system installations in California.
As an extension of the three previous studies, this study shifts from PV to CSP stations. The thermal power stations are technically different from the PV stations. So, this study is different from the preceding research in solar energy utilization. The previous works also did not consider a possible occurrence of congestion to distribute electricity to end-users. These two differences indicate the originality of this study.
The remainder of this research is organized as follows: Section 2 reviews solar thermal power stations. Section 3 proposes a new approach to examine the level of their efficiencies. The section also discusses a mathematical rationale concerning why the proposed DEA-based assessment can find a possible occurrence of congestion. Section 4 summarizes our empirical results regarding solar thermal power stations. Section 5 summarizes this study along with future research tasks. Variables are listed at the end of this article.
2. Solar Thermal Power Stations
2.1. Previous Studies
Previous studies have investigated the performance assessment of solar thermal power stations in the past decade. For example, Ibrik and Mahmoud [6] discussed energy efficiency improvements and audit results of electric, thermal and solar applications in Palestine. Coventry [7] compared the electric generation efficiencies of two CSP sites when heat increases.
After the 2010s, many research works paid attention to solar energy. Such previous efforts are summarized in the following annual order. For example, Clifton and Boruff [8] described how to assess a potential for CSP in rural Australia. Chow [9] gave a review of a trend in developing the PV-based thermal technology from 1970 to 2010. Xie et al. [10] discussed CSP technology, using a Fresnel lens, which was an effective way to make full use of sunlight. They did a review about the development of CSP applications by a Fresnel lens. Oro et al. [11] compared environmental impacts on three different thermal energy storage systems for solar power plants. They applied a life cycle assessment to measure the performance of the three systems. Bahadori and Nwaoha [12] reviewed the status of solar energy utilization in Australia. The research discussed the use of solar thermal energy in rural areas where the transmission has been not well developed between generators and consumers. Singh [13] reviewed various types of solar energies such as solar heat, heat, PV, CSP and solar fuels from the perspective of climate-friendly energy resources. The study compares PV with CSP, concluding that both solar technologies are essential for future energy development. Desideri et al. [14] provided a comparative analysis between PV and CSP from the two technology developments and environmental protection capabilities. Moore et al. [15] discussed an efficient use of CSP for designing various air cool condensers in very dry areas. Vignarooban et al. [16] reviewed a technical aspect on heat transfer fluid that is one important component for storing and transferring thermal energy into solar power. Ortiz et al. [17] considered that a key component of CSP was efficient energy storage. They proposed a power cycle integration system within CSP sites that included energy storage based on calcium looping. Fasquelle et al. [18] considered how to design thermal energy storage from sunlight that might have a risk of overheating. They discussed a temperature threshold for a use of thermocline energy storage in CSP sites. Salasa et al. [19] also consider an economical optimization of thermochemical storage in CSP sites by considering various pre-scenarios. Cavallaro et al. [20] discussed how to assess the rank of CSP hybridized systems by an intuitionistic fuzzy multi-criteria algorithm. A potential use of CSP was that it combined it with conventional energy sources such as natural gas. It is true that the hybrid system is necessary in a process toward solar-only power generation. They discussed how to assess such hybrid generation sites. Zsembinszki et al. [21] provided a review of reactors with a potential use in thermochemical energy storage in CSP plants. Cavallaroa et al. [22] discussed how to assess multiple CSP technologies based on a modified intuitionistic fuzzy approach and trigonometric entropy weights.
In comparing with the previous works, the position of this study can be summarized as follows: first, acknowledging the contributions of these previous studies, this research needs to mention that the engineering aspects of solar energy generation are important. In particular, many previous efforts pay attention to a design of heat-saving system because CSP outperform PV in terms of their use of 24 hours per day. Second, many studies discussed the assessment of CSP sites.
The two features are their contributions on solar energies. However, a problem of the previous works was that they did not consider the holistic assessment on solar technologies from a perspective of whole electric production system from generation, via transmission, to end users. In evaluating the solar power plants, it is necessary for us to incorporate a possible occurrence of congestion on transmission because the difficulty may occur in the electric power industry. This study is the first research effort on the holistic assessment of solar thermal power stations. No previous study has discussed this research direction.
2.2. Concentrated Solar Power (CSP) versus Solar Photovoltaic (PV) Power
CSP and PV power generation systems have often been compared in previous research, as both use solar energy to generate electricity. They have similarities and differences between them. The CSP systems utilize the heat from sunlight in order to generate power in a process which can be found in similar conventional thermal power plants (e.g., coal and nuclear). The PV solar panels depend upon the photovoltaic effect. The effect is characterized by the creation of a voltage and electric current when a material is exposed to sunlight. The phenomenon is used to convert sunlight to direct current (DC) electricity. The DC is then converted to alternating current (AC) electricity and distributed to consumers via a transmission grid network.
According to the IEA [1], PV systems make up 1.3% of the world’s electricity generation, while CSP make up less than 0.1%. While expected to grow, neither system makes up a large part of the energy market, although PV systems have a clear advantage in current market share. There are several factors that make PV seem more lucrative to today’s energy investors. Table 1 compares PV and CSR.
The cost is the most obvious advantage of PV over CSP. PV systems can be built at drastically lower costs than the CSP systems. According to the National Renewable Energy Laboratory (NREL) in 2017, a utility-scale CSP power station would cost about $8000/kW to build, while a comparable PV station would cost $2000/kW [23]. That makes the average CSP power station four times more expensive to install than a similar type of PV station. PV technology prices need to further decrease over time.
An advantage of PV systems is their reliability. While both PV and CSP require sunlight to function, a CSP station requires direct sunlight. PV solar panels will still function, to a lesser extent, during cloud cover. This makes them more attractive in areas where we see common cloud cover, such as Spain in the winter months. Another advantage that PV has over CSP is the simplicity of individual power generation sites. The PV systems require little more than an open space, solar panels, and a transfer line to a grid network. There are no moving parts required for the photovoltaic effect to generate electricity. Conversely, the CSP systems require mirrors, steam tanks, a turbine generator system, steam condensers, and potentially thermal storage tanks. This makes the construction, as well as operation of CSP sites more complex than that of PV sites. The simplicity of PV also lends itself to use in homes and small businesses, to offset electricity prices. The complexity and required space for CSP makes personal use impossible.
The advantage of CSP over PV is energy storage. The CSP sites can store heated transfer fluid in storage tanks to be used when the sun is not available. This enables sites to access dispatch-able power, while PV sites do not have such capability. We know that not all current CSP sites may utilize the advantage [24]. Current storage capacity is low, generally sitting at about 7.5 hours. Although not currently enough to provide power throughout the night, the further development of this storage technology may open the doors for further CSP investment. Of course, we must understand the existence of considerable cost for the storage system. The storage cost makes the three types of CSP plants, to be examined in this study, hardly useable on a small scale.
Overall, it is no surprise that currently PV technology dominates the solar energy market, with its lower cost and technological reliability. However, there is still optimism around CSP, especially for future. With the technology’s capability for storing energy, CSP sites may possibly fill the gap that solar power leaves during night hours.
2.3. Three Types of CSP Stations
This study examines the three types of solar thermal power stations whose performances are examined by DEA. The three types are specified as follows:
(a) Parabolic trough: the sunlight, which enters the mirror parallel, is focused along the focal line, where objects are positioned and are intended to be heated as depicted in Figure 1. A tube containing a fluid runs in the trough at its focal line. The sunlight is concentrated on the tube and the fluid heated to a high temperature by the sunlight energy. The hot fluid is conveyed to a heat engine, which uses the heat energy to generate electricity. This type of solar energy collector is common and is known as a “parabolic trough”.
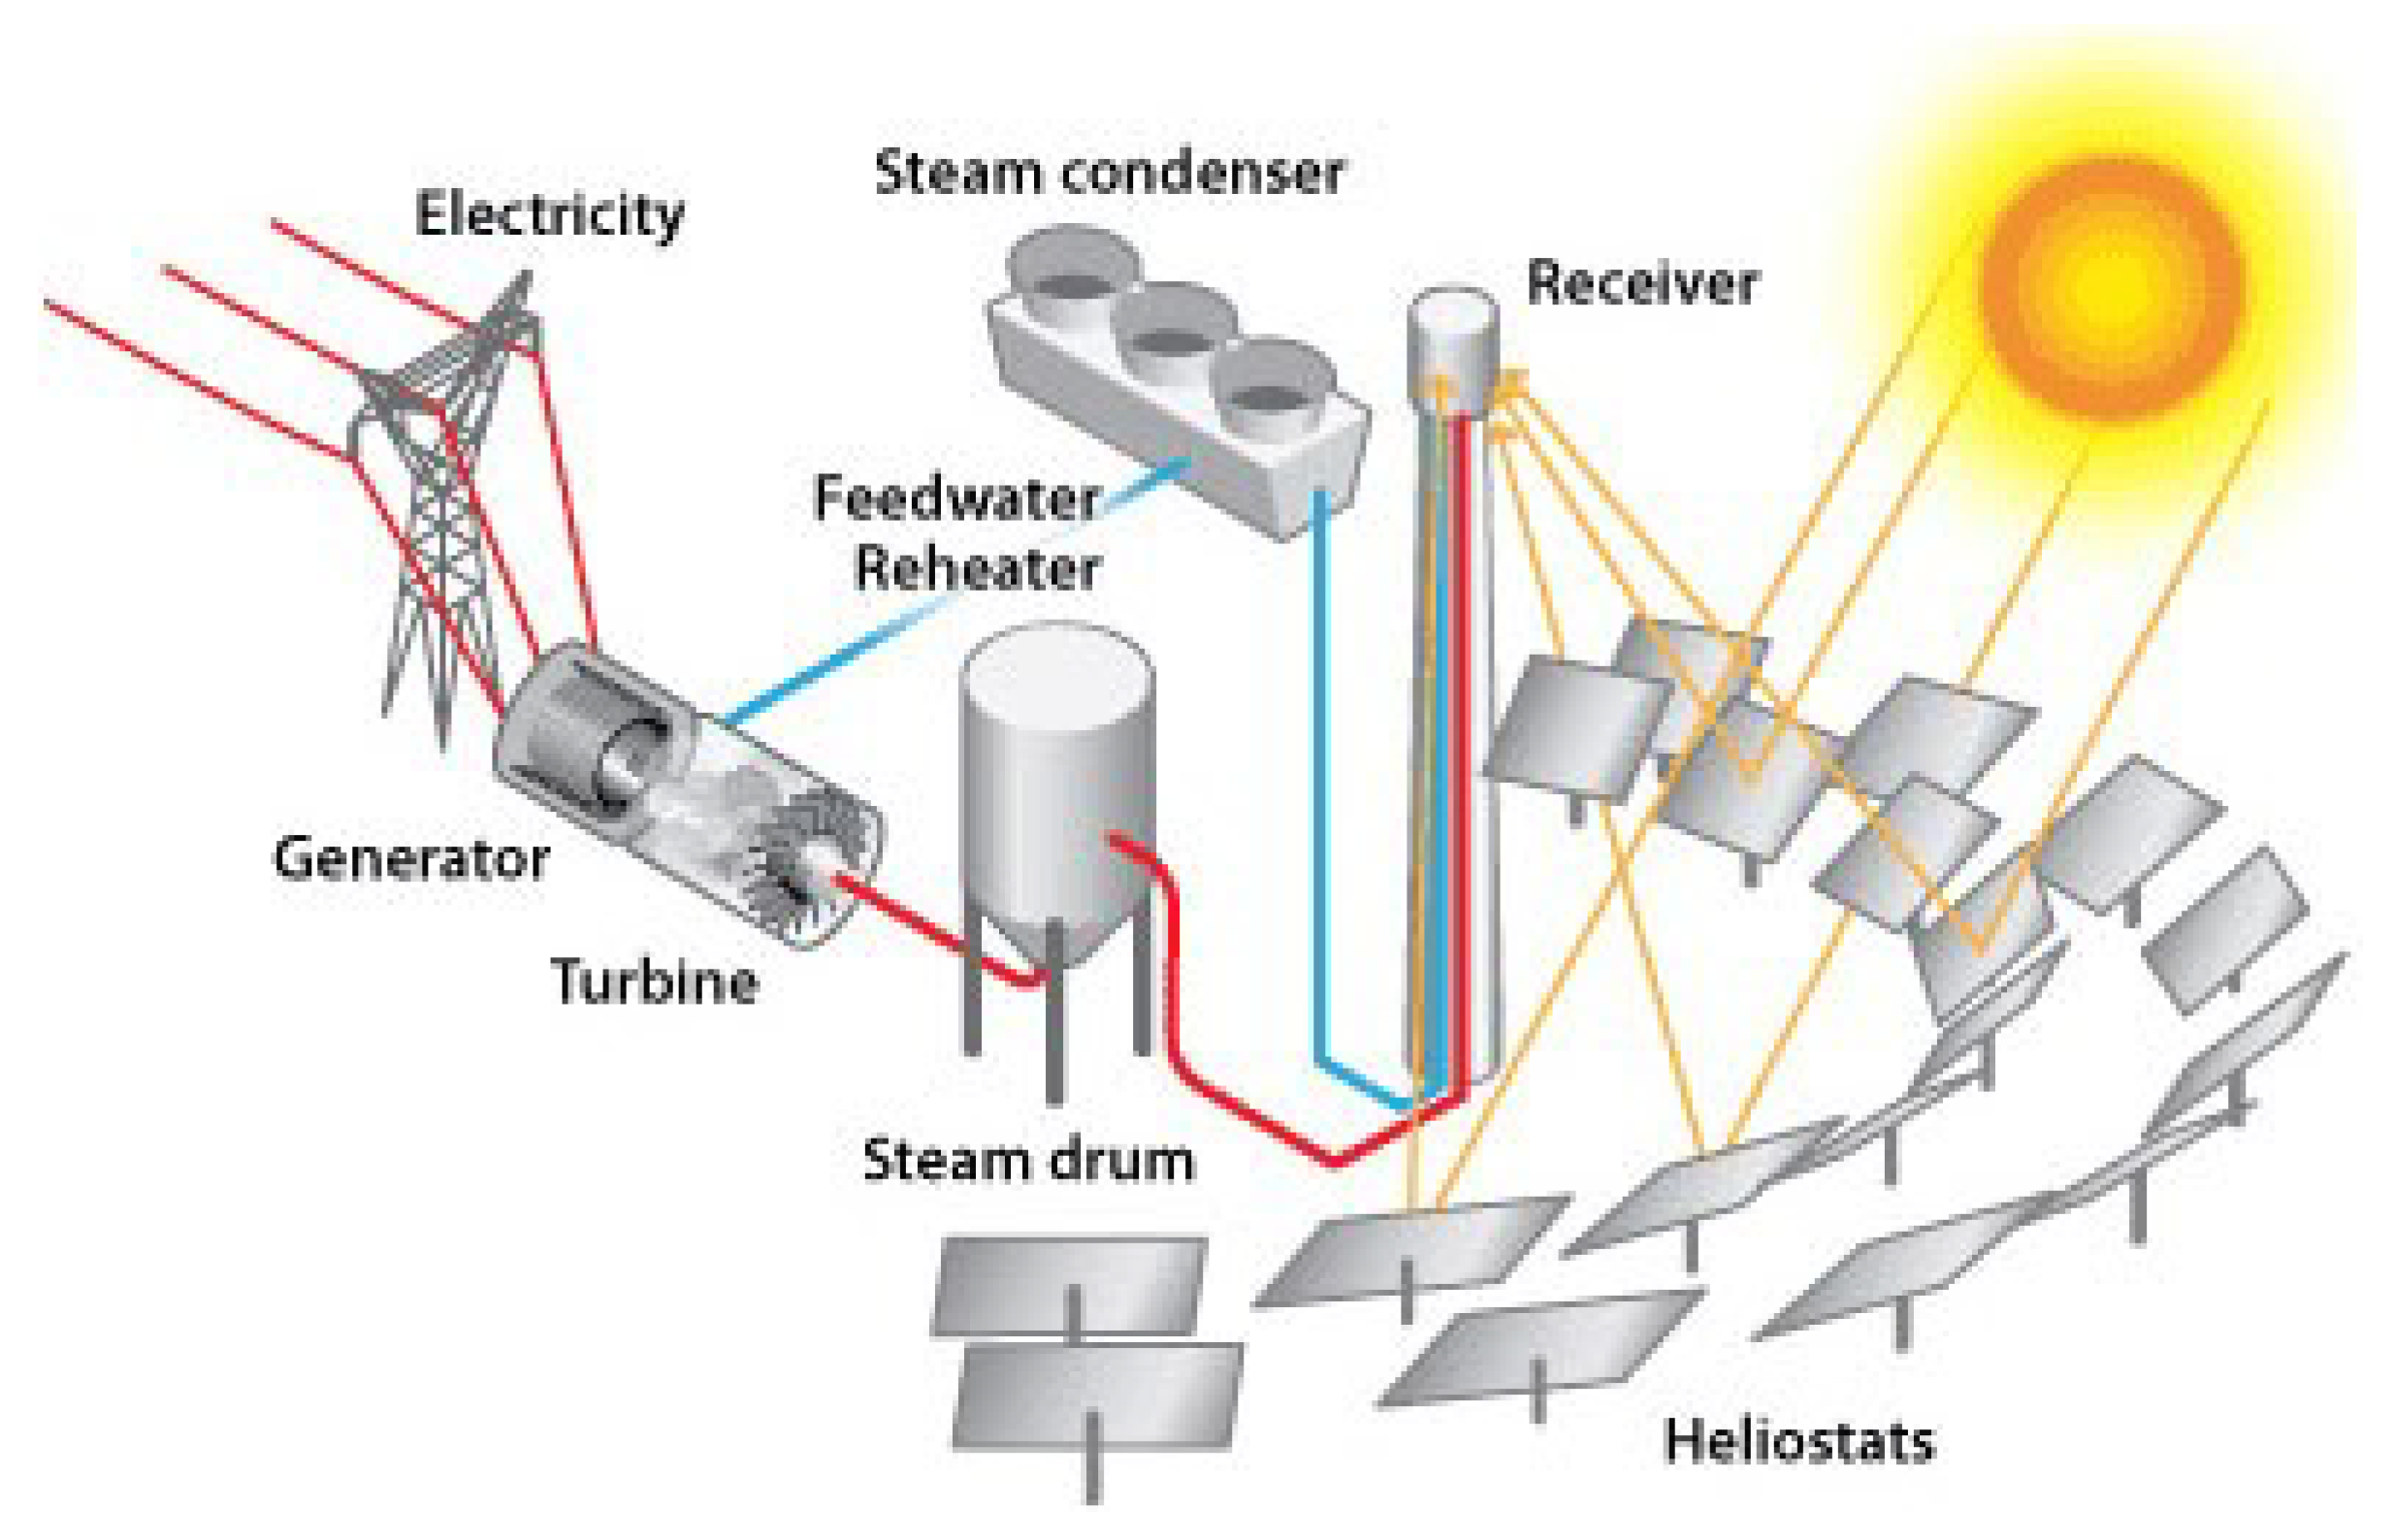
(b) Heliostat power tower: this collector is known as a central receiver that is the center of all concentrating solar collectors. Solar towers use many small sun tracking mirrored solar dish collectors, called “heliostats” which are similar to the ones in the previous parabolic collector tutorials that are used to reflect the sunlight directly onto a centrally located heat absorbing receiver. The name of power tower comes from the fact that the CSP does not focus at the focal point of each heliostat dish but at the top of a very tall vertical tower. The sunlight from many mirrors like dish reflectors spread over a large area accumulate into one central point that achieves an extremely high temperature. The heat produces high-pressure steam for electricity generation.
A power tower has a circular array of large two-axis tracking reflective dishes or flat multiple mirror heliostats on the ground that accurately follow the sun’s path across the sky. These reflective dishes capture and concentrate the sunlight onto a central receiver mounted at the top of the high “solar power tower” as depicted in Figure 2. These “heliostats” are basically large mirrors equipped with computer-controlled sun tracking mechanisms that keep them aligned so that reflected rays of the sun are always aimed at the blackened heat absorbing receiver as a focal point.
(c) Linear Fresnel reflector: this is a specific type of “linear Fresnel reflector” technology. The technology uses long, thin segments of mirrors to focus sunlight onto a fixed absorber located at a common focal point of the reflectors. They are named for their similarity to a “Fresnel lens”, in which many small, thin lens fragments are combined to simulate a much thicker simple lens. These mirrors are capable of concentrating the solar energy to many times its normal intensity. This concentrated energy is transferred through the absorber into some thermal fluid. The fluid then goes through the heat exchanger to power a steam generator as depicted in Figure 3.
Table 2 compares CSP technologies depicted in Figure 1, Figure 2 and Figure 3 by the following four criteria: First, construction cost is an important measure when comparing the different power station types in this study. The report of American Institute of Physics (AIP) indicates that heliostat power towers are slightly less expensive to construct than similar capacity parabolic trough power stations [28]. This is based upon a comparison among similar sized power stations, where estimated cost of construction of the parabolic trough site was US$675 million, and the power tower was US$598 million. Since the linear Fresnel reflectors are in their beginning stages of development, no major studies have been completed on comparing construction costs to the other forms of CSP. However, the idea of the Fresnel reflector design is a modification of the parabolic trough design, aimed at lowering costs by changing the shape of the mirrors. Thus, it can be concluded that the construction cost of Fresnel reflectors should be lower than that of parabolic troughs.
Second, efficiency of electricity generation is also an important characteristic of these technologies. This can be affected by the temperatures achieved by the technologies, as well as the transportation methods for the heat collected. Power towers achieve the highest temperatures, with parabolic troughs and Fresnel reflectors reaching similar temperatures [29,30]. The use of less piping to transfer the heat in the power tower system also lowers heat loss throughout the system, boosting efficiency.
Third, location is another important factor when comparing CSP technologies. It is clear that all three need locations with ample sun. However, power towers again have an advantage, as they do not require extremely flat surfaces for installation (with the exception of their central power tower). In the power tower’s solar field, each mirror operates individually, allowing for installation on uneven ground. This unevenness can be corrected by the software used to track the sun throughout the day. Conversely, parabolic trough and Fresnel reflectors require large mirrors that are connected to one another. This requires large, flat spaces for installation. Overall, power towers are a bit more flexible when considering building locations.
Finally, reliability of the parabolic trough outperforms the other two CSP. The reliability depends upon future technology development of CSP, so that it is not clearly decisive in this stage as in Table 2. Based on these comparison parameters, it can be concluded that as technology continues to develop, heliostat power towers are likely to become the dominant CSP method. This change is likely to occur due to the power tower’s lower cost, flexibility of location, and overall efficiency. However, as stated previously, the majority of current CSP stations are of the parabolic trough model. Conclusions on the Fresnel method are difficult to draw, because the method is still in developmental stages.
2.4. Congestion
This study visually discusses a possible existence of “congestion” in a transmission grid network for connecting solar thermal power stations and end users. For this purpose, Figure 4 is important in understanding what type of problem occurs in a grid network.
In Figure 4, we consider a power exchange market that is separated into two zones based on a geographic location of nodes and a transmission grid network. The figure depicts such a market that consists of two zones (i.e., A and B). Each zone contains several different types of generators and loads. There are two types of transmission connections in the power market: intra-zonal link and inter-zonal link. Intra-zonal links are connections that exist among generators and wholesalers within a zone. Inter-zonal links are connections between the two zones. A common market price exists if the two zones are linked together with each other. However, if they are functionally separated by a capacity limit on an interconnection line, so indicating the occurrence of congestion, then the two zones have different local market prices.
Figure 4 assumes that the congestion occurs in the inter-zonal link (a–b). This study excludes the congestion on an intra-zonal link because it can be handled by obtaining electricity from a generator(s) in a same zone. A capacity limit on the link usually increases the market price, because of limiting the transmission ability of each zone to obtain electricity from an inexpensive generator(s) in another zone(s). The expensive electricity generated by renewable energy is often excluded from the power exchange market if the congestion is observed [2].
Since the electricity generated by solar thermal power stations is expensive, there is a likelihood in which the power market excludes their electricity supplies. They need financial support on the use of solar thermal energy in the manner in which it can be competitive in the power market. The political rationale on the financial support is that we need to reduce the amount of GHG emissions. The market controllers (e.g., ISO: independent system organizer) also need to allocate the first priority to solar thermal power generation in their dispatch scheduling plans.
3. Methodology
3.1. Overview
This study uses DEA as an assessment tool to evaluate the performance of three types of solar thermal power plants in three different country groups. Before describing the analytical capability, this study needs to mention four methodological benefits when it is applied to energy and the environment. Our description has three components. We first explain rationales concerning why this research uses DEA for performance assessment. Then, we discuss how to reorganize its structure for energy and environmental assessment. Finally, we need to discuss how to restructure the DEA environmental assessment for performance assessment of solar thermal power plants.
(a) DEA: this has four unique analytical capabilities utilized in this study. First, it can be considered as a “non-parametric” approach because it measures weights among inputs and outputs, not parameter estimates. Second, DEA does not need to assume any functional form which expresses the analytical relationship between these factors. The method can avoid a “specification error” in determining such a relationship. The analytical capability indicates that DEA outperforms statistical approaches such as regression analysis and econometrics. It is widely known that we need to specify a functional form for statistical analysis, but none knows what the best functional form is. Third, DEA can handle multiple inputs and multiple outputs in performance assessment without computational difficulty. DEA can be solved by linear programming so that it has a high level of computational tractability. Finally, a drawback of DEA is that it does not have statistical inferences at the level of regression analysis and econometrics. It is necessary for us to develop statistical tests to examine null hypotheses.
(b) DEA environmental assessment: the above general description on DEA assumes that it utilizes inputs and outputs as production factors. The assumption shows limited applicability in assessing DEA environmental assessment. That is, the assessment needs to separate outputs into desirable and undesirable categories. A computational difficulty occurs because we need to maximize the former outputs, while minimizing the latter outputs. As a result, the approach was formulated by non-linear or integer programming. The unification between the two different types of outputs also becomes a major computational problem. To solve the difficulties, research efforts, including [2], introduced natural and managerial disposability concepts for DEA environmental assessment. The disposability means the elimination of inefficiency. The “natural disposability” has the first priority of economic prosperity. The second one exists on pollution prevention. The “managerial disposability” has an opposite priority to the natural disposability. The first priority exists in pollution prevention and the second one is economic prosperity. A series of studies, summarized in Reference [2], have extended the previous works in the manner that we can discuss the sustainability within economic prosperity and pollution prevention.
(c) Renewable energies: to combat global climate change, renewable energies are important because they do not produce CO2 and other GHG emissions. Solar thermal power generation is the one for such promising renewable energy source. When we apply DEA to the performance assessment of CSP stations, this research needs to drop the existence of undesirable outputs from our environmental assessment. As a consequence, the structure of DEA environmental assessment needs to return to the original formulations. An exception is that the reorganized formulations need to incorporate a possible occurrence of congestion (e.g., a line limit on transmission as discussed in Section 2.4) because it influences the performance of CSP stations. The electricity generated by CSP is not conveyed to consumers under the occurrence of congestion. The occurrence is problematic in terms of utilizing renewable energies. The difficulty has been not yet clearly discussed in research on renewable energies.
3.2. Input-Oriented Models
In this study, the proposed use of DEA is separated into the two types of models. One of them is an input-based model and the other is an output-based model. This study applies them to both the CSP stations for our empirical investigation.
Many previous studies (e.g., [2]) have discussed a possible occurrence of congestion by comparing between the two input-based models. This study reorganizes their previous works to prepare new input-based assessment. One of the two models is reorganized as follows:
![Energies 12 02454 i001]()

In Model (1), is an input-oriented efficiency measure determined by Model (1), is a very small number (e.g., 0.0001) and d-related variables are slacks related to inputs () and outputs () of all decision-making units (DMUs: j = 1, .., n). The variable () is an unknown column vector of intensity (or structural) variables for connecting and on all DMUs. The k indicates a specific DMU to be examined by DEA.
The other input-based model is as follows:
![Energies 12 02454 i002]()

The scalar () is an input-oriented efficiency measure determined by Model (2). A difference between (1) and (2) can be found in the equality assignment on inputs, i.e., . The equality constraint is used to identify a possible occurrence of input-based congestion.
In constructing Models (1) and (2), the left hand side (i.e., and ) indicates an efficiency frontier for a composite (i.e., hypothetically ideal) performance obtained from efficient DMUs, while the right hand side (i.e., and ) denotes the observed values of the k-th DMU. The two models compute the efficiency scores by comparing between the efficiency frontier and the observed achievement. The additional condition () indicates that the efficiency frontier is shaped by a convex combination of observations on DMUs. As a result of the assumption of convexity, we can avoid the specification of a functional form between inputs and outputs.
It is important to note that this study newly incorporates in Model (1) and in Model (2) to maintain a percentage expression on the two efficiency scores. As a result, they locate between 0 (full inefficiency) and 1 (full efficiency). Such an analytical treatment on the two efficiency measures is different from the previous DEA formulations summarized in [2].
On optimality (*), Model (1) compute the degree of input-based operational efficiency (OE) of the k-th DMU by
Meanwhile, Model (2) determines the measure by
Models (1) and (2) provide two measures on operational efficiency: OE(v) and OE(vc). The v stands for variable returns to scale (RTS) because is incorporated into Models (1) and (2), but OE(v) does not determine a possible occurrence of congestion. The c of OE(vc) can include such a possible occurrence into the proposed assessment. The importance of OE(v) and OE(vc) is that they can measure the occurrence of congestion by comparing between the two OE measures.
3.3. Input-Based Congestion Identification
Let the optimal objective value of Model (1) be and that of Model (2) be . Then, the input-based congestion (IC) is measured by the following ratio:
If IC then the congestion occurs on the k-th DMU. Meanwhile, if IC, then the congestion does not occur on the k-th DMU. The optimal objective value of Model (1) is more freely determined than that of Model (2) in terms of minimization. Therefore, IC < 1 indicates an occurrence of congestion while IC = 1 implies no occurrence of congestion.
3.4. Output-Oriented Models
Shifting our description to output-oriented measurement, this study reorganizes Models (1) and (2) by the following two output-oriented models (6) and (8):
![Energies 12 02454 i003]()

The model uses to express the level of an output-oriented OE of the k-th DMU. On optimality, Model (6) computes it by
The OE(v) stands for the degree of OE under variable RTS.
The occurrence of congestion on the k-th DMU is examined by the following model:
![Energies 12 02454 i004]() Model (8) drops slacks related to inputs from Model (6). The description of Models (1) and (2) can be applicable to Models (6) and (8).
Model (8) drops slacks related to inputs from Model (6). The description of Models (1) and (2) can be applicable to Models (6) and (8).

Let the optimal objective value of Model (8) be . Then, the OE measure becomes
Here, the c stands for a possible occurrence of congestion in the output-based OE.
3.5. Output-Based Congestion Identification
The output-based congestion (OC) is measured by the following ratio:
The classification rule is specified as follows: If OC () > 1, then the congestion occurs on the k-th DMU. The sign is an opposite of IC. Meanwhile, if OC () = 1, then there is no congestion on the DMU. The objective value of Model (6) is more freely determined than that of Model (8) in the maximization. Thus, OC () > 1 indicates an occurrence of congestion. Meanwhile, OC () = 1 indicates no occurrence of congestion.
A methodological benefit of the proposed approach is that it is possible for us to measure an occurrence of congestion even if the proposed models suffer from an occurrence of multiple solutions. Meanwhile, a drawback of the approach is that it is impossible for us to identify how and why the congestion occurs in part or whole of a production facility. The Reference [2] mathematically discussed the occurrence of congestion under multiple solutions in DEA.
4. Assessment of Solar Thermal Power Stations
This study use two outputs and three inputs to measure the performance of solar thermal power stations in industrial nations. The inputs include (a-1) average annual sunshine hours (hours), (a-2) a land area (acres) and (a-3) a solar filed aperture area (m2). The outputs include (b-1) a gross generation (MW: Megawatt) and (b-2) an average annual power generation capacity (MWh: Megawatt hours). In this study, each DMU represents a power station that utilizes such production factors.
The average annual sunshine is the average amount of sunshine that a given location may receive on an annual basis, measured in hours between sunrise and sunset. For energy generation, thermal energy from the Sun is the primary energy source. Thus, the amount of sunshine at a site has a significant effect on a power station’s ability to generate electricity. Weather conditions and location affect the amount of available sunlight at a given site. The data was calculated based off of monthly averages in the area of each site. Monthly averages come from the World Weather Online Database [31].
The solar field aperture area is the total area of mirrors deployed at a power station. This measurement is important, as the larger the collection area for the mirrors, the more sunlight can be captured for electricity generation. This measurement was taken in square meters. All but one data point for solar field aperture area data is from the National Renewable Energy Laboratory (NREL) Database [32]. The data for the Mojave Solar Project was available from the website of the company (Abengoa) [33].
The land area is the physical area that a power station occupies. The reasoning for using this as an input is similar to that of the solar field aperture area. Solar thermal power stations generally take up a large amount of physical space. The more effectively a power station can use their allotted land area to generate power, the more effective the station becomes. The unit, used to measure the area, is the acre. The data for land area was retrieved from several sources. The majority of the sites land areas were listed on the NREL database [32]. However, the Solar Energy Generating Systems (SEGS) sites’ data were all taken from the Global Energy Observatory website [34]. The data for the KaXu site was taken from the KaXu Solar One license application [35]. The Khi Solar One data was taken from the Abengoa website [33].
The gross generation capacity is the full-load, sustainable output of a power station. Power stations are often rated by this capacity (for example, the Mojave Solar Project stations is a 280 MW power station). This is a primary measure for any power station, as it indicates how much potential power a station can output. Many power stations do not operate at this capacity for various reasons, including consumer demand, sunshine availability, and equipment inefficiency. Installed capacity is often measured in MW. All gross generation capacity data comes from the NREL database [32].
The average annual power generation measures a power station’s generated power in MWh. This is the product that electric companies provide to the consumer. This output is the end goal of any commercial power station, as it dictates how much profit a power station can generate in a year. Since solar thermal electricity generation is in its early stages, most of the studied sites are relatively new. As such, most of the power generation data is estimated power generation. For sites with available annual average generation, the data was used. All data for the average annual power generation, with the acceptation of the SEGS sites, was obtained from the NREL database [32]. Data for the SEGS sites was obtained from the US Energy Information Administration website [36].
Table 3 exhibits all the data set. Table 4 summarizes descriptive statistics that contains an average, a maximum, a minimum and a standard deviation (SD) on each factor. The observed year was 2018. This study compares 55 solar thermal power stations which are classified (a) 13 sites in United States of America (USA), (b) 32 sites in Spain and (c) 10 sites in the other regions including France, Italia, Mexico, China, Thailand, United Arab Emirates (UAE), India and South Africa.
This study selects solar thermal power stations from European Union (EU), in particular Spain and the United States, in particular “Mojave Desert region” in Southern California. The research motivation concerning why the two regions are mainly selected is because those power stations have high densities of solar thermal power. It is widely known that the Mojave Desert region has the highest density of solar thermal energy in the United States, while Spain leads the way in EU by utilizing parabolic trough technology.
Table 5 summarizes the input-based OE measures of those sites, measured by Models (1) and (2), along with their types of IC. The IC classification is determined by Equation (5). For example, the Mojave Solar Project is rated as unity in all the three efficiency measures. As specified in IC, the power site (i.e., the first power plant in Table 5) does not suffer from the occurrence of IC. The operational performance is also efficient. Meanwhile, Guzman (12th power plant in Table 5) exhibits 0.9235 in input-based OE and 0.9610 under IC. The operational inefficiency may come from a possible occurrence of IC. Table 5 indicates that 23 of 55 solar thermal power sites may suffer from the occurrence of IC. The remaining 32 sites may not suffer the occurrence.
Here, it is important to describe the implication of IC on solar thermal generation. Under the IC occurrence, an output reduction (e.g., generation) does not decrease an input(s) (e.g., average annual sunshine hours, a land area and a solar filed aperture area) in the power sites because the inputs are “uncontrollable”. In other words, the IC occurrence indicates that the power stations cannot control the input resources which are influenced by Sun, weather and location of their sites. Thus, the IC implies a managerial limit on controllability on input resources. Such uncontrollable inputs may influence their operations, so becoming the sources of their inefficiencies. This feature on inputs is due only to renewable energies, and is not found in fossil fuel energies whose inputs are “controllable”. This difference on controllable and uncontrollable inputs provides a distinction between renewable and fossil fuel energies. No previous research has discussed the important distinction.
Table 6 summarizes those output-based operational efficiencies measured by Models (6) and (8) and the type of OC. The OC classification is determined by Equation (10). For example, Mojave Solar Project is rated as unity in all the three efficiency measures. As specified in OC, the power site (the first power plant in Table 6) does not suffer from the occurrence of OC. The operational performance is also efficient. Meanwhile, Guzman (12th power plant in Table 6) exhibits 0.8882 in output-based OE and 1.0389 in OC. The operational inefficiency may be due to the OC. Table 6 indicates that 20 CSP sites may suffer from a possible occurrence of OC.
It is important to note the implication of OC on solar thermal generation. The OC implies that an increase in an input(s) decreases an output(s). This type of inefficiency is different from the concept of IC. The OC indicates that an input enhancement (e.g., average sunny hours) does not increase an output increase (e.g., generation) due to a line limit on transmission, a dispatch scheduling problem and other technical problems between generators by CSP sites and consumers.
After obtaining the input- and output-based OE measures, Table 7 compares average efficiencies of the three types of CSP technologies. In the second column of the table, the parabolic trough exhibits 0.952, the heliostat power tower exhibits 0.939 and the linear Fresnel reflector exhibits 0.898 in their input-based OE(v) estimates on average. They do not maintain the ranking order if we consider an occurrence of IC as listed in the last column of Table 7.
Table 8 compares average efficiencies of CSP stations in the three country groups. In the second column of the table, the power stations in the United States exhibit 0.978, those of Spain exhibit 0.938 and those of the other nations exhibit 0.945 in their input-based OE(v) estimates on average. Those results are different from Table 7.
Table 9 compares average output-based OE of the three CSP technologies. In the second column of the table, the parabolic trough exhibits 0.904, the heliostat power tower exhibits 0.863 and the linear Fresnel reflector exhibits 0.715 in their output-based OE(v) estimates on average. They do not maintain the ranking order if we consider an occurrence of OC as listed in the last column of Table 9.
Table 10 compares output-based efficiencies of solar thermal power stations in the three country groups. In the second column of the table, the power sites in the United States exhibit 0.974, those of Spain exhibit 0.859 and those of the other nations exhibit 0.889 in their output-based OE(v) estimates on average. They maintain the same ranking order even if we consider the OC as listed in the last column of Table 10. This result is different from Table 9.
Hereafter, we conduct statistical tests on input-based and output-based efficiencies. The null hypotheses to be examined are summarized by the following four cases:
First Ho: there is no difference among input-based OE measures of the three types of solar thermal power stations.
Second Ho: there is no difference among input-based OE measures of the three country groups.
Third Ho: there is no difference among output-based OE measures of the three types of solar thermal power stations.
Fourth Ho: there is no difference among output-based OE measures of the three country groups.
Table 11 lists the p-value of the Kruskal–Wallis rank sum test to examine the first and second null hypotheses. The test indicates that we reject the second hypothesis on the country differences, but being unable to reject the first hypoesthesia on the three CSP technologies. The research [37] discussed how to use DEA results for the Kruskal–Wallis rank sum test.
Table 12 lists the p-value of the rank sum test to examine the third and fourth null hypotheses. The test indicates that we reject the fourth hypothesis on the country differences, but are unable to reject the third hypoesthesia on the three different solar thermal technologies. The results are similar to the ones of Table 11.
The statistical tests imply that we cannot find an efficiency difference among the three solar thermal technologies. Thus, there is no major technical difference among the efficiency measures regarding CSP stations. However, there is a difference among the three country groups. Thus, the location of CSP sites is more important than their technologies at the current moment.
5. Conclusion and Future Extensions
To combat increasing energy consumption in the world, many researchers and individuals who are involved in the electric power industry have been interested in solar thermal energies. Without GHG emission, the CSP may play an important role for future energy planning. This study selected CSP sites from three regions (i.e., the United States, Spain, the other nations) throughout the world and examined which region most efficiently produced solar thermal power.
This research utilized DEA to measure the performance of solar thermal power stations. There were many research efforts that documented how to utilized DEA assessment on renewable energies (e.g., [2,3,4,5]). These previous studies focused upon the performance of PV sites, not CSP. This research was the first effort to discuss the DEA assessment on the CSP sites.
Our empirical results showed that the sites in United States were the most efficient among the three regional groups. This study also indicated that parabolic trough technology slightly outperformed the other two technologies (i.e., heliostat power tower and linear Fresnel reflector) but not at the level of statistical significance. Besides the efficiency assessment, this study incorporated a way of finding a possible existence of IC and that of OC. The existence of IC implied that uncontrollable inputs might increase the level of inefficiency. Meanwhile, the OC implied the existence of a capacity limit (e.g, difficulties on transmission, voltage and frequency control, and dispatch scheduling) and other technical problems between generation and end users.
It is indeed true that renewable sources, such as CSP, are important as our future energy. However, a grid network is also essential in conveying electricity generated renewable energy to end users. A holistic assessment on electricity supply systems from generators to consumers is essential for evaluating and planning renewable energy sources such as CSP stations. This research has first documented the holistic measurement, including IC and OC, whose occurrence is identified by DEA. In this perspective, this study is an extension of the previous efforts such as References [2,3,4,5].
We acknowledge that this research has three drawbacks, all of which need to be explored in near future. One of them is that we need to restructure an analytical structure of DEA which can incorporate a time shift to examine a frontier shift among different periods. There are several approaches to measure the frontier shift. For example, a well-known approach is “Malmquist index approach” that measures the frontier shift among multiple periods. The other approach is “window analysis approach” that measures a shift of efficiency scores among multiple periods. The book [2] provides a detailed description on them. This study has used the performance of solar power sites in 2018 because the annual period expresses the most recent technology. We need to extend it to a long term horizon by using the two approaches. Second, it is necessary for us to apply the proposed DEA approach to other nations that were not examined in this article. Finally, this study needs to develop a new assessment to examine a technological progress in renewable energy [2,3,4,5].
In conclusion, it is hoped that this research makes a contribution to DEA applied to renewable energies.
Author Contributions
For research articles with two authors, this short paragraph specifying their individual contributions must be provided. Conceptualization, T.S.; Methodology, T.S.; Software, M.G.; Validation, T.S.; Formal Analysis, T.S.; Investigation, T.S.; Resources, T.S.; Data Curation, T.S.; Writing-Original Draft Preparation, T.S.; Writing-Review & Editing, T.S.; Visualization, T.S.; Supervision, T.S.; Project Administration, T.S.; Funding Acquisition, M.G.
Funding
This research received no external funding.
Conflicts of Interest
The authors declare no conflict of interest.
Variables
| an input-oriented operational efficiency (under no congestion) | |
| an input-oriented operational efficiency (under possible congestion) | |
| an output-oriented operational efficiency (under no congestion) | |
| an output-oriented operational efficiency (under possible congestion) | |
| the i-th input of the j-th DMU | |
| the r-th output of the j-th DMU | |
| an unknown slack variable of the i-th input | |
| An unknown slack variable of the r-th output | |
| an unknown column vector of intensity (or structural) variables | |
| a prescribed small number to control the magnitude of efficiency |
References
- The International Energy Agency. Available online: https://www.iea.org/statistics/?country (accessed on 1 March 2019).
- Sueyoshi, T.; Goto, M. Environmental Assessment on Energy and Sustainability by Data Envelopment Analysis; John Wiley & Sons: London, UK, 2018; pp. 1–699. [Google Scholar]
- Sueyoshi, T.; Goto, M. Photovoltaic power stations in Germany and the United States: A comparative study by data envelopment analysis. Energy Econ. 2014, 42, 271–288. [Google Scholar] [CrossRef]
- Sueyoshi, T.; Goto, M. Measurement of returns to scale on large photovoltaic power stations in the United States and Germany. Energy Econ. 2017, 64, 306–320. [Google Scholar] [CrossRef]
- Wang, D.; Sueyoshi, T. Assessment of large commercial rooftop photovoltaic system installations: Evidence from California. Appl. Energy 2017, 188, 45–55. [Google Scholar] [CrossRef]
- Ibrik, I.H.; Mahmoud, M.M. Energy efficiency improvement procedures and audit results of electric, thermal and solar applications in Palestine. Energy Policy 2005, 33, 651–658. [Google Scholar] [CrossRef]
- Coventry, J.S. Performance of a concentrating photovoltaic/thermal solar collector. Sol. Energy 2005, 78, 211–222. [Google Scholar] [CrossRef]
- Clifton, J.; Boruff, B.J. Assessing the potential for concentrated solar power development in rural Australia. Energy Policy 2010, 38, 5272–5280. [Google Scholar] [CrossRef]
- Chow, T.T. A review on photovoltaic/thermal hybrid solar technology. Appl. Energy 2010, 87, 365–379. [Google Scholar] [CrossRef]
- Xie, W.T.; Dai, Y.J.; Wang, R.Z.; Sumathy, K. Concentrated solar energy applications using Fresnel lenses: A review. Renew. Sustain. Energy Rev. 2011, 15, 2588–2606. [Google Scholar] [CrossRef]
- Oro, E.; Gil, A.; Gracia, A.; Boer, D.; Cabeza, L.F. Comparative life cycle assessment of thermal energy storage systems for solar power plants. Renew. Energy 2012, 44, 166–173. [Google Scholar] [CrossRef]
- Bahadori, A.; Nwaoha, C. A review on solar energy utilization in Australia. Renew. Sustain. Energy Rev. 2013, 18, 1–5. [Google Scholar] [CrossRef]
- Singh, G.K. Solar power generation by PV (photovoltaic) technology: A review. Energy 2013, 53, 1–13. [Google Scholar] [CrossRef]
- Desideri, U.; Zepparelli, F.; Morettini, V.; Garroni. Comparative analysis of concentrating solar power and photovoltaic technologies. Technical and environmental evaluations. Appl. Energy 2013, 102, 765–784. [Google Scholar] [CrossRef]
- Moore, J.; Grimes, R.; Walsh, E.; O’Donovan, A. Modeling the thermodynamic performance of a concentrated solar power plant with a novel modular air-cooled condenser. Energy 2014, 69, 378–391. [Google Scholar] [CrossRef]
- Vignarooban, K.; Xu, X.; Arvay, A.; Hsu, K.; Kannan, A.M. Heat transfer fluids for concentrating solar power systems. Appl. Energy 2015, 146, 383–396. [Google Scholar] [CrossRef]
- Ortiz, C.; Chacartegui, R.; Valverde, J.M.; Alovisio, A.; Becerra, J.A. Power cycles integration in concentrated solar power plants with energy storage based on calcium looping. Energy Conv. Manag. 2017, 149, 815–829. [Google Scholar] [CrossRef]
- Fasquelle, T.; Falcoza, Q.; Neveua, P.; Hoffmanna, J.-F. A temperature threshold evaluation for thermocline energy storage in concentrated solar power plants. Appl. Energy 2018, 212, 1153–1164. [Google Scholar] [CrossRef]
- Salasa, D.; Tapachèsa, E.; Mazeta, N.; Aussela, D. Economical optimization of thermochemical storage in concentrated solar power plants via pre-scenarios. Energy Conv. Manag. 2018, 174, 932–954. [Google Scholar] [CrossRef]
- Cavallaro, F.; Zavadskas, E.K.; Streimikiene, D. Concentrated solar power (CSP) hybridized systems: Ranking based on an intuitionistic fuzzy multi-criteria algorithm. J. Clean. Prod. 2018, 179, 407–416. [Google Scholar] [CrossRef]
- Zsembinszki, G.; Solé, A.; Barreneche, C.; Prieto, C.; Fernández, A.I.; Cabeza, L.F. Review of reactors with potential use in thermochemical energy storage in concentrated solar power plants. Energies 2018, 11, 2358. [Google Scholar] [CrossRef]
- Cavallaroa, F.; Zavadskas, E.K.; Streimikiene, D.; Mardanid, A. Assessment of concentrated solar power (CSP) technologies based on a modified intuitionistic fuzzy topsis and trigonometric entropy weights. Technol. Forecast. Soc. Chang. 2019, 140, 258–270. [Google Scholar] [CrossRef]
- National Renewable Energy Laboratory Database. Available online: https://solarpaces.nrel.gov/ (accessed on 1 March 2019).
- Energy Matters. Available online: http://euanmearns.com/concentrated-solar-power-vs-solar-pv-an-update/ (accessed on 1 March 2019).
- Office of Energy Efficiency and Renewable Energy. Available online: https://www.energy.gov/eere/solar/downloads/linear-concentrator-solar-power-plant-illustration (accessed on 1 March 2019).
- Office of Energy Efficiency and Renewable Energy. Available online: https://www.energy.gov/eere/solar/articles/power-tower-system-concentrating-solar-power-basics (accessed on 1 March 2019).
- Office of Energy Efficiency and Renewable Energy. Available online: https://www.energy.gov/eere/splar downloads/linear-fresnel-power-plant-illustration (accessed on 1 March 2019).
- American Institute of Physics. Available online: https://aip.scitation.org/doi/pdf/10.1063/1.4984538 (accessed on 1 March 2019).
- Nur Energie. Available online: http://www.nurenergie.com/index.php?page=csp-comparison (accessed on 1 March 2019).
- Soltigua. Available online: http://www.soltigua.com/wp-content/uploads/2009/09/Soltigua_Energetica india.pdf (accessed on 1 March 2019).
- World Weather Online Database. Available online: https://www.worldweatheronline.com (accessed on 1 March 2019).
- National Renewable Energy Laboratory Database. Available online: https://solarpaces.nrel.gov/by-technology (accessed on 1 March 2019).
- Abengoa Online Datasheet for Mojave Solar Project. Available online: http://www.abengoa.com/web/en/noticias_y_publicaciones/galleriavideos/infografias/energia/ (accessed on 1 March 2019).
- Global Energy Observatory. Available online: http://globalenergyobservatory.org/list.php? db=PowerPlants&type=Solar_Thermal (accessed on 1 March 2019).
- KaXu Solar One Licence Application. Available online: http://www.nersa.org.za/Admin/Document /Editor/file/Consultations/Electricity/Presentations/Ka%20Xu%20Solar%20One%20(Pty)%20Limited.pdf (accessed on 1 March 2019).
- U.S. Energy Information Administration. Available online: https://www.eia.gov/electricity/monthly/ (accessed on 1 March 2019).
- Sueyoshi, T.; Goto, M. Environmental assessment by DEA radial measurement: U.S. coal-fired power plants in ISO (independent system operator) and RTO (regional transmission organization). Energy Econ. 2012, 34, 663–676. [Google Scholar] [CrossRef]
Figure 1.
Parabolic trough power station. Source: Office of Energy Efficiency and Renewable Energy [25]. (i) The technology contains parabolic trough mirror solar collectors. (ii) Pipes at the focal point of the parabolic mirrors are filled with heat transfer fluid. (iii) Heated fluid is used to drive steam turbine generators. (iv) Fluid can be stored to generate power when the sun is not visible.

Figure 2.
Heliostat power tower power station. Source: Office of Energy Efficiency and Renewable Energy [26]. (i) Mirror array focuses sunlight to a surface on the power tower. (ii) Heat transfer fluid is passed through the surface. (iii) Heated fluid is used to drive steam turbine generators. (iv) Fluid can be stored to generate power when the sun is not visible.

Figure 3.
Linear Fresnel reflector power station. Source: Office of Energy Efficiency and Renewable Energy [27]. (i) Flat mirrors are used to redirect sunlight onto a collection surface. (ii) Pipes along the collection surface are filled with heat transfer fluid. (iii) Heated fluid is used to drive steam turbine generators. (iv) Fluid can be stored to generate power when the sun is not visible.

Figure 4.
Congestion between two zones. (i) The G stands for a generator. The arrow indicates a load. The generator includes a solar thermal power station and the other types of generation (e.g., oil, coal, nuclear and renewable energy generation). (ii) Each zone consists of several different types of generators and loads. (ii) If the two zones are functionally separated by a capacity limit on an interconnection line, then a possible congestion may occur between them. End users in a zone cannot uses electricity generated by a solar thermal power station in the other zone.


Table 1.
Solar photovoltaic (PV) and concentrated solar power (CSP): comparison.
| Criteria | PV | CSP |
|---|---|---|
| Construction Cost Estimate | $2000 per kW | $8000 per kW |
| Usable in Partial Sunlight | ✓ | - |
| Simplicity of Station Construction/Operation | ✓ | - |
| Option for Personal and Small Business Use | ✓ | - |
| Energy Storage Capability | - | ✓ |
Table 2.
Comparison among three concentrated solar power (CSP) technologies.
| Criteria | Parabolic Trough | Heliostat Power Tower | Linear Fresnel Reflector |
|---|---|---|---|
| Construction/Material Cost | Highest Cost | Lowest Cost | Assumed Median Cost |
| Efficiency | Low Efficiency | Highest Efficiency | - |
| Location Flexibility | Must be on flat surface | Can be constructed on flat or uneven terrain | Must be on flat surface |
| Reliability | Proven Technology with historical usage | Unproven (in initial production stages) | Unknown (developmental stage) |
Table 3.
Data on solar thermal power stations.
| Site | Input 1 | Input 2 | Input 3 | Output 1 | Output 2 | Country | Technology |
|---|---|---|---|---|---|---|---|
| Average Annual Sunshine (Hours) | Land Area (Acres) | Solar Field Aperture Area (m2) | Gross Output Capacity (MW) | Average Annual Power Generation (MWh) | |||
| Mojave Solar Project | 3741 | 1765.0 | 1,500,000 | 280 | 574,171 | USA | Parabolic Trough |
| Solana Generating Station | 3483 | 1927.0 | 2,200,000 | 280 | 555,859 | USA | Parabolic Trough |
| Genesis Solar Energy Project | 3587 | 1950.0 | 1,526,170 | 280 | 612,385 | USA | Parabolic Trough |
| Nevada Solar One | 3514 | 400.0 | 357,200 | 75 | 120,311 | USA | Parabolic Trough |
| SEGS III | 3545 | 160.6 | 230,300 | 33 | 59,717 | USA | Parabolic Trough |
| SEGS IV | 3545 | 185.3 | 230,300 | 33 | 60,646 | USA | Parabolic Trough |
| SEGS V | 3545 | 187.8 | 250,500 | 33 | 69,587 | USA | Parabolic Trough |
| SEGS VI | 3545 | 172.9 | 188,000 | 35 | 59,606 | USA | Parabolic Trough |
| SEGS VII | 3545 | 197.7 | 194,280 | 35 | 55,678 | USA | Parabolic Trough |
| SEGS VIII | 3545 | 407.7 | 464,340 | 89 | 97,510 | USA | Parabolic Trough |
| SEGS IX | 3545 | 469.5 | 483,960 | 89 | 129,506 | USA | Parabolic Trough |
| Guzman | 3112 | 494.2 | 310,406 | 50 | 104,000 | Spain | Parabolic Trough |
| Andasol Solar Power Station | 3281 | 1483.0 | 1,530,360 | 150 | 491,000 | Spain | Parabolic Trough |
| Extresol Solar Power Station | 3133 | 1483.0 | 1,530,360 | 150 | 491,000 | Spain | Parabolic Trough |
| Aste Solar Power Station | 3142 | 939.0 | 1,020,240 | 100 | 320,000 | Spain | Parabolic Trough |
| Arcosol 50 | 3648 | 568.3 | 510,120 | 50 | 175,000 | Spain | Parabolic Trough |
| Arenales | 3185 | 543.6 | 510,120 | 50 | 166,000 | Spain | Parabolic Trough |
| Borges Termosolar | 3301 | 237.2 | 183,120 | 23 | 98,000 | Spain | Parabolic Trough |
| Casablanca | 3108 | 494.2 | 510,120 | 50 | 160,000 | Spain | Parabolic Trough |
| Enerstar | 3270 | 523.8 | 339,506 | 50 | 100,000 | Spain | Parabolic Trough |
| Helioenergy 1+2 | 3112 | 543.6 | 600,000 | 100 | 190,000 | Spain | Parabolic Trough |
| Helios I and II | 3142 | 642.5 | 600,000 | 100 | 194,000 | Spain | Parabolic Trough |
| Ibersol Ciudad Real | 3102 | 370.7 | 287,760 | 50 | 103,000 | Spain | Parabolic Trough |
| La Africana | 3145 | 622.7 | 550,000 | 50 | 170,000 | Spain | Parabolic Trough |
| La Dehesa | 3133 | 494.2 | 552,750 | 50 | 175,000 | Spain | Parabolic Trough |
| La Florida | 3133 | 494.2 | 552,750 | 50 | 175,000 | Spain | Parabolic Trough |
| Alvarado I | 3133 | 333.6 | 352,854 | 50 | 105,200 | Spain | Parabolic Trough |
| Agua Prieta II | 3451 | 148.3 | 85,000 | 14 | 34,000 | Mexico | Parabolic Trough |
| Archimede | 3416 | 19.8 | 31,860 | 5 | 9,200 | Italy | Parabolic Trough |
| Astexol II | 3133 | 395.4 | 510,120 | 50 | 170,000 | Spain | Parabolic Trough |
| Cresent Dunes Solar Energy Project | 3462 | 1600.0 | 1,197,148 | 110 | 500,000 | USA | Heliostat Power Tower |
| eLLo Solar Thermal Project | 3009 | 86.5 | 153,000 | 9 | 20,200 | France | Linear Fresnel Reflector |
| Gemasolar Thermosolar Plant | 3111 | 481.9 | 304,750 | 20 | 80,000 | Spain | Heliostat Power Tower |
| Ivanpah Solar Electric Generation System | 3438 | 3500.0 | 2,600,000 | 392 | 1,079,232 | USA | Heliostat Power Tower |
| Lebrija 1 | 3182 | 464.6 | 412,020 | 50 | 12,000 | Spain | Parabolic Trough |
| Majadas I | 3112 | 333.6 | 372,240 | 50 | 104,500 | Spain | Parabolic Trough |
| Manchasol 1 +2 | 3142 | 988.4 | 1,020,240 | 100 | 316,000 | Spain | Parabolic Trough |
| Moron | 3185 | 395.4 | 380,000 | 50 | 100,000 | Spain | Parabolic Trough |
| Olivenza 1 | 3133 | 395.4 | 402,210 | 50 | 100,000 | Spain | Parabolic Trough |
| Orellana | 3133 | 459.6 | 405,500 | 50 | 118,000 | Spain | Parabolic Trough |
| Palma del Rio I + II | 3111 | 667.2 | 744,480 | 100 | 229,000 | Spain | Parabolic Trough |
| Planta Solar 10 | 3182 | 135.9 | 75,000 | 11 | 23,400 | Spain | Heliostat Power Tower |
| Planta Solar 20 | 3182 | 197.7 | 150,000 | 20 | 48,000 | Spain | Heliostat Power Tower |
| Puerto Errado 2 | 3325 | 173.0 | 302,000 | 30 | 49,000 | Spain | Linear Fresnel Reflector |
| Solacor 1 + 2 | 3144 | 543.6 | 600,000 | 100 | 200,000 | Spain | Parabolic Trough |
| Solnova 1 + 3 + 4 | 3182 | 852.5 | 900,000 | 150 | 340,560 | Spain | Parabolic Trough |
| Termesol 50 | 3134 | 568.3 | 510,120 | 50 | 175,000 | Spain | Parabolic Trough |
| Termosol 1 + 2 | 3133 | 988.4 | 1,046,400 | 100 | 360,000 | Spain | Parabolic Trough |
| KaXu Solar One | 3941 | 2718.2 | 800,000 | 100 | 330,000 | South Africa | Parabolic Trough |
| Khi Solar One | 3941 | 346.0 | 576,800 | 50 | 180,000 | South Africa | Heliostat Power Tower |
| Supcon Solar Project | 3375 | 815.4 | 434,880 | 50 | 146,000 | China | Heliostat Power Tower |
| Megha Solar Plant | 3186 | 598.0 | 366,240 | 50 | 110,000 | India | Parabolic Trough |
| Godawari Solar Project | 3549 | 296.5 | 392,400 | 50 | 118,000 | India | Parabolic Trough |
| Thai Solar Energy | 2729 | 27.8 | 45,000 | 5 | 8,000 | Thailand | Parabolic Trough |
| Shams 1 | 3658 | 617.8 | 627,840 | 100 | 210,000 | UAE | Parabolic Trough |
Table 4.
Descriptive statistics.
| Production Factors | Input 1 | Input 2 | Input 3 | Output 1 | Output 2 |
|---|---|---|---|---|---|
| Average Annual Sunshine (Hours) | Land Area (Acres) | Solar Field Aperture Area (m2) | Gross Output Capacity (MW) | Average Annual Power Generation (MWh) | |
| Avg. | 3307 | 671.0 | 600,196 | 78 | 196,041 |
| Max. | 3941 | 3,500.0 | 2,600,000 | 392 | 1,079,232 |
| Min. | 2729 | 19.8 | 31,860 | 5 | 8,000 |
| S.D. | 241 | 667.2 | 517,469 | 75 | 194,696 |
Table 5.
Operational efficiency and input-based congestion.
| OE(v) | OE(vc) | IC | |
|---|---|---|---|
| Mojave Solar Project | 1.0000 | 1.0000 | 1.0000 |
| Solana Generating Station | 1.0000 | 1.0000 | 1.0000 |
| Genesis Solar Energy Project | 1.0000 | 1.0000 | 1.0000 |
| Nevada Solar One | 1.0000 | 1.0000 | 1.0000 |
| SEGS III | 1.0000 | 1.0000 | 1.0000 |
| SEGS IV | 0.9119 | 0.9119 | 1.0000 |
| SEGS V | 0.9366 | 0.9366 | 1.0000 |
| SEGS VI | 1.0000 | 1.0000 | 1.0000 |
| SEGS VII | 0.9203 | 0.9203 | 1.0000 |
| SEGS VIII | 1.0000 | 1.0000 | 1.0000 |
| SEGS IX | 0.9672 | 0.9672 | 1.0000 |
| Guzman | 0.9235 | 0.9610 | 0.9610 |
| Andasol Solar Power Station | 0.9699 | 1.0000 | 0.9699 |
| Extresol Solar Power Station | 1.0000 | 1.0000 | 1.0000 |
| Aste Solar Power Station | 0.9696 | 0.9895 | 0.9799 |
| Arcosol 50 | 0.8439 | 0.8439 | 1.0000 |
| Arenales | 0.9034 | 0.9034 | 1.0000 |
| Borges Termosolar | 1.0000 | 1.0000 | 1.0000 |
| Casablanca | 0.9278 | 0.9278 | 1.0000 |
| Enerstar | 0.8745 | 0.8943 | 0.9779 |
| Helioenergy 1+2 | 1.0000 | 1.0000 | 1.0000 |
| Helios I and II | 0.9656 | 0.9656 | 1.0000 |
| Ibersol Ciudad Real | 0.9689 | 0.9759 | 0.9929 |
| La Africana | 0.9020 | 0.9076 | 0.9938 |
| La Dehesa | 0.9370 | 0.9483 | 0.9881 |
| La Florida | 0.9370 | 0.9483 | 0.9881 |
| Alvarado I | 0.9133 | 0.9134 | 0.9999 |
| Agua Prieta II | 1.0000 | 1.0000 | 1.0000 |
| Archimede | 1.0000 | 1.0000 | 1.0000 |
| Astexol II | 1.0000 | 1.0000 | 1.0000 |
| Cresent Dunes Solar Energy Project | 0.9817 | 1.0000 | 0.9817 |
| eLLo Solar Thermal Project | 0.9096 | 1.0000 | 0.9096 |
| Gemasolar Thermosolar Plant | 0.8925 | 0.9166 | 0.9738 |
| Ivanpah Solar Electric Generation System | 1.0000 | 1.0000 | 1.0000 |
| Lebrija 1 | 0.8860 | 0.8875 | 0.9984 |
| Majadas I | 0.9192 | 0.9197 | 0.9995 |
| Manchasol 1 +2 | 0.9545 | 0.9545 | 1.0000 |
| Moron | 0.8926 | 0.8928 | 0.9997 |
| Olivenza 1 | 0.9065 | 0.9072 | 0.9993 |
| Orellana | 0.8996 | 0.9012 | 0.9983 |
| Palma del Rio I + II | 0.9632 | 0.9792 | 0.9837 |
| Planta Solar 10 | 0.9650 | 1.0000 | 0.9650 |
| Planta Solar 20 | 0.8895 | 0.8949 | 0.9940 |
| Puerto Errado 2 | 0.8863 | 1.0000 | 0.8863 |
| Solacor 1 + 2 | 1.0000 | 1.0000 | 1.0000 |
| Solnova 1 + 3 + 4 | 1.0000 | 1.0000 | 1.0000 |
| Termesol 50 | 0.9194 | 0.9194 | 1.0000 |
| Termosol 1 + 2 | 0.9973 | 1.0000 | 0.9973 |
| KaXu Solar One | 0.9432 | 1.0000 | 0.9432 |
| Khi Solar One | 1.0000 | 1.0000 | 1.0000 |
| Supcon Solar Project | 0.8471 | 0.8774 | 0.9655 |
| Megha Solar Plant | 0.8880 | 0.9136 | 0.9720 |
| Godawari Solar Project | 0.9548 | 0.9577 | 0.9970 |
| Thai Solar Energy | 1.0000 | 1.0000 | 1.0000 |
| Shams 1 | 0.9063 | 0.9063 | 1.0000 |
Table 6.
Operational efficiency and output-based congestion.
| Site | OE(v) | OE(vc) | OC |
|---|---|---|---|
| Mojave Solar Project | 1.0000 | 1.0000 | 1.0000 |
| Solana Generating Station | 1.0000 | 1.0000 | 1.0000 |
| Genesis Solar Energy Project | 1.0000 | 1.0000 | 1.0000 |
| Nevada Solar One | 1.0000 | 1.0000 | 1.0000 |
| SEGS III | 1.0000 | 1.0000 | 1.0000 |
| SEGS IV | 0.8923 | 0.8940 | 1.0019 |
| SEGS V | 0.9256 | 0.9282 | 1.0028 |
| SEGS VI | 1.0000 | 1.0000 | 1.0000 |
| SEGS VII | 0.9043 | 0.9737 | 1.0768 |
| SEGS VIII | 1.0000 | 1.0000 | 1.0000 |
| SEGS IX | 0.9567 | 0.9661 | 1.0099 |
| Guzman | 0.8882 | 0.9228 | 1.0389 |
| Andasol Solar Power Station | 0.9507 | 1.0000 | 1.0519 |
| Extresol Solar Power Station | 1.0000 | 1.0000 | 1.0000 |
| Aste Solar Power Station | 0.9079 | 0.9600 | 1.0574 |
| Arcosol 50 | 0.8118 | 0.9085 | 1.1191 |
| Arenales | 0.7977 | 0.7977 | 1.0000 |
| Borges Termosolar | 1.0000 | 1.0000 | 1.0000 |
| Casablanca | 0.8087 | 0.8087 | 1.0000 |
| Enerstar | 0.7846 | 0.8100 | 1.0323 |
| Helioenergy 1+2 | 1.0000 | 1.0000 | 1.0000 |
| Helios I and II | 0.9315 | 0.9315 | 1.0000 |
| Ibersol Ciudad Real | 0.9574 | 0.9666 | 1.0096 |
| La Africana | 0.7563 | 0.7563 | 1.0000 |
| La Dehesa | 0.8637 | 0.8637 | 1.0000 |
| La Florida | 0.8637 | 0.8637 | 1.0000 |
| Alvarado I | 0.8316 | 0.8316 | 1.0000 |
| Agua Prieta II | 1.0000 | 1.0000 | 1.0000 |
| Archimede | 1.0000 | 1.0000 | 1.0000 |
| Astexol II | 1.0000 | 1.0000 | 1.0000 |
| Cresent Dunes Solar Energy Project | 0.9826 | 1.0000 | 1.0177 |
| eLLo Solar Thermal Project | 0.5816 | 1.0000 | 1.7195 |
| Gemasolar Thermosolar Plant | 0.5902 | 0.6035 | 1.0226 |
| Ivanpah Solar Electric Generation System | 1.0000 | 1.0000 | 1.0000 |
| Lebrija 1 | 0.6399 | 0.6399 | 1.0000 |
| Majadas I | 0.8220 | 0.8220 | 1.0000 |
| Manchasol 1 +2 | 0.8656 | 0.8656 | 1.0000 |
| Moron | 0.7268 | 0.7268 | 1.0000 |
| Olivenza 1 | 0.7003 | 0.7003 | 1.0000 |
| Orellana | 0.7298 | 0.7298 | 1.0000 |
| Palma del Rio I + II | 0.8569 | 0.9225 | 1.0765 |
| Planta Solar 10 | 0.9212 | 1.0000 | 1.0856 |
| Planta Solar 20 | 0.8072 | 0.8148 | 1.0095 |
| Puerto Errado 2 | 0.8481 | 1.0000 | 1.1792 |
| Solacor 1 + 2 | 1.0000 | 1.0000 | 1.0000 |
| Solnova 1 + 3 + 4 | 1.0000 | 1.0000 | 1.0000 |
| Termesol 50 | 0.8411 | 0.8411 | 1.0000 |
| Termosol 1 + 2 | 0.9920 | 1.0000 | 1.0080 |
| KaXu Solar One | 0.9470 | 1.0000 | 1.0559 |
| Khi Solar One | 1.0000 | 1.0000 | 1.0000 |
| Supcon Solar Project | 0.7431 | 0.7679 | 1.0334 |
| Megha Solar Plant | 0.7637 | 0.7925 | 1.0376 |
| Godawari Solar Project | 0.9480 | 0.9480 | 1.0000 |
| Thai Solar Energy | 1.0000 | 1.0000 | 1.0000 |
| Shams 1 | 0.9055 | 0.9650 | 1.0657 |
Table 7.
Average input-based efficiencies: three technologies.
| Technology | OE(v) | OE(vc) |
|---|---|---|
| Heliostat Power Tower | 0.939 | 0.956 |
| Linear Fresnel Reflector | 0.898 | 1.000 |
| Parabolic Trough | 0.952 | 0.958 |
Table 8.
Average input-based efficiencies: three country groups.
| Country | OE(v) | OE(vc) |
|---|---|---|
| USA | 0.978 | 0.980 |
| Spain | 0.938 | 0.949 |
| Others | 0.945 | 0.965 |
Table 9.
Average output-based efficiencies: three technologies.
| Technology | OE(v) | OE(vc) |
|---|---|---|
| Heliostat Power Tower | 0.863 | 0.884 |
| Linear Fresnel Reflector | 0.715 | 1.000 |
| Parabolic Trough | 0.904 | 0.916 |
Table 10.
Average output-based efficiencies: three country groups.
| Country | OE(v) | OE(vc) |
|---|---|---|
| USA | 0.974 | 0.982 |
| Spain | 0.859 | 0.878 |
| Others | 0.889 | 0.947 |
Table 11.
The p-value of the rank sum test on input-based efficiencies.
| Category | OE(v) | OE(vc) |
|---|---|---|
| Technology | 0.2099 | 0.3653 |
| Country | 0.0199 | 0.0554 |
Table 12.
The p-value of the rank sum test on output-based efficiencies.
| Category | OE(v) | OE(vc) |
|---|---|---|
| Technology | 0.2003 | 0.3664 |
| Country | 0.0037 | 0.0080 |
© 2019 by the authors. Licensee MDPI, Basel, Switzerland. This article is an open access article distributed under the terms and conditions of the Creative Commons Attribution (CC BY) license (http://creativecommons.org/licenses/by/4.0/).
Share and Cite
MDPI and ACS Style
Sueyoshi, T.; Goto, M. Comparison among Three Groups of Solar Thermal Power Stations by Data Envelopment Analysis. Energies 2019, 12, 2454. https://doi.org/10.3390/en12132454
AMA Style
Sueyoshi T, Goto M. Comparison among Three Groups of Solar Thermal Power Stations by Data Envelopment Analysis. Energies. 2019; 12(13):2454. https://doi.org/10.3390/en12132454
Chicago/Turabian StyleSueyoshi, Toshiyuki, and Mika Goto. 2019. "Comparison among Three Groups of Solar Thermal Power Stations by Data Envelopment Analysis" Energies 12, no. 13: 2454. https://doi.org/10.3390/en12132454
Note that from the first issue of 2016, this journal uses article numbers instead of page numbers. See further details here.