Application of the Double Diode Model of Photovoltaic Cells for Simulation Studies on the Impact of Partial Shading of Silicon Photovoltaic Modules on the Waveforms of Their Current–Voltage Characteristic


Abstract
:1. Introduction
2. Materials and Methods
2.1. Model Background
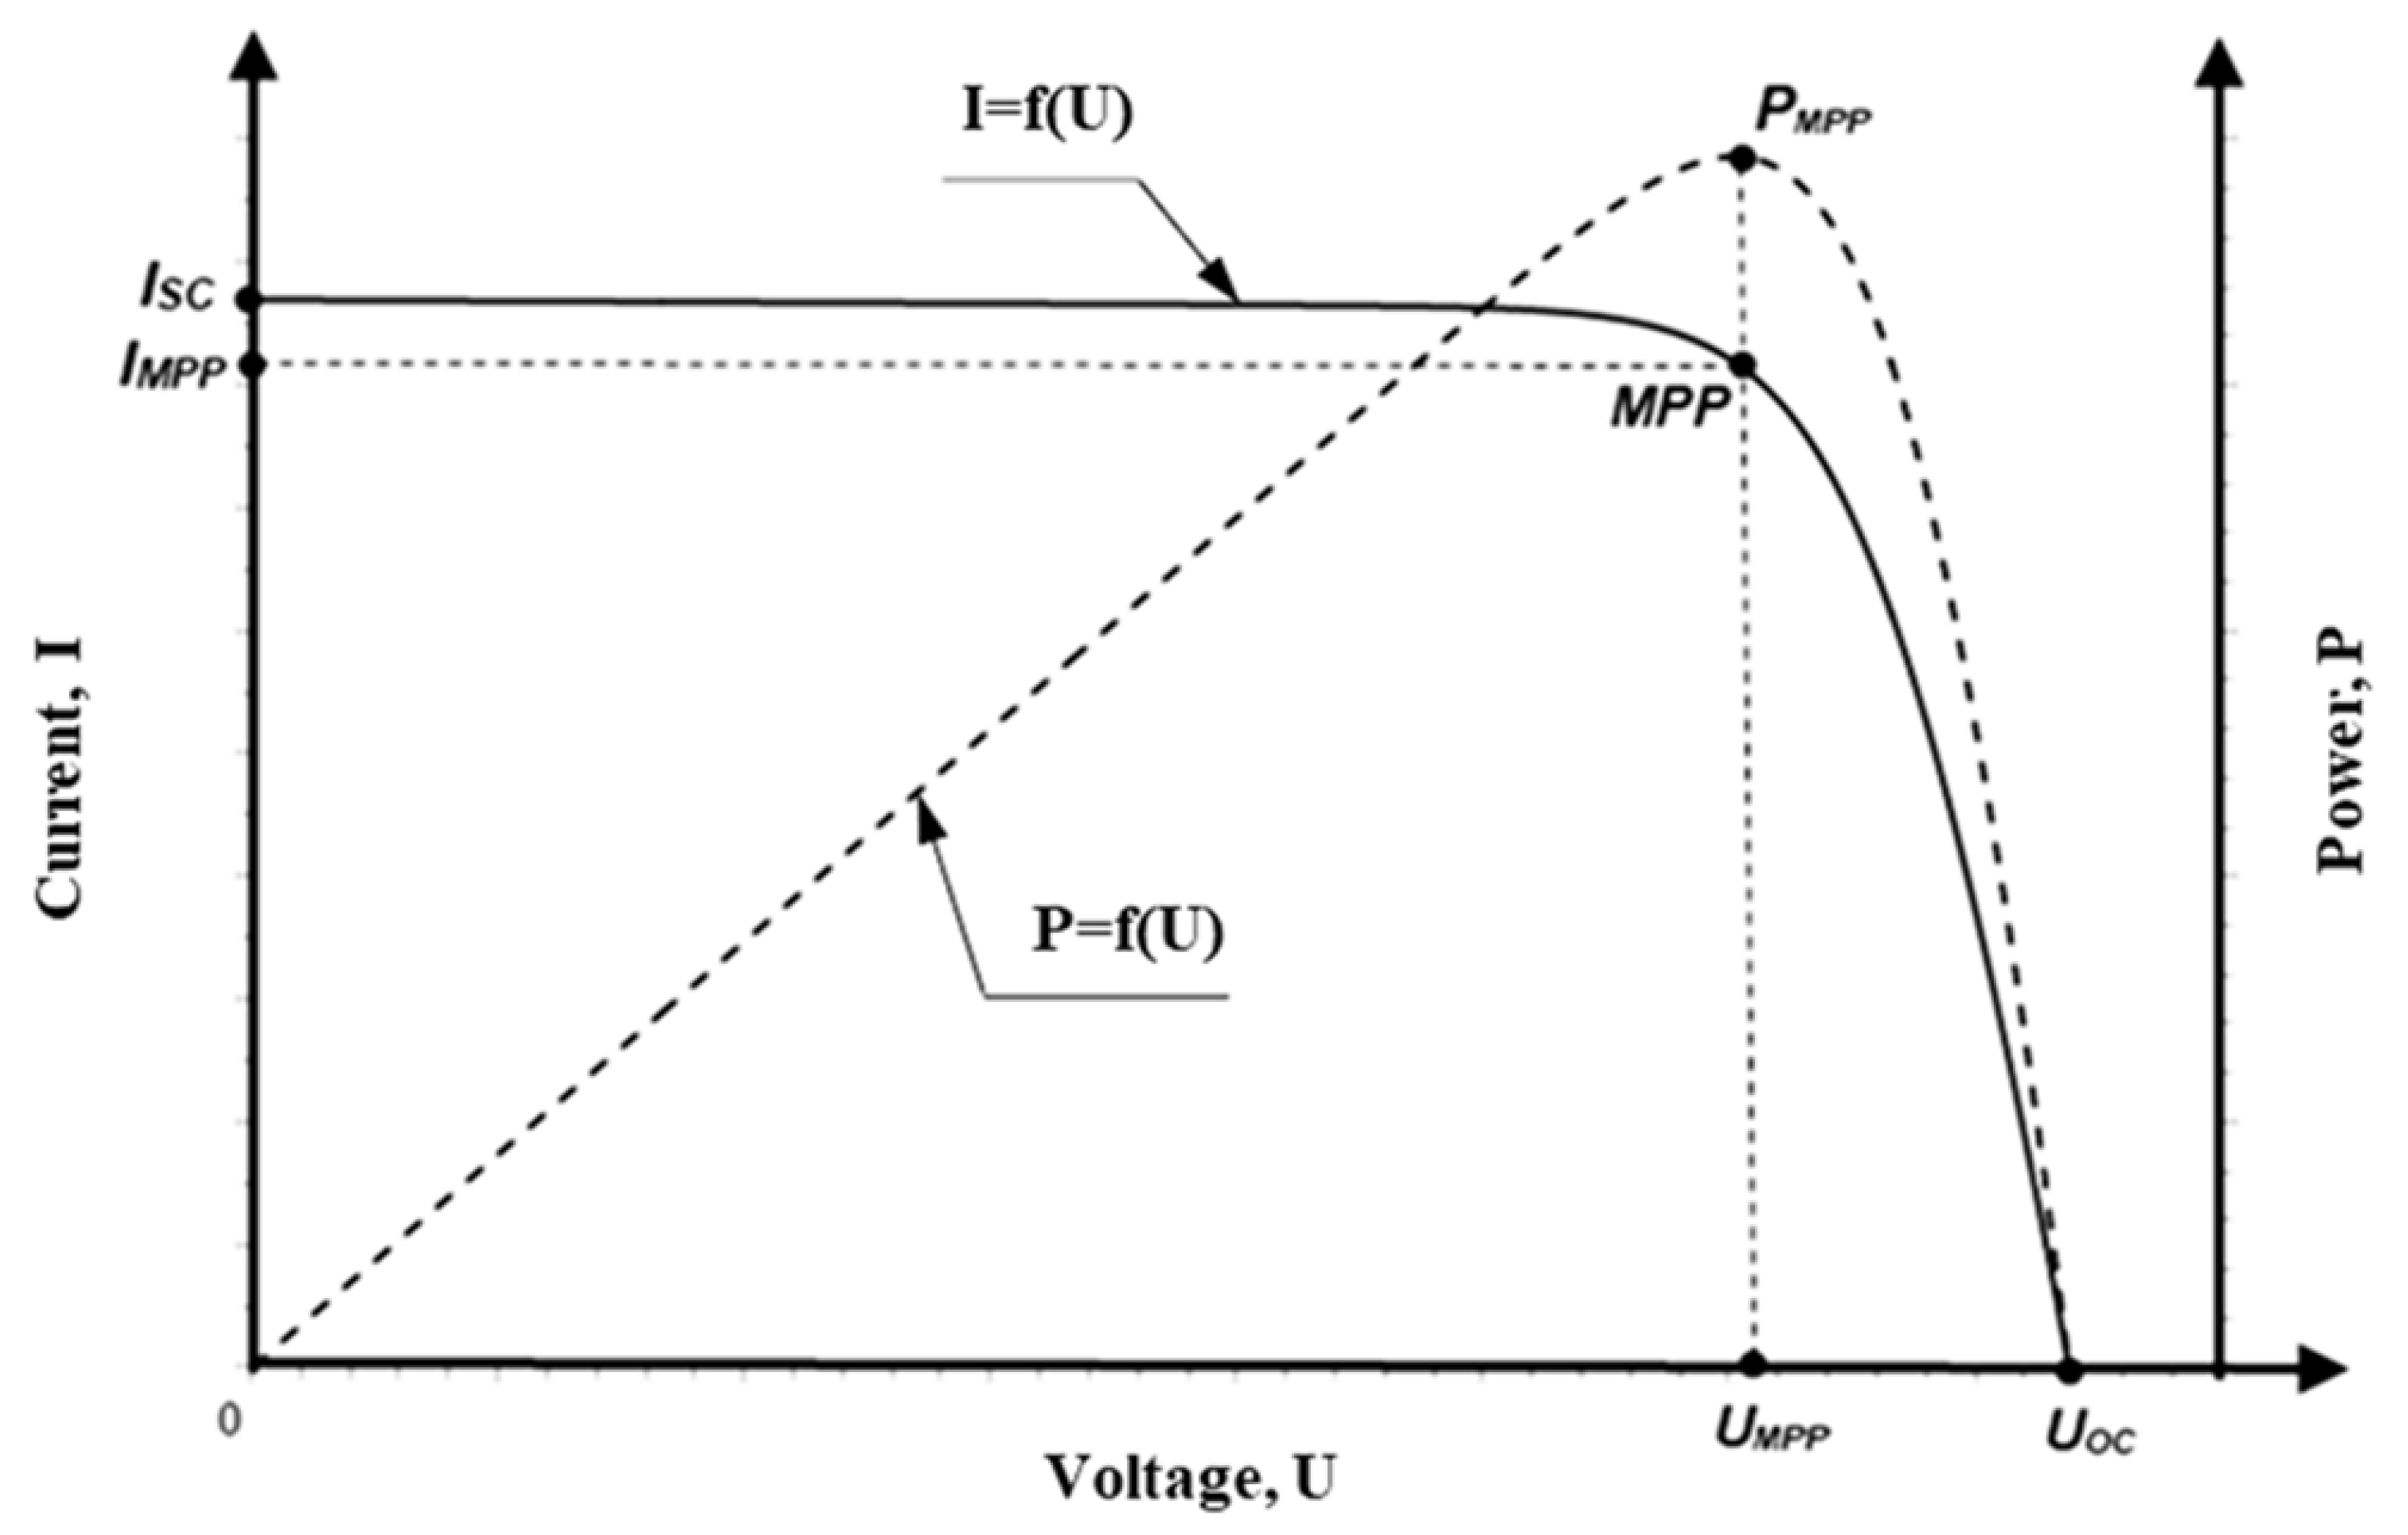
- Horizontal part—from the side of the vertical axis (sometimes slightly falling), characterized by an almost constant current at high voltage changes;
- Vertical, falling part—from the side of the horizontal voltage axis, characterized by a large decrease of the current value with a slight increase in voltage;
- Curve bend—transition area between the above-mentioned parts, in which the maximum power point is determined (point MPP in Figure 1).
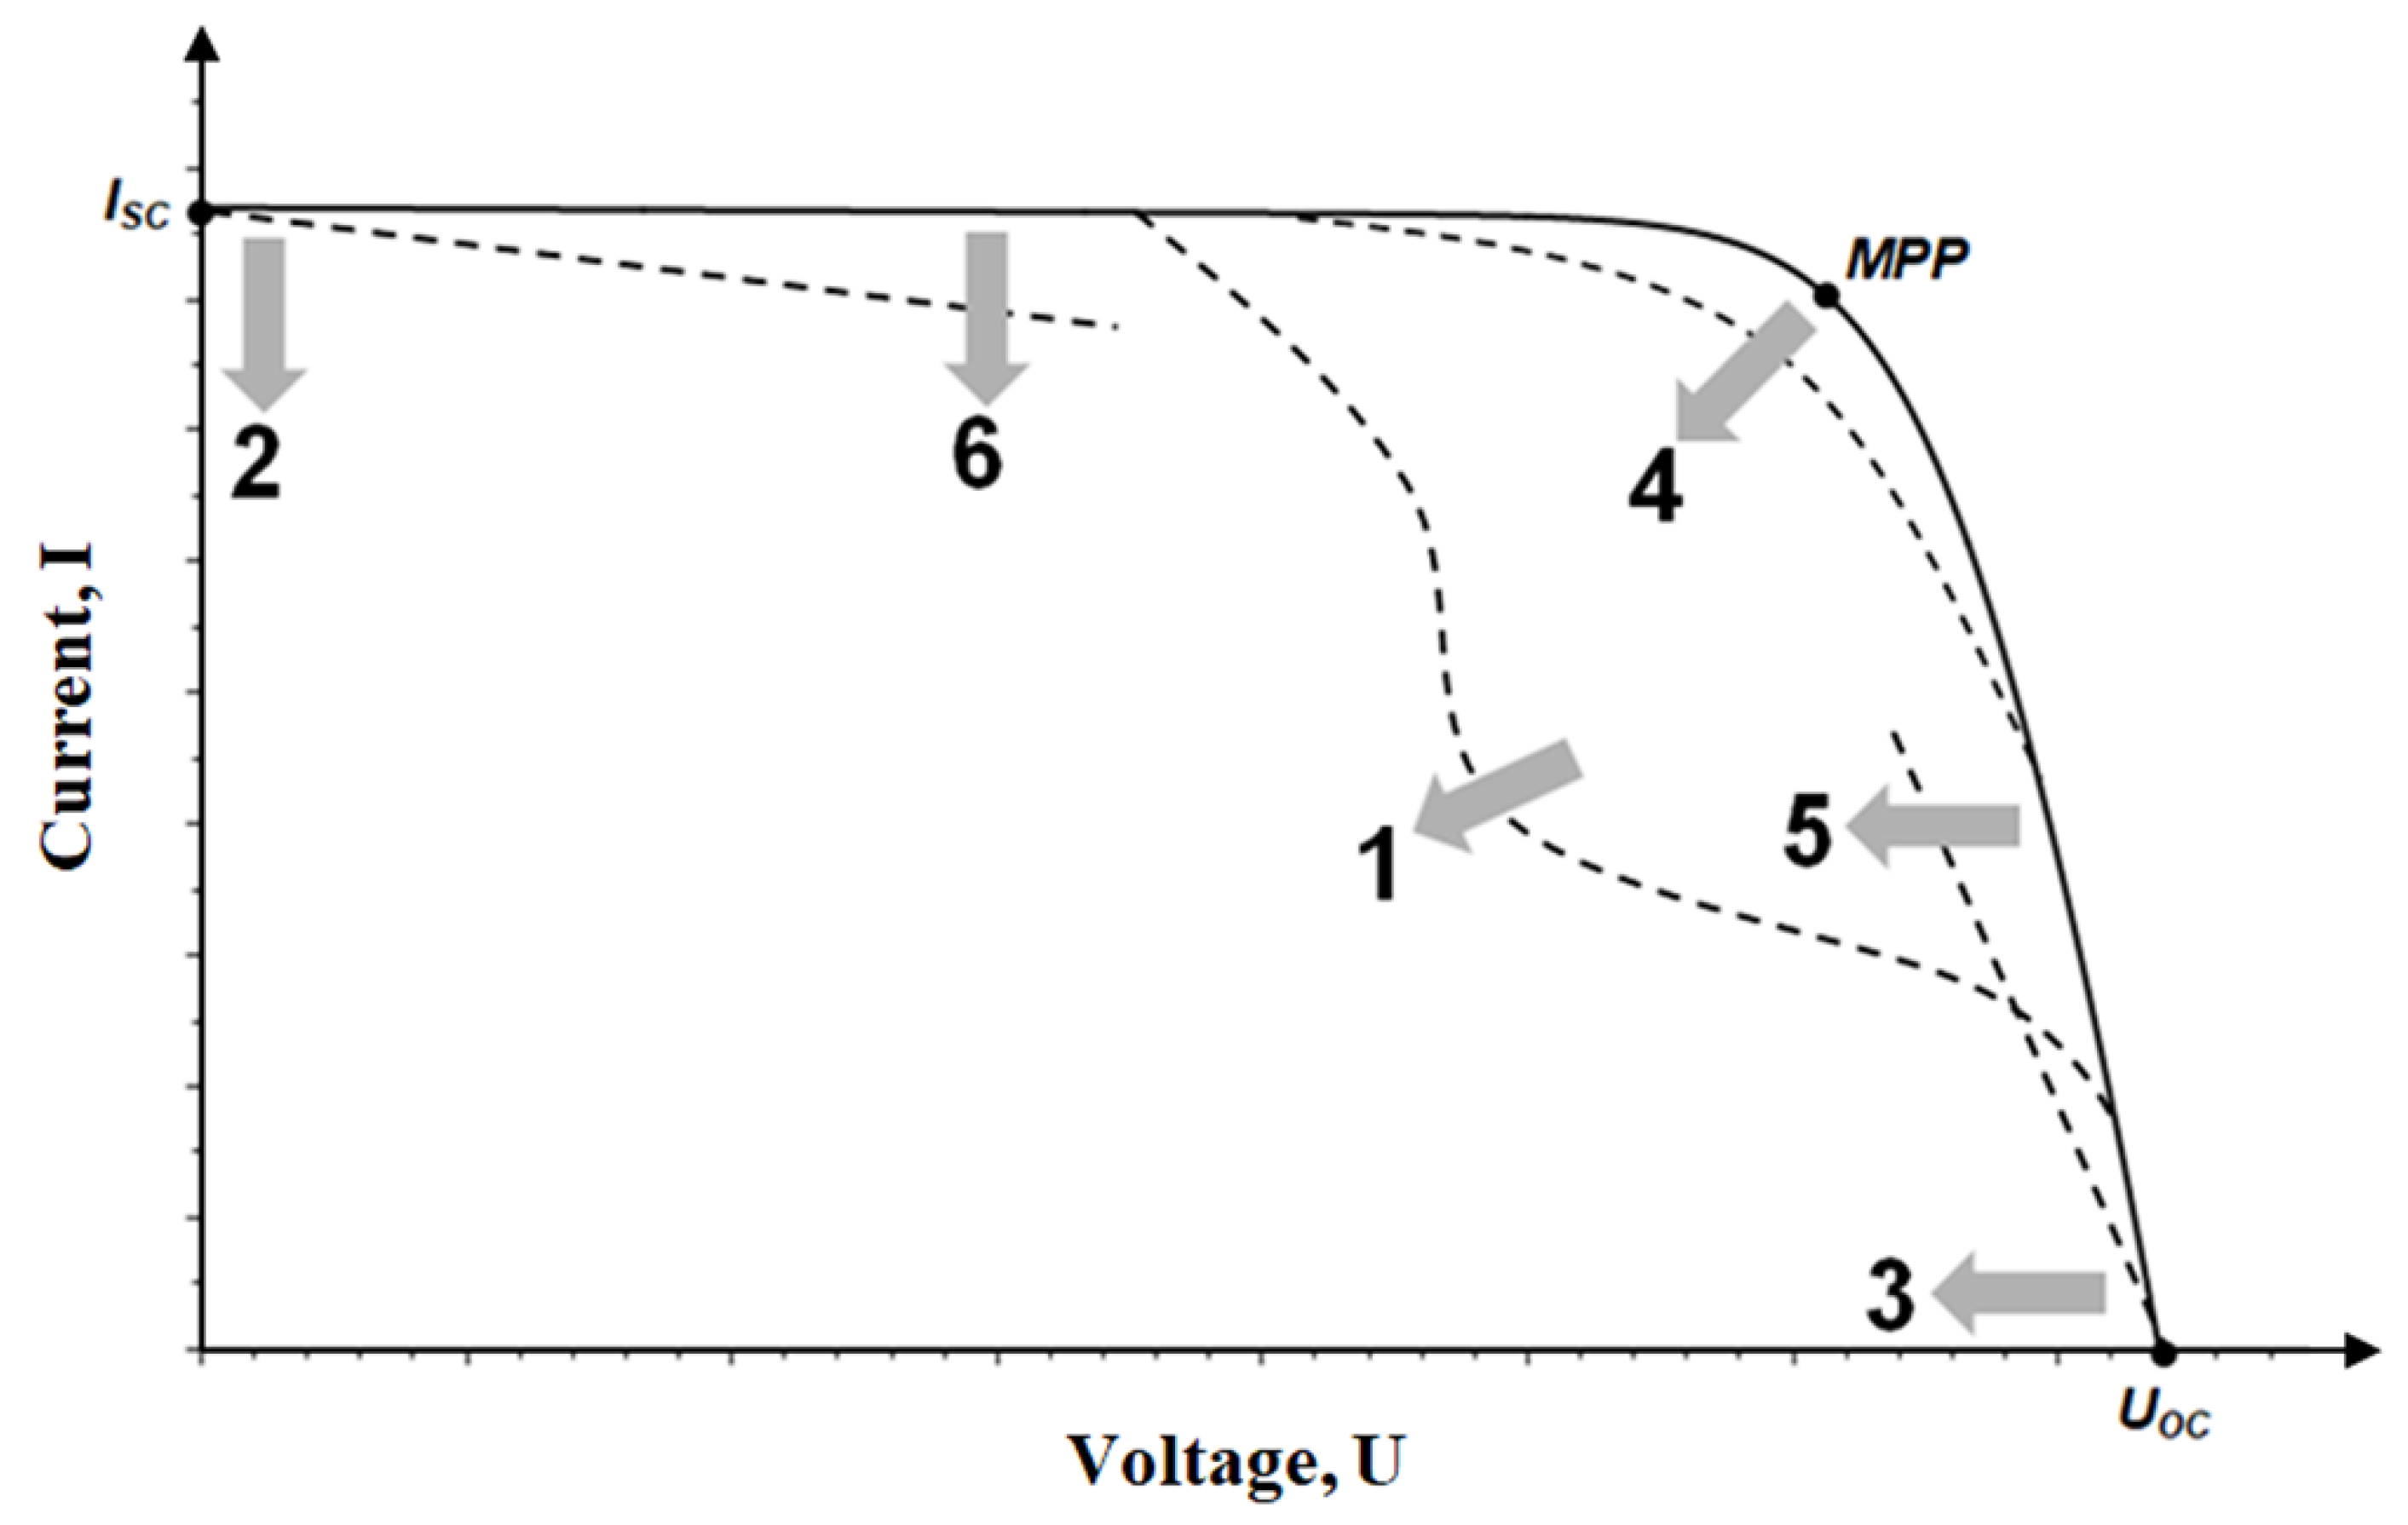
- Partially shaded PV module, even partial shading of a single cell (about 20% of the surface) in the module can cause switching of the bypass diode, causing a clear indentation in the I–V curve (this case will be analyzed in detail in this research);
- PV module partially dirty or covered (e.g., with snow, frost, etc.);
- Damaged PV cells in the module.
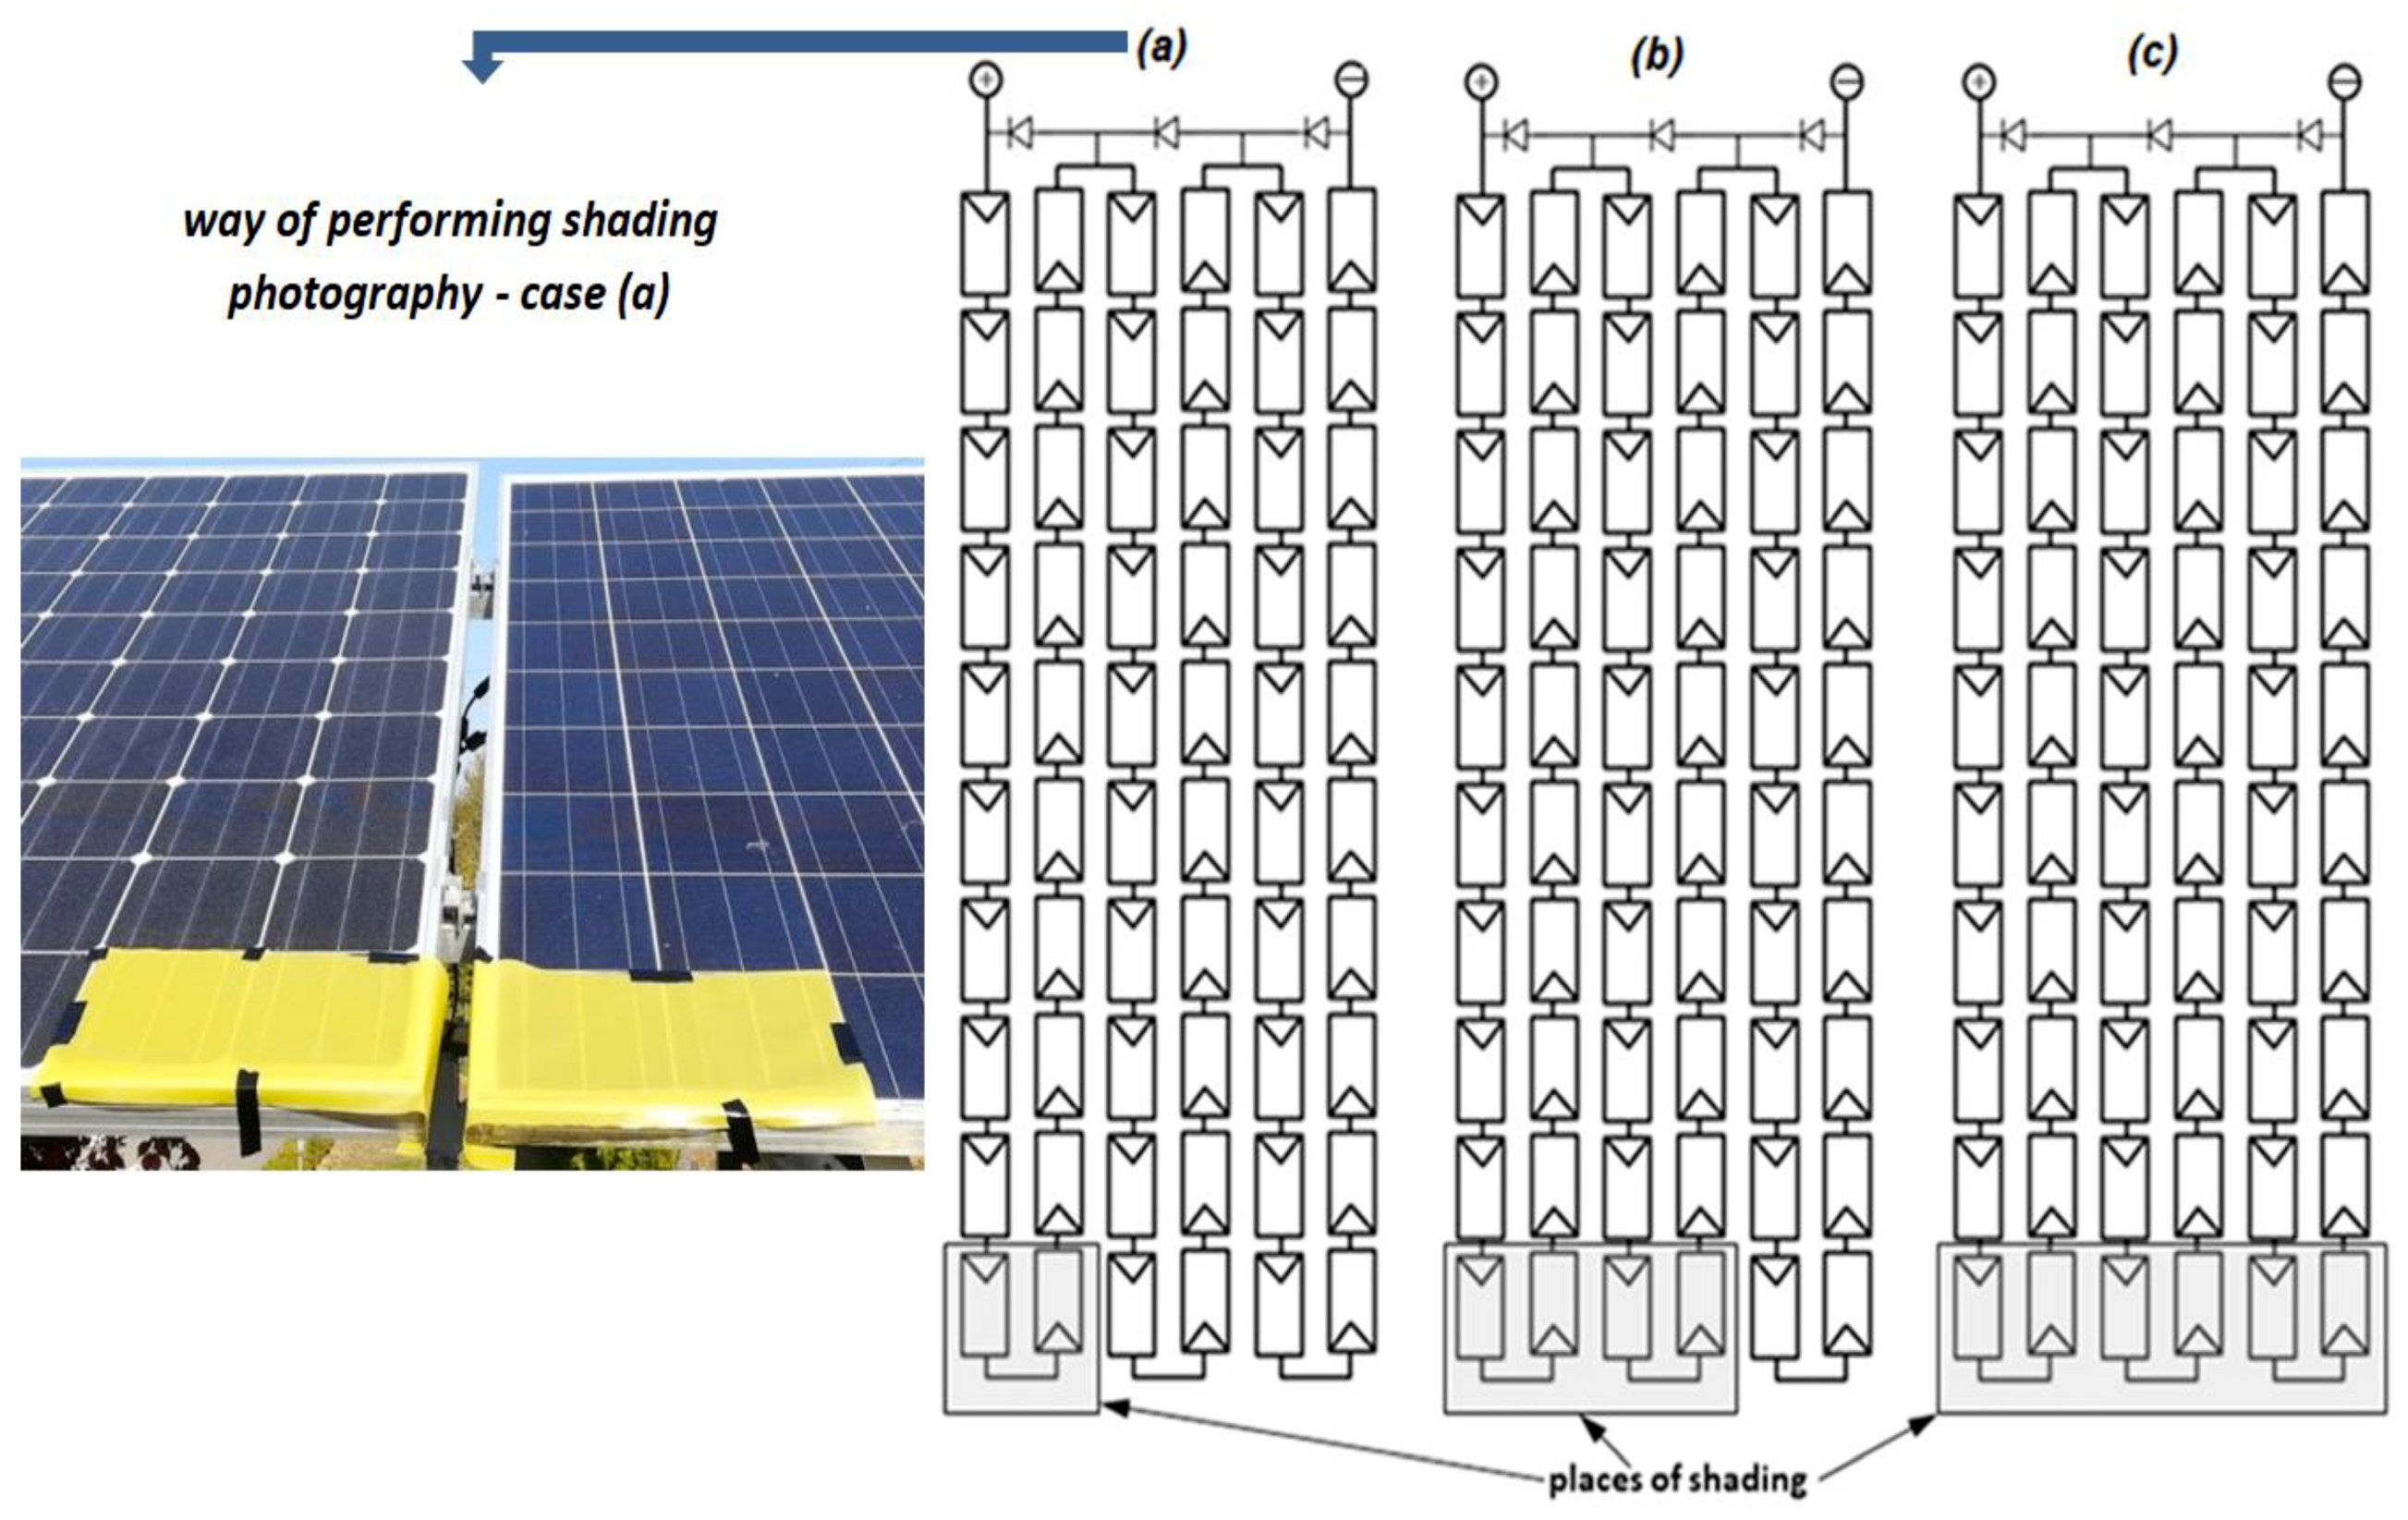
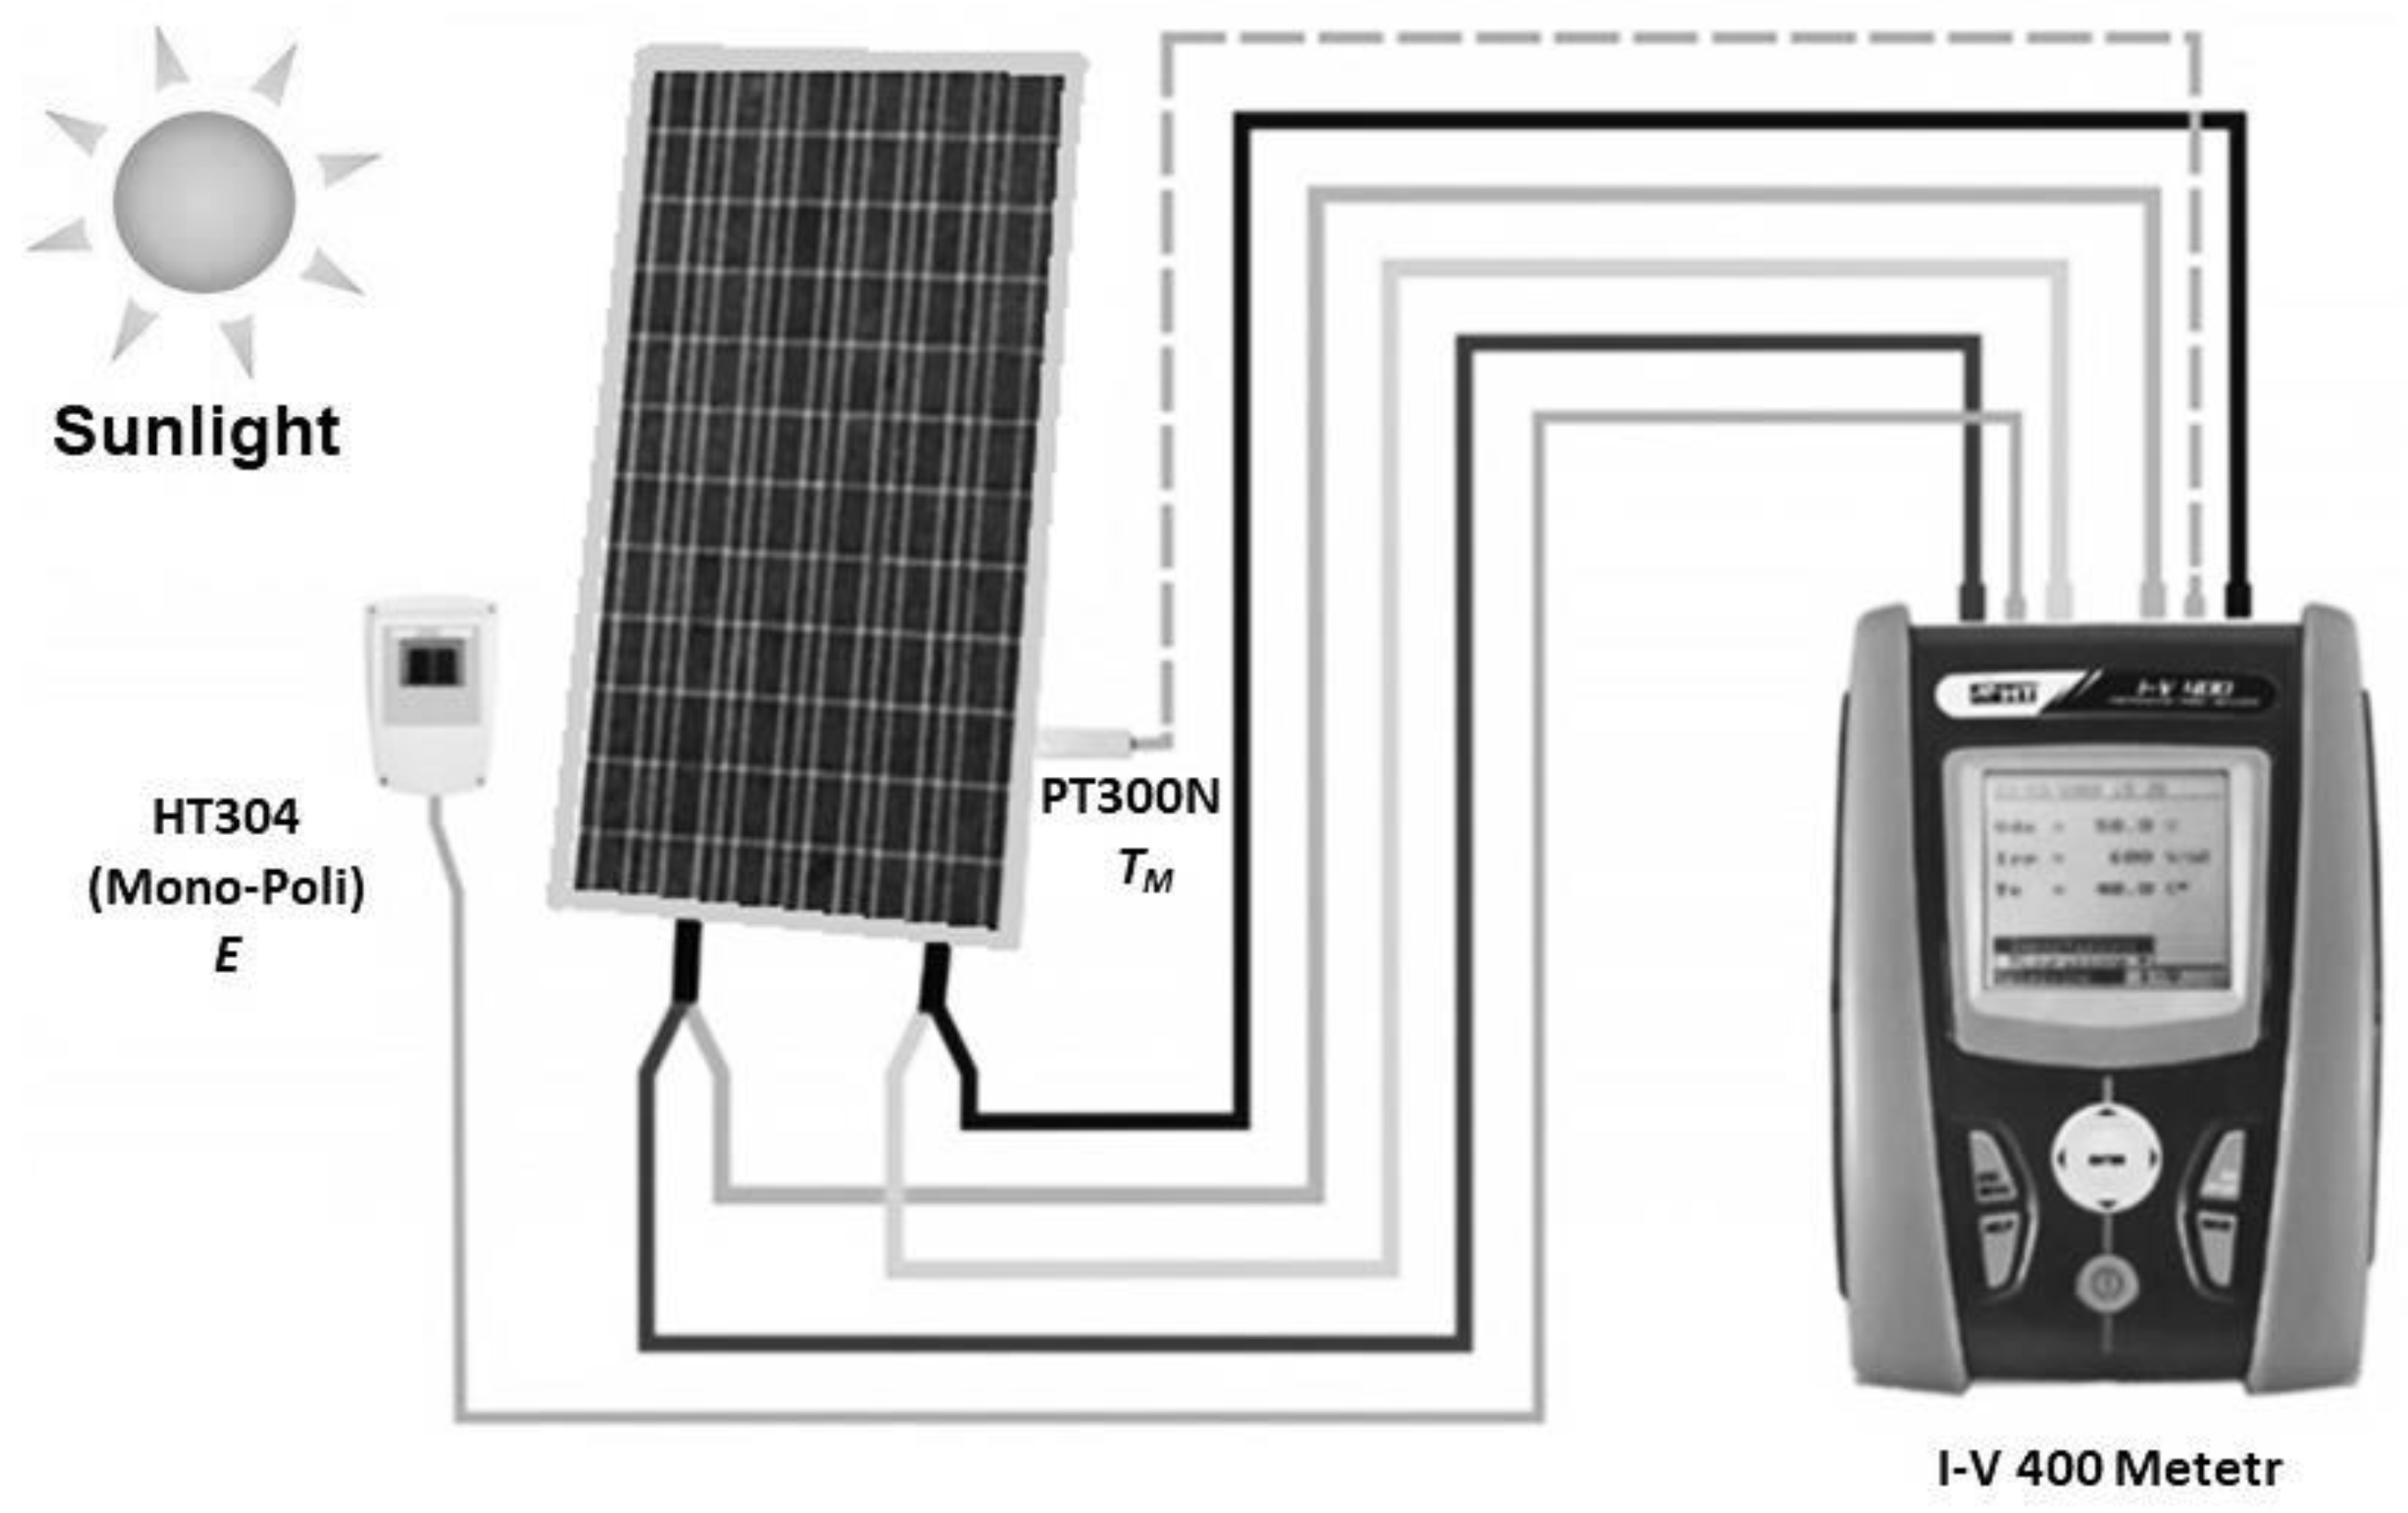
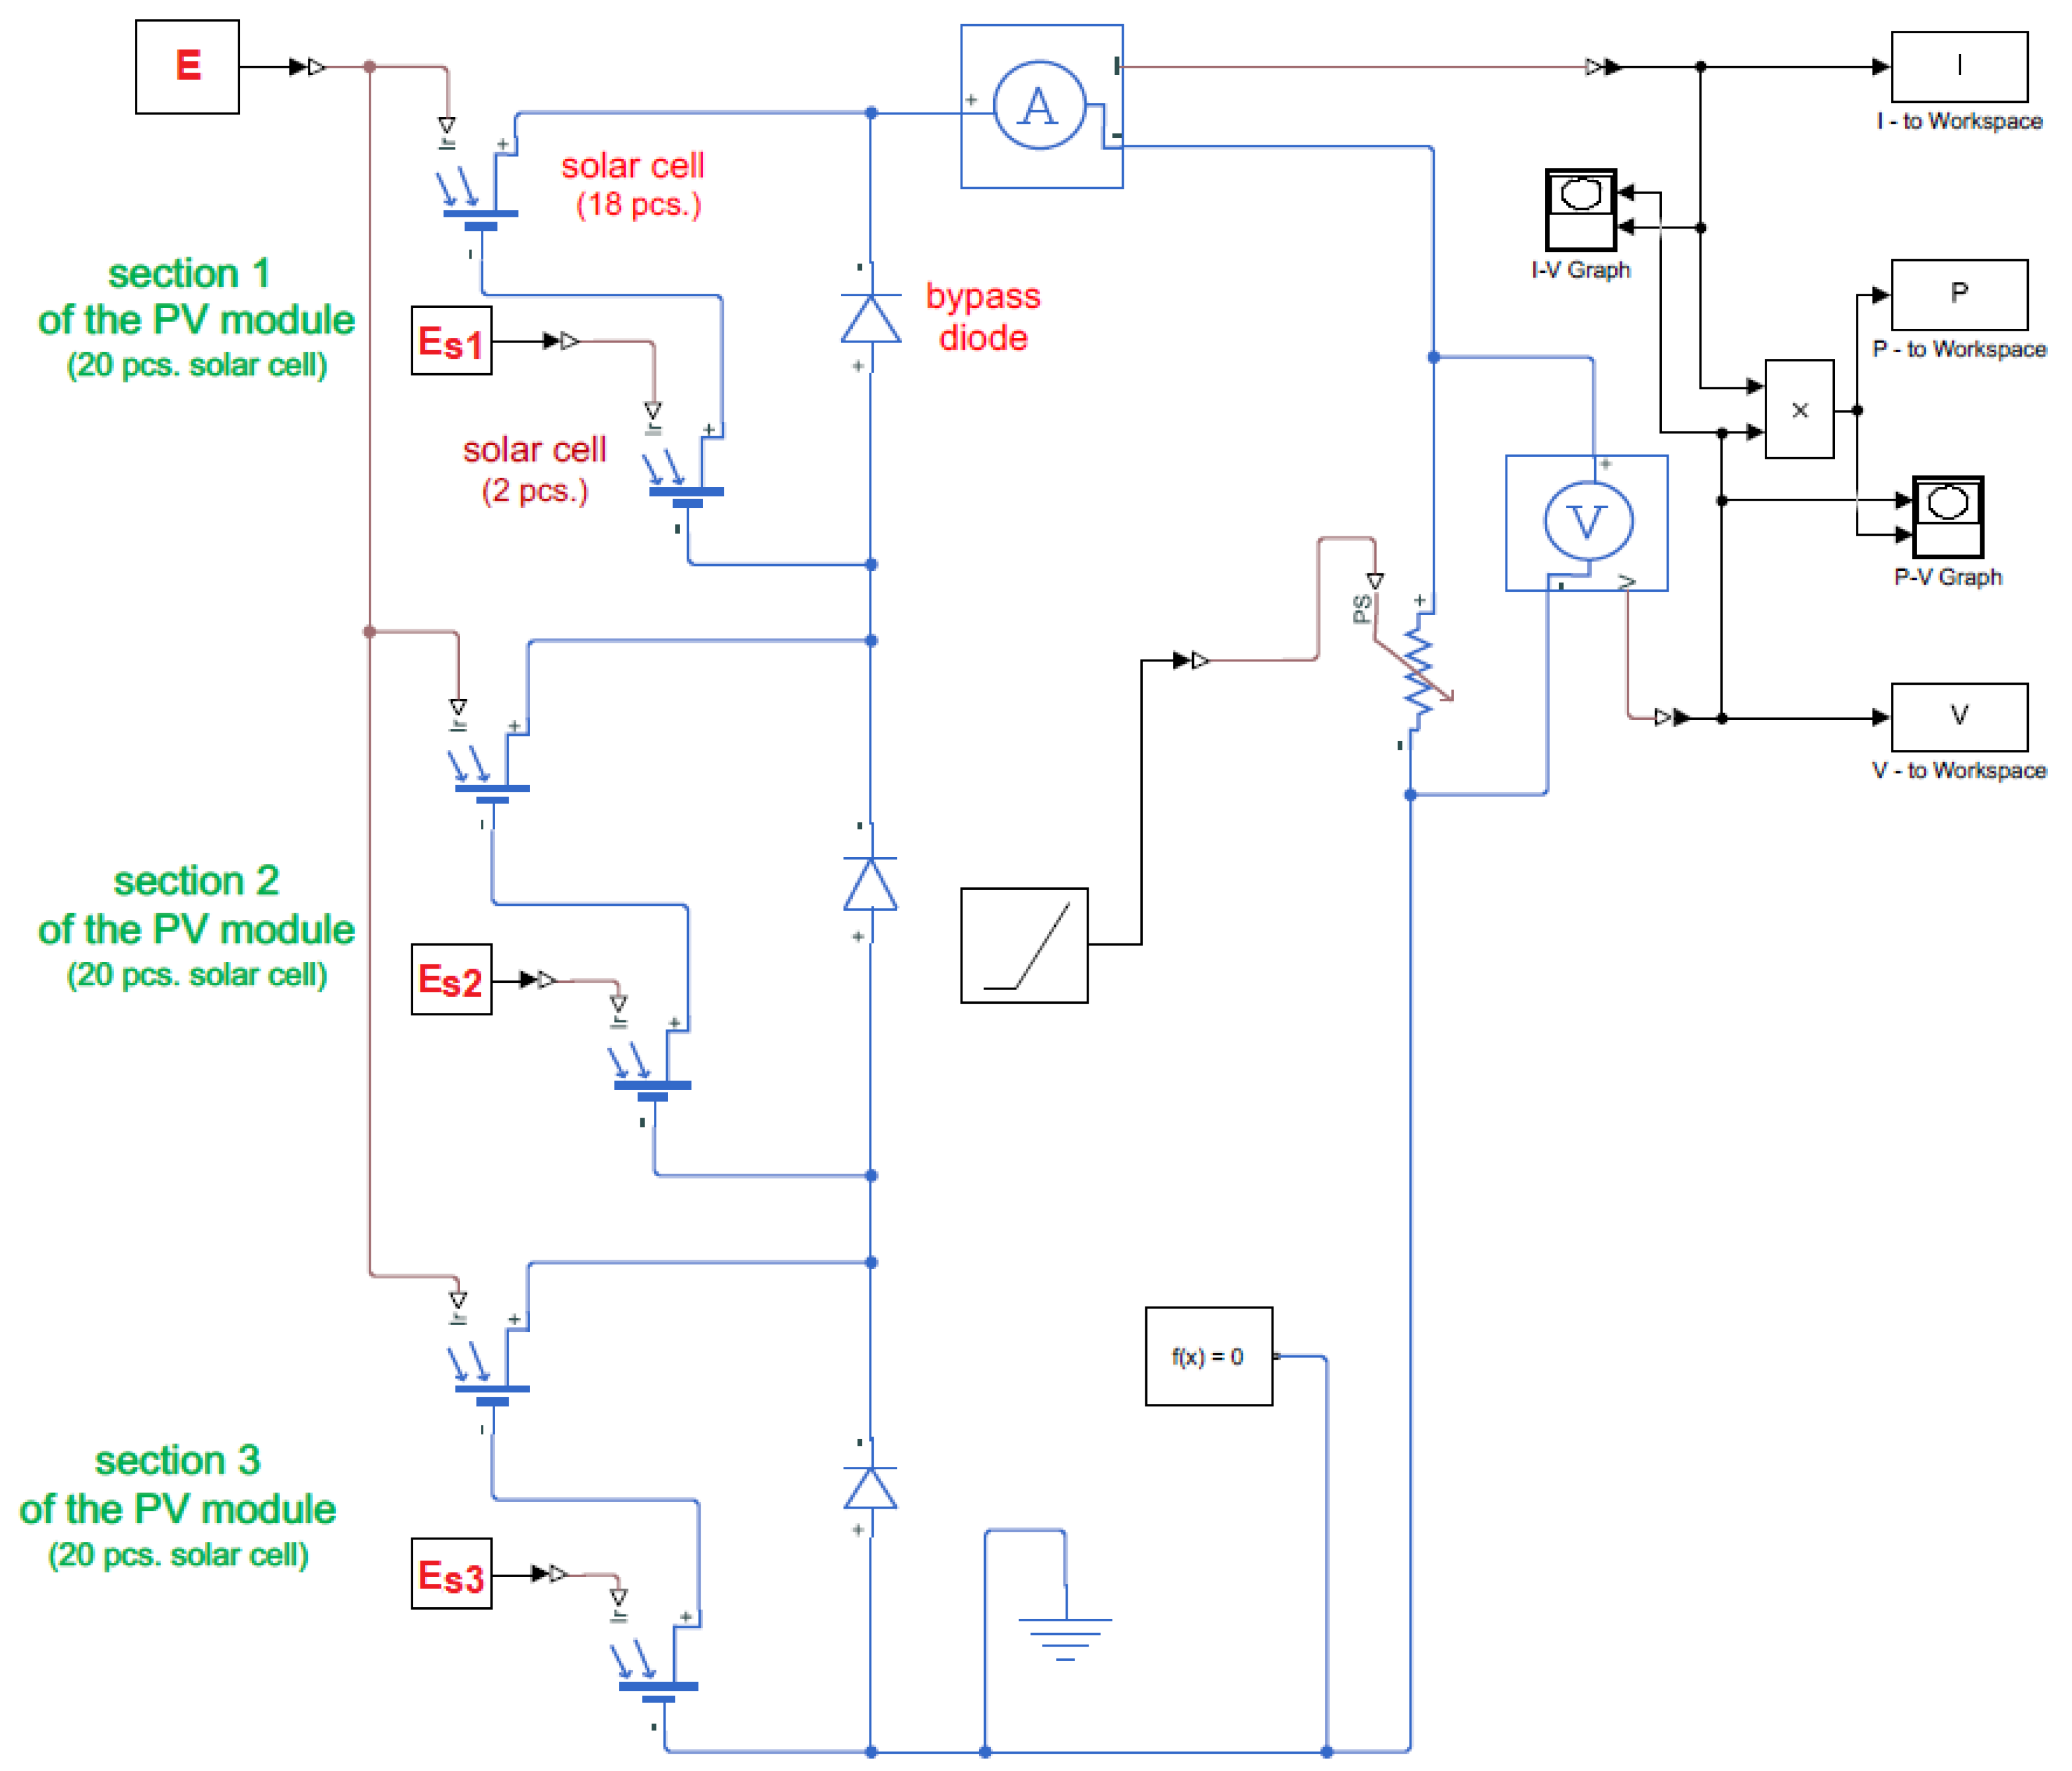
2.2. Research Stand and Methods
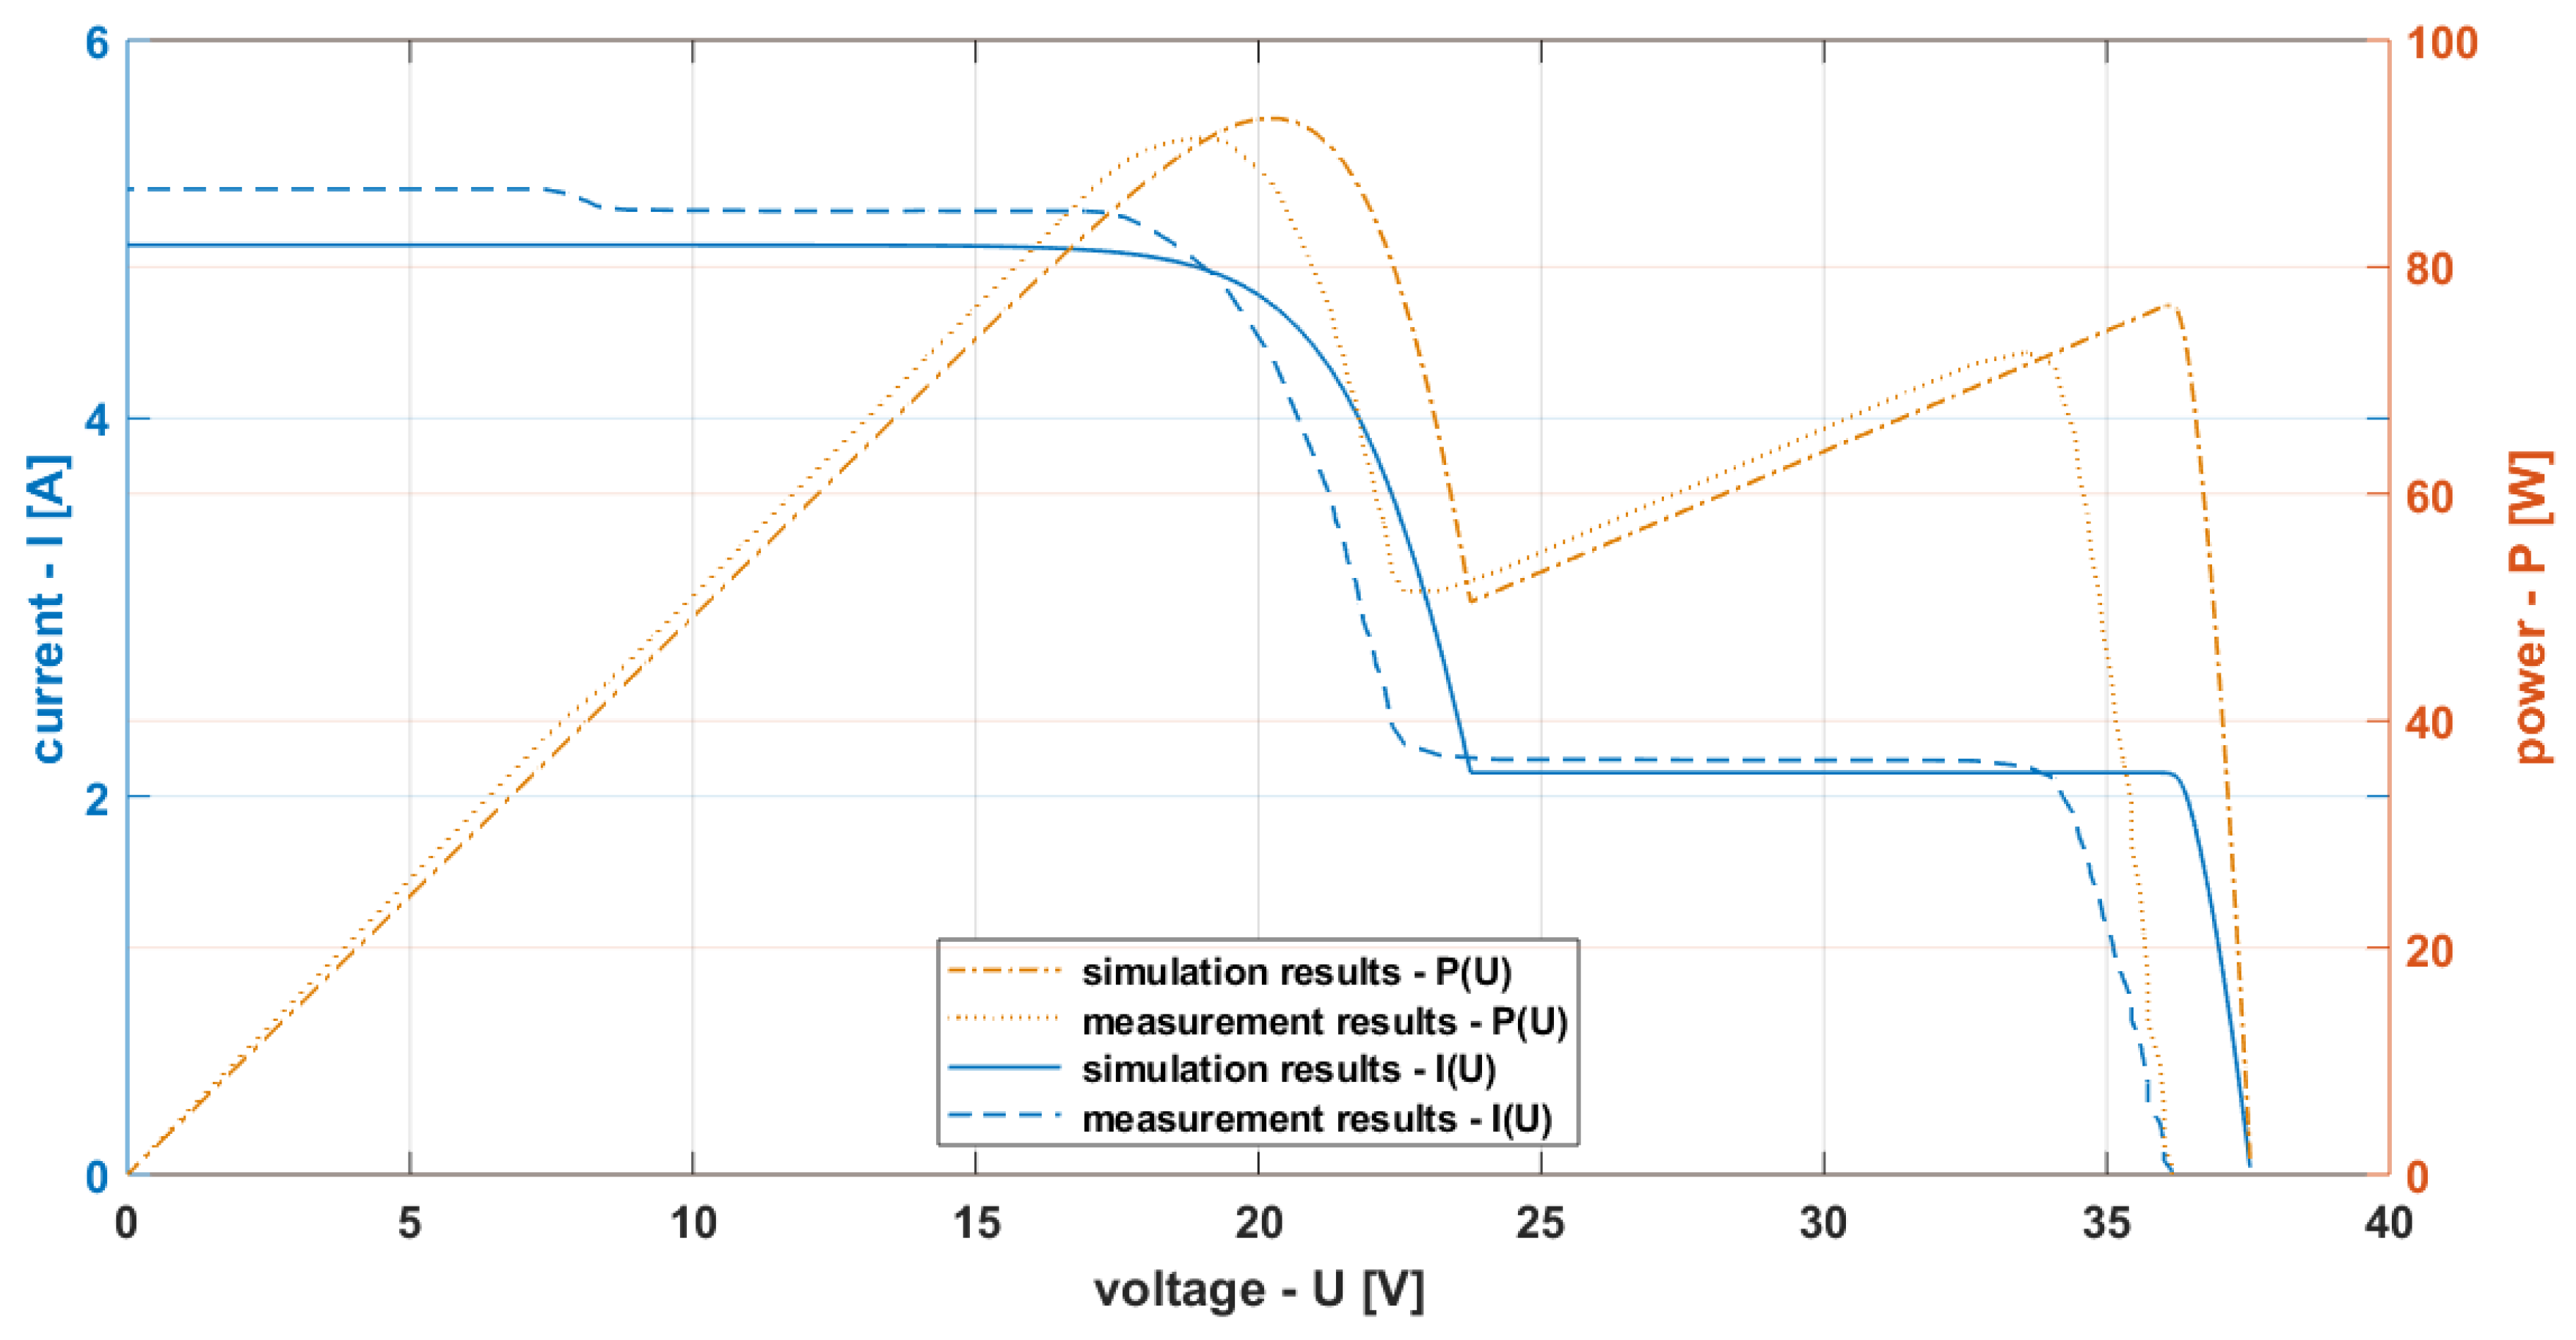
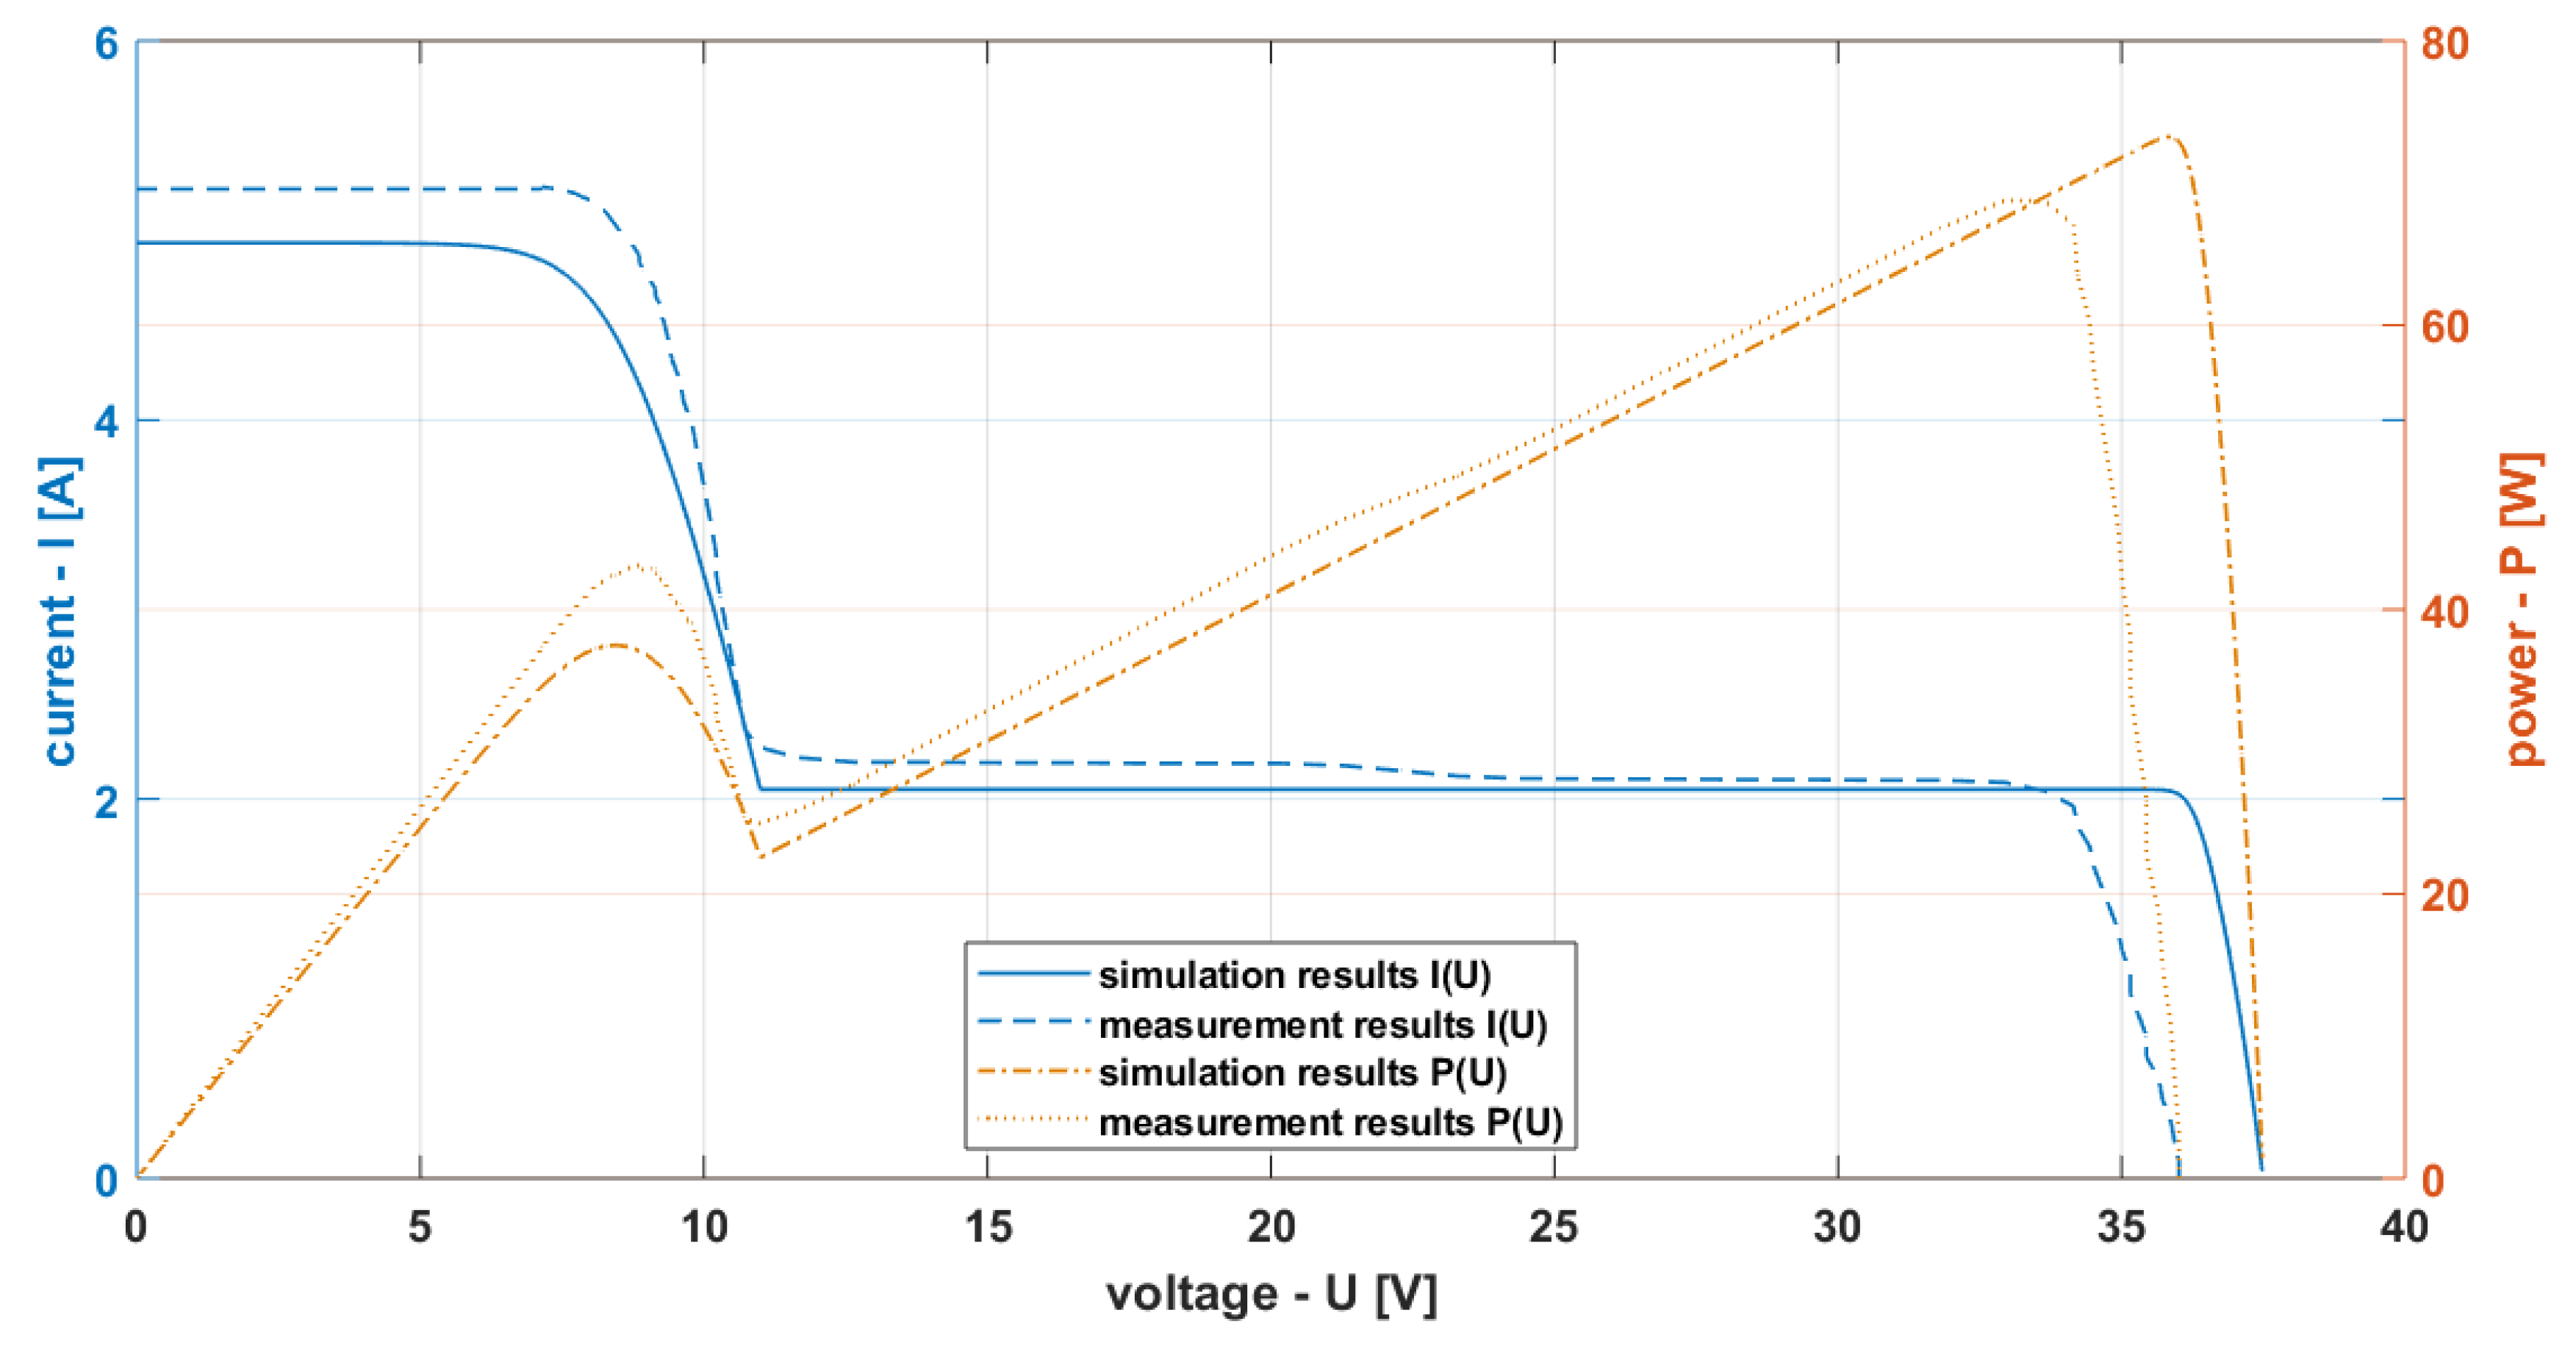
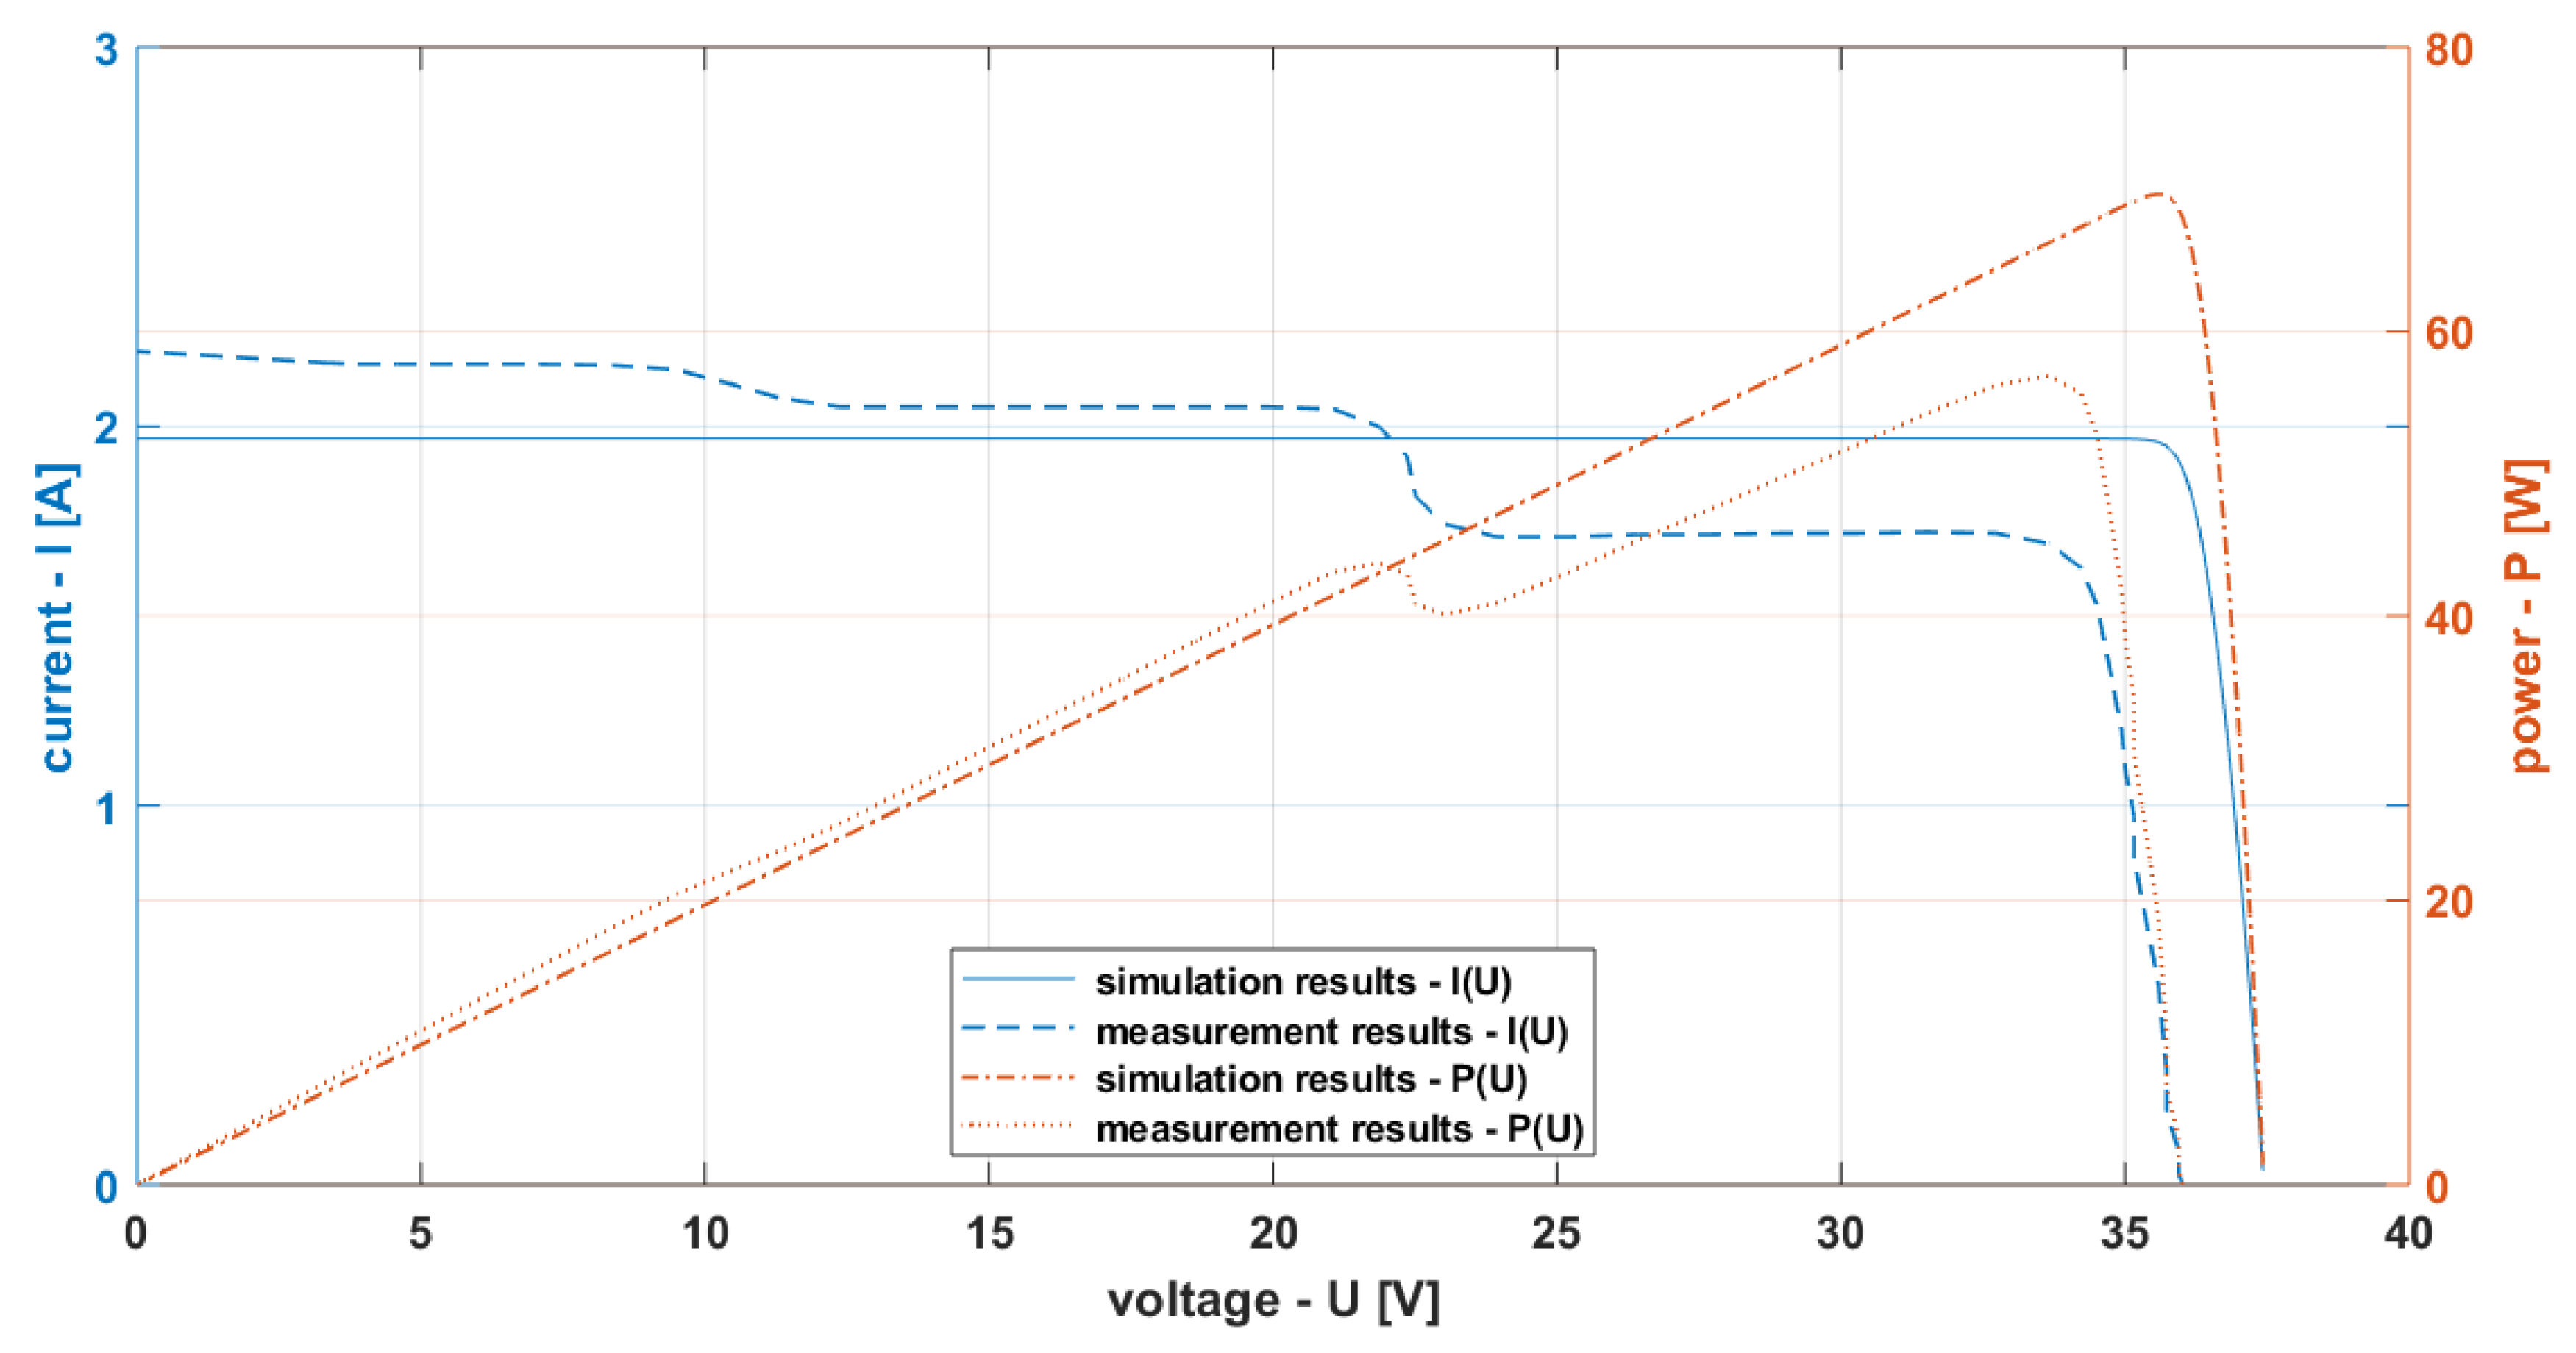
3. Results
4. Discussion
5. Conclusions
Author Contributions
Funding
Conflicts of Interest
References
- Messenger, R.A.; Ventre, A. Photovoltaic Systems Engineering, 4th ed.; CRC Press Taylor & Francis Group: Boca Raton, FL, USA, 2017; ISBN 978-1-4398-0293-9. [Google Scholar]
- Hegedus, S.; Luque, A. Handbook of Photovoltaic Science and Engineering, 2nd ed.; John Wiley & Sons: Hoboken, NJ, USA, 2011; ISBN 978-0-470-72169-8. [Google Scholar]
- Conibeer, G.; Willoughby, A. Solar Cell Materials: Developing Technologies, 1st ed.; John Wiley & Sons: Hoboken, NJ, USA, 2014; ISBN 978-1-118-69581-4. [Google Scholar]
- Yadav, A.S.; Mukherjee, V. Line losses reduction techniques in puzzled PV array configuration under different shading conditions. Sol. Energy 2018, 171, 774–783. [Google Scholar] [CrossRef]
- Mohamed, M.A.; Zaki Diab, A.A.; Rezk, H. Partial shading mitigation of PV systems via different meta-heuristic techniques. Renew. Energy 2019, 130, 1159–1175. [Google Scholar] [CrossRef]
- Gokdag, M.; Akbaba, M.; Gulbudak, O. Switched-capacitor converter for PV modules under partial shading and mismatch conditions. Sol. Energy 2018, 170, 723–731. [Google Scholar] [CrossRef]
- Fadhel, S.; Delpha, C.; Diallo, D.; Bahri, I.; Migan, A.; Trabelsi, M.; Mimouni, M.F. PV shading fault detection and classification based on I-V curve using principal component analysis: Application to isolated PV system. Sol. Energy 2019, 179, 1–10. [Google Scholar] [CrossRef]
- Ishaque, K.; Salam, Z.; Taheri, H. Syafaruddin modeling and simulation of photovoltaic (PV) system during partial shading based on a two-diode model. Simul. Model. Pract. Theory 2011, 19, 1613–1626. [Google Scholar] [CrossRef]
- Patel, H.; Agarwal, V. MATLAB-based modeling to study the effects of partial shading on PV array characteristics. IEEE Trans. Energy Convers. 2008, 23, 302–310. [Google Scholar] [CrossRef]
- Pendem, S.R.; Mikkili, S. Modelling and performance assessment of PV array topologies under partial shading conditions to mitigate the mismatching power losses. Sol. Energy 2018, 160, 303–321. [Google Scholar] [CrossRef]
- Gallardo-Saavedra, S.; Karlsson, B. Simulation, validation and analysis of shading effects on a PV system. Sol. Energy 2018, 170, 828–839. [Google Scholar] [CrossRef]
- Abbassi, R.; Abbassi, A.; Jemli, M.; Chebbi, S. Identification of unknown parameters of solar cell models: A comprehensive overview of available approaches. Renew. Sustain. Energy Rev. 2018, 90, 453–474. [Google Scholar] [CrossRef]
- Jack, V.; Salam, Z.; Ishaque, K. Cell modelling and model parameters estimation techniques for photovoltaic simulator application: A review. Appl. Energy 2015, 154, 500–519. [Google Scholar]
- Obbadi, A.; Errami, Y.; Rmaily, R.; Sahnoun, S.; El, A.; Agunaou, M. Parameters estimation of the single and double diode photovoltaic models using a Gauss-Seidel algorithm and analytical method: A comparative study. Energy Convers. Manag. 2017, 148, 1041–1054. [Google Scholar]
- Gao, X.; Cui, Y.; Hu, J.; Xu, G.; Yu, Y. Lambert W-function based exact representation for double diode model of solar cells: Comparison on fitness and parameter extraction. Energy Convers. Manag. 2016, 127, 443–460. [Google Scholar] [CrossRef]
- Chwieduk, D. Solar Energy in Buildings: Thermal Balance for Efficient Heating and Cooling, 1st ed.; Elsevier: Amesterdam, The Netherlands, 2014; ISBN 978-0124105140. [Google Scholar]
- Drabczyk, K.; Panek, P. Silicon-Based Sollar Cells. Characteristics and Production Processes; Institute of Metallurgy and Materials Science of Polish Academy of Sciences: Krakow, Poland, 2012; ISBN 978-83-62098-07-1. [Google Scholar]
- Sarniak, M.T. Fundamentals of Photovoltaics; Publishing House of Warsaw University of Technology: Warsaw, Poland, 2008; ISBN 978-83-7207-773-8. [Google Scholar]
- Sarniak, M.T. Construction and Operation of Photovoltaic Systems; Medium Group: Warsaw, Poland, 2015; ISBN 978-83-64094-41-5. [Google Scholar]
- International Electrotechnical Commission (IEC). IEC/PN-EN60891 Photovoltaic Devices—Procedures for Temperature and Irradiance Corrections to Measured I-V Characteristics; International Electrotechnical Commission: Genewa, Switzerland, 2009. [Google Scholar]
- Żdanowicz, T. Photovoltaic system (PV) reception—Procedures and documentation—Part 2. Magazynfotowoltaika 2018, 1, 16–20. [Google Scholar]
- HT-Italia Technical Specification of Characteristics Meter “I-V 400”—User Manual. Available online: https://www.ht-instruments.com/en/products/i-v400w/download/manual/ (accessed on 5 March 2019).
- IBC-SOLAR Technical Data of PV Module—IBC SOLAR MonoSol 260 EX. Available online: https://www.zonnepanelen.net/nl/pdf/panels/datasheet-ibc-solar-monosol-260-ex-black-zonnepaneel.pdf (accessed on 5 March 2019).
- SUNTECH Technical Data of PV Module—SUNTECH STP255-20/Wd. Available online: http://pdf.directindustry.com/pdf/suntech-power-corporation/stp255-20-wd/54793-588792.html (accessed on 8 February 2019).
- Gow, J.A.; Manning, C.D. Development of a photovoltaic array model for use in power-electronics simulation studies. IEEE Proc. Electr. Power Appl. 1999, 146, 193–200. [Google Scholar] [CrossRef]


| Technical Data in STC: | IBC SOLAR MonoSol 260 EX | SUNTECH STP255-20/Wd |
|---|---|---|
| Solar Cell (6 inches ≈ 156 × 156 [mm]) | Monocrystalline Silicon | Polycrystalline Silicon |
| No. of Cells | 60 | 60 |
| Maximum Power Point—PMPP, [Wp] | 260 | 255 |
| Power Tolerance, [%] | 0/+3 | 0/+5 |
| Module Efficiency—η, [%] | 15.8 | 15.7 |
| Voltage in MPP—UMPP, [V] | 30.6 | 30.8 |
| Current in MPP—IMPP, [A] | 8.51 | 8.28 |
| Open Circuit Voltage—UOC, [V] | 38.8 | 37.6 |
| Short Circuit Current—ISC, [A] | 9.24 | 8.76 |
| Dimensions of PV Module, [mm] | 1660 × 990 × 50 | 1640 × 992 × 35 |
| NOCT, °C | 48.4 | 45 ± 2 |
| Temperature Coefficient of PMPP - γT, [%/°C] | −0.43 | −0.44 |
| Temperature Coefficient of UOC - βT, [%/°C] | −0.31 | −0.33 |
| Temperature Coefficient of ISC - αT, [%/°C] | +0.042 | +0.055 |
| Marking of Measurement: M-mono, P-poly Crystalline PV Module: | Temperature of the PV Module TM, [°C] | Number of Shaded PV Cells in the Module, [pcs.] | Coefficient of Shading Degree: ksh, [%] |
|---|---|---|---|
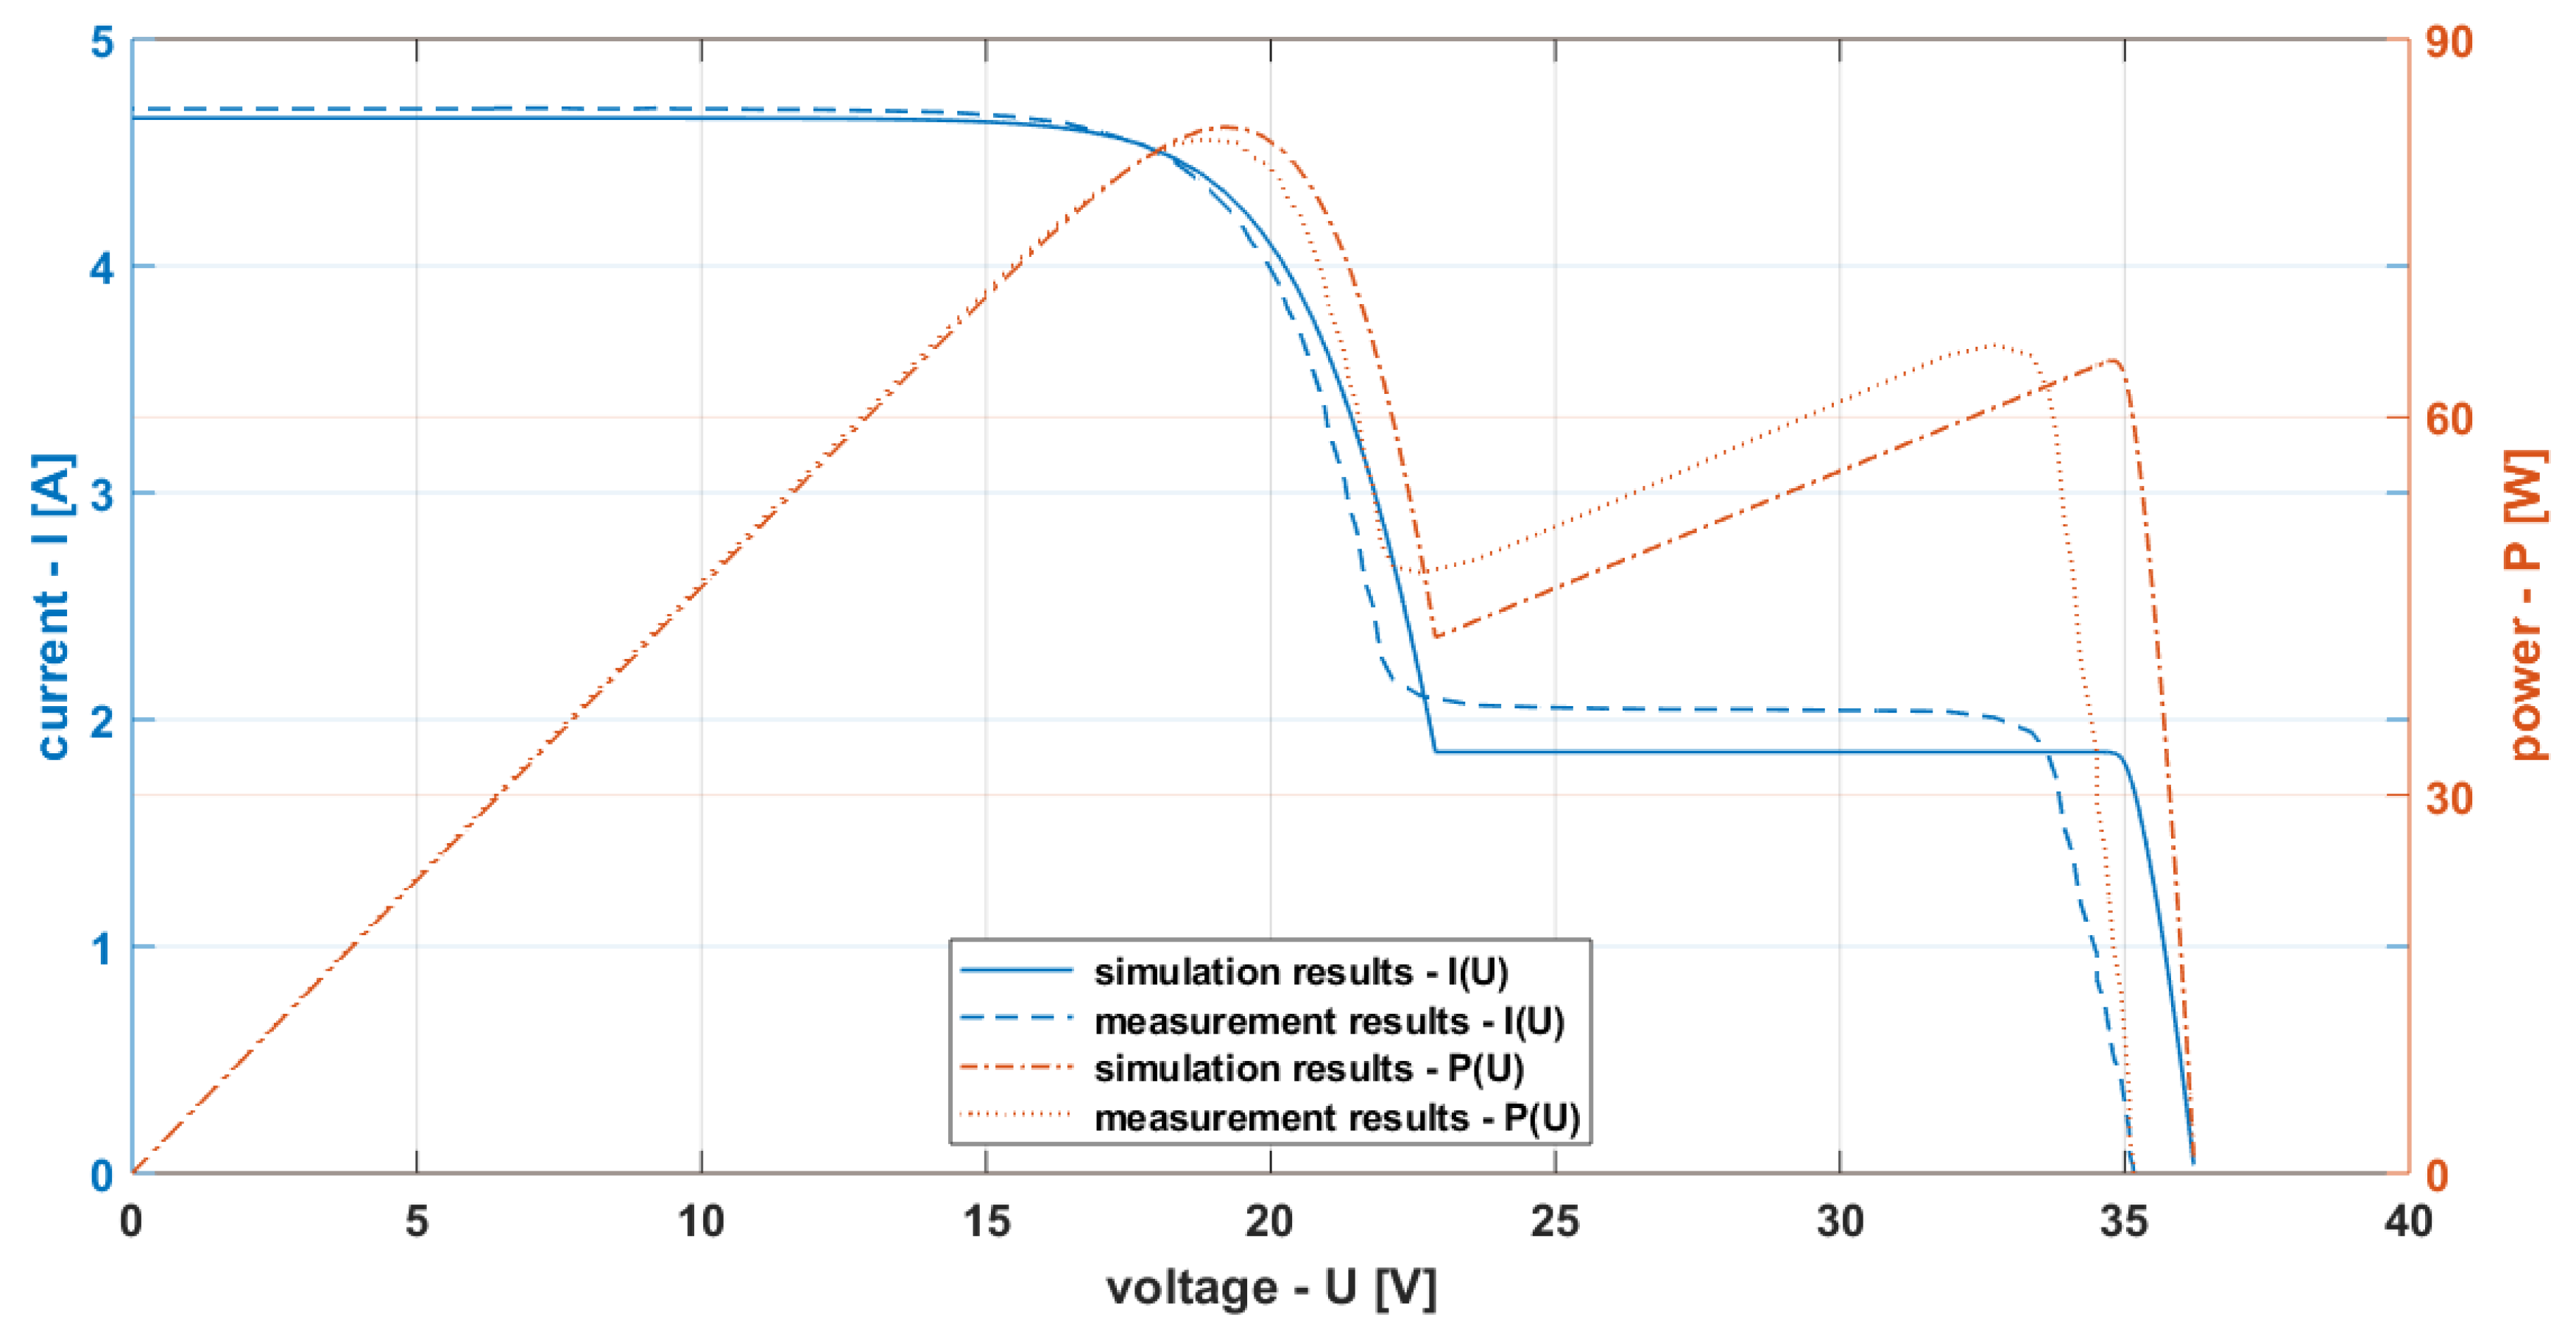
| P1 (Figure 6) | 34.1 | 2 | 60.1 |
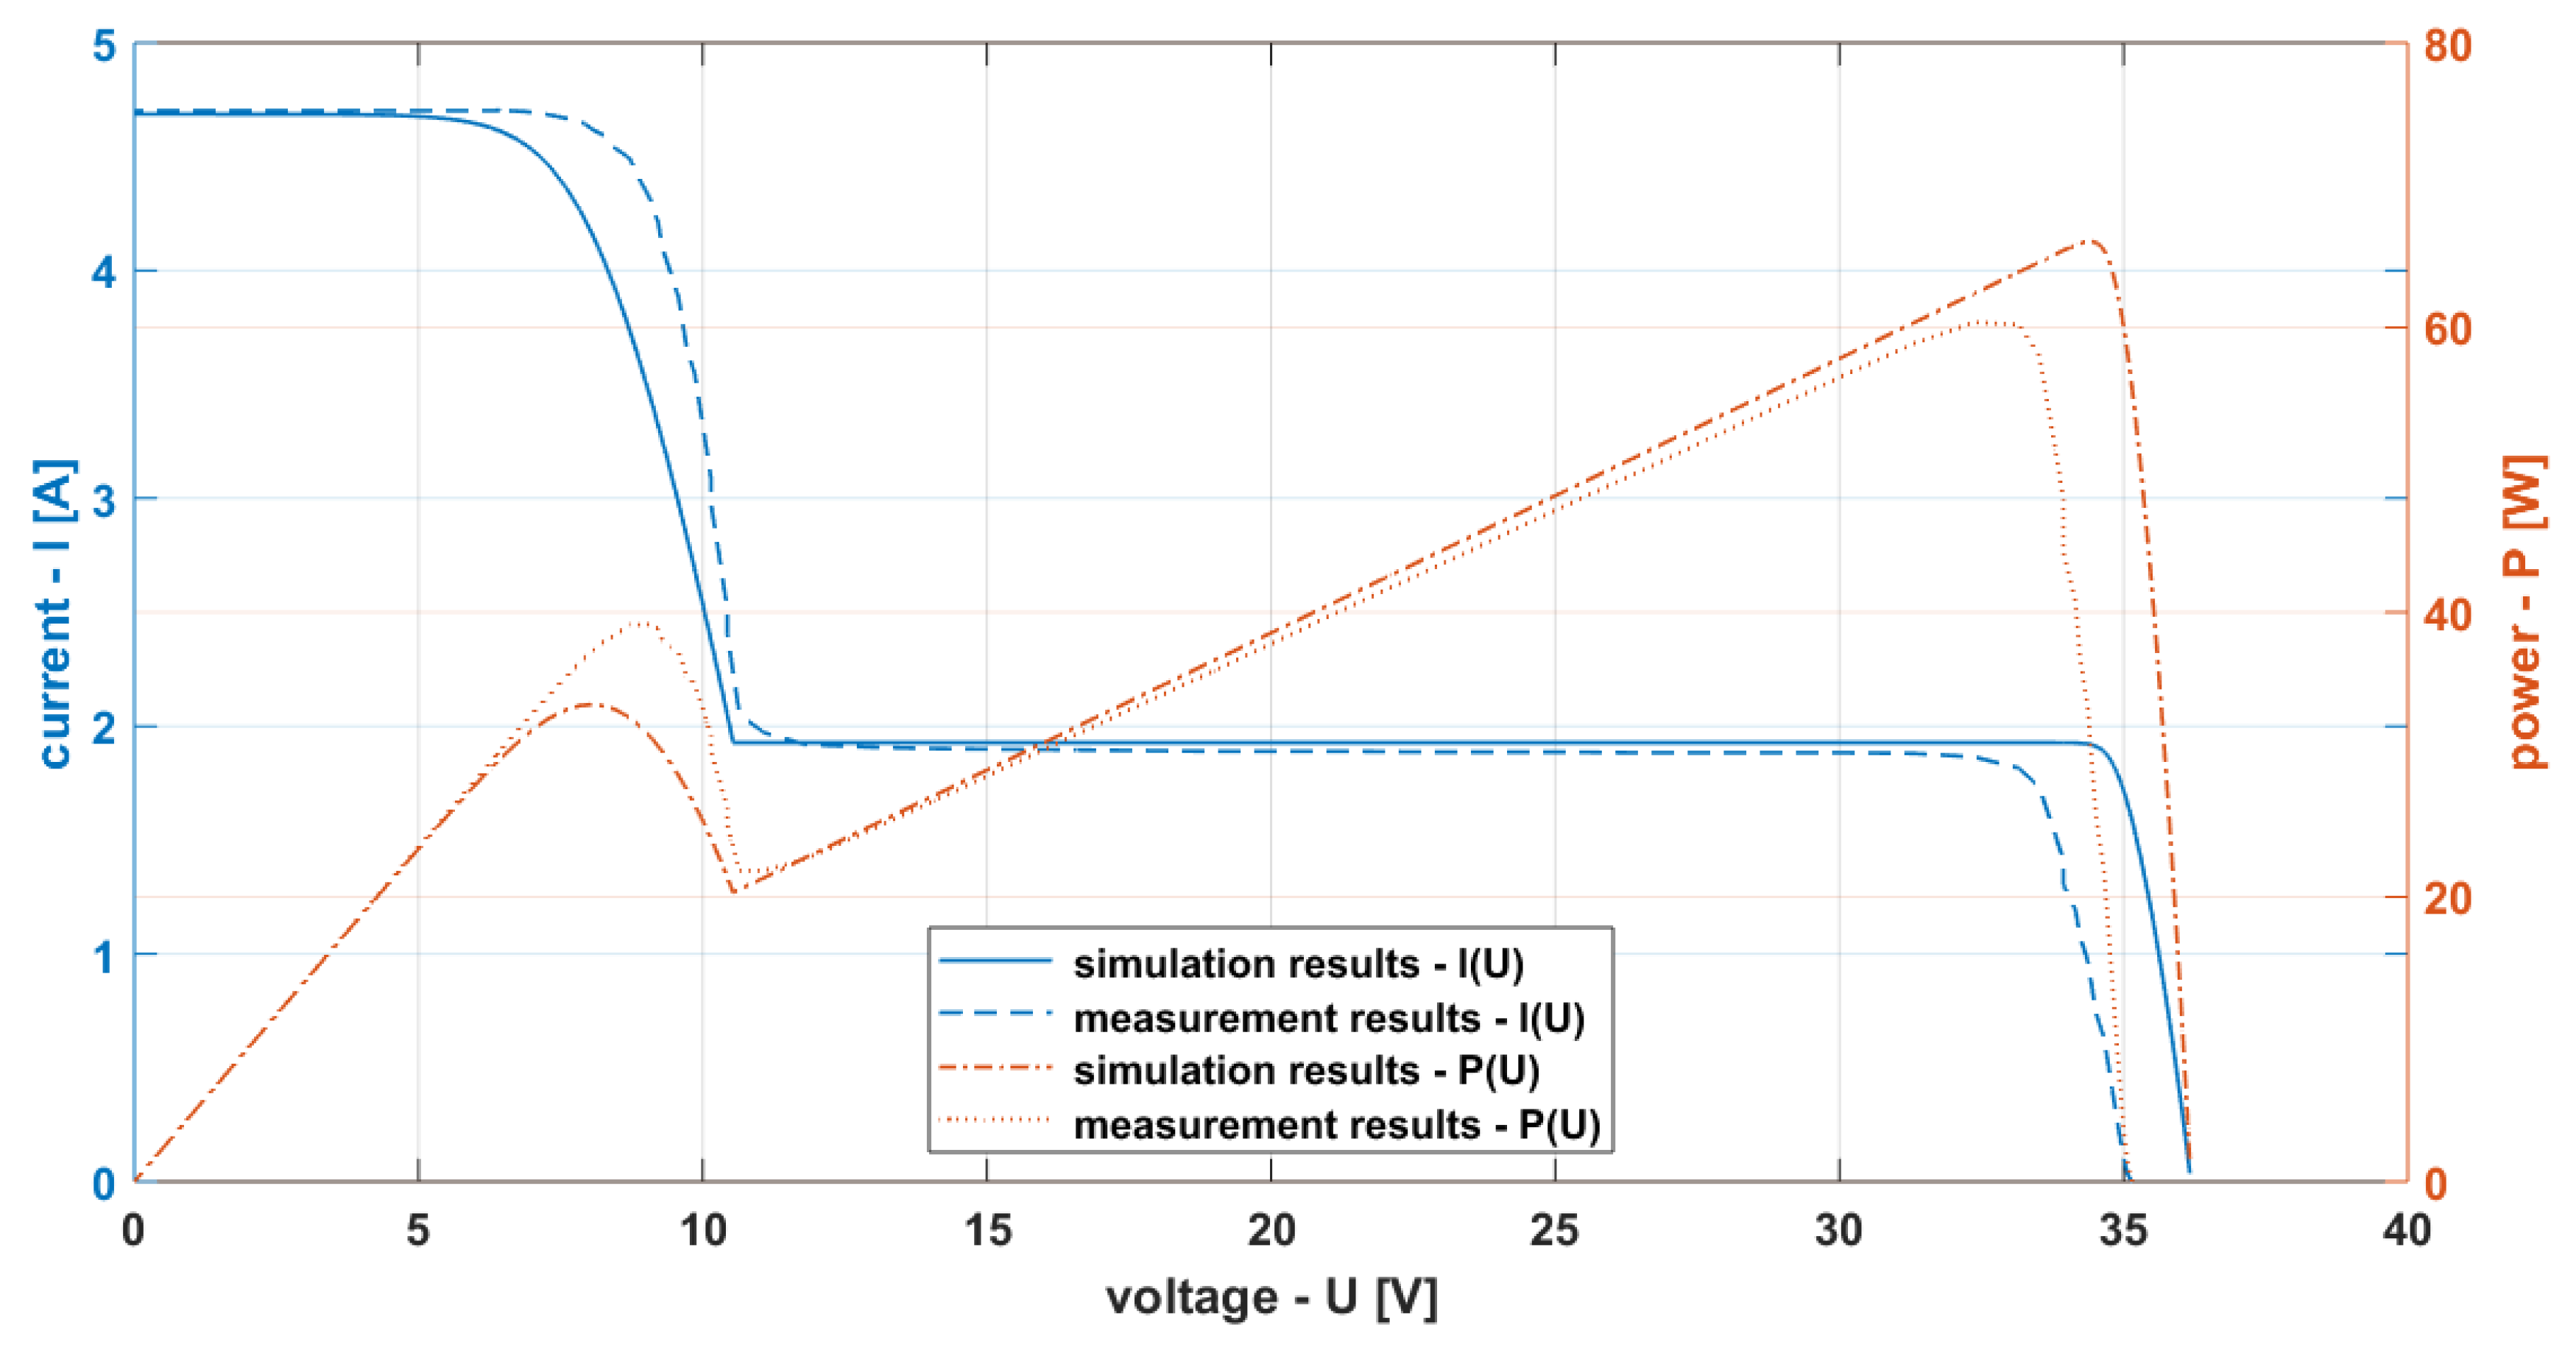
| P2 (Figure 7) | 34.4 | 4 | 58.9 |
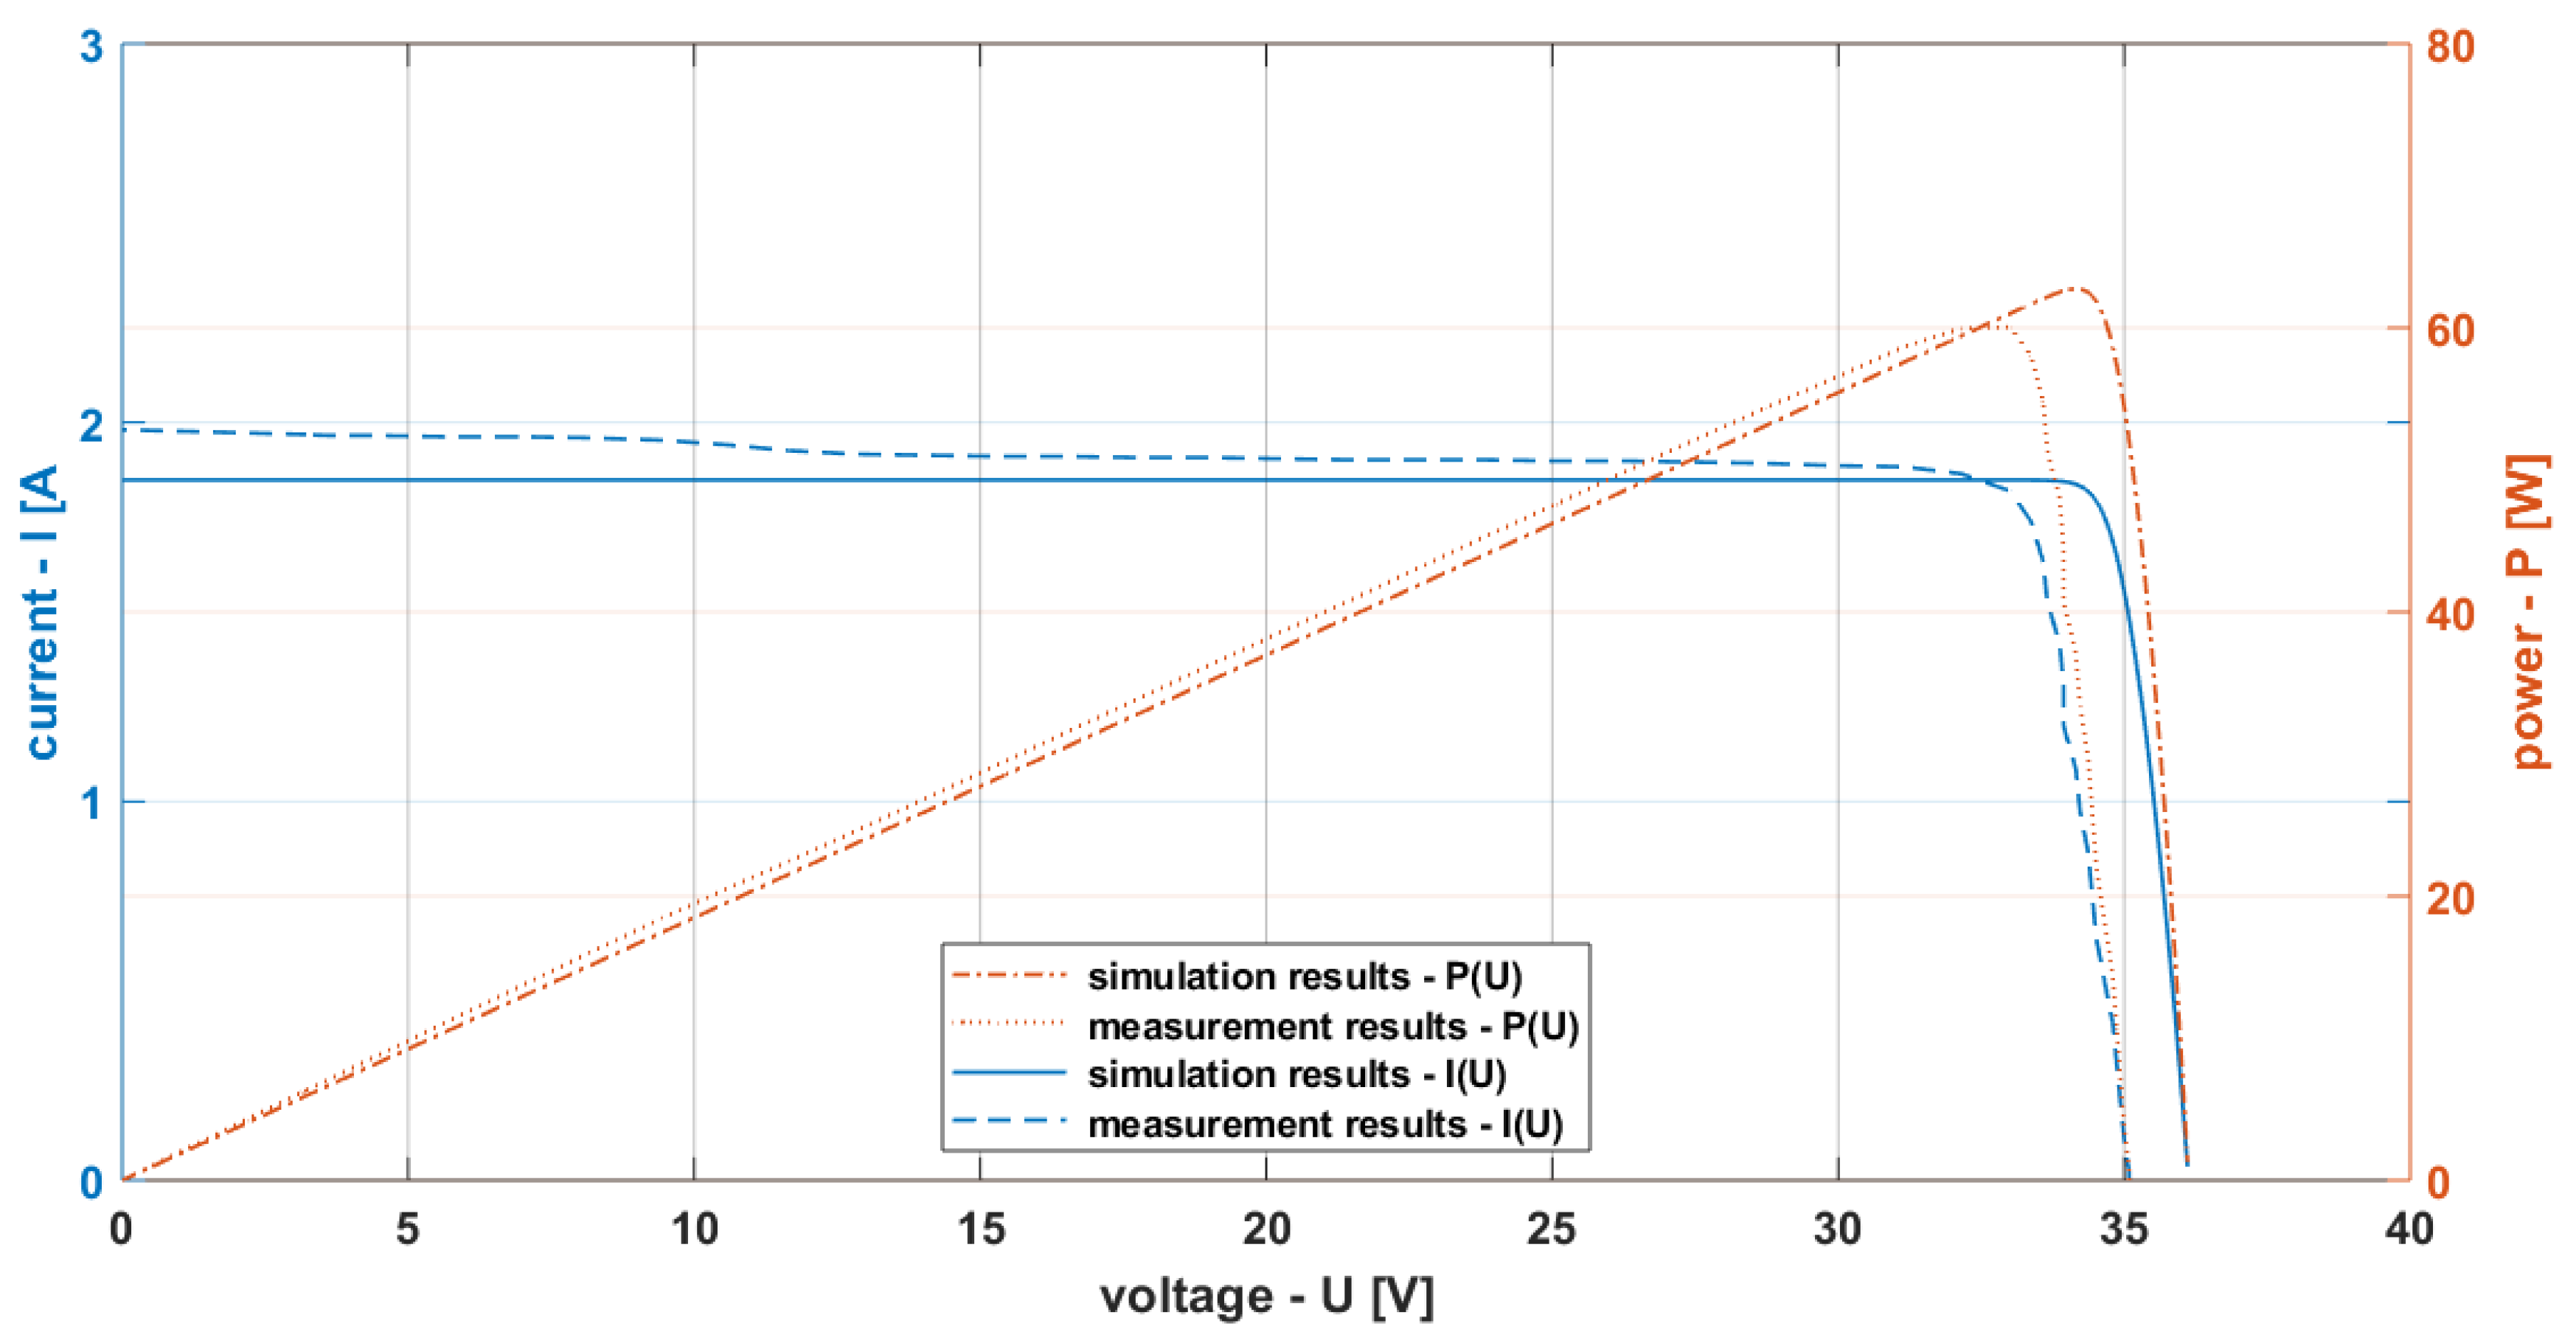
| P3 (Figure 8) | 34.3 | 6 | 60.8 |
| M1 (Figure 9) | 33 | 2 | 56.8 |
| M2 (Figure 10) | 33.1 | 4 | 58.4 |
| M3 (Figure 11) | 33 | 6 | 38.8 |
© 2019 by the authors. Licensee MDPI, Basel, Switzerland. This article is an open access article distributed under the terms and conditions of the Creative Commons Attribution (CC BY) license (http://creativecommons.org/licenses/by/4.0/).
Share and Cite
Sarniak, M.T.; Wernik, J.; Wołosz, K.J. Application of the Double Diode Model of Photovoltaic Cells for Simulation Studies on the Impact of Partial Shading of Silicon Photovoltaic Modules on the Waveforms of Their Current–Voltage Characteristic. Energies 2019, 12, 2421. https://doi.org/10.3390/en12122421
Sarniak MT, Wernik J, Wołosz KJ. Application of the Double Diode Model of Photovoltaic Cells for Simulation Studies on the Impact of Partial Shading of Silicon Photovoltaic Modules on the Waveforms of Their Current–Voltage Characteristic. Energies. 2019; 12(12):2421. https://doi.org/10.3390/en12122421
Chicago/Turabian StyleSarniak, Mariusz T., Jacek Wernik, and Krzysztof J. Wołosz. 2019. "Application of the Double Diode Model of Photovoltaic Cells for Simulation Studies on the Impact of Partial Shading of Silicon Photovoltaic Modules on the Waveforms of Their Current–Voltage Characteristic" Energies 12, no. 12: 2421. https://doi.org/10.3390/en12122421