Carbon Dioxide Absorption by Blast-Furnace Slag Mortars in Function of the Curing Intensity


1
Department of Science and Technology of Building Materials, Civil Engineering School, Technical University of Madrid (UPM), 28040 Madrid, Spain
2
Department of Cement Chemical Testing, LOEMCO. Technical University of Madrid (UPM), Avda. Eric Kandel 0001, LOEMCO Building. South Technological Area “Acedinos”, GETAFE, 28906 Madrid, Spain
*
Author to whom correspondence should be addressed.
Energies 2019, 12(12), 2346; https://doi.org/10.3390/en12122346
Submission received: 12 May 2019
/
Revised: 13 June 2019
/
Accepted: 13 June 2019
/
Published: 19 June 2019
(This article belongs to the Special Issue Carbon Capture, Storage and Utilization)
Abstract
:Climate change is one of the most important issues affecting the future of the planet. Then, a lot of resources are being used to actively work on climate change issues and greenhouse gas reduction. Greenhouse gas (GHG) emissions are monitored by each country and reported yearly to the United Nations Framework Convention on Climate Change (UNFCCC). The Intergovernmental Panel on Climate Change (IPCC) published the document entitled “2006 IPCC Guidelines for National Greenhouse Gas Inventories” to provide the calculation rules and the way to inform the UNFCCC of the national GHG emissions. Currently, this document does not give a procedure to calculate the net carbon dioxide emissions to the atmosphere due to the Portland cement clinker production. The purpose of this paper is to get reliable relationships to better calculate the CO2 uptake by ground granulated blast-furnace slag (GGBFS) mortars. The application of this material cured under controlled conditions could help minimize environmental impact. Carbonation coefficient versus 28-day compressive strength relationship of mortars elaborated with GGBFS and cured underwater for 0, 1, 3, 7, 14, or 28 days were obtained. The main finding is the extreme sensitivity of the GGBFS mortars to the curing intensity and, therefore, they can be used cured under controlled conditions to minimize carbon footprints.
1. Introduction
Climate change threat is promoting the development of new technologies on greenhouse gas (GHG) emissions. Given that, carbon dioxide utilization is diverse [1,2] and new technologies must be promoted to be implemented successfully. New composite materials designed to be carbonated has a great potential for CO2 uptake, for instance, by using new additions, providing a denser final material [3].
In order to assess the annual amount of GHG emissions in the world, they are monitored at national level and reported to the United Nations Framework Convention on Climate Change (UNFCCC) according to The Intergovernmental Panel on Climate Change (IPCC) rules published in the “2006 IPCC Guidelines for National Greenhouse Gas Inventories” [4]. With regard to the Portland cement clinker production, such guidelines do not include an accurate procedure to calculate the net carbon dioxide emissions to the atmosphere, i.e., carbon dioxide is formed by the Portland cement clinker production [5], but also, carbon dioxide is partly uptaken by the Portland cement-based materials by means of the well-known carbonation chemical process [6].
Cement industry reports to the UNFCCC both the carbon dioxide emissions formed from the fuels combustion and from the raw materials calcination, mainly limestone (Equation (1)). However, the carbon dioxide uptake by mortars and concretes [7,8,9] is not yet considered (Equation (2)). Consequently, this omission leads to a distortion of the calculations. Cement industry might deplore this mistake because it places a severe strain on the inaccurate and overestimated results. Nowadays, cement industry accounts for 6–7% of man-made CO2 emissions [5]. Nevertheless, carbonation process is the responsible of removing CO2 from the atmosphere, because it permanently locks carbon dioxide.
CaCO3 → CaO + CO2
CO2 + Ca(OH)2 → CaCO3 + H2O
This chemical process provides a stable long-term carbon dioxide storage solution. During the service life of cement-based materials, such as mortars, reinforced concrete, and so on, a significant amount of the process emissions (up to 44% [8]) related to the production of the Portland cement clinker may be absorbed by the cement paste constituents in the cement-based materials.
In Portland cement exposed to natural carbonation, the porosity decreases as result of the calcium carbonate precipitation inside the pores [10]. With regard to carbonation of ground granulated blast-furnace slag (GGBFS) cement-based materials, a scarce but rich literature not exempt of some debate has been found. The effect of GGBFS replacement on carbonation rate concerns both capillary porosity and carbon dioxide binding capacity. A recent study showed that the carbonation rate increases as the cement replacement by GGBFS increases [11]. Additionally, it increases when the curing time is low [12,13]. These findings are in agreement with previous work of De Belie et al. [14], who showed the influence of the high water/cement ratio and high GGBFS content on the increase of the carbonation level. With regard to the effect of the curing temperature, carbonation rates of GGBFS cement pastes cured at high temperature (60 °C) are lower than that of GGBFS cement paste cured at lower temperatures [15]. This effect was explained by the hydration enhancement, which produces a denser final product. Additionally, some researchers have used accelerated carbonation (3% CO2) to assess the carbonation resistance of cement-based materials [16,17,18]. In some cases, they found that the carbonation rate is about ten times faster than in natural exposure conditions (0.03% CO2) [16].
The calculation method for the uptake of carbon dioxide in cement-based materials presented in Annex BB in EN 16757:2017 [19] estimates the carbonation rate from the 28-day compressive strength. This method represents a simplified calculation method yet provides a reliable calculation result for the uptake of CO2. Accurate measurements as well as calculations are extremely important for all decision-making processes in general, but this also applies to the mortar and concrete carbon dioxide uptake in particular. The scope of this study is to provide input to mentioned Annex BB for improving the calculation model. Furthermore, a new opportunity of carbonating GGBFS cement-based materials under controlled conditions (time of curing) is shown. This process could be optimized for CO2 sequestration purposes.
2. Materials and Methods
Portland cements and GGBFS cements provided by a Spanish cement producer [20,21] with diverse contents of GGBFS (0, 14.4, 28.1, and 62.2%) were selected for this research program (Table 1). The chemical analyses were made under the standard EN 196-2:2014 [22]. Mortars were made according to EN 196-1:2016 [23]. Cement/sand and water/cement ratios were 1/3 and 0.50, respectively. After 1 day at 98–100% relative humidity (RH), they were removed from the molds: Later, they were submitted to several curing periods from 0 to 28 days underwater, i.e., 0, 1, 3, 7, 14, or 28. From then on, mortar samples were tested for natural carbonation.
Mortars were exposed to the outdoor environment sheltered from rain according to the European Technical Specification CEN/TS 12390-10 [24]. Measurement was taken after 2 years of exposure. The samples were sawn up into slices with a thickness of 20 mm. This sawn surface was cleaned of dust formed. Later on, the freshly and clean sawn surfaces were sprayed with a mist of phenolphthalein, which was used as pH indicator solution (Figure 1).
Compressive strength was measured on a universal testing machine following the standard EN 196-1:2016 [23]. Prismatic mortar specimens, i.e., 40 × 40 × 160 mm, cured for 28 days immersed in water at 20.0 ± 1.0 °C, were tested. Compressive strength was measured on six samples for each mortar quality.
3. Results and Discussion
3.1. CO2 Uptake and Carbonation Coefficient
The CO2 uptake in mortars and concretes, both in primary products and in end-of-life materials, is relatively slow because this process depends on the long exposure to CO2 from the air. Currently, the CO2 content in air is about 400 ppm, but it increases by about 1–2 ppm per year. Therefore, this process can be considered as a mineral sequestration of CO2 [25].
Figure 2 shows the relative coefficient of carbonation, B obtained for GGBFS mortars. This parameter was determined from the depth of carbonation measurements performed after a period of natural carbonation of 2 years. The influence of the GGBFS content and the type of curing can be evidenced at the same time. The reference value is one for the mortar with 0% slag and 28 days of curing underwater. It is clearly marked with a white bar in Figure 2. Taking the relative carbonation coefficient of the mortar made without GGBFS and cured for 28 days as 1 mm/y0.5 (reference value), all the rest of the carbonation coefficients were obtained. For instance, this mortar offered an experimental carbonation coefficient of 2.52 mm/y0.5, and in order to convert the experimental result into the relative carbonation coefficient, it was divided by 2.52.
Apparently, the shorter the curing period is, the higher the relative carbonation coefficient is reached, in line with some other previous studies [16]. Even more, a reduce time of curing is more important when the amount of GGBFS added to the mortars is increased, in agreement with other findings [17]. Nevertheless, mortars with a low level of GGBFS, CEM I 52.5, and CEM II/A-S, presented similar carbonation results at 7, 14, and 28 days of curing. These results were in agreement with the findings of other researchers who have observed that replacement levels below 30% do not affect the carbonation resistance significantly [16]. The carbonation process is produced when CO2 from the air dissolves in the pore solution contained in the mortar and reacts with cement alkaline components such as calcium, sodium, and potassium hydroxides, forming calcium, sodium, and potassium carbonates. Lee and Wang [3] reported a carbon dioxide uptake of 4.61% in structures made with slag blended concrete during its 50 years of service life with relation to the emitted CO2.
Mortars sheltered from rain and cured for 7, 14, and 28 days showed the lowest relative carbonation coefficients. This result suggests that seven days of curing can be considered as good for mortars made with more than 28% of GGBFS, but it is sufficient merely to make a curing of three days for mortars and concretes with less than 28% GGBFS. High-sensitivity mortars for carbonation might present a fast depletion of calcium hydroxide [16]. In our measurements, phenolphthalein color change is not only a matter of Ca(OH)2 carbonation but of reaction of other components such as calcium silicate hydrates, C3S, C2S, and ettringite, among others; particularly, carbonated calcium aluminates form vaterite and alumina gel [26]. Figure 2 shows that GGBFS mortars exhibit a low resistance to be carbonated, notably bad cured GGBFS-based materials [17].
Carbonation process was modelled by using Equation (3), considering the experimental results summarized in Figure 1, in which B is the carbonation coefficient (mm/s0.5), x is the depth of carbonation (mm), and t the carbonation time (s). This coefficient is affected by the intrinsic mortar characteristics and external conditions and is used in many cases to assess the service life with regard to the corrosion of the concrete reinforcement induced by concrete cover carbonation [26].
The relative carbonation coefficient obtained after 2 years of natural carbonation can be split into a pair of sets. One of them is formed by CEM I and CEM II/A-S, the other is formed by CEM III/A and CEM III/B. During carbonation of cements without additions, CEM I, calcium carbonate, blocks the capillary pores leading to a carbonation slowdown. The difference between the volume of the reactants and products could explain partly this effect. On the other hand, carbonation of cements made with additions presents a high porosity [16].
Surprisingly, relative carbonation coefficients determined for mortars which has been cured for 1 day or without a curing underwater are nearly the same. This suggest that 1 day of curing is not enough to achieve a good mortar quality.
3.2. Compressive Strength
Figure 3 shows the 28-day compressive strength results obtained in CEM II/A-S 42.5 N, CEM III/A 42.5 N, CEM III/B 32.5 N-LH/SR, and CEM I 52.5 R-SR 3. As expected, the strength diminishes if there is an increase of GGBFS in the material. Similar findings were reported in the paper [16]. The 28-day compressive strength evolution in mortars with from 0 to 28% of GGBFS goes from about 63 to 45 MPa. Given that, a range of 22 MPa was found in these mortars. However, this trend cannot be considered as a rule. More experimentation will be necessary for each specific situation.
In addition, carbonates formation will help to densify mortar microstructure. Therefore, their compressive strength increases [4]. Consequently, carbonation curing is a promising technique to make mass concrete.
3.3. Carbonation Versus 28-Day Compressive Strength Relationship
Figure 4 shows the results found for mortars made with GGBFS and cured underwater for 0, 1, 3, 7, 14 or 28 days with regard to the relationship between the carbonation coefficient, B, and 28-day compressive strength, S. These relationships heavily rely on the curing time underwater. The relationships obtained for the different times of curing are given in Equations (4)–(9).
There are two groups of linear equations, the first one corresponds to the lower curing times (0 and 1 days of curing underwater) with the highest negative slopes going from −0.6 to −0.5; whereas the second one corresponds to the longer curing periods and exhibits gentle slopes which go from −0.2 to −0.1 (3, 7, 14, and 28 days of curing underwater). In particular, the slopes for curing times from 7 to 28 days are almost the same (from −0.16 to −0.18) meaning that curing times over 7 days have reached the best curing conditions in the tested material. Three days of curing time is also good since the slope (−0.23) is not significantly high. Conversely, 1 day of curing underwater is not enough to reach a proper carbonation resistance [17].
The European standard EN 16.757 in Annex BB [19] gives a way to estimate theoretically the k-values from the concrete strength results and exposure conditions [19]. However, the curing conditions are not considered. Our findings suggest that curing conditions should be implemented in the model proposed by such Annex BB [19] in order to achieve more accurate results. The correction factors for the k-value for ordinary Portland cement with additional constituents or concrete with supplementary cementitious materials (SCM) are presented in Table BB.2
Figure 5 shows the experimental results found in ground granulated blast-furnace slag mortars cured underwater for 28 days (Equation (10)) in comparison with the factors given by Annex BB in its Table BB.1 Equation (11) [19]. Such factors are much lower than the relative carbonation coefficients found for ground granulated blast-furnace slag mortars cured for 28 days. This could be explained because Annex BB [19] only applies to concretes, but a difference about 40% between both values for 70% ground granulated blast-furnace slag is weird. Probably, this difference should be lower. Given that, a more detailed study should be performed in order to be applied to cement-based materials currently produced.
4. Conclusions
The focus in this study is the climate performance with regard to the carbonation potential of mortars made with diverse GGBFS contents cured during several times. Based on the experimental results, the following conclusions can be drawn:
- Ground granulated blast-furnace slag (GGBFS) mortars cured under controlled conditions, i.e., under poor curing conditions, could help minimize carbon footprints.
- Correlations between the carbonation coefficient and GGBFS content in mortars are heavily reliant on the curing time. Two groups of linear equations were found. The first one corresponds to the lower curing times (0 and 1 days of curing underwater) and the second one corresponds to the longer curing periods (3, 7, 14, and 28 days of curing underwater).
- Carbonation coefficient is indeed increased when GGBFS amount rises. Then, carbonation process in any cement-based material is strongly reliant upon the type of cement, i.e., the kind of additions used in its production.
- The mathematical relationships given in this paper can be used to estimate the carbonation coefficient in function of the GGBFS content and curing.
Author Contributions
Conceptualization, M.Á.S., C.A. and E.E.; Methodology, M.Á.S. and E.E.; Software, M.Á.S. and E.E.; Validation, M.Á.S., C.A. and E.E.; Formal analysis, C.A.; Investigation, M.Á.S. and E.E.; resources, E.E.; Data curation, M.Á.S., C.A. and E.E.; Writing—original draft preparation, M.Á.S.; Writing—review and editing, M.Á.S.; Visualization, M.Á.S. and C.A.; supervision, M.Á.S.
Funding
This research received no external funding.
Acknowledgments
The authors gratefully acknowledge the technical support of LOEMCO. The authors also appreciate the unknown referee’s valuable and profound comments.
Conflicts of Interest
The authors declare no conflicts of interest.
References
- Kim, H.-J.; Lee, H.-K. Mineral Sequestration of Carbon Dioxide in Circulating Fluidized Bed Combustion Boiler Bottom Ash. Minerals 2017, 7, 237. [Google Scholar] [CrossRef]
- Klumpen, C.; Radakovitsch, F.; Jess, A.; Senker, J. BILP-19—An Ultramicroporous Organic Network with Exceptional Carbon Dioxide Uptake. Molecules 2017, 22, 1343. [Google Scholar] [CrossRef] [PubMed]
- Lee, H.-S.; Wang, X.-Y. Evaluation of the Carbon Dioxide Uptake of Slag-Blended Concrete Structures, Considering the Effect of Carbonation. Sustainability 2016, 8, 312. [Google Scholar] [CrossRef]
- Eggleston, H.S.; Buendia, L.; Miwa, K.; Ngara, T.; Tanabe, K. (Eds.) IPCC, The Intergovernmental Panel on Climate Change, 2006 IPCC Guidelines for National Greenhouse Gas Inventories; Prepared by the National Greenhouse Gas Inventories Programme; Institute for Global Environmental Strategies (IGES) on behalf of the IPCC (IGES): Hayama, Japan, 2006; ISBN 4-88788-032-4. [Google Scholar]
- Barcelo, L.; Kline, J.; Walenta, G.; Gartner, E. Cement and carbon emissions. Mater. Struct. 2014, 47, 1055–1065. [Google Scholar] [CrossRef]
- Saetta, A.V.; Schrefler, B.A.; Vitaliani, R.V. The carbonation of concrete and the mechanism of moisture, heat and carbon-dioxide flow-through porous materials. Cem. Concr. Res. 1993, 23, 761–772. [Google Scholar] [CrossRef]
- Andrade, C.; Sanjuán, M.A. Updating Carbon Storage Capacity of Spanish Cements. Sustainability 2018, 10, 4806. [Google Scholar] [CrossRef]
- Xi, F.; Davis, S.J.; Ciais, P.; Crawford-Brown, D.; Guan, D.; Pade, C.; Shi, T.; Syddall, M.; Lv, J.; Ji, L.; et al. Substantial global carbon uptake by cement carbonation. Nat. Geosci. 2016, 9, 880–883. [Google Scholar] [CrossRef] [Green Version]
- Galán, I.; Andrade, C.; Mora, P.; Sanjuán, M.A. Sequestration of CO2 by Concrete Carbonation. Environ. Sci. Technol. 2010, 44, 3181–3186. [Google Scholar] [CrossRef] [PubMed]
- Goñi, S.; Gaztañaga, M.; Guerrero, A. Role of cement type on carbonation attack. J. Mater. Res. 2002, 17, 1834–1842. [Google Scholar] [CrossRef]
- Gruyaert, E.; Van den Heede, P.; De Belie, N. Carbonation of slag concrete: Effect of the cement replacement level and curing on the carbonation coefficient– effect of carbonation on the pore structure. Cem. Concr. Compos. 2013, 35, 39–48. [Google Scholar] [CrossRef]
- Sanjuán, M.A.; Piñeiro, A.; Rodríguez, O. Ground granulated blast furnace slag efficiency coefficient (k value) in concrete. Applications and limits. Mater. Constr. 2011, 61, 303–313. [Google Scholar] [CrossRef]
- Sanjuán, M.A.; Estévez, E.; Argiz, C.; del Barrio, D. Effect of curing time on granulated blast-furnace slag cement mortars carbonation. Cem. Concr. Compos. 2018, 90, 257–265. [Google Scholar] [CrossRef]
- De Belie, N.; Kratky, J.; Van Vlierberghe, S. Influence of pozzolans and slag on the microstructure of partially carbonated cement paste by means of water vapour and nitrogen sorption experiments and BET calculations. Cem. Concr. Res. 2010, 40, 1723–1733. [Google Scholar] [CrossRef]
- Borges, P.H.; Costa, J.O.; Milestone, N.B.; Lynsdale, C.J.; Streatfield, R.E. Carbonation of CH and C–S–H in composite cement pastes containing high amounts of BFS. Cem. Concr. Res. 2010, 40, 284–292. [Google Scholar] [CrossRef]
- Sisomphon, K.; Franke, L. Carbonation rates of concretes containing high volume of pozzolanic materials. Cem. Concr. Res. 2007, 37, 1647–1653. [Google Scholar] [CrossRef]
- Chen, Y.; Liu, P.; Yu, Z. Effects of Environmental Factors on Concrete Carbonation Depth and Compressive Strength. Materials 2018, 11, 2167. [Google Scholar] [CrossRef] [PubMed]
- Leemann, A.; Moro, F. Carbonation of concrete: The role of CO2 concentration, relative humidity and CO2 buffer capacity. Mater. Struct. 2017, 50, 30–43. [Google Scholar] [CrossRef]
- EN 16757. Sustainability of construction works—Environmental product declarations—Product Category Rules for concrete and concrete elements. Annex BB (informative). In CO2 Uptake by Carbonation—Guidance on Calculation; CEN: Brussels, Belgium, 2017. [Google Scholar]
- Sanjuán, M.A.; Argiz, C. The new European standard on common cements specifications EN 197-1:2011. Mater. Constr. 2012, 62, 425–430. [Google Scholar] [CrossRef]
- EN 197-1. Cement—Part 1: Composition; Specifications and Conformity Criteria for Common Cement; CEN: Brussels, Belgium, 2011. [Google Scholar]
- EN 196-2. Method of Testing Cement—Part 2: Chemical Analysis of Cement; CEN: Brussels, Belgium, 2014. [Google Scholar]
- EN 196-1. Method of Testing Cement—Part 1: Determination of Strength; CEN: Brussels, Belgium, 2016. [Google Scholar]
- CEN/TS 12390-10. Testing Hardened Concrete. Part 10: Determination of the Relative Carbonation Resistance of Concrete; CEN: Brussels, Belgium, 2007. [Google Scholar]
- Konist, A.; Maaten, B.; Loo, L.; Neshumayev, D.; Pihu, T. Mineral sequestration of CO2 by carbonation of Ca-rich oil shale ash in natural conditions. Oil Shale 2016, 33, 248–259. [Google Scholar] [CrossRef]
- Sanjuán, M.A.; Andrade, C.; Cheyrezy, M. Concrete carbonation tests in natural and accelerated conditions. Adv. Cem. Res. 2003, 15, 171–180. [Google Scholar] [CrossRef]
Figure 1.
Carbonation depth measurement: (a) Cutting; (b) phenolphthalein pH-indicator test.
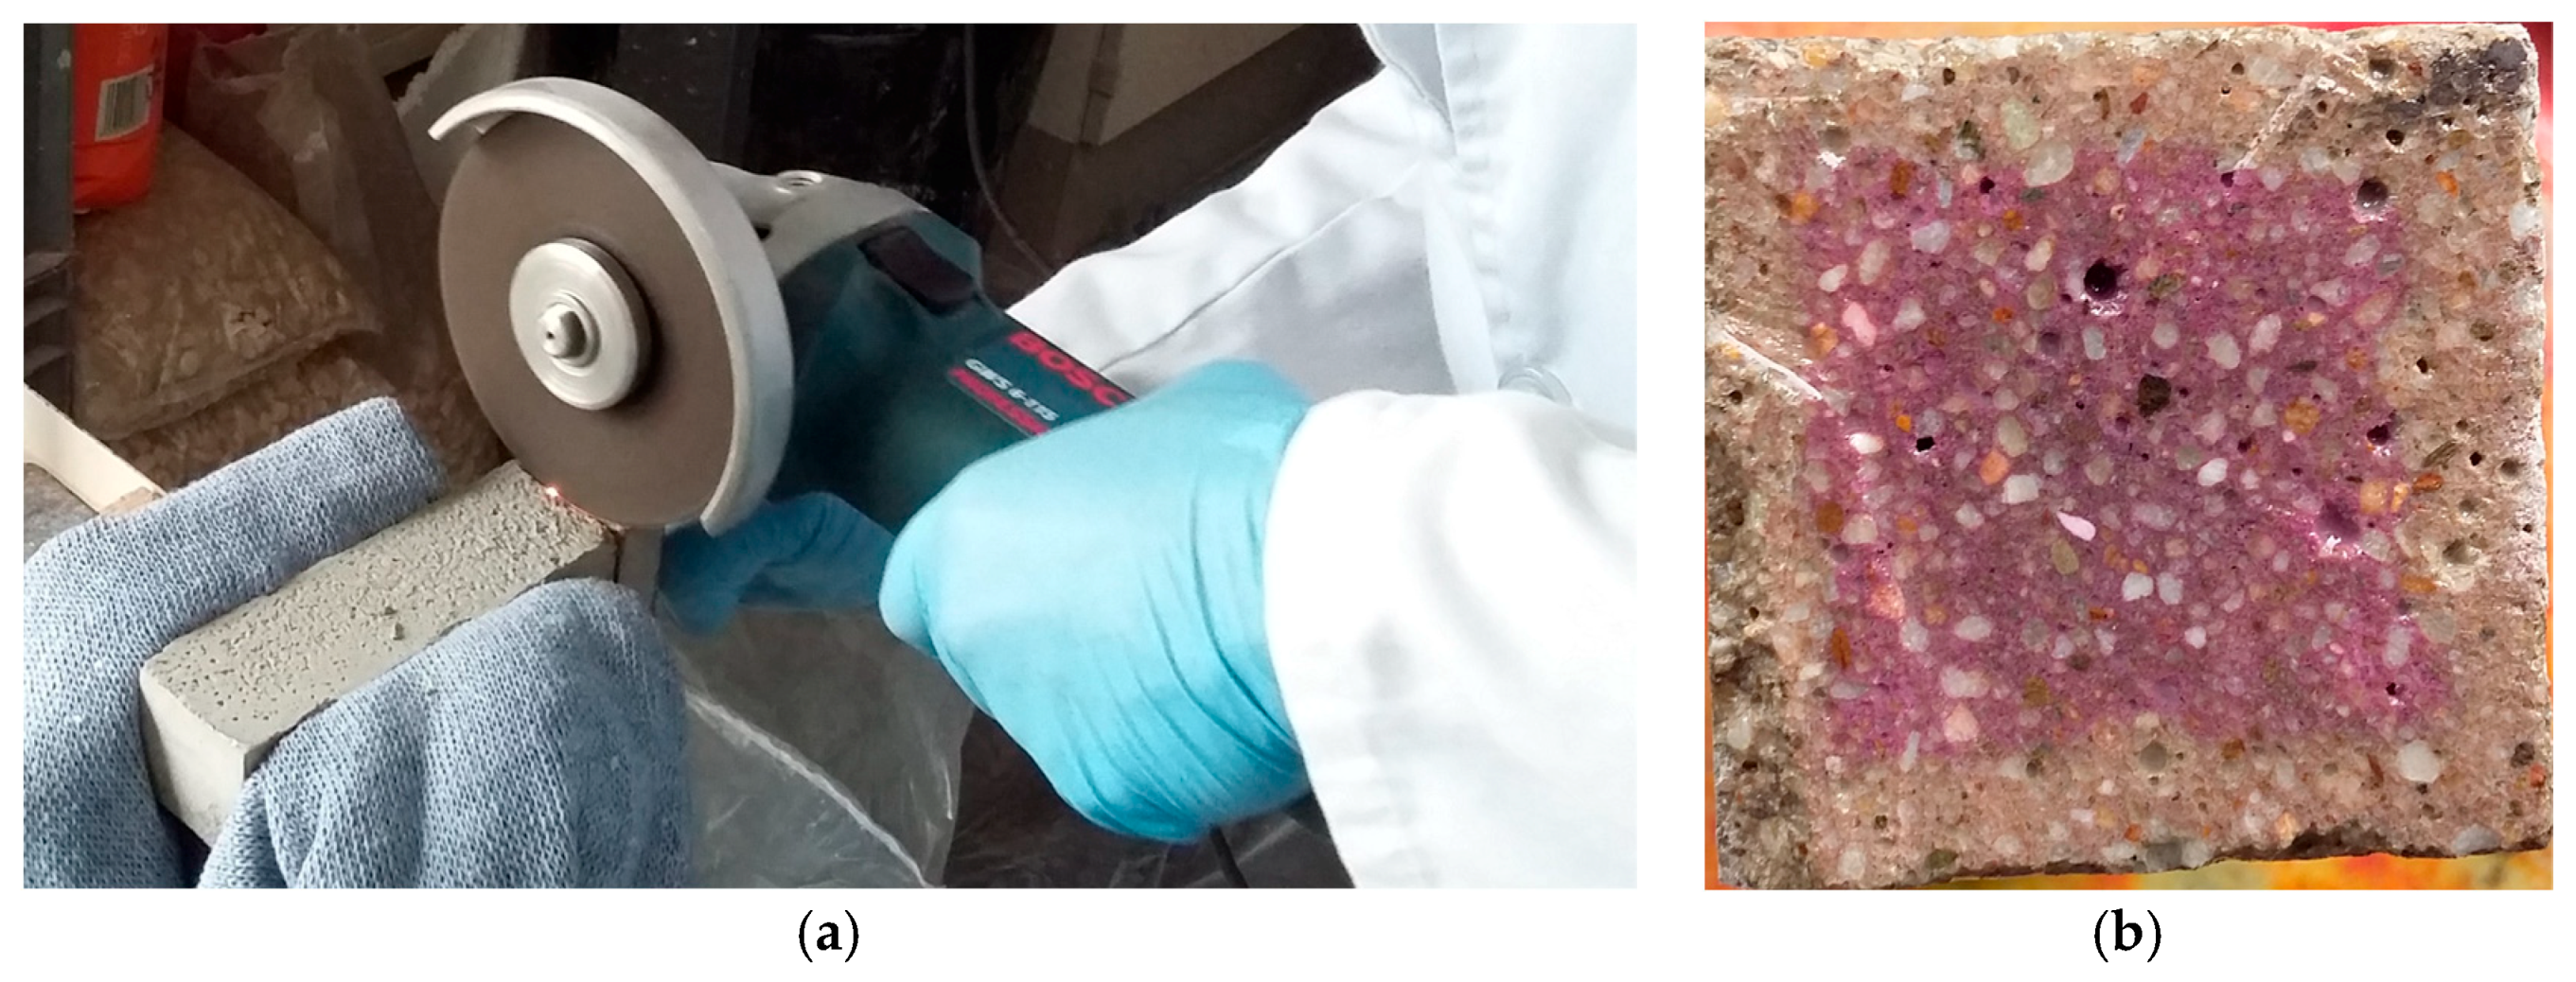
Figure 2.
Relative carbonation coefficient, B, calculated after 2 years of natural carbonation in mortars made with ground granulated blast-furnace slag (GGBFS), which have been cured for 0, 1, 3, 7, 14 and 28 days (The reference value (one) is represented by a broken line in black color: 0% slag and 28 days of curing underwater).
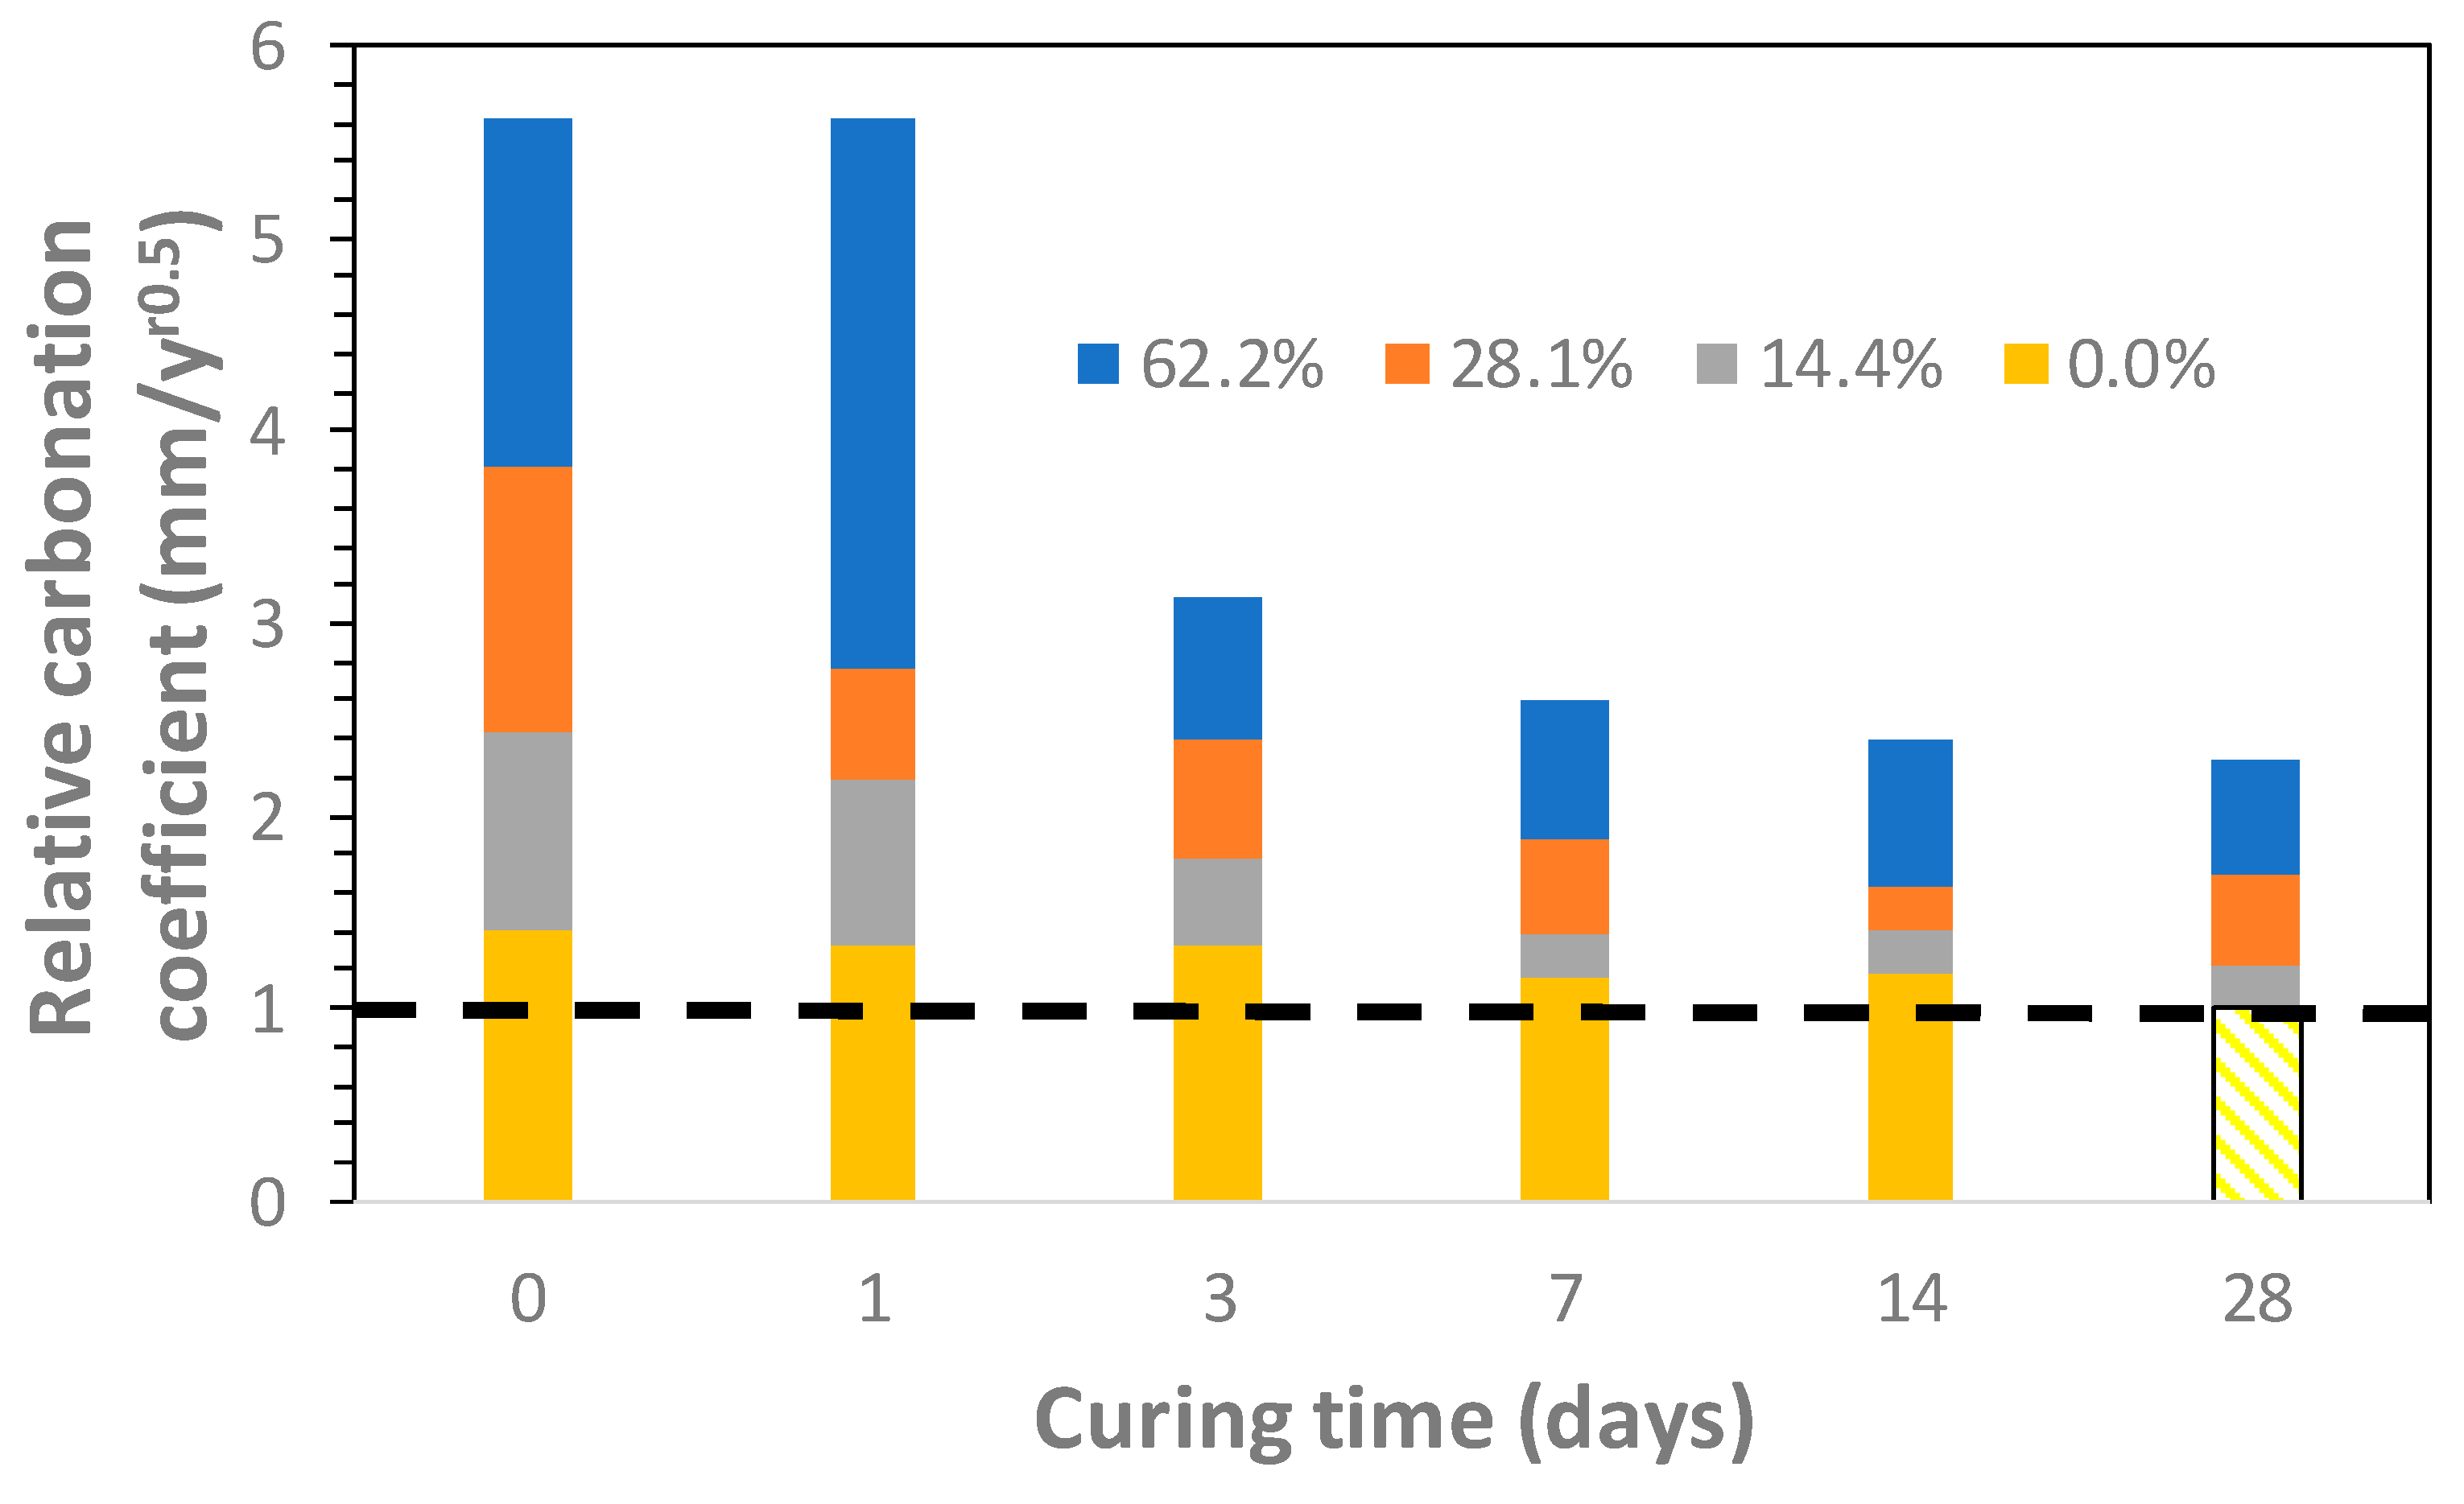
Figure 3.
Compressive strength at 28 days measured in GGBFS mortars. From top to down, CEM III/B 32.5 N-LH/SR, CEM III/A 42.5 N, CEM II/A-S 42.5 N, and CEM I 52.5 R-SR 3 mortars.
Figure 3.
Compressive strength at 28 days measured in GGBFS mortars. From top to down, CEM III/B 32.5 N-LH/SR, CEM III/A 42.5 N, CEM II/A-S 42.5 N, and CEM I 52.5 R-SR 3 mortars.
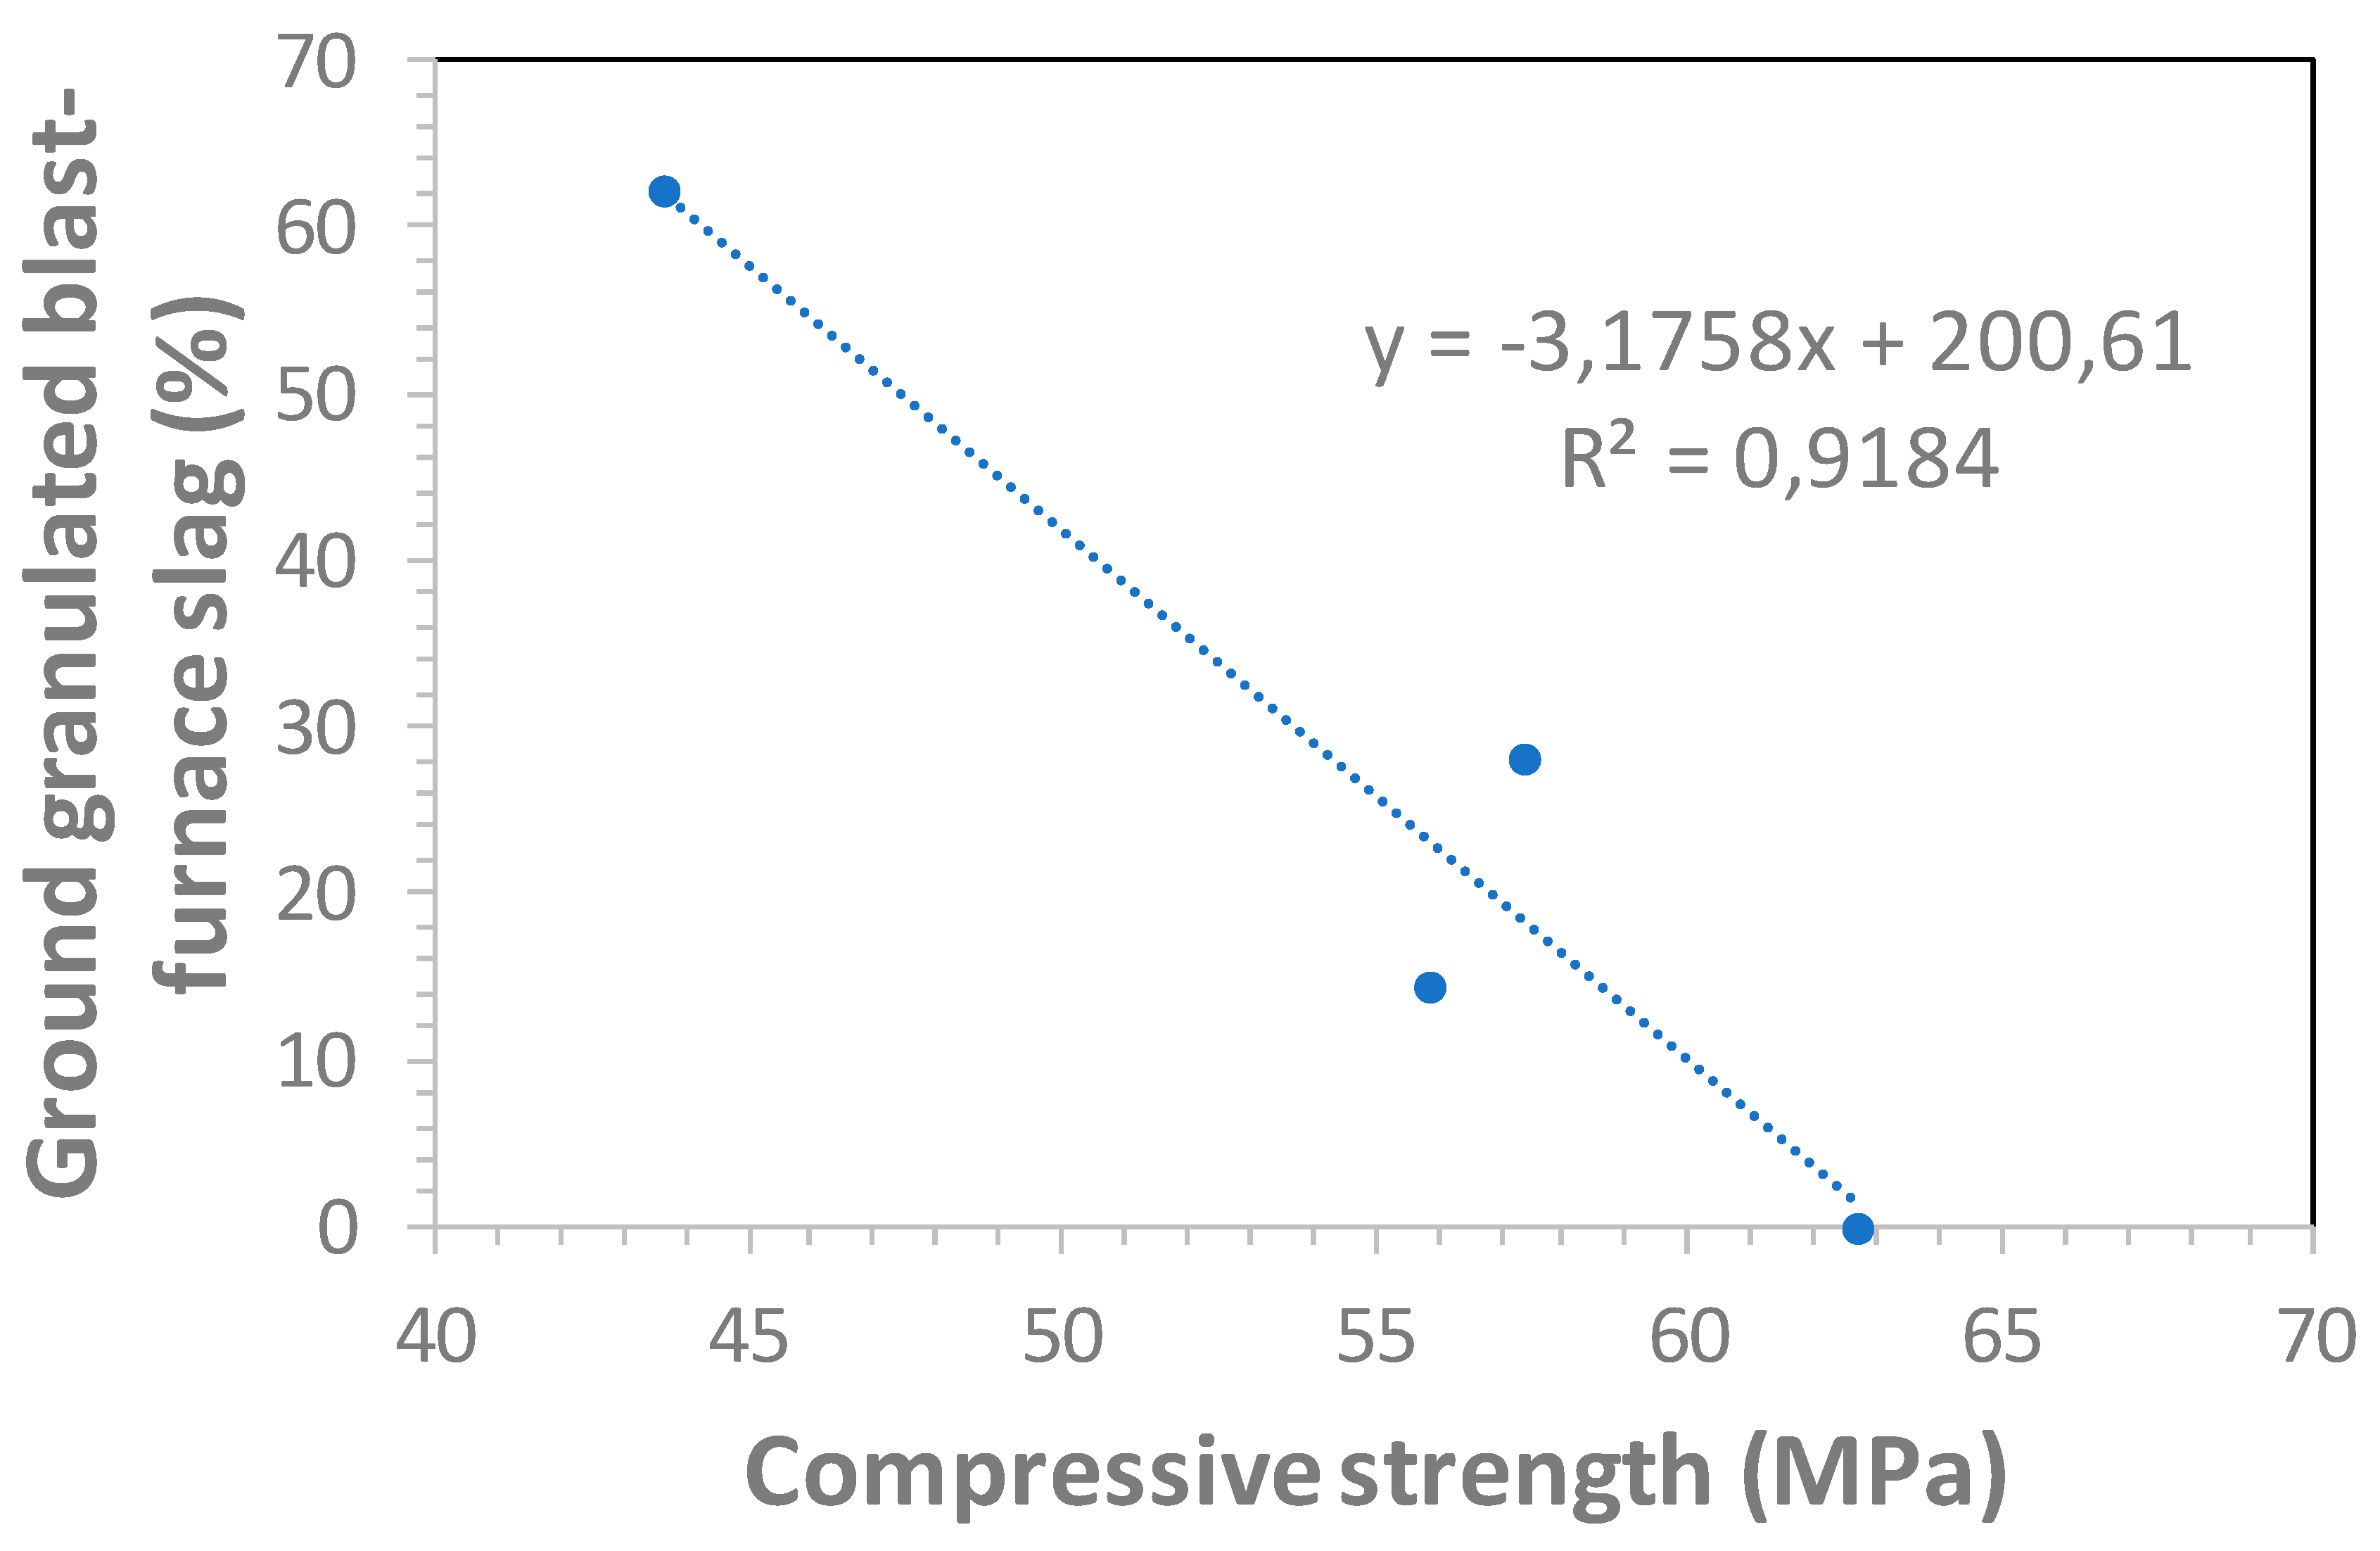
Figure 4.
Carbonation coefficient versus 28-day compressive strength relationship of mortars made with ground granulated blast-furnace slag and cured underwater for 0, 1, 3, 7, 14, or 28 days.
Figure 4.
Carbonation coefficient versus 28-day compressive strength relationship of mortars made with ground granulated blast-furnace slag and cured underwater for 0, 1, 3, 7, 14, or 28 days.

Figure 5.
Correction for the k-value for cement with GGBFS according to EN 16,757 [10] in comparison with the relative carbonation coefficient of mortars made with GGBFS (0, 14.4, 28.1, and 62.2%) and cured underwater for 28 days.
Figure 5.
Correction for the k-value for cement with GGBFS according to EN 16,757 [10] in comparison with the relative carbonation coefficient of mortars made with GGBFS (0, 14.4, 28.1, and 62.2%) and cured underwater for 28 days.


Table 1.
Chemical compositions of the cements.
| Cement | SiO2 | Al2O3 | Fe2O3 | CaO | MgO | SO3 | Na2O | K2O | LOI | IR 1 | Cl− |
|---|---|---|---|---|---|---|---|---|---|---|---|
| CEM I | 21.7 | 3.7 | 4.3 | 66.1 | 1.3 | 3.0 | 0.5 | 0.6 | 1.1 | 0.2 | 0.01 |
| CEM II/A-S | 23.2 | 5.7 | 2.5 | 61.8 | 2.3 | 2.8 | 0.5 | 0.6 | - | - | 0.05 |
| CEM III/A | 24.6 | 6.4 | 2.1 | 57.1 | 3.0 | 2.8 | 0.4 | 0.5 | 0.9 | 0.2 | 0.05 |
| CEM III/B | 29.7 | 8.1 | 2.2 | 51.1 | 4.8 | 2.5 | 0.3 | 0.4 | 0.8 | 0.4 | 0.05 |
1 Insoluble residue determined by the Na2CO3 method.
© 2019 by the authors. Licensee MDPI, Basel, Switzerland. This article is an open access article distributed under the terms and conditions of the Creative Commons Attribution (CC BY) license (http://creativecommons.org/licenses/by/4.0/).
Share and Cite
MDPI and ACS Style
Sanjuán, M.Á.; Estévez, E.; Argiz, C. Carbon Dioxide Absorption by Blast-Furnace Slag Mortars in Function of the Curing Intensity. Energies 2019, 12, 2346. https://doi.org/10.3390/en12122346
AMA Style
Sanjuán MÁ, Estévez E, Argiz C. Carbon Dioxide Absorption by Blast-Furnace Slag Mortars in Function of the Curing Intensity. Energies. 2019; 12(12):2346. https://doi.org/10.3390/en12122346
Chicago/Turabian StyleSanjuán, Miguel Ángel, Esteban Estévez, and Cristina Argiz. 2019. "Carbon Dioxide Absorption by Blast-Furnace Slag Mortars in Function of the Curing Intensity" Energies 12, no. 12: 2346. https://doi.org/10.3390/en12122346
Note that from the first issue of 2016, this journal uses article numbers instead of page numbers. See further details here.