1. Introduction
Methane hydrates are considered to be a potential source of clean energy. Gas hydrates are ice-like crystals, formed at low temperatures and in high-pressure conditions, having guest molecules of appropriate size and shape occupied inside water cages. Methane hydrate deposits are discovered in cold permafrost regions and deep ocean sediments [
1] and are considered a potential source of methane gas production. Traditional production methods, e.g., depressurization, thermal stimulation, and chemical injection, are considered unsafe due to the perceived danger of hydrate dissociation causing geo-mechanical instability and natural disasters. Recently, a novel technique comprised of carbon dioxide (CO
2) or CO
2 + nitrogen (N
2) gas mixture injection into methane hydrate was proposed to produce methane gas and sequestration of CO
2 at the same time without disturbing the geo-mechanical stability [
2]. This technology is still immature and there are many unknowns; for example, the reaction rate (kinetics), the stability of the mixed hydrates structures, structural changes, the recovery rate of methane, and the storage percentage of CO
2 are currently under investigation.
Results from laboratory-based experiments show different methane replacement percentages. Consistently lower methane recovery percentages have been attributed to the mass-transfer barrier created on the outermost layer of methane hydrate due to the formation of CO
2 and mixed hydrates [
3]. Yoon et al. [
4] have further investigated this using Raman spectroscopy and concluded that contact between CH
4 hydrate and CO
2 molecules reduces over time due to a shielding effect caused by the outermost hydrate layer, which consists of the CO
2 hydrate that leads to rate decrease and the reaction to finally cease. Zhao et al. [
5] have described methane CH
4–CO
2 replacement as a two-step process. The first step, described as a surface-replacement reaction between hydrate layer and injected CO
2 rich gas, creating a layer of mixed CH
4–CO
2 hydrate, lasts for very short time. The second step, a diffusion-driven reaction, is responsible for CO
2 molecule diffusion through methane hydrate and CO
2 hydrates and is considered as a rate-determining step. Many of the early studies on CH
4–CO
2 replacement dealt with bulk methane hydrate samples placed in contact with liquid or gaseous CO
2. McGrail et al. [
6] have conducted the CH
4–CO
2 replacement in a high-pressure cell using powered CH
4 hydrate and found the replacement to be rapid during the first 200 min. In another experiment, Hauge et al. [
7] calculated the CO
2 penetration rate into bulk hydrate as 0.55 mm/h at 2.5 °C. The probabilistic nature of the morphology of gas hydrate depends on many factors, such as apparatus design, experimental procedure, isolation of experimental setup from surroundings, impurities in the gas or bulk sample, and type and composition of injected gas [
1].
Laboratory-scale experiments to investigate CH
4–CO
2 replacement reaction are long and tedious and start with the formation of artificial methane hydrate. Hydrate formation is a stochastic phenomenon and the onset of nucleation time to form hydrate depends on the method and the medium used; therefore, in general, they do not show reproducibility. Researchers have used different methods and media to form methane hydrate at a laboratory scale, including porous media, bulk water and a dispersed medium that results in a different mass-transfer scenario, different methane stability pressure, and growth kinetics. This initial difference in methane hydrate formation also affects the methane recovery potential during the CH
4–CO
2 replacement reaction. Methane hydrate and further CH
4–CO
2 replacement in bulk medium formation using bulk water is considered to be the most difficult and results in lower recovery due to the absence of a mineral surface [
8]. Researchers added silica particles to accelerate the methane hydrate formation using bulk water. In this work, we used sodium dodecyl sulfate (SDS) in low concentrations to accelerate the methane hydrate formation; there is a necessity to study the effect of SDS on CH
4–CO
2 exchange under the chemical technique.
SDS is a well-known kinetic hydrate promoter that can enhance the hydrate formation rate both for CH
4 [
9] and CO
2 hydrates [
10]. It reduces hydrate nucleation induction time, enhances the hydrate growth rate, and maximizes the water-to-hydrate conversion efficiency [
8] by creating the porous hydrate that allows for improved diffusion between liquid and gas and results in enhanced liquid-to-hydrate conversion. Thermal conductivity experiments of SDS-based methane hydrate formation also confirm the presence of porous gas hydrate as reflected by very low thermal conductivity [
11]. SDS concentrations of 300–1000 ppm have been suggested as optimum concentrations to maximize the hydrate growth [
12]. Higher concentrations above the optimal amount lead to excess foam formation that can be disadvantageous and need to be avoided. This can be done by using an antifoam agent along with SDS. SDS performance in the presence of an anti-foam agent has been studied by Pandey et al. [
13]. It is suggested that SDS should be used in such low concentrations that it neither occupies the hydrate cages nor affects the temperature and pressure conditions of hydrate formation; hence, the presence of SDS is expected to not affect the driving force and thermodynamics between CH
4–CO
2 replacements. Research on SDS has mainly focused on hydrate promoters for potential applications in natural gas storage and transportation. Using SDS to form methane hydrate also increases the surface area compared to water [
14]. Until now, only a few studies have focused on CH
4–CO
2 replacement in the presence of SDS. Zhou et al. [
15,
16] used SDS for hydrate formation in quartz sand and observed the enhanced replacement rate while injecting CO
2 emulsions. Using surfactants, such as SDS, may become a method for shortening methane hydrate formation and further studying the CH
4–CO
2 exchange in the presence of SDS could be advantageous to understand surfactant presence on CH
4–CO
2 exchange.
Depressurization is the most studied method to produce methane from gas hydrate deposits by reducing the pressure below its stability pressure, creating enhanced diffusion pathways and by dissociating the methane hydrates [
17,
18,
19,
20]. Depressurization or pressure drop is the pressure decrease induced by the field operator. It is considered an effective method, yet risky due to the risk of geo-mechanical instability and excess sand and water production. Controlled depressurization followed by CO
2-rich gas injection could act as a potential method to improve the mass transfer of CO
2 gas molecules by enhancing diffusion pathways inside the methane hydrate. The combined approach could have the potential to overcome an individual shortcoming in depressurization and CO
2 replacement. Studies based on temperature-assisted CH
4–CO
2 replacement have also been carried out [
21,
22]. Zhao et al. [
23] studied the combined method using a high-pressure vessel and confirmed that the depressurization-assisted CH
4–CO
2 replacement produces higher methane percentages than the CO
2 replacement reaction. However, there are not enough studies currently available to understand the effect of different parameters, including the degree of pressure reduction, the risk of water production, the role of injected CO
2-rich gases in a combined method, the stability of mixed hydrates, and dominating mechanisms between depressurization and CO
2 replacement in a combined approach.
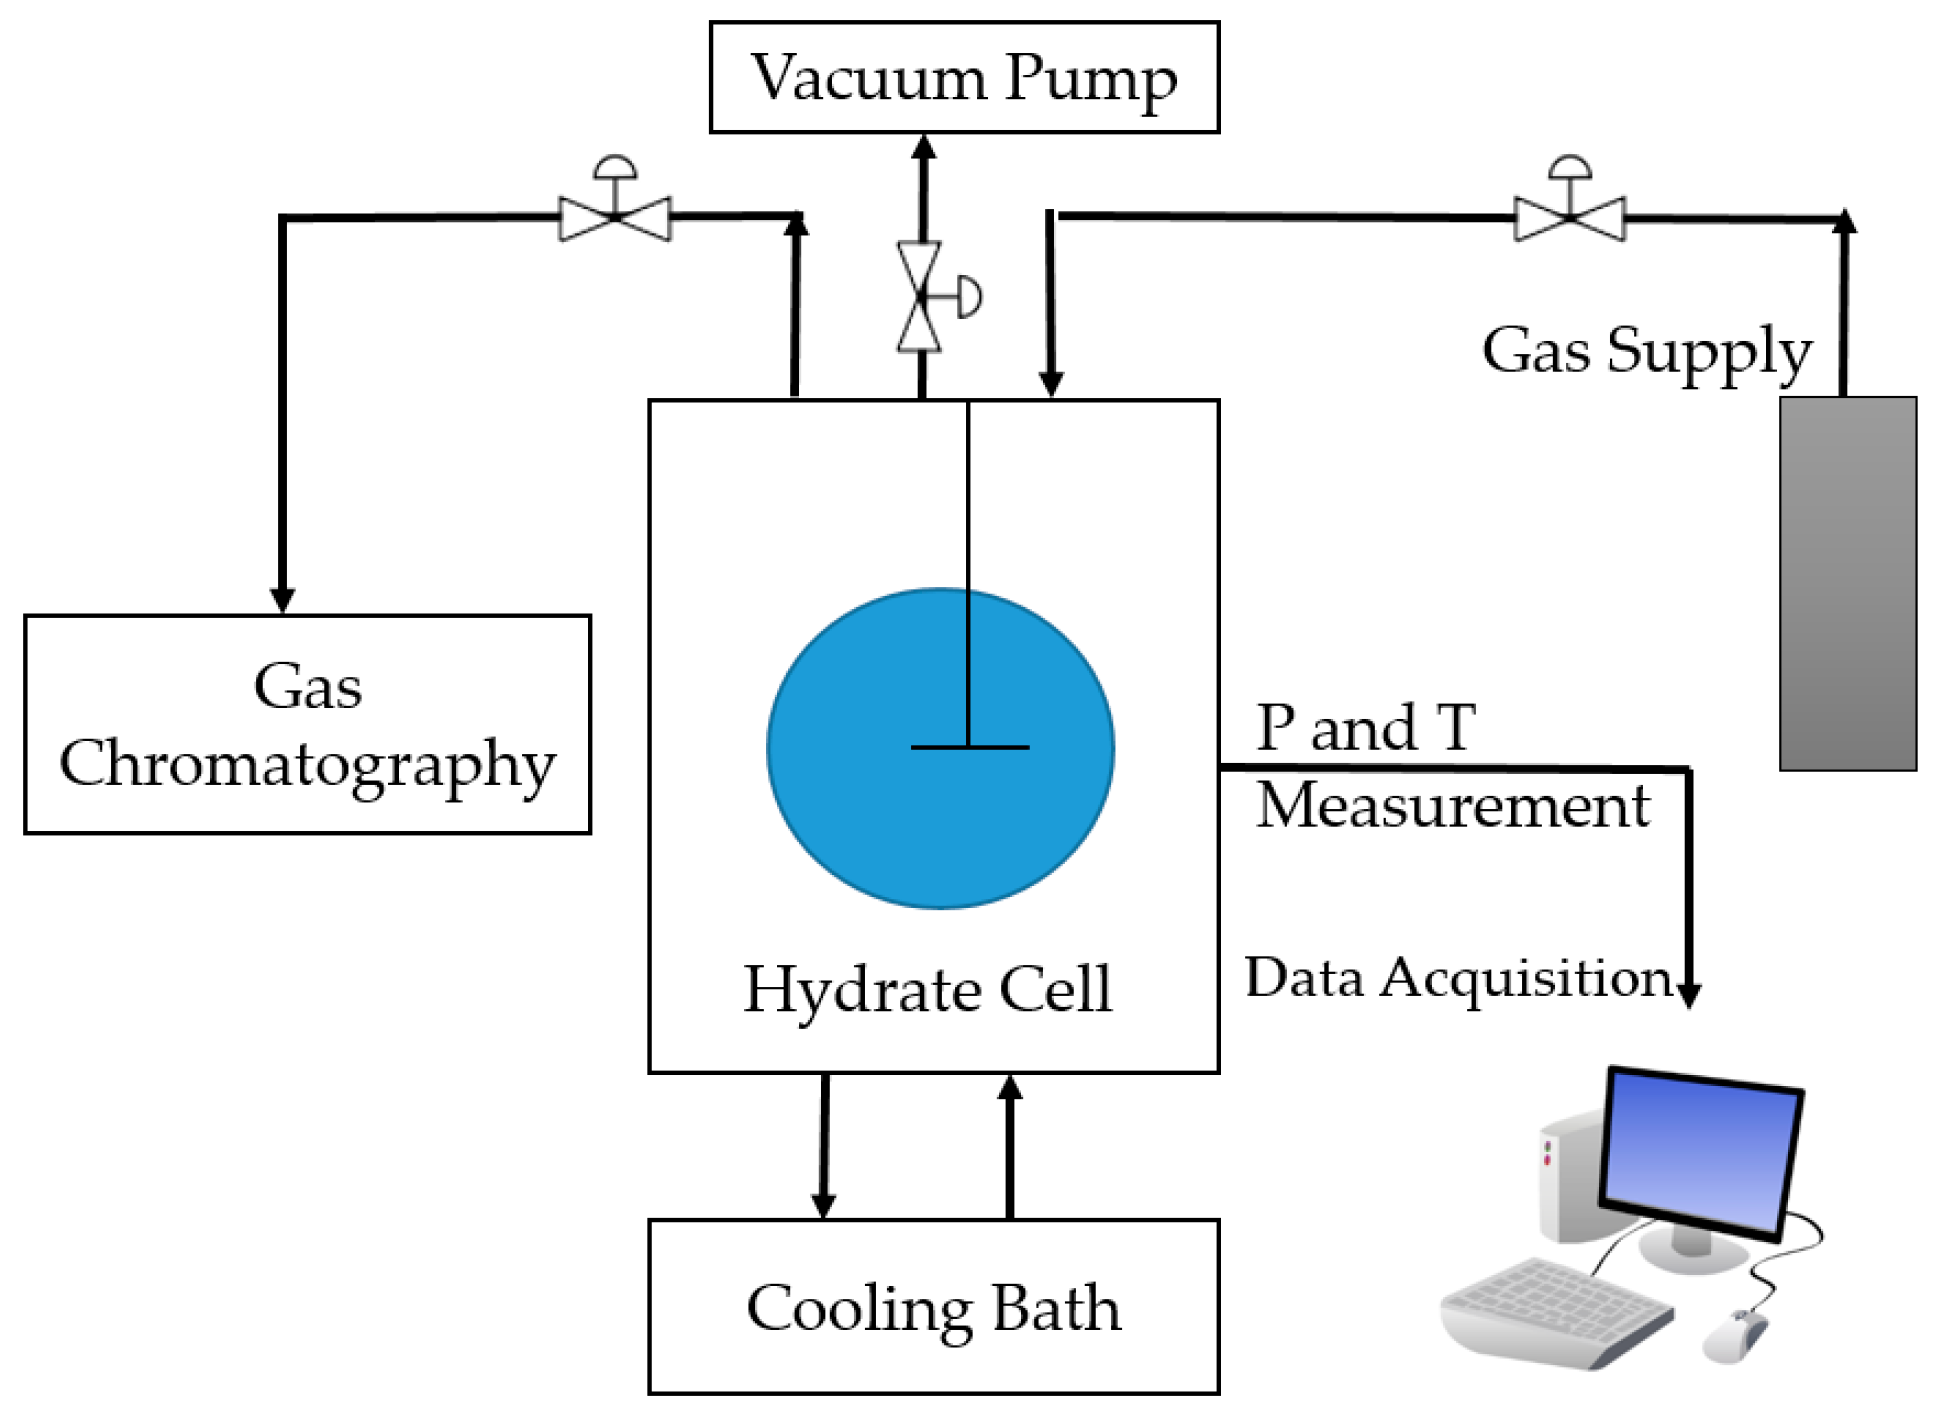
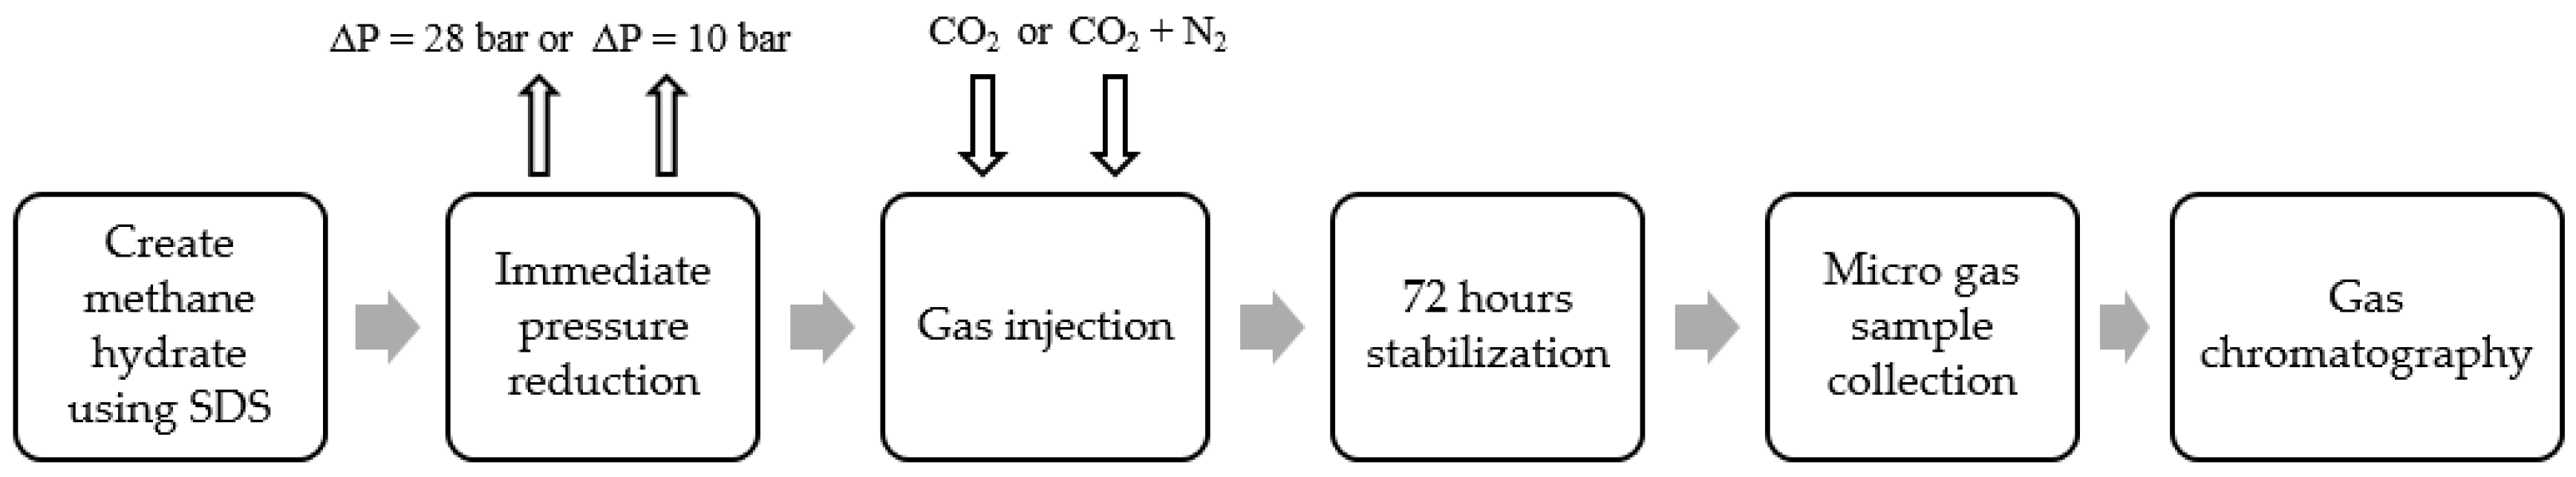
In this work, a high-pressure cell is used to form artificial methane hydrate using 500 ppm SDS solution to shorten the methane hydrate formation time and to improve the mass transfer process during CH4–CO2 exchange. To study the effect of the mechanical technique to improve mass transfer, immediate pressure reduction (IPR), followed by CO2-rich gas injection using the huff-and-puff production technique is applied and a combined method of pressure reduction and CH4–CO2 replacement is applied. CH4 recovery, mixed hydrate stability, and risk of water production are investigated. The key parameter varied is the amount of pressure reduction in the form of IPR, injection pressure, and CO2 gas concentration in the CO2-rich gas mixture. Additionally, the effect of an increase in SDS concentration on CH4 recovery is studied. Change in morphology during the whole reaction is also recorded to investigate the risk of water produced during the process.
3. Results and Discussion
In this study, the combined technique is studied using immediate pressure reduction (IPR), followed by the injection of CO
2-enriched gas at various injection pressures. Injection and production using same well is the well-known huff-and-puff method. CO
2 injection and production from shale reservoirs using the huff-and-puff method have been studied extensively [
26]. The current work is one of the first studies in which pressure reduction and the huff-and-puff technique combination have been used to study CH
4–CO
2 exchange. Different degrees of pressure reduction by mechanical means stand to improve diffusion channels during the CH
4–CO
2 exchange. For chemical improvement, methane hydrate is formed using different SDS concentrations and CH
4–CO
2 exchange has been studied while keeping other parameters constant. Both qualitative and quantitative analyses are performed to study the effect of different degrees of IPR, type of gas injection on the stability of mixed gas hydrates, methane recovery efficiency, and risk of water production. There are a total of 14 experimental runs and progress that can be explained in five different steps, M
1–M
5, as highlighted in
Table 2. Step M
1 includes SDS nucleation, which refers to the first microscopic detection of hydrate formation. Nucleation starts after methane dissolves into the bulk SDS solution. Step M
2 is about the rapid hydrate formation period. Hydrate nucleation and growth theories have been discussed elsewhere [
27]. Step M
3 describes the period of stabilization where pressure and temperature achieve constant values within certain hours. In our experiments, it is evident from the results that M
1 + M
2 last for 2–6 h, consistently. This period is dependent on the operating pressure. The higher the operating pressure, the higher the driving force and the shorter the hydrate formation period [
27]. Sub-cooling (Δ
T) is the most often used term to define the driving force for hydrate formation and is given by the formula Δ
T =
Teq −
Texp, where
Teq is the equilibrium temperature and
Texp is the experimental temperature, such that
Texp <
Teq. Presence of SDS provides the certainty within the hydrate formation period, showing reproducibility in terms of achieving the final methane hydrate stability pressure and creating similar initial conditions before IPR implementation. Further, the total time for M
1 + M
2 + M
3 is approximately 18–24 h. Stage M
4 includes IPR followed by gas injection. The total duration for IPR and gas injection lasts for a few minutes. Stage M
5 lasts for approximately 72 h to allow CH
4–CO
2 replacement.
Table 3 summarizes the methane hydrate formation in the presence of SDS in all 14 experimental runs. Methane hydrate saturation varies from 58–61% and water conversion to hydrate (C
wh%) varies from 52–55%.
Pstability is the methane hydrate stability pressure at the end of M
1 + M
2 + M
3. P
1 is the initial operating methane pressure,
Pstability is the pressure inside cell after methane hydrate formation, and
nCH4, H is the moles of methane trapped in hydrate.
CSDSH% is the percentage of SDS solution converted into methane hydrate. Based on IPR, runs 1–5 are in set S1 and runs 6–14 are in set S2, as previously shown in
Table 3.
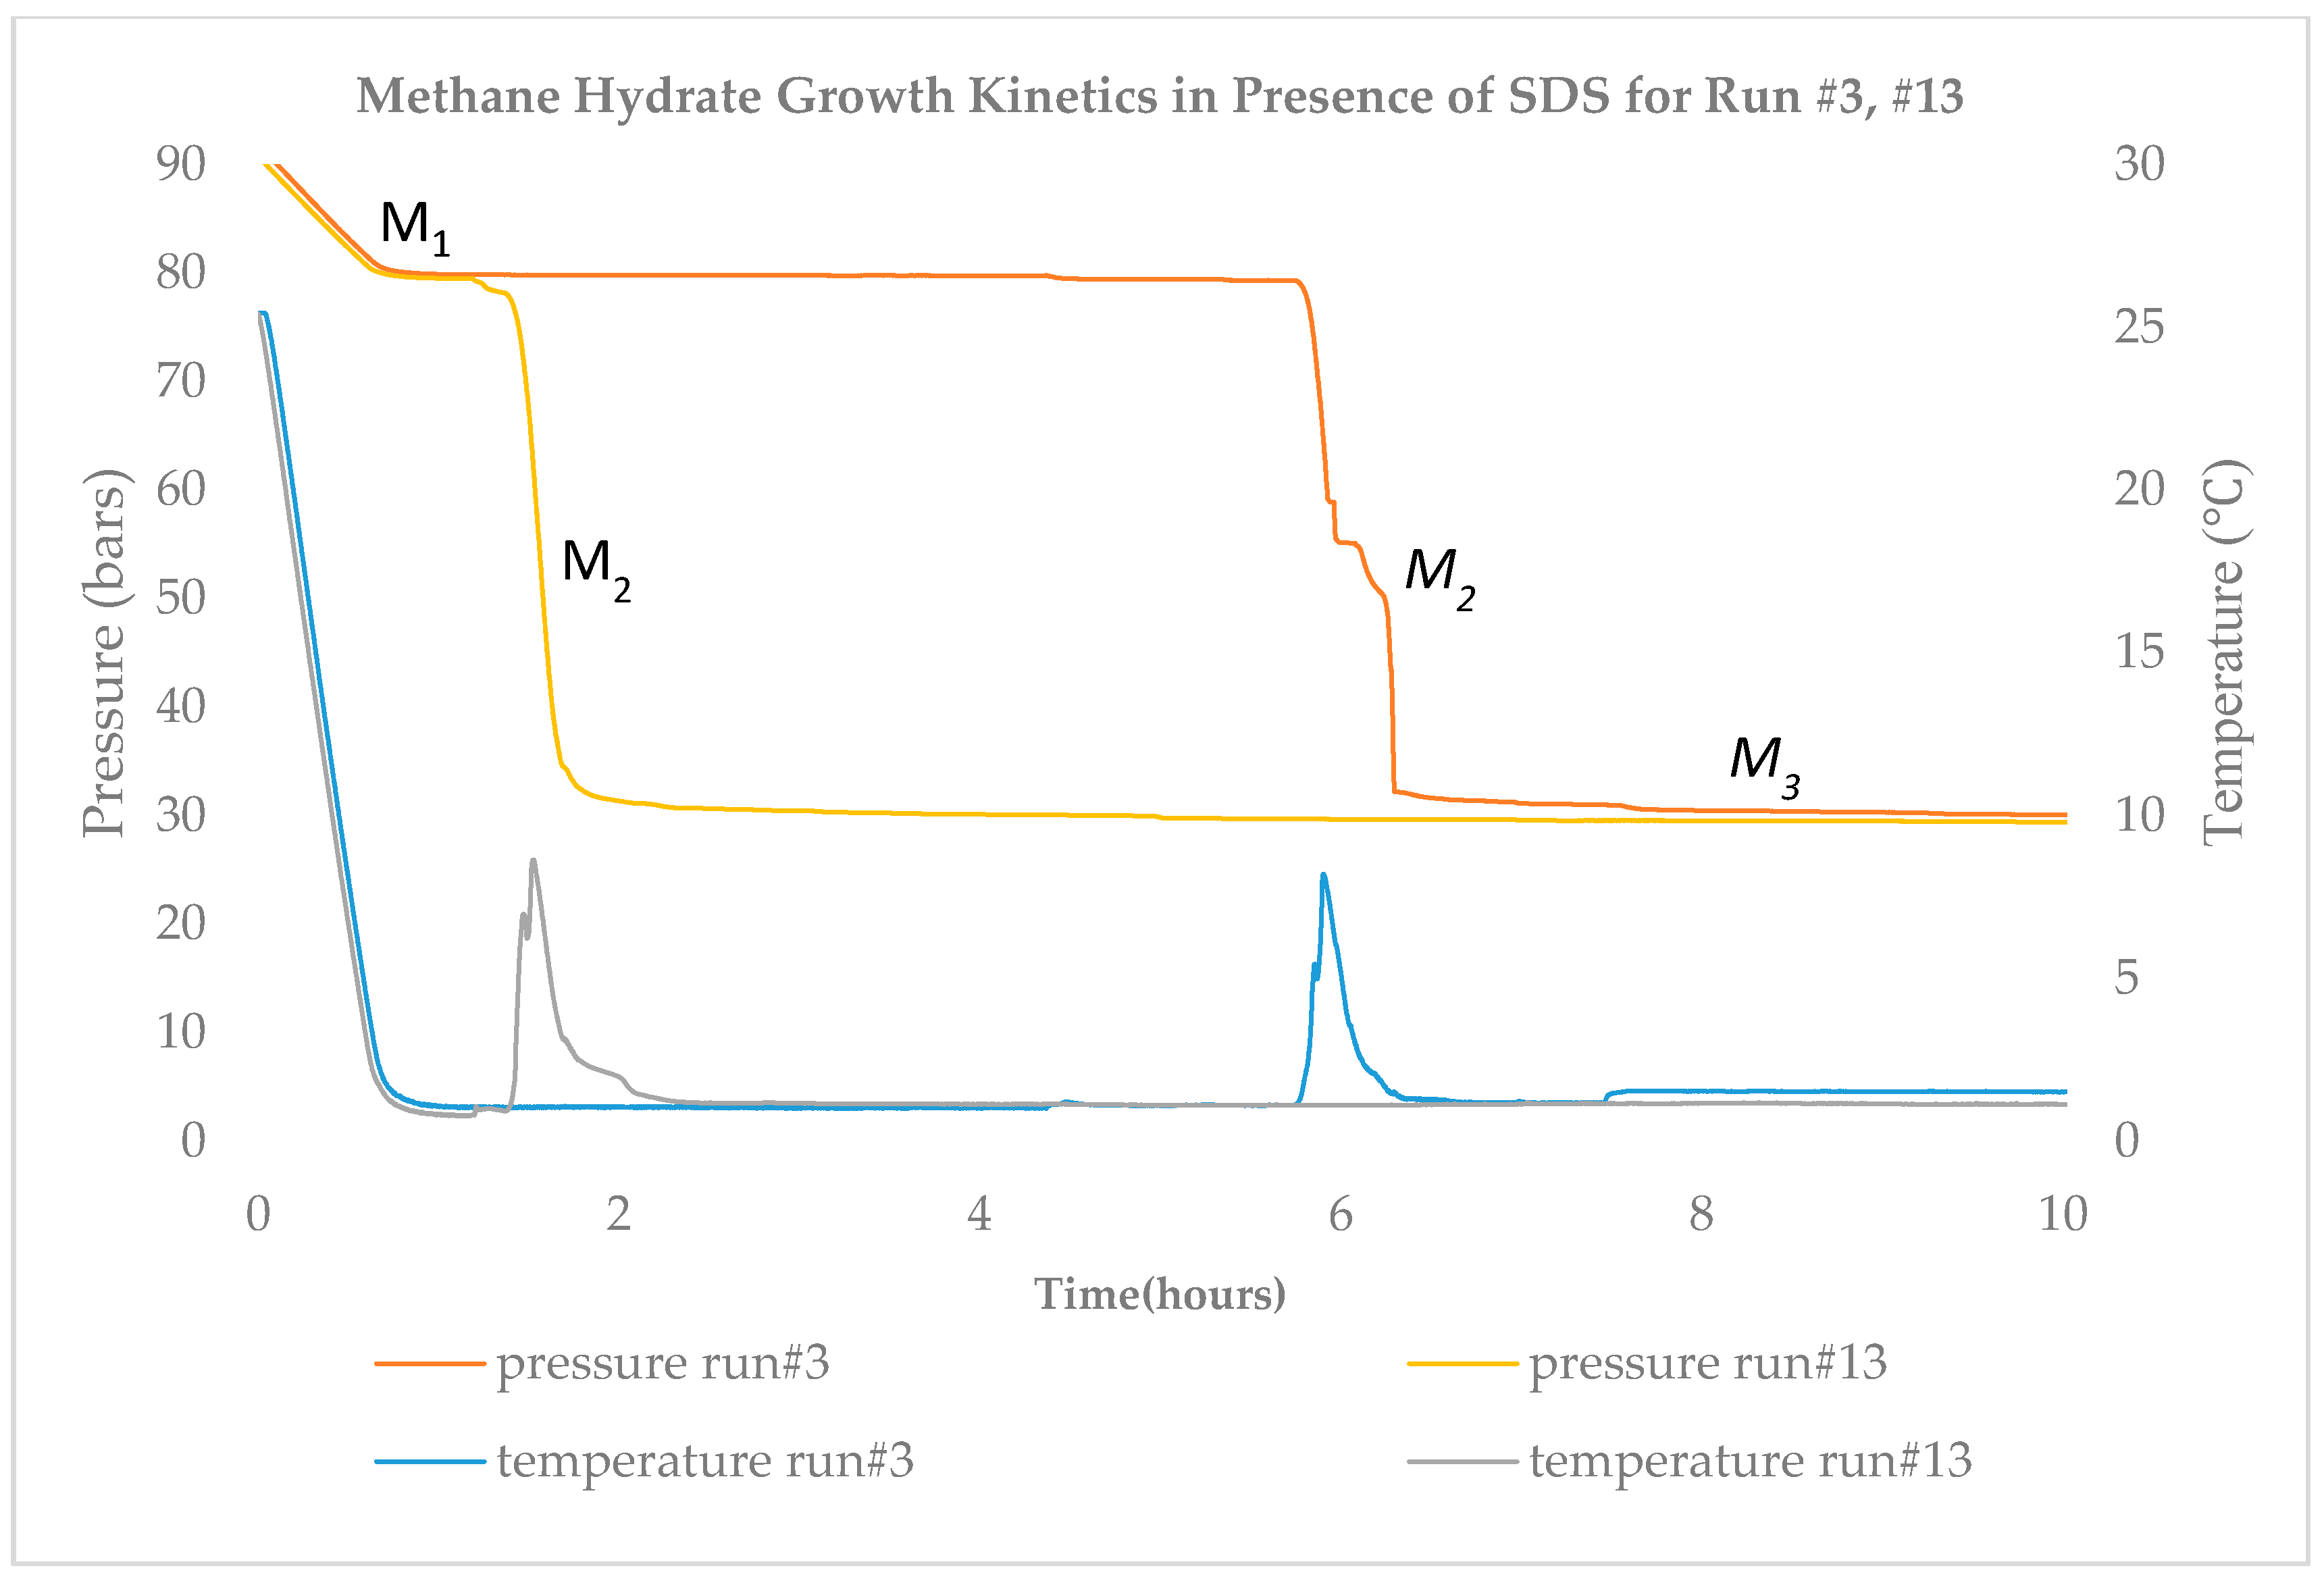
Figure 3 describes the P–T variation up to 10 h for two runs, #3 and #13. Run #3 is from set S1 and run #13 is from set S2. Run #3 has a longer nucleation time compared to run #13. This could be due to the presence of air with methane inside the high-pressure cell. With the rest of the runs, we achieve nucleation within 2 h consistently.
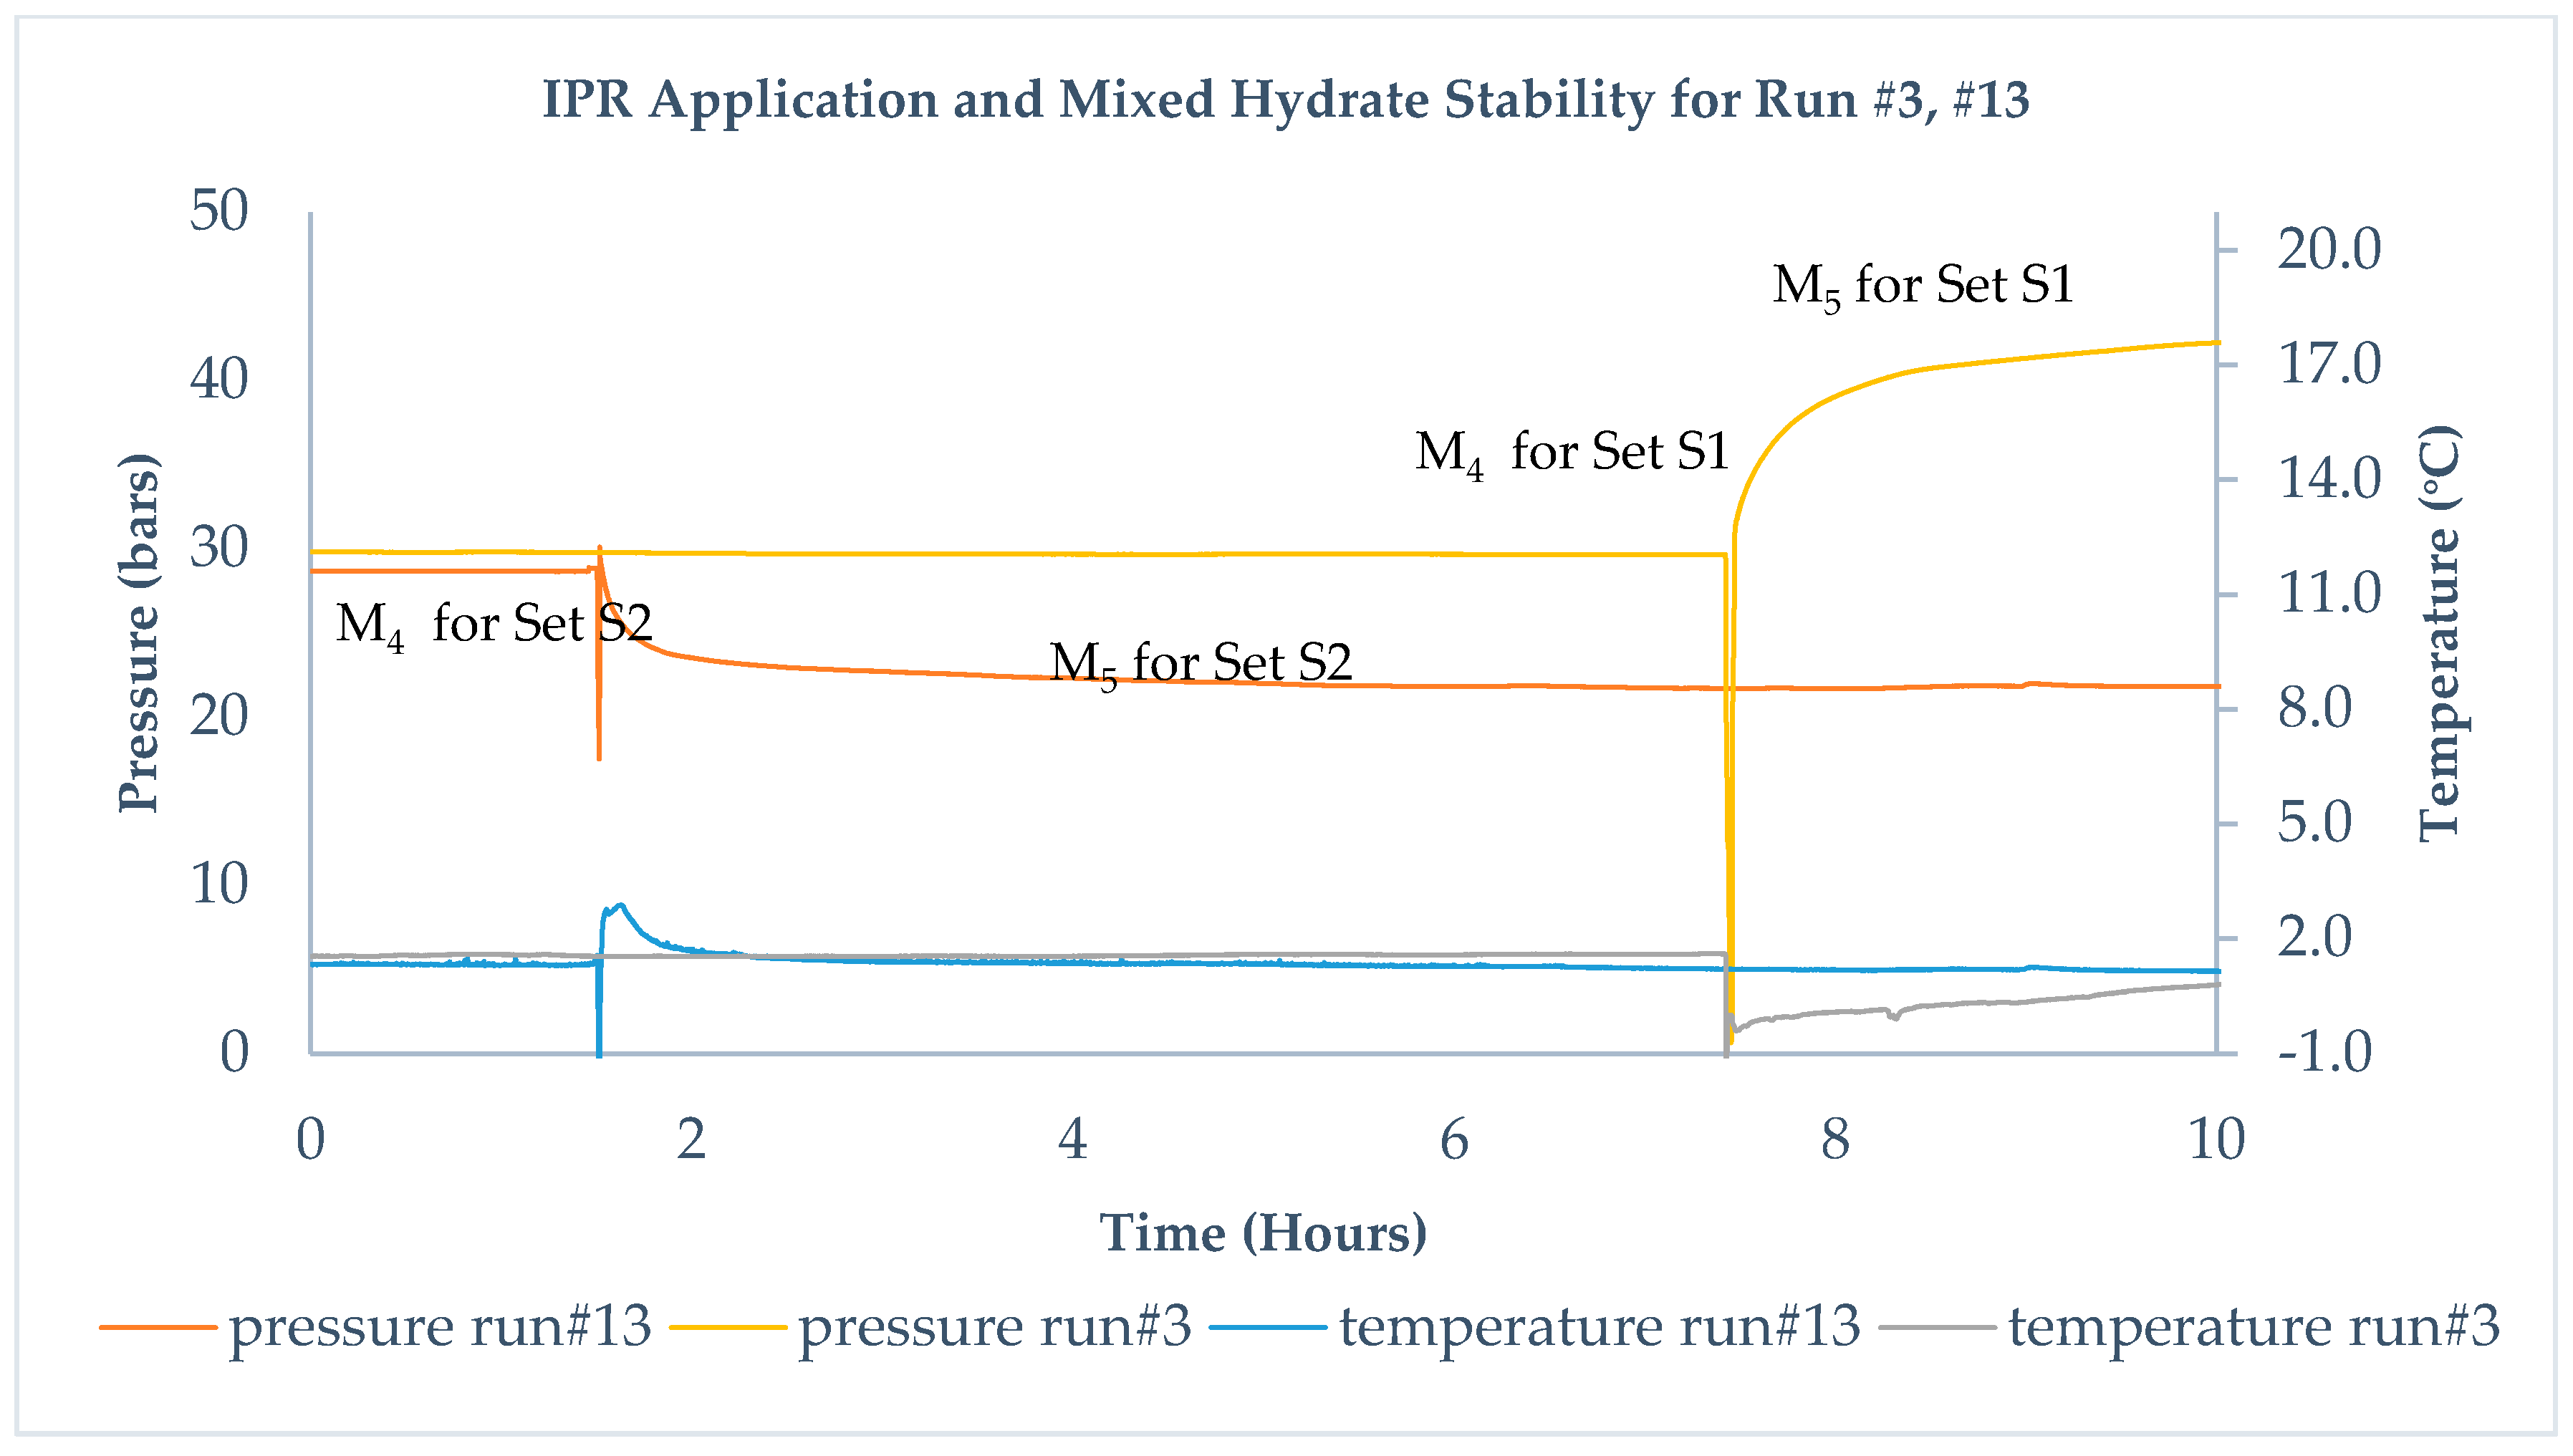
Figure 4 describes the M
4 and M
5 steps in set S1 and set S2. To differentiate S1 from S2, experiments are put in different timelines but with similar initial conditions before IPR is applied. In set S1, which includes runs 1–5, methane gas above methane hydrate vented quickly before injecting CO
2-rich gas at different injection pressures. State M
5 after injecting corresponds to an exchange between CH
4–CO
2 and leads to stabilization of pressure within 72 h. During M
4 in set S1, water production is observed while venting out the gas, which suggests that pressure reduction leads to dissociation of the hydrate and thus release of gas and water. Run #3 in set S1 corresponds to injection of CO
2 + N
2 gas mixture; therefore, during the replacement, mixed hydrate stability pressure moves to a higher value compared to initial methane hydrate stability pressure and suggests that replacement took place.
Run #13 is from set S2 and corresponds to IPR equal to about 10 bars followed by injection of CO
2 gas. CO
2 injection leads to a lower stability pressure than the methane hydrate pressure, which indicates that replacement took place. This is reflected as M
4 for set S2 and M
5 in
Figure 4. IPR under set S2 leads to the breaking of hydrogen bonds between water molecules forming the cages, moving methane hydrate into a metastable state. It does not produce water, as observed during the venting out of methane before CO
2 injection, whereas a higher degree of IPR under set S1 initiates dissociation and is responsible for the production of water. Two different IPRs lead to two states of methane hydrate before the injection of CO
2 –rich gas. For IPR in S1, dissociation dominates, while for IPR in S2, the metastable state and breaking of hydrogen bonds dominates. IPR is believed to improve the sample permeability and add additional diffusion channels, supporting the enhanced mass transfer for CO
2 molecules [
19] and could be considered as a mechanical means to improve diffusion channels.
3.1. SDS-Based Methane Hydrate Formation
The summary based on Kumar et al. [
12] suggests that SDS is one of the best hydrate promoters in the surfactant category and its performance can be further enhanced if mixed with another chemical, such as tetrahydrofuran (THF). SDS has distinctive two-stage growth kinetics differentiated by a sudden spike in temperature, as shown in
Figure 3. The sharp temperature rise indicates the two distinct hydrate growth phases with a short duration in the first stage, followed by a significantly faster rate of hydrate formation in the second stage. In general, gas hydrate formation kinetics are very probabilistic and dependent on factors such as apparatus design, experimental procedure, reactor wall, driving force, and impurities in the sample [
1].
Ganji et al. [
28] have compared different surfactants on methane hydrate formation rate, stability, and storage capacity. Application of SDS for methane hydrate formation would lead to certainty in the hydrate formation without affecting the thermodynamics of methane hydrate. Due to the presence of SDS in the system, similar initial conditions have been achieved in all 14 runs before the instant pressure reduction.
Linga et al. [
29] suggested that nucleation and growth of the hydrate are not only dependent on the operating pressure and concentration of the hydrate promoter but also on the design of the reactor. The authors of this paper believe that reactor design also influences the methane recovery as a wide range of methane recovery percentages are reported using bulk media with the HPC in literature.
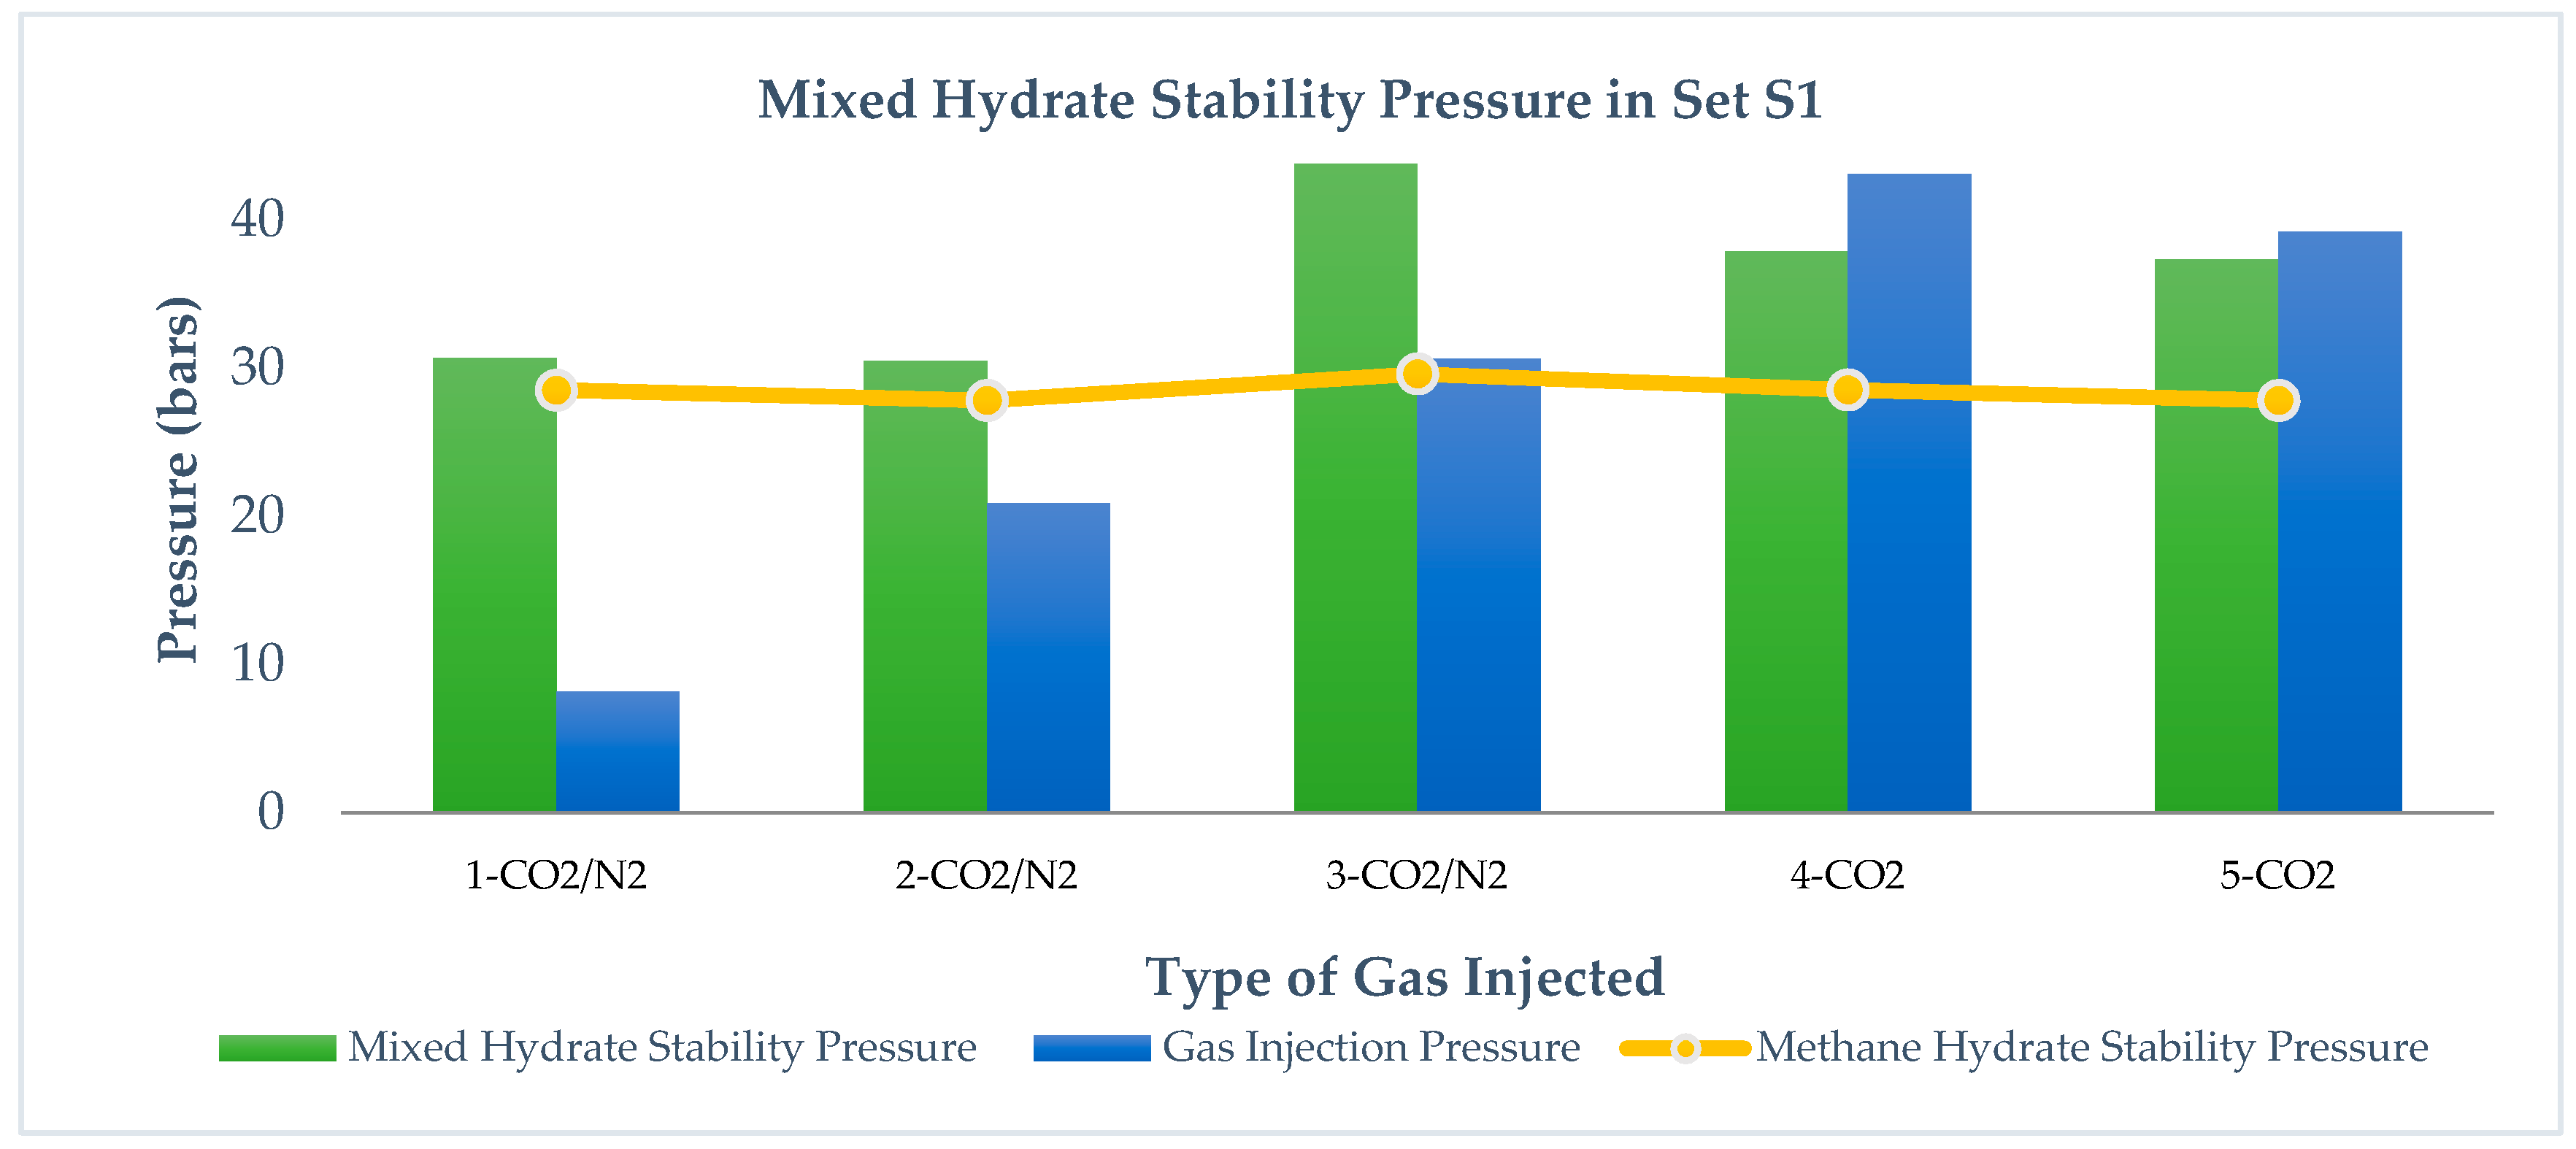
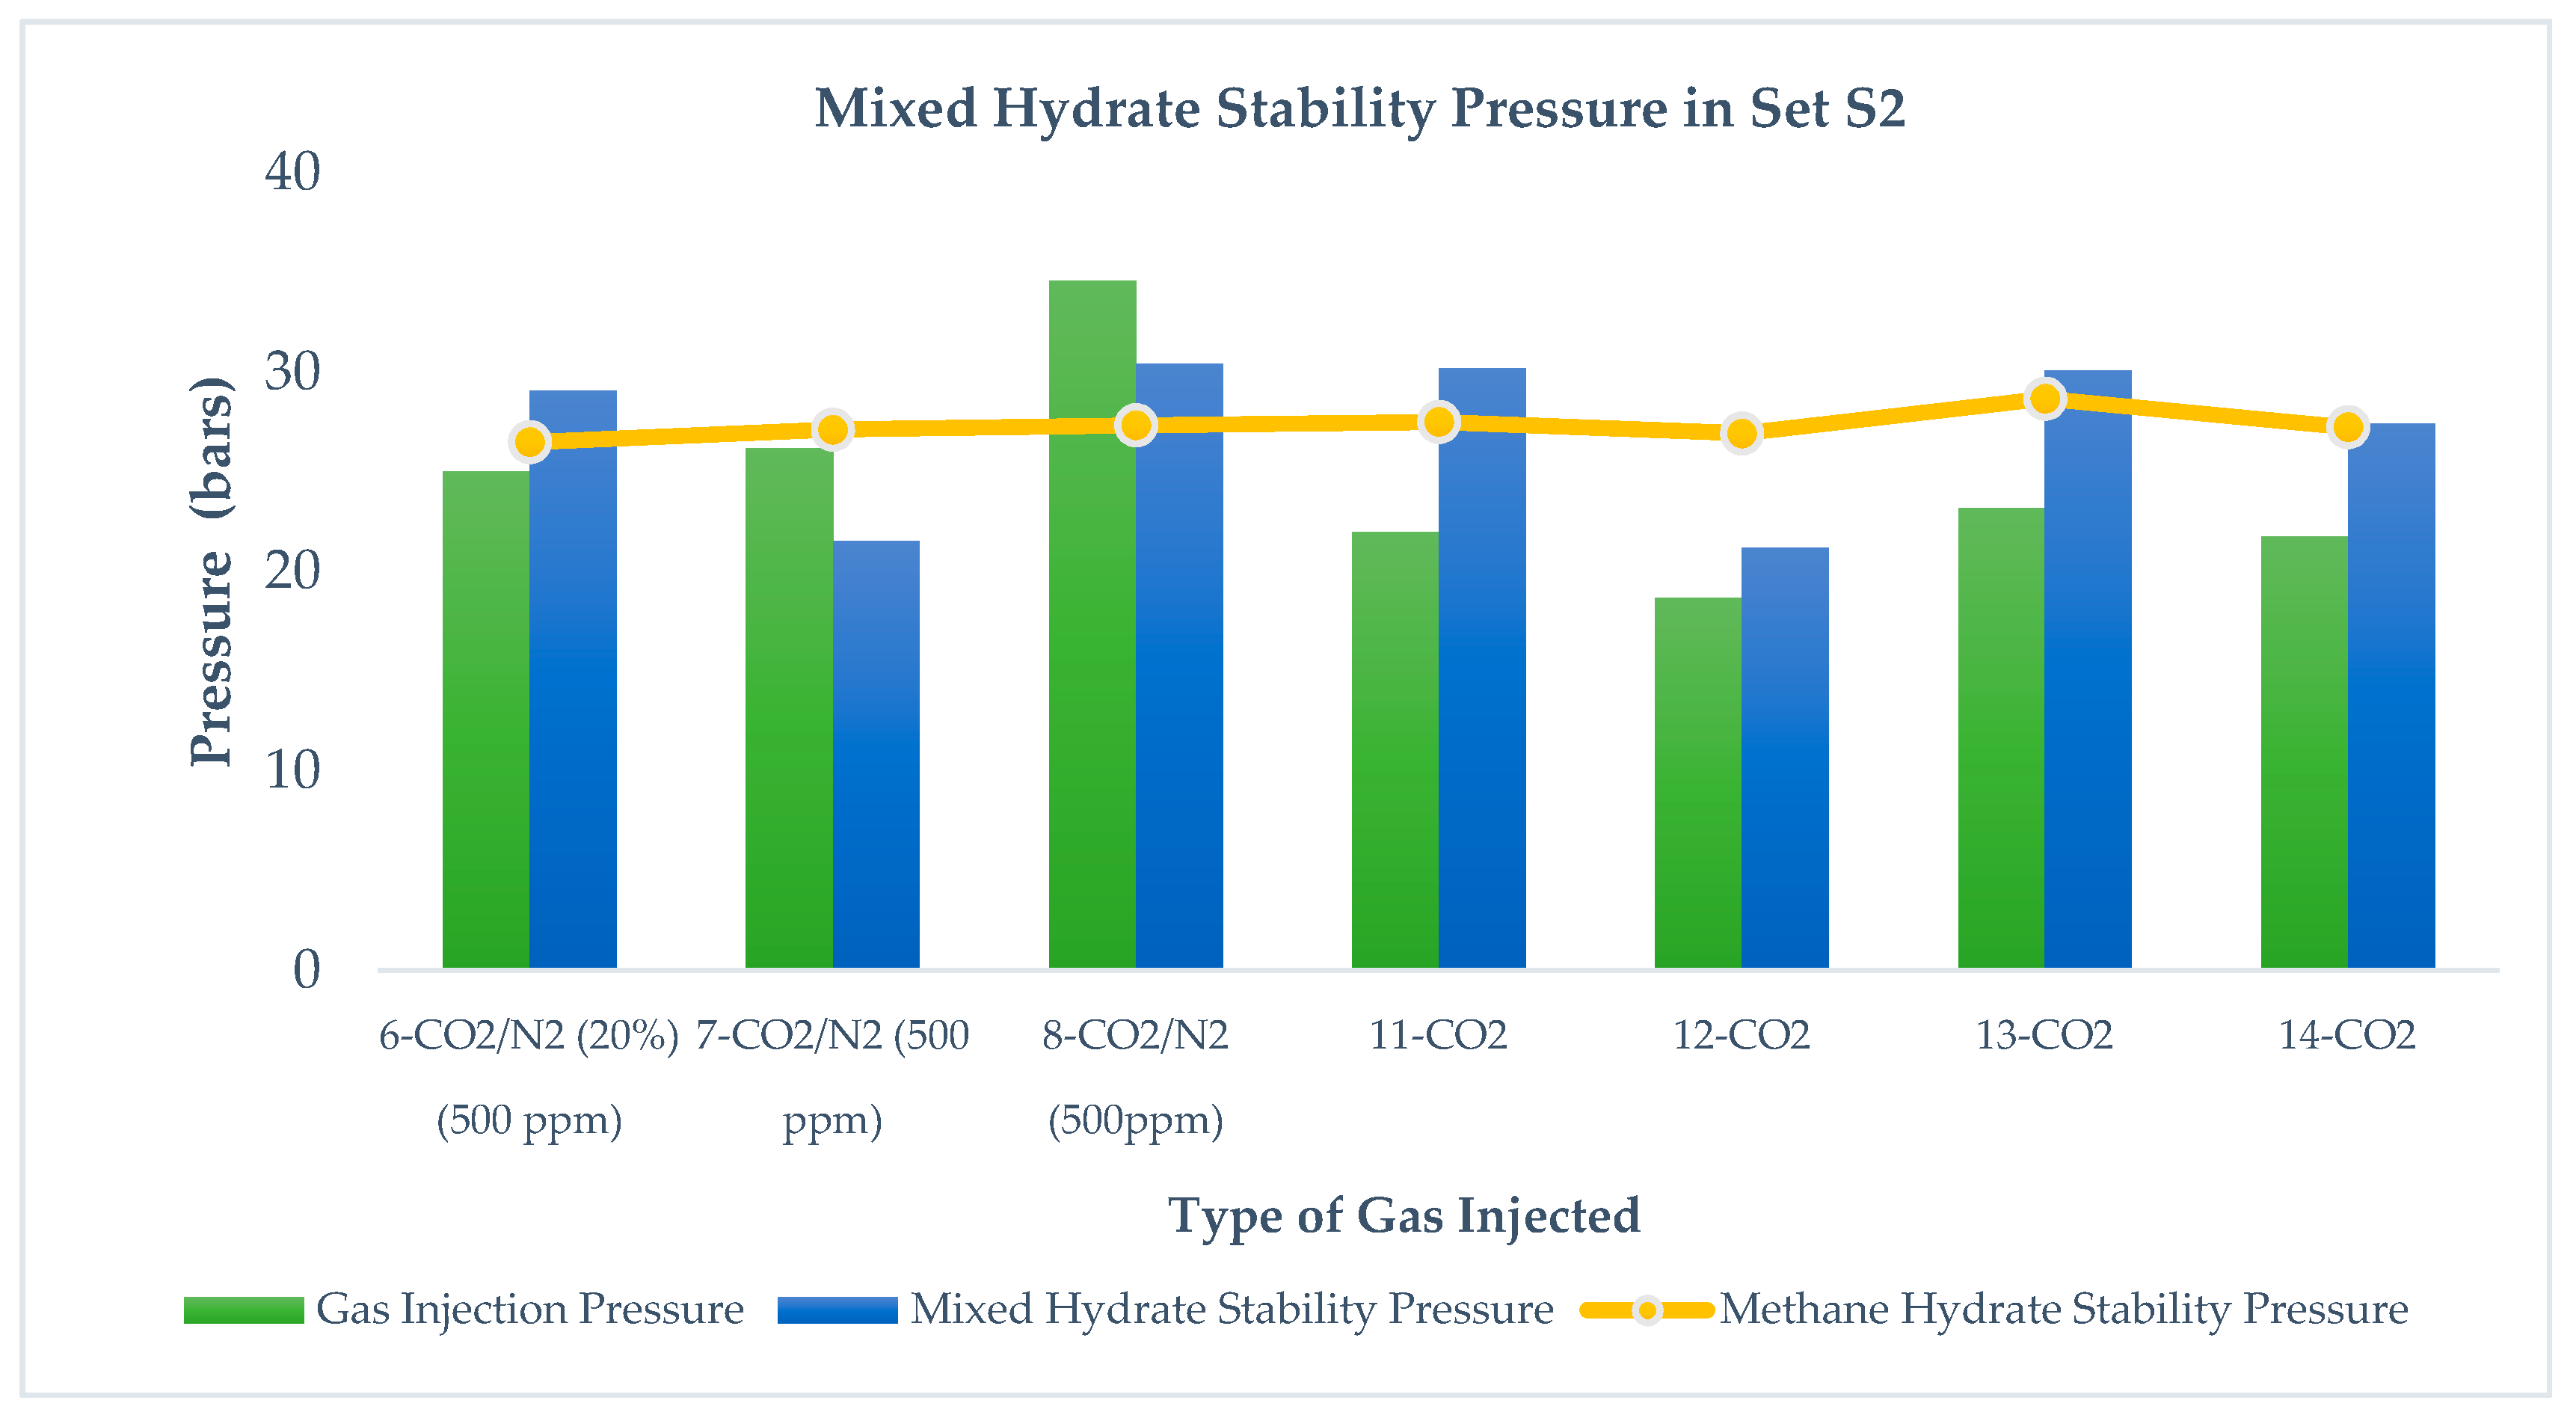
3.2. Mixed Hydrate Stability Pressure
Table 4 summarizes the mixed hydrate stability pressure in all experimental runs in both sets. P
3 is the pressure after IPR applied,
Pinj is the injection pressure of CO
2 rich gas, and
Pf is the pressure recorded at the end of replacement reaction which corresponds to mixed hydrate stability pressure. Hydrate stability pressure is an indicator of thermodynamic stability achieved by a hydrate at a given temperature. Hydrate replacement experiments are performed at constant temperature conditions in which, before and after gas injection, hydrate stability pressure changes due to a replacement reaction. Therefore, it is a matter of interest for us to understand whether CO
2 and CO
2 + N
2 gas injection can lead to higher or lower stability pressures than the methane hydrate stability pressure.
Figure 5 and
Figure 6 show the mixed hydrate stability in sets S1 and S2 after injecting CO
2-rich gases at different injection pressures.
From runs 1, 2, and 3 in set S1 and runs 7 and 8 in set S2, we observe that Pf (mixed hydrate) > PInjection (CO2 + N2), whereas in runs 4 and 5 in set S1 and runs 11, 12, 13, and 14 in set S2, Pf (mixed hydrates) < PInjection (CO2). It is evident from the results that CO2 injection leads to lower stability pressure than gas injection pressure, while CO2 + N2 injection leads to higher mixed hydrate pressure than injection pressure. Pinj is pressure induced by injecting CO2-rich gases while Pf is the measured pressure after the replacement reaction. This relationship is independent of pressure reduction in S1 and S2 as well as the range of pressure injection below and above the methane stability pressure. This is because the mixed hydrate stability pressure is mostly affected by the injected gas thermodynamics and its difference in methane hydrate thermodynamics. Addition of N2 into the CO2 leads to higher stability pressure of the gas mixture because N2 converts into hydrate at a higher pressure and thus the thermodynamic force between CH4 and CO2 reduces due to the presence of N2 in CO2. Run 6 in S2 shows that, by increasing CO2 content in the gas mixture, a lower stability pressure can be achieved than the injected gas pressure. Even at the same injection pressure in runs 8 and 11 in S2, CO2 leads to a more stable hydrate pressure compared to CO2 + N2.
Comparing runs 11, 12, 13, and 14 in S2, it is also observed that Pf mixed hydrate (after CO2 injection) < PCH4 (independent of a range of injection pressure), which means in S2, CO2 injection leads to a more stable hydrate than methane hydrate. However, a similar observation is not found valid after CO2 + N2 injection.
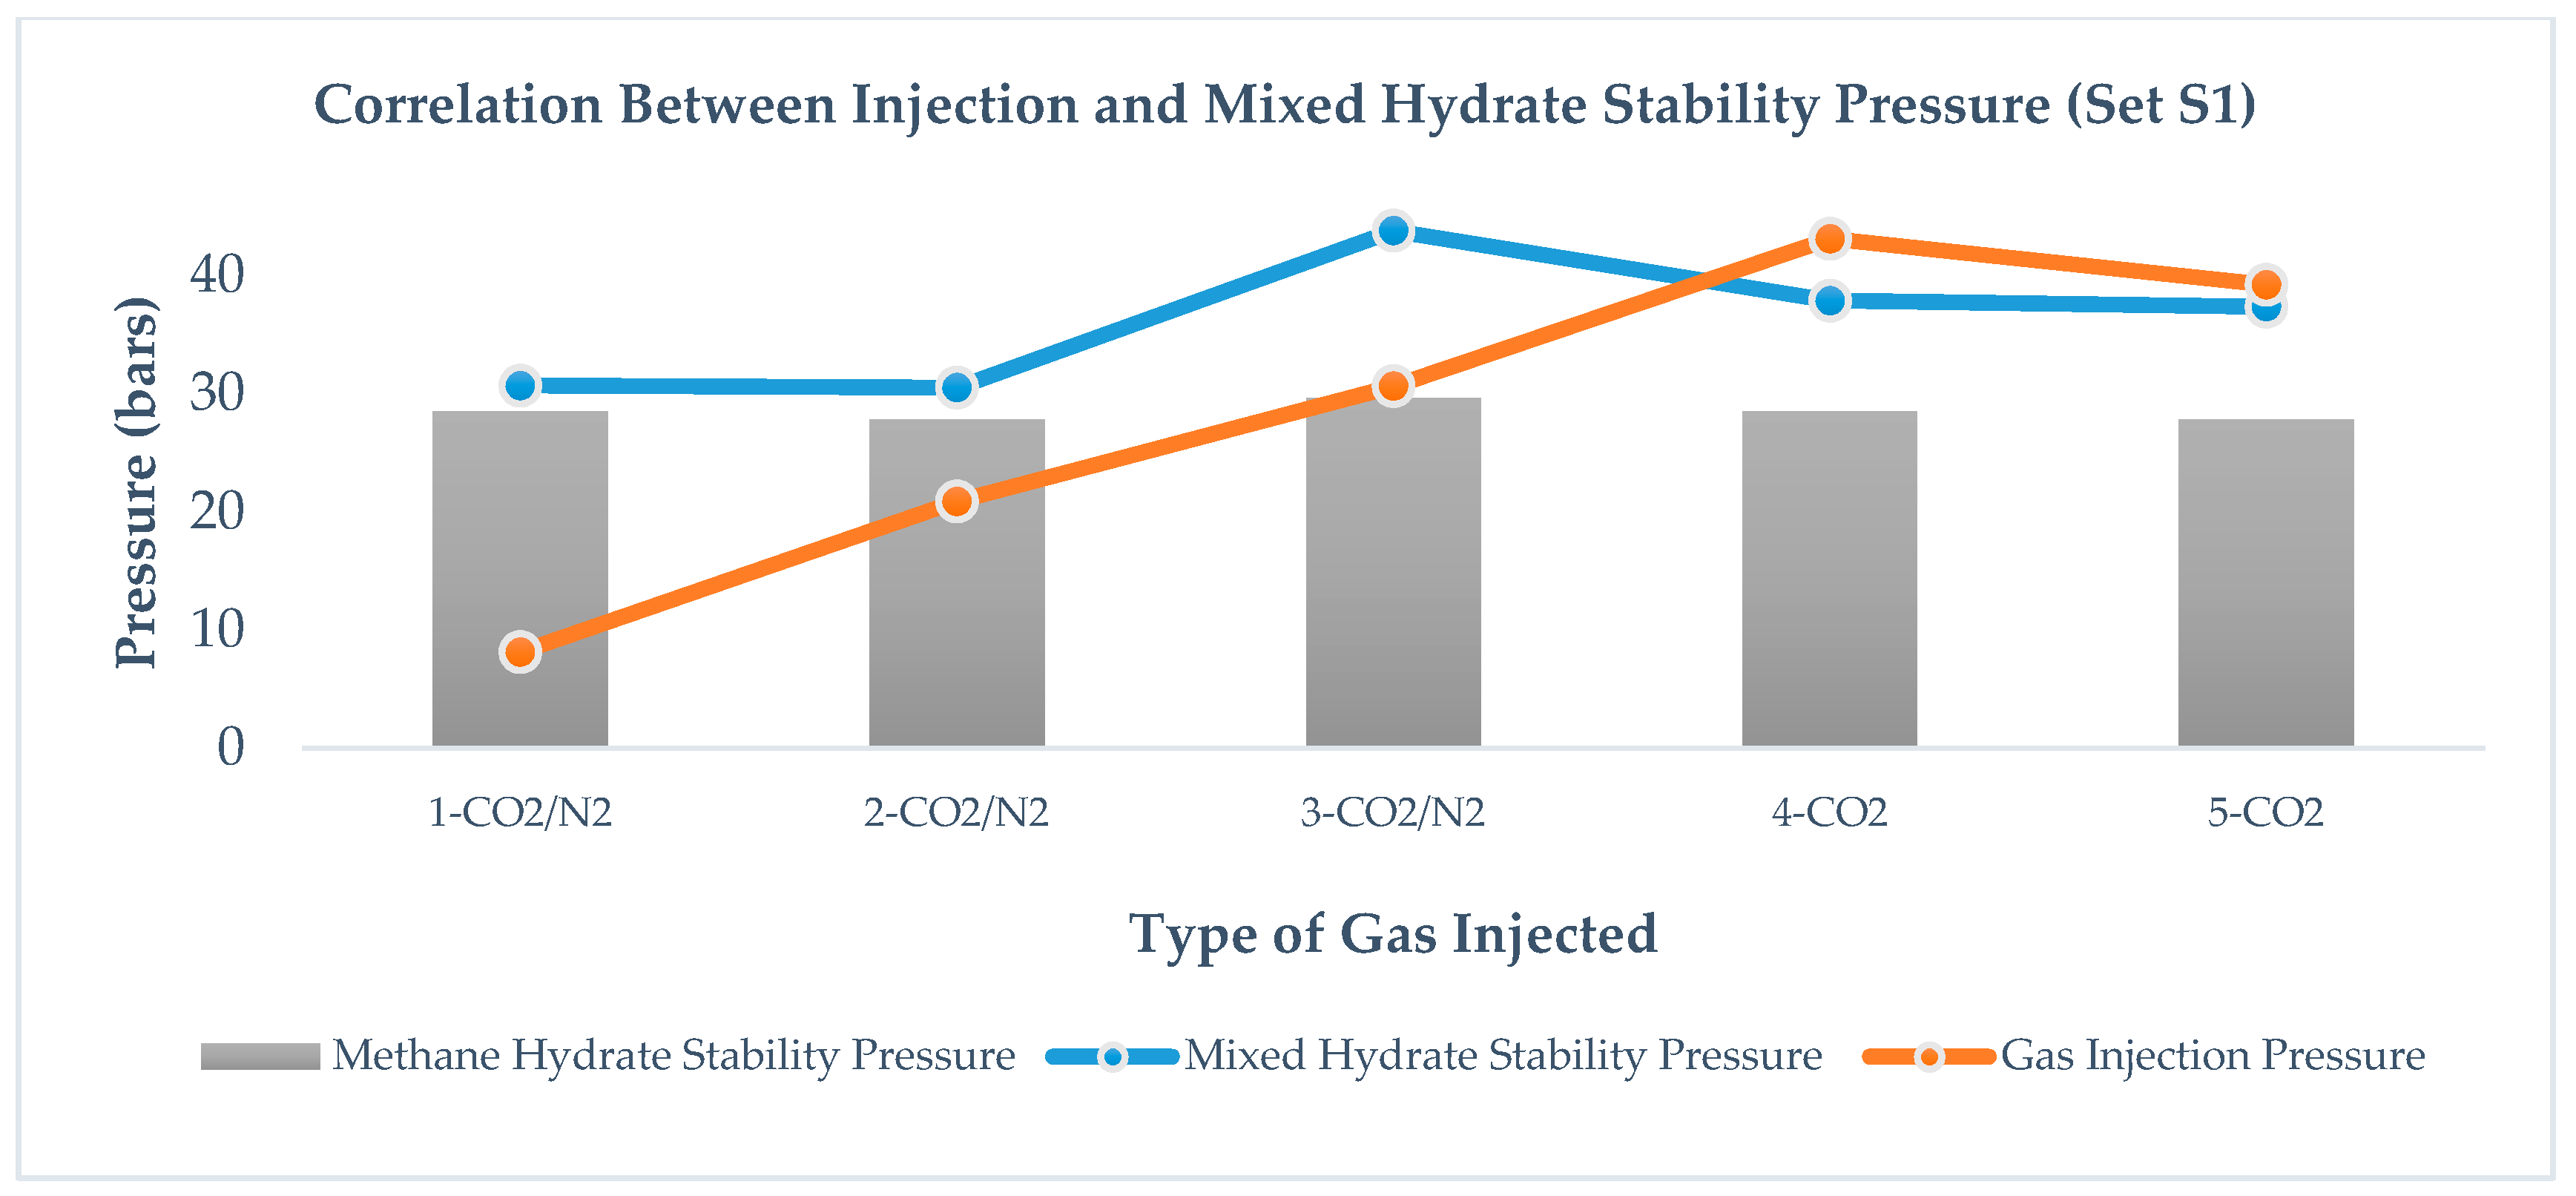
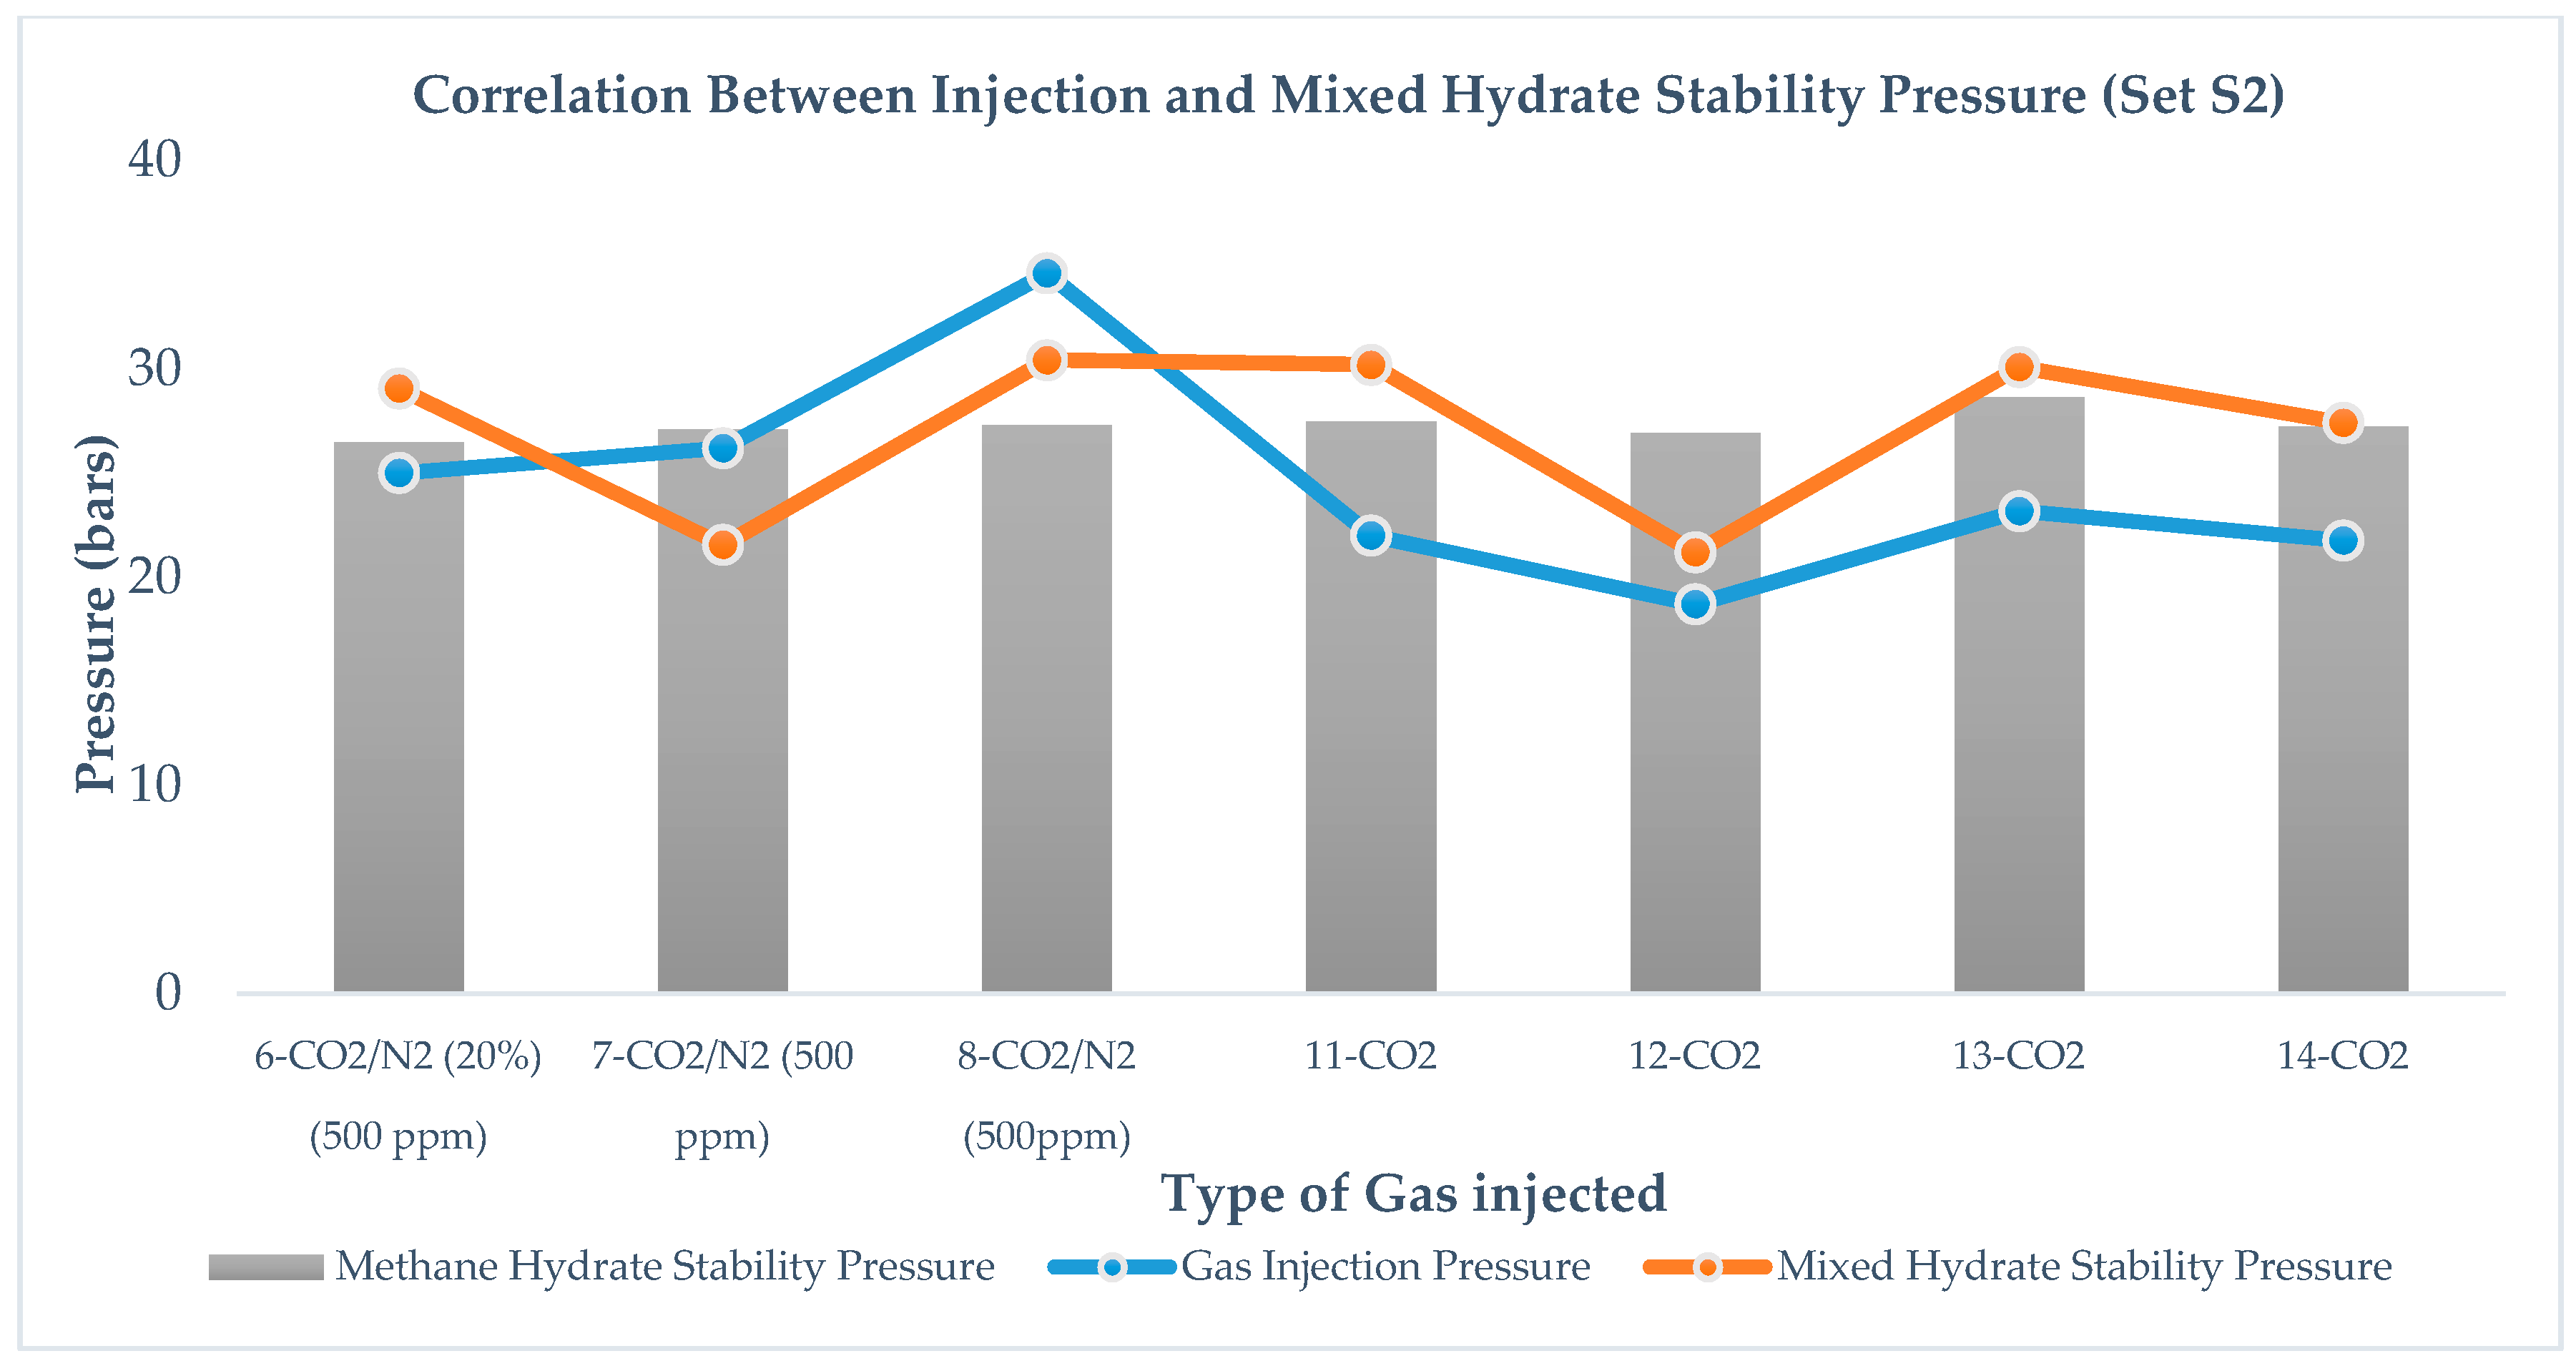
For set S1 in
Figure 7, correlation between mixed hydrate stability pressure
Pf, and gas injection pressure
Pinj, is not very clear, However, in set S2, as shown in
Figure 8, there exists a correlation between mixed hydrate stability pressure,
Pf, and gas injection pressure,
Pinj, that is independent of the type of gas injection and amount of immediate pressure reduction.
Based on the above results, it can be concluded that CO
2 injection is the better option compared to CO
2 + N
2 gas injection because it leads to a more stable hydrate than CO
2 + N
2. This is reflected by a lower stability pressure at the end of experiment. In the case of CO
2 injection, mixed hydrate stability pressure is recorded as lower than the injection pressure. It can be derived that, to achieve higher stability during the replacement reaction, the CO
2 injection pressure should be lower than the methane hydrate stability pressure. In the case of injection of the CO
2 + N
2 mixture, to achieve a lower pressure than gas injection, a higher CO
2 content in the gas mixture is recommended. Tsypkin [
30] concluded that an increase in injection pressure might lead to termination of the replacement reaction due to suppression of methane hydrate dissociation.
3.3. Methane Recovery Efficiency
Another major factor of concern during methane production through gas injection is methane-recovery efficiency. In this study, we are interested to know the effect of ΔP, the effect of injection gas, and the effect of injection pressure on the methane-recovery efficiency. Methane-recovery efficiency is calculated as the ratio of number of moles of CH
4 released to the number of moles of CH
4 in the hydrates. Moles of CH
4 hydrates are considered at the end of CH
4 hydrate formation.
Table 5 summarizes the methane-recovery efficiency in all experimental runs.
is the number of moles of methane stored in hydrates and
nCH4, Re is the number of moles of the methane recovery at the end of the run, measured using gas chromatograph.
Figure 9 and
Figure 10 summarize the results of methane recovery efficiency for sets S1 and S2.
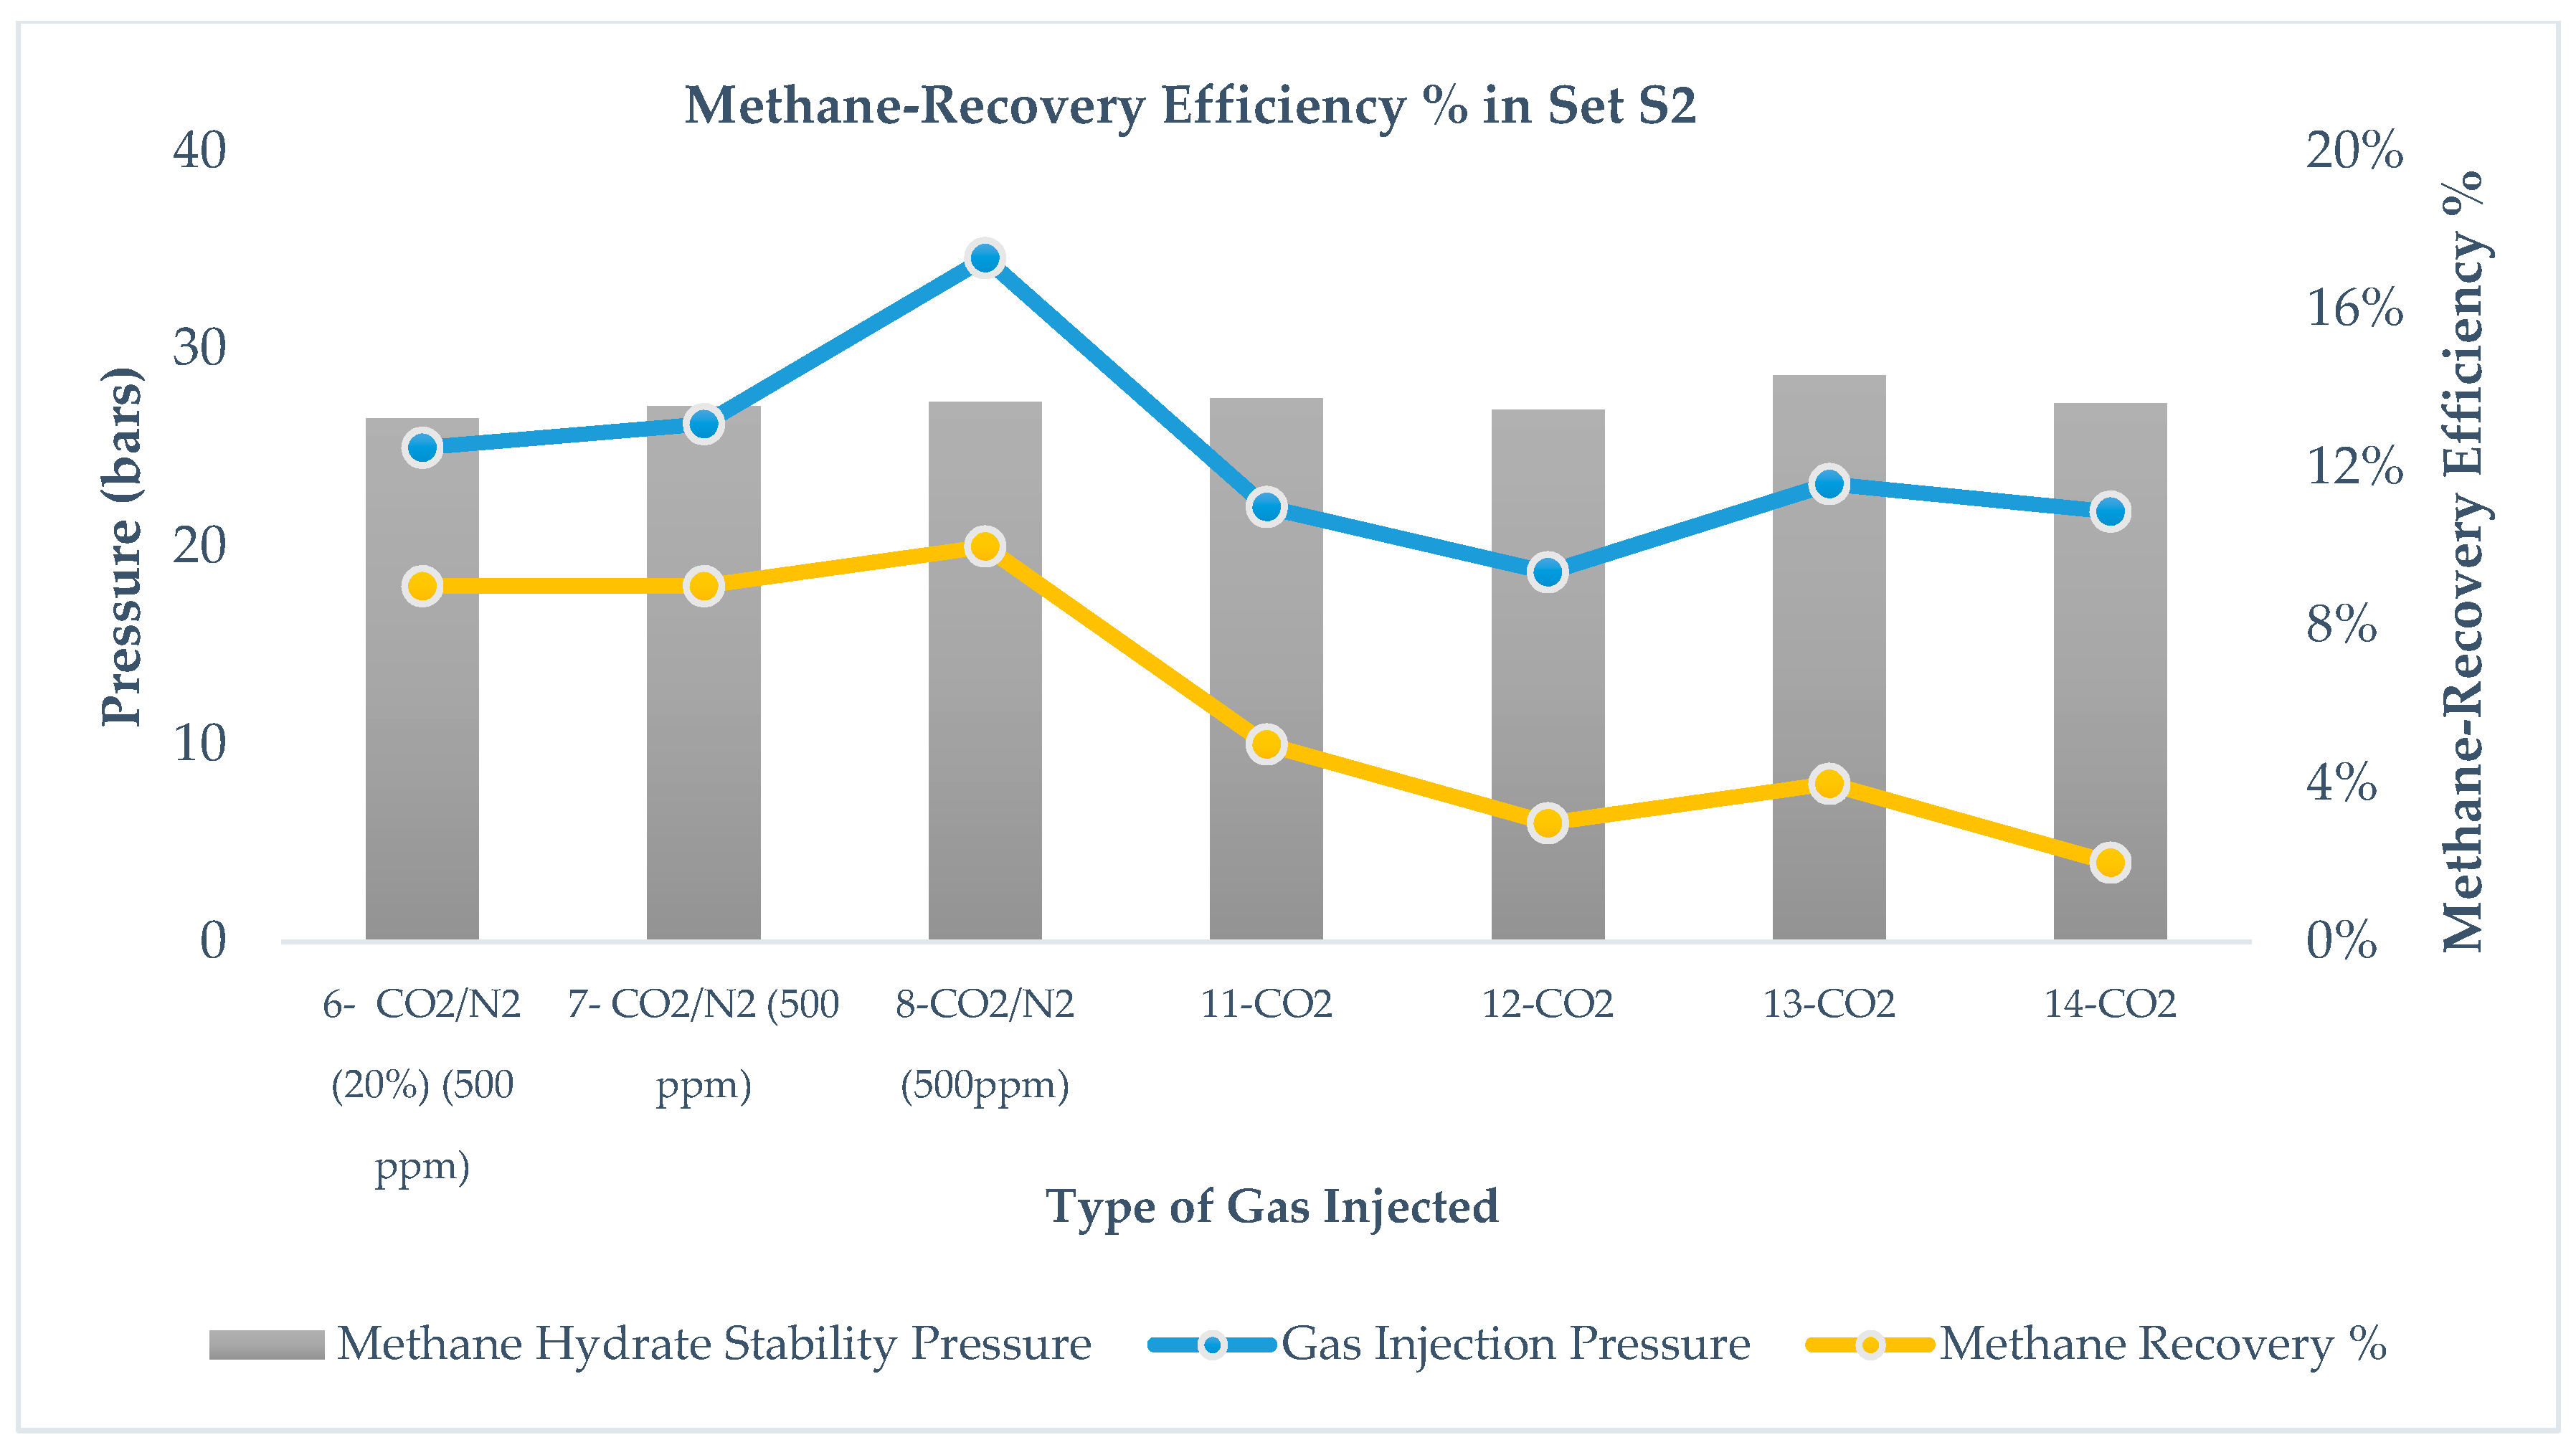
Figure 9 and
Figure 10 Showcase the difference in methane recovery for CO
2 + N
2 and CO
2 gas in set S1 and set S2. For set S1 in
Figure 9, during runs 1–3, it shows that the CO
2 + N
2 gas mixture leads to 30–40% gas recovery, whereas during runs 4 and 5, CO
2 leads to 5% gas recovery. For set S2 in
Figure 10, during runs 7 and 8, CO
2 + N
2 gas mixture leads to 10% methane recovery, whereas during runs 11–14, CO
2 leads to very low recovery, <5%. Koh et al. [
31], in their review paper, summarized the methane-recovery yield reported elsewhere. Comparison of results show that methane recovery from CO
2 + N
2 injection has a consistently higher methane recovery from pure CO
2 injection. Therefore, it can be derived that the CO
2 + N
2 gas mixture leads to higher gas recovery than pure CO
2, independent of degree of pressure reduction. This difference is due to N
2-assisted higher dissociation and water generation which is re-converted into CO
2. However, methane could not reconvert into methane hydrate and could not reoccupy cages due to the presence of N
2. In the case of CO
2, methane was reconverted into methane hydrate and a layer of CH
4–CO
2 was generated, which stopped additional methane recovery. It can be derived from the results that the degree of pressure reduction plays an important role in methane recovery if the CO
2 + N
2 gas mixture is injected. The effect of pressure reduction is negligible in the case of CO
2 injection and no substantial change in methane recovery between S1 and S2 is observed.
Chen et al. [
32] have studied the effect of injection pressure of CO
2 gas on replacement efficiency and suggested that lower injection pressure leads to dissociation of methane hydrate and that higher injection pressure would lead to accelerating CO
2 formation. However, a change in injection pressure does not show a strong influence on replacement efficiency. In our work, we do not see any trend between gas injection pressure and methane recovery for set S1, as shown in
Figure 7 but for set S2, as shown in
Figure 8 methane-recovery efficiency and gas injection pressure are correlated; however, no systematic correlation could be proposed at this point. From the results, we observed the pattern that, in the case of CO
2 + N
2 gas injection, recovery is consistently higher when the injection pressure of the gas mixture is close to or below the methane hydrate stability pressure, thus supporting Chen et al.’s experimental conclusions that a lower injection pressure below methane hydrate stability pressure would accelerate the dissociation of methane hydrate, while a higher injection pressure could lead to faster CO
2 hydrate formation, faster CH
4–CO
2 hydrate layer formation, and lower CH
4 recovery.
Run #6 in set S2 suggests that the CO2 + N2 mixture (20% CO2) leads to equal methane recovery while creating more stable mixed hydrate if injected close to the initial methane hydrate stability pressure. Thus, a higher mole percentage of CO2 is advantageous in a CO2-rich gas mixture for improved methane recovery and higher stability of mixed hydrates.
3.4. Effect of SDS Concentration on Methane Recovery and Stability
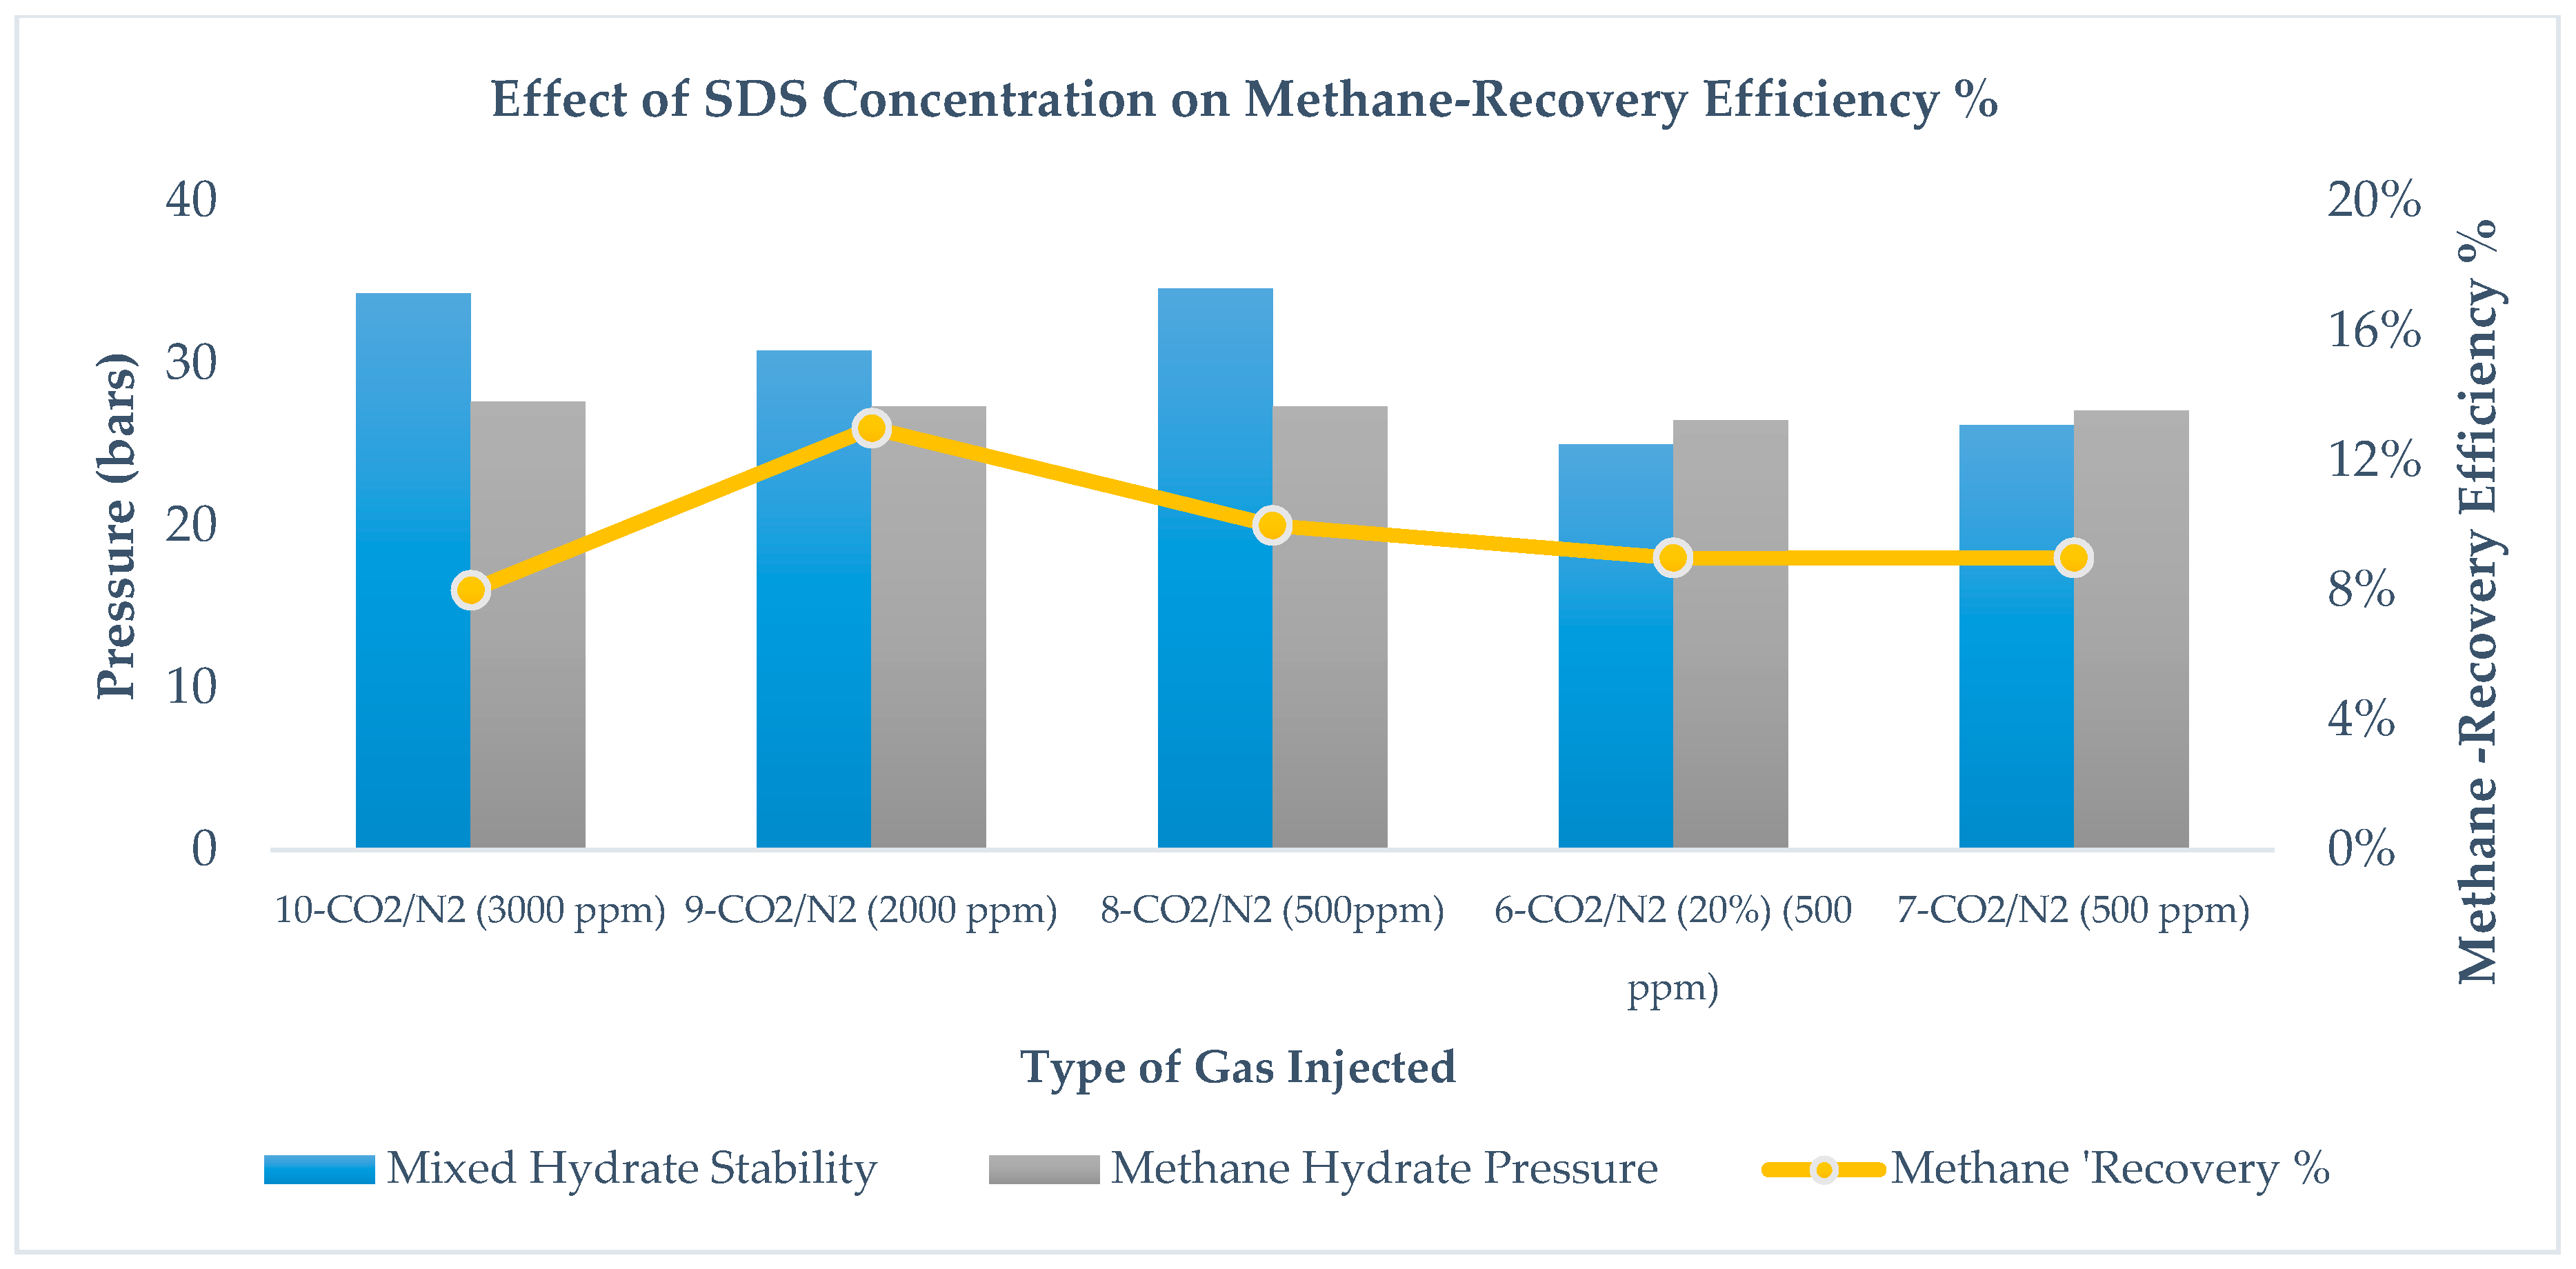
As SDS concentration increases from 500 ppm to 2000 ppm, we observe an increase in methane recovery efficiency. Comparing runs 8–10, it is found that, between runs 8 and 9, methane recovery and methane stability improve, while from runs 9 to 10, methane recovery and instability decrease, as per
Figure 11. At a higher concentration of 3000 ppm, methane-recovery efficiency and mixed hydrate stability decrease, because a higher surfactant concentration may lead to foam generation that may have created a barrier for effective CH
4–CO
2 replacement. It is also clear from
Figure 11 that SDS does not disturb the methane hydrate stability pressure, as most of the methane hydrate stability pressure is in a small range (26–28 bars) when the temperature is between 1–2 °C, thus confirming that SDS is a kinetic hydrate promoter. Increasing the concentration in SDS does not lead to drastic change in methane recovery, which confirms that SDS does not affect the thermodynamics of CH
4–CO
2 replacement. Since SDS creates pseudo-porous media and accelerates the methane hydrate formation, use of SDS in low concentrations to form methane hydrate could be advantageous in reducing total experiment time. In the case of a higher concentration, to avoid the formation of foam, use of antifoam agent is recommended.
3.5. Morphology Studies of Hydrate during the CO2 and CO2 + N2 Injections
There are different theories proposed to explain the exact mechanism behind CH
4–CO
2 replacement. According to the first theory, CH
4–CO
2 replacement includes methane hydrate decomposition and reformation in the presence of CO
2-rich gas driven by the chemical potential gradient between gases and the hydrate phase. According to the second theory, CH
4–CO
2 replacement happens without any cavity destruction as no water was detected using magnetic resonance imagining (MRI) and differential scanning calorimeter (DSC) experiments. Therefore, it would be helpful to use an HPC to observe whether water is present during the replacement reaction.
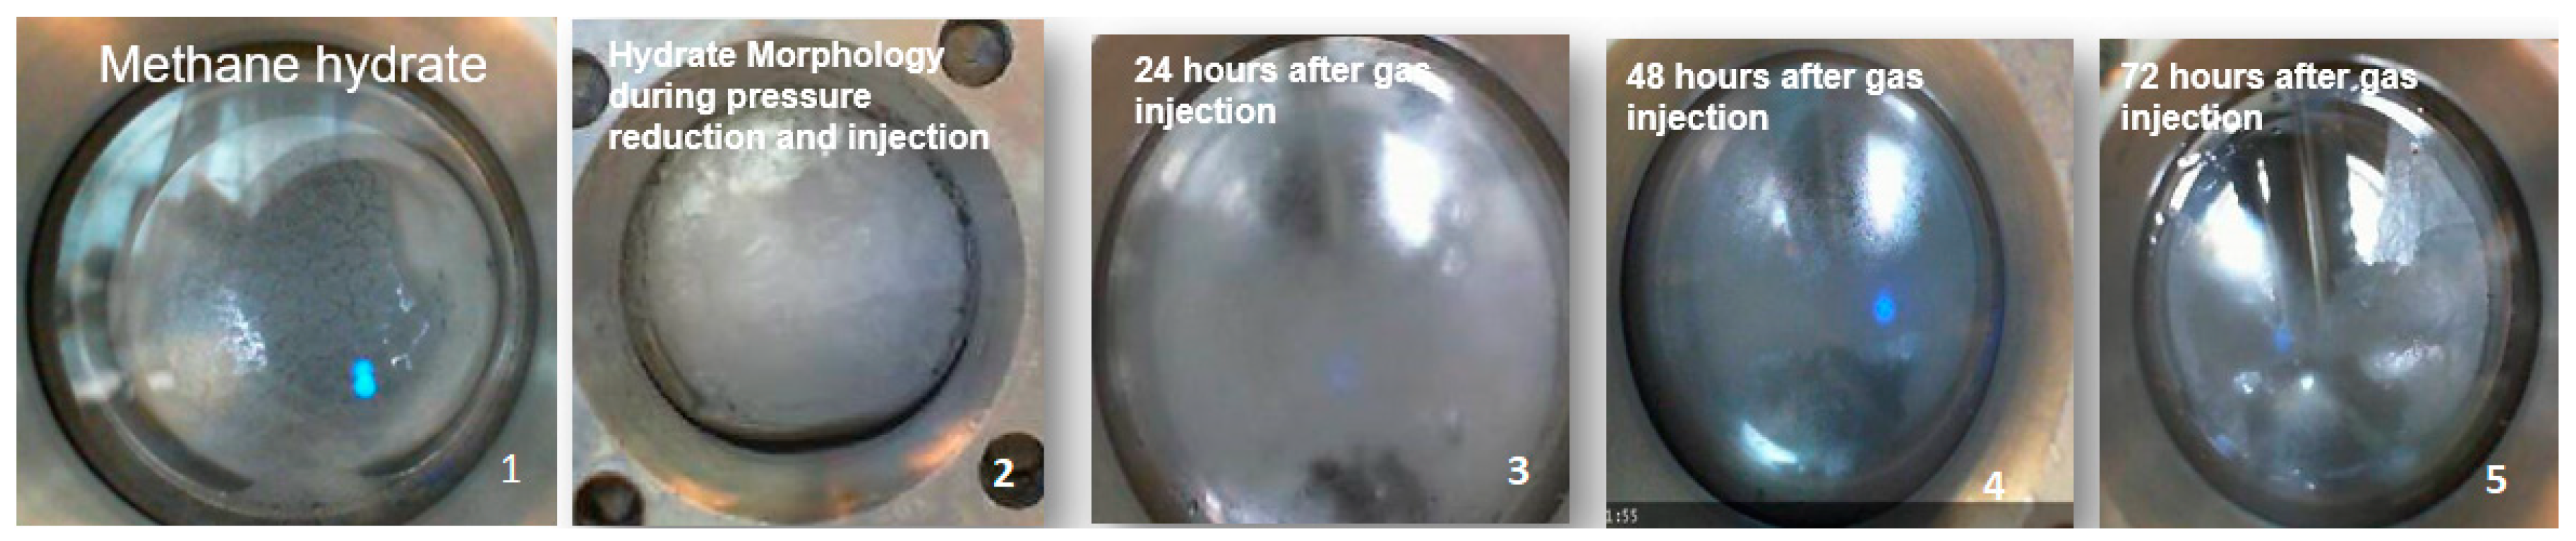
Figure 12 shows the typical gas hydrate morphology change during the experiment and highlights the interesting observation about change in morphology from a semi-solid hydrate to a crystal hydrate in a 24–72 h timeline, which occurs at the stage of CH
4–CO
2 exchange at constant temperature. It indicates a change in the water–gas contact area during the replacement and improvement in the contact area leads to faster crystallization over a longer period.
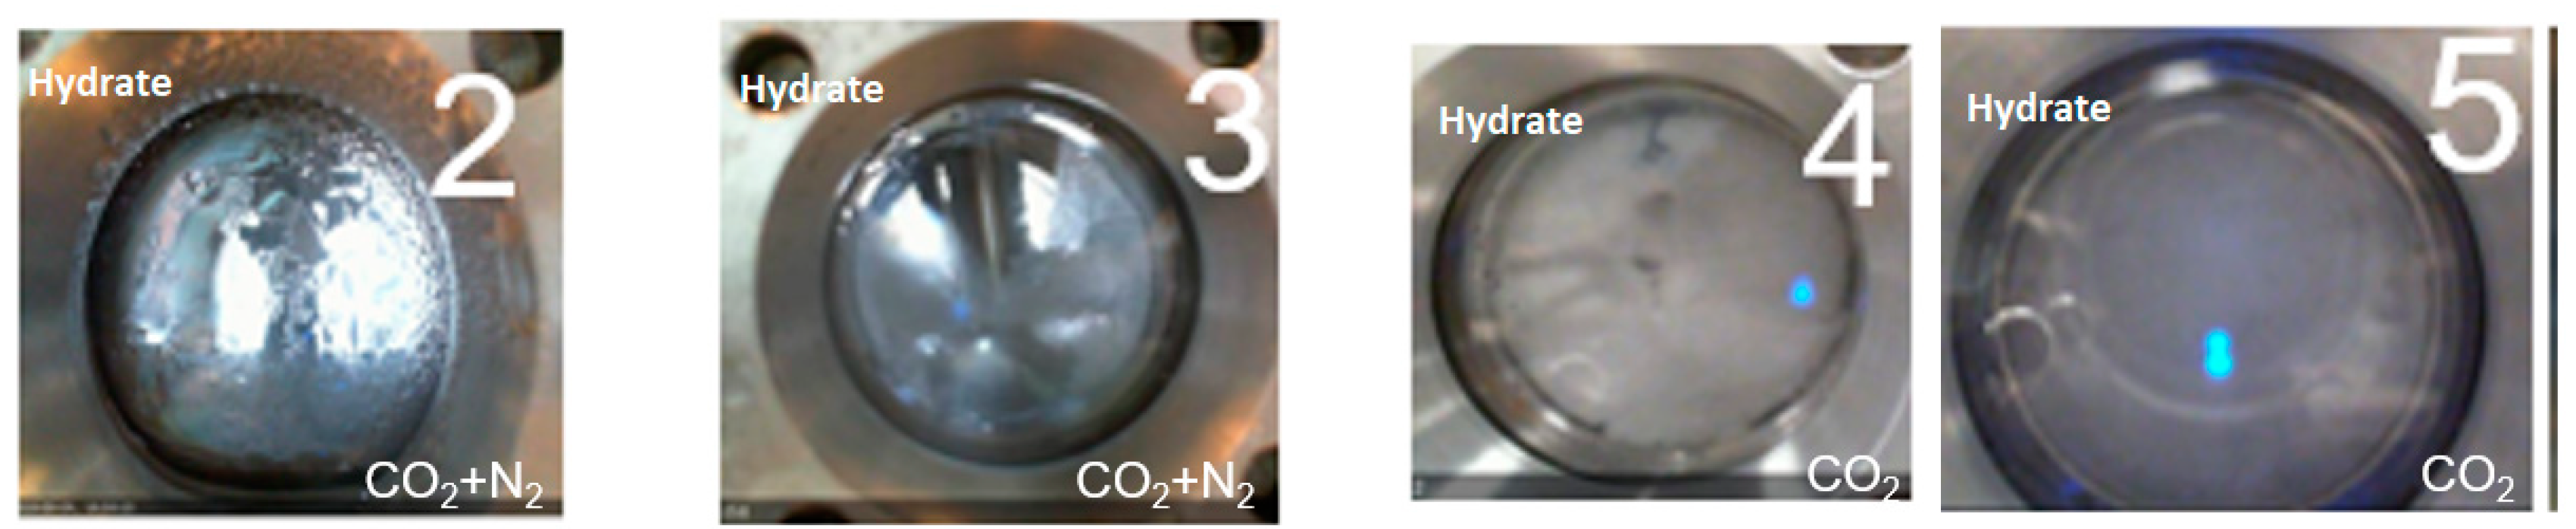
Table 6 summarizes the morphology studies collected at the end of all experimental runs. Morphology observed is divided into two categories: Hydrate crystals and hydrate slurry. Crystal morphology is considered in those cases in which an ice-like structure is observed, while hydrate slurry is considered in those cases where the liquid state coexists with hydrate particles. Morphology studies of four experimental runs 2–5 from set S1 are presented in
Figure 13. In runs 2 and 3, CO
2 + N
2 is injected, while in runs 4 and 5, CO
2 is injected. For all four cases, visual inspection suggests the presence of crystal morphology without any visible water. Set S1 includes IPR = 28 bars, which results in decomposition of methane hydrate into methane gas and water. Produced water converts back into hydrate in the presence of hydrate-forming gases CO
2 + N
2 and CO
2; however, in the presence of N
2, lower conversion of methane into methane hydrate occurs, which explains the higher methane-recovery efficiency in set S1. Morphology in runs 2 and 3 appear to be less dense compared to runs 4 and 5, which could be due to the presence of CH
4–CO
2 mixed hydrates in those runs. The difference in morphology is a direct indicator of CO
2 concentration available in injected gas. Higher CO
2 content in injected gas and higher content of CH
4–CO
2 mixed hydrates correspond to denser hydrates and lower methane recovery.
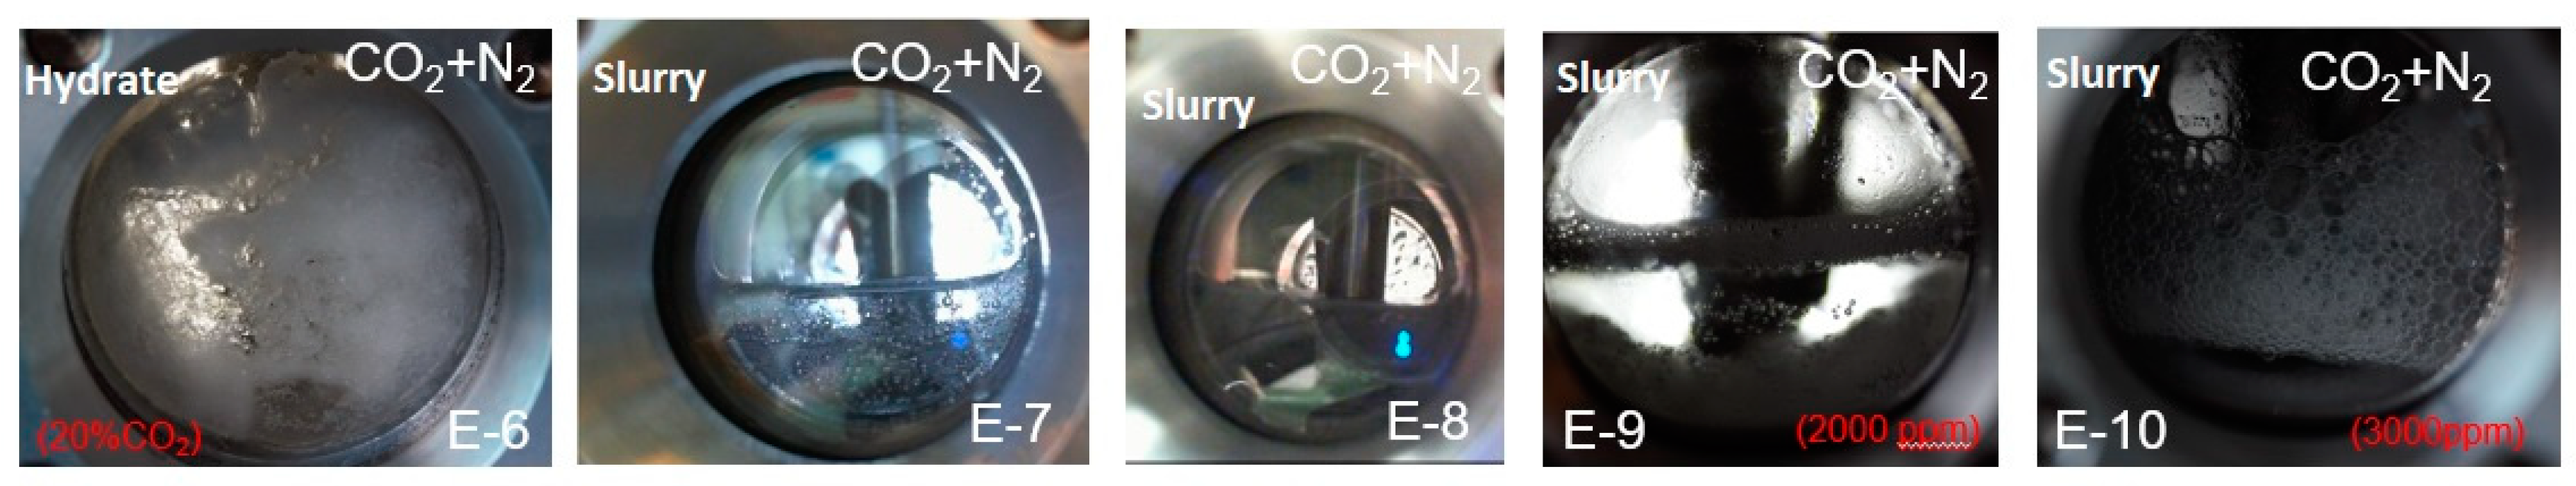
Figure 14 showcases the morphology in runs 6–10 from set S2. In these runs, an IPR equal to 10 bars is applied below the methane hydrate stability pressure and CO
2 + N
2 is injected. In experimental run #6, 20% CO
2 is used, while in other cases, 10% CO
2 is used. In run #6, the presence of crystal morphology is recorded, while in other cases, hydrate slurry is recorded. In these runs, due to a small pressure reduction, methane hydrate goes into a metastable state and the presence of N
2 in CO
2 + N
2 acts as a driver for the complete dissociation of methane hydrate and the release of water. However, due to a lower concentration of CO
2, CH
4–CO
2 hydrate does not form and water production is observed. In experimental run #6, a higher CO
2 content creates enough driving force for CH
4–CO
2 hydrate formation and dissociated water to convert into CH
4–CO
2 mixed hydrate. Runs# 9 and 10 include the methane hydrate using SDS 2000 and 3000 ppm concentrations; however, presence of SDS and change in SDS concentration do not influence the risk of water production and hydrate morphology.
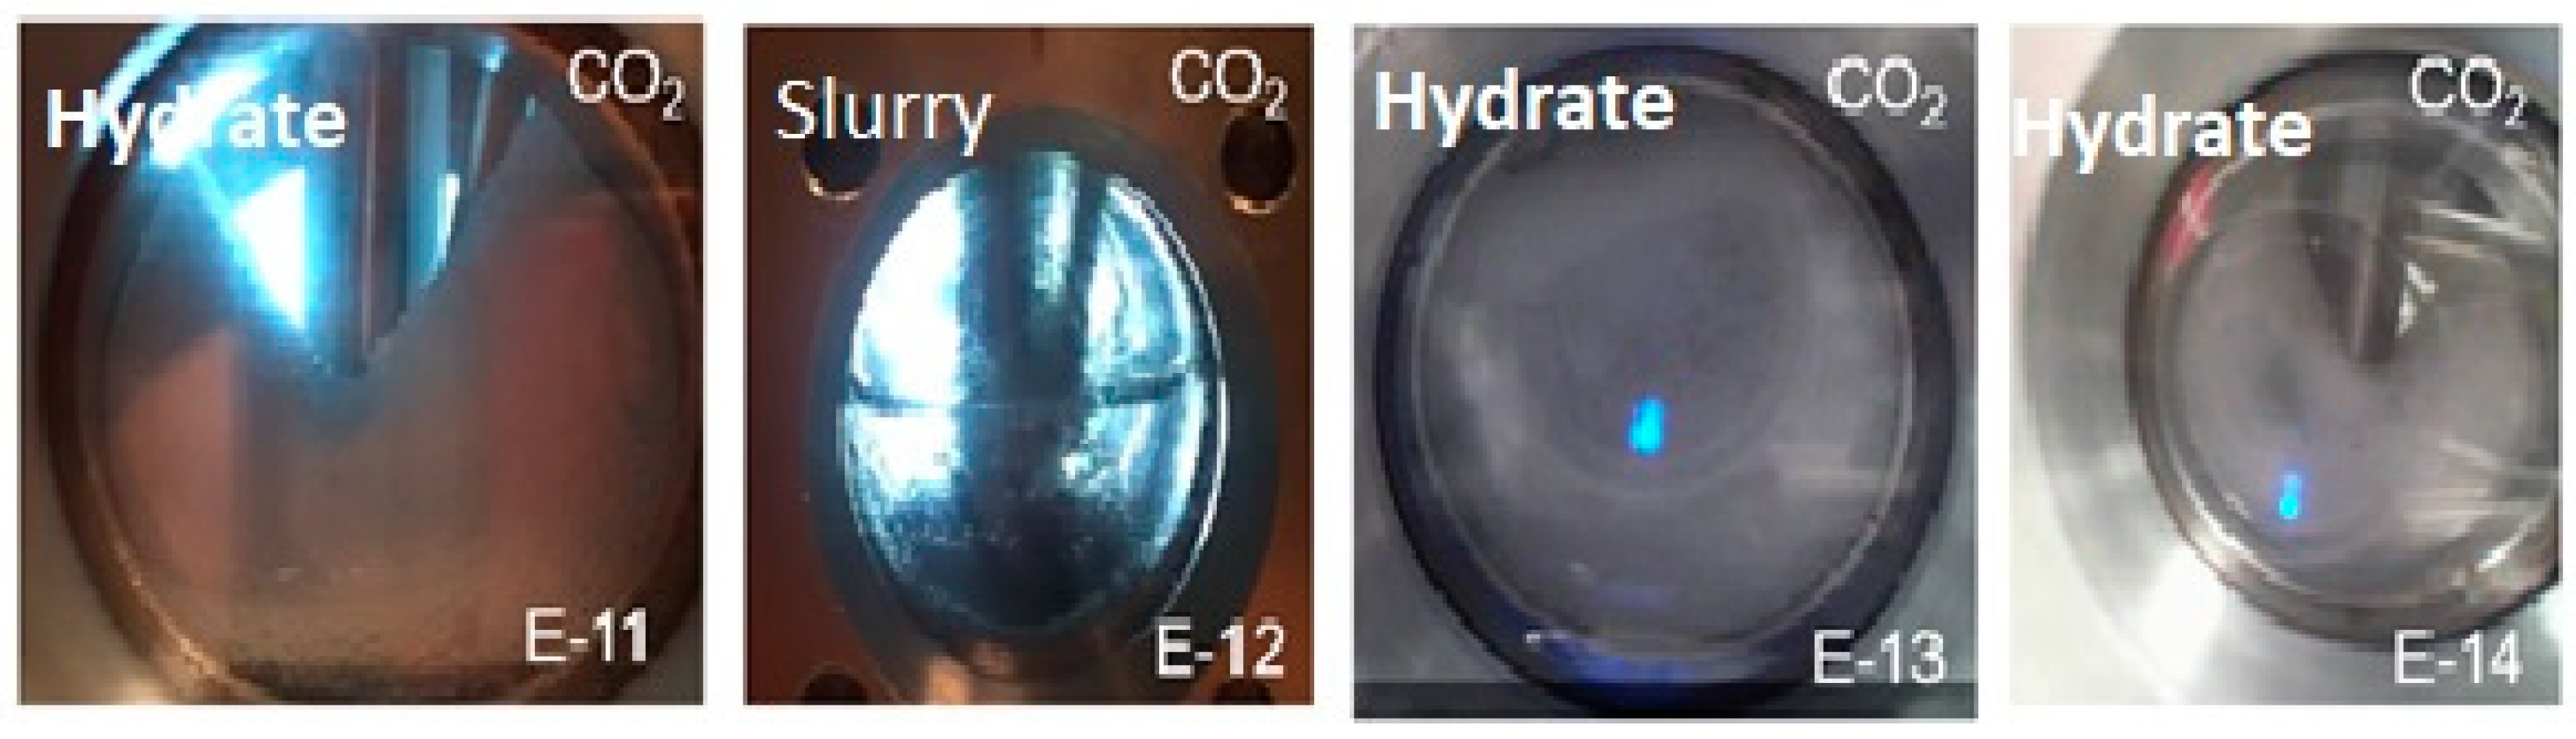
Figure 15 includes the morphology of the experimental runs 11–14 from set S2. In these runs, an IPR equal to 10 bars is applied, the pressure is reduced below the methane hydrate stability pressure, and pure CO
2 gas is injected. CO
2 injection leads to CH
4–CO
2 mixed hydrate formation. With the exception of run #12, we identify the morphology as crystalline for all runs. A reason for the presence of water in run #12 could be the presence of air while injecting CO
2 (hence the presence of N
2), which causes a lower driving force for hydrate to form. Comparing runs 2, 3, 7, and 8, it can be concluded that the degree of pressure reduction combined with CH
4–CO
2 exchange has little impact on mixed hydrate stability while keeping all other parameters constant.
In
Figure 14 we see that in runs 7–10 in set S2, we injected CO
2 + N
2, and hydrate slurry formed, which includes the water and hydrate particle system. However, run #6, when CO
2 + N
2 with 20% CO
2 was injected and hydrate crystals formed at the end of replacement experiment.
Figure 15 shows the morphology at the end of runs 11–14 from set S2. In these cases, CO
2 gas was injected. We observed water in run #12; runs 11, 13, and 15 showed hydrate crystal formation.
The overall conclusion from the morphology study is that water production using the combined method of pressure reduction followed by CO
2-rich gas injection using the huff-and-puff production technique is a stochastic phenomenon, which depends on many factors, including the degree of pressure reduction, type of gas injected, and composition of the gas injected. Water production risk is higher when injecting the CO
2 + N
2 gas, as shown in
Figure 13. It can be explained as the role of N
2 in dissociating the methane hydrate and lowering the driving force of CO
2 + N
2 gas mixture compared with pure CO
2. This risk can be lowered further if the CO
2 concentration in the mixture is increased. Increasing the CO
2 percentage not only reduces the risk of water production, but it also makes the mixed hydrate more stable than the methane hydrate after replacement without affecting the methane recovery, as shown in
Figure 14 and
Figure 10. A higher degree of pressure reduction could generate enough water, which might accelerate CH
4–CO
2 mixed hydrate formation and could reduce the risk of water production. However, the presence of N
2 in the environment might improve methane recovery, as previously discussed.
Morphology studies also suggest that mass-transfer improvement through pressure reduction is the dominating mechanism compared to the chemical method of improving mass transfer, as an increase in SDS concentration did not lead to a change in morphology (see runs 8, 9, and 10 in
Table 5). Based on morphological evidence, we propose the hypothesis that the mechanism between CH
4–CO
2 exchanges includes CH
4-hydrate dissociation and release of free water converting back to CH
4–CO
2 mixed hydrates. Methane recovery ceases when free water is unavailable. Thus, it can be proposed that CH
4–CO
2 exchange includes methane hydrate dissociation and reconversion into CH
4-CO
2 mixed hydrate. This is the reason why a higher methane recovery is found for ΔP = 28 bars, whereas for ΔP = 10 bars, a lower methane recovery is observed. Initiating the controlled dissociation would allow us to produce a higher degree of methane while storing the CO
2. In the combined approach using the huff-and-puff production technique, controlled dissociation before the gas injection leads to a higher degree of methane recovery as well as a lower risk of water production, as our experimental results suggest.


