Investigation on Optimization Design of Offshore Wind Turbine Blades based on Particle Swarm Optimization


1
School of Marine Engineering and Technology, Sun Yat-sen University, Guangzhou 518000, China
2
College of Shipbuilding Engineering, Harbin Engineering University, Harbin 150001, China
3
Southern Marine Science and Engineering Guangdong Laboratory (Zhuhai), Zhuhai 519000, China
*
Author to whom correspondence should be addressed.
Energies 2019, 12(10), 1972; https://doi.org/10.3390/en12101972
Submission received: 30 April 2019
/
Revised: 17 May 2019
/
Accepted: 21 May 2019
/
Published: 23 May 2019
(This article belongs to the Special Issue Wind Turbine Power Optimization Technology)
Abstract
:Offshore wind power has become an important trend in global renewable energy development. Based on a particle swarm optimization (PSO) algorithm and FAST program, a time-domain coupled calculation model for a floating wind turbine is established, and a combined optimization design method for the wind turbine’s blade is developed in this paper. The influence of waves on the power of the floating wind turbine is studied in this paper. The results show that, with the increase of wave height, the power fluctuation of the wind turbine increases and the average power of the wind turbine decreases. With the increase of wave period, the power oscillation amplitude of the wind turbine increases, and the power of the wind turbine at equilibrium position decreases. The optimal design of the offshore floating wind turbine blade under different wind speeds is carried out. The results show that the optimum effect of the blades is more obvious at low and mid-low wind speeds than at rated wind speeds. Considering the actual wind direction distribution in the sea area, the maximum power of the wind turbine can be increased by 3.8% after weighted optimization, and the chord length and the twist angle of the blade are reduced.
1. Introduction
Climate change is showing abnormal effects all over the world. Environmental pollution is continuously aggravated, and energy demand is increasingly variable. Developing and utilizing clean and pollution-free renewable energy has become an effective way to alleviate energy shortages, reduce environmental pollution and improve climate conditions [1].
Wind energy is one of the most mature forms of renewable energy, which has promising large-scale development conditions and commercial development prospects. Wind energy includes onshore wind energy and offshore wind energy. In recent years, the development and utilization of onshore wind energy has encountered bottlenecks due to the limitation of land and wind resources. Compared with onshore wind power, offshore wind power has many advantages, such as higher wind speed, more stable wind direction, and smaller turbulence and wind shear. With the rapid development of wind power technology, the leading direction of wind power development in the future will focus on offshore wind power [2].
A large number of studies on fixed wind turbines have been carried out. Apparent models suitable for the wind turbines have been developed to predict the aerodynamic characteristics of the wind turbine [3,4]. In the engineering application, most design software for the wind turbine follows the dynamic stall model in the helicopter field, and modifies the working environment of the fixed wind turbine [5,6]. It can basically meet the design requirements of the fixed wind turbine. At present, fixed wind turbine technology has become relatively mature and accomplished commercialization in China and several European countries. However, the floating wind turbine can move freely in the ocean environment. It is always in an obvious oscillation dynamic state under the influence of waves. Continuous oscillation not only causes the dynamic response of the wind turbine, but also enhances the unsteady effect of aerodynamic load, which brings great difficulties to the design and evaluation of floating wind turbine. The technology is still in the primary stage of research and development [7].
The offshore floating wind turbine is a very complex system, which mainly consists of the top wind turbine generator set, the tower supporting the wind turbine, the floating platform infrastructure and the mooring positioning system. For the wind turbine generator set alone, blades with excellent aerodynamic performance are the core of wind turbines [8]. Blade design is a complex multi-objective optimization design process, which needs to meet a number of design indicators, such as aerodynamic performance, structural strength and economic characteristics [9]. There are three theoretical research methods: blade element momentum (BEM) method based on momentum conservation; generalized dynamics wake (GDW) based on vortex theory; CFD method by solving N-S equation directly. The BEM method can simply calculate the energy efficiency and the force of horizontal axis impeller. It is effective and fast for estimating the overall load of the impeller. It is suitable for wind turbines with equal blade lengths and no less than a 3 blade tip speed ratio. The BEM method is the most widely used and technologically mature aerodynamic performance prediction method for the wind turbine [10,11]. GDW method includes the dynamic wake effect, tip loss and skewed wake effect, and does not require additional modified model [12]. However, the method assumes that the induced velocity is small relative to the inflow velocity. Thus, it is suitable for the wind turbines with heavy load. When the wind speed is small, the wake appears to be in a turbulent state, and the method becomes unstable [13]. CFD method can simulate yaw, tower shadow, wind shear and other complex conditions. Through CFD calculation, abundant flow field information can be obtained [14,15]. However, due to the large dimension of the wind turbine and the complexity of blade shape, the CFD method requires a lot of computer resources and computing time. Besides, this method is affected by the turbulence model, transition model, discrete format, boundary conditions and other factors [16].
In the application research process of the wind turbine, numerous methods synthetically simulating wind turbine loads have been developed based on the above theoretical research methods. Some scholars have synthetically simulated the preliminary design of floating wind turbines by using the linear frequency domain method commonly used in offshore oil and gas exploitation. For example, Bulder et al. [17] used the linear frequency domain method to simulate a wind turbine with a three-dimensional floating body. The response amplitude operator and standard deviation of the six rigid-body motion modes of the floating platform were calculated and analyzed. Tracy [18] used a similar method to study the optimal design parameters of tension leg and mast-type wind turbine. However, these studies only introduce the aerodynamic and structural characteristics of the wind turbines by adding additional mass, additional damping and an additional recovery matrix, without simulating the real wind turbine. The linear frequency domain method can’t simulate the non-linear dynamic characteristics and unsteady effects. Some scholars use other methods to study the floating wind turbine. For example, Henderson et al. [19] used a method called “state domain” to study the effect of platform motion on the fatigue load of the wind turbine. Combining aeroelastic load simulation software with hydrodynamic load simulation software, Withee [20] established the time domain dynamic model for floating wind turbine, and studied a tension leg wind turbine. Because they employed a simple hydrodynamic model, aerodynamic model or structural dynamic model, these studies still have some limitations and couldn’t develop a better blade optimization design scheme.
Wind turbine blade design is also a complex multi-objective optimization design process. Strong interactions exist between the disciplines of aerodynamics, dynamics, structures, and economies. A number of previous studies have optimized blades with intelligent calculation methods, including a neural network algorithm, genetic algorithm and data mining algorithm [21,22,23]. Particle swarm algorithm is a modern heuristic algorithm, which has great advantages in computing speed and memory consumption, and has fewer parameters to adjust. Liao et al. [24] employed an improved PSO algorithm to optimize wind turbine blades. The comparison results of optimized blades and reference blades indicated that this method was feasible and practical. Combined with the improved PSO algorithm with FAST program, they pursued the minimum blade mass to reduce the cost of the wind turbine. The thickness and the location of the layers in spar caps were selected as the optimization variables [25].
In addition, the wind speed of 12 m/s is mainly used as the design reference for international mainstream wind turbines. But the wind field with high-quality wind resources is limited. The wind field with low wind speed occupies a larger proportion, and these wind fields are generally closer to the power grid [26]. Taking China as an example, only the wind speed of 9.5 m/s in Fujian sea area is relatively close to the average wind speed in Europe, while the average wind speed in other sea areas is generally less than 8m/s, and even the wind speed in many sea areas is less than 7 m/s.
Therefore, this paper combines the PSO algorithm and FAST V8 computational analysis software for the wind turbine to optimize the design of offshore wind turbine blades in sea areas with different wind speeds including low wind speed. The “aero-hydro-control-structure” coupled time-domain calculation model for floating wind turbine is developed. By using this model, the motion state of floating wind turbine under real working conditions is simulated. Aiming at getting the maximum output power of the wind turbine, the optimal design of the wind turbine blade can be searched in many combinations by changing the distribution of twist angle and chord length. In addition, the influence of sea state and wind conditions in the actual sea area on the optimal design of the wind turbine blades is investigated. The study can provide theoretical guidance for the optimal design of an offshore floating wind turbine blade.
2. Blade Optimization Based on PSO Algorithm and FAST Program
FAST is an open source software for simulating dynamic response of horizontal-axis wind turbines, which is developed by the United States Department of Energy’s NREL. FAST was originally used as a program to calculate the aerodynamic performance of horizontal axis wind turbines based on BEM theory. Thereafter, the hydrodynamic module, coupling calculation module, noise module, elastic module, ice load module, servo system module and wind environment load module were gradually added, making FAST a floating wind turbine solver with multiple performance modules. Input files should be provided before running the FAST, including the basic operation parameters of the wind turbine, blade geometry parameters, wind spectrum file, tower data file, wave load file, and platform foundation file. When FAST runs, each module reads its corresponding input file, and the data interaction between each module is completed by a dynamic link library. All modules cooperate to achieve time-domain coupled calculation.
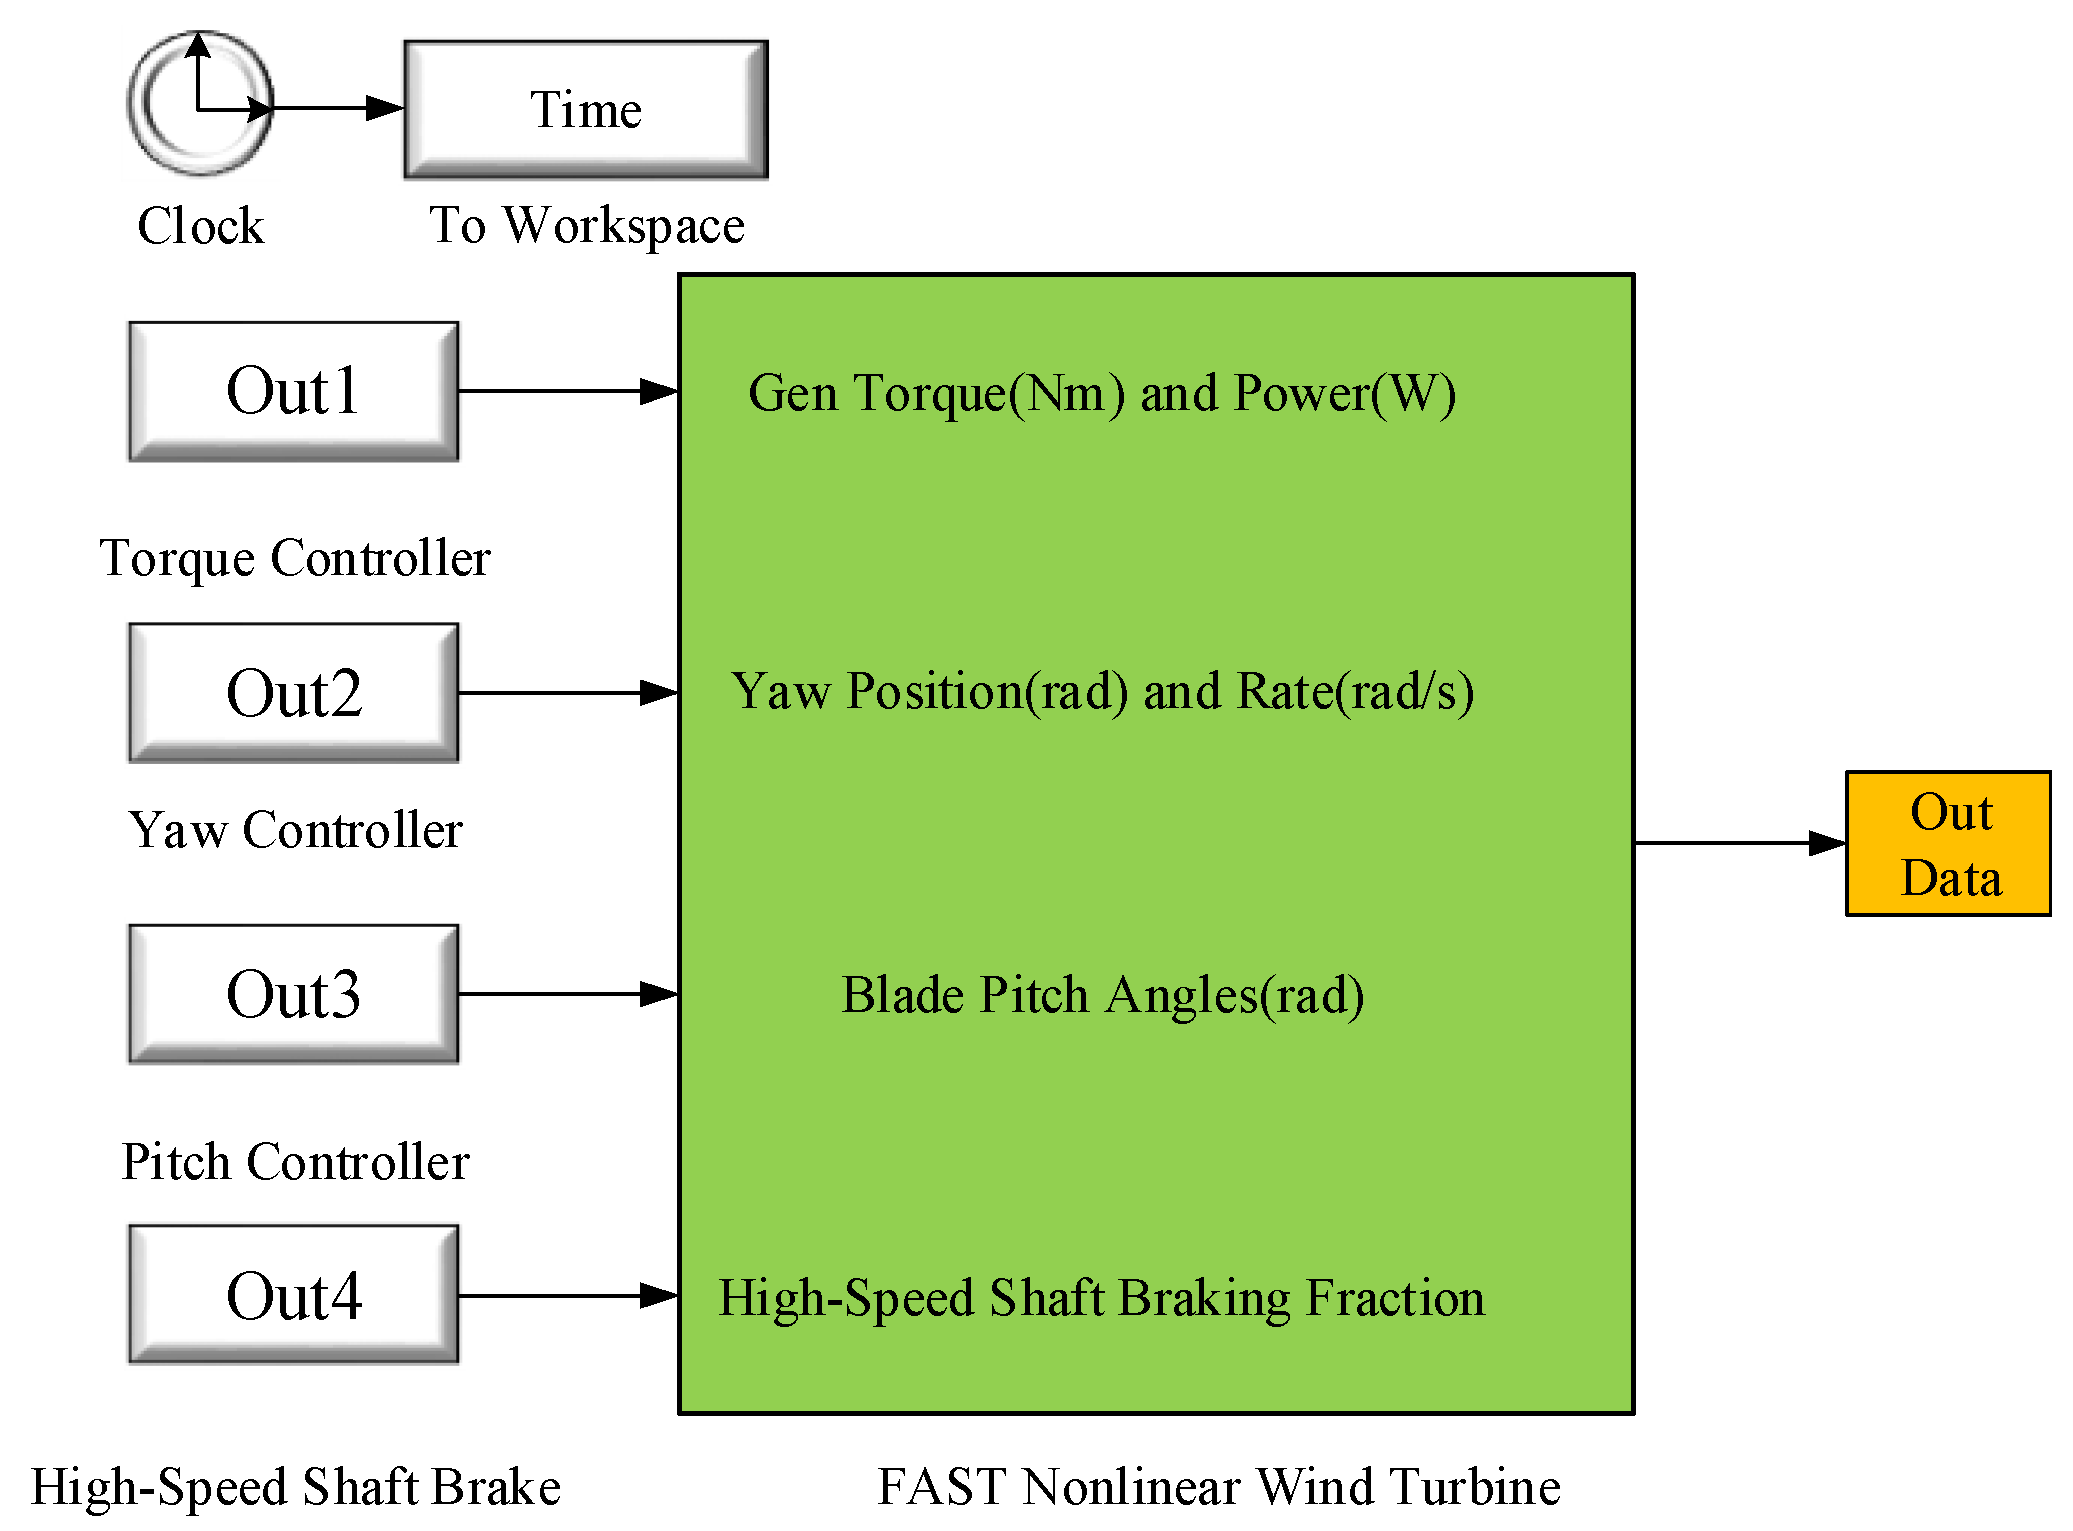
There are two different analysis modes in FAST V8. The first analysis mode is linearization, in which BEM is used to calculate the aerodynamic force; the second analysis mode is simulation, in which the time marching method is used to solve the nonlinear motion equation. This is also the method used in this study. In the simulation process, the aerodynamic response and the structural response of the wind turbine are processed in real time. FAST V8 provides the S-Function (System Function) function interface for the Simulink module library in MATLAB, as shown in Figure 1. The S-Function function is compiled by C++ language, and the optimization algorithm is embedded to carry out the optimization design of the wind turbine blades.
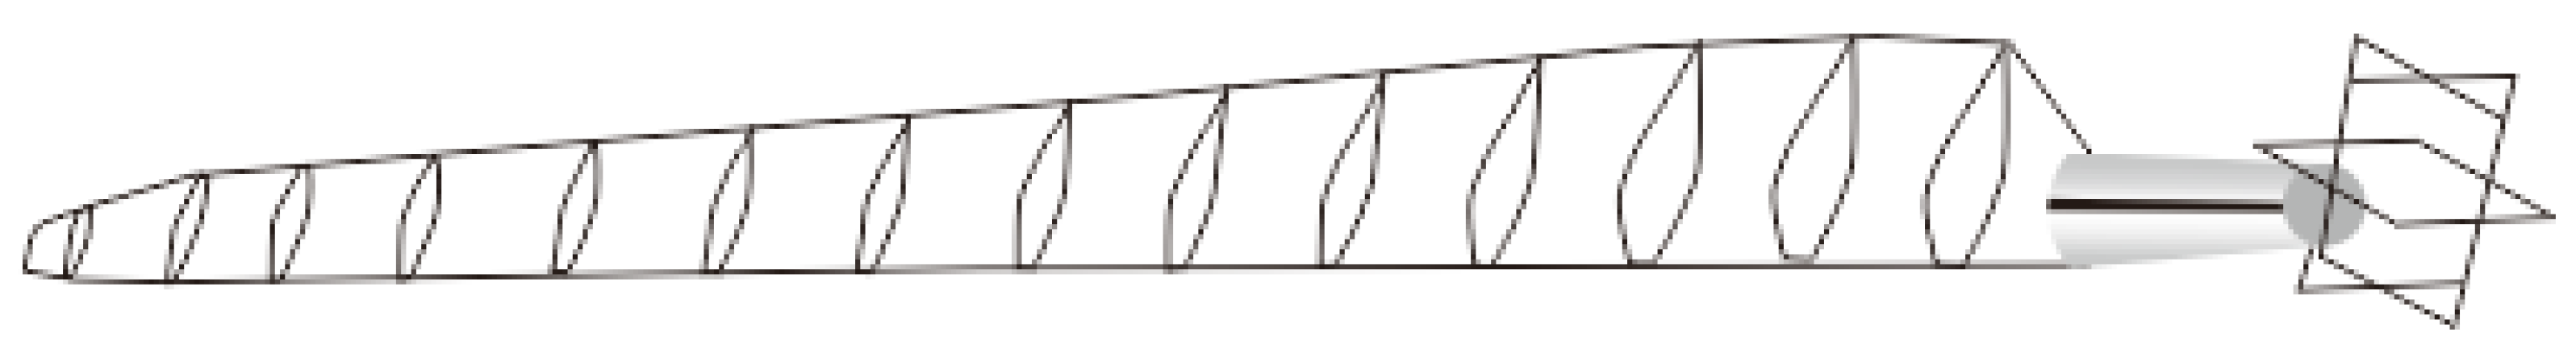
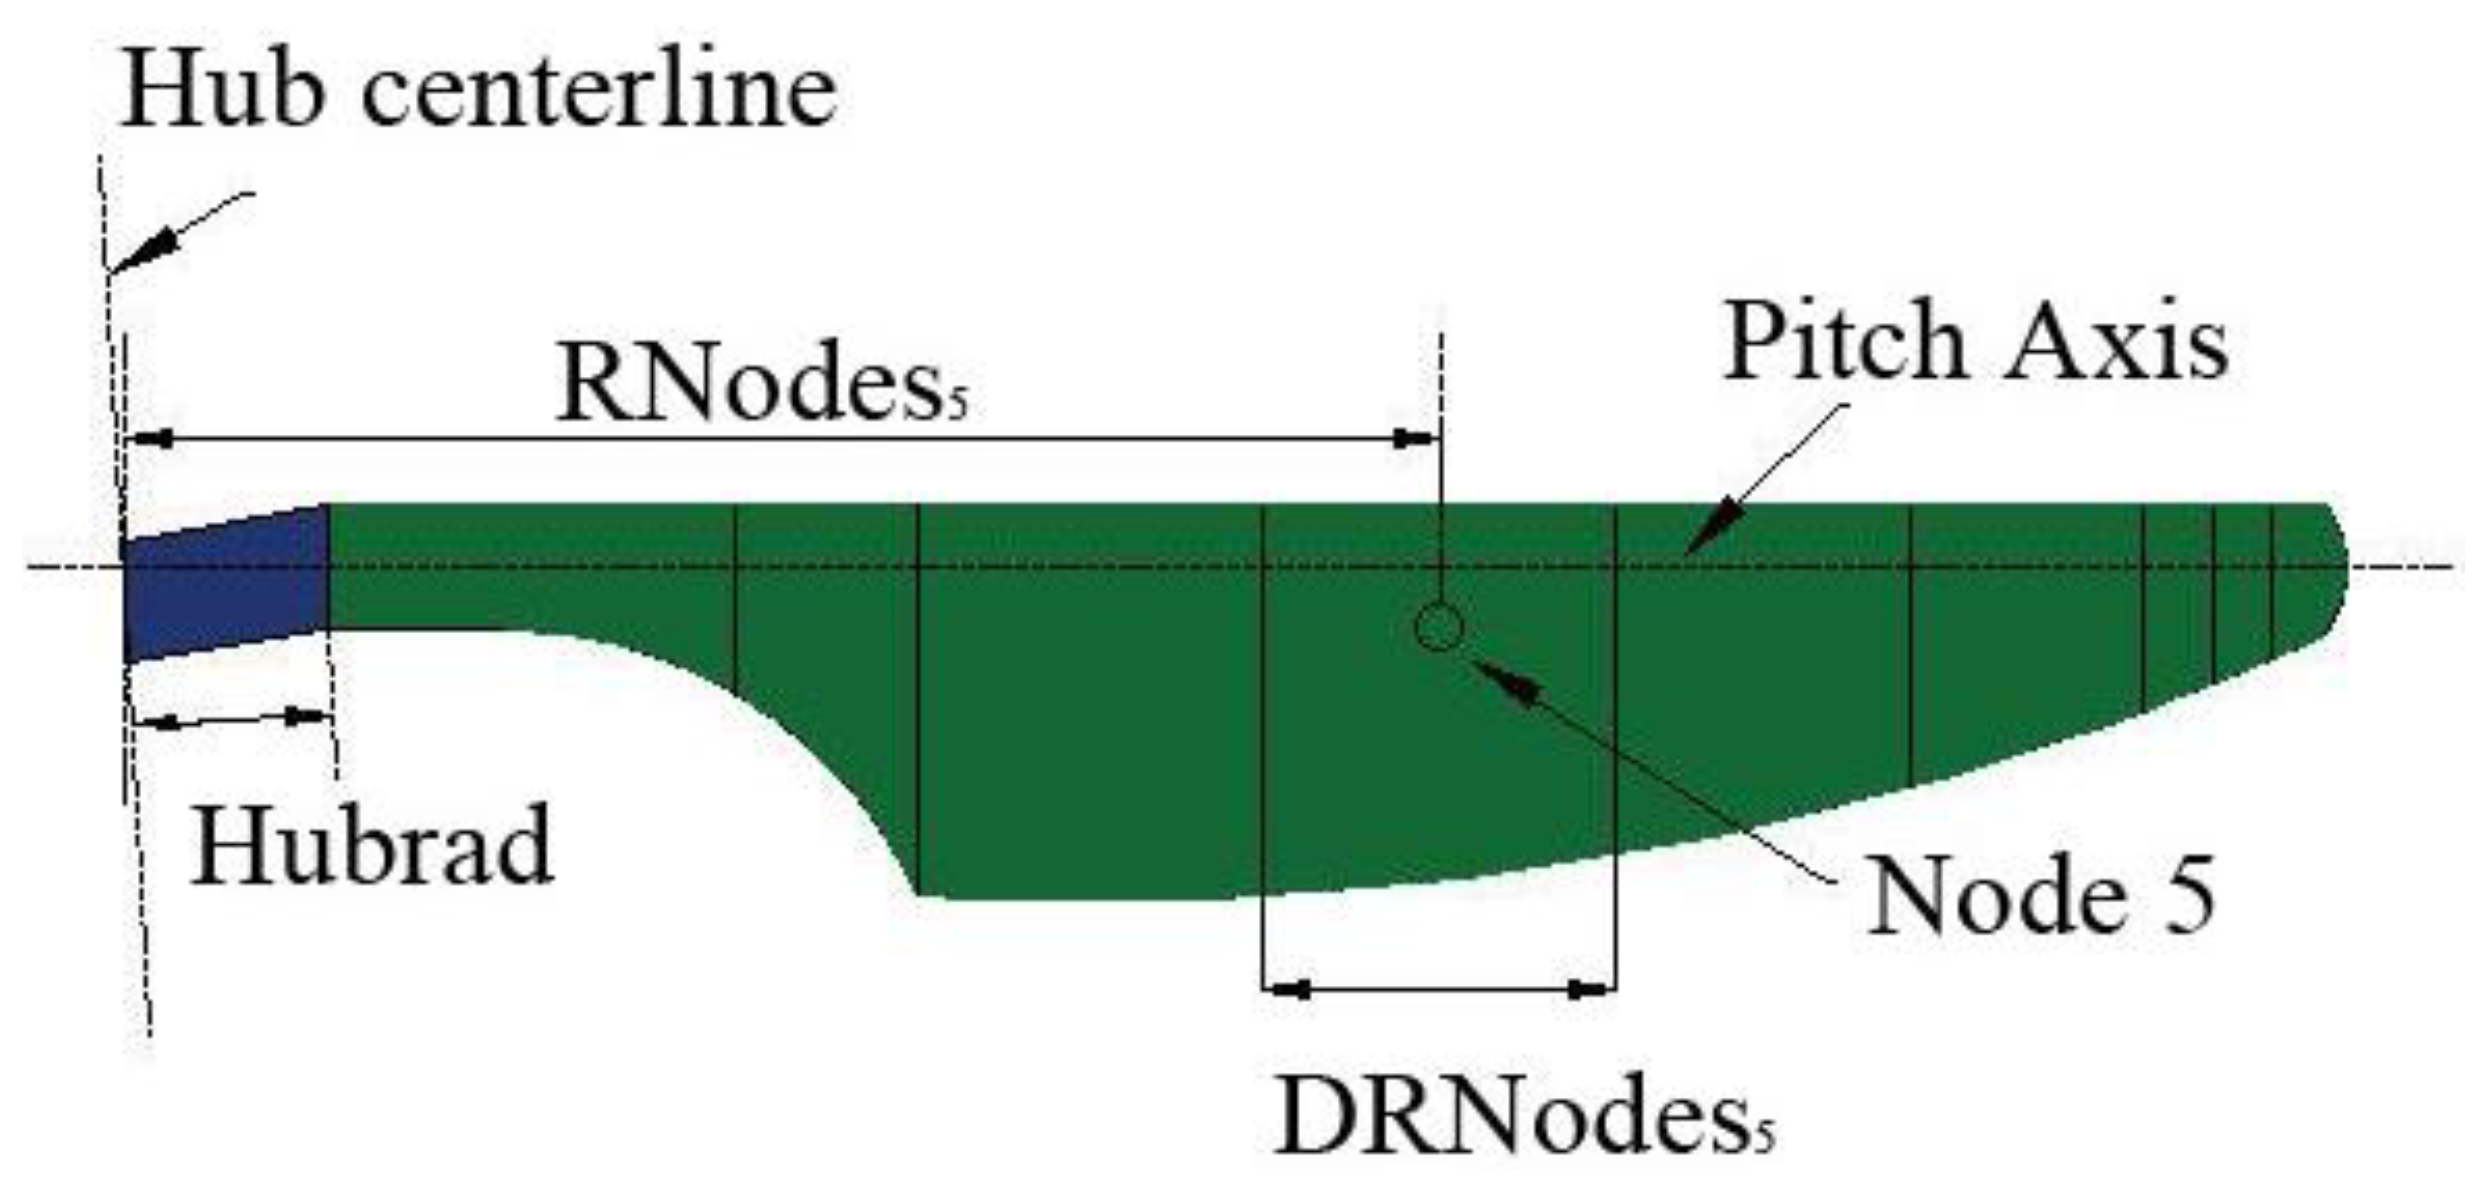
In this study, the NREL 5 MW wind turbine is used as the optimized parent form. The wind turbine is a three-blade horizontal axis wind turbine, which can be used as onshore or offshore wind turbine, and can be installed in deep-sea areas. It has gradually become a research example of large offshore wind turbines. The overall parameters of the wind turbine system are shown in the Table 1. PSO algorithm is used to optimize the design of the wind turbine blades. As shown in Figure 2, each blade of NREL 5 MW wind turbine has 19 control surfaces. After the airfoil of each control surface is selected, each control surface is determined by its twist angle and chord length. Figure 3 shows the blade layout. The control surfaces from the blade root to 4.1 m from the blade root are circular, and the overall shape is cylindrical. Therefore, the lift coefficient is 0, which makes no contribution to the aerodynamic performance of the whole blade. Therefore, only 16 control surfaces in the range of 4.1 m from the blade root to the blade tip need to be considered with a total of 16 × 2 parameters. Particle swarm space is set as 32 dimensions. For each particle, in represents the twist angle of 16 control surfaces of NREL 5 MW wind turbine blade in turn, and represents the chord length of 16 control surfaces of a blade of NREL 5 MW wind turbine blade in turn.
After K iterations, the updating speed of the ith particle in the next iteration is as follows:
where
In the next iteration, the position of the ith particle is:
where C1 and C2 are learning factors and non-negative constants, which can accelerate the convergence rate if appropriate selected; ω is inertia weight; r1 and r2 are random numbers distributed between [0,1].
In order to prevent premature convergence, which leads to local optimal solution of the algorithm, an improved PSO algorithm is adopted. After K iterations of the ith particle, the velocity update equation is changed to:
Improved PSO algorithm can enable particles to learn from excellent particles in the crowd and enhance particle search ability. The aerodynamic profile of offshore wind turbine blades is determined by the optimization results of PSO algorithm. Under the combined action of wind and waves, the floating wind turbine power is in a fluctuating state. The wind turbine power at balance position in a period of time is taken as the average power during this period. The optimization objective is to select the wind turbine blade with the maximum power at balance position. The fitness of each particle of the particle swarm is selected as the wind turbine power at balance position generated by FAST. By changing the distribution of twist angle and chord length of the blade and studying the change rule of aerodynamic performance of the wind turbine, the optimal design of the wind turbine blade can be determined.
When the program runs, the whole particle swarm is initialized to generate the initial population. The PSO algorithm needs to set an upper bound (ub) and a lower bound (pb) to prevent the particles from deviating from the solution range in the search process. At the same time, the algorithm can reduce the impact of the optimization results on the blade structure, strength and control system. In this study, the upper and lower bounds of particle swarm are ±10% of the original parameters of NREL 5 MW wind turbine blade. When the twist angle and chord length of any one-dimensional interface of a particle in particle swarm exceed the limit, the program sets the exceeding values as ub and pb. After the program starts to run, FAST is automatically called to calculate the fitness of each particle in the iteration process. When the set number of iterations is reached or the relative error between the average fitness of particle swarm and the fitness of particle swarm is less than 0.5%, the program automatically terminates.
3. Validation of Particle Swarm Optimization
The improved PSO algorithm employed in this study has been verified and applied in the work of Liao et al. [24]. They compared the optimized results of improved PSO algorithm with those of Glauert method that was a traditional design method for the wind turbine blade. The comparison results showed that the shape parameters of the wind turbine blade obtained by improved PSO algorithm were more reasonable, which could meet the design requirement. The blade designed by improved PSO algorithm also had better performance than the blade designed by the Glauert method. In this study, in order to verify the feasibility of the blade optimization design method combining PSO algorithm with FAST program, the twist angle, chord length and power improvement of the wind turbine blades before and after optimization are analyzed by taking the NREL 5 MW wind turbine as the optimized parent form. During validity verification, the 5 MW wind turbine is considered as an offshore fixed wind turbine, and the foundation is anchored to the sea floor. The optimization of the wind turbine is carried out under steady wind. Therefore, in the main input file of FAST, CompMooring and CompHydro are both equal to 0. The six degrees of freedom of the platform in the ElastoDyn module is set to 0. The particle swarm size is 30. The number of iteration steps is set to 30. The time step is 0.0125 s, and the calculation time is 1000 s.
3.1. Optimization of Fixed Wind Turbine Blade at Rated Wind Speed
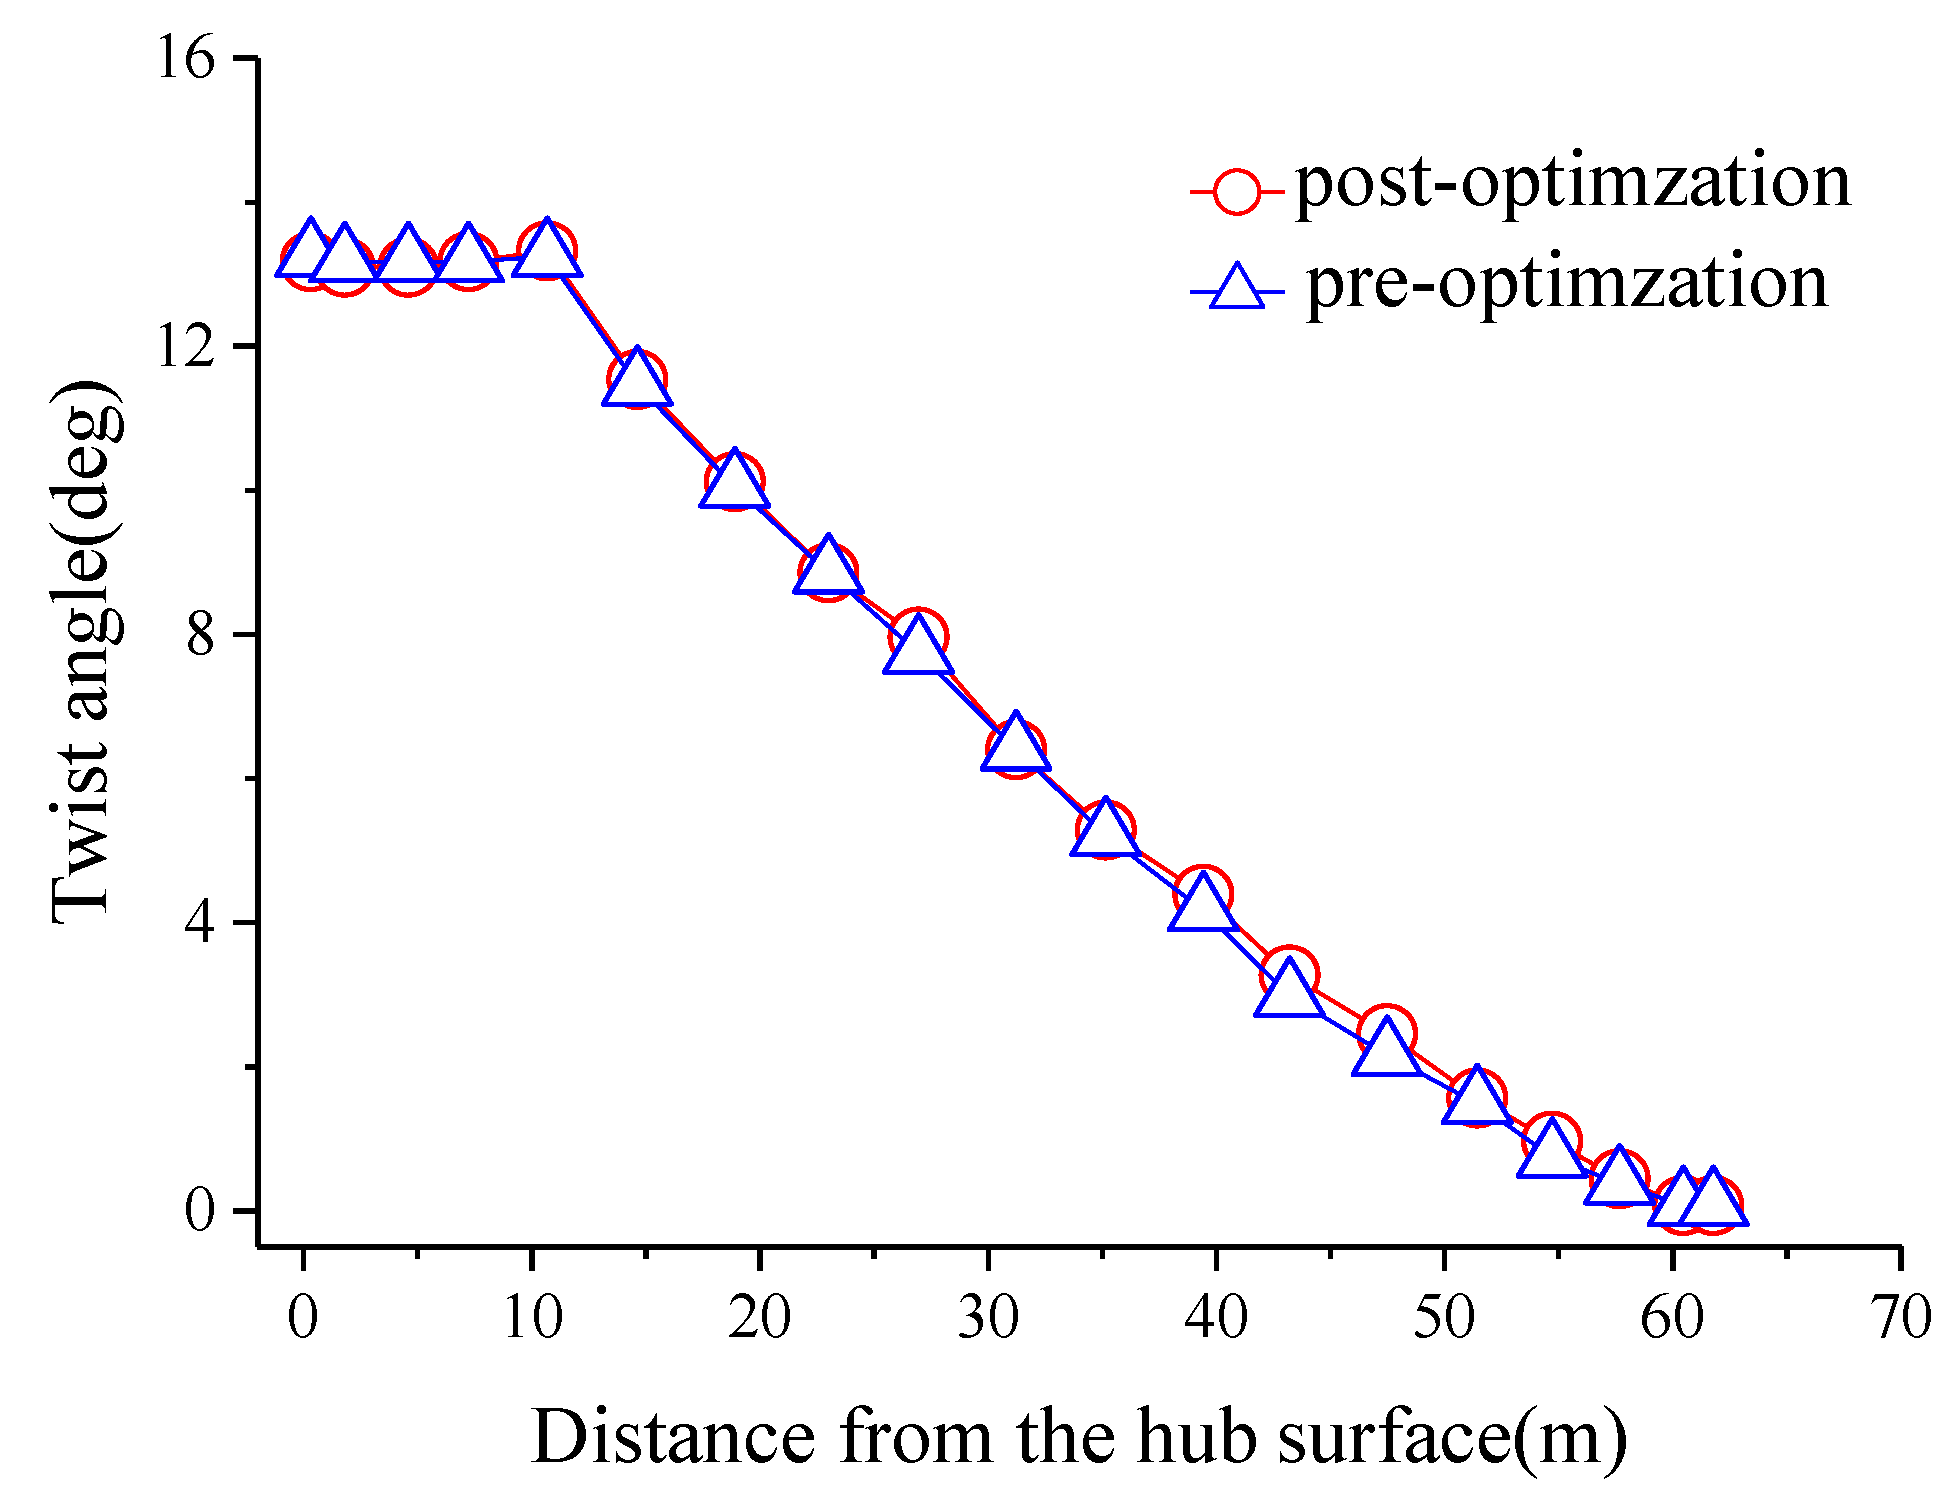
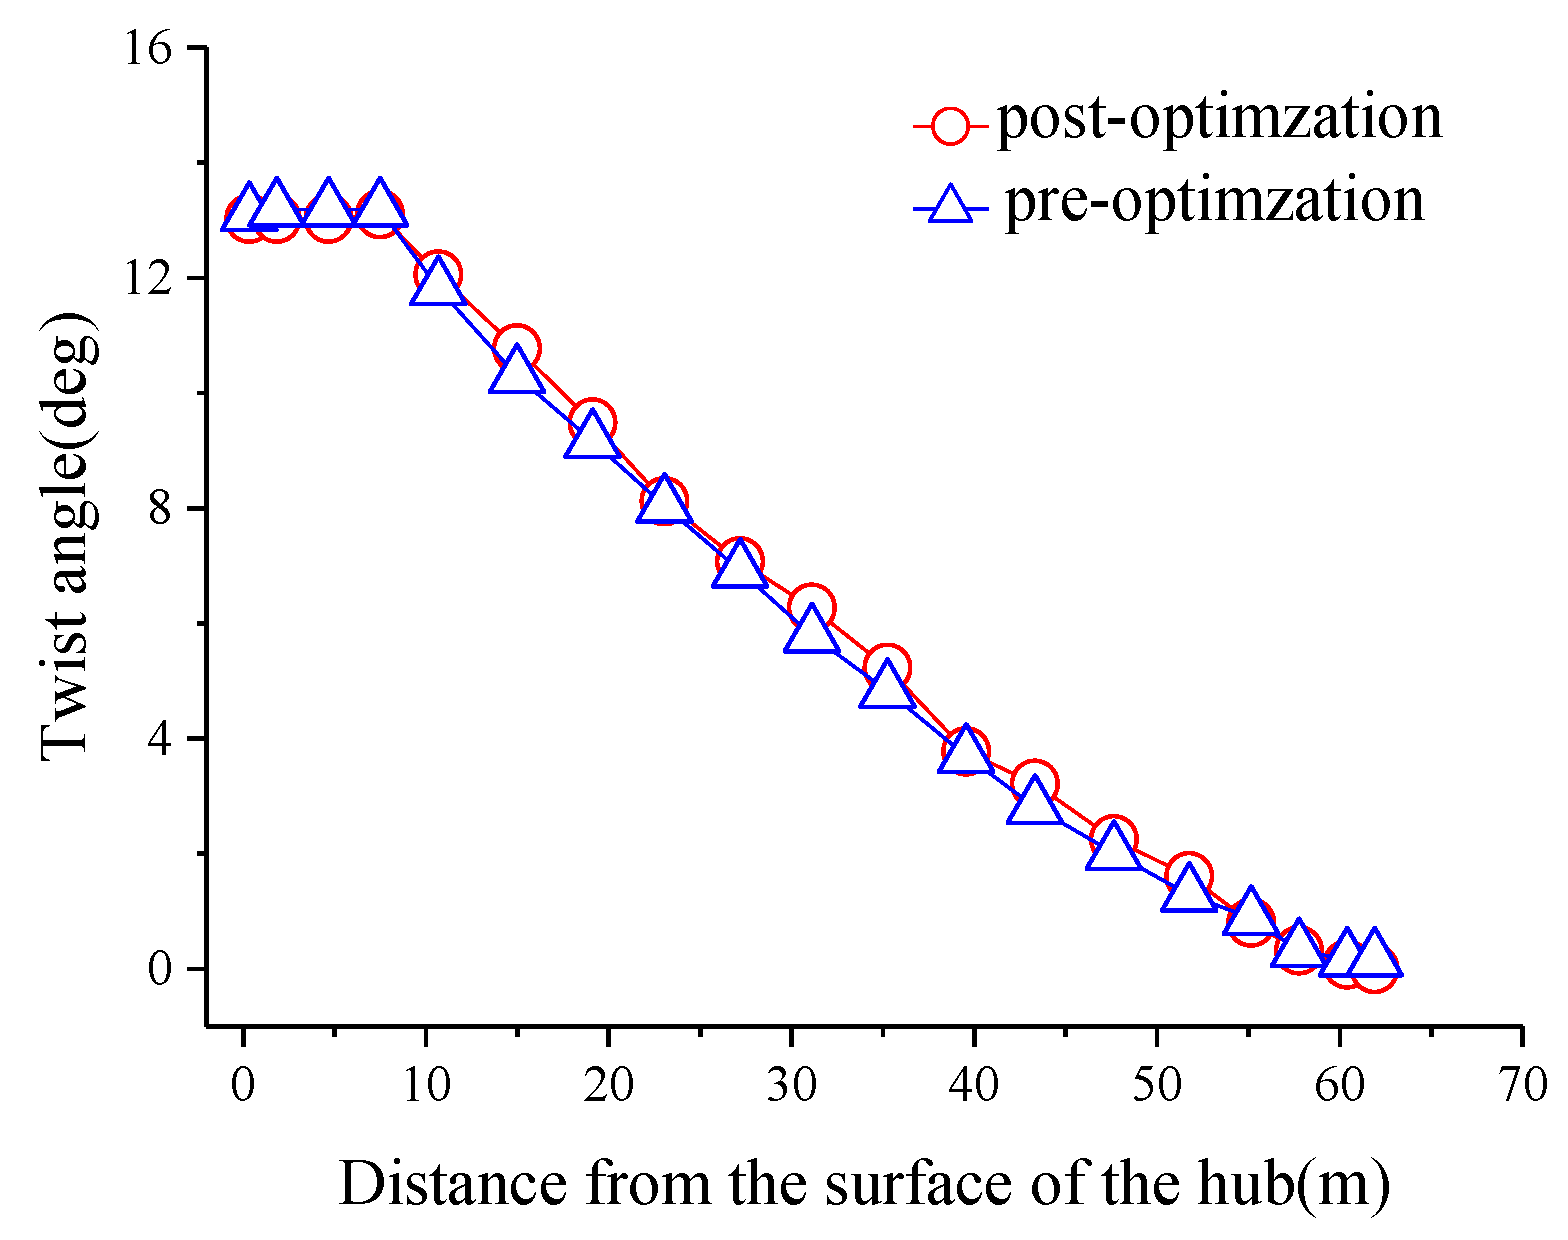
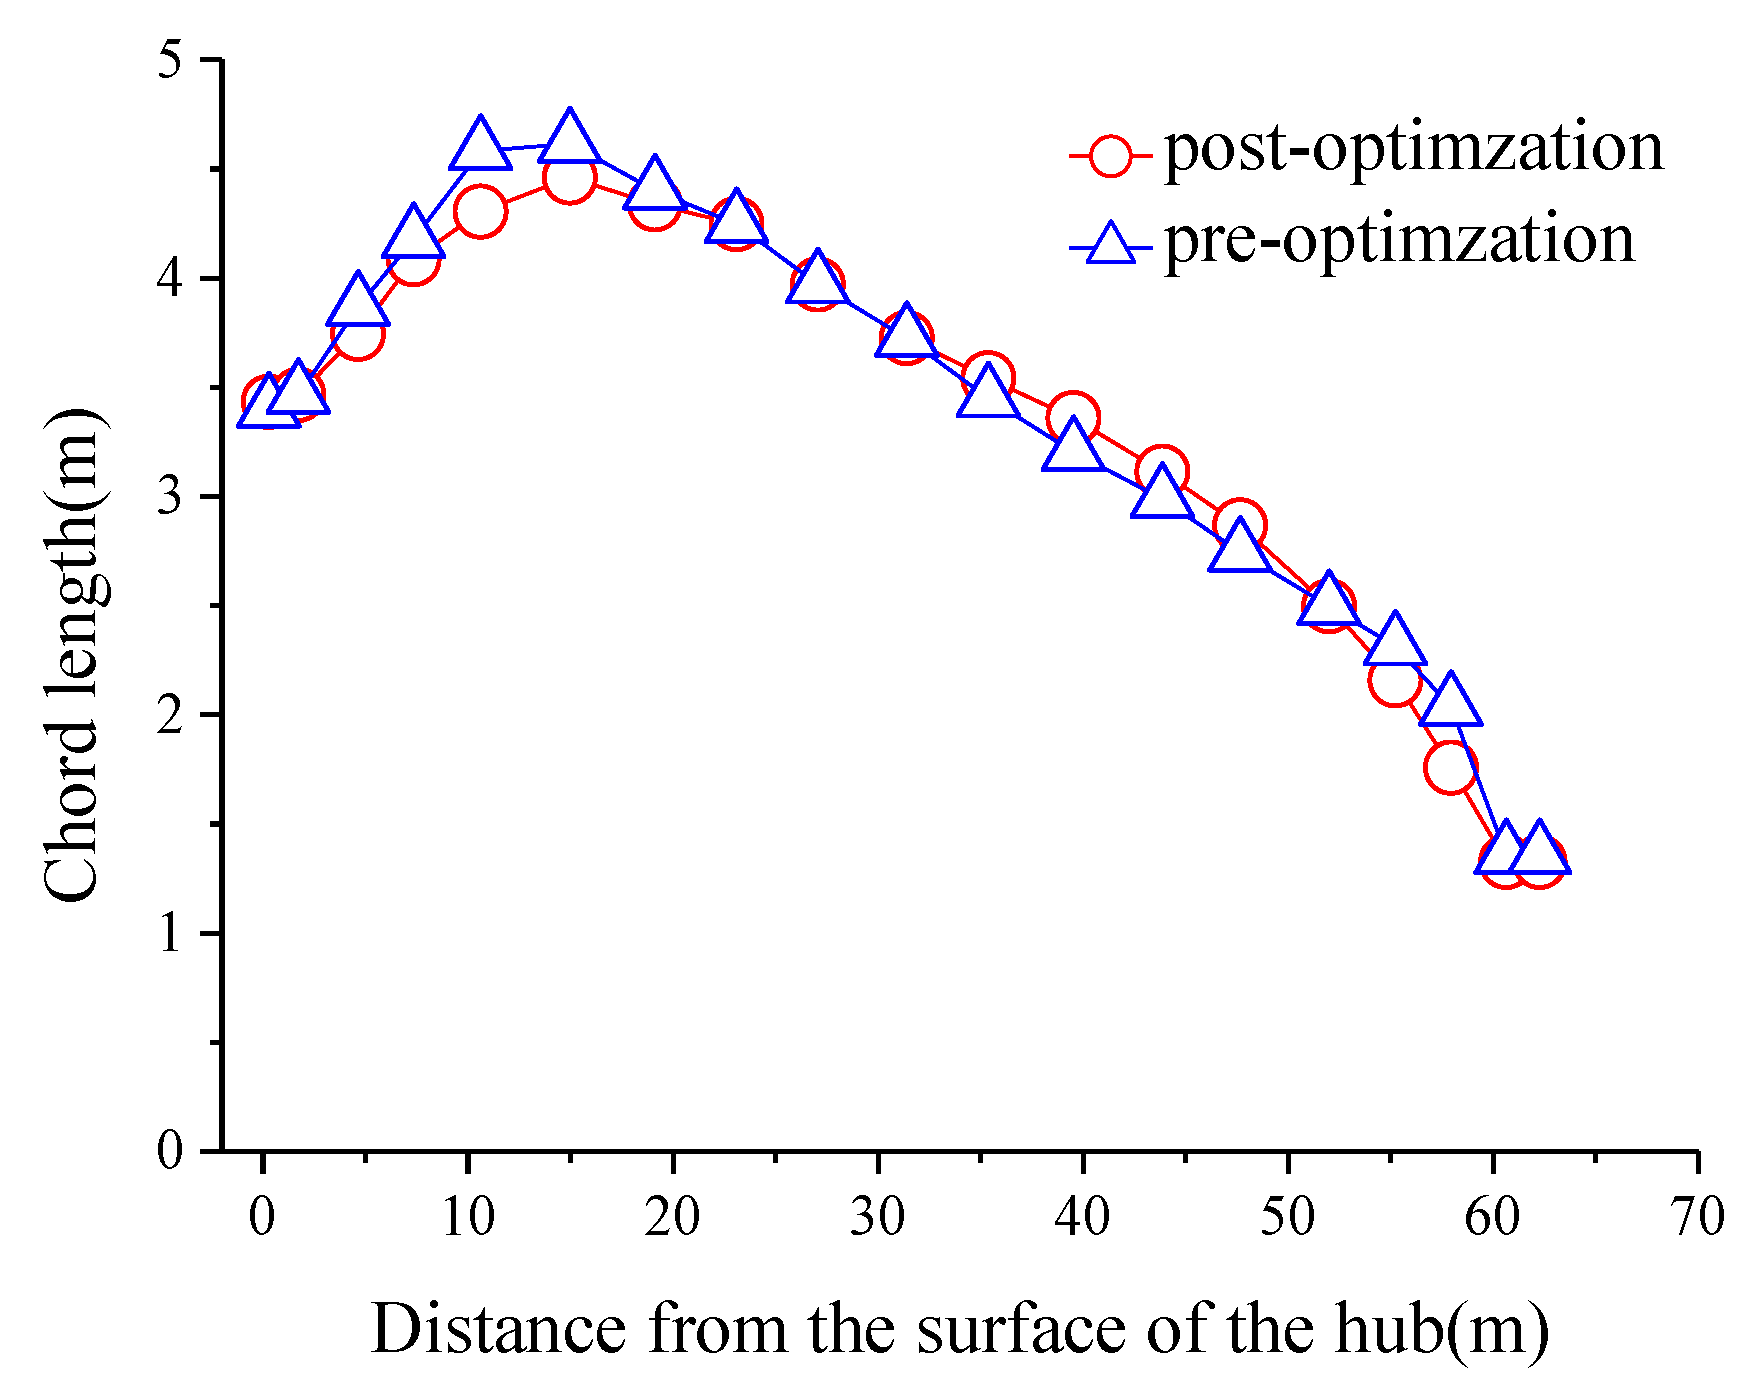
Comparing the twist angle and chord length of the optimized particle with that before optimization, as shown in Figure 4 and Figure 5, the chord length of the optimized blade is slightly larger than that of the optimized blade after 10 m from the hub surface, and the twist angle is almost the same before and after optimization. From the graph, it can be seen that the distribution of the twist angle and chord length of the blade will jump after optimization by particle swarm optimization. This is because particle swarm optimization is only a theoretical calculation. In the calculation, the optimal twist angle and chord length of each control surface are considered only in theory, and the continuity of blade structure is not considered in the actual manufacturing process. Therefore, in the following blade optimization process, if there is a large jump in the distribution of twist angle and chord length, polynomial fitting is used to smooth the blade.
The optimized power is 5037.3 kW, which is approximately equal to 5030 KW of the wind turbine before optimization, and the improved power is 0.145%. Under rated wind speed condition, the optimization effect of the wind turbine blade is not great. This is because the NREL 5 MW wind turbine is designed according to the rated wind speed of 11.4 m/s, and the twist angle and chord length of each control surface have been designed according to the optimal size.
3.2. Optimization of Fixed Wind Turbine Blade at Low Wind Speed
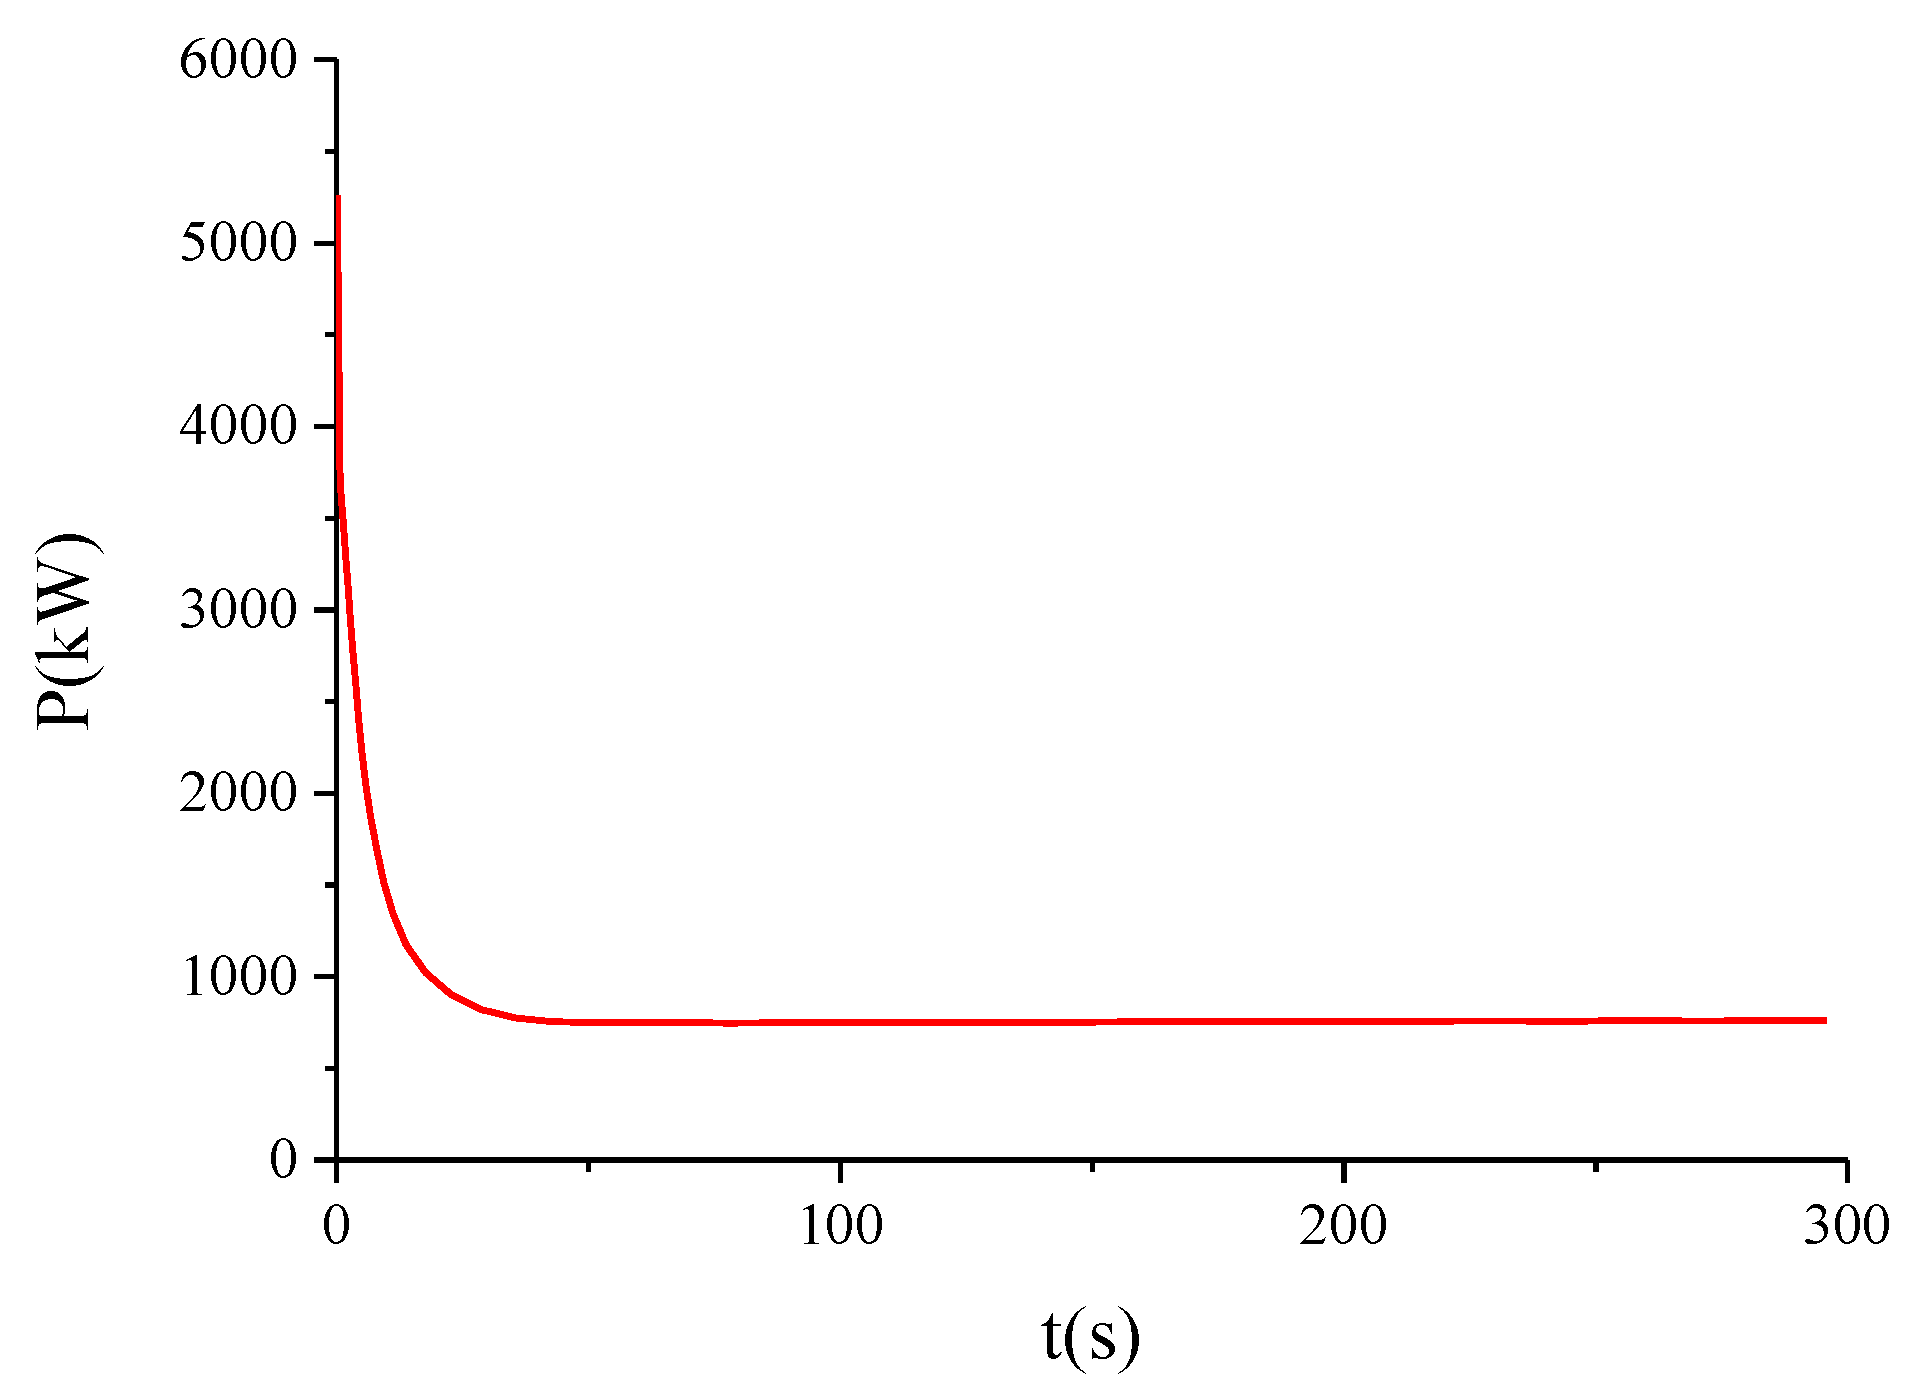
In order to verify the PSO algorithm, the typical operating conditions of China’s offshore waters with a wind speed of 6 m/s are selected. The time step is set to 0.0125 s and the time domain calculation period is 300 s. The time domain calculation result of NREL 5 MW wind turbine power is shown in Figure 6.
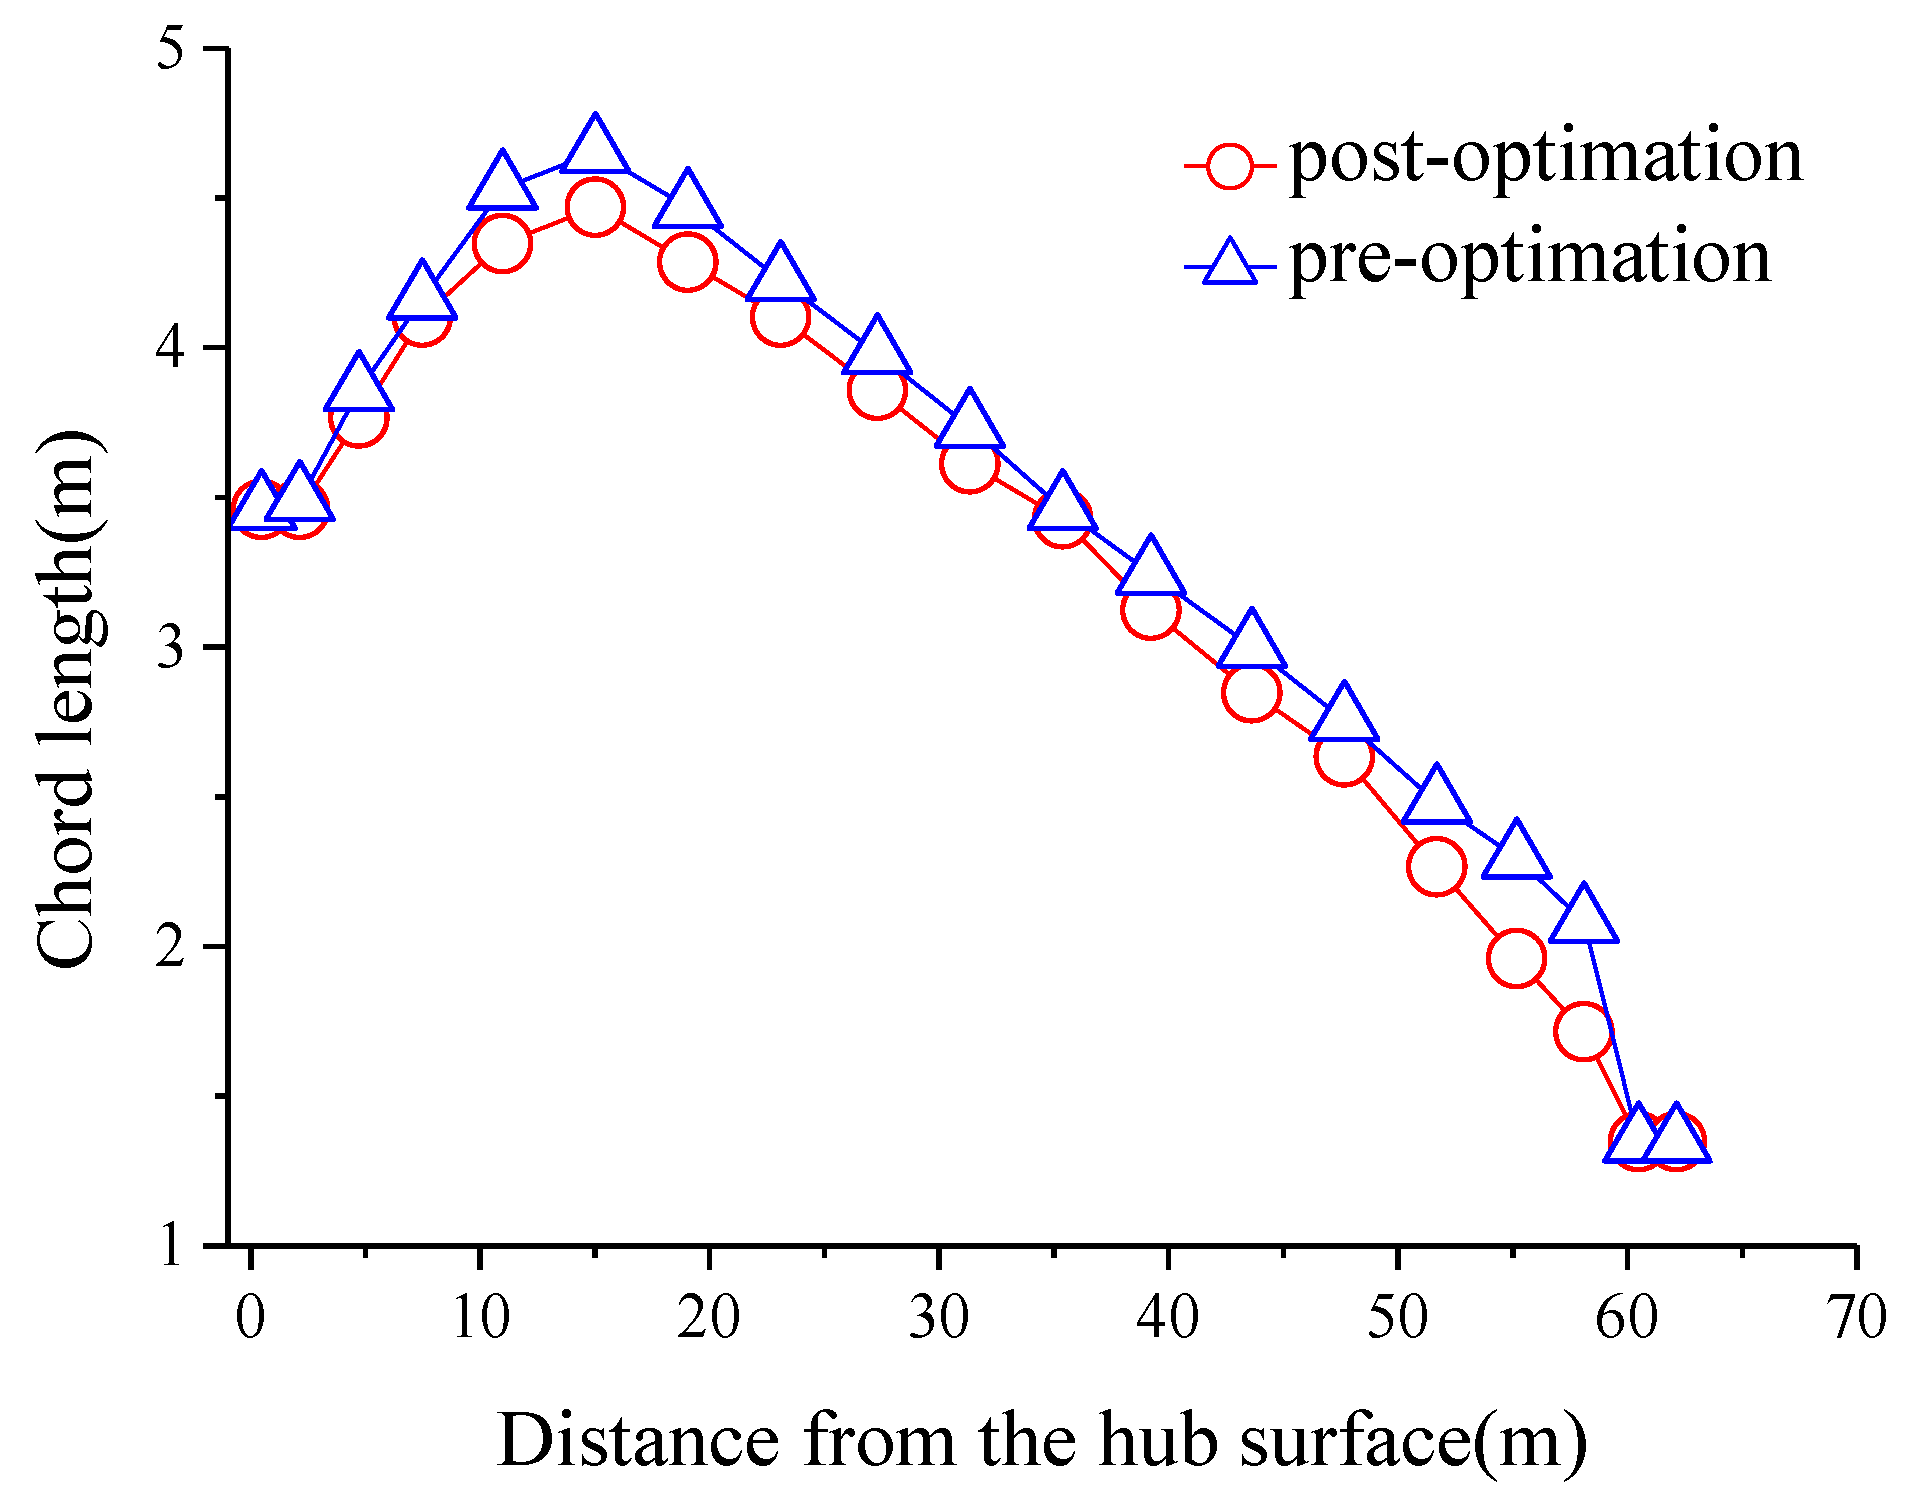
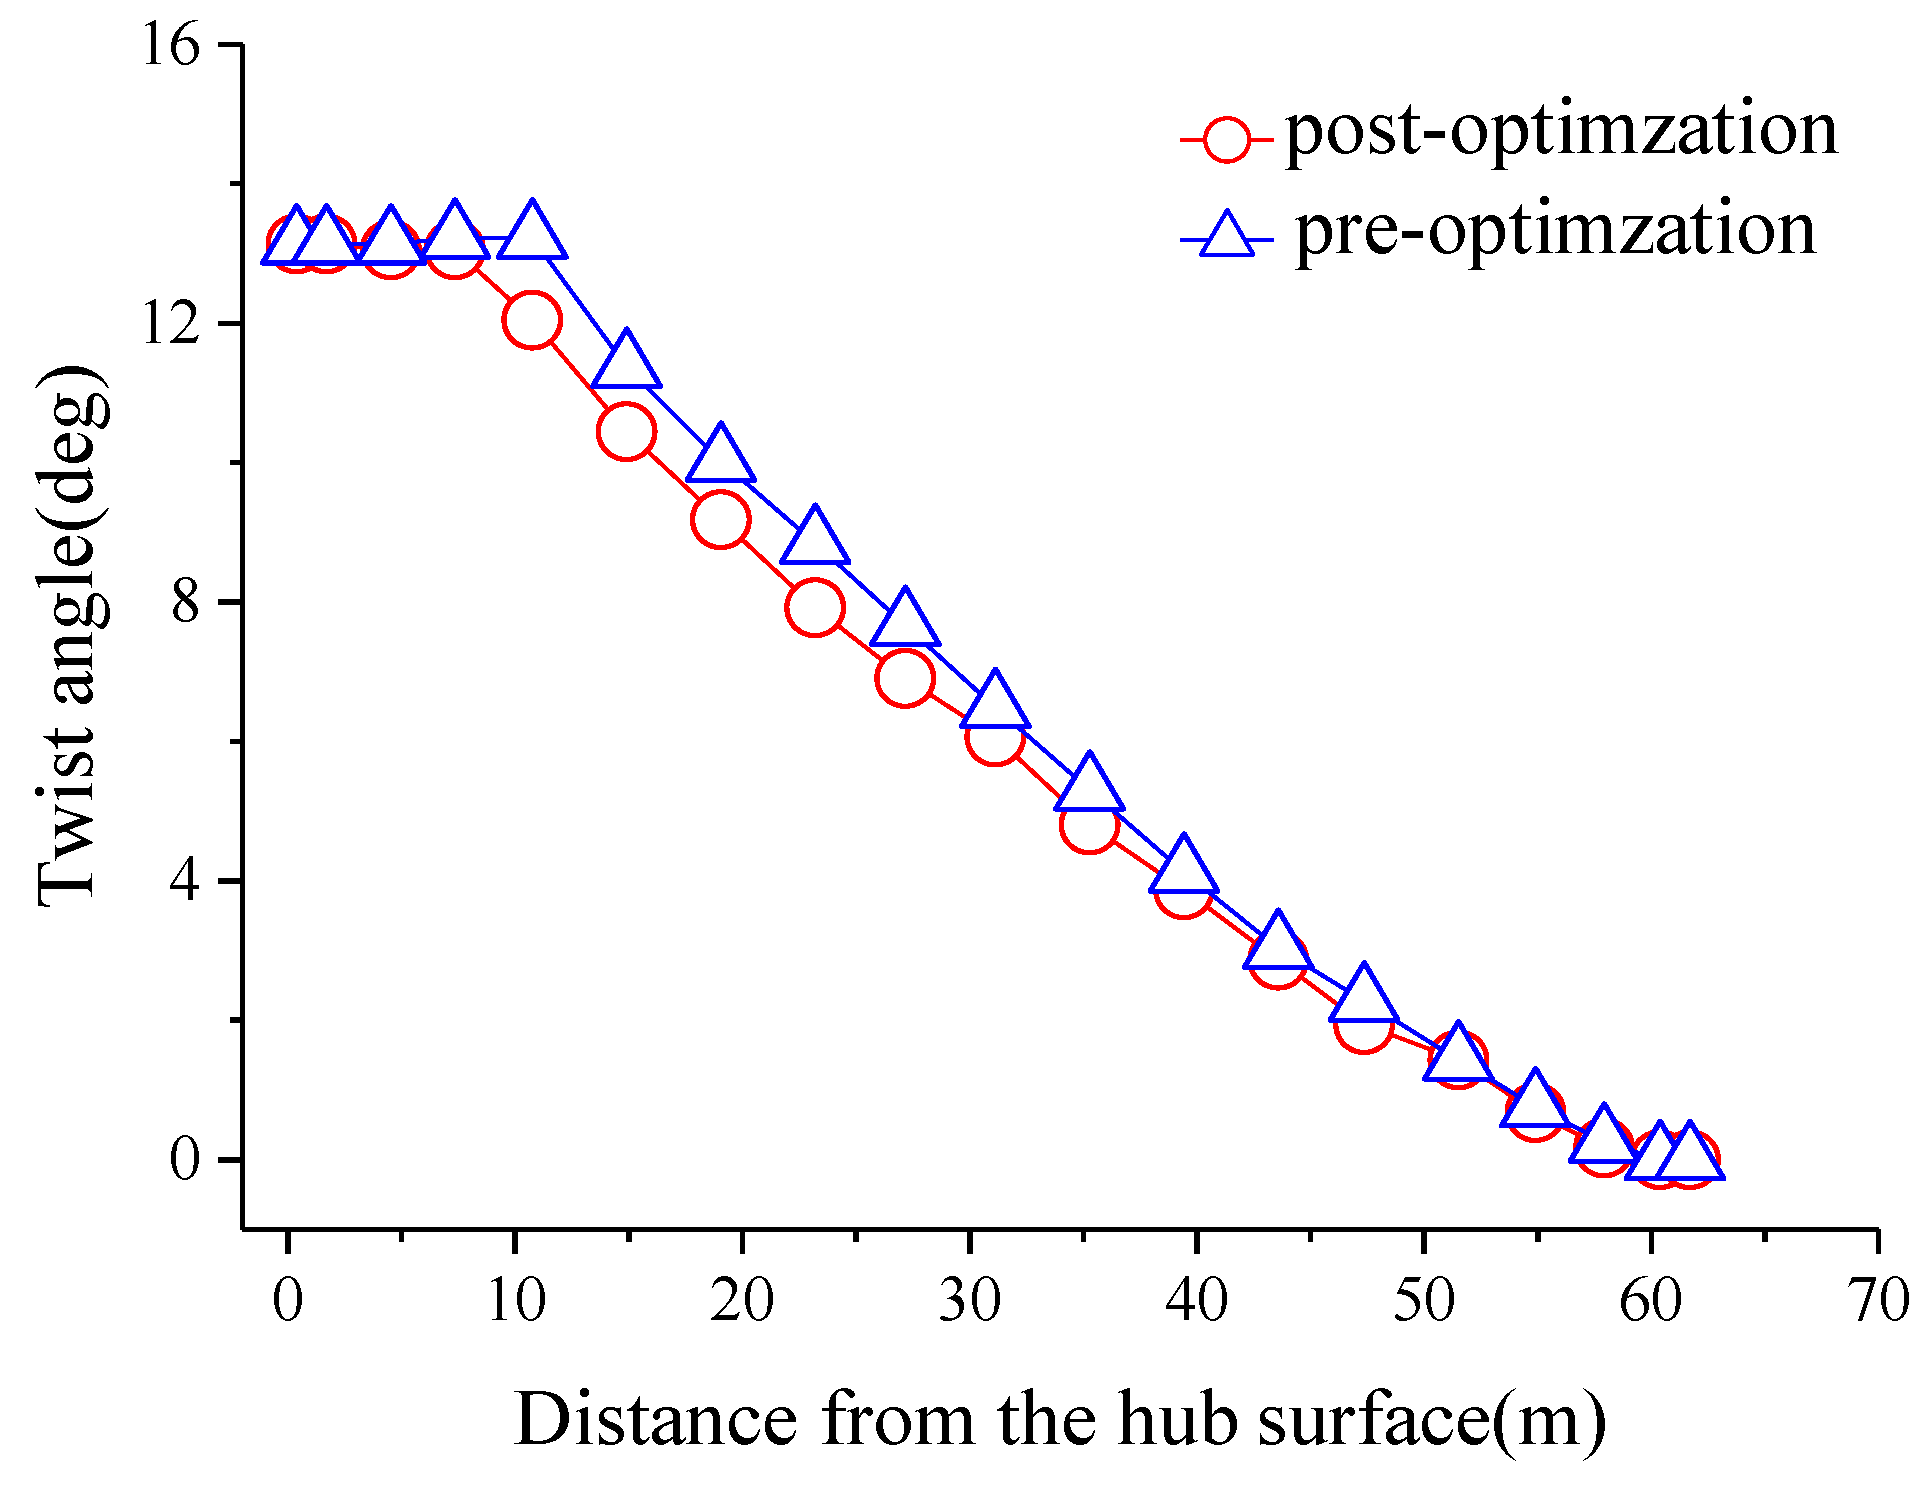
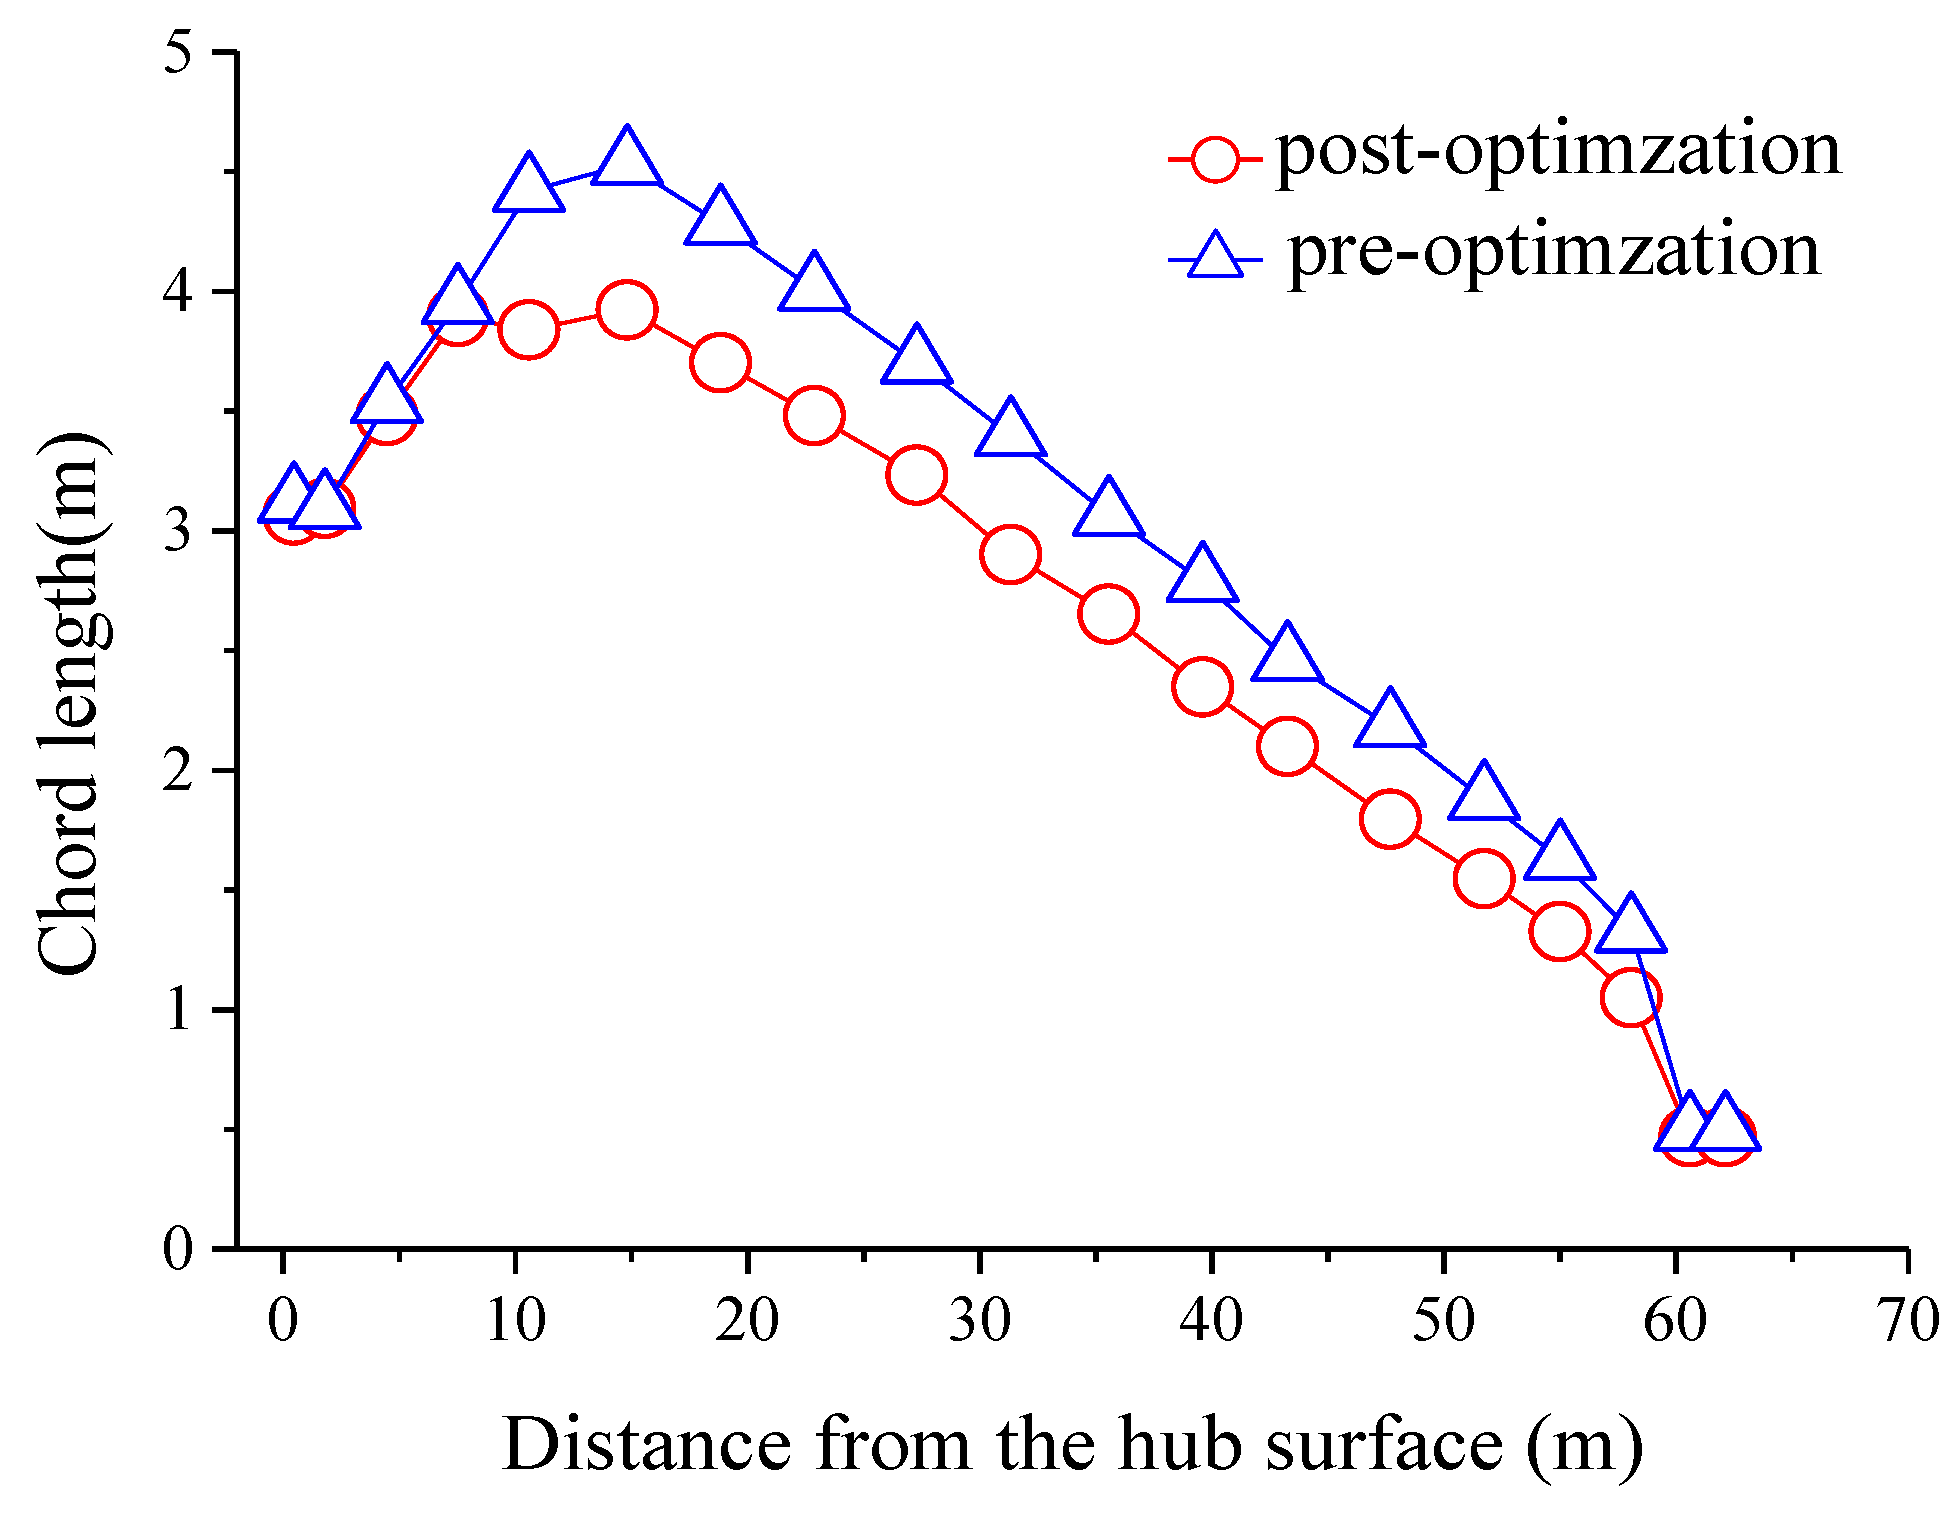
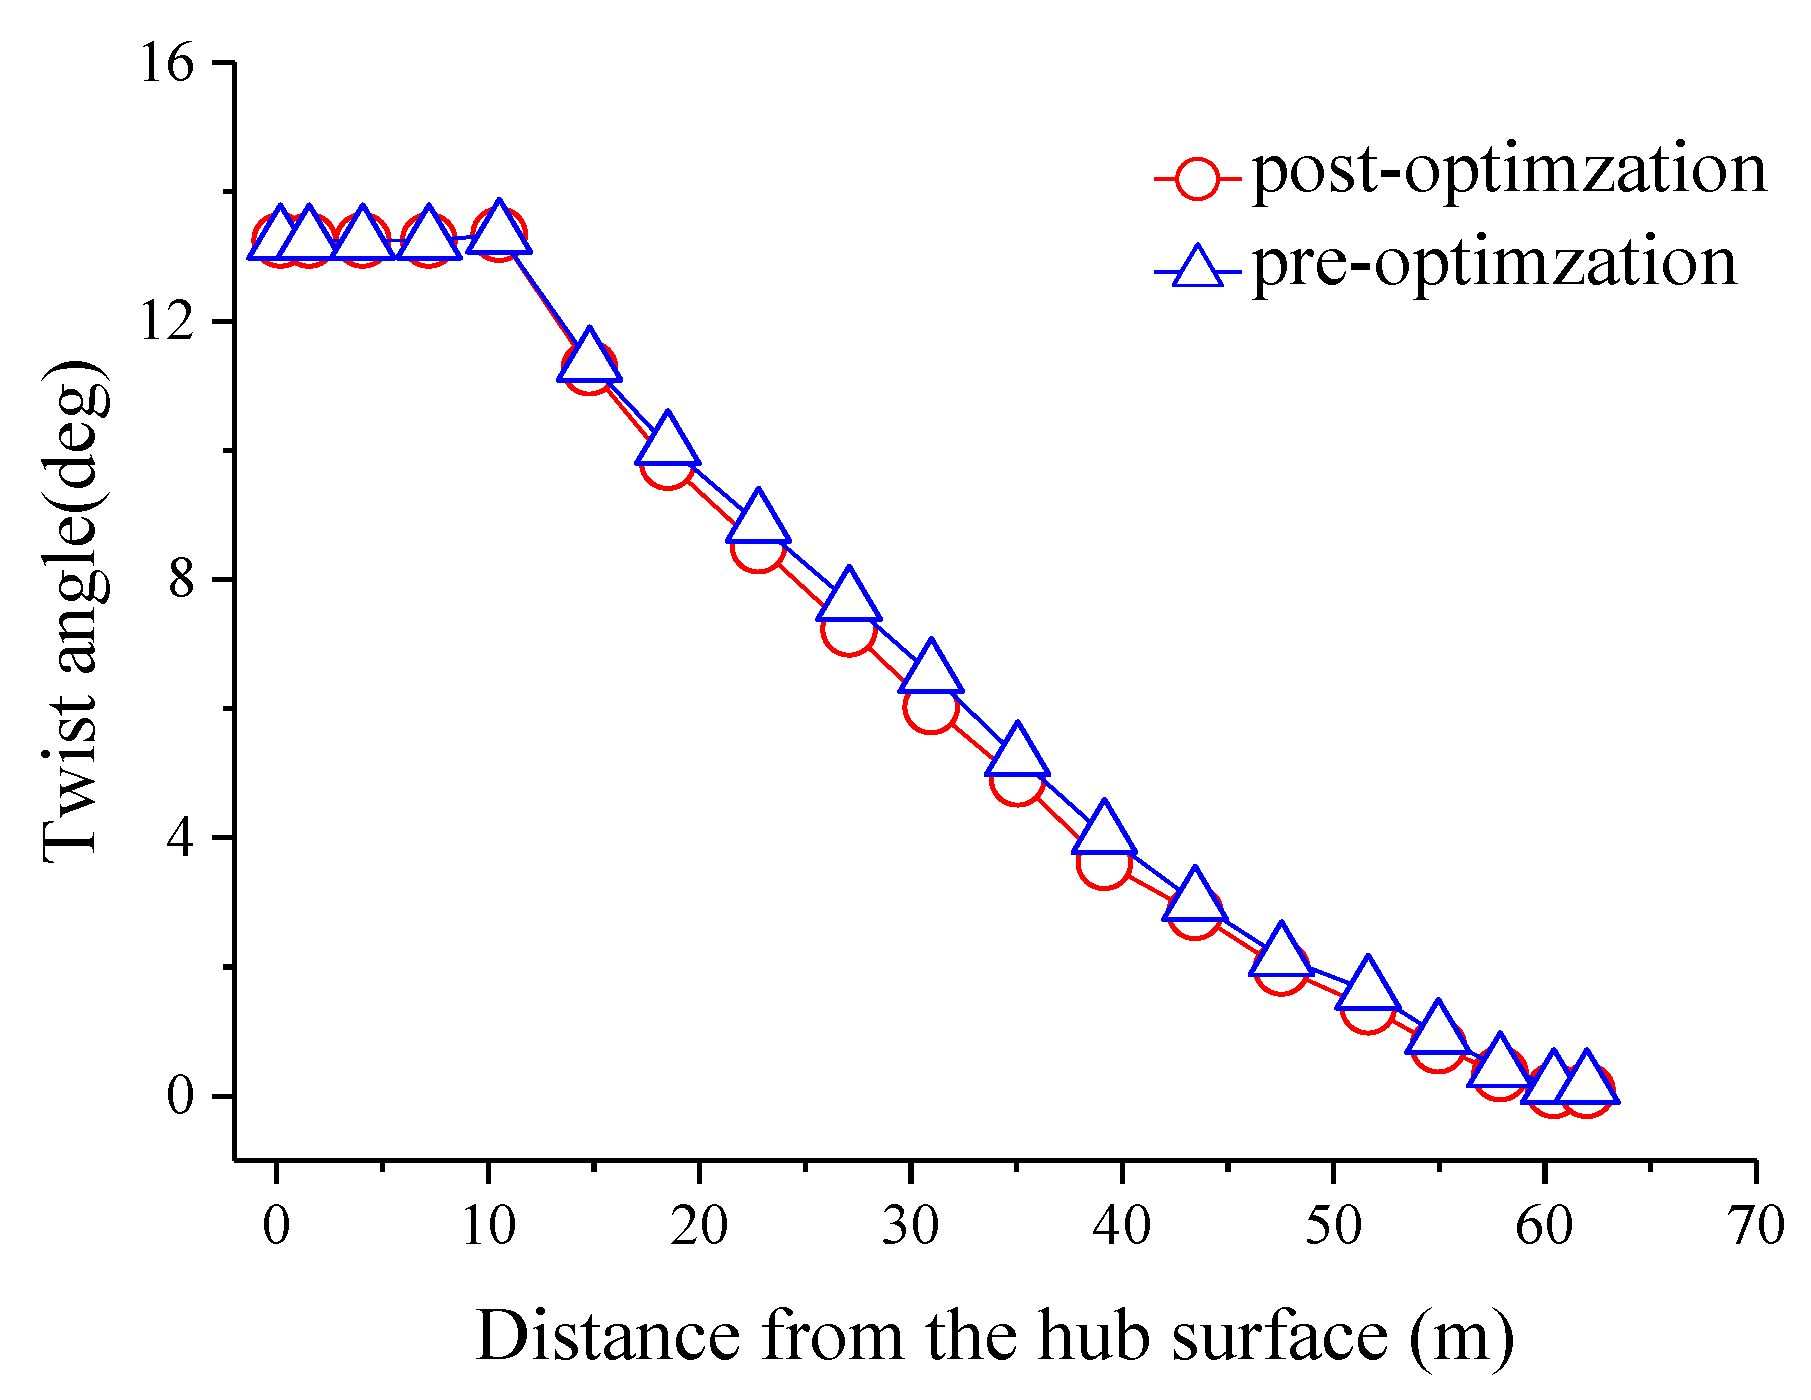
Figure 7 and Figure 8 depict the distributions of the chord length and twist angle before and after optimization. After iterative screening of the PSO algorithm designed in this paper, the distribution of the chord length in the range of 10 m to 35 m from the hub surface of the wind turbine is less than that before optimization. The chord length of the control surface at 34.85 m is basically the same as that before optimization. The chord length in the range of 34.85 m from the hub surface to blade tip decreases further. The distribution of the twist angle in the range of 10.25 m to 38.95 m from the hub surface of the wind turbine is less than that before optimization. After 38.95 m, the distribution of twist angle after optimization is close to that before optimization.
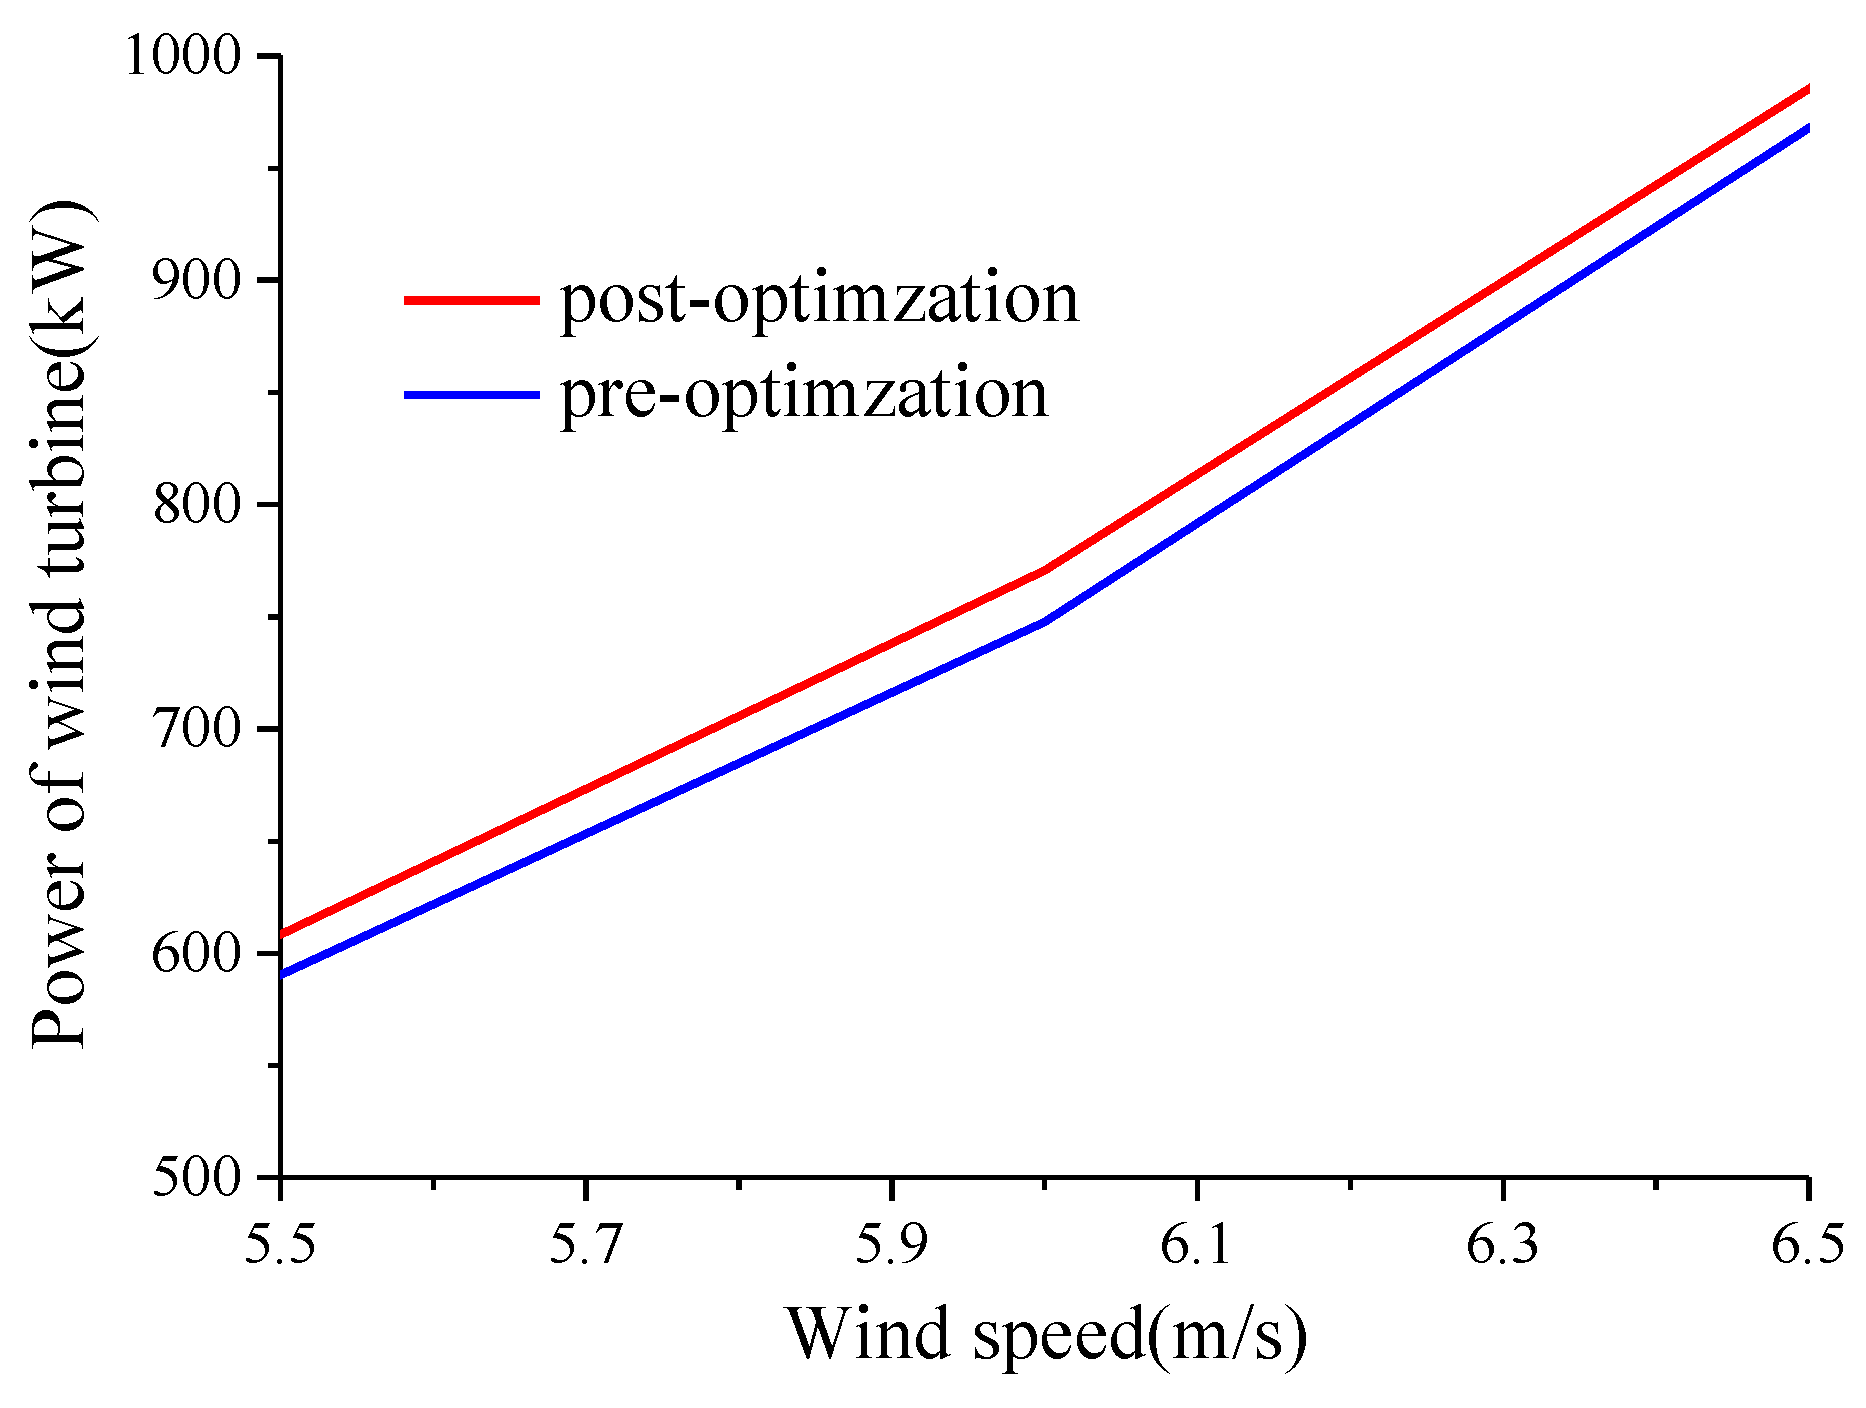
The optimized wind turbine power is 760 kW, larger than 750 kW before optimization, and the power is increased by 1.4%. The enhancement effect is obviously larger than that at rated wind speed. In addition, when the wind turbine works, the wind turbine adjusts its position by yaw to adapt to the incoming wind. The phase angle between the impeller and the wind turbine blade changes periodically. Thus, the aerodynamic characteristics of the wind turbine blade need to have roughness. As can be seen in Figure 9, the optimized wind turbine power has been promoted obviously in the range of 5.5 m/s to 6.5 m/s of low wind speed. This indicates that the optimized wind turbine blades meet the roughness requirements of aerodynamic characteristics. Therefore, the blade optimization program based on PSO algorithm and FAST secondary development has an obvious effect on blade optimization at low wind speed. The sensitivity to wind speed is reduced, and the twist angle and chord length are also reduced. The ability of PSO algorithm to solve non-linear and global optimization problems is verified. It also proves the effectiveness of PSO algorithm in aerodynamic optimization of the wind turbine blades.
4. Optimization of Offshore Wind Turbine Blades
The waves cause the motion of the foundation platform of floating wind turbines, which result in change of relative wind speed of the wind turbine. Accordingly, the aerodynamic performance of the wind turbine also changes, which is the main difference between floating wind turbine and fixed wind turbine. Therefore, for floating wind turbines installed in different sea areas, the influence of sea conditions should be taken into account in the design of the wind turbine blade. It has significant theoretical and practical meaning to develop optimization design method for the wind turbine blade that is suitable for different sea conditions.
In this paper, the optimization design of NREL 5 MW_OC3Hywind wind turbine blade is carried out by using the sea state parameters listed in Table 2. The incident wave is regular wave parallel to the hub axis.
4.1. Influence of Regular Wave Height and Period on Wind Turbine Power
In order to study the effects of wave height and period of different regular waves on floating wind turbines, several typical wave heights and periods are selected respectively. The coupling model of 5 MW wind turbine-SPAR platform-mooring system is developed by FAST to calculate for different conditions. The wind turbine powers at wave crest, wave trough and equilibrium position are selected for analysis.
4.1.1. Effect of Wave Height on Wind Turbine Power
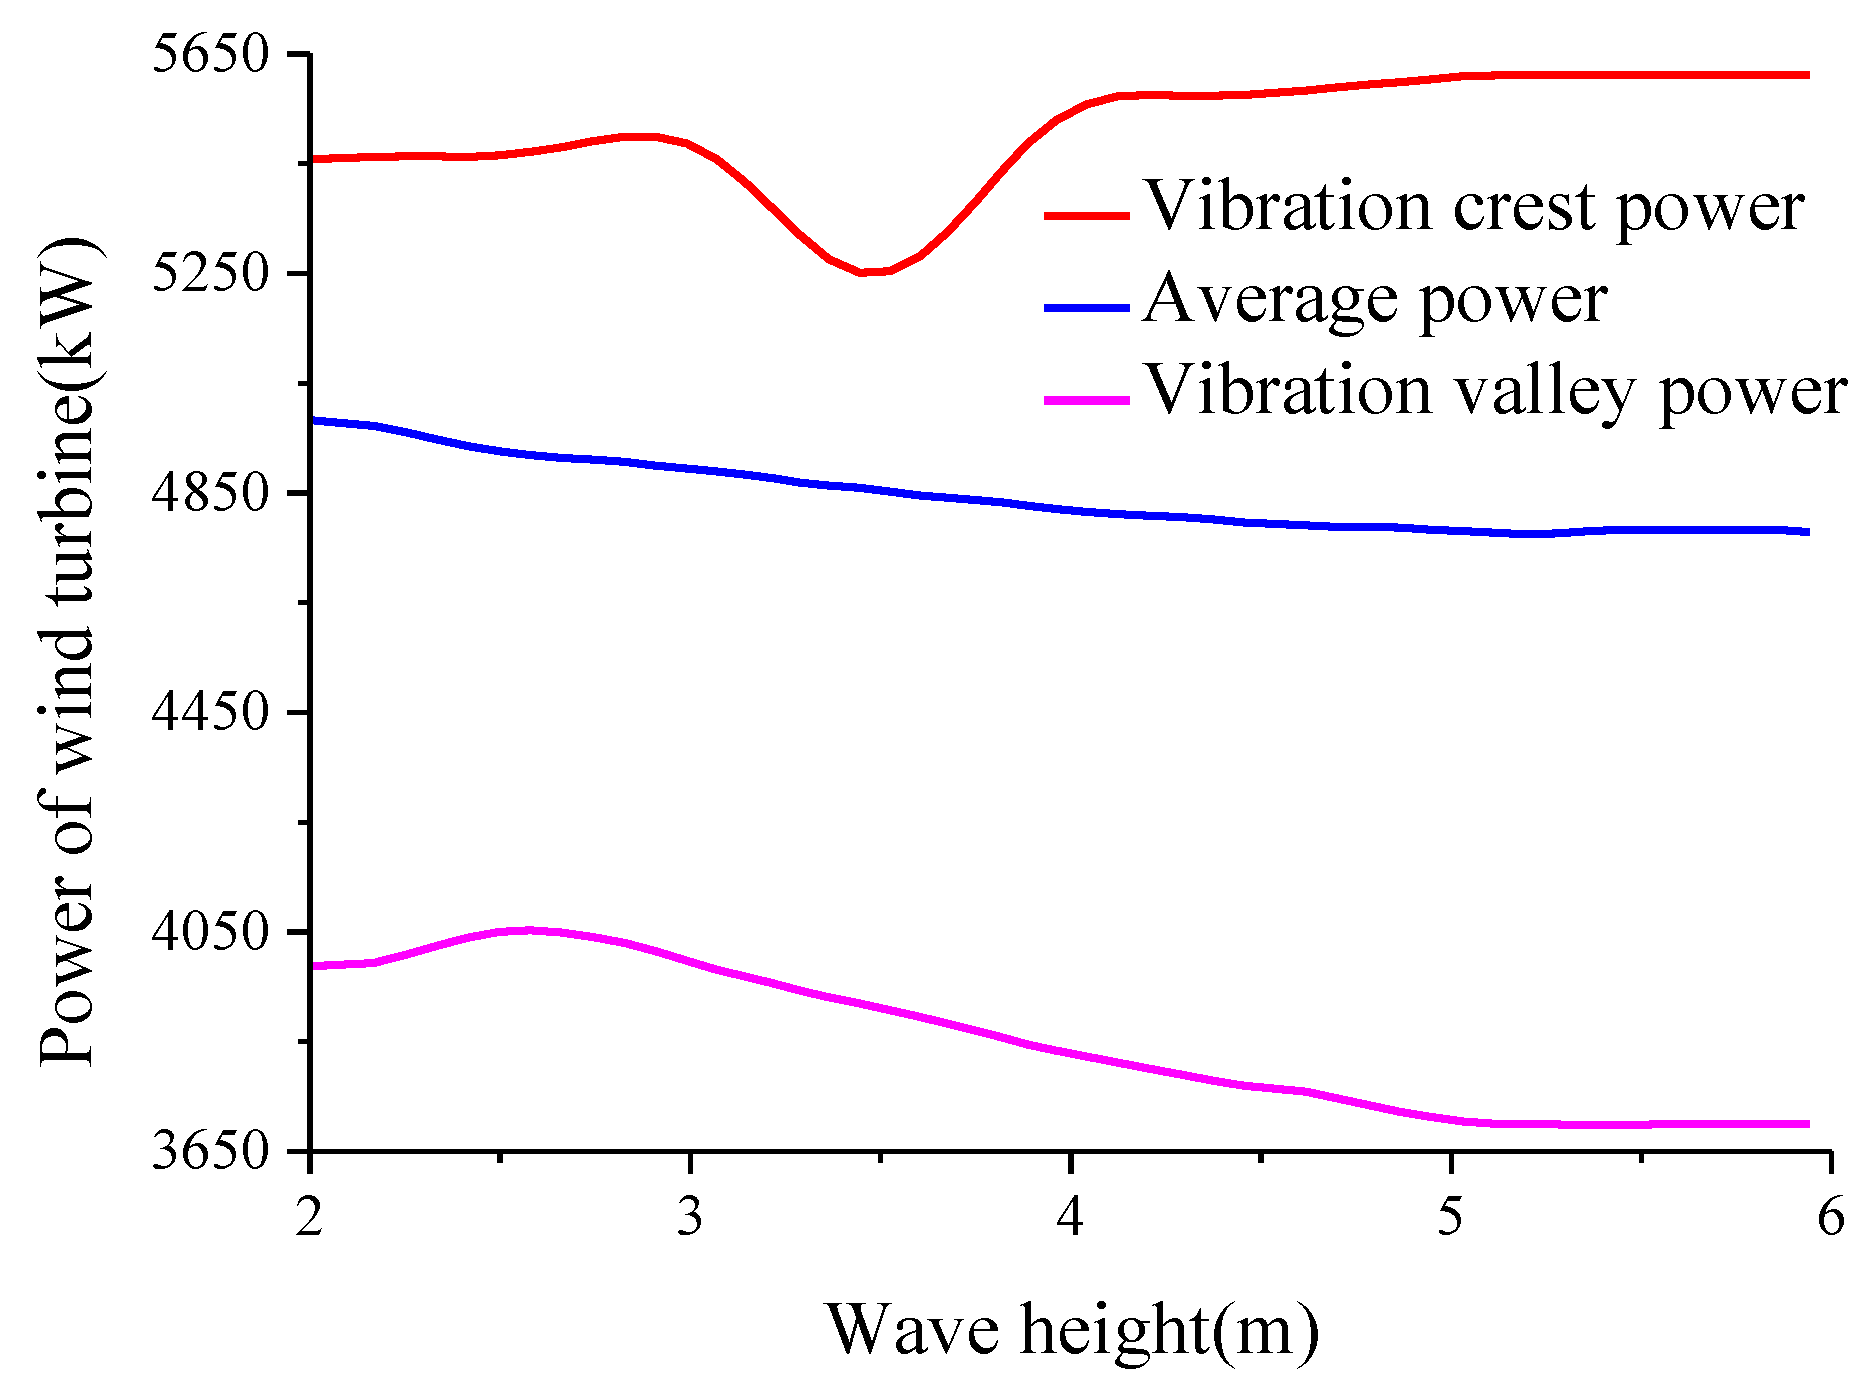
Figure 10 shows the change of the wind turbine power with a significant wave height, with the direction and period of the wave remaining unchanged. As the significant wave height increases from 2 m to 6 m, the wave peak power fluctuates greatly. The wave peak power shows a parabolic distribution in the range of 3 m to 4 m for significant wave height, increasing from 5460 kW to 5610 kW. The wave trough power increases slowly at first and then decreases sharply, from 3980 kW to 3770 kW. The wave peak power and wave trough power of the wind turbine fluctuate irregularly with wave height. This is due to that the floating foundation is fixed on the sea floor through anchor chains. When the floating platform is affected by wave force, the wind force is applied above the wind turbine. The coupling effect of the two forces makes the phase angle between the wind turbine and the incoming wind change due to the platform shaking. The phase angle change is different for different wave height. Thus, the wind turbine power fluctuates irregularly. The power at the equilibrium position decreases rapidly in the range of 2 m to 5 m for significant wave height, from 5010 kW to 4790 kW. In the range of 5 m to 6 m, the power at the equilibrium position is stable at 4790 kW. The overall power fluctuation at the equilibrium position is only 4%, which is very small. This is because the Spar water line surface is very small and the draft depth is large, and thus the change of wave height has little influence on the dynamic response of the floating platform. Fixed onshore 5 MW wind turbine has a power of 5000 kW at 12 m/s wind speed. Floating wind turbine has a lower power at the equilibrium position. In conclusion, with the increase of incident wave height, the power fluctuation of the wind turbine increases, and the average power of the wind turbine decreases.
4.1.2. Effect of the Wave Period on the Wind Turbine Power
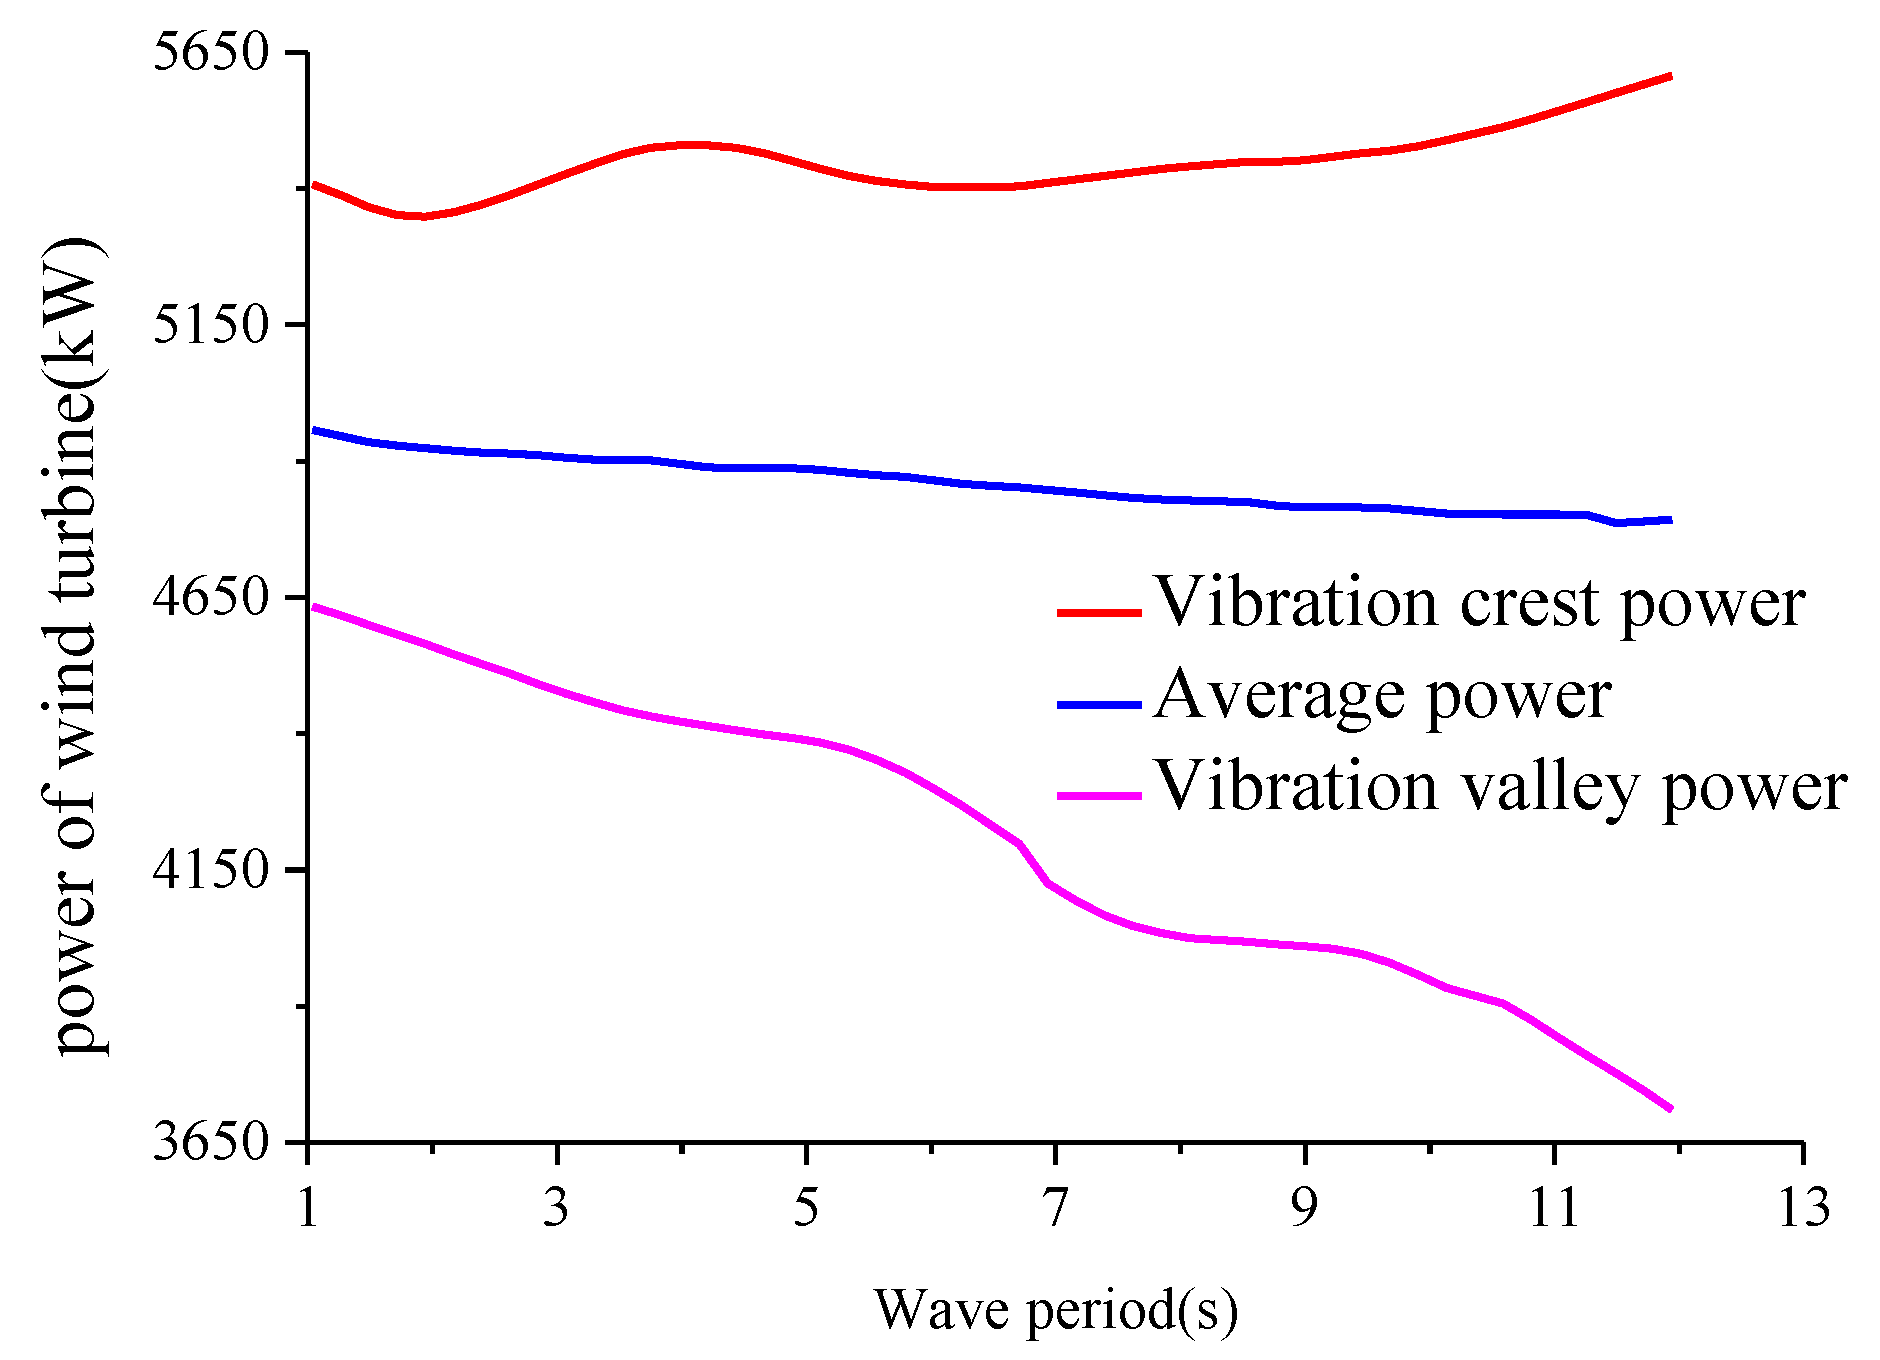
Figure 11 shows the change of the wind turbine power with the wave period, with the direction and significant wave height of the wave remaining unchanged. As the wave period increases from 1 s to 12 s, the wave peak power increases from 5410 kW to 5610 kW. The wave trough power decreases from 4680 kW to 3710 kW. The amplitude of power fluctuation increases gradually. When the incident wave period is 1 s, the wind turbine power at the equilibrium position is 4969 kW, which is the same as the power of 5 MW wind turbine on land at the same wind speed. It means that the influence of waves on the wind turbine power is small. But when the incident wave period is 12 s, the wind turbine power at the equilibrium position is only 4790 kW. The influence of waves on the wind turbine power becomes large. With the increase of the incident wave period, the wind turbine power at the equilibrium position decreases. NREL 5 MW wind turbine is a variable-speed and variable-pitch wind turbine. The control system can make the speed and pitch angle of the wind turbine correspond to the actual working conditions as much as possible. However, the large wave period results in a poor adaptive ability of the wind turbine. Then, the wind turbine cannot adjust its attitude to adapt to the incoming wind in time, resulting in a power reduction. In conclusion, the period of the wave is closely related to the wind turbine power. With the increase of incident wave period, the power oscillation amplitude of the wind turbine increases and wind turbine power at the equilibrium position decreases.
4.2. Optimization of the Wind Turbine Blade at Rated Wind Speed
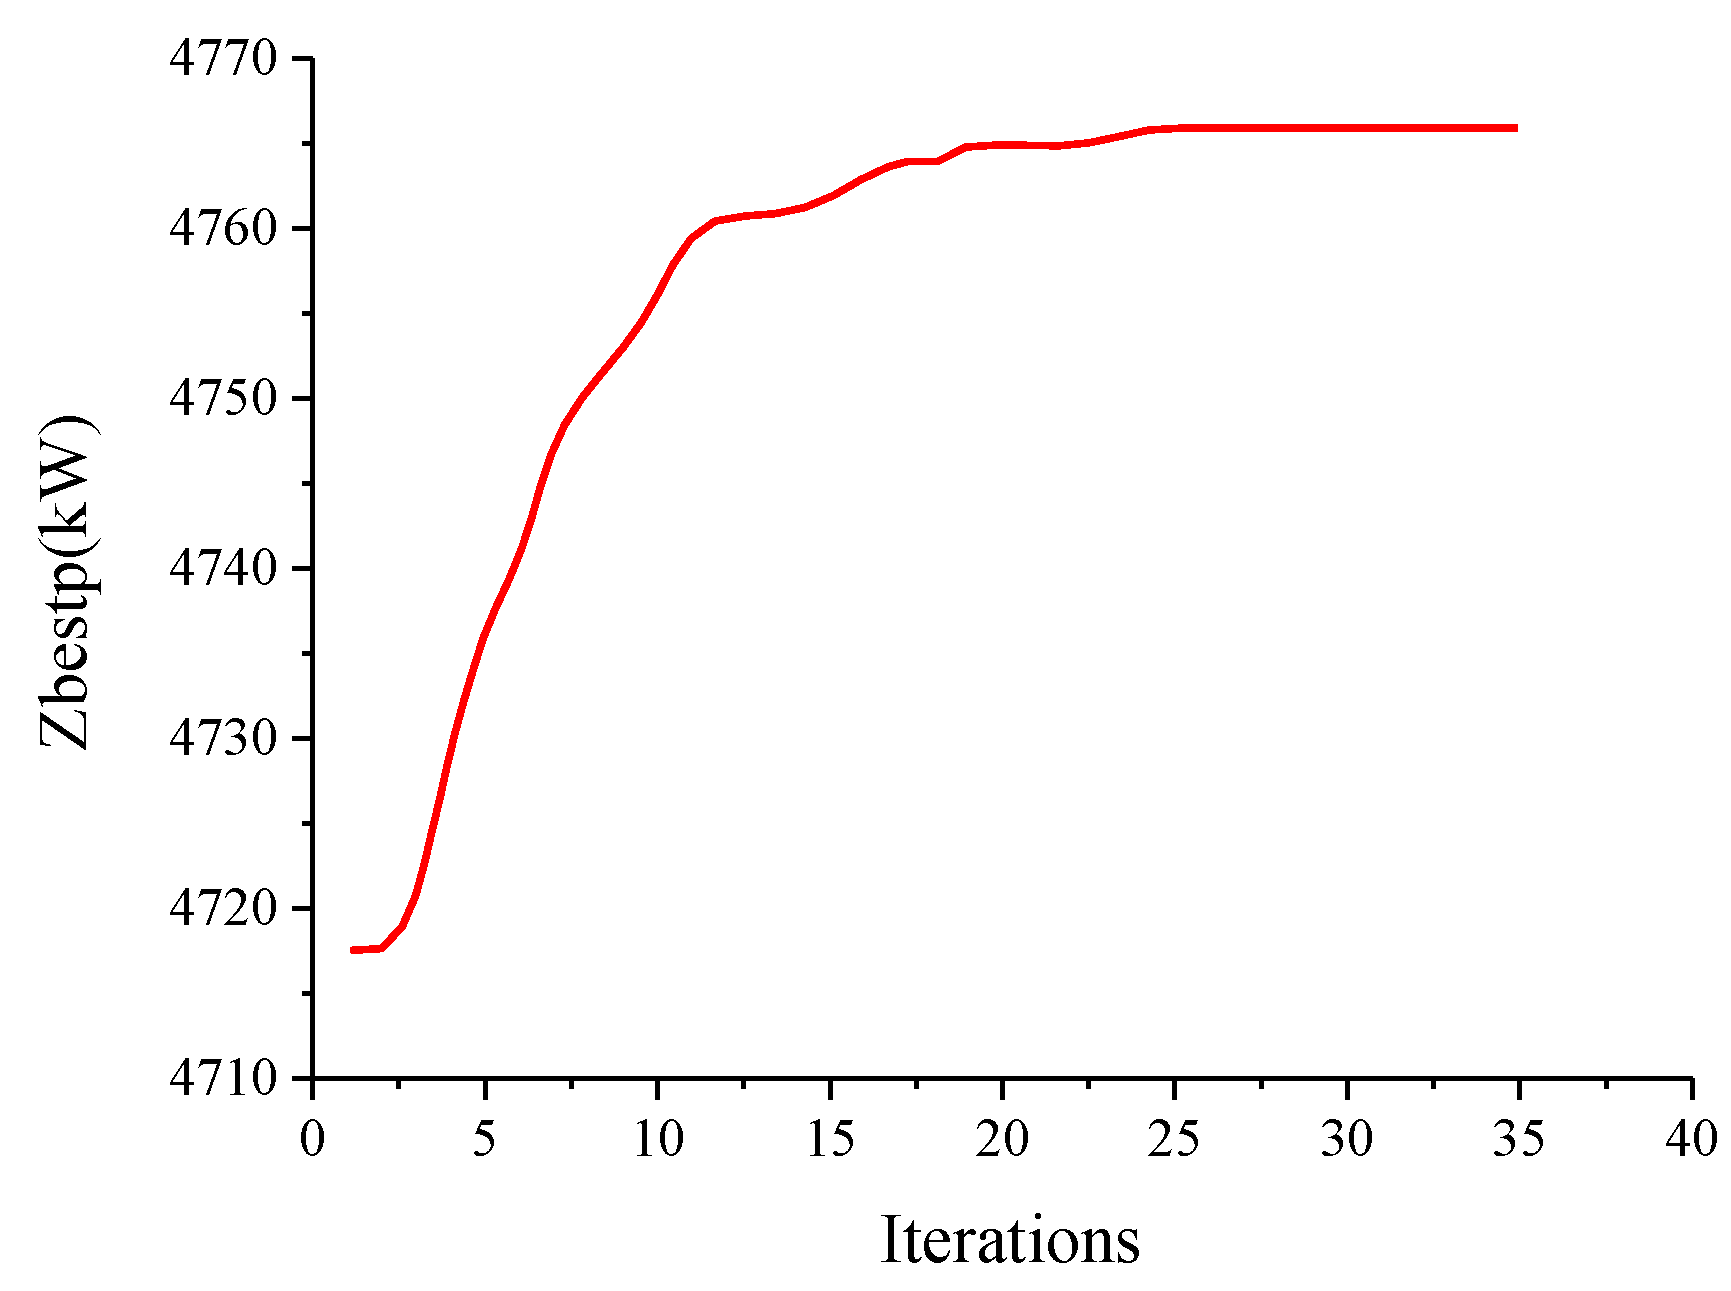
At the rated wind speed, the PSO algorithm is used to optimize the floating wind turbine blades. The fitness output of the optimal particle for each iteration of PSO is shown in Figure 12. The evolution of the population can be observed. In 0-14 iterations, the particle swarm grows rapidly, and Zbest of the optimal particle increases from 4718 kW to 4761 kW. In 14–25 iterations, the growth rate of Zbest slows down, increasing from 4761 kW to 4766 kW. After 25 iterations, the optimal particle of particle swarm does not renew. The PSO algorithm stops automatically after 35 iterations, indicating that the difference between the average fitness and the best fitness of the population is less than 0.5%. The particle swarm as a whole approaches the optimal solution in the search area. Compared with the power before optimization, the power is increased by 1.017% after optimization by the PSO algorithm under this condition.
The distributions of twist angle and chord length after optimization by the PSO algorithm are compared with those before optimization, as shown in Figure 13 and Figure 14. The optimized twist angle is slightly larger than that before optimization in the range of 10.25 m to 47.15 m from hub surface. The optimized twist angle is almost close to that before optimization in the range of 47.15 m from the hub surface to the blade tip. The current optimization design only considers the best twist angle and chord length of each control surfaces by using blade element momentum, without considering the continuous process and actual operation of the wind turbine. Thus, some changes have taken place in the distribution of the chord length. The changes of the distribution of twist angle are more obvious. The chord length is smoothed by a spline curve in MATLAB. The distribution of chord length after smoothing by the spline curve is more reasonable, as shown in Figure 15. The continuity of blade structure is ensured by modification, which facilitates the manufacture of actual blades. The wind turbine power with smooth blades is 4751 kW, slightly less than that before smoothing. Compared with the power before optimization, the wind turbine power after smoothing is increased by 0.7%.
4.3. Optimization of the Wind Turbine Blade at Mid-Low Wind Speed
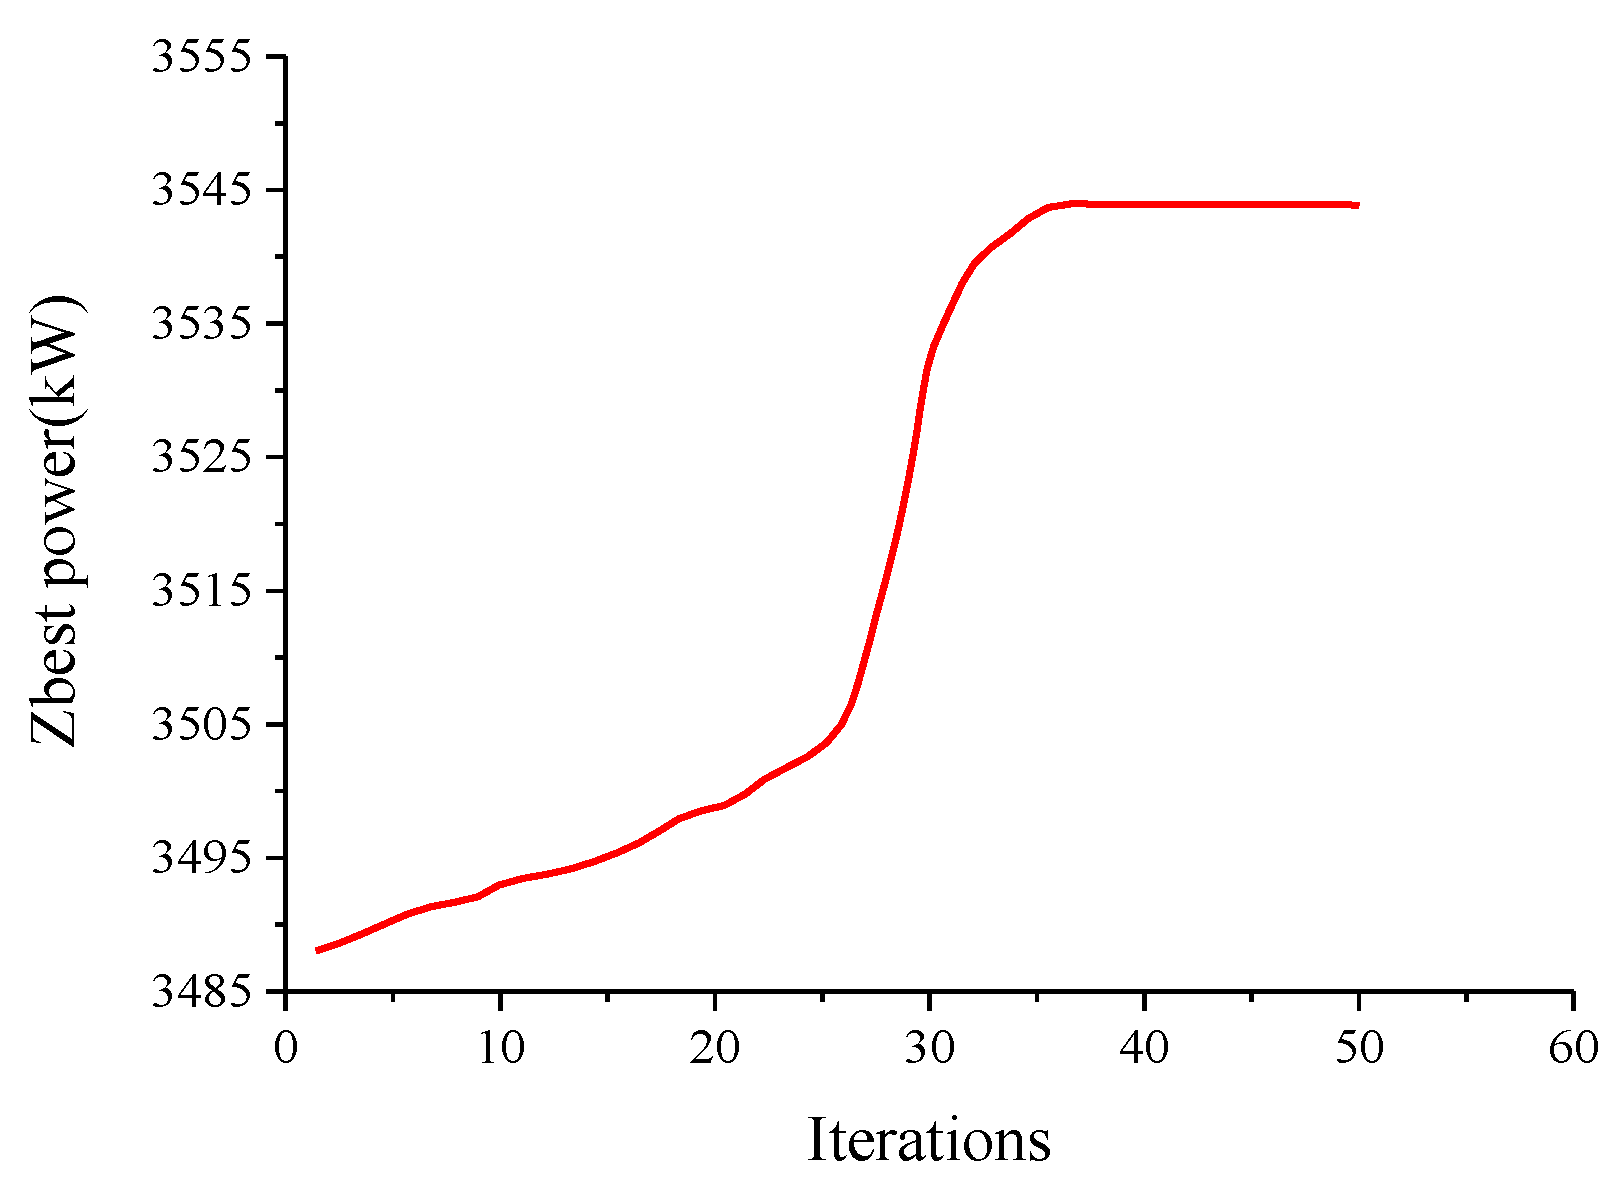
At mid-low wind speeds, the fitness output of the optimal particle for each iteration of PSO can be observed in Figure 16. In 0~34 iterations, each iteration produces a better individual (Zbest). After 34 iterations, each iteration does not produce a better individual, but the particle swarm as a whole approaches the optimal solution in the search area. The PSO algorithm stops automatically after 50 iterations, indicating that the difference between the average fitness and the best fitness of the population is less than 0.5%.
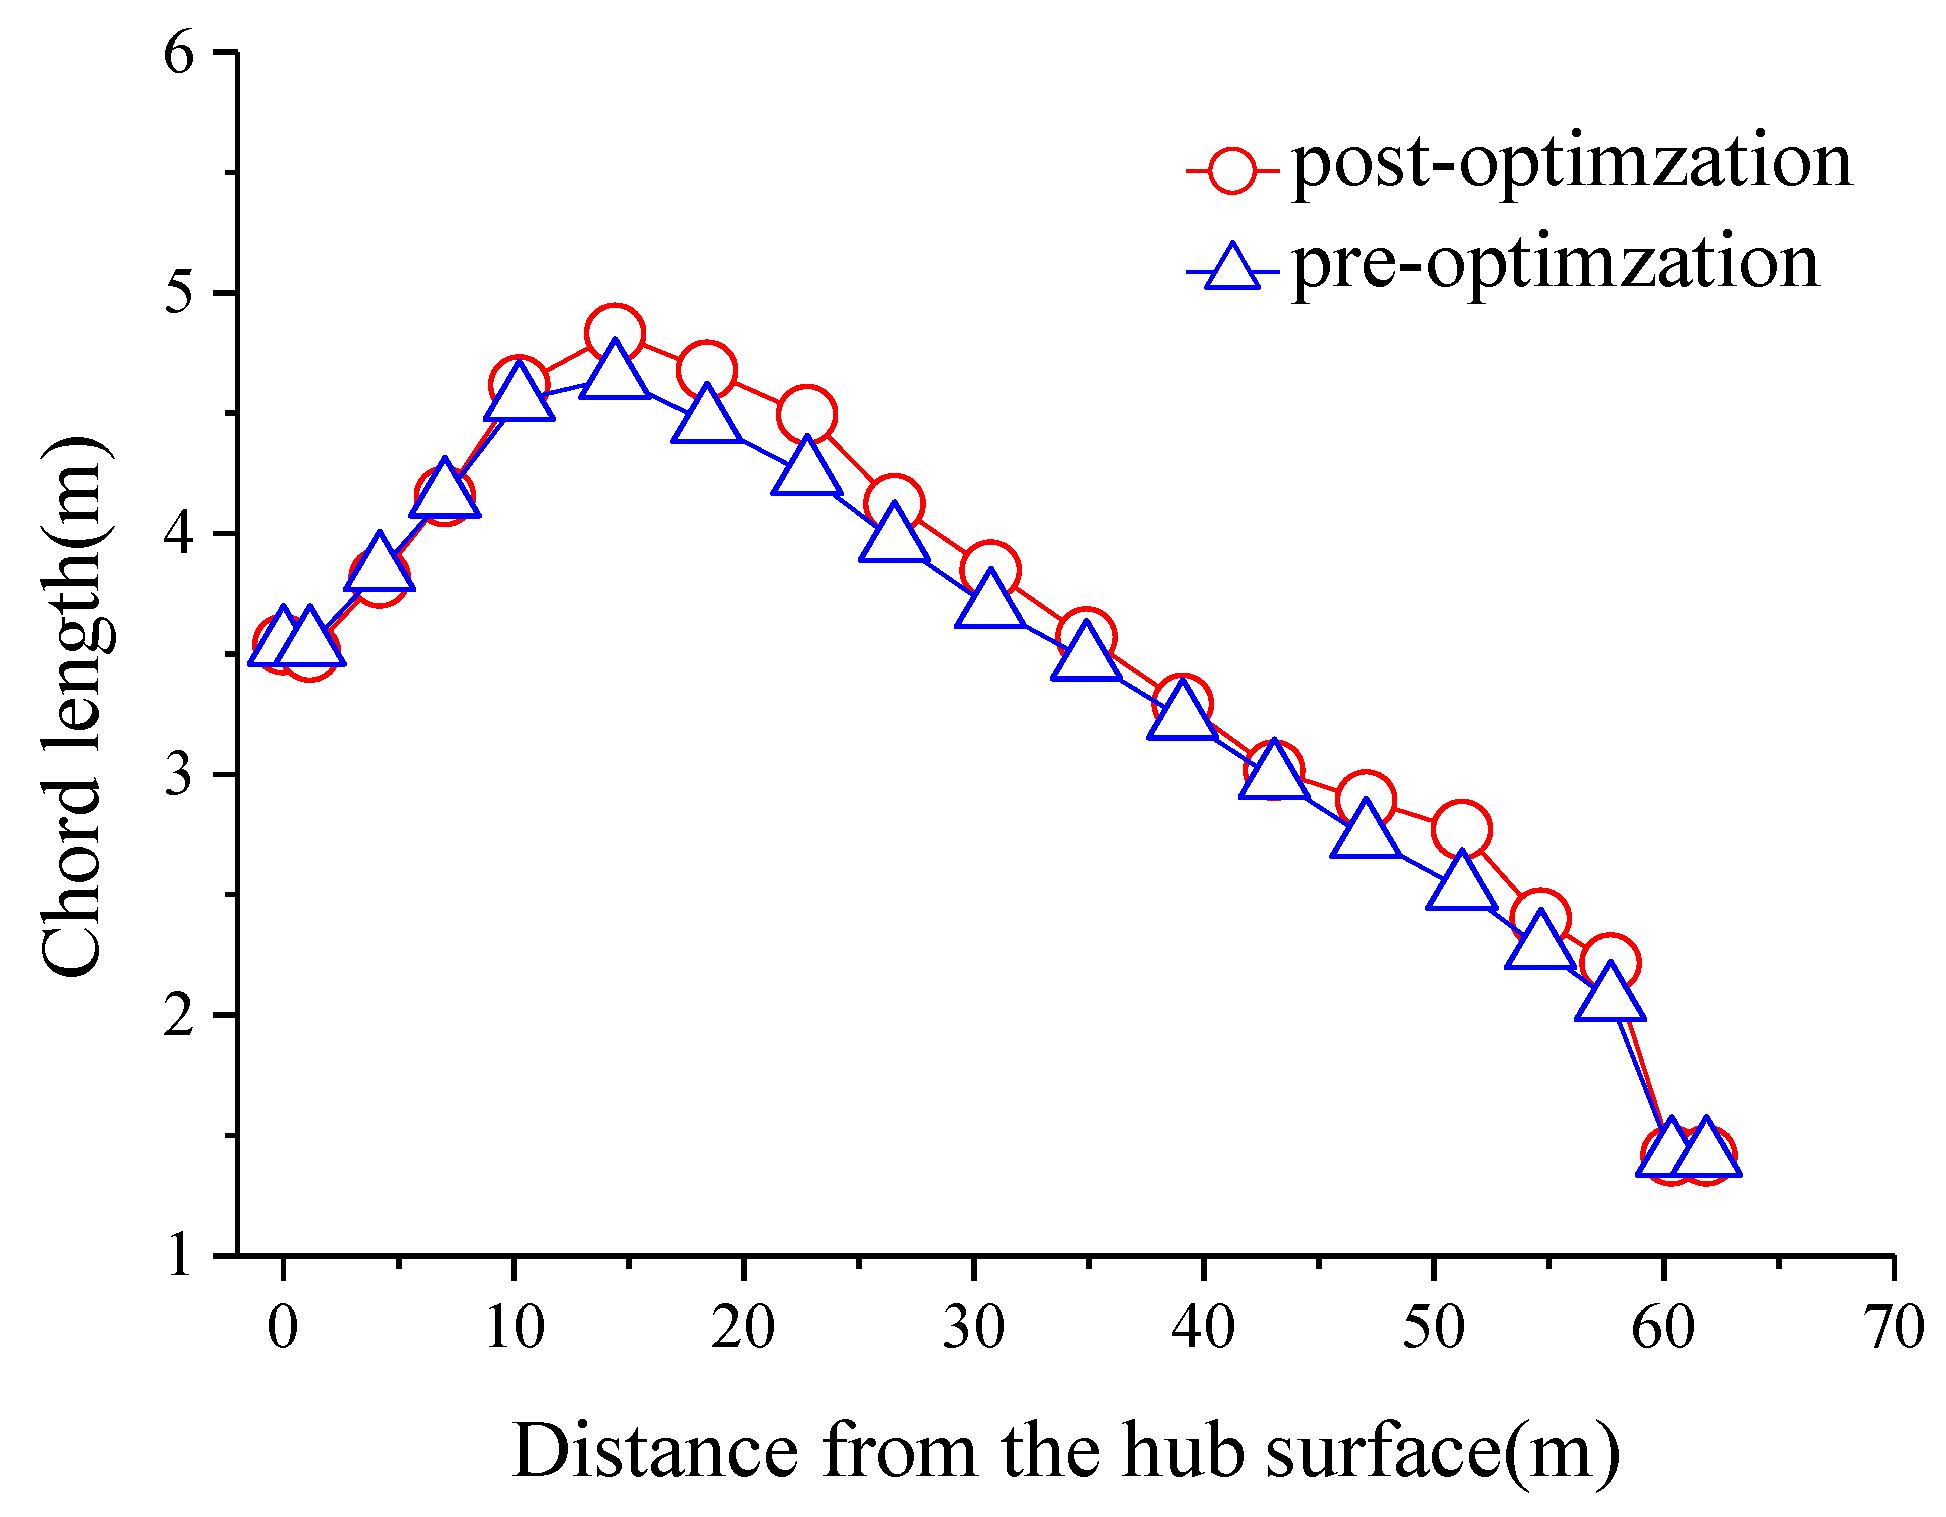
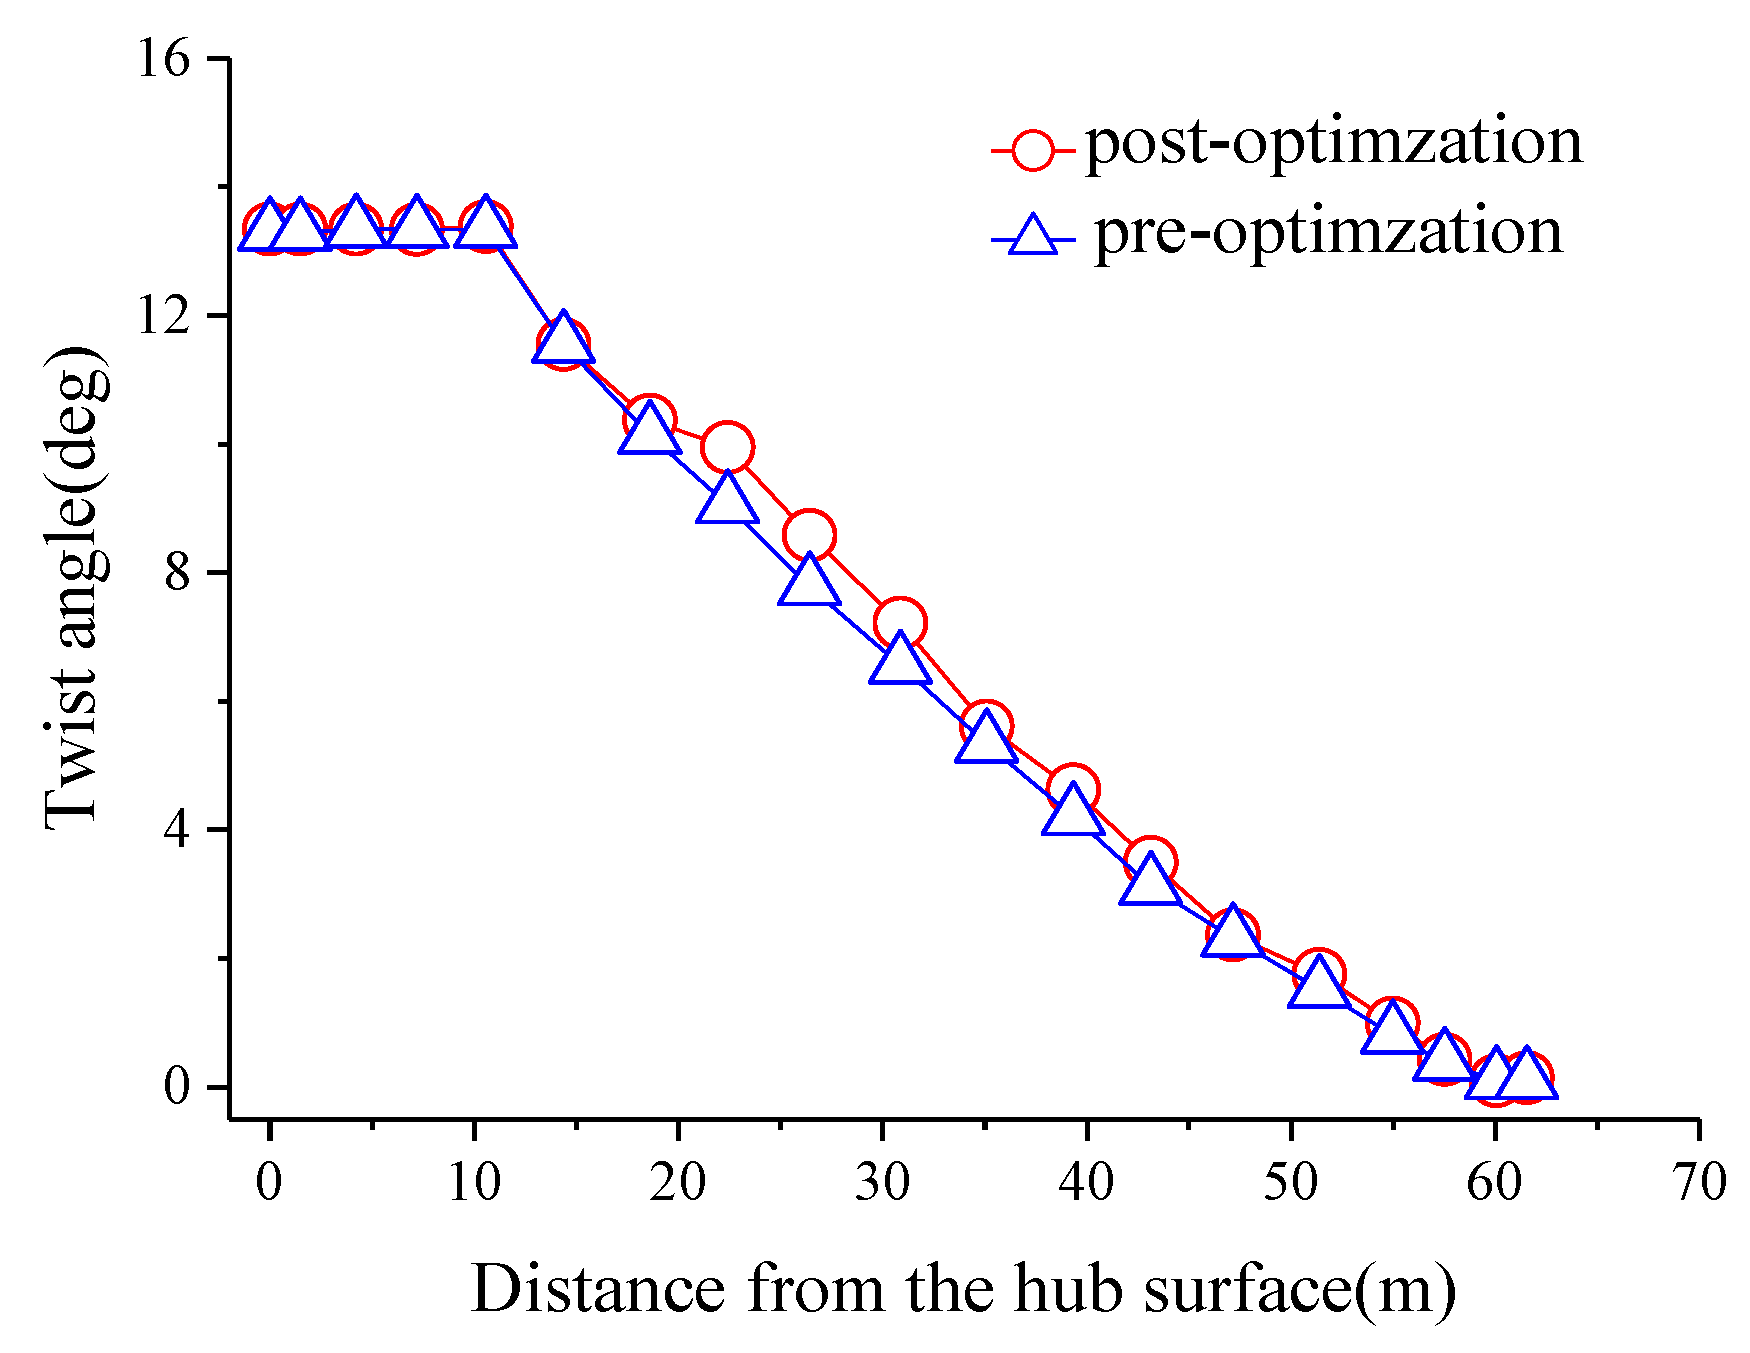
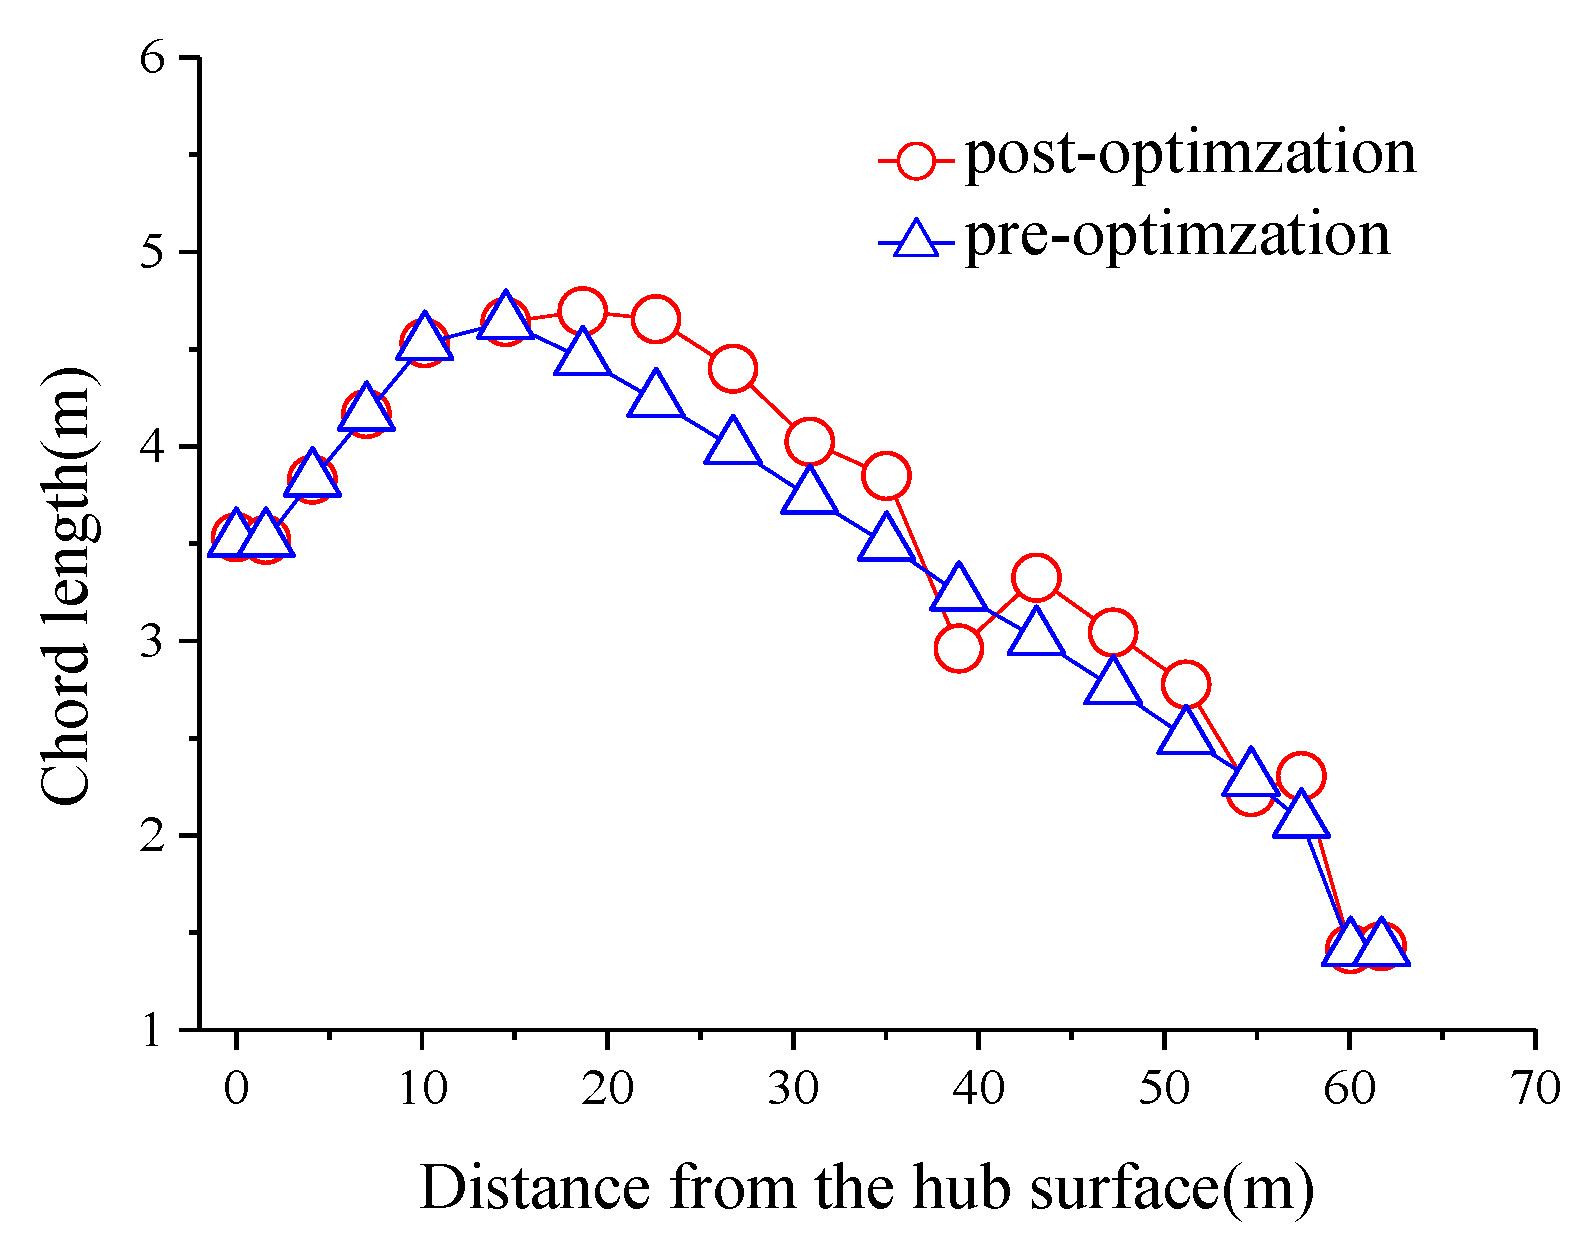
Figure 17 and Figure 18 are the distributions of twist angle and chord length after optimization at mid-low wind speed. The change of the twist angle and chord length in 15 control surfaces of floating wind turbine blades can be observed. In the range of 0 m to 10 m from the hub surface, the first four control surfaces are cylindrical, which are the connecting parts between blades and hub. Thus, there is no change in the twist angle and chord length. In the range of 10 m to 60 m from the hub surface, the distribution of twist angle after optimization is slightly larger than that before optimization, and the chord length is slightly larger than that before optimization. Except for the cylindrical control surface, the chord length in each control surface of the wind turbine after optimization is smaller than that before optimization. Therefore, the area of the wind turbine blade is reduced, and the material of the wind turbine blade is saved, which can save the cost. At mid-low wind speed, the power of the wind turbine at equilibrium position is 3485 kW before optimization. After optimization, the power of the wind turbine at equilibrium position is increased by 1.7%, namely 3544 kW.
4.4. Optimization of the Wind Turbine Blade at Low Wind Speed
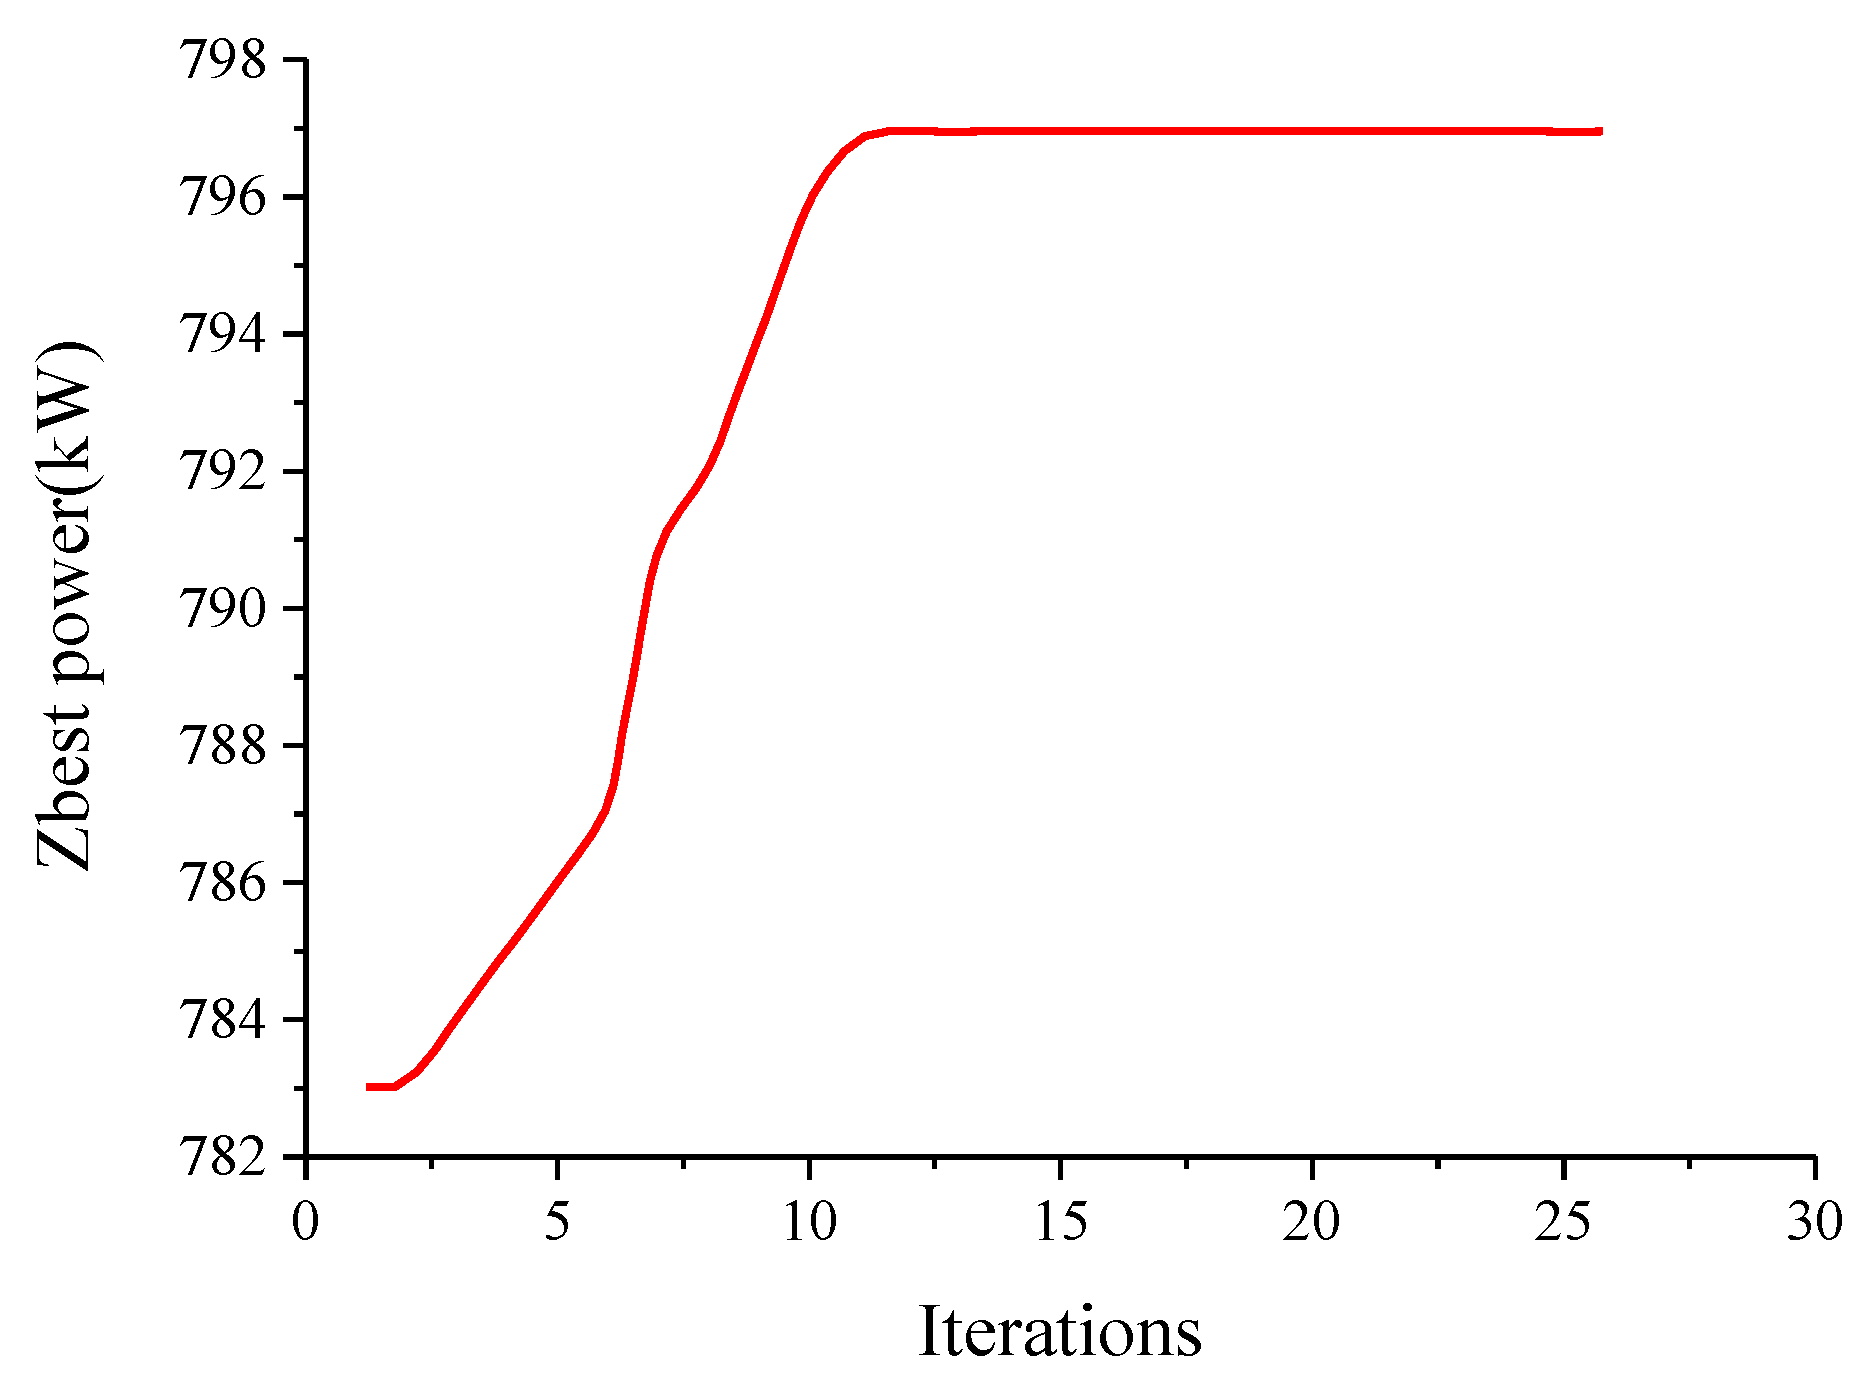
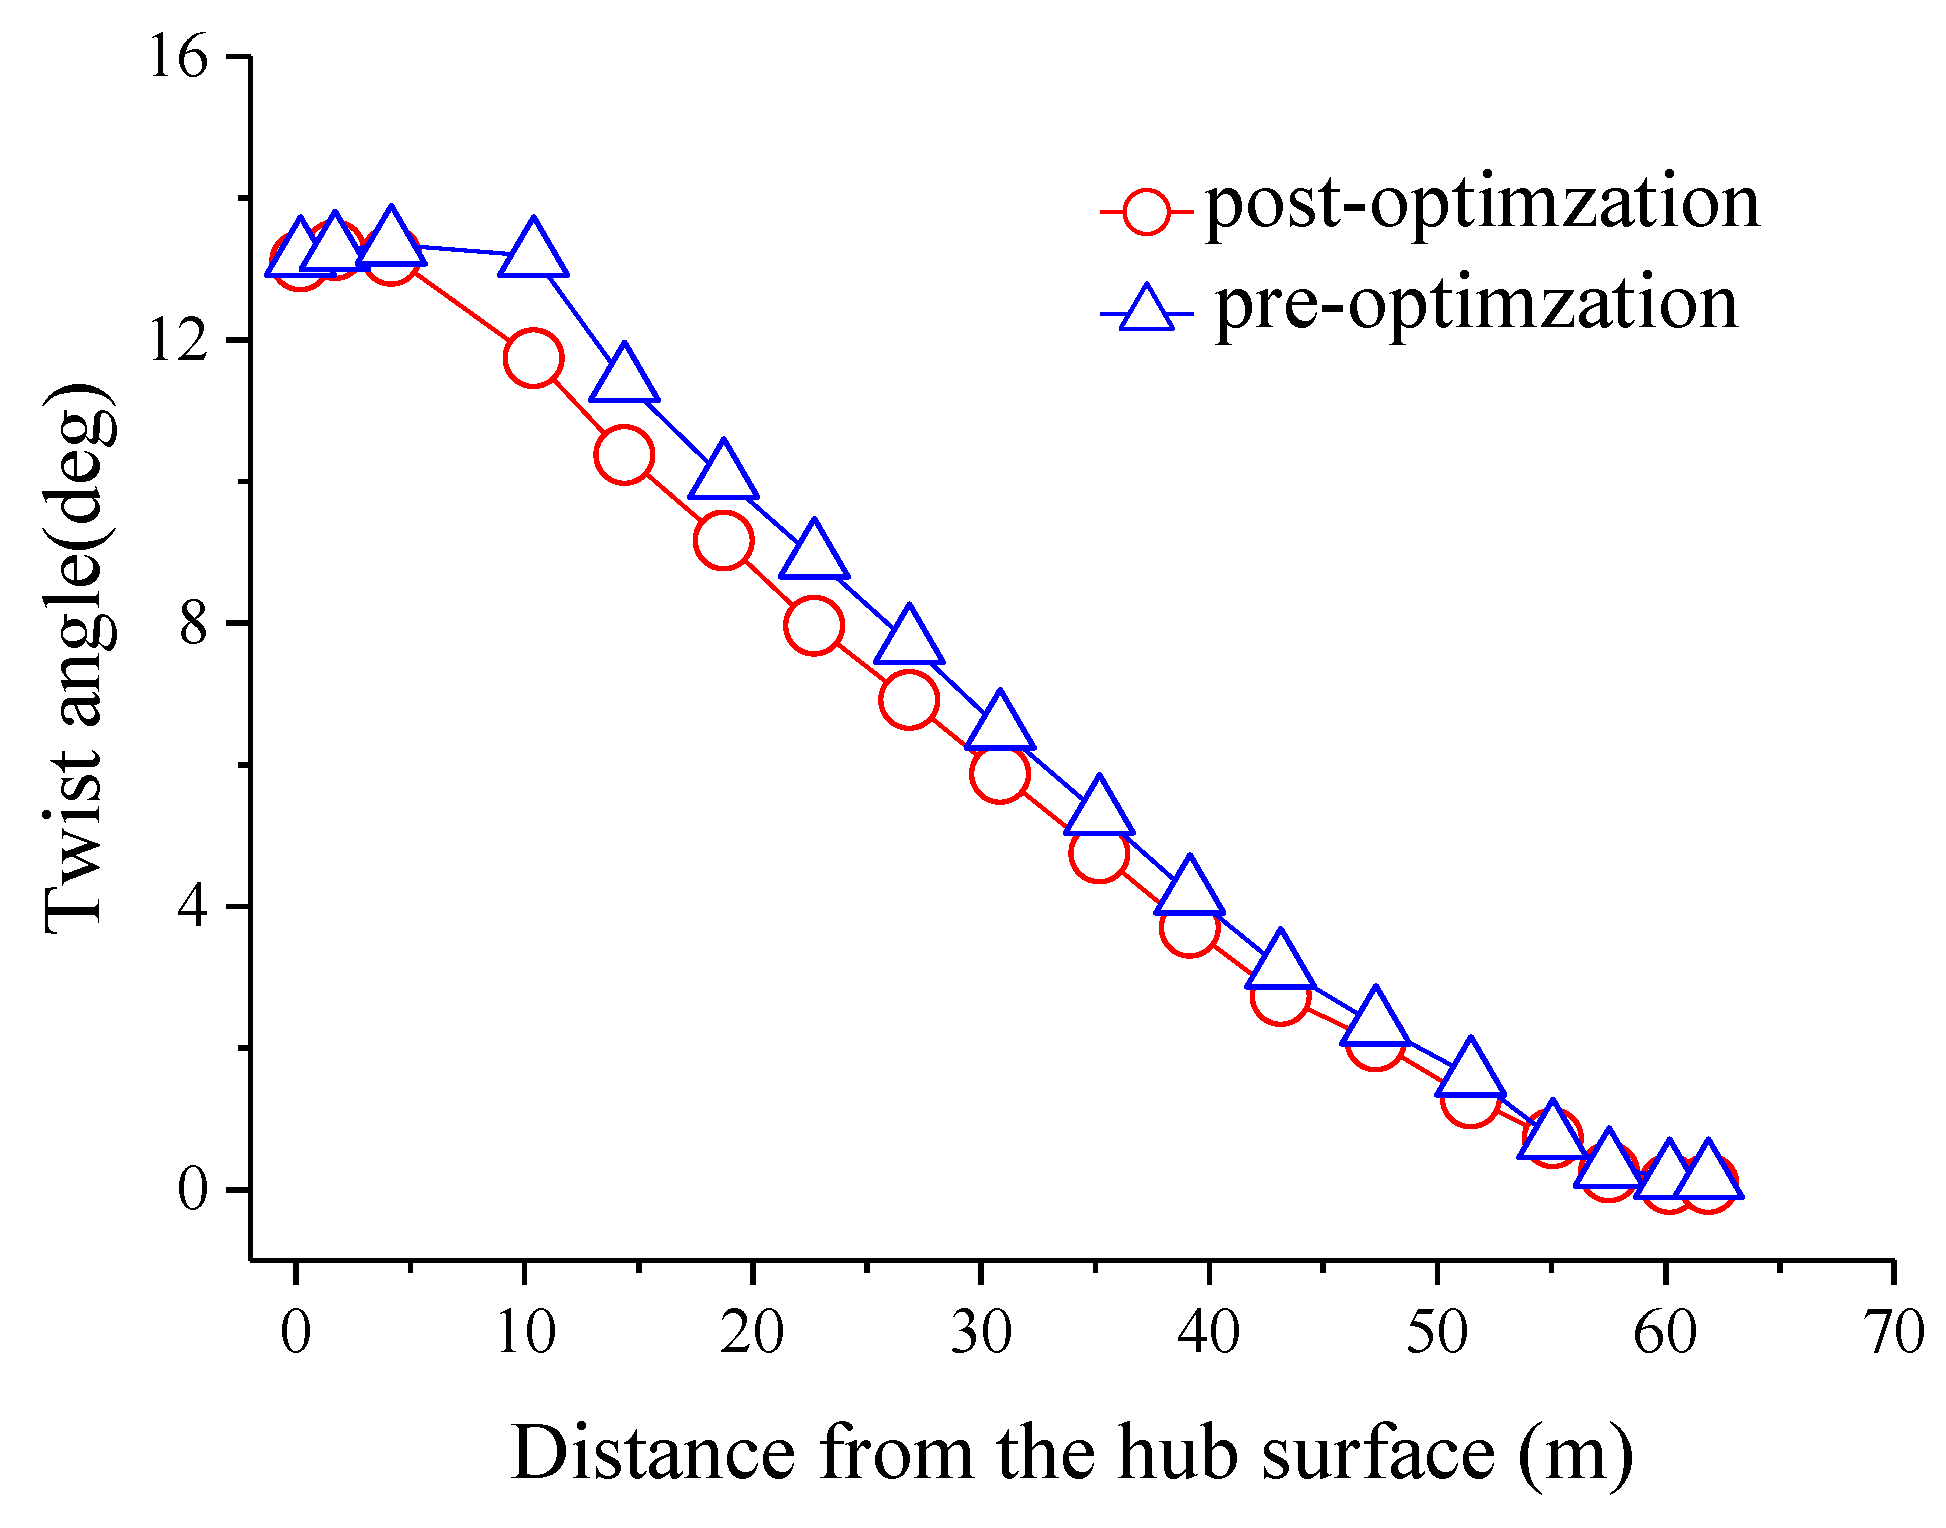
Population evolution can be observed from Figure 19. In 0~11 iterations, the particle swarm grows rapidly, and the Zbest of population particles increases from 777 kW to 797 kW. After 11 iterations, the optimal particle is no longer updated and no new extremum emerges. When the algorithm runs to 26 iterations, the particle swarm algorithm achieves the termination condition. The particle swarm as a whole approaches the optimal solution in the search area. The power of the wind turbine is increased by 2.5% through the optimization of particle swarm optimization. Figure 20 and Figure 21 are the distributions of twist angle and chord length after optimization. The optimized twist angle and chord length are less than those before optimization in the range of 6.83 m from the hub surface to blade tip. The difference of twist angle and chord length before and after optimization is the greatest in the control surface 6.83 m from the hub surface. Along the direction of blade tip, the twist angle and chord length are gradually close to those before and after optimization. In summary, when the blade is optimized at low wind speed, the power of the wind turbine get promoted, while the manufacturing difficulty and cost of the blades are reduced.
4.5. Optimization of the wind turbine Blade under Actual Sea Conditions
The marine meteorological environment of site section should be considered in the offshore wind turbine design. In this paper, the location of the wind turbines is assumed to be in the China’s Bohai Bay. According to the statistics of wind wave characteristics in Bohai Bay within one year, the average wind speed is 7 m/s, and the average significant wave height is 1.3 m. The wave period is 3.25 s. The frequency of the wind wave direction is 27% in the north direction, 22% in the northwest direction, and 8.3% in the northeast to northwest direction.
In the optimization process, the generated power of the wind turbines in eight wind wave directions (N, NW, W, SW, S, SE, E, NE) is calculated by FAST software. The particle fitness of the particle population is determined by the weighted average of the wind wave direction frequency. The expression is as follows:
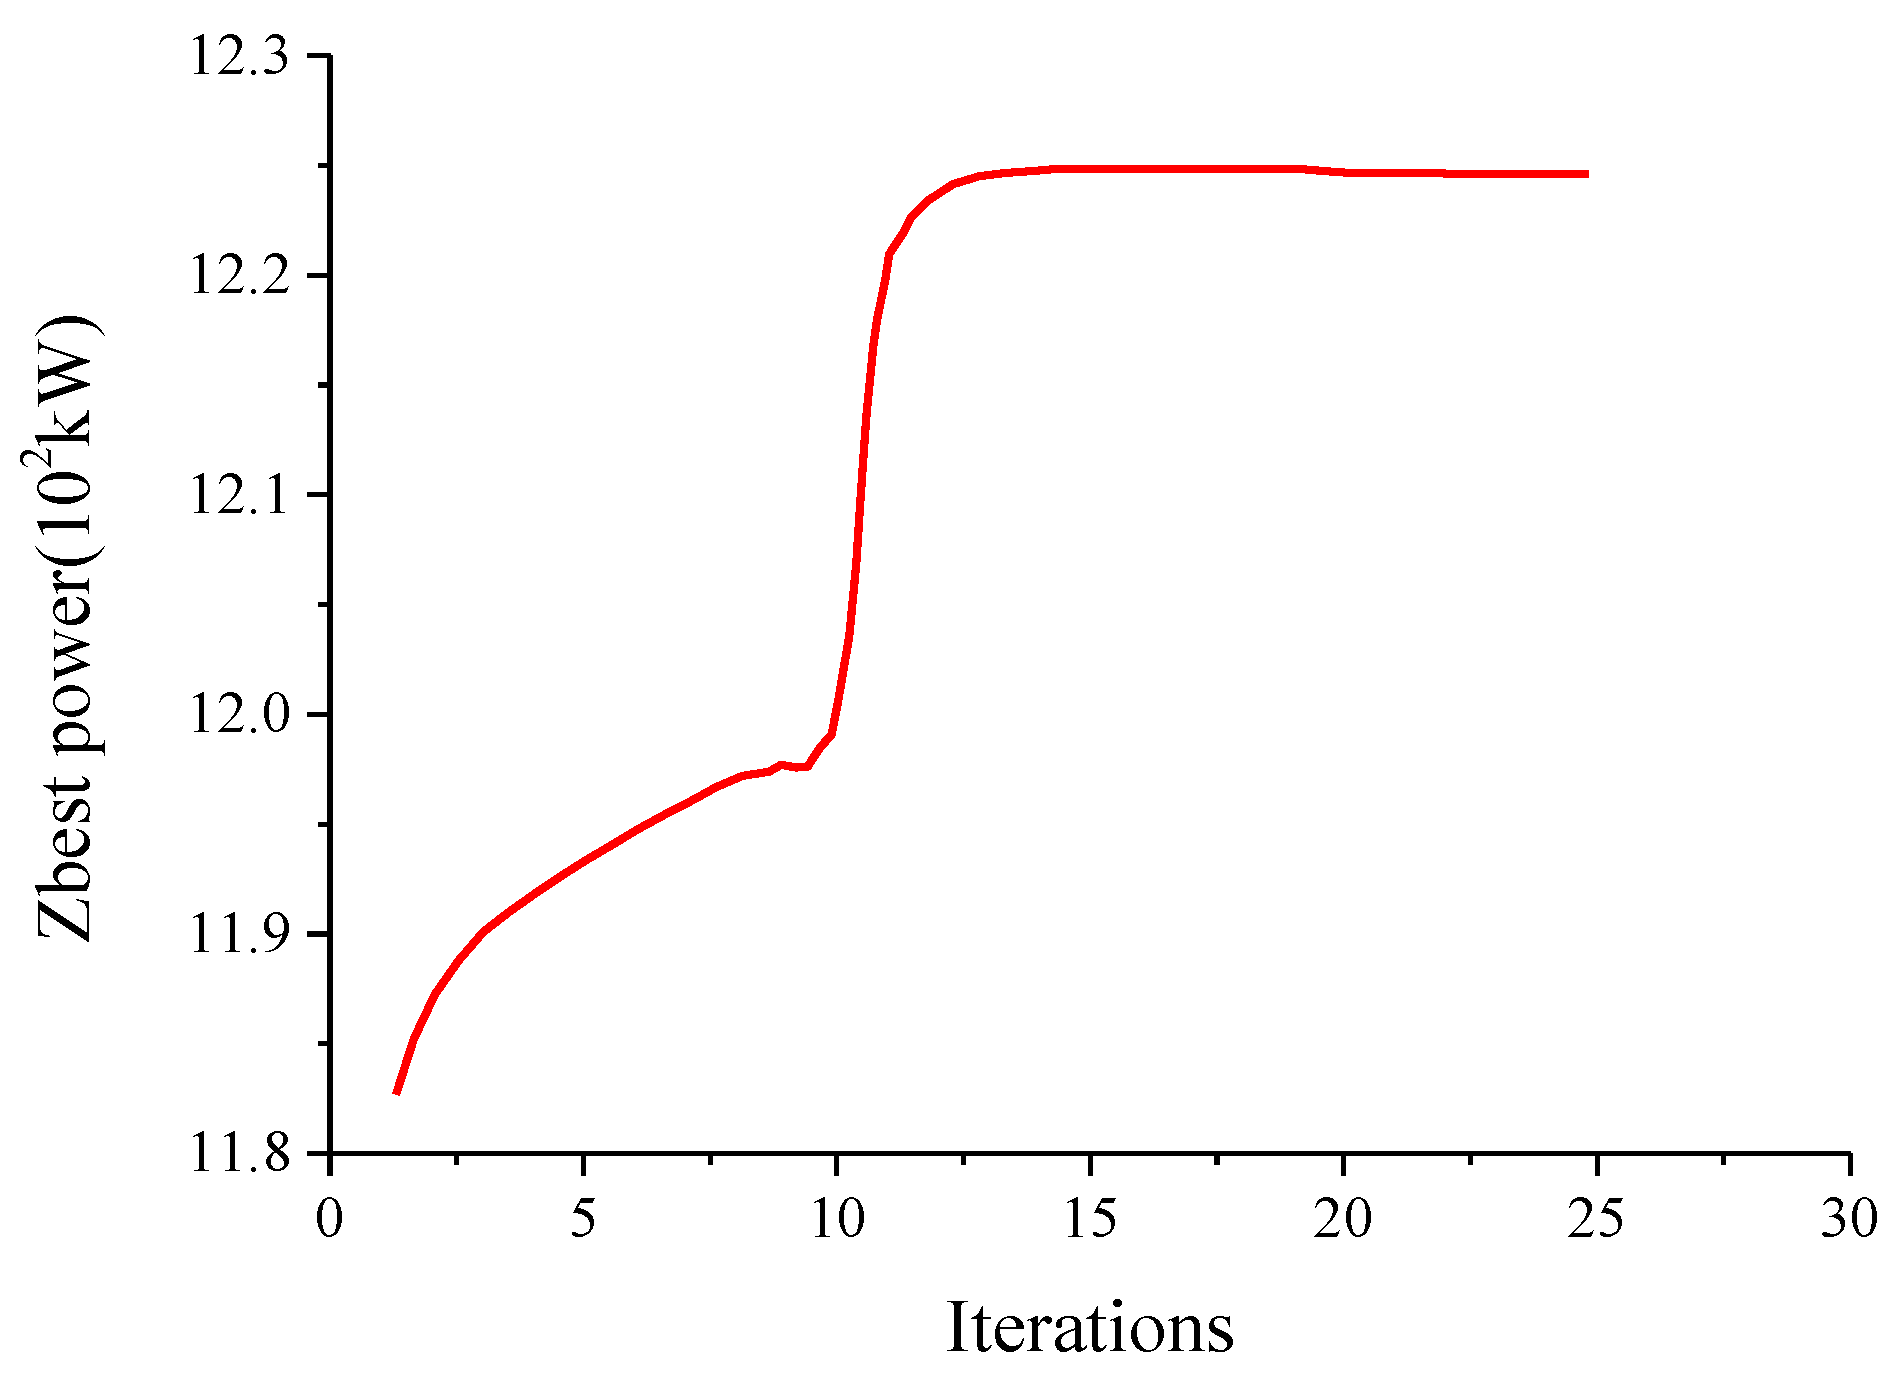
The wave spectrum is chosen as Jonswap spectrum. Under the rated wind speed, the floating wind turbine blade is optimized by PSO algorithm. As shown in Figure 22, particle swarm grows rapidly in 0~13 iterations, and the Zbest of particle swarm increases from 1180 kW to 1225 kW. After 13 iterations, the optimal particle of particle swarm does not renew. When it reaches 24 iterations, particle swarm stops automatically, indicating that the difference between the average fitness and optimal fitness of the population is less than 0.5%. The algorithm achieves the termination condition, and the particle swarm as a whole approaches the optimal solution in the search area. Under this condition, the power of the wind turbine is increased by 3.8% through the optimization of particle swarm optimization.
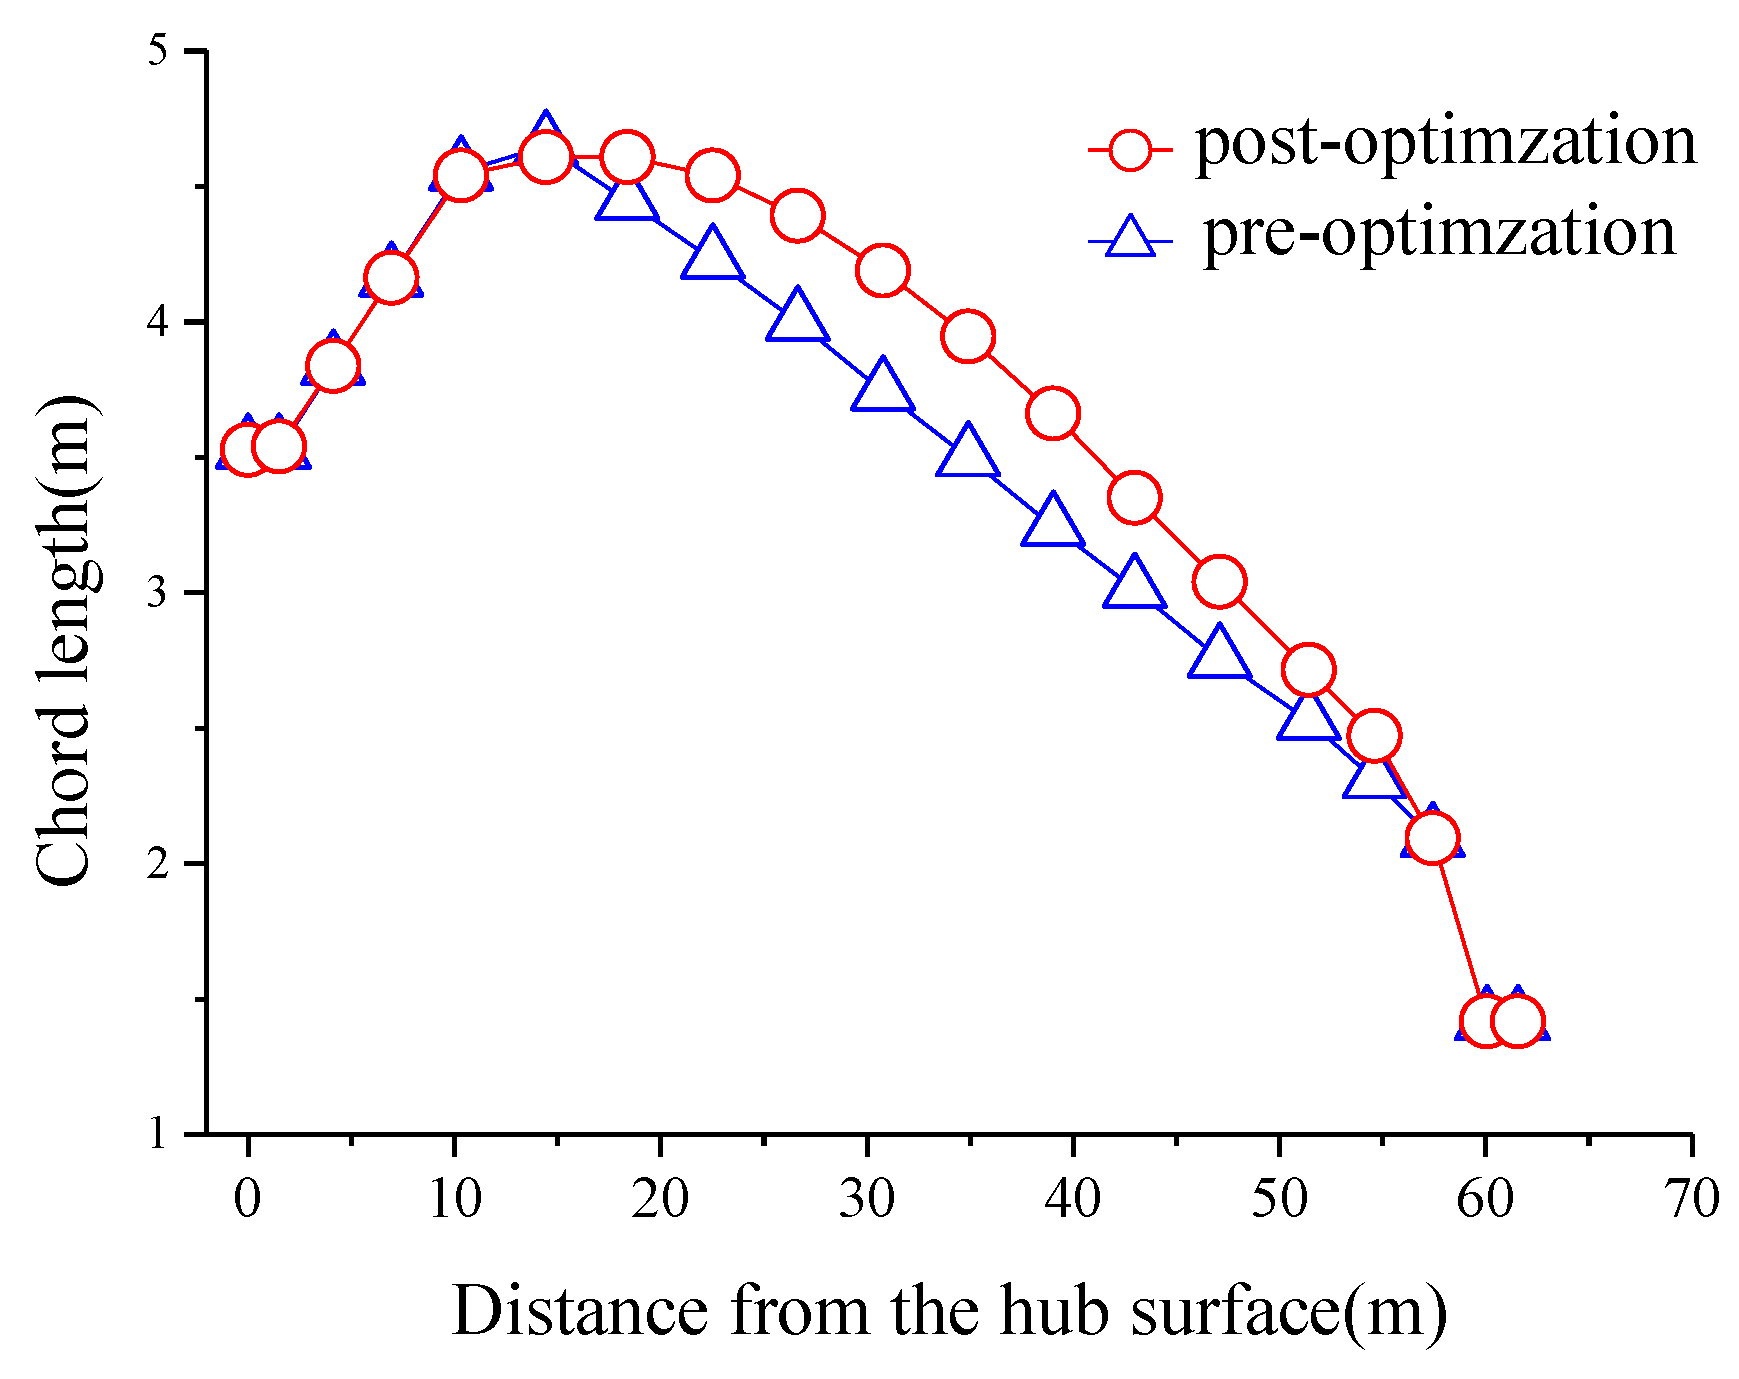
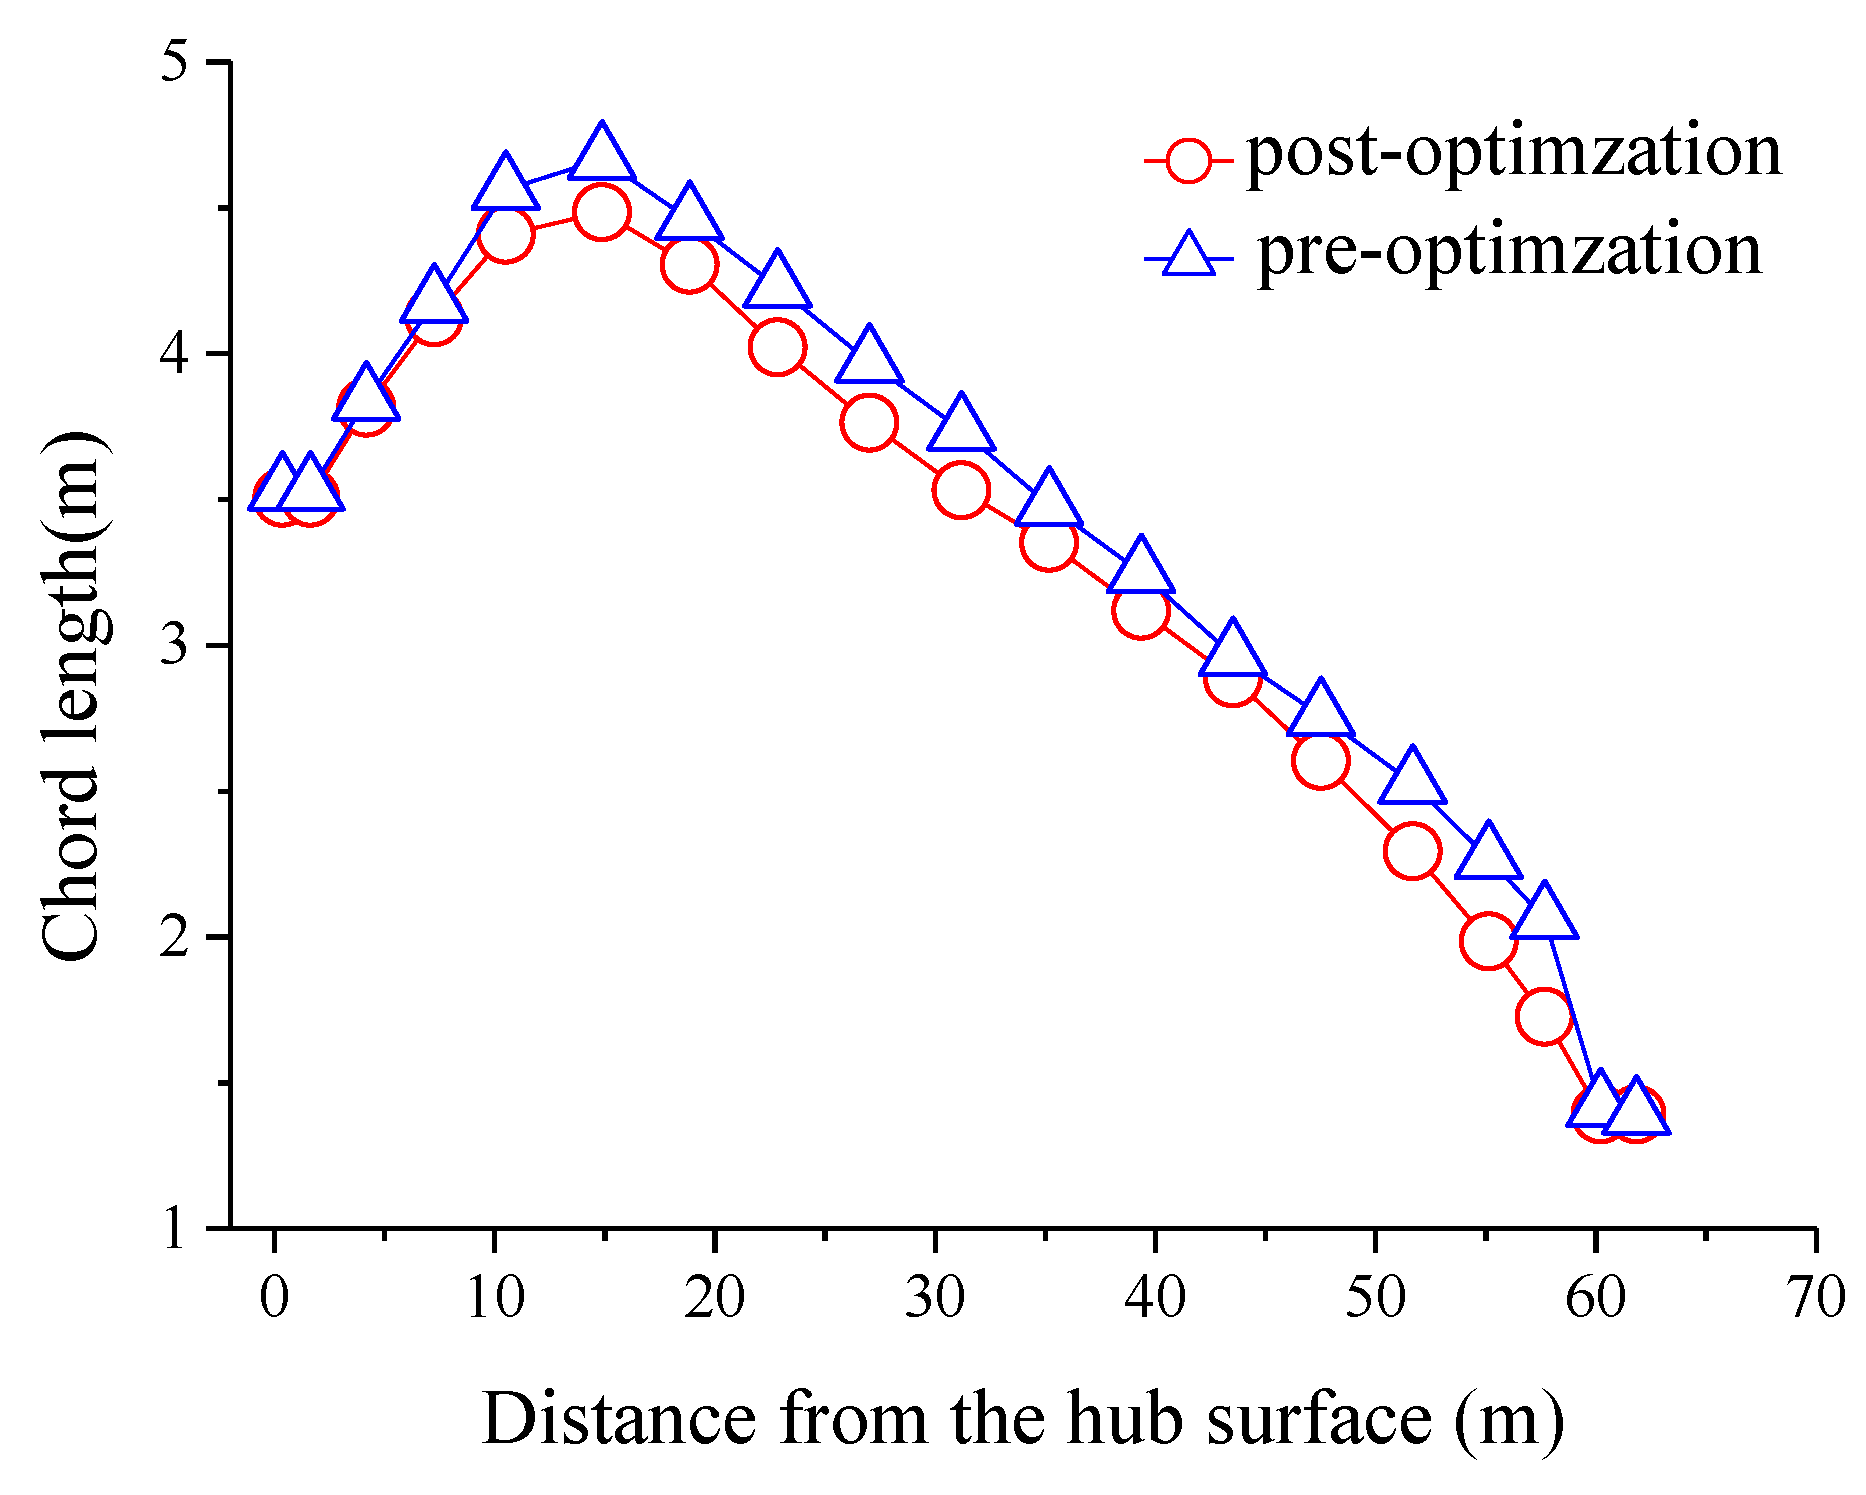
As shown in Figure 23 and Figure 24, the optimized torsion angle is slightly less than that before optimization in the range of 10.25 m to 47.15 m from the hub surface. The optimized torsion angle is almost close to that before optimization in the range of 47.15 m to 60 m from the hub surface. The chord length in each control surface of optimized blade is less than that before optimization. The overall optimization effect is obvious.
5. Conclusions
Based on PSO algorithm and Fast program, a combined optimization design method for a wind turbine blade is developed in this paper. The optimization results of the NREL 5 MW fixed wind turbine show that this optimization method can not only improve the power of the wind turbine, but also reduce the manufacturing cost of the wind turbine blade. The feasibility of PSO is verified. The influence of wave on the power of floating wind turbine is studied in this paper. The results show that, with the increase of wave height, the power fluctuation of the wind turbine increases and the average power of the wind turbine decreases. With the increase of the wave period, the power oscillation amplitude of the wind turbine increases, and the power of the wind turbine at equilibrium position decreases. The optimal design of the offshore floating wind turbine blade under different wind speeds is carried out. The results show that the power of the optimized wind turbine blade increases less under rated wind speeds, and the optimization effect of the blade is more obvious at mid-low and low wind speeds. The Bohai Strait is chosen as the operation site of the wind turbine, and the wind wave direction is weighted. After optimization, the maximum power of the wind turbine can be increased by 3.8% after weighted optimization, and the chord length and the twist angle of the blade are reduced. The results of this study can provide theoretical guidance for the optimal design of a offshore floating wind turbine blade.
Author Contributions
Conceptualization, L.Y. and Y.M.; Methodology, L.Y.; Software, L.Y. and A.Z.; Validation, L.Y. and Y.M.; Investigation, L.Y.; Resources, Y.M.; Data Curation, C.H.; Writing-Original Draft Preparation, L.Y.; Writing-Review & Editing, A.Z. and Y.B.; Visualization, A.Z.; Supervision, C.H.; Project Administration, Y.M.; Funding Acquisition, Y.M.
Funding
This paper was financially supported of the National Natural Science Foundation of China (No. 51779062), the Fundamental Research Funds for the Central Universities of China (No. HEUCFP201714), the Natural Science Foundation of Heilongjiang Province (No. A2016001).
Acknowledgments
Authors gratefully acknowledge the Institute of Marine Engineering Equipment and Technology in Sun Yat-sen University.
Conflicts of Interest
The authors declare no conflict of interest.
References
- Oh, K.-Y.; Nam, W.; Ryu, M.S.; Kim, J.Y.; Epureanu, B.I. A review of foundations of offshore wind energy convertors: Current status and future perspectives. Renew. Sustain. Energy Rev. 2018, 88, 16–36. [Google Scholar] [CrossRef]
- Fontana, C.M.; Hallowell, S.T.; Arwade, S.R.; DeGroot, D.J.; Melissa, E.L.; Charles, P.A.; Brian, D.; Andrew, T.M.; Senol, O. Multiline anchor force dynamics in floating offshore wind turbines. Wind Energy 2018, 21, 1177–1190. [Google Scholar] [CrossRef]
- Madsen, H.A.; Rasmussen, F. A near wake model for trailing vorticity compared with the blade element momentum theory. Wind Energy 2010, 7, 325–341. [Google Scholar] [CrossRef]
- Leishman, J.G. Challenges in modelling the unsteady aerodynamics of wind turbines. Wind Energy 2002, 5, 85–132. [Google Scholar] [CrossRef]
- Butterfield, C.P.; Simms, D.; Scott, G.; Hansen, A.C. Dynamic stall on wind turbine blades. In Proceeding of the Wind power ‘91Conerence and Exposition, Palm Springs, CA, USA, 24–27 September 1991; pp. 393–401. [Google Scholar]
- Pierce, K.G. Wind Turbine Load Prediction Using the Beddoes-Leishman Model for Unsteady Aerodynamics and Dynamic Stall. Master’s Thesis, University of Utah, Salt Lake, UT, USA, 1996. [Google Scholar]
- Liang, L.; Yuanchuan, L.; Zhiming, Y.; Gao, Y. Wind field effect on the power generation and aerodynamic performance of offshore floating wind turbines. Energy 2018, 157, 379–390. [Google Scholar] [Green Version]
- Li, X.; Yang, K.; Liao, C.; Bai, J.; Zhang, L.; Xu, J. Overall design optimization of dedicated outboard airfoils for horizontal axis wind turbine blades. Wind Energy 2018, 21, 320–337. [Google Scholar] [CrossRef]
- Chehouri, A.; Younes, R.; Ilinca, A.; Perron, J. Review of performance optimization techniques applied to wind turbines. Appl. Energy. 2015, 142, 361–388. [Google Scholar] [CrossRef]
- Pratumnopharat, P.; Leung, P.S. Validation of various windmill brake state models used by blade element momentum calculation. Renew. Energy. 2011, 36, 3222–3227. [Google Scholar] [CrossRef]
- Bai, C.J.; Wang, W.C.; Chen, P.W.; Chong, W.T. System integration of the horizontal-axis wind turbine: The design of turbine blades with an axial-flux permanent magnet generator. Energies 2014, 7, 7773–7793. [Google Scholar] [CrossRef]
- Gaonkar, G.H.; Peters, D. Review of dynamic inflow modeling for rotorcraft flight dynamics. Vertica 1988, 12, 213–242. [Google Scholar] [CrossRef]
- Laino, D.; Hansen, A.C. Current efforts toward improved aerodynamic modeling using the AeroDyn subroutines ASME wind energy symposium. In Proceeding of the Aerospace Sciences Meeting and Exhibit, Reno, NV, USA, 5–8 January 2004; pp. 329–338. [Google Scholar]
- Shahizare, B.; Nazri Bin Nik Ghazali, N.; Chong, W.; Saeed Tabatabaeikia, S.; Izadyar, N. Investigation of the optimal omni-direction-guide-vane design for vertical axis wind turbines based on unsteady flow CFD simulation. Energies 2016, 9, 146. [Google Scholar] [CrossRef]
- Gebhardt, C.G.; Preidikman, S.; Massa, J.C. Numerical simulations of the aerodynamic behavior of large horizontal-axis wind turbines. Int. J. Hydrogen Energy 2010, 35, 6005–6011. [Google Scholar] [CrossRef]
- Benjanirat, S. Computational studies of the horizontal axis wind turbines in high wind speed condition using advanced turbulence models. Ph.D. Thesis, Georgia Institute of Technology, Atlanta, GA, USA, 2006. [Google Scholar]
- Bulder, B.H.; van Hees, M.T.; Henderson, A.; Huijsmans, R.H.M.; Pierik, J.T.G.; Snijders, E.J.B.; Wijnants, G.H.; Wolf, M.J. Study to Feasibility of and Boundary Conditions for Floating Offshore Wind Turbines; Technische Universiteit Delft: Delft, Netherlands, 2002. [Google Scholar]
- Tracy, C.C.H. Parametric Design of Floating Wind Turbines. Ph.D. Thesis, Massachusetts Institute of Technology, Boston, MA, USA, 2007. [Google Scholar]
- Henderson, A.R.; Patel, M.H. On the modelling of a floating offshore wind turbine. Wind Energy 2003, 6, 53–86. [Google Scholar] [CrossRef]
- Withee, J.E. Fully coupled dynamic analysis of a floating wind turbine system. Ph.D. Thesis, Massachusetts Institute of Technology, Cambridge, MA, USA, 2004. [Google Scholar]
- Han, B.; Zhou, L.; Zhang, Z. LIDAR-assisted radial basis function neural network optimization for wind turbines. IEEJ Trans. Electr. Electr. 2018, 13, 195–200. [Google Scholar] [CrossRef]
- Lee, J.; Hajela, P. Parallel genetic algorithm implementation in multidisciplinary rotor blade design. J. Aircr. 1996, 33, 962–969. [Google Scholar] [CrossRef]
- Kusiak, A.; Zheng, H. Optimization of wind turbine energy and power factor with an evolutionary computation algorithm. Energy 2010, 35, 1324–1332. [Google Scholar] [CrossRef]
- Liao, C.C.; Xi, G.; Xu, J.Z. An improved PSO algorithm for solution of constraint optimization problem and its application. J. Eng. Thermophys.-Rus. 2009, 24, 256–260. (In Chinese) [Google Scholar]
- Liao, C.C.; Zhao, X.L.; Xu, J.Z. Blade layers optimization of wind turbines using FAST and improved PSO Algorithm. Renew. Energy 2012, 42, 227–233. [Google Scholar] [CrossRef]
- Yang, H.; Chen, J.; Pang, X. Wind turbine optimization for minimum cost of Energy in low wind speed areas considering blade length and hub height. Appl. Sci. 2018, 8, 1202. [Google Scholar] [CrossRef]
Figure 1.
FAST Simulink S-function.

Figure 2.
Blade structure of NREL 5 MW wind turbine.

Figure 3.
Blade layout.

Figure 4.
Distribution of the chord length for fixed wind turbine blade at rated wind speed before and after optimization.
Figure 4.
Distribution of the chord length for fixed wind turbine blade at rated wind speed before and after optimization.

Figure 5.
Distribution of the twist angle for fixed wind turbine blade at rated wind speed before and after optimization.
Figure 5.
Distribution of the twist angle for fixed wind turbine blade at rated wind speed before and after optimization.

Figure 6.
Time-domain calculation of fixed wind turbine power.

Figure 7.
Distribution of the twist angle for fixed wind turbine blade at low wind speed before and after optimization.
Figure 7.
Distribution of the twist angle for fixed wind turbine blade at low wind speed before and after optimization.

Figure 8.
Distribution of the twist angle for fixed wind turbine blade at low wind speed before and after optimization.
Figure 8.
Distribution of the twist angle for fixed wind turbine blade at low wind speed before and after optimization.

Figure 9.
Wind turbine blade power at low wind speed before and after optimization.

Figure 10.
Comparison of the wind turbine power at different wave heights.

Figure 11.
Comparison of the wind turbine power at different wave periods.

Figure 12.
Evolution of particle swarm at rated wind speed.

Figure 13.
Distribution of the twist angle at rated wind speed before and after optimization.

Figure 14.
Distribution of the chord length at rated wind speed before and after optimization.

Figure 15.
Distribution of the chord length at rated wind speed before and after smoothing.

Figure 16.
Evolution of particle swarm at mid-low wind speed.

Figure 17.
Distribution of the twist angle at mid-low wind speed before and after optimization.

Figure 18.
Distribution of the chord length at mid-low wind speed before and after optimization.

Figure 19.
Evolution of particle swarm at low wind speed.

Figure 20.
Distribution of the twist angle at low wind speed before and after optimization.

Figure 21.
Distribution of the chord length at low wind speed before and after optimization.

Figure 22.
Evolution of the particle swarm under actual sea conditions.

Figure 23.
Distribution of the twist angle under actual sea conditions before and after optimization.
Figure 23.
Distribution of the twist angle under actual sea conditions before and after optimization.

Figure 24.
Distribution of the chord length under actual sea conditions before and after optimization.
Figure 24.
Distribution of the chord length under actual sea conditions before and after optimization.


Table 1.
Overall parameters of NREL 5 MW wind turbine system.
| Name | Parameter |
|---|---|
| Unit-power | 5 MW |
| Blade layout | Upwind Direction, 3 blades |
| Control system | Variable speed, variable pitch |
| Drive system | High-speed multi-stage gearbox |
| Blade and hub diameter | 126 m, 3 m |
| Hub center height | 90 m |
| Cut-in, rated and cut-out wind speed | 3 m/s, 11.4 m/s, 25 m/s |
| Cut-in and rated blade rotate speed | 6.9 rpm, 12.1 rpm |
| Rated tip speed | 80 m/s |
| Cantilever length, axis inclination angle, pre-deflection angle of the blade | 5 m, 5°, 2.5° |
| Total system mass | 8,130,315.388 kg |
| Total gravity center height (below hydrostatic surface) | 77.3829 m |
Table 2.
Sea state parameters.
| Working Conditions | Wind Speed (m/s) | Significant Wave Height (m) | Peak Period (s) | Wave Direction (deg) |
|---|---|---|---|---|
| rated wind speed mid-low wind speed | 11.4 10 | 6 6 | 12 12 | 0 0 |
| low wind speed | 6 | 3 | 6 | 0 |
© 2019 by the authors. Licensee MDPI, Basel, Switzerland. This article is an open access article distributed under the terms and conditions of the Creative Commons Attribution (CC BY) license (http://creativecommons.org/licenses/by/4.0/).
Share and Cite
MDPI and ACS Style
Ma, Y.; Zhang, A.; Yang, L.; Hu, C.; Bai, Y. Investigation on Optimization Design of Offshore Wind Turbine Blades based on Particle Swarm Optimization. Energies 2019, 12, 1972. https://doi.org/10.3390/en12101972
AMA Style
Ma Y, Zhang A, Yang L, Hu C, Bai Y. Investigation on Optimization Design of Offshore Wind Turbine Blades based on Particle Swarm Optimization. Energies. 2019; 12(10):1972. https://doi.org/10.3390/en12101972
Chicago/Turabian StyleMa, Yong, Aiming Zhang, Lele Yang, Chao Hu, and Yue Bai. 2019. "Investigation on Optimization Design of Offshore Wind Turbine Blades based on Particle Swarm Optimization" Energies 12, no. 10: 1972. https://doi.org/10.3390/en12101972
Note that from the first issue of 2016, this journal uses article numbers instead of page numbers. See further details here.