Suppressing Conducted DM EMI in an Active Power Filter via Periodic Carrier Frequency Modulation

1
College of Instrumentation and Electrical Engineering, Jilin University, Changchun 130061, China
2
Company of Jilin Province BoAn Fire Fighting Equipment, Changchun 130026, China
*
Author to whom correspondence should be addressed.
Energies 2019, 12(10), 1903; https://doi.org/10.3390/en12101903
Submission received: 27 April 2019
/
Revised: 12 May 2019
/
Accepted: 15 May 2019
/
Published: 18 May 2019
(This article belongs to the Special Issue Active Power Filters)
Abstract
:Active power filters (APF) aim at solving the harmonic problem originated by the nonlinear load in power systems. However, the high dv/dt and di/dt outputs from power electronic devices in a voltage source converter on APF introduced unwanted conducted electromagnetic interference (EMI) when compensating for the low-frequency harmonic components. Hence, this paper develops a spectrum analysis approach to investigate and quantify the source differential-mode (DM) voltage of a single-phase shunt APF to suppress the DM EMI via periodic carrier frequency modulation (PCFM). In this scheme, the analytical expressions of source DM voltage in the APF using the PCFM scheme are obtained with a double Fourier series. In addition, the influence of PCFM parameters on the source DM voltage spectrum is predicted based on the analytical expression. As a result, the PCFM parameters, which have the best suppression effect on the DM EMI are obtained. The experiment results proved the validity of the sawtooth PCFM APF with the maximum frequency deviation equal to 800 Hz in alleviating the APF DM EMI.
1. Introduction
Due to the harmonic pollution and the power quality issues of the power system caused by nonlinear electrical equipment, passive filters (PF) [1] and active power filters (APF) [2] continue to attract substantial attention. Compared with PF, APF is considered to be the best solution to solve the harmonic disturbances because of its good dynamic performance, which has been employed in many areas such as residential, commercial, and industrial [3,4]. However, as a switching mode converter, APF generates considerable conducted differential-mode (DM) electromagnetic interference (EMI) [5,6]. The conducted DM EMI pollutes the power grid, and likely causes a large number of electronic device failures when APF and noise-sensitive analog circuits are connected to the same power line. Therefore, it is imperative to suppress the conducted DM EMI generated by the converter in the APF.
The traditional methods to solve this kind of problem is adding EMI filters [7,8] or using EMI shielding, which increases the extra weight and cost. Unlike traditional methods, the modulation approach is to suppress the conducted EMI by using carrier frequency modulation (CFM) schemes instead of the pulse width modulation (PWM). The CFM schemes spread the power of the switching frequency harmonics to a certain frequency band to reduce the peak spectral power of the harmonics generated by the PWM and eventually, decrease the conducted EMI. CFM schemes include random modulation [9,10], chaotic modulation [11,12,13,14], and periodic modulation [15,16,17,18]. The modulated spectrum distributions between the random system and the chaotic system are similar because of the intrinsic randomness. Based on this, the modulation bandwidth needs to be set widely to realize the purpose of suppressing the conducted EMI. However, these two technologies cause an adverse impact on the suppression of low-frequency interference [19]. By contrast, periodic carrier frequency modulation (PCFM) can achieve a narrower modulation bandwidth under the premise of ensuring the suppression effect of the conducted EMI. Therefore, this paper presents a reliable idea to apply the PCFM technology to an APF, which can suppress the conducted DM EMI.
PCFM has been extensively used in power converters to spread harmonic spectra and reduce EMI [20,21]. However, little attention has been paid to PCFM in reducing APF-conducted EMI. In [22], Gong and Ferreira have presented an APF based on random CFM and achieved the suppression of EMI. Like most of the PCFM approaches in the literature [15,16,17,18,20,21], study [22] only focuses on the effectiveness of the EMI suppression through numerical simulations and experimental observations; however, the quantitative analysis of the conducted EMI suppression effect by using CFM is scanty. Thus, this paper proposes a new spectrum calculation method of source DM voltage in a PCFM APF to suppress the conducted DM EMI produced by the switching operation. This approach first proposes the analytical expressions of the source DM voltage of the PCFM APF based on the spectral analysis method. Then, combining the source DM voltage suppression effect and the grid current low-frequency characterizations, the optimal parameters of the PCFM are selected. Finally, the EMI experimental platform of an APF is built to verify that the PCFM can effectively suppress the conducted DM EMI of the APF.
2. Spectral Analysis of the Source DM Voltage of APF
To illustrate the conducted DM EMI emission of a single-phase shunt APF, the topology and control diagram of the APF and its position in the standard conducted EMI test is shown in Figure 1. A pair of line impedance stabilization networks (LISN) in Figure 1 connected between the power source and the APF is served to isolate the interference of the power source and provide stable measured impedance. Based on Figure 1, the DM equivalent circuit model of the APF is shown in Figure 2.
From Figure 2, the voltage vDMEMI across the impedance ZLISN is generally considered as the conducted DM EMI from the APF when vDMS is coupled to the LISN pair [23]. vDMEMI can be gotten by:
where vDMS is the source DM voltage, which is the high-frequency content of the converter’s AC voltage vab; ZLISN is the equivalent impedance of LISN pair; Z1 is the equivalent impedance of the AC bus and line inductance L.
According to Figure 2 and Equation (1), the impedance Z1, Z2 (the equivalent impedance of the DC link capacitance C), and ZLISN in the APF system based on different PWM modulation strategies are constant, the conducted DM EMI mainly depends on the source DM voltage vDMS. Therefore, the next section is to focus on quantifying the effect of different modulation strategies on the source DM voltage vDMS spectrum.
2.1. Spectrum Calculation of the Source DM Voltage of the PWM APF
The traditional third-order PWM control scheme of the APF converter is shown in Figure 3. The modulated wave ur is a non-sinusoidal periodic signal whose fundamental frequency is fr. The carrier uc is a fixed frequency triangular wave signal whose frequency is fc. According to the literature [24], the PWM pulse is periodic in both the two axes (x = 2πfct, y = 2πfrt), and the output pulse voltage vab(t) of the APF converter can be expressed as a double Fourier series vab(x, y):
where A00/2 is the DC component; A0n and B0n are the Fourier coefficients of the fundamental and baseband harmonic components; Am0 and Bm0 are the Fourier coefficients of the carrier harmonic components; Amn and Bmn are the Fourier coefficients of the sideband harmonic components; n is the number of fundamental and baseband harmonic components; and m is the number of carrier harmonic components.
Fourier coefficients of Equation (2) can be expressed as:
The AC voltage of the converter of the single-phase shunt PWM APF can be expressed as:
Substituting Equation (4) into Equation (3), while using the Jacobi-Anger expansion:
Fourier coefficients of Equation (4) can be achieved by:
where Mu = Uu/Uc is the modulation index; Uu is the amplitude of the harmonics modulated wave; Uc is the amplitude of the carrier; umax is the maximum order of the harmonics of the modulated wave; ϕu is the phase of the harmonics modulated wave; κ = 2n/[umax(1 + umax)].
By substituting Equation (6) into Equation (2), the AC voltage vab of the converter of the single-phase shunt PWM APF can be expressed as:
From the analytical Equation (7), the vab spectra can be dissected into five regions shown in Figure 4. When m = 0 and n = 0, the analytical Equation (7) represents a DC component of vab with a frequency of 0 Hz and an amplitude of 0 V. When m = 0 and n = u = 1, the analytical Equation (7) represents a fundamental component of vab with a frequency of fr and an amplitude of M1Ed. When m = 0 and n = u ≠ 1, the analytical Equation (7) represents the baseband harmonic components of vab with a frequency of ufr and an amplitude of MuEd. When m ≠ 0 and n = 0, the analytical Equation (7) represents the carrier harmonic components of vab with a frequency of mfc and an amplitude of 0 V. When m ≠ 0 and n ≠ 0, the analytical Equation (7) represents the sideband harmonic components of vab with a frequency of mfc+nfr and an amplitude of . The source DM voltage vDMS of the PWM APF caused by the third-order PWM belongs to part 5 in Figure 4:
For a given PWM APF, its parameters are given in Table 1, the nonlinear load is a third harmonic source (M1 = 0.679, φ1 = 0°; M3 = 0.085, φ3 = 258°). The vDMS spectrum of the PWM APF obtained from numerical simulations and calculated with the analytical Equation (8) are compared in Figure 5. As shown in Figure 5, the calculated results match very well with the numerical results, and the analytical Equation (8) is very accurate. In particular, Figure 5 shows that the spectrum distribution of vDMS is related to the carrier frequency. In the next section, the vDMS of the PCFM APF will be further analyzed by using the spectrum analysis approach.
2.2. Spectrum Calculation of the Source DM Voltage of the PCFM APF
In fact, while using the PCFM PWM, the vDMS of the PCFM APF can be obtained by replacing fc in Equation (8) into fc(t):
where fc0 is the center frequency in the time-varying carrier frequencies; Δfc is the maximum frequency deviation from the time-varying carrier frequencies to the center frequency; and vm(t) is a deterministic period signal between [−1, 1].
The periodic signal vm(t) can be expanded by the Fourier series:
where av0/2 is the DC component; fv is the fundamental frequency; and aq and bq are the qfv frequency harmonic coefficients.
By substituting Equations (9) and (10) into Equation (8), the vDMS of the PCFM APF can be achieved after extensive calculation:
where
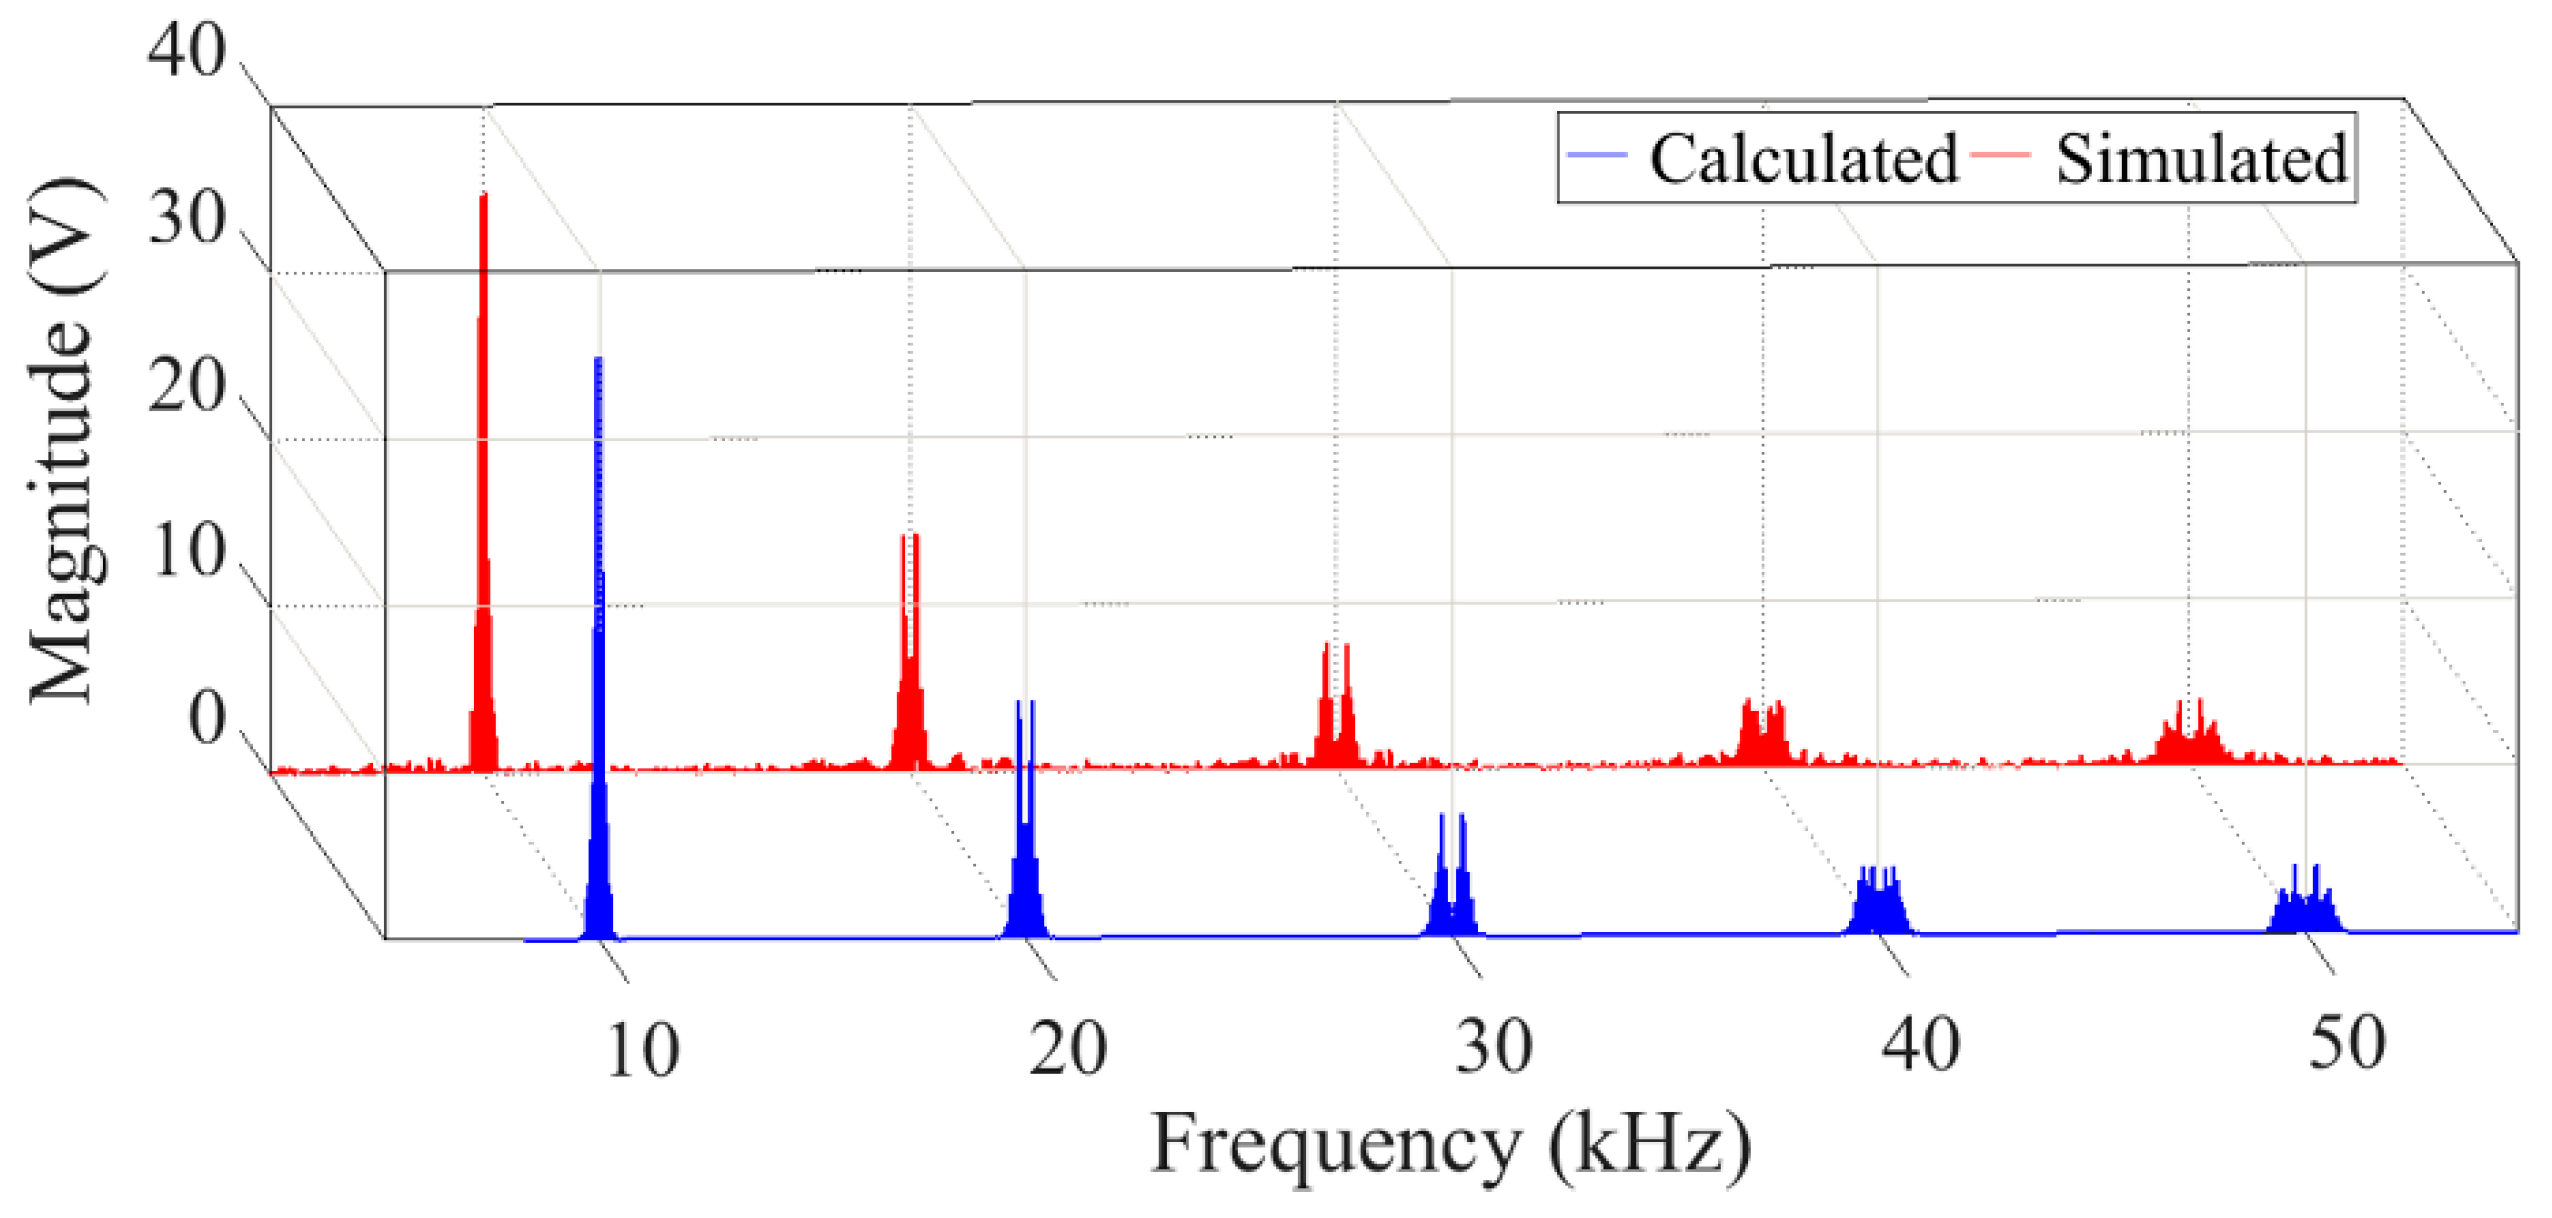
Based on Table 1 and the nonlinear load in Section 2.1, when the modulation signal for the PCFM is a sinusoid, fv = 100 Hz, fc0 = 10 kHz, and Δfc = 500 Hz, the vDMS spectrum of the PCFM APF obtained from numerical simulations and calculated from the analytical Equation (11) are compared in Figure 6. As shown in Figure 6, the calculated results match very well with the numerical results, and the analytical Equation (11) is very accurate. Through the comparative analysis of Figure 5 and Figure 6, it can be concluded that the vDMS peak of the PCFM APF has dropped about 50 percent than that of the PWM APF.
2.3. The PCFM Parameters Impact on the Spectrum of vDMS
The analytical Equation (11) can be used for quantificationally analyzing the effect of the PCFM parameters (vm(t) and Δfc) on the vDMS spectrum of the PCFM APF. In the frequency range between 9 kHz and 11 kHz, the waveforms of vm(t) are shown in Figure 7, and the calculated spectra of vDMS with the varying vm(t) are shown in Figure 8. The vDMS spectrum of the sinusoid PCFM APF and that of the triangular wave PCFM APF is analogous, the distribution of the harmonic is more concentrated on both sides of the extended frequency bandwidth, and sparser in the middle of the extended frequency bandwidth, but the vDMS peak amplitude of the sinusoid PCFM APF is 0.03 V larger than that of the triangular wave PCFM APF. Compared to the vDMS spectrum of the sinusoid PCFM APF and the triangular wave PCFM APF, the vDMS spectrum of the sawtooth PCFM APF is basically evenly distributed over the extended frequency bandwidth with minimal peaks. Therefore, the optimal modulating signals of PCFM APF are successively sawtooth, triangular wave, and sinusoid.
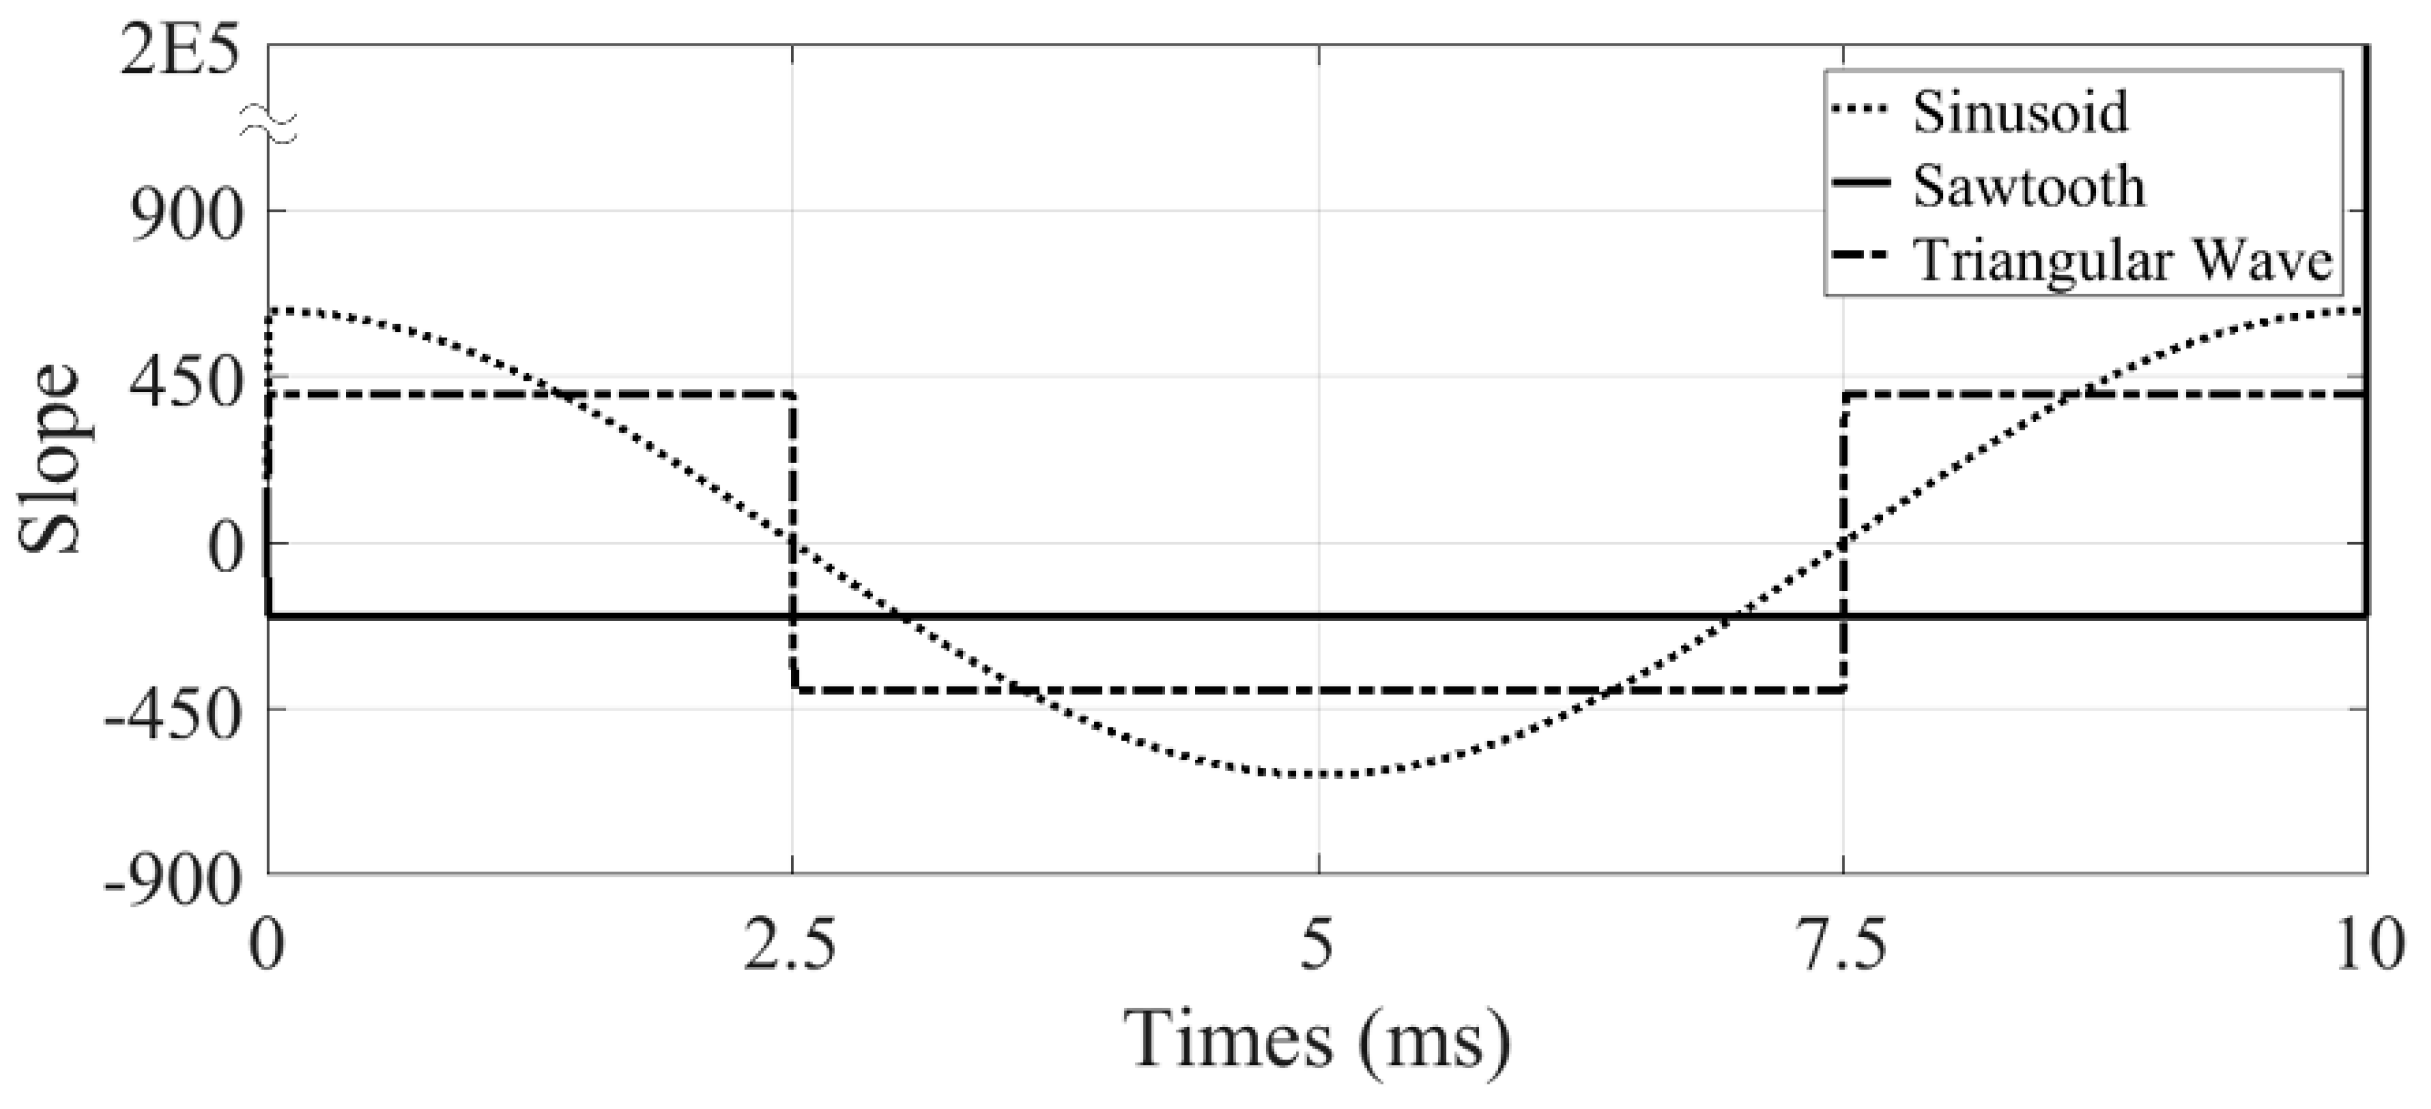
The vDMS spectrum distribution characteristics of the PCFM APF under three modulation signals in Figure 8 can be explained by the power spectral density (PSD), which is understood as the energy of a harmonic at a certain frequency, and the energy of a harmonic at a certain frequency is positively proportional to the acting time of the harmonic at that frequency. Analysis of the vDMS spectrum of the PCFM APF, the acting time of a harmonic at a certain frequency depends on the frequency distribution of the triangular carrier for the PCFM PWM; moreover, the frequency distribution of the triangular carrier relies on the slope of the modulation signals for the PCFM PWM. Specifically, when the slope dvm(t1)/dt of the modulation signal corresponding to a certain frequency fc(t1) in the harmonic spectrum is larger (smaller), the less (more) the triangular waves with the frequency of fc(t1) in the carrier, the shorter (longer) the acting time of the harmonic at the frequency of fc(t1), and the lower (higher) the amplitude of the harmonic at the frequency of fc(t1).
Figure 9 shows the slope of the three modulation signals in Figure 7. As shown in Figure 9, the absolute value of the slope of the sinusoid is the maximum (minimum) when at its zero-crossing instance (peak value). By using a periodic sinusoid modulation technique, the number of triangular carriers with a frequency of 10 kHz (9.5 kHz and 10.5 kHz) is the least (most). The acting time of the harmonics around the frequency of 10 kHz (9.5 kHz and 10.5 kHz) is the shortest (longest), and the amplitude of the harmonics around the frequency of 10 kHz (9.5 kHz and 10.5 kHz) is the minimum (maximum). Therefore, the vDMS spectrum of the sinusoid PCFM APF has a larger amplitude on both sides of the extended frequency bandwidth and a smaller amplitude in the middle of the extended frequency bandwidth.
The absolute value of the slope of the triangular wave is the minimum when at its peak value, the number of triangular carrier with a frequency of 9.5 kHz and 10.5 kHz is the most, the acting time of the harmonics around the frequency of 9.5 kHz and 10.5 kHz is the longest, and the amplitude of the harmonics around the frequency of 9.5 kHz and 10.5 kHz is the maximum. Compared to periodic sinusoid modulation signals, the absolute value of the slope of the triangular wave is a constant number when in its trailing and rising edge, the acting time of the harmonics within the bandwidth of 9.5–10.5 kHz is the same, so the harmonic amplitudes within the bandwidth of 9.5–10.5 kHz are comparable. According to the law of conservation of energy, the harmonic amplitude is the minimum when the harmonic energy is basically evenly distributed over the extended frequency bandwidth. Therefore, the vDMS spectrum of the triangular wave PCFM APF has a larger amplitude on both sides of the extended frequency bandwidth and a smaller amplitude in the middle of the extended frequency bandwidth. Moreover, the vDMS peak amplitude of the triangular wave PCFM APF is slightly smaller than that of the sinusoid PCFM APF.
The slope of the sawtooth is a constant number, the frequencies of the triangular carrier, by using periodic sawtooth modulation, are uniformly distributed within the bandwidth of 9.5–10.5 kHz, and the acting time of the harmonics within the bandwidth of 9.5–10.5 kHz is the same. Therefore, the harmonic amplitudes within the bandwidth of 9.5–10.5 kHz are comparable. According to the law of conservation of energy, the vDMS amplitude of the sawtooth PCFM APF is the minimum over the extended frequency bandwidth. The above analysis results are consistent with the vDMS spectrum distribution characteristics of the PCFM APF under three modulation signals, which verify that the optimal modulation signals of the PCFM APF are successively sawtooth, triangular wave, and sinusoid.
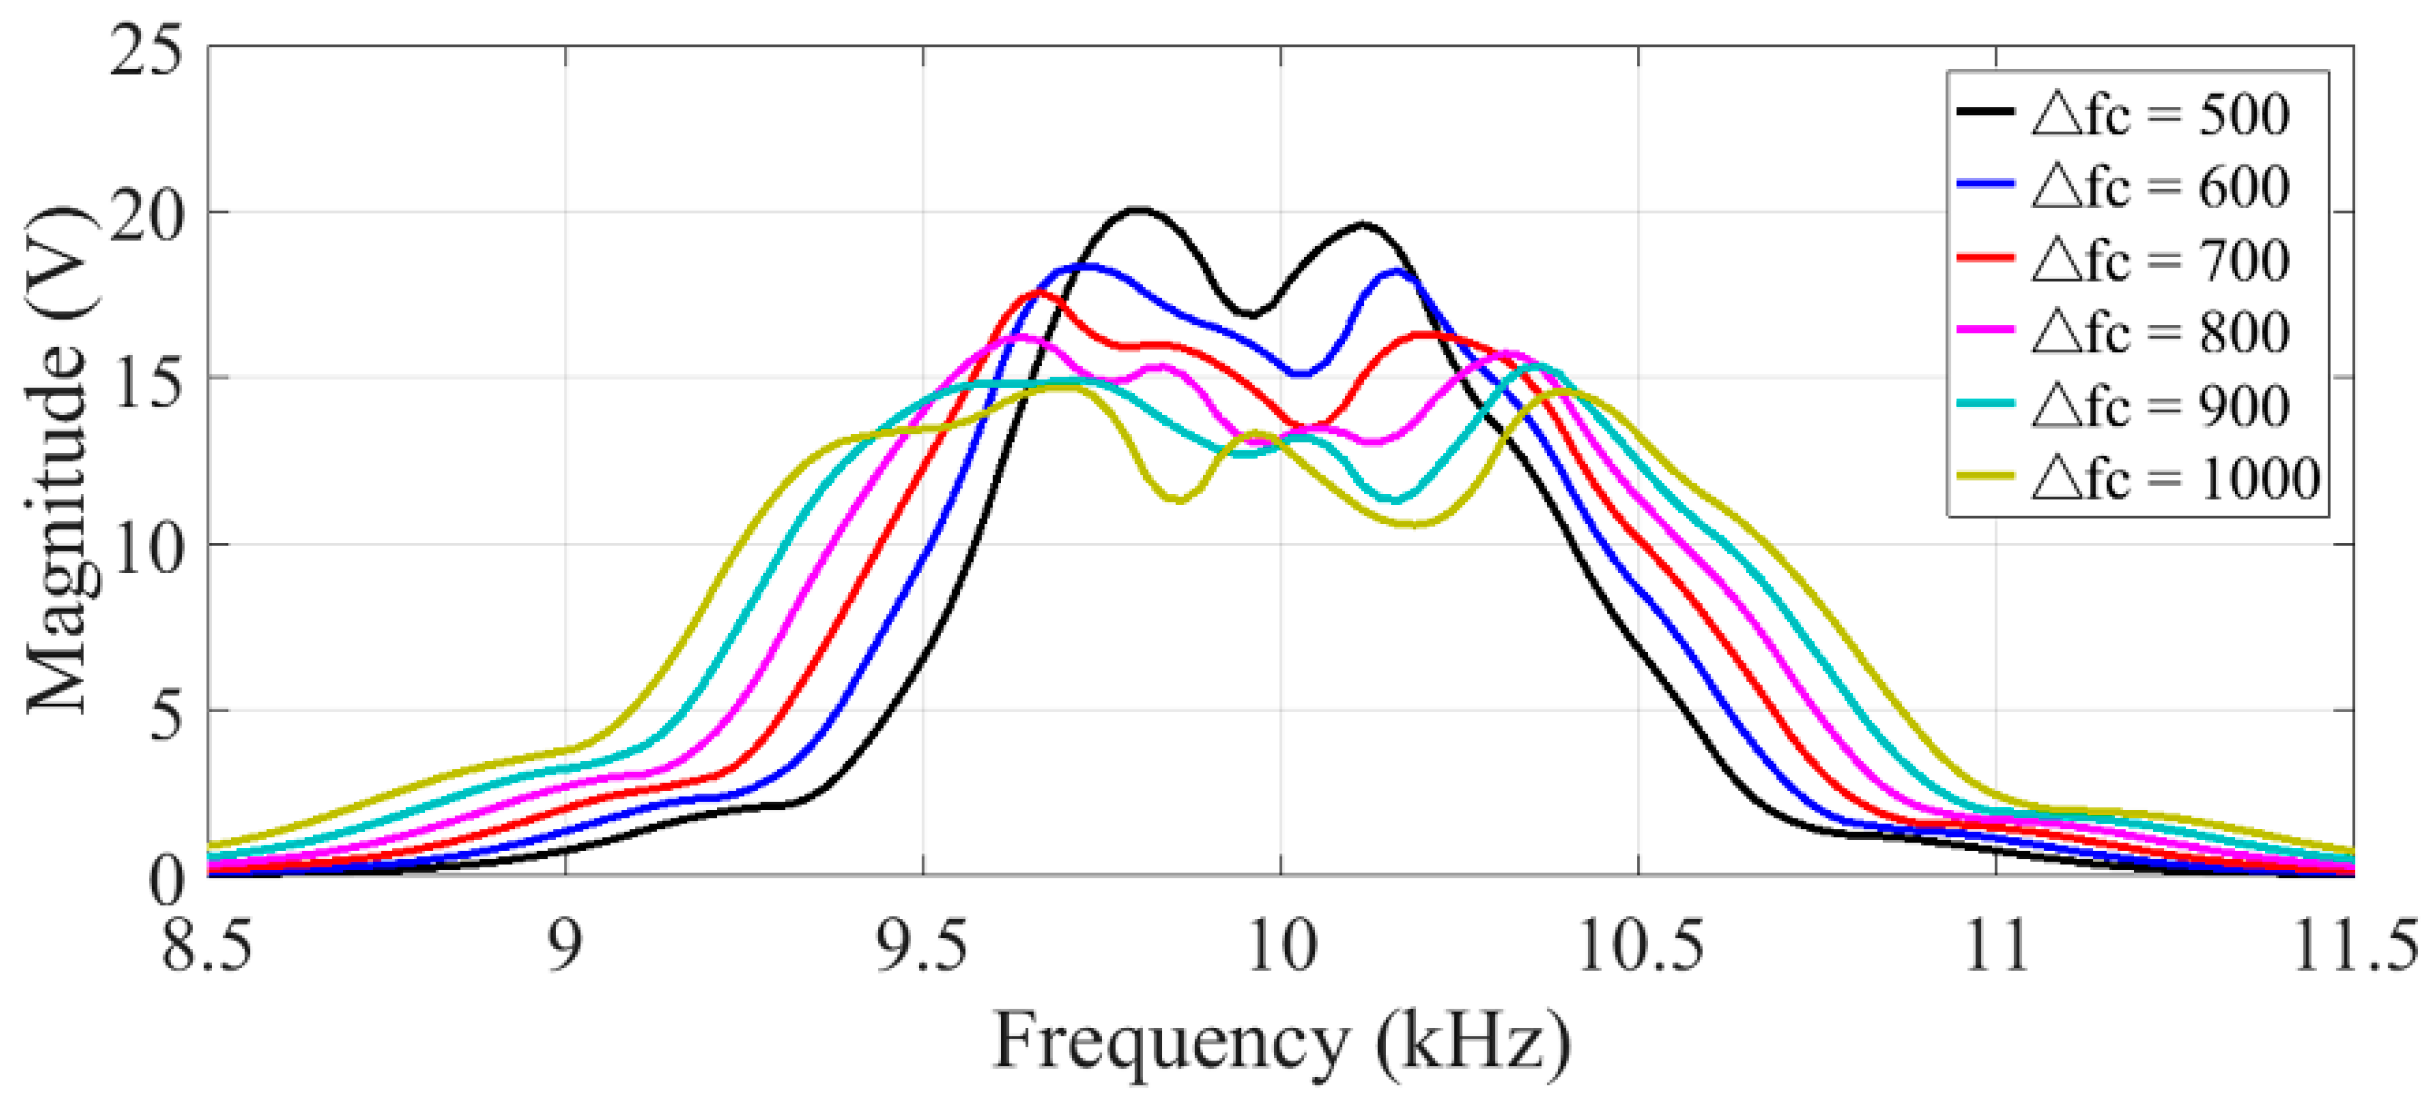
In the frequency range between 9 kHz and 11 kHz, the vDMS calculated spectra of sawtooth PCFM APF with varying Δfc are shown in Figure 10. As Δfc increases, the spectra of vDMS spread out from 10 kHz, the peak amplitude of the vDMS spectrum reduces, and the decrement of the peak amplitude is gradually reduced. At the same time, the bandwidth of the peak-to-peak increases, and the increment of the bandwidth is unchanged. For the APF system, excessive bandwidth of peak-to-peak could result in performance degradations caused by the low-frequency harmonic components increase. The low-frequency characterizations calculated with vDMS/(jωL + R) of the grid current compensated by sawtooth PCFM APF with varying Δfc are illustrated in Figure 11. The decrement of the peak amplitude of the grid current is gradually reduced when Δfc increases gradually from 500 Hz to 1000 Hz, and the advantage of reducing the peak amplitude is offset by the increase in the low-frequency output ripple when Δfc > 800 Hz. Therefore combining the source DM voltage suppression effect and the grid current low-frequency characterizations, Δfc = 800 Hz is selected as the optimal frequency deviation of the sawtooth PCFM APF.
3. Experimental Comparison of the Conducted DM EMI of the PWM APF and PCFM APF
In the experiments, the experimental platform of a single-phase full-bridge APF and the nonlinear loads are shown in Figure 12. The main parameters of the APF are shown in Table 1, and the types of the main experimental devices are given in Table 2. The nonlinear load consists of an uncontrollable rectifier with resistance, inductance, and capacitance load, which is employed as a harmonic source. Both the spectra of the source DM voltage vDMS and the DM EMI vDMEMI ranged from 6 kHz to 100 kHz.
The experimental results of the current waveforms for PWM APF and sawtooth PCFM APF with Δfc = 800 Hz are presented in Figure 13 and Figure 14, respectively. As can be seen from Figure 13, the load I current is distorted with the total harmonic distortion (THD) level of 21.11%. The grid current becomes more close to ideal sinusoidal through APF compensation, and the THD of the grid current is reduced to 3.99%. At about 0.06 s, the load on the system is changed from the nonlinear load I to nonlinear load II, by observing the dynamic response of three current waveforms, it can be seen that the APF system achieves new steady states after 20 ms. Under the nonlinear load II, the THD of the compensated grid current is reduced from 30.93% to 5.34%.
From Figure 14, it can be seen that the THD of the compensated grid current under the nonlinear load I is reduced from 21.11% to 3.33%. When the nonlinear load changes, the shunt APF system achieves new steady states within one cycle. Under the nonlinear load II, the THD of the compensated grid current is reduced from 30.93% to 4.66%. The results of the experiment show that the APF system designed in the paper achieves the expected compensation effect.
The current waveforms shown in Figure 13 and Figure 14 look almost identical because of the high switching frequencies. However, the frequency domain information of vDMS and the DM EMI shown in Figure 15, Figure 16, Figure 17 and Figure 18 distinctly differ from each other.
The time domain data of the source DM voltage are measured using a Tektronix DPO3052, and then analyzed based on the fast Fourier transform (FFT) method. Finally, the source DM voltage spectra are obtained by calculation. The experimental results under nonlinear load I and nonlinear load II are presented in Figure 15 and Figure 16, respectively. As shown in Figure 15, under the nonlinear load I, the source DM voltage vDMS spectrum of PWM APF concentrates at multiples of the switching frequency. The peak amplitude of the vDMS spectrum of PWM APF, which emerges near 10 kHz, is 151.7 dBµV. The concentration of the vDMS spectrum is spread to the harmonic sidebands by the PCFM. The peak amplitude of the vDMS spectrum of the sawtooth PCFM APF with Δfc = 800 Hz that emerges near 10 kHz is 142.0 dBµV, and 9.7 dBµV lower than the PWM APF. As shown in Figure 16, under the nonlinear load II, the peak amplitude of the vDMS spectrum of PWM APF, which emerges near 10 kHz, is 151.9 dBµV. The peak amplitude of the vDMS spectrum of the sawtooth PCFM APF with Δfc = 800 Hz emerges near 10 kHz is 142.4 dBµV, and 9.5 dBμV lower than the PWM APF. Experimental results validating that PCFM APF can effectively reduce the peak amplitudes of vDMS.
The conducted DM EMI spectra are measured using a Rohde & Schwarz ESL and quasi-peak detection mode. The experimental results under the nonlinear load I and nonlinear load II are presented in Figure 17 and Figure 18, respectively. As shown in Figure 17 and Figure 18, the conducted DM EMI spectra of PWM APF concentrate at multiples of the switching frequency. The peak amplitudes of the conducted DM EMI spectra of PWM APF, which emerge near 10 kHz, are 111.4 dBµV (nonlinear load I) and 111.1 dBµV (nonlinear load II). The concentration of the conducted DM EMI spectra is spread to the harmonic sidebands by the PCFM. The peak amplitudes of the conducted DM EMI spectra of sawtooth PCFM APF with Δfc = 800 Hz, which emerge near the 10 kHz, are 104.8 dBµV (nonlinear load I) and 105.0 dBµV (nonlinear load II).
The peak amplitudes of the conducted DM EMI spectra of the PCFM APF are smaller than that of the PWM APF and reduced by 6.6 dBµV (nonlinear load I) and 6.1 dBµV (nonlinear load II). Experimental results validate that the PCFM APF can effectively reduce the conducted DM EMI.
The experimental results are in good agreement with the theoretical analysis results. In addition, experiments indicate that PCFM APF not only suppresses the conducted DM EMI well but also has a good compensation effect for the distorted current.
4. Conclusions
This paper investigated and quantified the source DM voltage in a PCFM APF to suppress the conducted DM EMI produced by the switching operation. It first concluded that the conducted DM EMI of the APF will be significantly impacted by the source DM voltage. Then, the analytical expressions for the source DM voltage of the PWM APF and Pthe CFM APF are derived and thoroughly discussed. The discussions reveal that the conducted DM EMI spreading depends on both the modulation signals and the frequency deviations of the PCFM. Finally, combining the source DM voltage suppression effect and the grid current low-frequency characterizations, a sawtooth is selected as the modulation signal and the frequency deviation is 800 Hz. The experimental results have confirmed that the proposed PCFM APF can effectively suppress the conducted DM EMI which usually occurs in the PWM APF. In fact, this developed spectrum analysis approach provides rigorous theoretical foundations for investigating and quantifying the source DM voltage of a single-phase shunt APF, which can provide the opportunity to optimize the THD of the compensated grid current and the DM EMI generated by the APF.
Author Contributions
Conceptualization—S.Y., N.C., L.G. and Y.H.; Hardware—N.C. and H.Z.; Software—N.C.; Validation—N.C., L.G. and H.Z.; Writing of original draft preparation–N.C. and L.G.; Experimental data curation—N.C. and L.G.; Formal analysis—N.C. and L.G.; Supervision—S.Y., H.Z. and Y.H.
Funding
“This research was funded by Department of Science and Technology of Jilin Province, grant number 20160204034GX” and “The APC was funded by Jilin University”.
Conflicts of Interest
The authors declare no conflict of interest.
References
- Montoya, F.G.; Alcayde, A.; Arrabal-Campos, F.M.; Baños, R. Quadrature Current Compensation in Non-Sinusoidal Circuits Using Geometric Algebra and Evolutionary Algorithms. Energies 2019, 12, 692. [Google Scholar] [CrossRef]
- Akagi, H. New Trends in Active Filters for Power Conditioning. IEEE Trans. Ind. Appl. 1996, 56, 1312–1322. [Google Scholar] [CrossRef]
- Qasim, M.; Kanjiya, P.; Khadkikar, V. Optimal Current Harmonic Extractor Based on Unified ADALINEs for Shunt Active Power Filters. IEEE Trans. Power Electron. 2014, 29, 6383–6393. [Google Scholar] [CrossRef]
- Tareen, W.; Aamir, M.; Mekhilef, S.; Nakaoka, M.; Seyedmahmoudian, M.; Horan, B.; Memon, M.; Baig, N. Mitigation of Power Quality Issues Due to High Penetration of Renewable Energy Sources in Electric Grid Systems Using Three-Phase APF/STATCOM Technologies: A Review. Energies 2018, 11, 1491. [Google Scholar] [CrossRef]
- Lei, W.J.; Wang, Y.; Zhuo, F.; Liu, J.J.; Zhai, X.; Si, W.B.; Wang, Z.A. Analysis and suppression of conductive EMI originated by an active power filter. In Proceedings of the Conference Record of the 2005 Industry Applications Conference 2005, Hong Kong, China, 2–6 October 2005; pp. 1220–1224. [Google Scholar]
- Zhang, L.; Luo, X.B.; Liu, X.S.; Ding, K. The structural stability analysis of active power filter and its capability of suppressing EMI. In Proceedings of the 43rd International Universities Power Engineering Conference, Padova, Italy, 1–4 September 2008. [Google Scholar]
- Goswami, R.; Wang, S.; Solodovnik, E.; Karimi, K.J. Differential Mode Active EMI Filter Design for a Boost Power Factor Correction AC/DC Converter. IEEE J. Emerg. Sel. Top. Power Electron. 2019, 7, 576–590. [Google Scholar] [CrossRef]
- Liu, Y.; Lai, C.M. LCL Filter Design with EMI Noise Consideration for Grid-Connected Inverter. Energies 2018, 11, 1646. [Google Scholar] [CrossRef]
- Lai, Y.S.; Chen, B.Y. New Random PWM Technique for a Full-Bridge DC/DC Converter with Harmonics Intensity Reduction and Considering Efficiency. IEEE Trans. Power Electron. 2013, 28, 5013–5023. [Google Scholar] [CrossRef]
- Kapat, S. Reconfigurable Periodic Bifrequency DPWM with Custom Harmonic Reduction in DC–DC Converters. IEEE Trans. Power Electron. 2016, 31, 3380–3388. [Google Scholar] [CrossRef]
- Gamoudi, R.; Charing, D.E.; Sbita, L. A Review of Spread—Spectrum—Based PWM Techniques—A Novel Fast Digital Implementation. IEEE Trans. Power Electron. 2018, 33, 10292–10307. [Google Scholar] [CrossRef]
- Nguyen, V.H.; Huyuh, H.A.; Kim, S.Y.; Song, H.J. Active EMI Reduction Using Chaotic Modulation in a Buck Converter with Relaxed Output LC Filter. Electronics 2018, 7, 254. [Google Scholar] [CrossRef]
- Li, H.; Li, Z.; Zhang, B.; Wang, F.L.; Tan, N.L.; Halang, W.A. Design of Analogue Chaotic PWM for EMI Suppression. IEEE Trans. Electromagn. Compat. 2010, 52, 1001–1007. [Google Scholar] [CrossRef]
- Li, H.; Yang, Z.C.; Wang, B.Y.; Agelidis, V.G.; Zhang, B. On Thermal Impact of Chaotic Frequency Modulation SPWM Techniques. IEEE Trans. Ind. Electron. 2017, 46, 2032–2043. [Google Scholar] [CrossRef]
- Huang, J.; Xiong, R. Study on Modulating Carrier Frequency Twice in SPWM Single-Phase Inverter. IEEE Trans. Power Electron. 2014, 29, 3384–3392. [Google Scholar] [CrossRef]
- Johnson, S.; Zane, R. Custom Spectral Shaping for EMI Reduction in High-Frequency Inverters and Ballasts. IEEE Trans. Power Electron. 2005, 20, 1499–1505. [Google Scholar] [CrossRef] [Green Version]
- Balcells, J.; Santolaria, A.; Orlandi, A.; Gonzalez, D.; Gago, J. EMI Reduction in Switched Power Converters Using Frequency Modulation Techniques. IEEE Trans. Electromagn. Compat. 2005, 47, 569–576. [Google Scholar] [CrossRef]
- Gonzalez, D.; Balcells, J.; Santolaria, A.; Le Bunetel, J.C.; Gago, J.; Magon, D.; Brehaut, S. Conducted EMI Reduction in Power Converters by Means of Periodic Switching Frequency Modulation. IEEE Trans. Power Electron. 2007, 22, 2271–2281. [Google Scholar] [CrossRef]
- Tse, K.K.; Chung, H.S.; Ron Hui, S.Y.; So, H.C. A Comparative Study of Carrier-Frequency Modulation Techniques for Conducted EMI Suppression in PWM Converters. IEEE Trans. Ind. Electron. 2002, 49, 618–627. [Google Scholar] [CrossRef]
- Bazzi, A.M.; Krein, P.T.; Kimball, J.W.; Kepley, K. IGBT and Diode Loss Estimation under Hysteresis Switching. IEEE Trans. Power Electron. 2012, 27, 1044–1048. [Google Scholar] [CrossRef]
- Xu, Y.X.; Yuan, Q.B.; Zou, J.B.; Li, Y. Analysis of Triangular Periodic Carrier Frequency Modulation on Reducing Electromagnetic Noise of Permanent Magnet Synchronous Motor. IEEE Trans. Magn. 2012, 48, 4424–4427. [Google Scholar] [CrossRef]
- Borisov, K.; Ginn, H.L., III; Trzynadlowski, A.M. Attenuation of Electromagnetic Interference in a Shunt Active Power Filter. IEEE Trans. Power Electron. 2007, 22, 1912–1918. [Google Scholar] [CrossRef]
- CISPR 11: Industrial, Scientific and Medical (ISM) Radio-Frequency Equipment-Limits and Methods of Measurement; IEC: Geneva, Switzerland, 2003.
- Holmes, D.G.; Lipo, T. Pulse Width Modulation for Power Converters: Principles and Practice; Wiley: New York, NY, USA, 2003. [Google Scholar]
Figure 1.
Topology and control diagram of the single-phase shunt APF.

Figure 2.
DM equivalent circuit model of a single-phase shunt APF.

Figure 3.
Schematic diagram of the third-order PWM control.

Figure 4.
Analytical expressions of the vab spectra.

Figure 5.
Comparison between the calculated spectrum and the simulated spectrum of the vDMS for the PWM APF.
Figure 5.
Comparison between the calculated spectrum and the simulated spectrum of the vDMS for the PWM APF.

Figure 6.
Comparison between the calculated spectrum and the simulated spectrum of the vDMS for the sinusoid PCFM APF with Δfc = 500 Hz.
Figure 6.
Comparison between the calculated spectrum and the simulated spectrum of the vDMS for the sinusoid PCFM APF with Δfc = 500 Hz.

Figure 7.
Two periods of the three modulation signals.

Figure 8.
The source DM voltage vDMS spectra of the PCFM APF with different modulation signals (Δfc = 500 Hz).
Figure 8.
The source DM voltage vDMS spectra of the PCFM APF with different modulation signals (Δfc = 500 Hz).

Figure 9.
The slope of the three modulation signals in Figure 7.
Figure 9.
The slope of the three modulation signals in Figure 7.

Figure 10.
The source DM voltage vDMS spectra of the sawtooth PCFM APF with different frequency deviations.
Figure 10.
The source DM voltage vDMS spectra of the sawtooth PCFM APF with different frequency deviations.

Figure 11.
The low-frequency characterizations of the sawtooth PCFM APF with different frequency deviations.
Figure 11.
The low-frequency characterizations of the sawtooth PCFM APF with different frequency deviations.

Figure 12.
Experimental platform of a single-phase full-bridge APF: (a) Nonlinear loads; (b) Experimental platform.
Figure 12.
Experimental platform of a single-phase full-bridge APF: (a) Nonlinear loads; (b) Experimental platform.


Figure 13.
Experimental results of the current waveforms for PWM APF under the load change conditions.
Figure 13.
Experimental results of the current waveforms for PWM APF under the load change conditions.

Figure 14.
Experimental results of the current waveforms for the sawtooth PCFM APF with Δfc = 800 Hz under the load change condition.
Figure 14.
Experimental results of the current waveforms for the sawtooth PCFM APF with Δfc = 800 Hz under the load change condition.

Figure 15.
Experimental results of the source DM voltage vDMS spectra of APF under the nonlinear load I (Sawtooth PCFM APF with Δfc = 800 Hz).
Figure 15.
Experimental results of the source DM voltage vDMS spectra of APF under the nonlinear load I (Sawtooth PCFM APF with Δfc = 800 Hz).

Figure 16.
Experimental results of the source DM voltage vDMS spectra of APF under the nonlinear load II (Sawtooth PCFM APF with Δfc = 800 Hz).
Figure 16.
Experimental results of the source DM voltage vDMS spectra of APF under the nonlinear load II (Sawtooth PCFM APF with Δfc = 800 Hz).

Figure 17.
Experimental results of the DM EMI vDMEMI of APF under the nonlinear load I (Sawtooth PCFM APF with Δfc = 800 Hz).
Figure 17.
Experimental results of the DM EMI vDMEMI of APF under the nonlinear load I (Sawtooth PCFM APF with Δfc = 800 Hz).

Figure 18.
Experimental results of the DM EMI vDMEMI of APF under the nonlinear load II (Sawtooth PCFM APF with Δfc = 800 Hz).
Figure 18.
Experimental results of the DM EMI vDMEMI of APF under the nonlinear load II (Sawtooth PCFM APF with Δfc = 800 Hz).


Table 1.
Parameters of APF.
| Symbol | Value | Commentary |
|---|---|---|
| Us | 220 V/50 Hz | AC input voltage |
| Tra | 220:48 | Transformer |
| fc | 10 kHz | Fixed carrier frequency |
| fr | 50 Hz | Fundamental frequency |
| R | 0.1 Ω | Line resistance |
| L | 1.8 mH | Line inductance |
| C | 470 μF | DC link capacitance |
| Vdc | 100 V | DC link voltage |
Table 2.
Main Experimental Devices.
| Component | Types |
|---|---|
| Field Programmable Gate Array (FPGA) | EP3C25E144C8 |
| Insulated Gate Bipolar Transistor (IGBT) | HGTG-30N60A4D |
| LISN | EM5040B |
| EMI Test Receiver | Rohde&Schwarz ESL |
| Spectrum Analyzer | JHDZ-6 |
| Oscilloscope | Tektronix DPO3052 |
© 2019 by the authors. Licensee MDPI, Basel, Switzerland. This article is an open access article distributed under the terms and conditions of the Creative Commons Attribution (CC BY) license (http://creativecommons.org/licenses/by/4.0/).
Share and Cite
MDPI and ACS Style
Yu, S.; Chen, N.; Gao, L.; Zhou, H.; Huang, Y. Suppressing Conducted DM EMI in an Active Power Filter via Periodic Carrier Frequency Modulation. Energies 2019, 12, 1903. https://doi.org/10.3390/en12101903
AMA Style
Yu S, Chen N, Gao L, Zhou H, Huang Y. Suppressing Conducted DM EMI in an Active Power Filter via Periodic Carrier Frequency Modulation. Energies. 2019; 12(10):1903. https://doi.org/10.3390/en12101903
Chicago/Turabian StyleYu, Shengbao, Nan Chen, Lihui Gao, Haigen Zhou, and Yong Huang. 2019. "Suppressing Conducted DM EMI in an Active Power Filter via Periodic Carrier Frequency Modulation" Energies 12, no. 10: 1903. https://doi.org/10.3390/en12101903
Note that from the first issue of 2016, this journal uses article numbers instead of page numbers. See further details here.