Article

Coordinated Voltage Regulation by On-Load Tap Changer Operation and Demand Response Based on Voltage Ranking Search Algorithm

1
College of Electrical Engineering, Zhejiang University, Hangzhou 310027, China
2
College of Electronics and Information, Hangzhou Dianzi University, Hangzhou 310018, China
3
College of Electrical Engineering, Naval University of Engineering, Wuhan 430033, China
*
Author to whom correspondence should be addressed.
Energies 2019, 12(10), 1902; https://doi.org/10.3390/en12101902
Submission received: 16 April 2019 / Revised: 13 May 2019 / Accepted: 15 May 2019 / Published: 18 May 2019
(This article belongs to the Special Issue Demand Response Optimization for Smart Energy Systems)

Abstract

:
The growing penetration of photovoltaic (PV) systems may cause an over-voltage problem in power distribution systems. Meanwhile, charging of massive electric vehicles may cause an under-voltage problem. The over- and under-voltage problems make the voltage regulation become more challenging in future power distribution systems. Due to the development of smart grid and demand response, flexible resources such as PV inverters and controllable loads can be utilized for voltage regulation in distribution systems. However, the voltage regulation needs to calculate the nonlinear power flow; as a result, utilizing flexible resources for voltage regulation is a nonlinear scheduling problem requiring heavy computational resources. This study proposes an intelligent search algorithm called voltage ranking search algorithm (VRSA) to solve the optimization of flexible resource scheduling for voltage regulation. The VRSA is built based on the features of radial power distribution systems. A numerical simulation test is carried out on typical power distribution systems. The VRSA is compared with the genetic algorithm and voltage sensitivity method. The results show that the VRSA has the best optimization effect among the three algorithms. By utilizing flexible resources through demand response, the tap operation times of on-load tap changers can be reduced.

1. Introduction

With the integration of distributed generation (DG) technologies, such as rooftop photovoltaic (PV) systems, great changes took place in power distribution systems [1]. In traditional power distribution systems, the power flow is from substations to customers. After the DG is installed on the customer side, the power flow may become inverse. More seriously, the high penetration of rooftop PV systems may increase the voltage of power distribution systems beyond the upper limit, causing an over-voltage problem [2]. Meanwhile, the number of electric vehicles (EVs) rose dramatically in recent years. The charging of EV batteries may bring significant challenges to power distribution systems. For example, simultaneous charging of massive EVs may cause an under-voltage problem [3]. The over- and under-voltage problems complicate the voltage regulation issue of power distribution systems.
Several researches were performed to solve the over- and under-voltage problems. A distribution system operator (DSO) focuses on traditional voltage regulation devices such as on-load tap changers (OLTCs) and reactive power devices. Due to the intermittent output of PV systems, the voltage variations of PV-installed nodes happen so quickly that the tap of OLTCs cannot operate as quickly as required [4]. Salih and Chen [5] focused on studying the coordination of OLTCs and reactive power devices to deal with voltage regulation. Moreover, Molina-Garcìa et al. [6] utilized a PV inverter to generate reactive power for voltage regulation. However, because the value of the reactance/resistance (X/R) ratio was low, the effect of utilizing reactive power for voltage regulation was limited. Therefore, active power should be considered for voltage regulation. Tonkoski et al. [7] studied curtailing the active power of PV systems when the over-voltage problem occurs. Furthermore, energy storage systems (ESSs) [8] or batteries [9] were applied in PV-rich power distribution systems. Owing to the development of demand response (DR) technology, voltage regulation by customers’ flexible resources attracted more attention recently. Vivekananthan et al. [10] provided a reward-based DR to utilize residential customers’ controllable load (CL) to improve the voltage condition and shave network peaks. A decentralized multi-agent system was proposed by Mocci et al. [11] to coordinate active power demand and EVs. Yao et al. [12] proposed a voltage sensitivity-based CL scheduling algorithm to shave the load peak and solve the over-voltage problem. Xie et al. studied a real-time coordinated control of the OLTC and CLs for over-voltage prevention [13].
Since the introduction of smart grids, smart meters were extensively installed on the customer side to enable the two-way communication between the customers and the DSO [14]. In modern smart grids, customers can play an active role as small producers via DG, or as virtual power plants by participating in DR programs [15]. Flexible resources such as PV inverters and CLs can be utilized through the DR for solving the over- and under-voltage problems in power distribution systems. The DSO can better manage the voltage condition in power distribution systems by utilizing more flexible resources. When utilizing the PV inverters, the adjustment of reactive and active power should be minimized for the purpose of minimally affecting the PV generation output. When shifting the customers’ CL to regulate the voltage, the combination power of CLs should be minimized so that the customers’ loads schedule can be minimally disturbed. In other words, if a higher capacity of CLs is utilized for voltage regulation, the DSO should pay more to customers through the DR program. As a result, the selection of CL should be optimized for voltage regulation. However, the voltage regulation needs to calculate the nonlinear power flow; as a result, utilizing flexible resources for voltage regulation is a nonlinear scheduling problem requiring heavy computational resources.
Many heuristic algorithms, such as the genetic algorithm (GA) [16] and particle swarm optimization algorithm [17], were applied for solving non-linear voltage regulation problems. Heuristic algorithms usually need many iterations to attain the result, which makes them time-consuming. The voltage sensitivity method (VSM) is widely used in voltage regulation [18]. Voltage sensitivity matrices are derived by Newton–Raphson algorithm-based power flow calculation. The amounts of reactive and active power, which can regulate the voltage magnitude to the desired range, are directly calculated by the sensitivity matrix [19]. The VSM is adequate for real-time voltage regulation due to its fast calculation speed. However, the VSM directly calculates the needed regulation power of each node but does not consider whether the available flexible resource is sufficient at the node. Furthermore, the VSM regulates the voltage of all nodes to the desired range, which does not focus on the regulation of voltage-violated nodes. As a result, the optimization by VSM can be further explored. This study proposes a new intelligent search algorithm called the voltage ranking search algorithm (VRSA) to solve the optimization of flexible resource scheduling for voltage regulation. The VRSA is built based on the features of a radial power distribution system. A numerical simulation test is validated on an IEEE 33-node power distribution system, and the VRSA is compared with VSM and GA. The results show that the VRSA has the best optimization effect among the three algorithms. By utilizing flexible resources, the number of OLTC tap operations can be reduced; in other words, the stress of voltage regulation of the DSO can be relieved.
The remainder of this paper is organized as follows: Section 2 describes the over- and under-voltage problems; Section 3 presents the formulation of the voltage regulation problem and solving of the algorithms; Section 4 describes the numerical simulation test and its results; finally, Section 5 provides conclusions to the study.

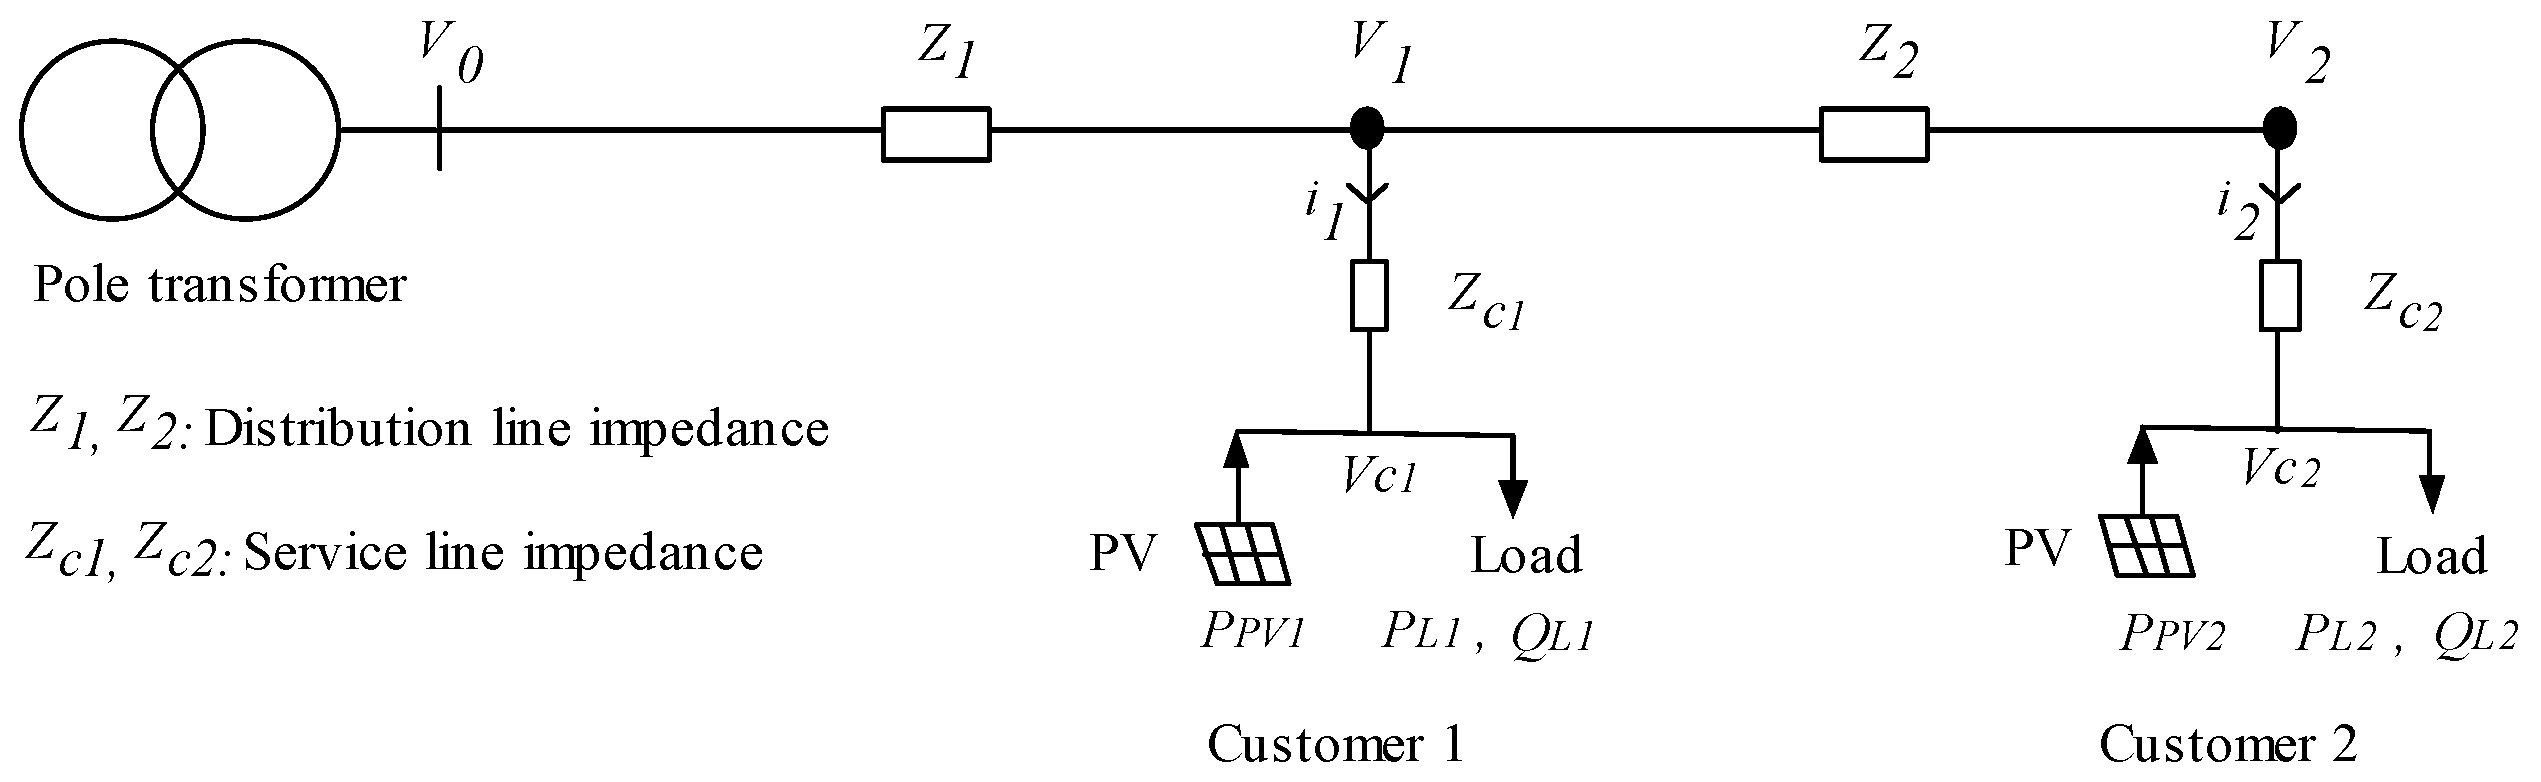
2. The Over- and Under-Voltage Problems and Voltage Regulation by Flexible Resources

2.1. Voltage Limits in Power Distribution Systems

In power distribution systems, electricity is serviced to customers with a limited range. A voltage violation of the limited range would harm customers’ appliances. As previously mentioned, over-voltage problems may occur in the daytime when PV output is high, while under-voltage problems may occur during the night when massive EVs are simultaneously charging. Because the time periods of the over- and under-voltage problems do not overlap, the DSO should separately cope with over- and under-voltage problems.

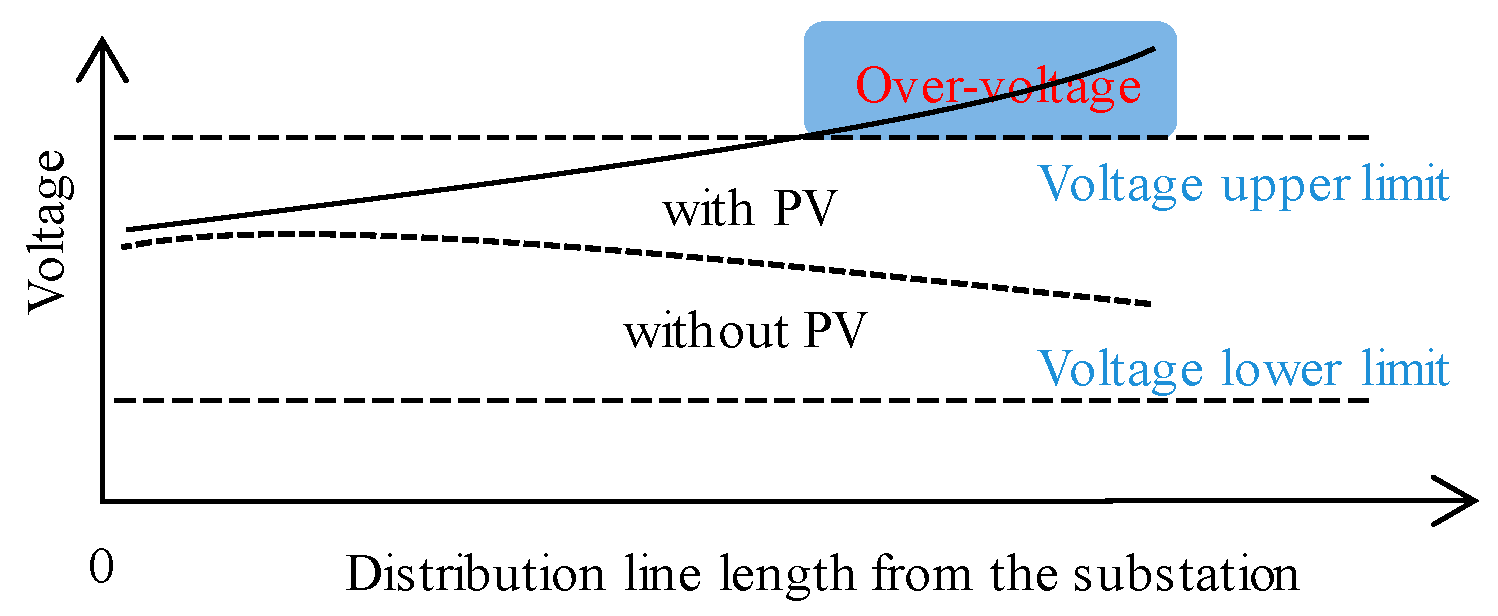
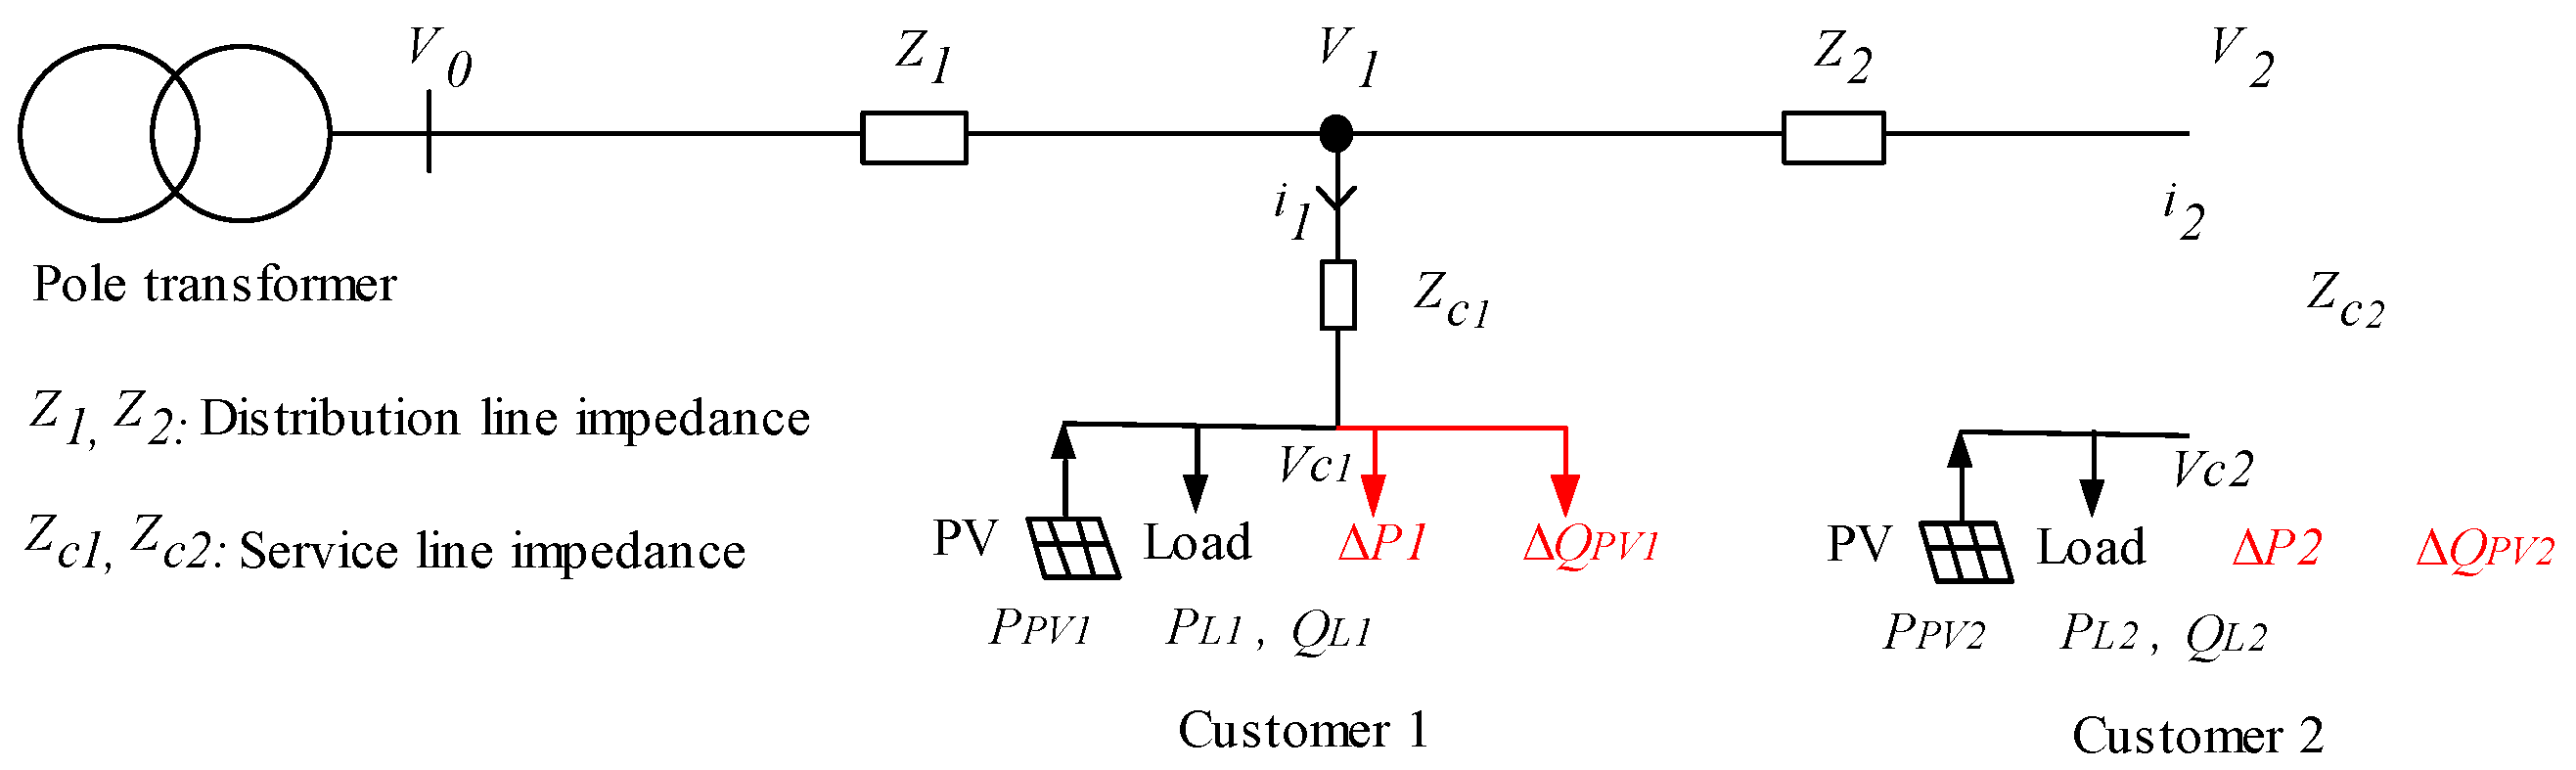
2.2. Over-Voltage Problem

In conventional power distribution systems, the power flows from a substation to customers; hence, the node voltage drops along with the lines of the distribution system. After PV systems are installed on the customer side, the power flow is reversed when the generation of the PV system is greater than the customer consumption. In a highly PV-penetrated power distribution system, the voltage can be increased by the reverse power. A brief model of a power distribution system is depicted in Figure 1 to explain this issue.
In Figure 1, two customers with PV systems installed are connected.
In the diagram, the two customers who have PV systems installed are connected to a transformer at different positions. The impedances of the distribution line are Z 1 and Z 2 . Furthermore, the impedances of the service line Z c 1 and Z c 2 are given by R + j · X . Analogously, it is assumed that the customers’ PV generation and load are the same, where the load and PV power are given by S = P L + j · Q L and P P V , respectively. V 0 , V c 1 , and V c 2 represent the voltage at the transformer, and the voltages of customers 1 and 2, respectively, while the service line currents for customers 1 and 2 are i 1 and i 2 , respectively. It is assumed that the positive direction of current is from the transformer to the customers. For this model, supposing one day with good sunshine, customers’ load consumption will be less than PV generation, i.e., P P V > P L + X · Q L / R . Therefore, reverse power flow would appear. The service line voltage drops of customers 1 and 2 are negative and can be modeled by Equations (1) and (2). V c 1 and V c 2 are modeled by Equations (3) and (4).
Δ V c 1 = Z c 1 · i 1 R · ( P L 1 P P V 1 ) + X · Q L 1 | V c 1 | ;
Δ V c 2 = Z c 2 · i 2 R · ( P L 2 P P V 2 ) + X · Q L 2 | V c 2 | ;
V c 1 = V 1 Δ V c 1 ;
V c 2 = V 2 Δ V c 2 .
In the above conditions, V 1 is smaller than V 2 , and their values can be obtained from Equations (5) and (6).
V 1 = V 0 Z 1 · ( i 1 + i 2 ) ;
V 2 = V 1 Z 2 · i 2 .
The above equations indicate that, when the load and the PV profiles of the two customers are the same, the voltage of customer 2 is higher than the voltage of the customer 1. If the reverse power continues to increase, customer 2 will first experience an over-voltage problem. At the same time, customer 2 needs to reduce their PV power generation through a PV active power curtailment strategy [7]. Due to the physical structure of the distribution system, the voltage at the nodes remote from the substation is more unstable than that at other nodes. Therefore, over-voltage problems will occur more frequently at locations remote from the substation. Figure 2 shows the diagram of an over-voltage profile.

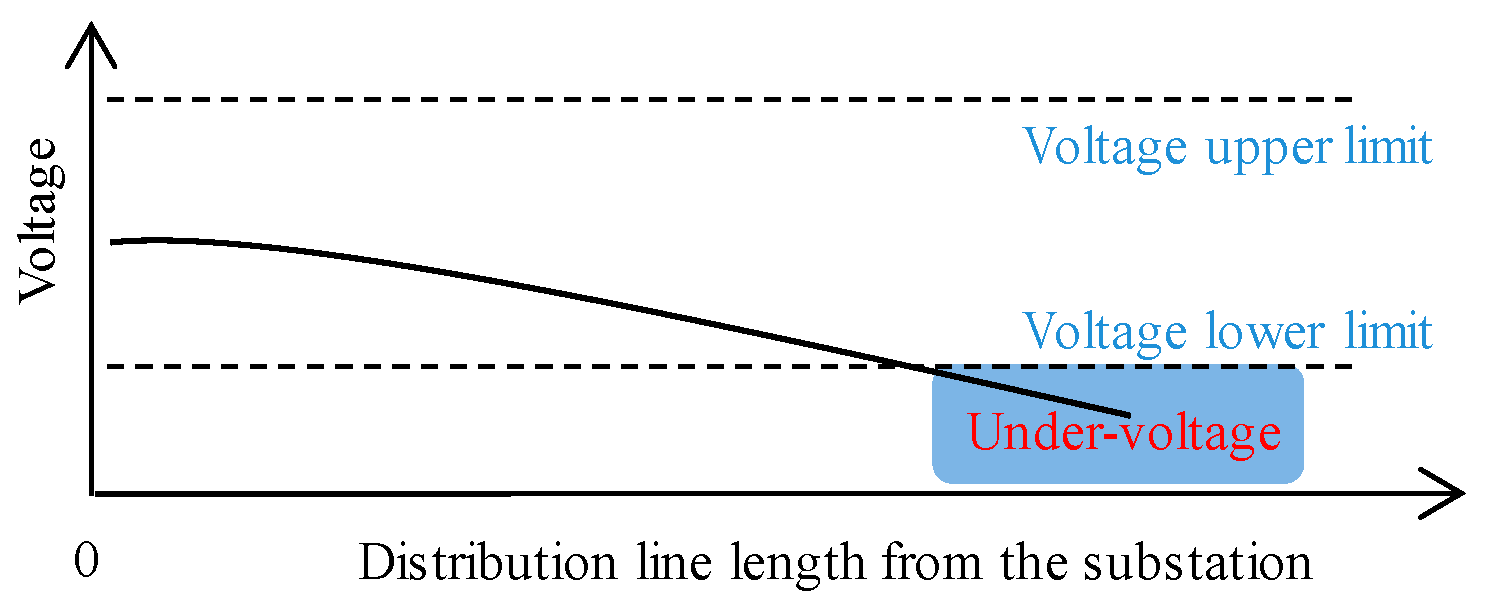
2.3. Under-Voltage Problem

The current of the distribution line becomes large when a large number of EVs are charging simultaneously. The voltage drops of distribution lines Δ V c 1   and   Δ V c 2 become large according to Equations (1) and (2). At the same time, V 2 is smaller than V 1 , as indicated by the values in Equations (5) and (6). If the power consumption continues to increase, customer 2 will first experiences an under-voltage problem. A node remote from the substation will experience an under-voltage problem more frequently. The diagram of an under-voltage profile is illustrated in Figure 3.

2.4. Voltage Regulation by Flexible Resources via DR

As previously mentioned, an over-voltage problem occurs because of the injection power of a PV system, while an under-voltage problem occurs because of peak load consumption. Utilizing flexible resources through DR, an over-voltage problem can be settled by utilizing the reactive power generated by PV inverters, and shifting the CLs to work at the time when the PV output is high. On the other hand, an under-voltage problem can be solved by cutting the peak through CL shifting. In the case of a voltage violation being anticipated, changing the reactive and active power of flexible resources can regulate the voltage. However, an optimal power combination of flexible resources should be determined. In this manner, the disturbance of customers can be minimized during the DR process.

3. Problem Formulation and Solving Algorithms

3.1. Problem Formulation of Real-Time Voltage Regulation

As previously mentioned, customer flexible resources, including PV inverters and CLs such as air conditioners, batteries, and washing machines, can be adopted for regulating voltage through a DR program. The constraint for controlling the reactive power output of a PV inverter without curtailing the active power can be exploited as shown in Equation (7).
S max 2 P P V 2 Q P V S S max 2 P P V 2 ,
where S max represents the rated capacity of the PV. P P V and Q P V S represent the active and reactive power of PV, respectively.
The power factor of the PV output is given as
P F = cos ( tan 1 ( Q P V S P P V ) ) .
In power distribution systems, the power factor is limited within an allowable range. Too small an absolute value of the P F increases the power loss without distributing much active power. The reactive power under the P F limit is given by
Q P V P F = tan ( a r c cos ( P F ) ) · P P V .
The set of operating time slots of a day is denoted by Γ { 1 , 2 , , t , , T } , where t is the time slot number, and T identifies the total number of time slots in 24 h. The selection of an appropriate interval, which is denoted by Δ t , depends on the formulated problem.
As a result, the reactive power limit of a PV inverter of the customer n at time slot t that could be adopted for voltage regulation is
Q P V n ( t ) = min { Q P V P F ( t ) , Q P V s ( t ) } .
The start time of CLs, such as washing machines, can be flexibly adjusted. For these loads, customers only care about whether the task can be completed or not before a specified deadline. Therefore, the scheduling or shifting of CLs can be utilized for voltage regulation. Let P n ( t ) represent the active power of customer n at time slot t. P l C L n ( t ) is a combination of several CLs, which can be expressed as
P l C L n ( t ) = i = 1 N A i P A i n ( t ) · S W A i n ( t ) ,
where P l C L n ( t ) is the summation of the active power of available CLs, and N A i is the sum of CLs. P A i n ( t ) is the power of A i at time slot t. S W A i n ( t ) is the switch of A i , where 1 represents on and 0 represents off.
Moreover, Φ A i [ α A i , β A i ] is defined as the feasible working interval for A i , where α A i and β A i are the allowed starting time and finishing time (deadline), respectively. Thus, P A i n ( t ) can be described as
P A i n ( t ) = { P A i n , T A i s t a r t t T A i s t a r t + T A i o t 0 , o t h e r s ,
α A i T A i s t a r t β A i T A i o t ,
where P A i n , T A i s t a r t , and T A i o t are the rated power, start time, and minimum working time of appliance Ai of customer n, respectively.
In the operation of real-time voltage regulation, when voltage violation is anticipated, the available reactive power of the PV inverter is firstly utilized to decrease the voltage. If the PVs make full use of their adjustable reactive power capacity and the voltage is still higher than the upper limit, a combination of CLs can be turned on to regulate the over-voltage problem. When an under-voltage problem is anticipated, a combination of available CLs can be turned off to regulate the under-voltage problem.
The objective function of the proposed real-time load combination search is shown in Equation (14).
Min .   n = 1 N c P l C L n ( t ) .
The constraints include the CL power combination shown in Equations (7)–(13), and The nonlinear power flow equations shown below [20].
P l b a s e n ( t ) + P l C L n ( t ) P P V n ( t ) = V n ( t ) j N c V j ( t ) ( G n j cos δ n j + B n j sin δ n j ) ;
Q l o a d n ( t ) + Q P V n ( t ) = V n ( t ) j N c V j ( t ) · ( G n j sin δ n j B n j cos δ n j ) .
The voltage constraint is as follows:
V l o w V n ( t ) V h i g h ,
where P l b a s e n ( t ) is the base load, N c denotes the total number of customers, V n ( t ) is the node voltage, and V l o w and V h i g h are the low and high limits of the voltage, respectively. G n j is the real part of the element in the bus admittance matrix, B n j is the imaginary part of the element, and δ n j is the difference in voltage angle.
Figure 4 shows the flow chart of voltage regulation through the cooperation of the OLTC and flexible resources.
In each time slot of real-time operation, the DSO firstly forecasts the voltage condition of the network. When an over-voltage problem occurs, the available reactive power of the PV inverter is utilized firstly to decrease the voltage. If the PVs make full use of their adjustable reactive power capacity and the voltage is still higher than the upper limit, a combination of unstarted CLs can be optimized and turned on to decrease the voltage. Because utilizing specific appliances ( A i ) of different position customers (n) can get different voltage regulation results, the objective of Equation (14) is to search the minimum total power of P l C L n ( t ) which can solve the over-voltage problem. When an under-voltage problem occurs, the optimization involves determining the minimum power combination of working P l C L n ( t ) which can regulate the under-voltage problem, and then delaying the working time of these CLs. By optimizing the power combination of CLs which can solve the voltage violation problem, the working schedule of customers’ CLs will be minimally disturbed. In other words, the DSO can save cost for DR utilization. In the case that all CLs of all customers are considered but the voltage violation still cannot be solved, the customers’ CLs will not operate and the OLTC will operate its tap to decrease or increase the voltage output. The operating strategy of coordinated control of the OLTC and flexible resources can be explained in a few steps. The flexible resources are firstly considered to solve the over-voltage or under-voltage problem in each time slot. When the capacity of flexible resources is insufficient for solving the over-voltage or under-voltage problem, the DR of flexible resources will not be applied, and the OLTC decreases or increases its tap value, respectively.

3.2. Solving Algorithms
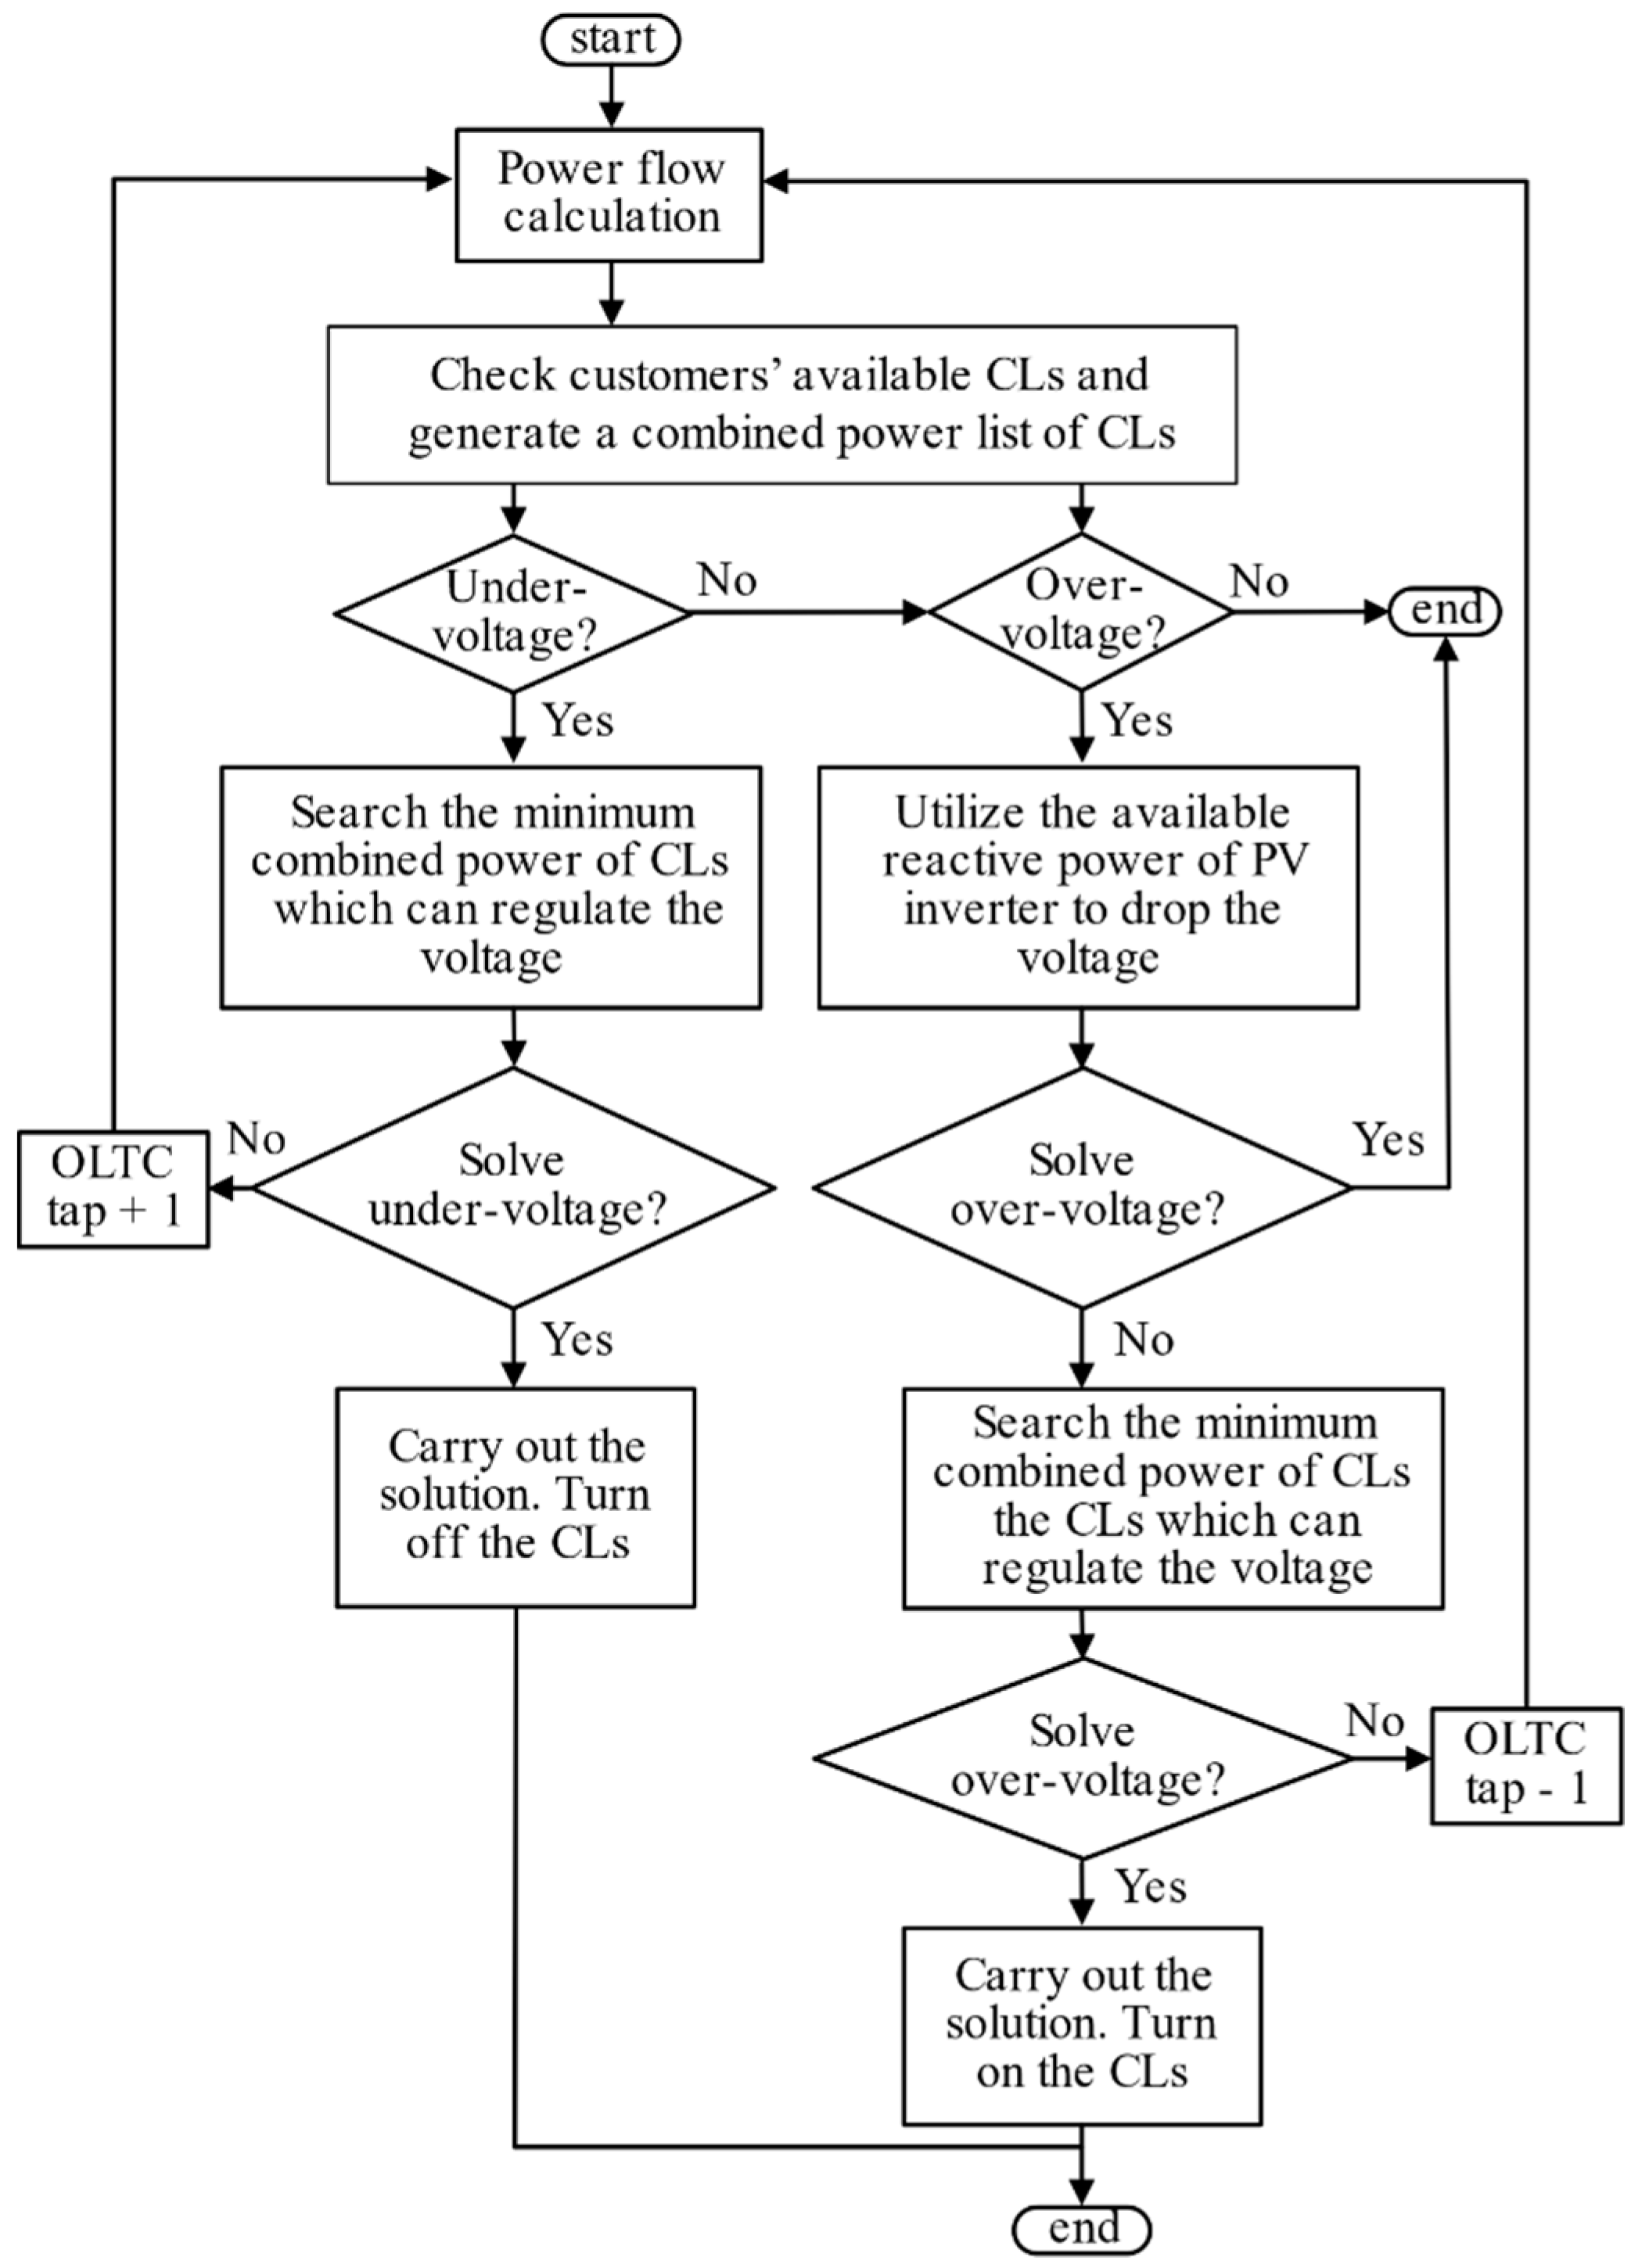
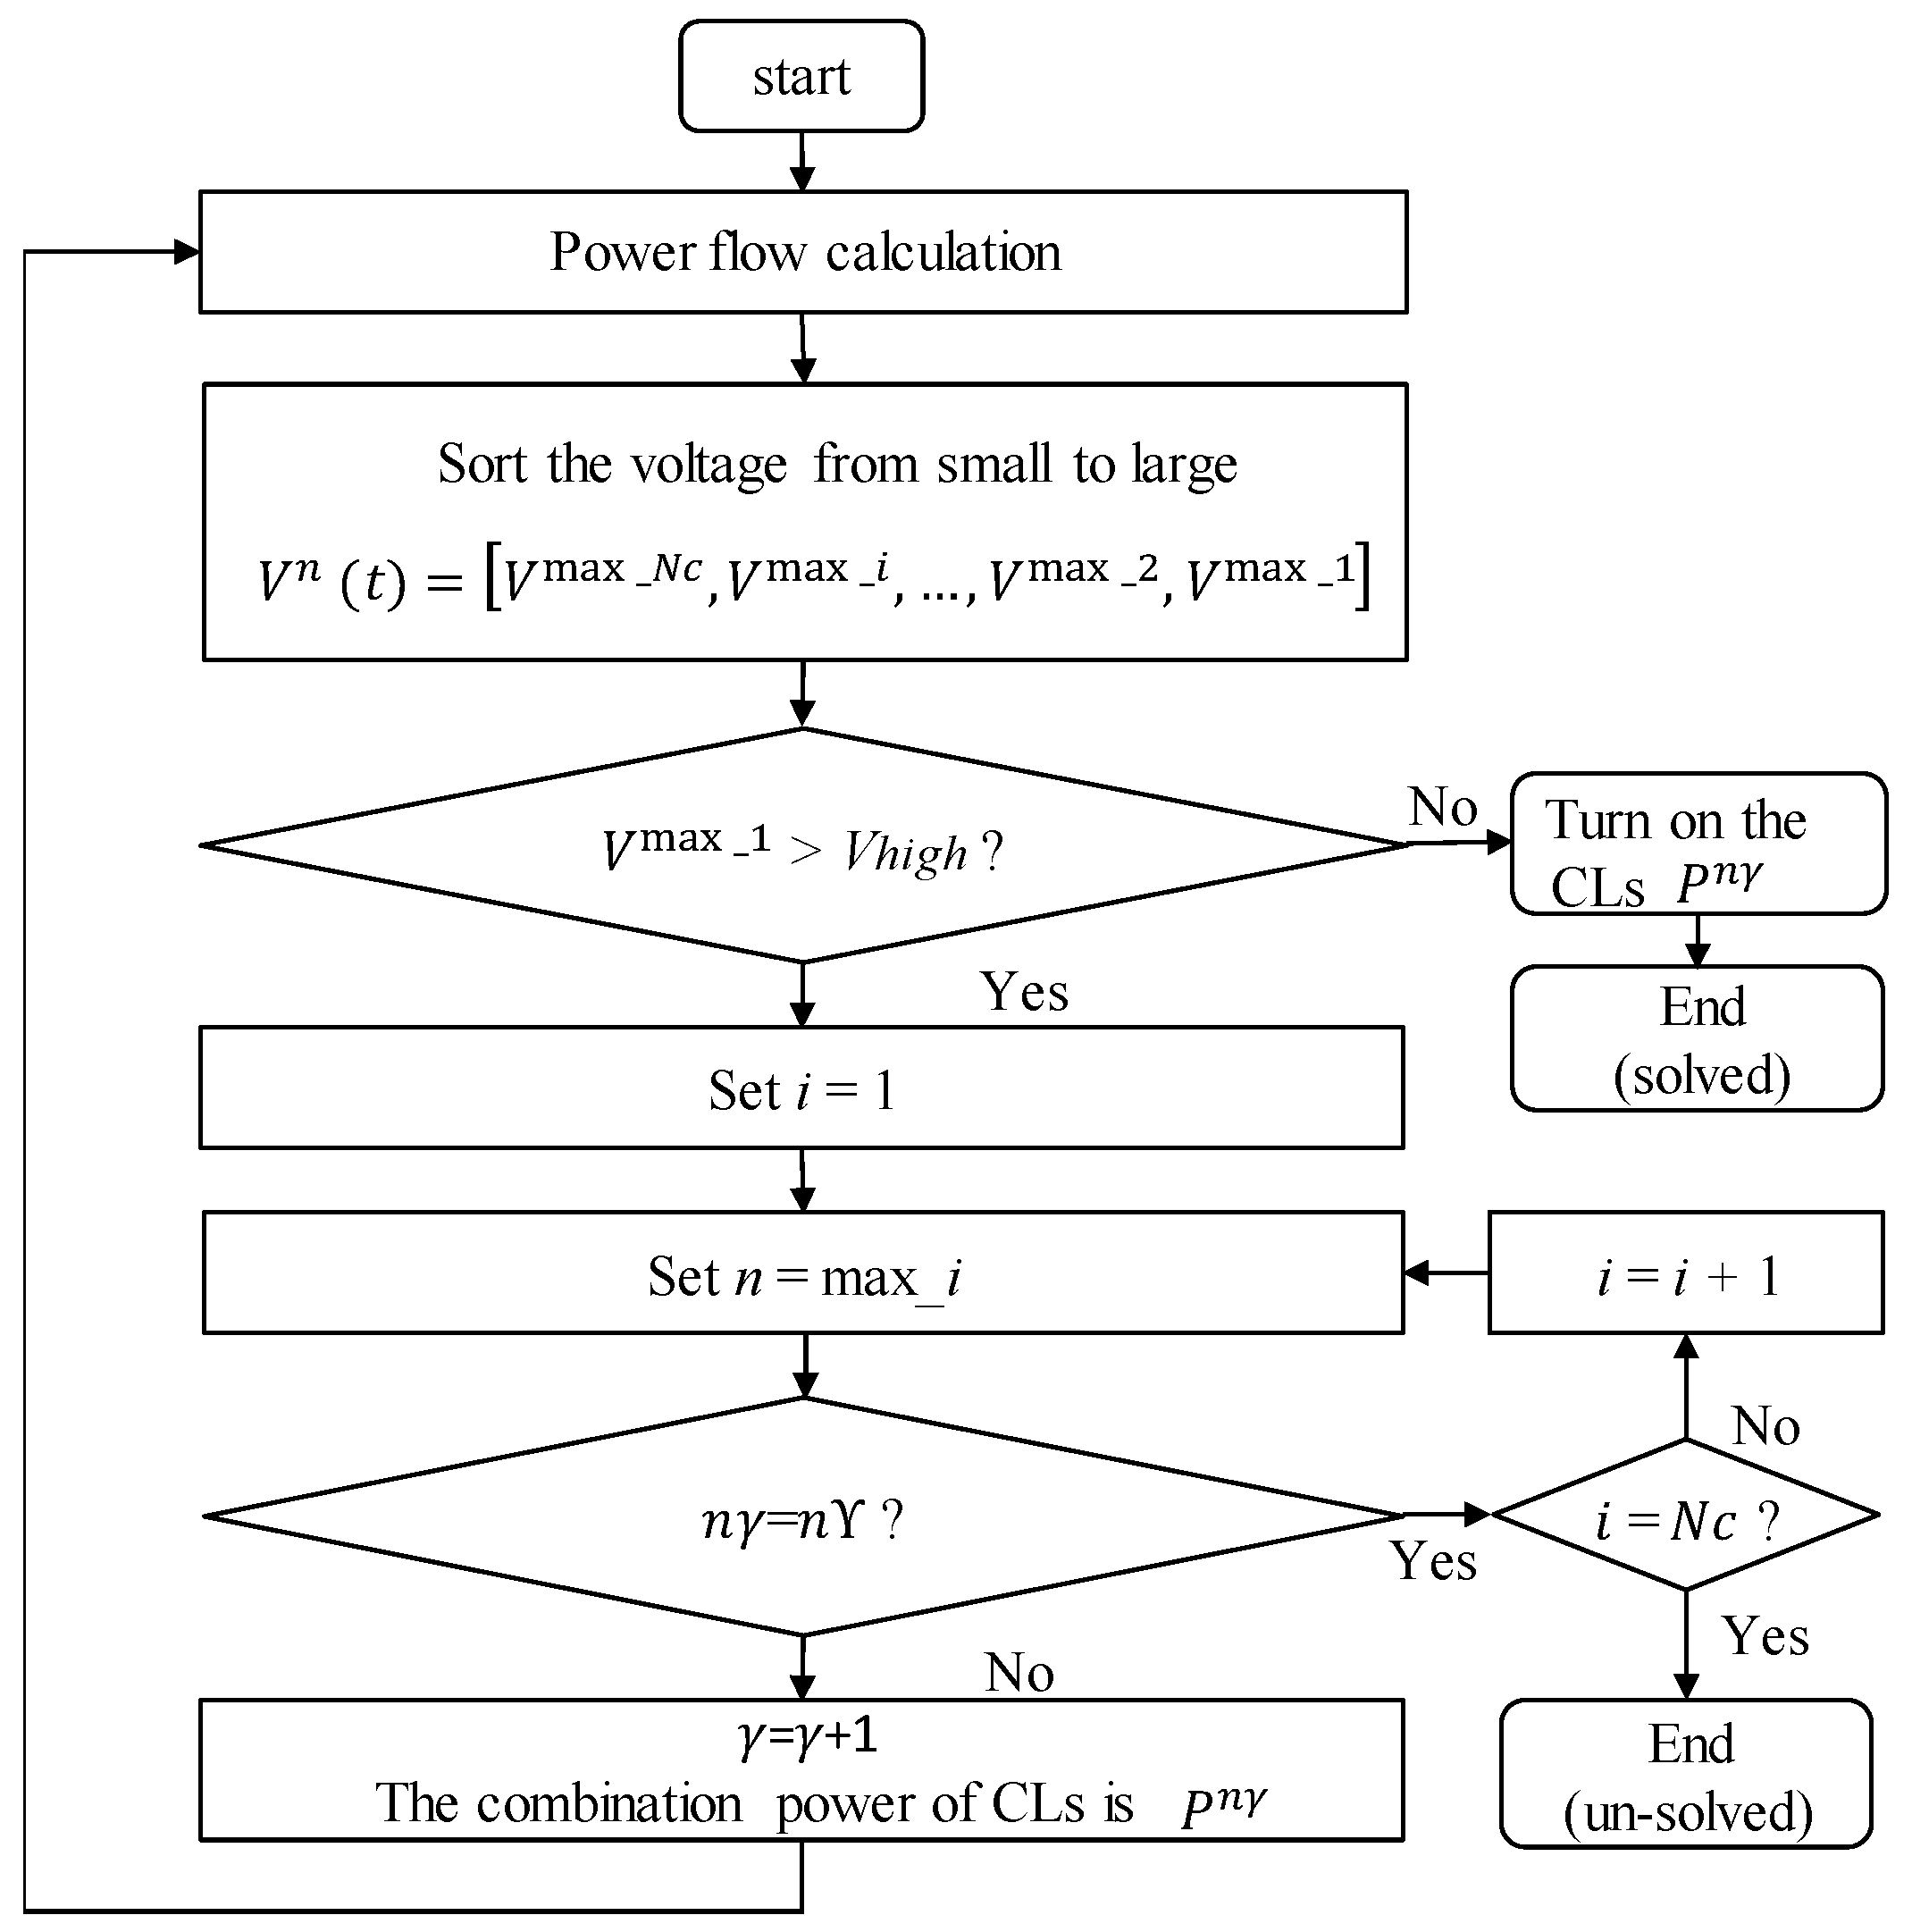
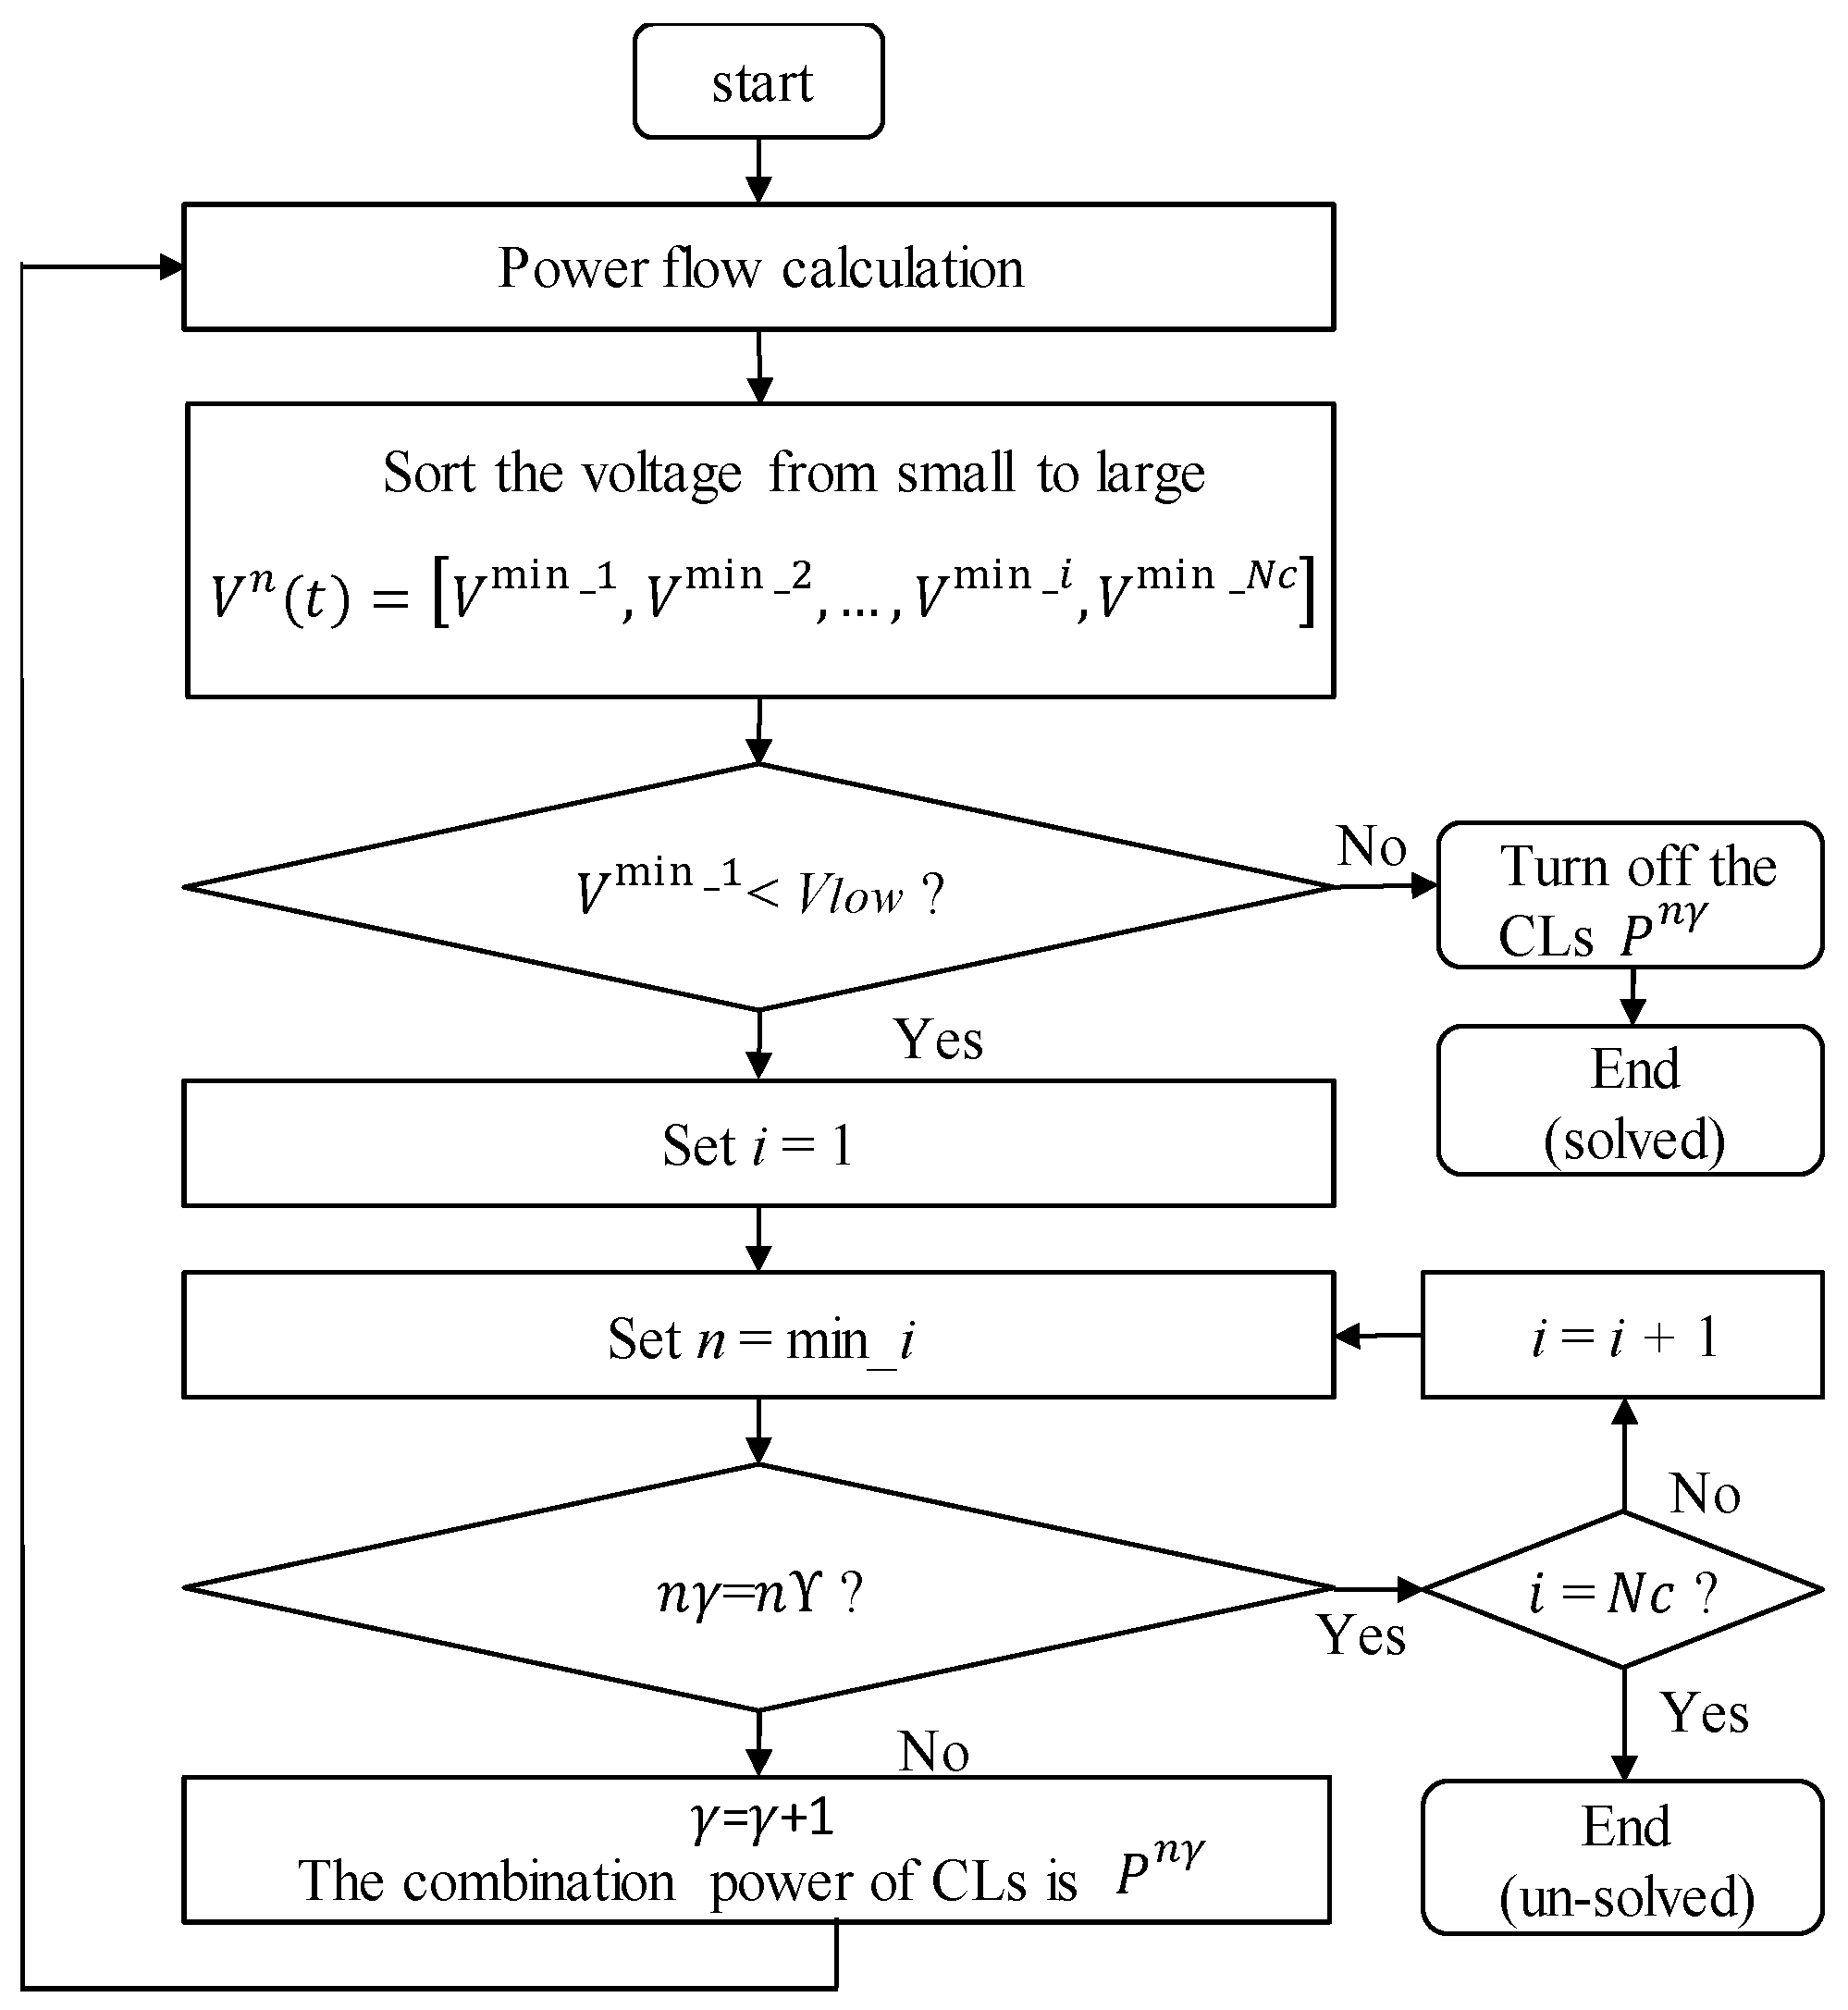
The search for optimization in Figure 4 is to find the minimal power combination of CLs that can regulate the voltage violation. The search of the objective function in Equation (14) needs to calculate the nonlinear power flow; as a result, it is a nonlinear scheduling problem requiring heavy computational resources. To realize real-time regulation, this paper proposes an intelligent algorithm called VRSA to solve the optimization problem. In addition, GA and VSM are introduced for comparison.

3.2.1. VRSA

To explain the VRSA, Figure 5 shows a modified diagram of Figure 1, where the adjusted active and reactive power are denoted by Δ P 1 and Δ P 2 , and Δ Q 1 , and Δ Q 2 , respectively.
In this case, the voltage drop of a service line changes because of Δ P 1 , Δ P 2 , Δ Q 1 , and Δ Q 2 , as indicated in Equations (18) and (19).
Δ V c 1 = Z c 1 · i 1 R · ( P L 1 + Δ P 1 P P V 1 ) + X ( Q L 1 + Δ Q P V 1 ) | V c 1 | ;
Δ V c 2 = Z c 2 · i 2 R · ( P L 2 + Δ P 2 P P V 2 ) + X ( Q L 2 + Δ Q P V 2 ) | V c 2 | .
In over-voltage conditions, by increasing the active power consumption of the CL (i.e., + | Δ P 1 | and + | Δ P 2 | ), or by letting the PV inverter absorb the reactive power (i.e., + | Δ Q P V 1 | and + | Δ Q P V 2 | ), the amplitude of the negative voltage drop can be regulated to be smaller; hence, an over-voltage problem can be regulated. On the other hand, in under-voltage conditions, by decreasing the active power consumption of the CL (i.e., | Δ P 1 | and | Δ P 2 | ), or by letting the reactive power devices inject reactive power (i.e., | Δ Q P V 1 | and | Δ Q P V 2 | ), the voltage drop can be regulated to be smaller; in this way, an under-voltage problem can be regulated. It is difficult to decide the amount of Δ P and Δ Q because of the nonlinear power flow calculation. However, from the above equations, two rules can be considered when determining Δ P and Δ Q .
(1) If the objective is to adjust V c 1 , changing the Δ P 1 and Δ Q 1 at customer 1 could reduce current i 1 directly, thereby more effectively reducing the voltage drop at customer 1’s service line.
(2) From Equation (6), changing the power of customer 2 at the further position can regulate i 2 , thereby regulating V c 2 , V 2 , and V 1 . At last, V 1 in Equation (5) can be regulated.
In short, the most efficient way to regulate the voltage of a node is to adjust its own reactive power and active power. Moreover, changing the power at the nodes located at further positions can influence the voltage of the whole network. The VRSA is developed on the above features of radial power distribution systems. The search process of the VRSA is based on voltage ranking. In over- or under-voltage conditions, the first step of the VRSA is to find the node with the maximum or minimum voltage, before choosing the available CLs of the node to regulate the voltage. In Equation (11), regarding the on/off state of the CLs, there are ϒ = 2 N A i combinations of available power for the CLs, which can be sorted in ascending order.
P a v a i l a b l e n γ = [ P n 1 , P n 2 , P n 3 , , P n γ , P n ϒ ] ,
where P a v a i l a b l e n γ is the matrix of available power of a CL combination of node n, γ indicates the variable of the matrix, P n 1 = 0 indicates that all the CLs are not utilized, P n 2 is the minimum available power, and P n ϒ is the maximum available power.
A detailed flow chart of the VRSA is depicted in Figure 6 and Figure 7. For each optimization step, the VRSA searches the node with the highest/lowest voltage and then firstly selects the smallest available power combination of CLs at the furthest location.
If an over-voltage problem is predicted at the beginning of a time slot, the VRSA examines the available unstarted CLs and then generates a list of power combinations as shown in Equation (20). The next step is to calculate the power flow and sort the voltage from small to large. If the highest voltage is larger than the high limit, the VRSA firstly checks the available CLs from the highest voltage node (n = max_1). If the combined power of the largest CLs is considered in the max_1 customer, then the CL combination search goes to the second largest voltage node (n = max_2), and so on. The search is continued until the combination power of CLs can solve the over-voltage problem. At last, the customers’ available CLs of P n γ will be turned on to solve the over-voltage problem. The VRSA ensures that the search of CL combinations is always from the node with the largest voltage because CLs starting at these nodes can effectively regulate the voltage. The under-voltage regulation of VRSA is similar to the over-voltage regulation, as shown in Figure 7. If all CLs of all customers are considered but the over- or under-voltage problem still cannot be solved, the customers’ CLs would not be operated, and other voltage regulation methods should be applied. The cooperation of the OLTC can be applied when the capacity of flexible resources is not sufficient.

3.2.2. VSM

VSM is widely utilized in the determination of the amount of reactive and active power in the voltage regulation of power distribution systems. Voltage sensitivity matrix S is the inverse of a system Jacobian matrix, which is derived from a Newton-Raphson algorithm-based power flow calculation [18]. The voltage sensitivity matrix S is modeled in Equation (21).
[ Δ θ Δ U ] = J 1 [ Δ P Δ Q ] ;
S = J 1 = [ S θ P S θ Q S U P S U Q ] .
In Equations (21) and (22), Δ θ and Δ U are decoupled, and Δ U can be calculated as follows:
Δ U = S U P · Δ P + S U Q · Δ Q .
In real-time operation, the reactive and active power are sequentially adjusted; thus, Δ Q and Δ P can be calculated as shown in Equations (24) and (25).
Δ Q ( t ) = S U Q 1 ( t ) · Δ U ( t ) ,
Δ P ( t ) = S U P 1 ( t ) · Δ U ( t ) ,
where Δ U ( t ) = [ Δ U 1 ( t ) , · · · , Δ U n ( t ) , · · · , Δ U N c ( t ) ] T , which is the difference between the node voltage and the high or low limit.
Δ U n ( t ) = { U n ( t ) V max , U n ( t ) > V max U n ( t ) V min , U n ( t ) < V min 0 , others .
The matrices of Δ Q ( t ) and Δ P ( t ) are the required reactive and active power, which can adjust the voltage to the permissible range. In real-time operation, when the voltage violation is estimated, the VRSA searches for and operates the available reactive power of the PV system or the active power of CLs according to Δ Q ( t ) or Δ P ( t ) , respectively.

3.2.3. GA

GA is widely utilized for solving nonlinear optimization problems in power distribution systems. The search of GA is based on random chromosome crossover and genetic mutation. The process of GA is as follows: at the beginning, an initial population is created, and the number of chromosomes is represented by P n ϒ . Then, the population evolution starts. At first, each chromosome is checked through the power flow calculation. The unavailable chromosomes that cannot solve the voltage violation are replaced by the available ones. After that, the GA evaluates and ranks the fitness of each chromosome using Equation (14). The top two chromosomes are retained, while the others undergo the process of crossover and mutation. After the mutation, a new population is developed, and the evolution moves to the next generation. The GA iterates the procedure of chromosome checking, fitness function evaluation, crossover, and mutation until the generation achieves a set number.

4. Numerical Test and Results

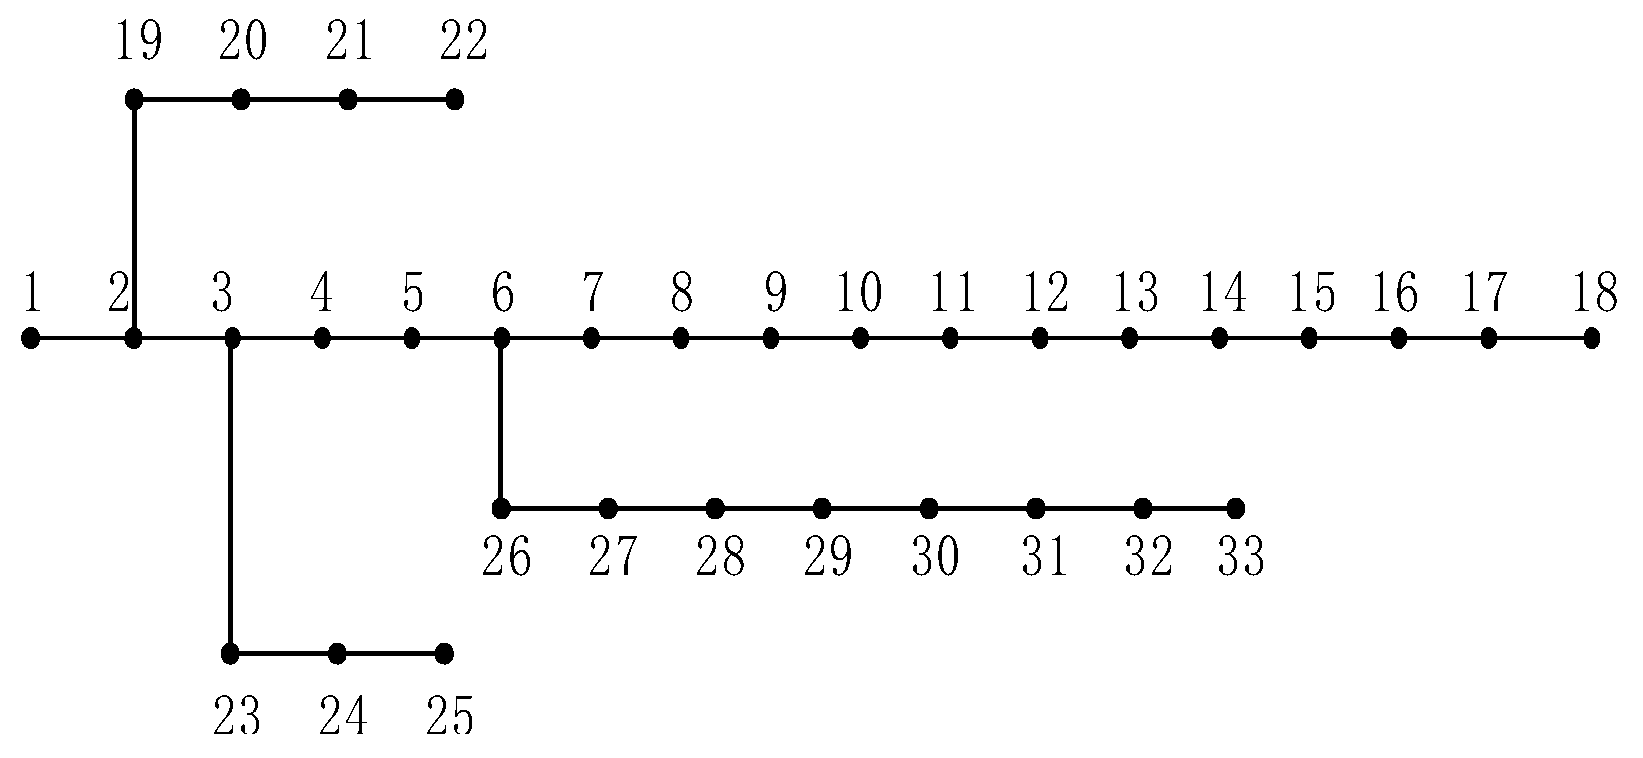
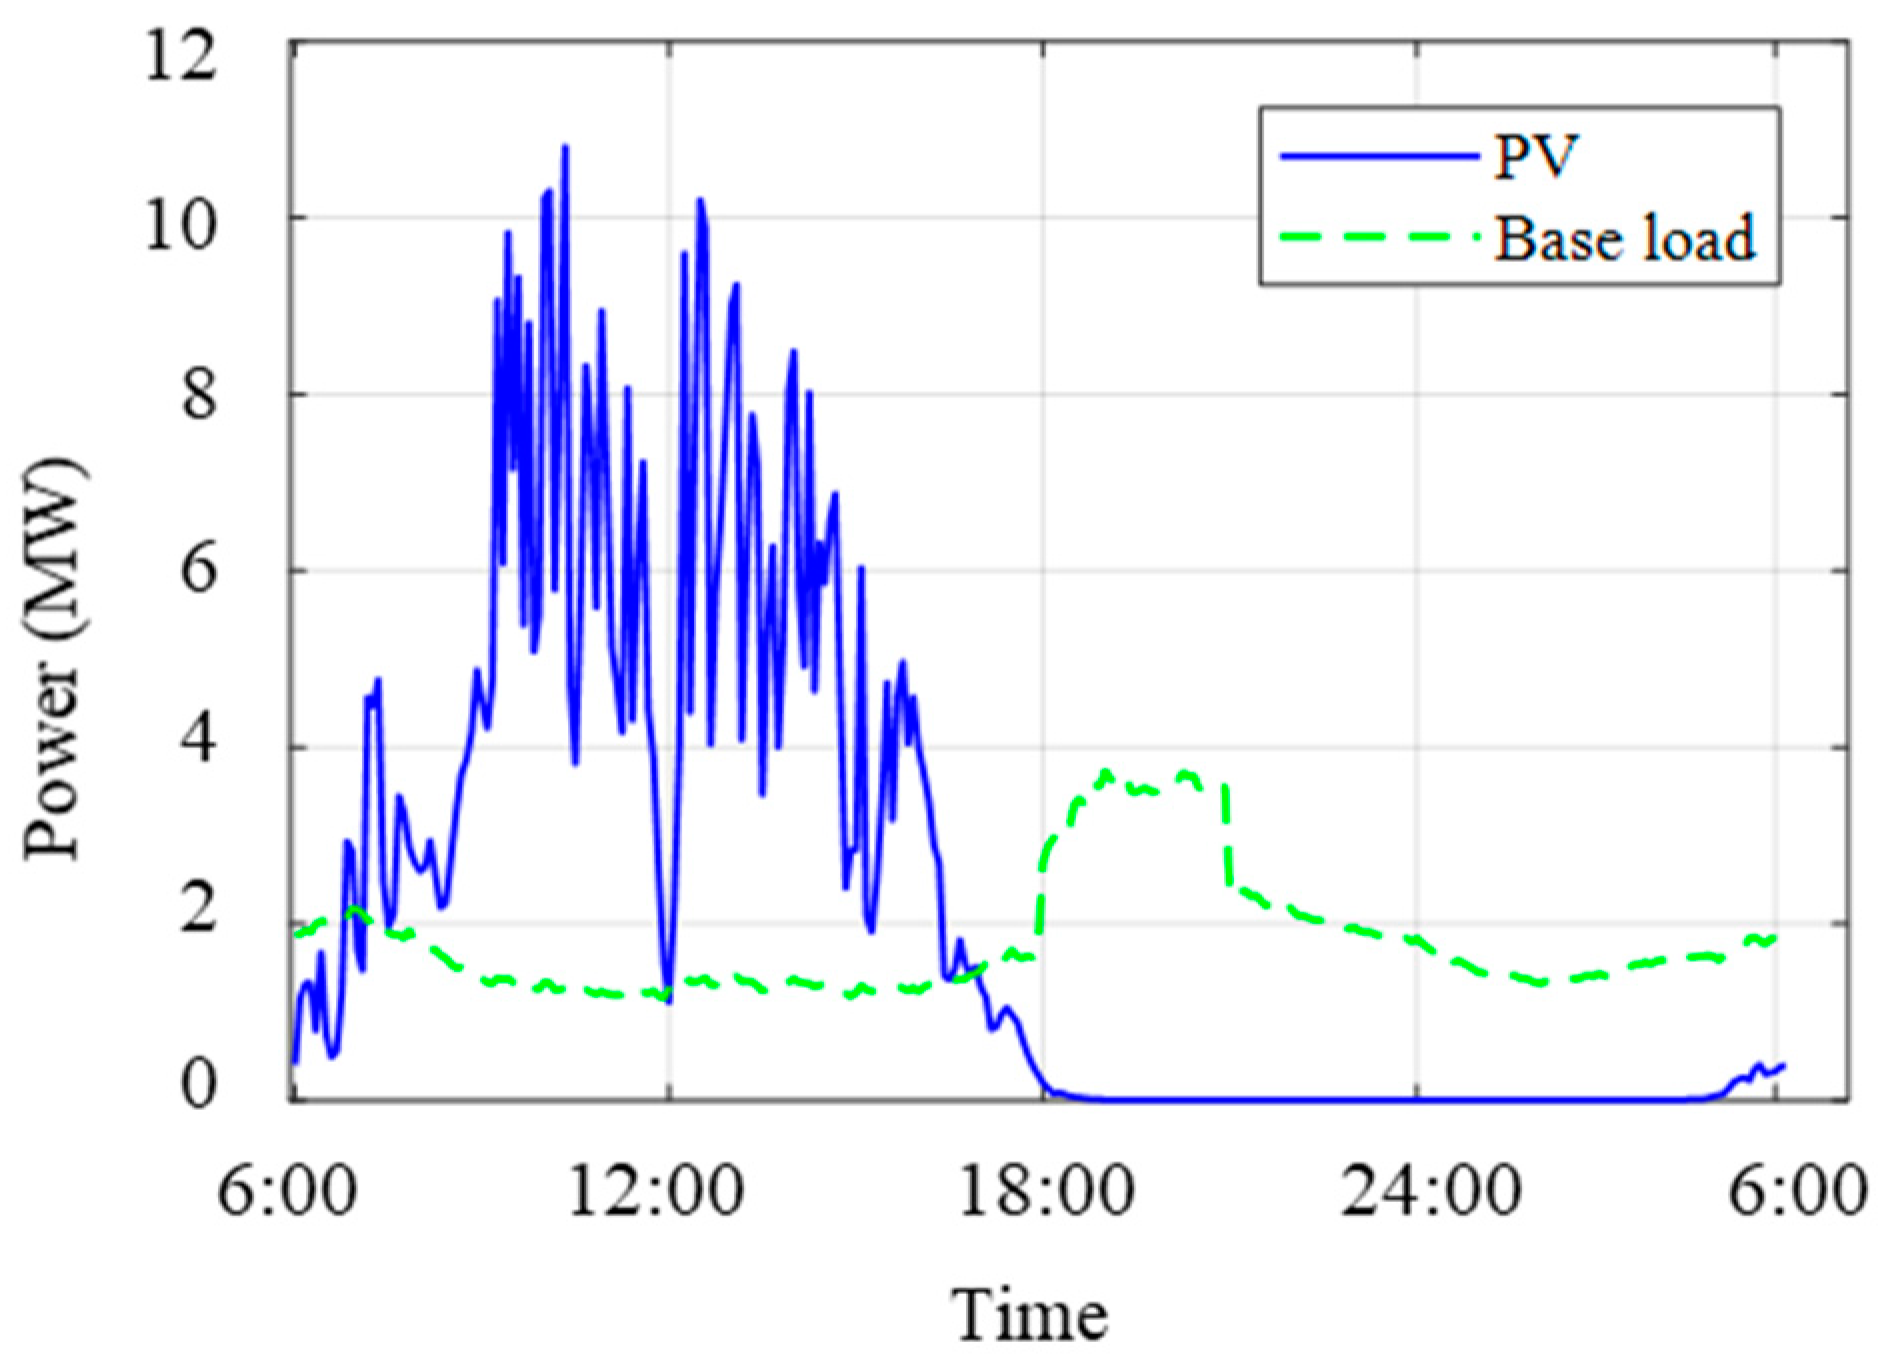
4.1. Test System and Parameters

An IEEE 33-node power distribution system was applied to validate the proposed coordinated control algorithm (as shown in Figure 8) [21]. The reference voltage of node 1 was fixed at 1 per unit (pu). The other 32 nodes were customer nodes, and the allowed range of each node voltage was [0.9, 1.1] pu.
In the simulation, the duration of one time slot was set as 5 min, i.e., t ∊ [1, 288]. The penetrations of PV generation and EV were 60% and 50%, respectively. The data of PV and base load were obtained from Reference [13]. In order to match the IEEE 33-node power distribution system, the PV data were amplified by a factor of 1.5, and 100 customers were set at each node. The aggregated power of PV and base load is illustrated in Figure 9. The aggregated peak power of PV was 10.81 MW, while the peak of the base load was 3.75 MW.
The CL data were set according to typically used appliances [22]. Table 1 illustrates six ordinary CLs. The power of the EVs was assumed as 3 kW during charging [23]. The total CL consumption was 45.68 MWh.
Four cases were considered in the simulation as follows:
Case 1: the real-time CL optimization was not applied;
Case 2: the real-time CL optimization was carried out by the VSM;
Case 3: the real-time CL optimization was carried out by the GA;
Case 4: the real-time CL optimization was carried out by the VRSA.
In Case 1, the working time of all CLs was random during the allowed working time, and real-time CL optimization was not considered. For Cases 2, 3, and 4, the original CL working time was the same as that in Case 1. When voltage violation was anticipated, the optimal power combination of CLs was adjusted through the optimization of Equation (14) in order to minimally disturb customers’ schedule.

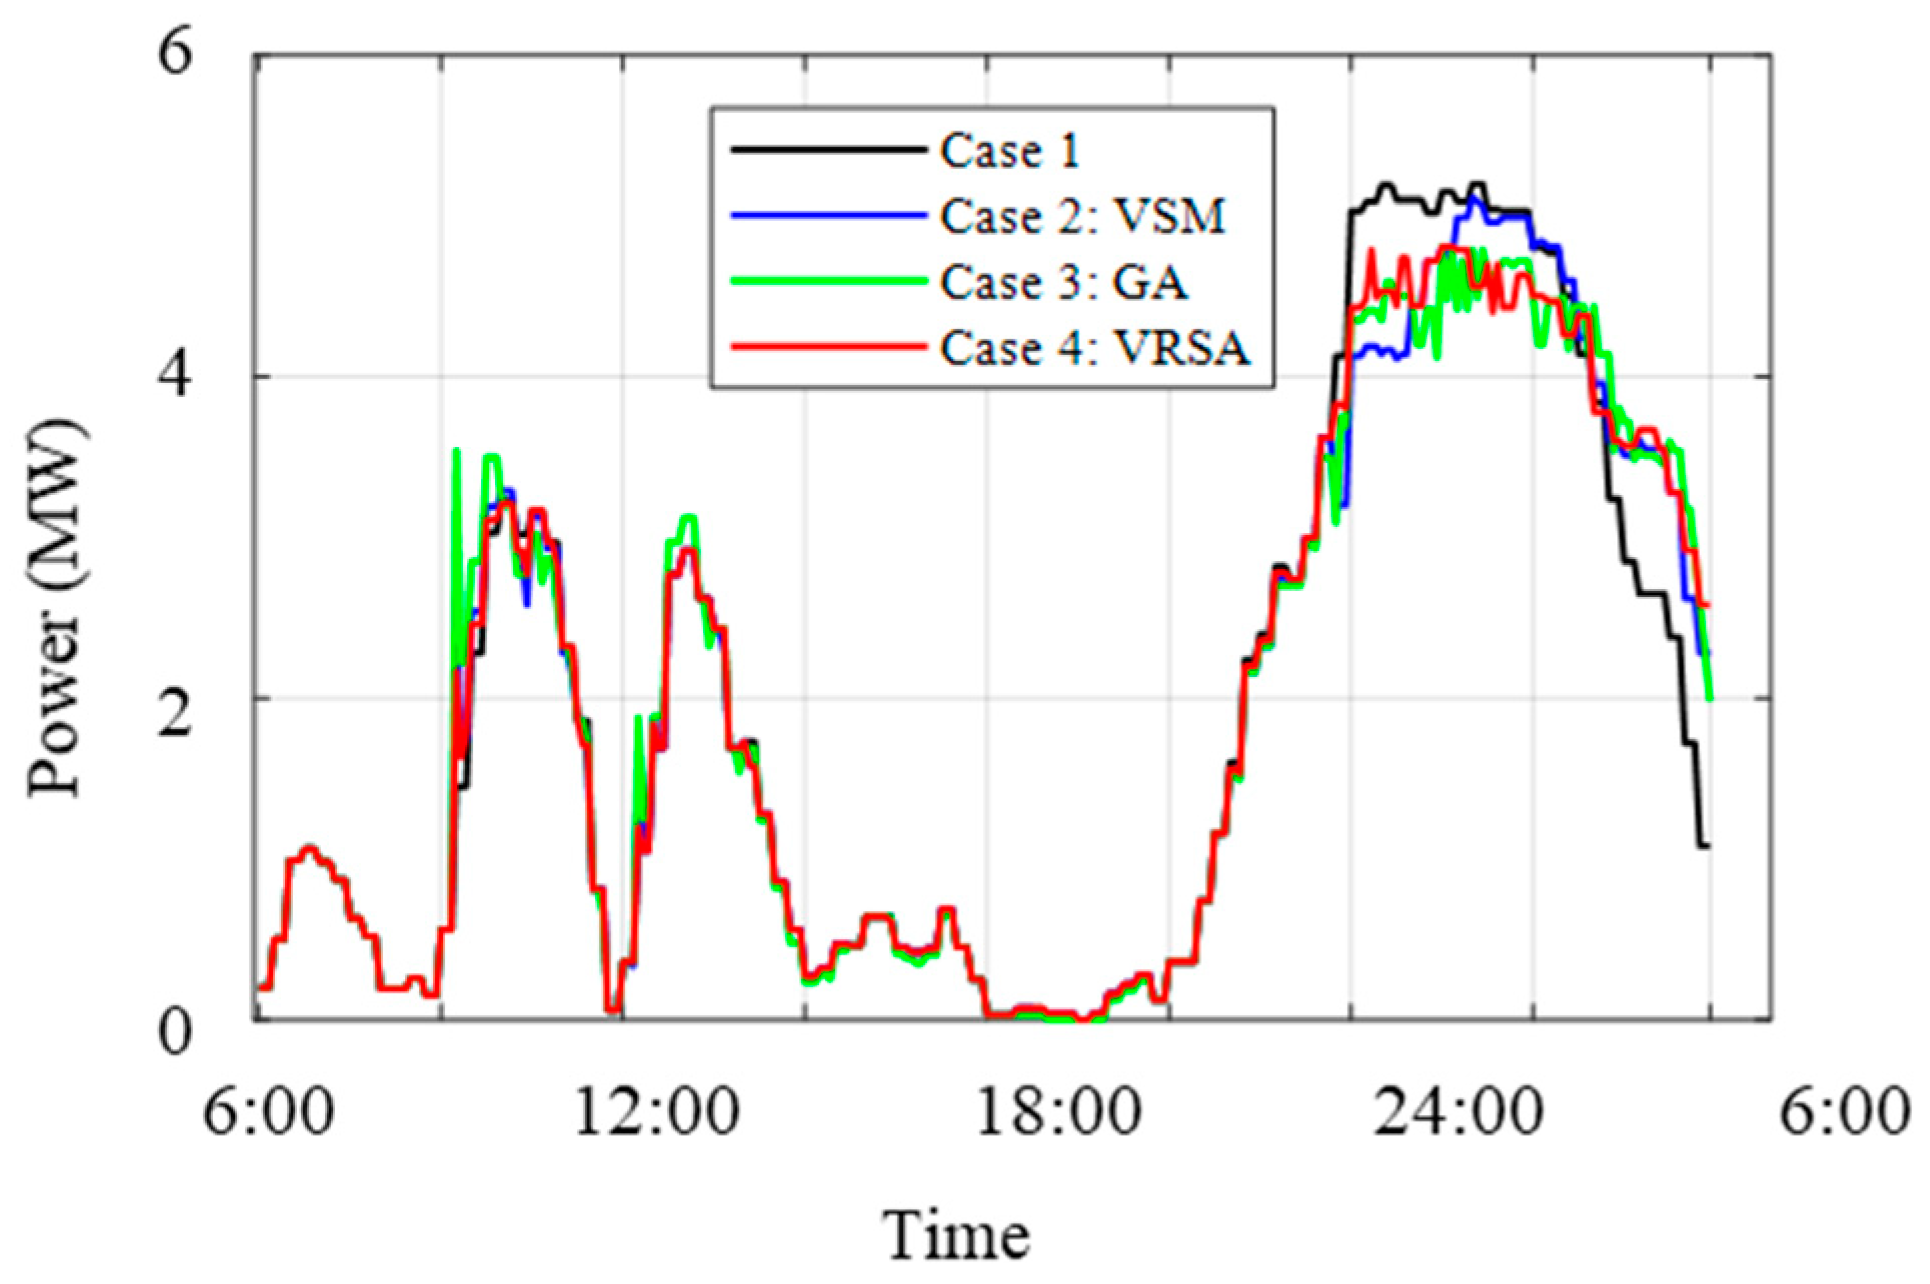
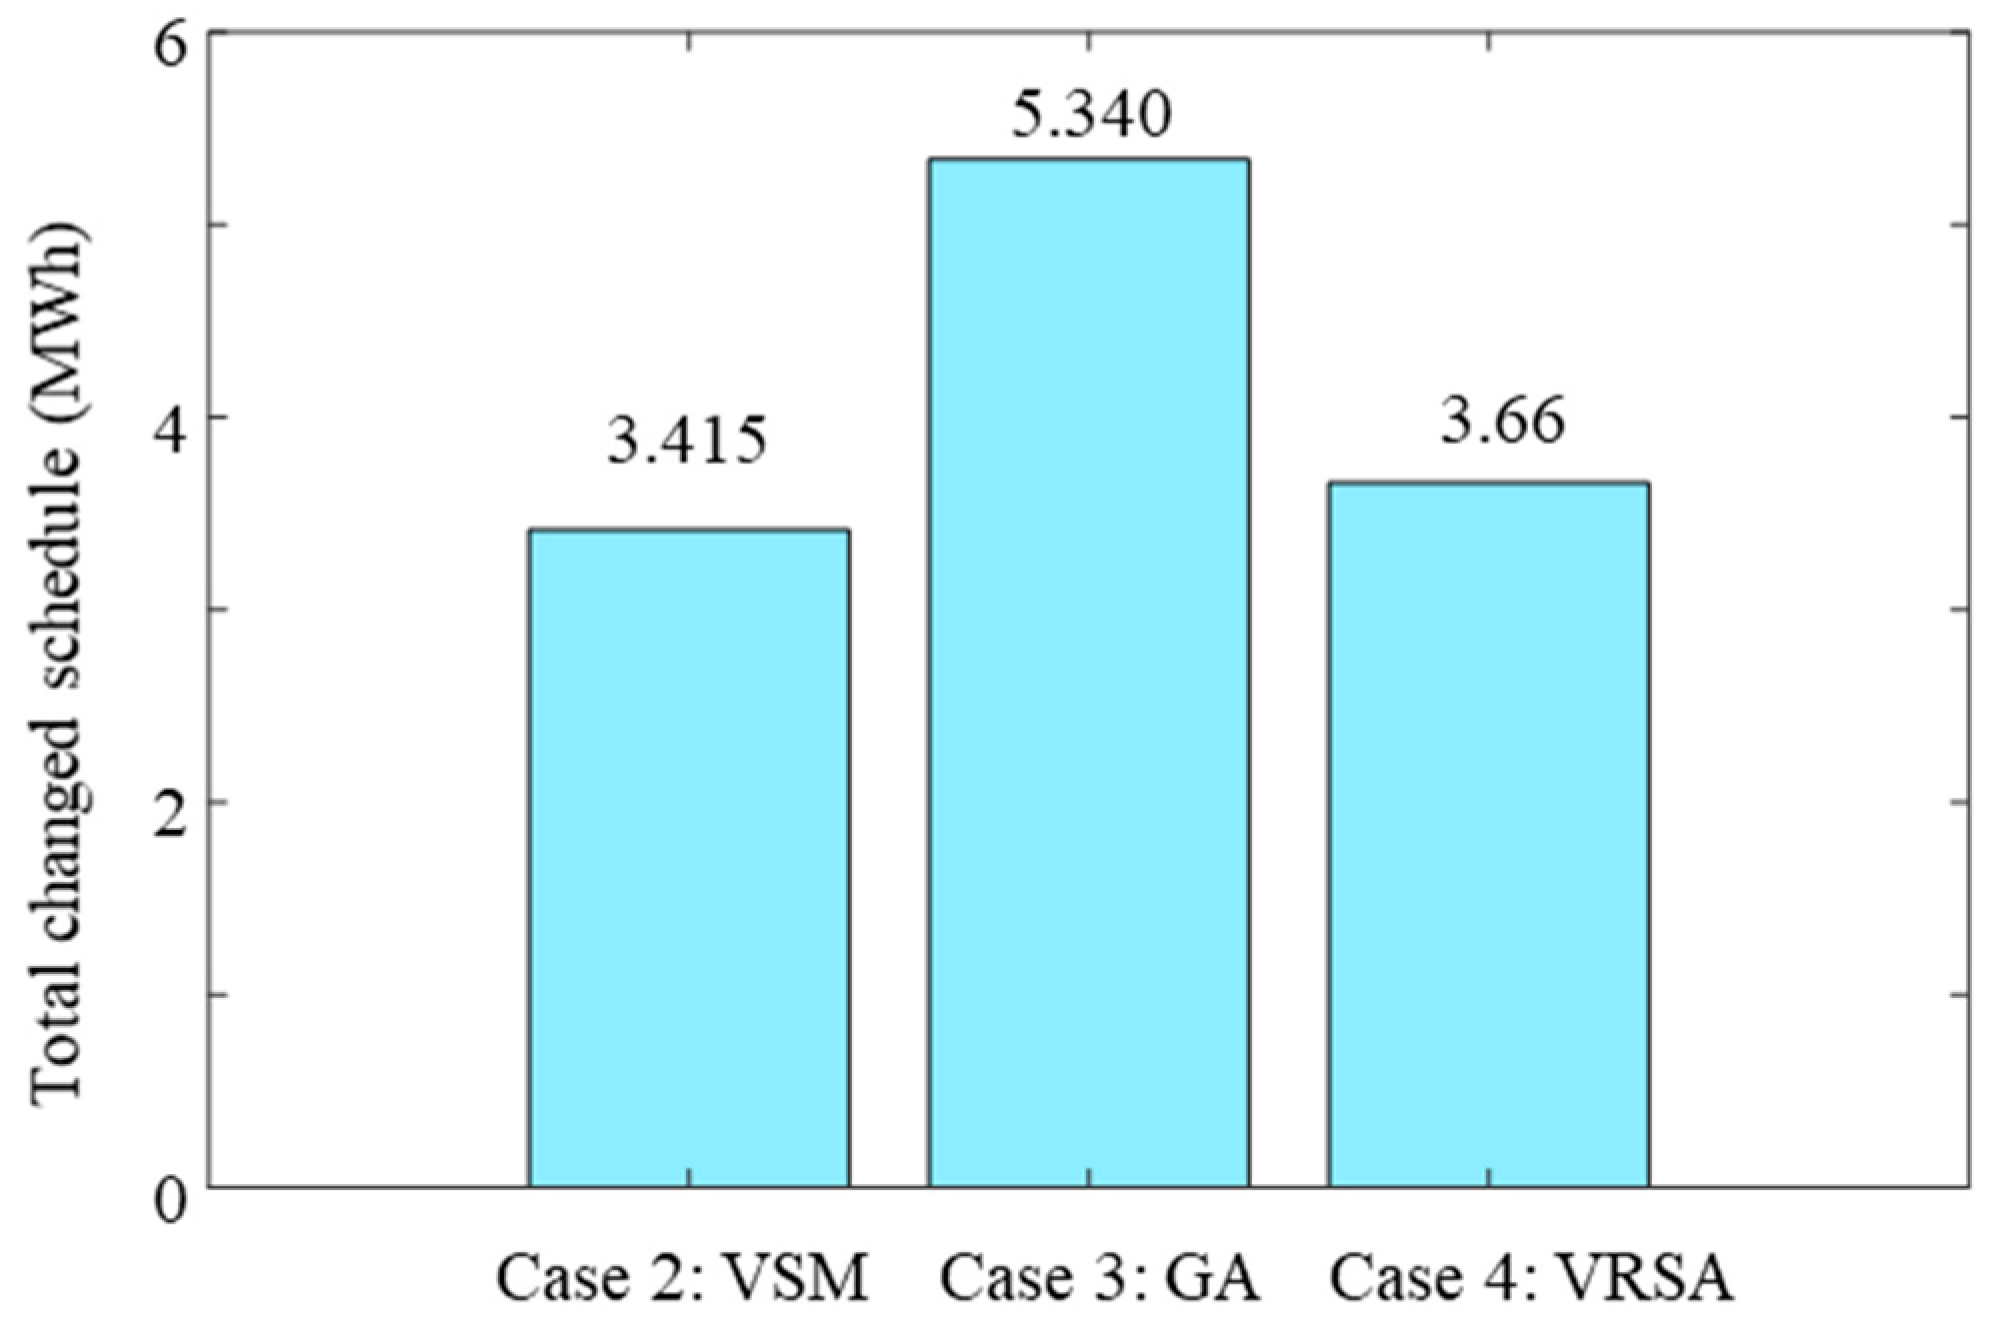
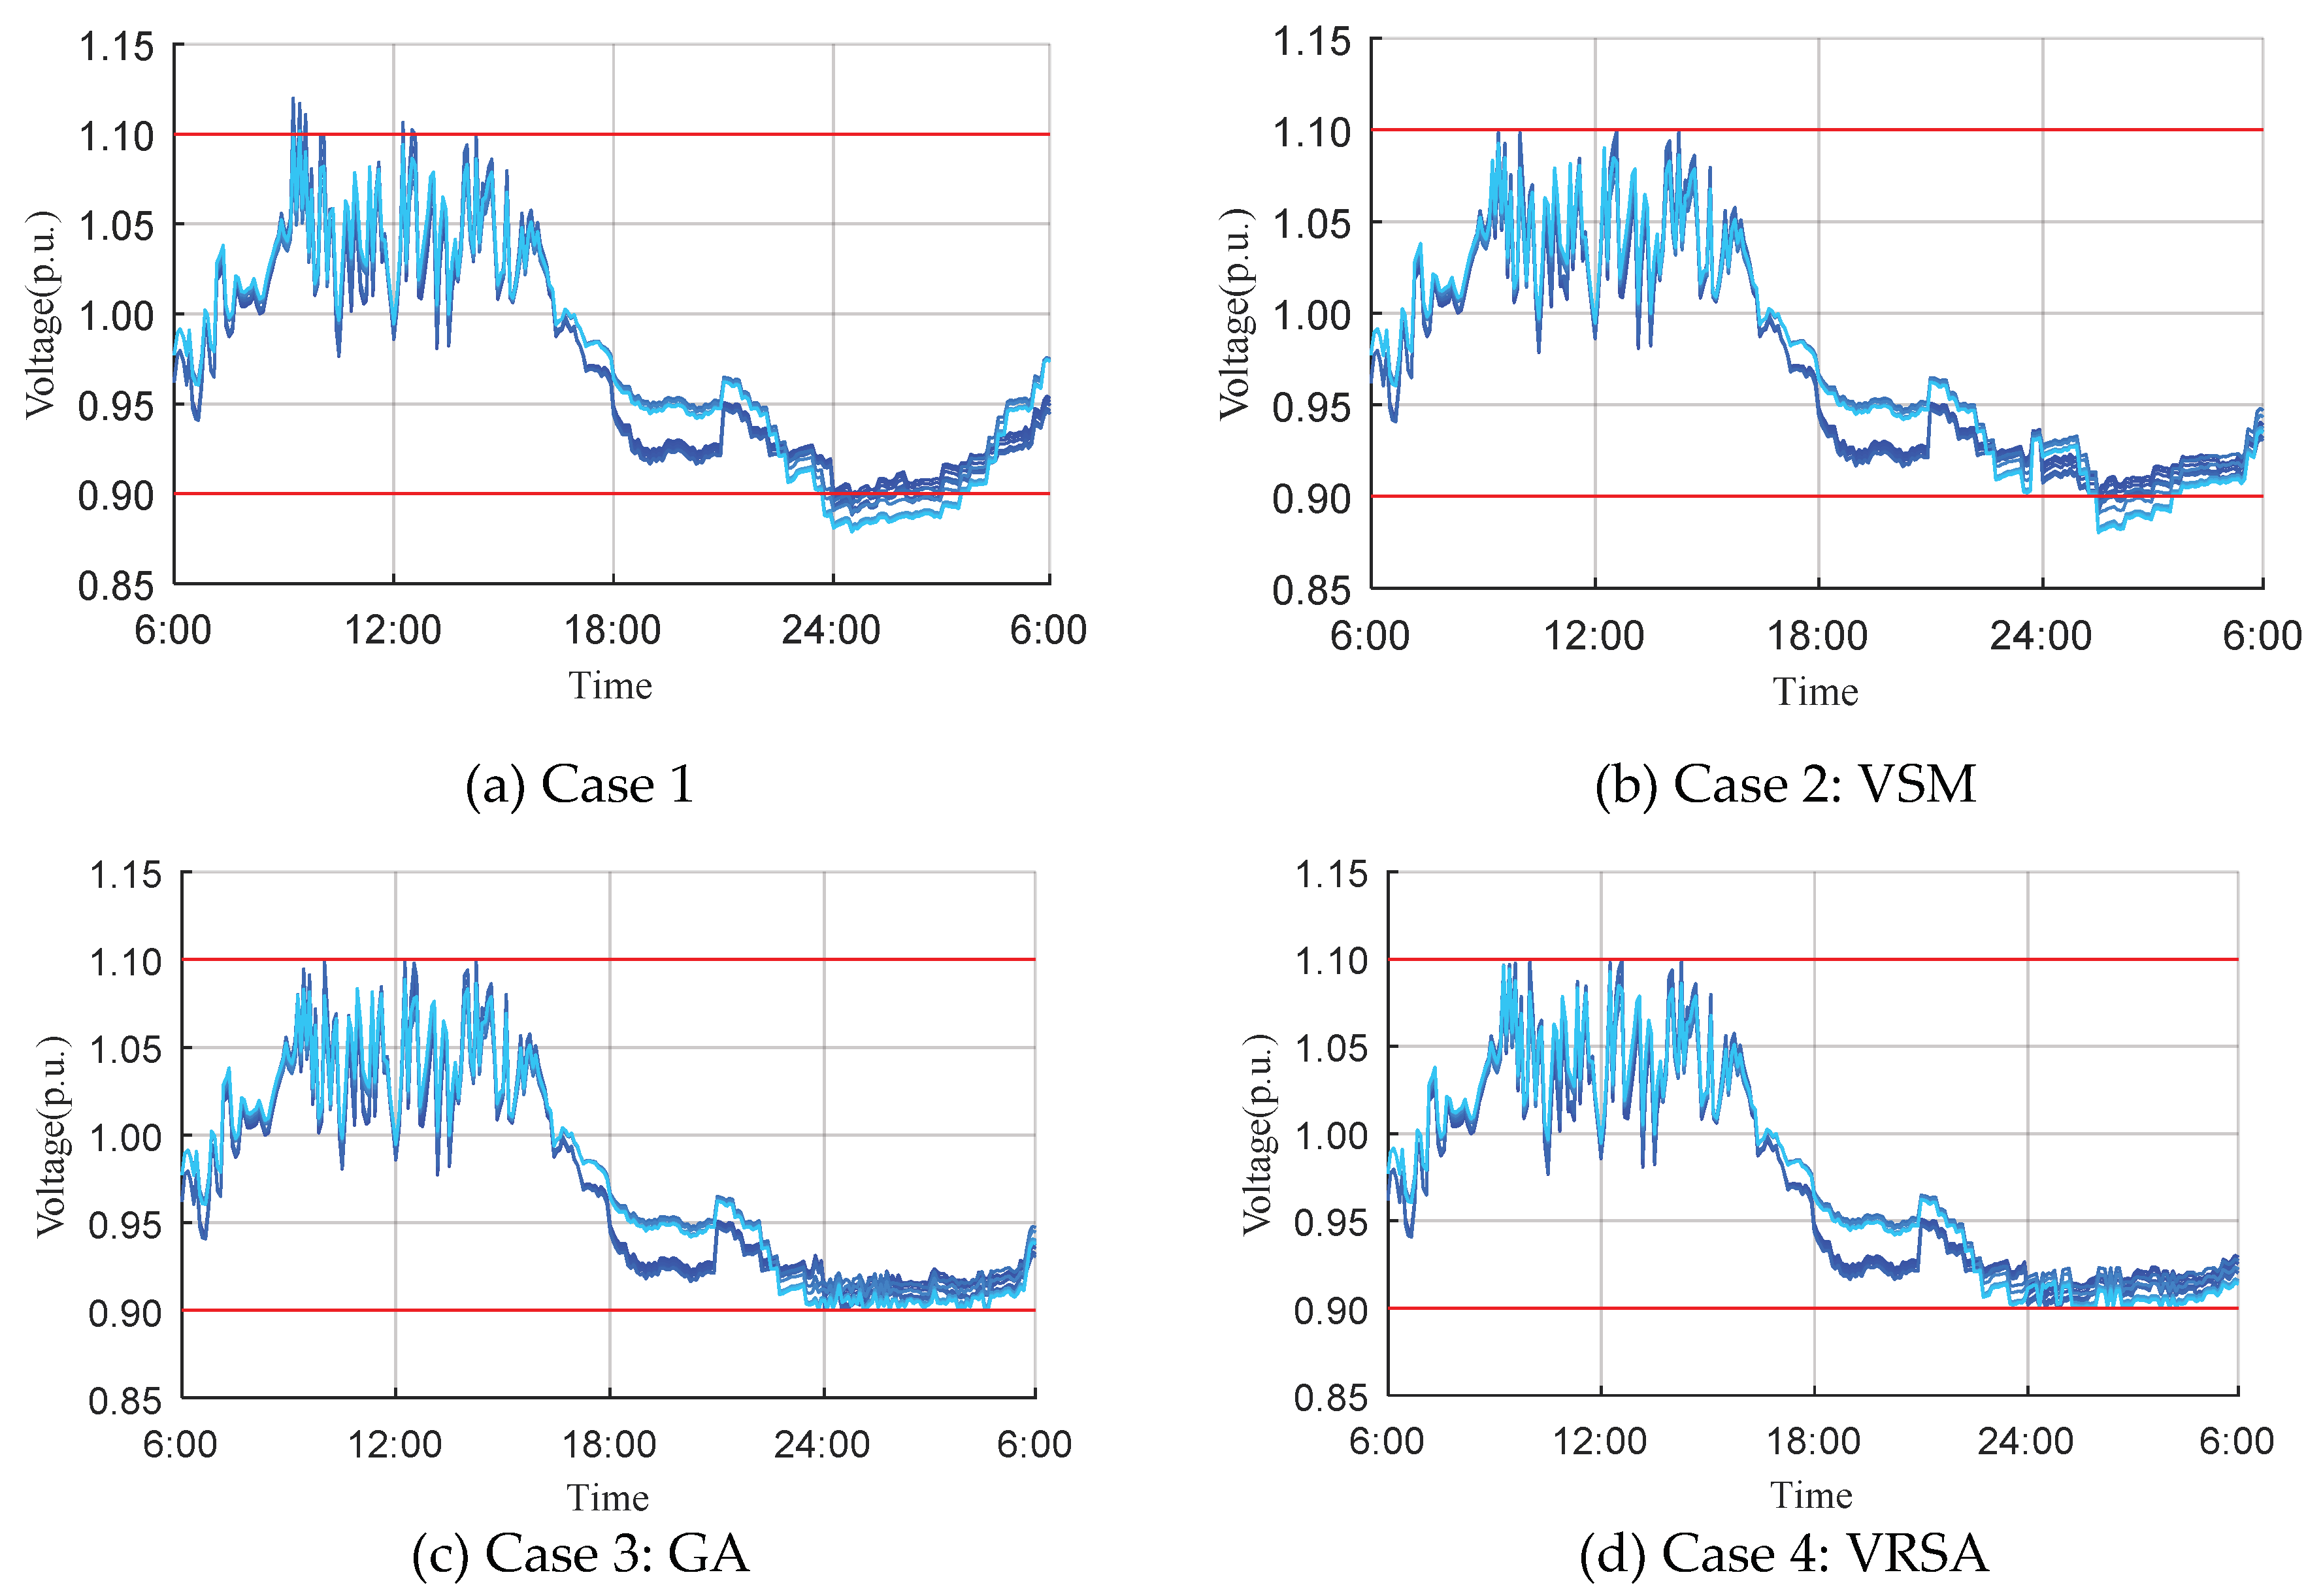
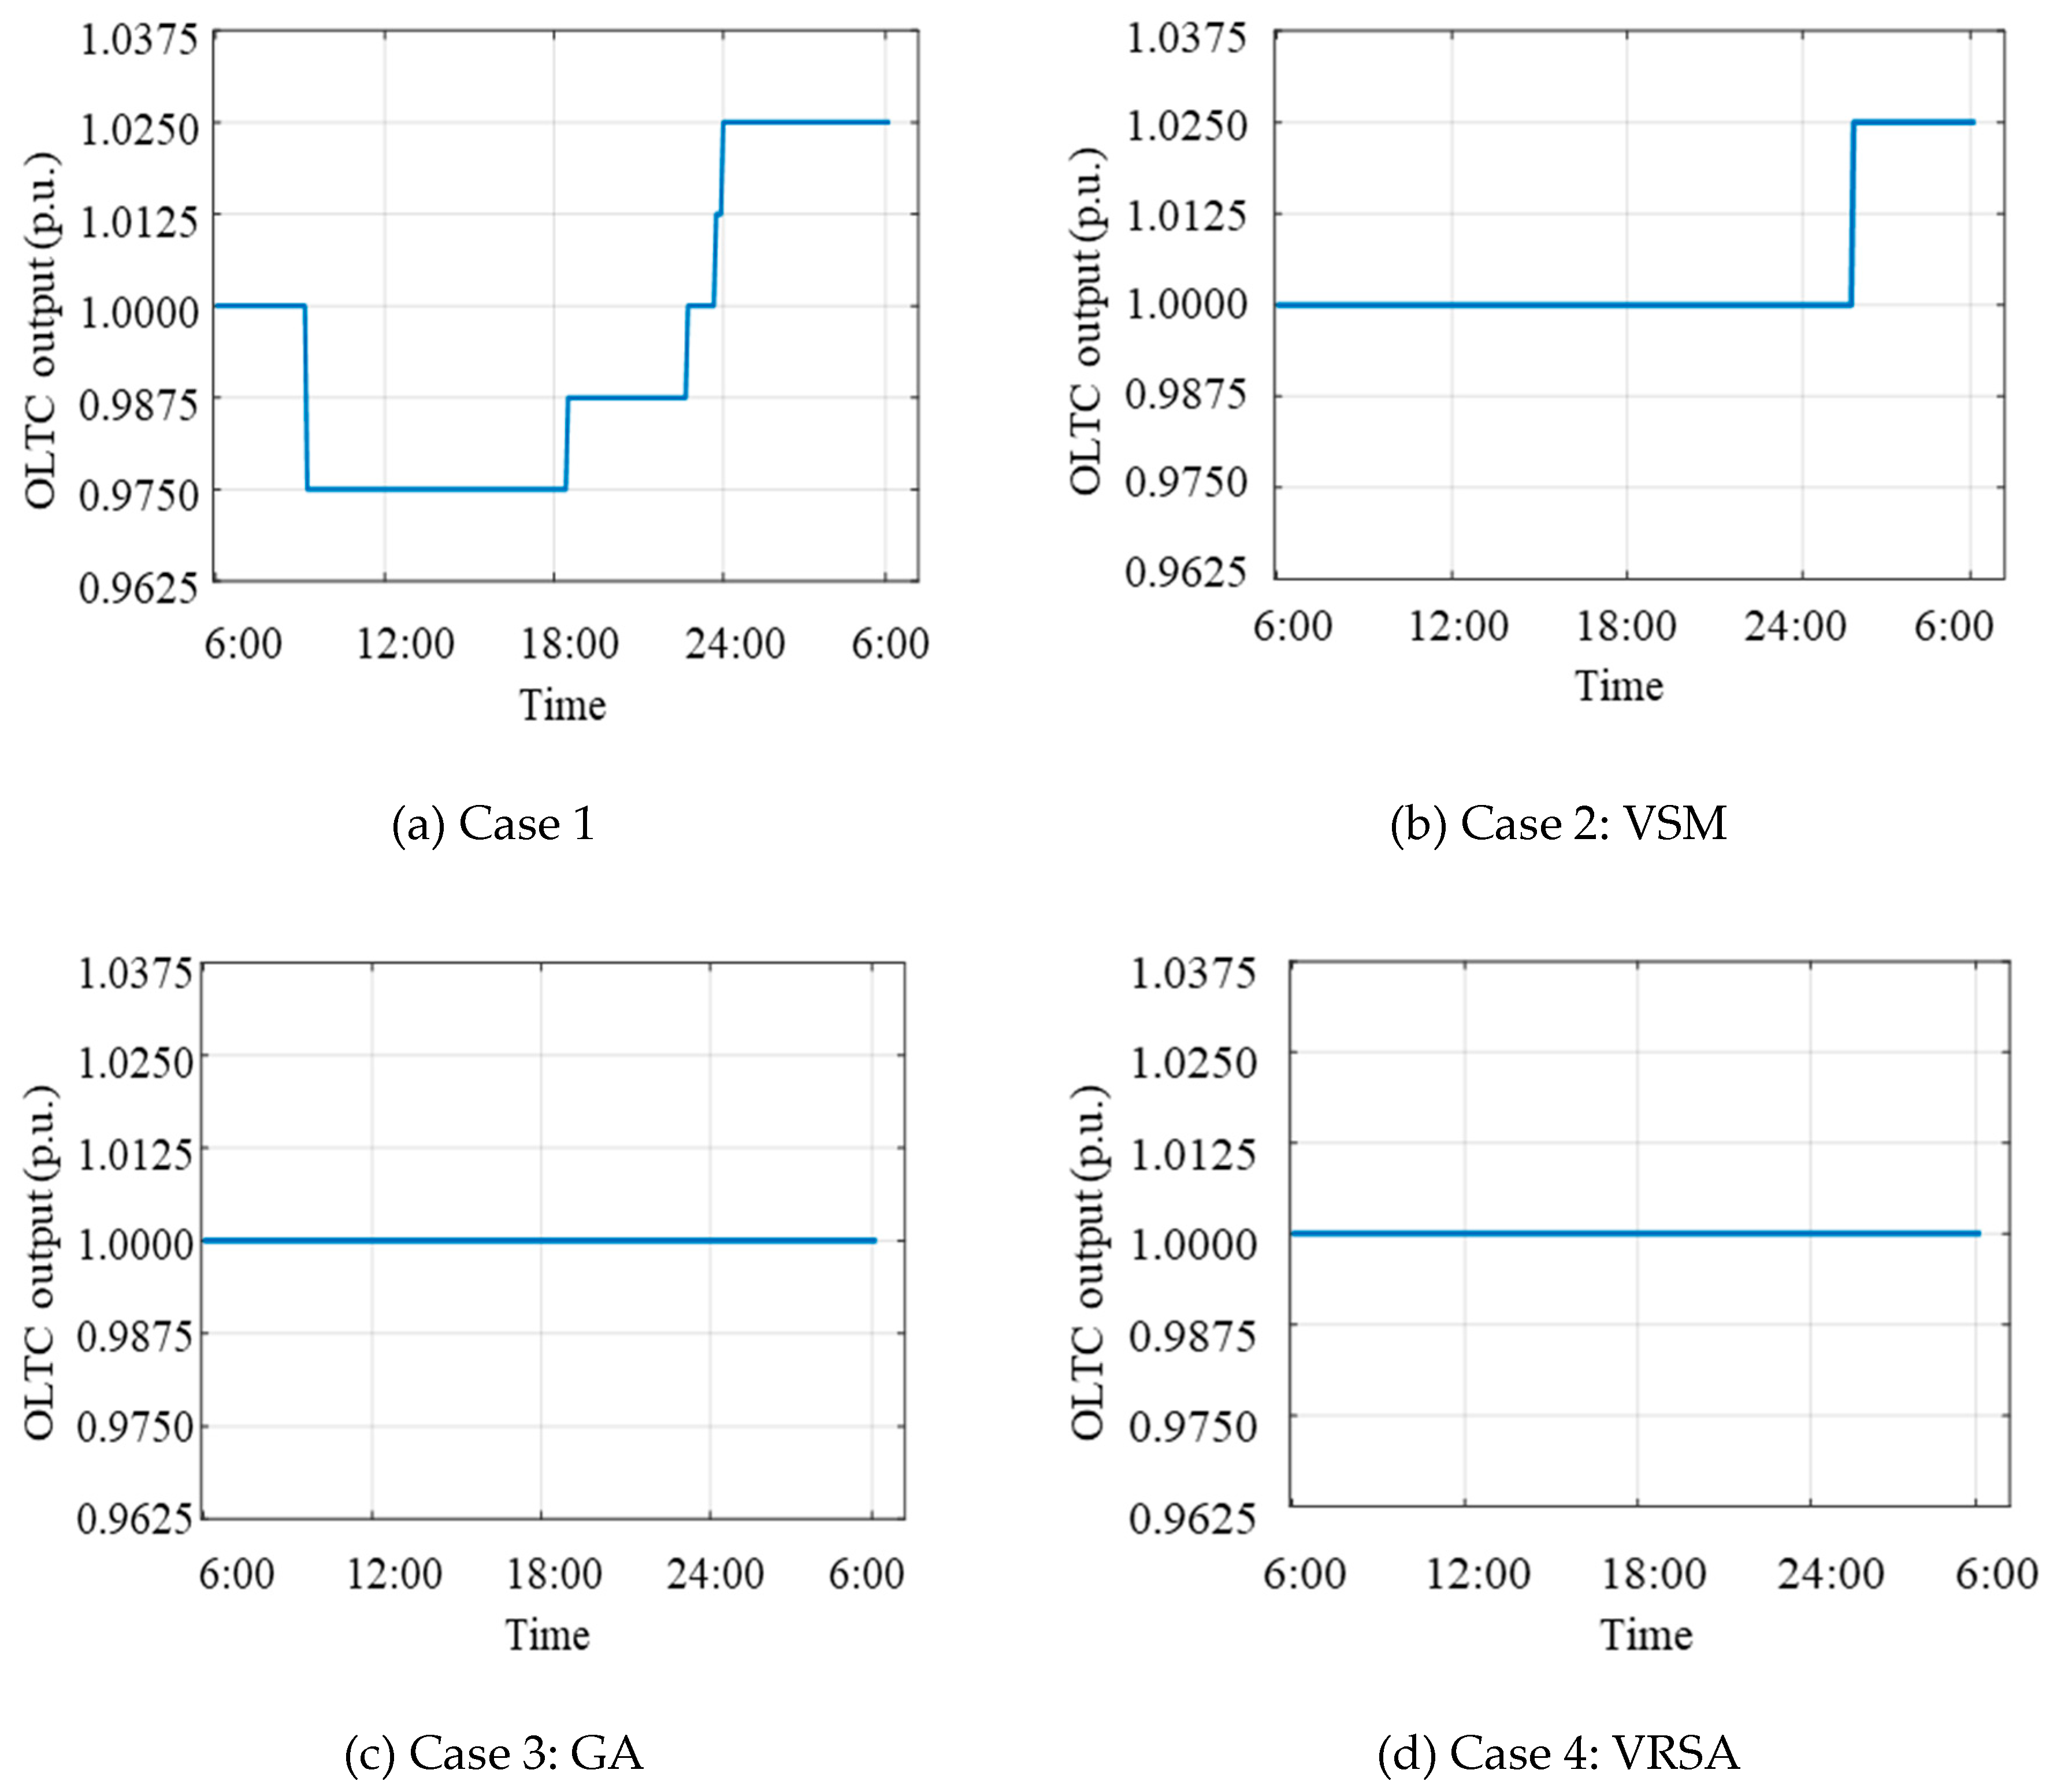
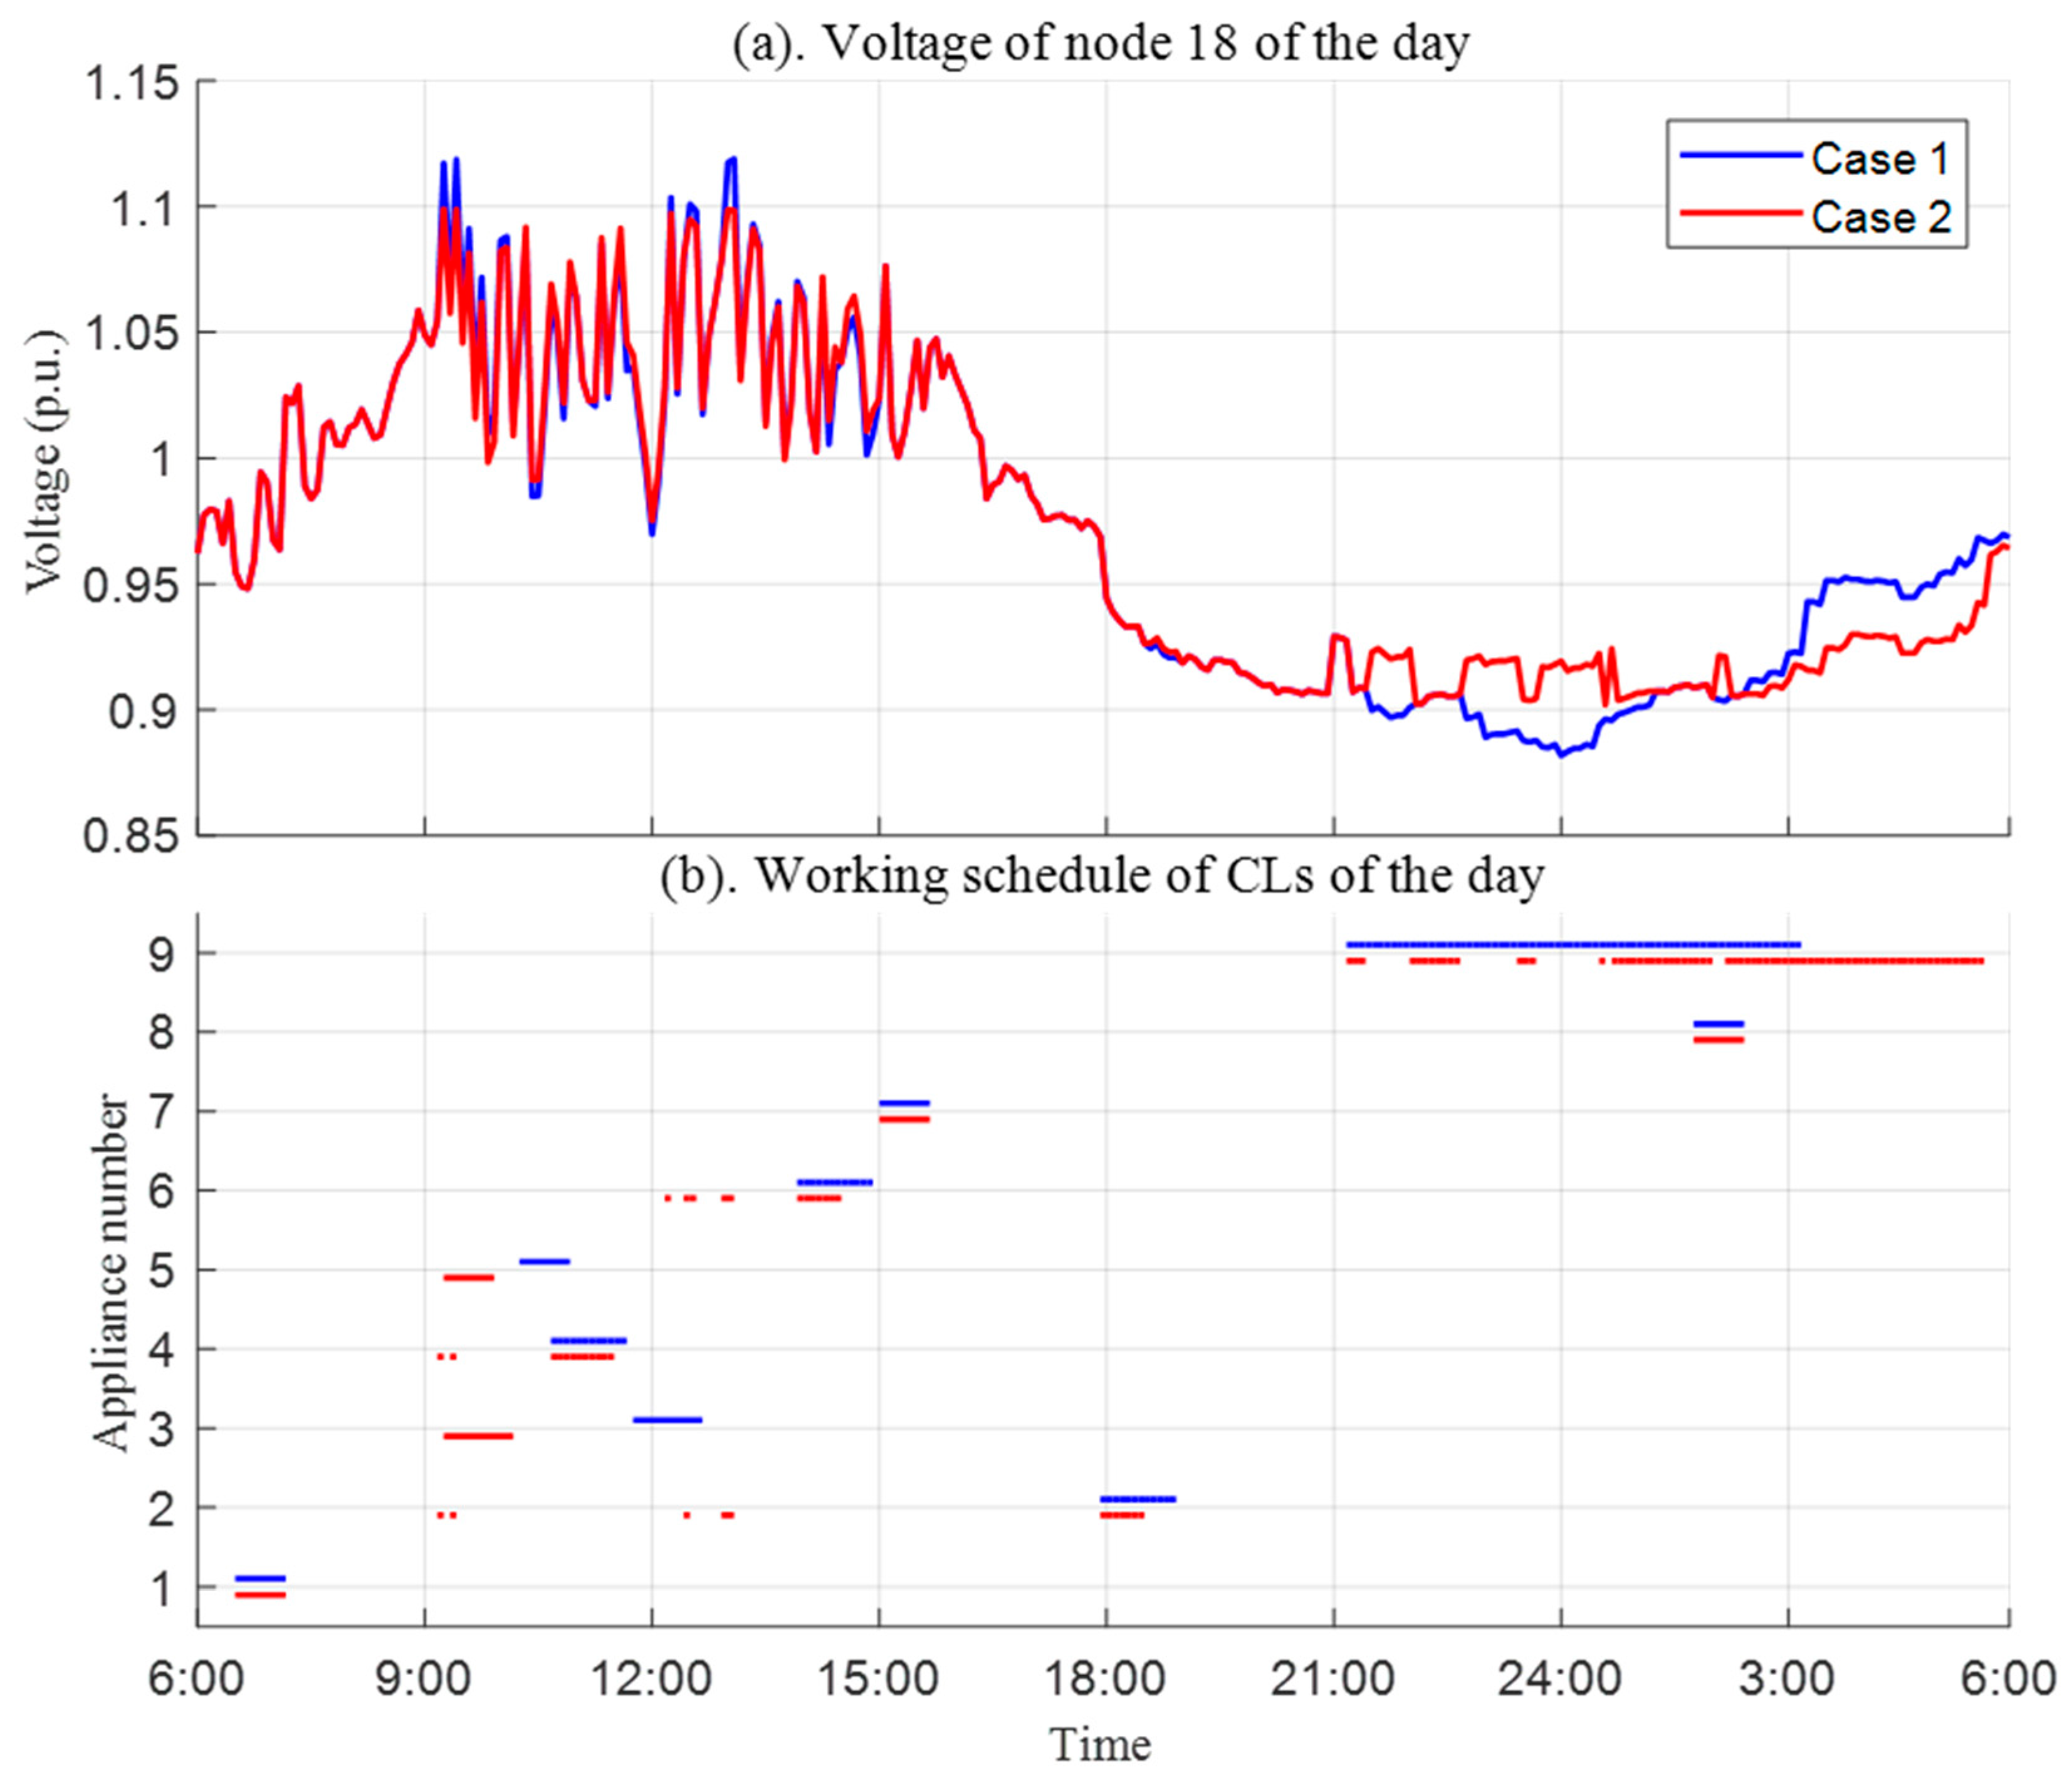
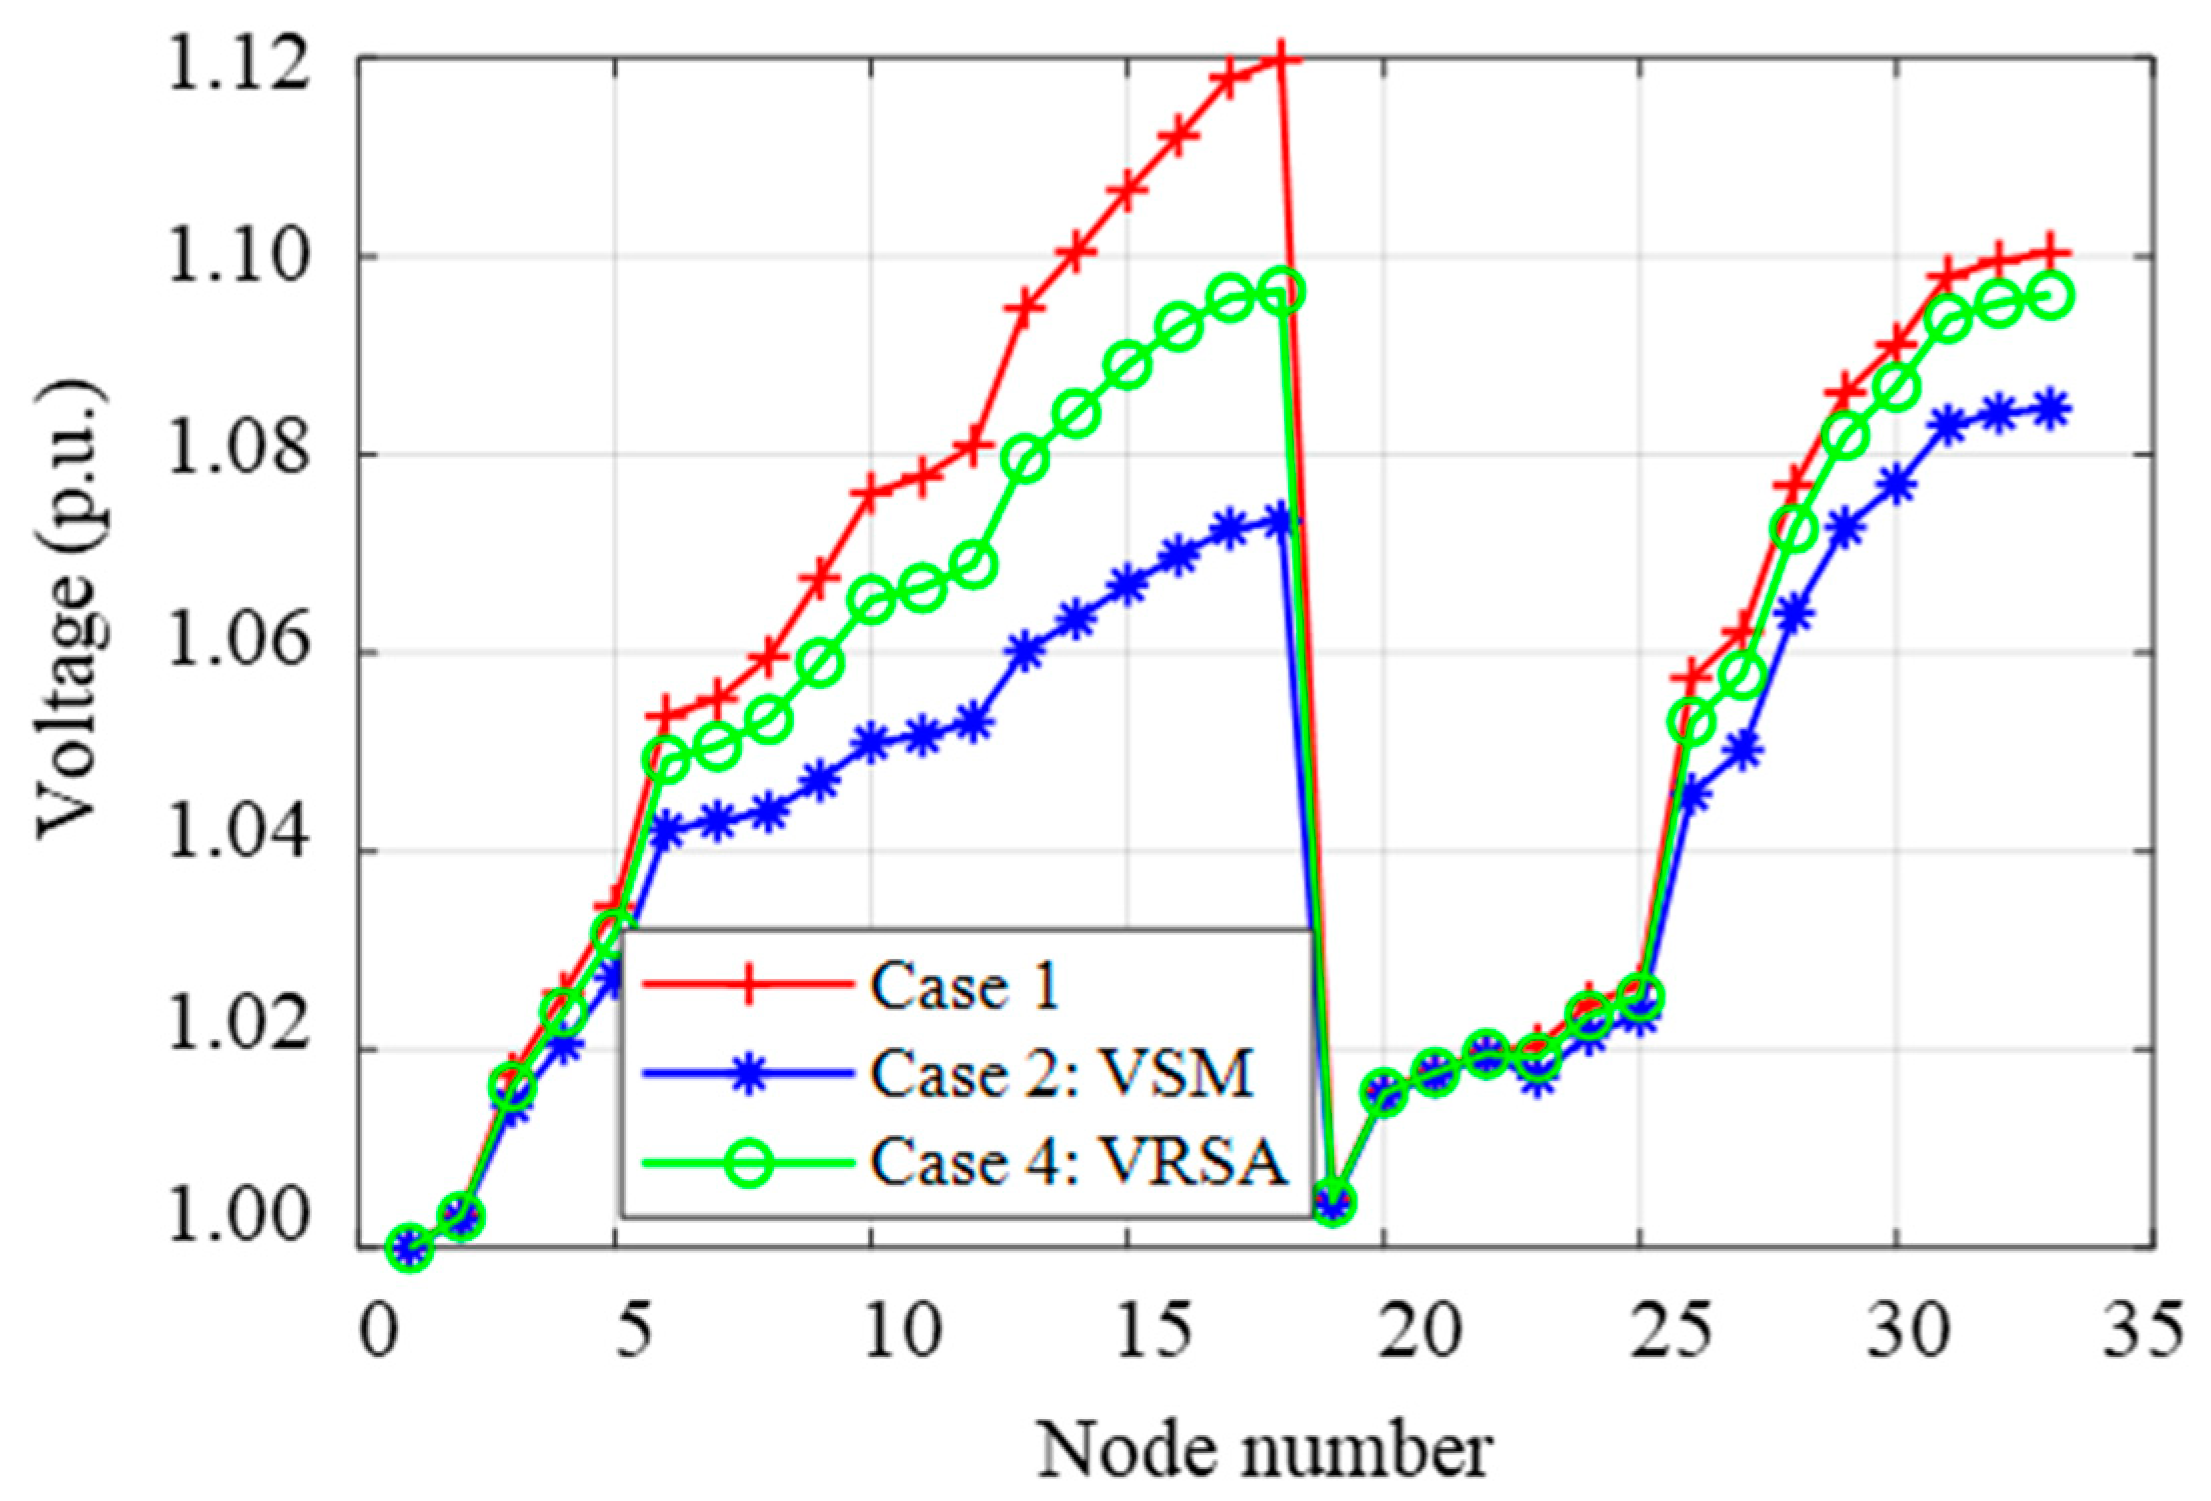
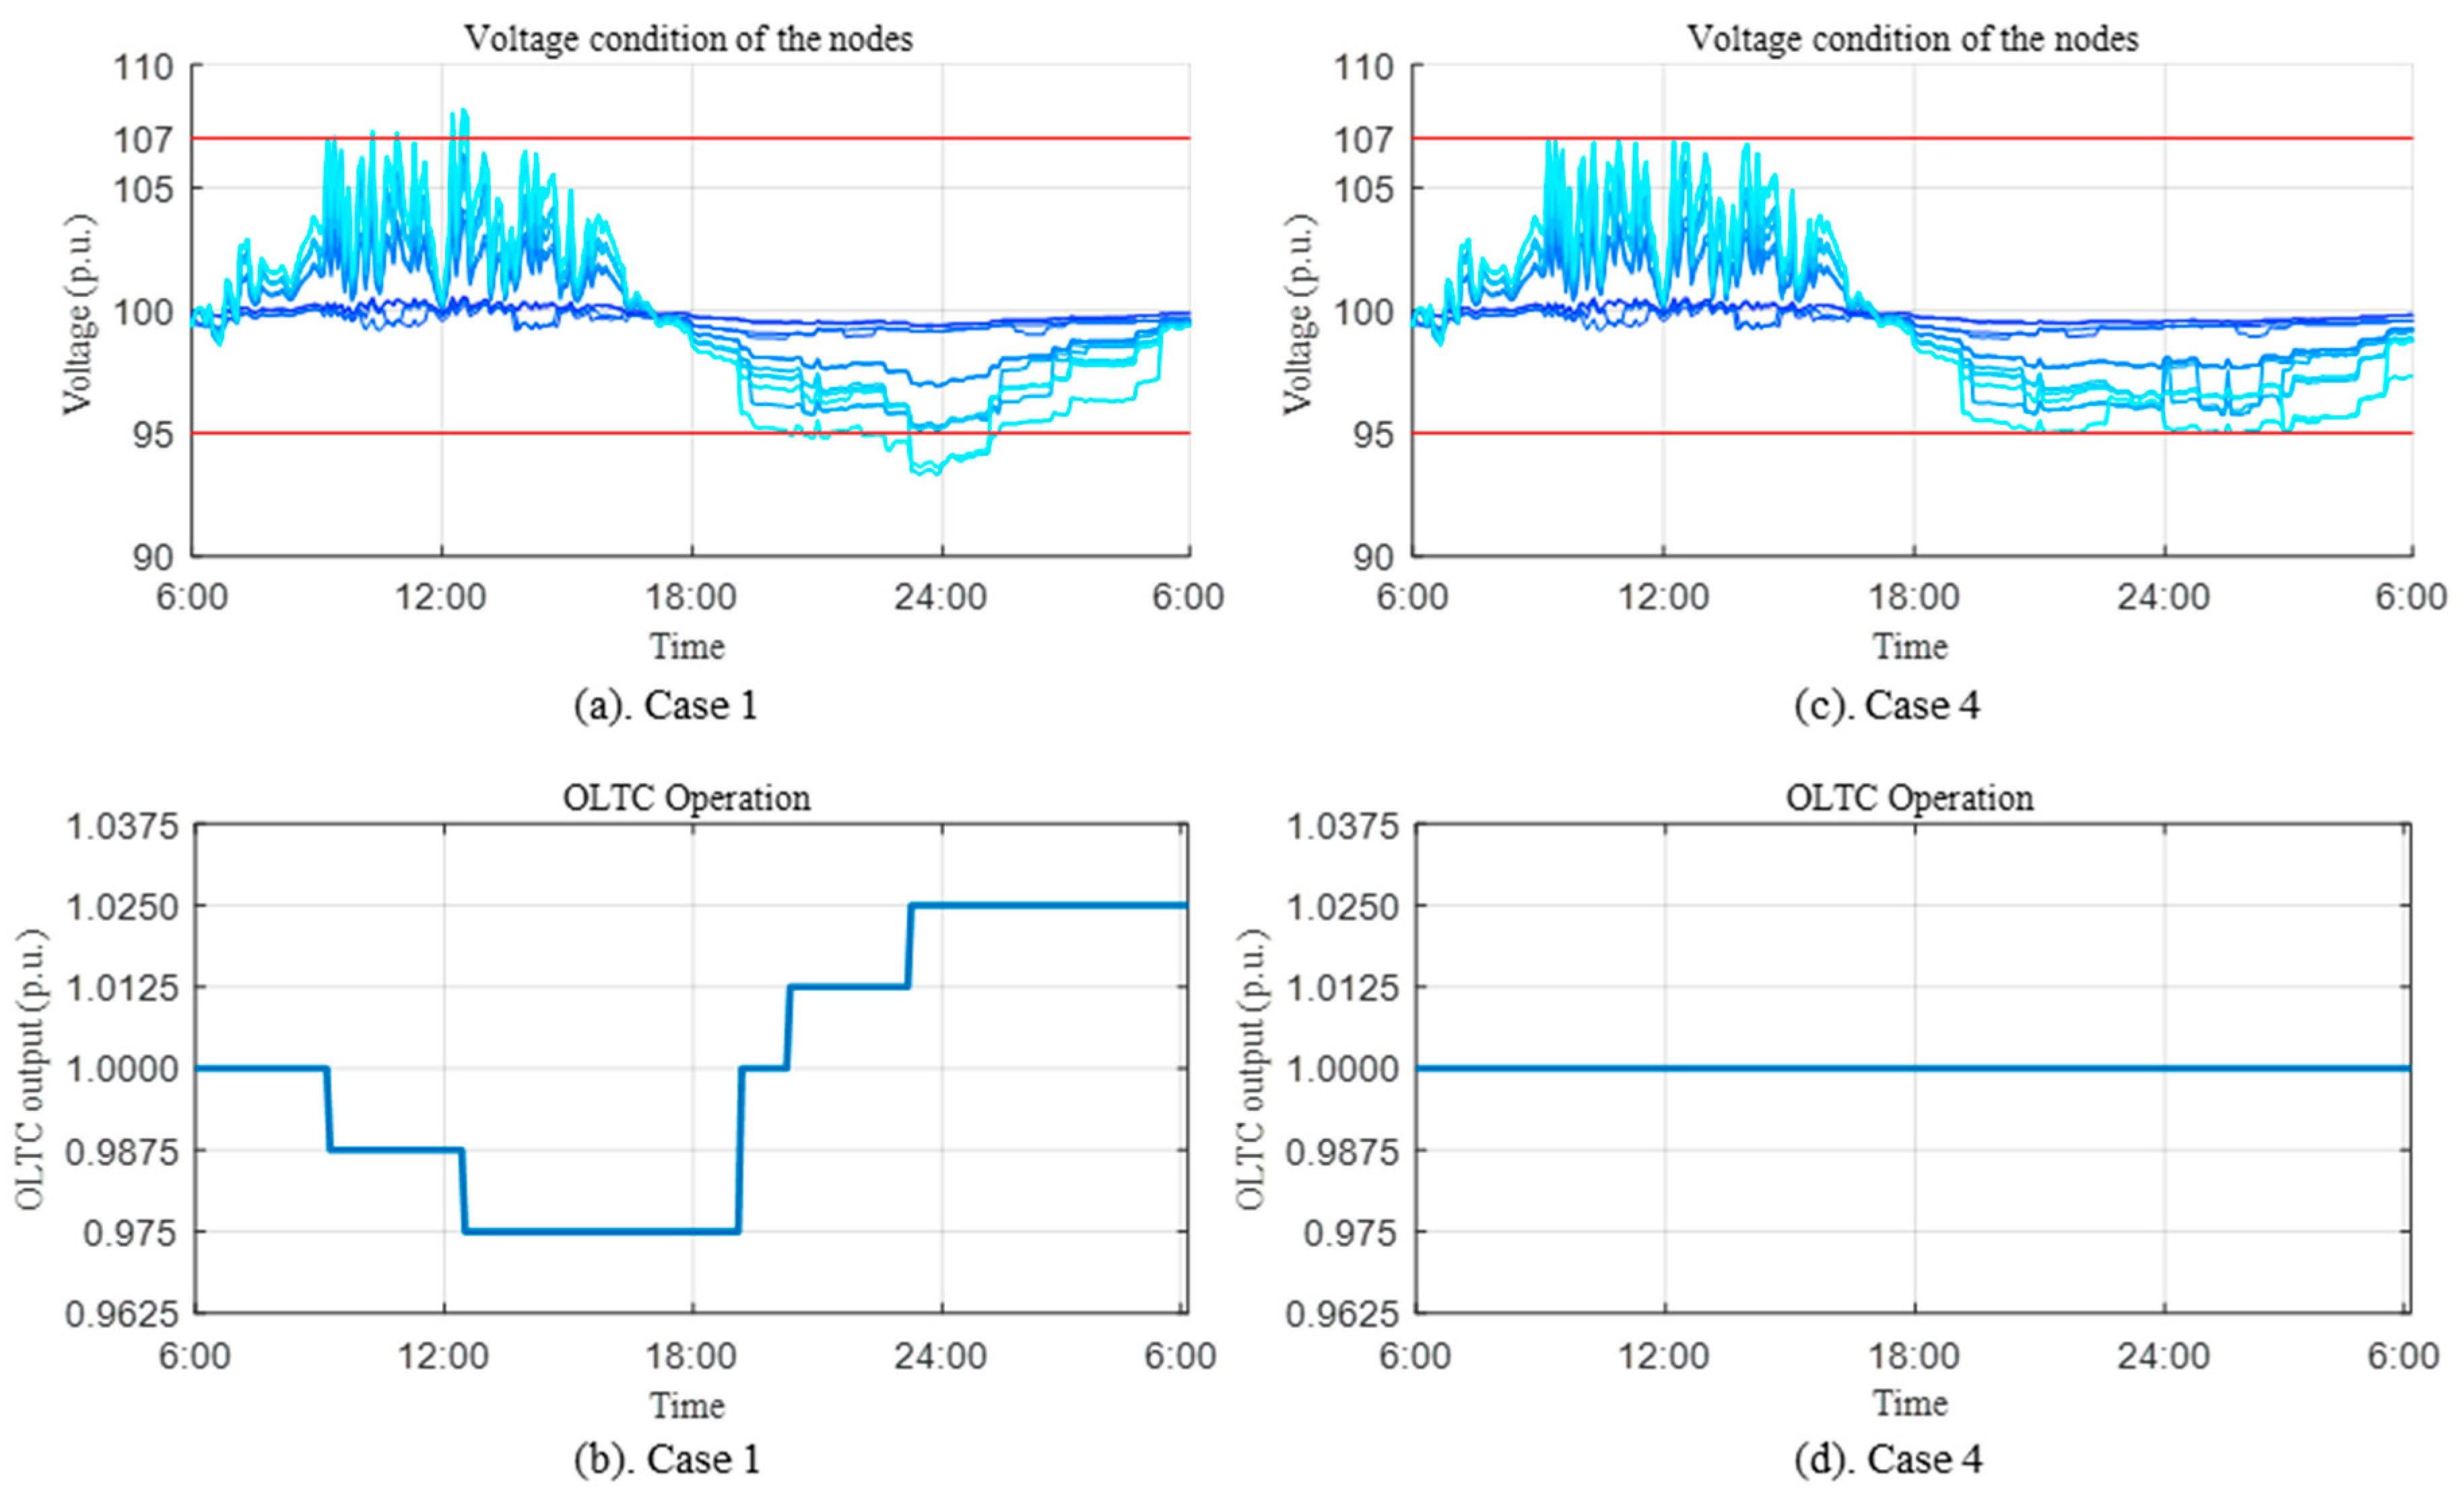
4.2. Results of the Four Cases

The simulation was executed utilizing MATLAB (Version R2017b, MathWorks, Natick, MA, USA) software using an Intel(R) i7 3.40-GHz central processing unit (CPU) with 8 GB of memory. The calculation time of the Newton–Raphson algorithm-based power flow was approximately 0.006 s for the 33-node distribution system.
In the simulation of Case 1, the customer CLs were started randomly according to the allowable working interval shown in Table 1. Because the PV output is large around and the peak load of EV charging is high during the night, over- and under-voltage problems occur many times during these time periods. For Cases 2, 3, and 4, the original working time of customer CLs was the same as Case 1. When an over-voltage problem was anticipated at the beginning of each time slot, the minimum combination of unstarted CLs was searched and turned on to solve the over-voltage problem. When an under-voltage problem was anticipated, the minimum capacity of working CLs was searched and turned off to solve the under-voltage problem. The optimization of the three cases are carried out using the VSM, GA, and VRSA, respectively. The optimization time, over- and under-voltage violation numbers, and total capacity of CLs utilized (TCCU), which is the summation of the objection function in Equation (14) of the 288 time slots, for the four cases are shown in Table 2. The longest optimization times for the VRSA and GA were 0.117 s and 2.615 s, respectively. Because, in the process of GA, the time-consuming power flow calculation is included in long iterations, the optimization of GA was much slower than that of the VRSA. As a result, GA is difficult to be applied to a large power distribution system. The VRSA optimization time was less than 0.2 s, which is appropriate for real-time voltage regulation. Among the three optimization algorithms, the optimization time of Case 2 was the shortest; however, there were 114 instances of under-voltage violations in Case 2. This was because the purpose of Equation (25) is to calculate the needed power for each node without considering whether the available CLs are sufficient or not in each node. In the case of the available CL power of a node not being enough following the calculation result of the VSM, real-time optimization may fail to solve the voltage violation. As a result, the VSM is not always effective in solving voltage violation compared to the VRSA and GA. Table 2 also shows that the TCCU of the VRSA was smaller than that of the GA, which indicates that the customers’ CL schedule would be less disturbed.
Figure 10 shows the working schedule of CLs for the four cases. The black curve of Case 1 indicates the original working schedule of the CLs. The green curve of Case 3 deviated from the black curve more than the blue and red curves, because GA utilized more power from the CLs for real-time voltage regulation. As a result, the customers’ CL schedule changed more in Case 3.
Figure 11 shows the total changed CL schedule for Cases 2, 3, and 4. Compared with the GA, the VRSA can get the optimal power combination of CLs for the voltage regulation, thereby minimally changing customers’ CL schedule. The abovementioned results show that the VRSA attained the best optimization result of Equation (14).
Voltage violations occurred in ten nodes (node 14, 15, 16, 17, 18, 29, 30, 31, 32, and 33) during the 24-h simulation. Figure 12 shows the voltage conditions of the ten nodes before the OLTC operation for the four cases. As seen in Case 1, an over-voltage problem occurred during the daytime and an under-voltage problem occurred during the night. Figure 12b shows that the VSM was unable to solve the under-voltage problem in the night. In Cases 3 and 4, the GA and the VRSA could regulate all voltages to the permissible range.
The tap operation schedules of the OLTC are shown in Figure 13. In Case 1, because voltage violations occurred frequently, the OLTC needed to operate many times to solve the voltage violations. In Case 2, the OLTC needed to operate twice because the VSM could not solve all under-voltage problems during the night. For Cases 3 and 4, the OLTC did not need to operate because the utilization of flexible resources through DR could solve all voltage violations. OLTCs are slower-changing devices in power distribution systems and frequent tap operation should be avoided. Furthermore, the intermittent generation characteristics of PV systems may cause excessive tap operation, and reduce the device’s lifetime. As a result, utilizing flexible resources can be beneficial to reducing OLTC operation.
Figure 14 shows the voltage conditions and CL working schedule of node 18. In Figure 14b, the blue and red lines indicate that CLs are powered on. The blue lines of Case 1 represent the original working time of the CLs. Node 18 is the furthest node of the 33-node distribution system, where over- and under-voltage problems occur frequently during the day. As a result, the working schedules of several CLs are changed; however, all of the CLs work during the allowed working interval [ α A i , β A i ] according to Table 1. CLs 2, 4, 6, and 9 correspond to the ventilator, two air conditioners, and EV, respectively, which are all interruptible loads; therefore, these loads can be flexibly arranged for voltage regulation.

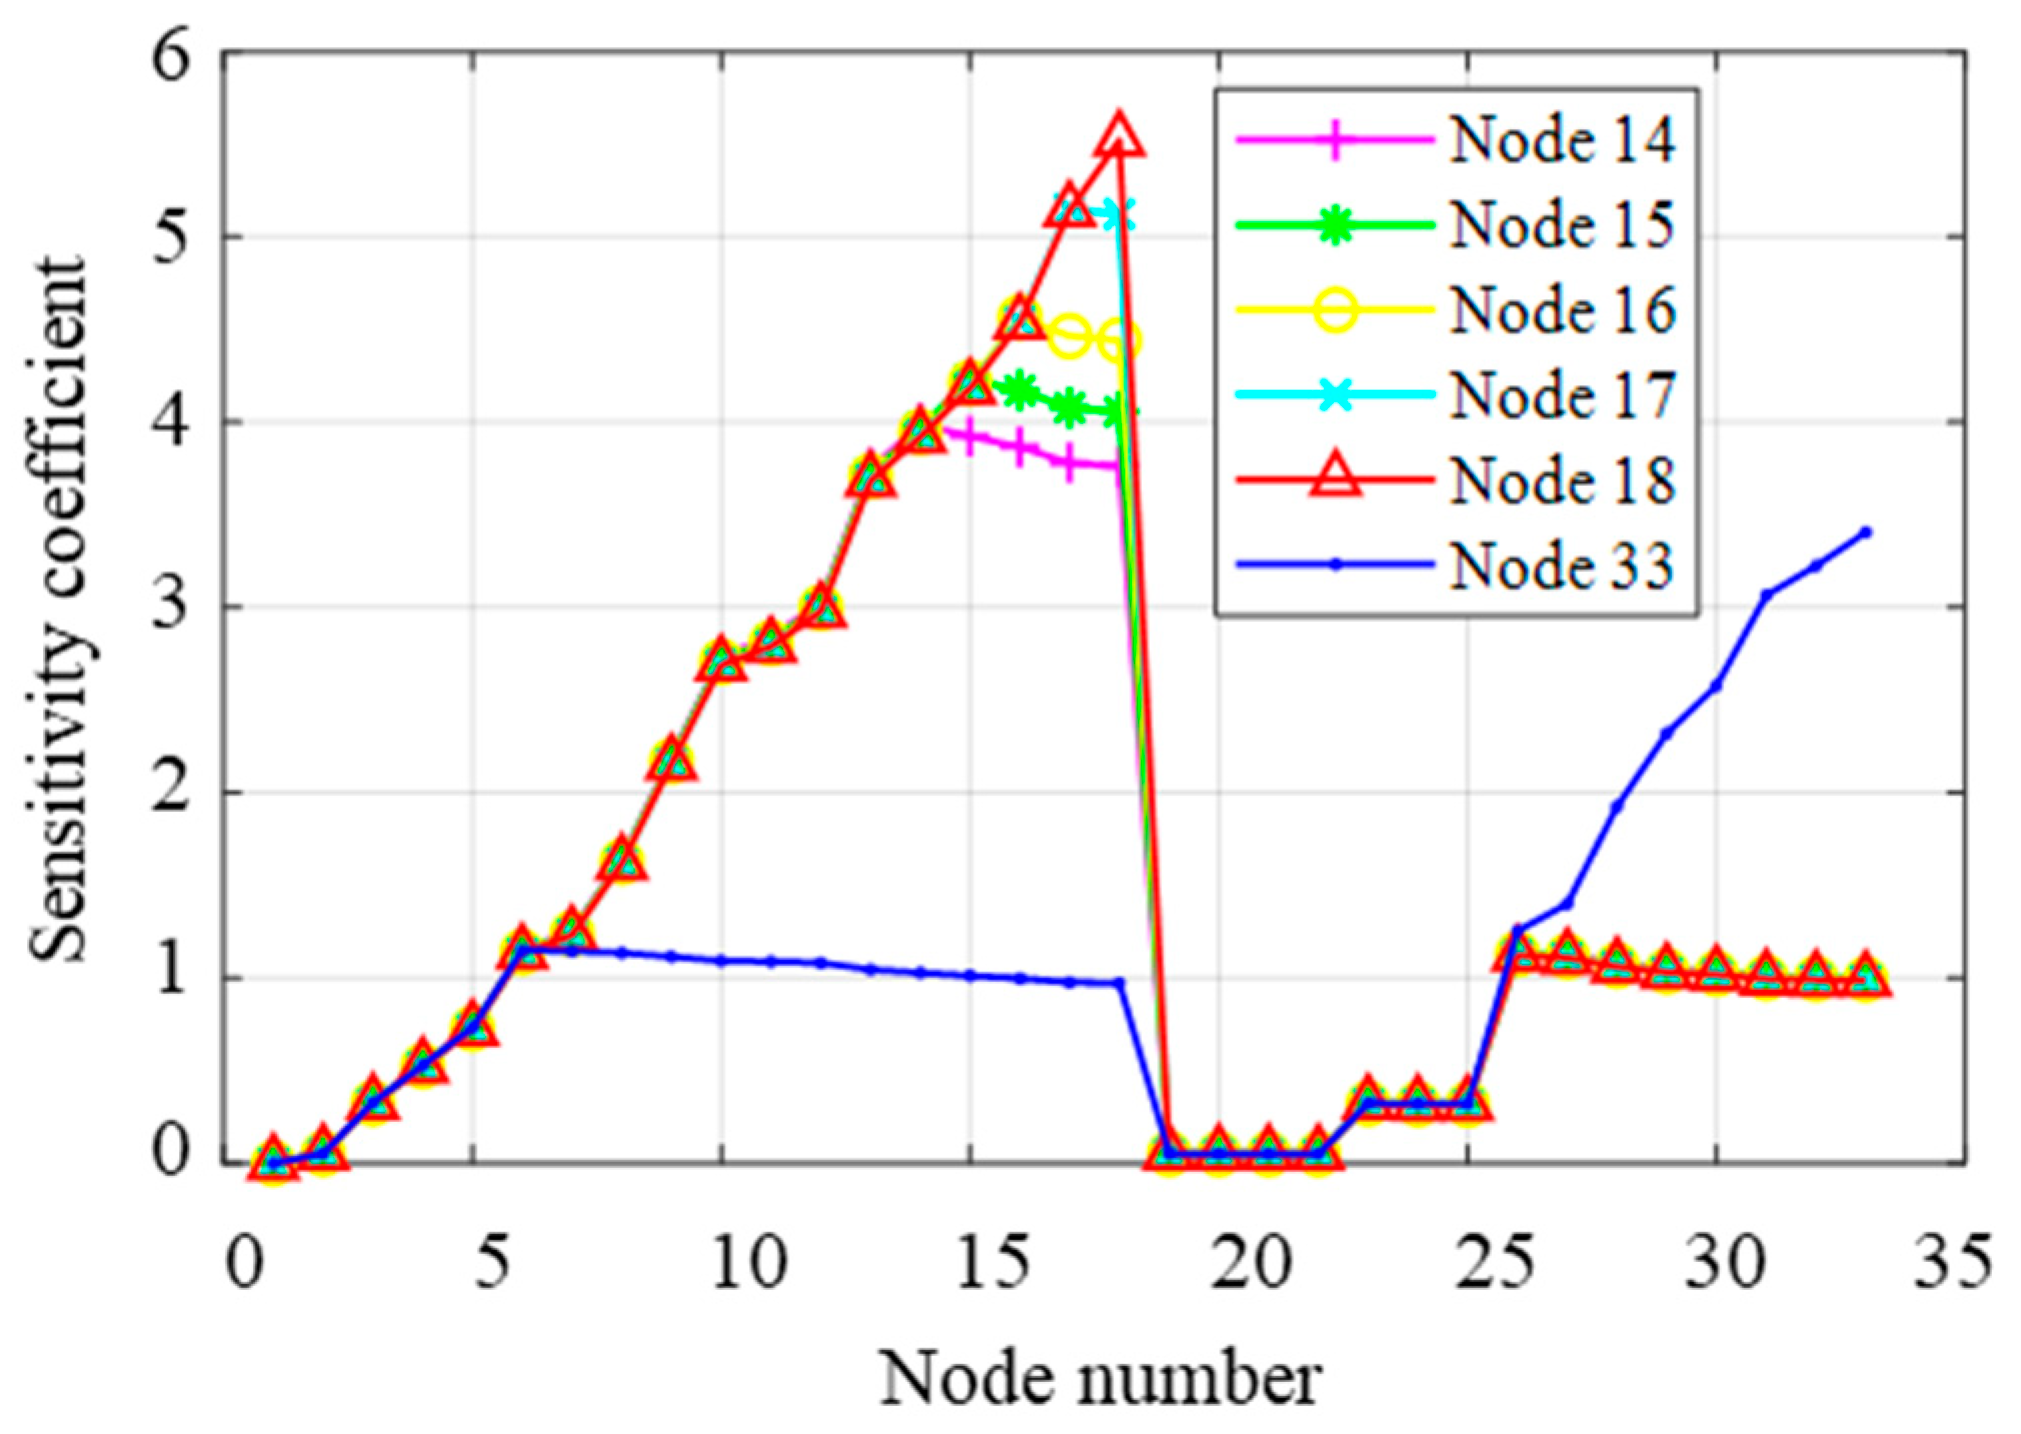
4.3. Voltage Regulation at Time Slot 40 (9:16) and Sensitivity Analysis

In the simulation, the first voltage violation occurred at time slot 40 (9:16) because the PV output was high. The voltages of the 33 nodes of time slot 40 are shown in Figure 15, in which the red curve indicates the voltage of all nodes of Case 1. As seen in the figure, the voltage of nodes 14, 15, 16, 17, 18, and 33 were beyond the high limit (1.1 pu), causing over-voltage problems in Case 1.
As proposed in this study, the CLs could be utilized for voltage regulation through DR. According to the VSM and VRSA, the selected CL powers of nodes 14, 15, 16, 17, 18, and 33 are shown in Table 3.
According to the VSM, the needed active power for the voltage regulation is calculated using Equation (25). The selected CL powers of nodes 14, 15, 16, 17, 18, and 33 are 0, 2.2, 2, 1.8, 2.7, and 1.9, respectively. Indeed, the sensitivity coefficients of these nodes are correlated with each other; thus, modifying any of the nodes may simultaneously influence other nodes. However, this significant point is ignored when calculating Equation (25). Through the search of the VRSA, the selected CL powers for the voltage regulation were 1.5 and 2.7 at nodes 17 and 18, respectively. Table 3 shows that the VRSA selected less CL power for regulating the voltage, i.e., customers’ CLs schedule would be less affected.
The voltage sensitivity matrix ( S U P ) of the abovementioned nodes is shown in Figure 16. It illustrates that the active power change at nodes 14, 15, 16, 17, and 18 would significantly affect their voltages. The sensitivity coefficients of nodes 17 and 18 are listed in Table 4. According to the sensitivity coefficients, the voltages of nodes 14, 15, and 16 are highly correlated with nodes 17 and 18. As a result, starting the CLs at nodes 17 and 18 is sufficient to regulate the over-voltage problems of the other nodes. The sensitivity analysis indicates that the VRSA search is more effective than the VSM in voltage regulation.

4.4. Simulation on a Typical Japanese Distribution System

The simulation was validated on a typical Japanese power distribution system according to Reference [23]. In Japan, the over- and under-voltage points are 107 and 95 V, respectively. Figure 17 shows the simulation results of 12 customers using the model of Reference [23]. Figure 17a shows the voltage conditions of the 12 customers before the OLTC operation. It can be seen that over- and under-voltage problems occurred during the daytime and nighttime, respectively. The OLTC needed to operate six times to regulate the voltage, as shown in Figure 17b. Figure 17c,d illustrate that, with the optimization of CLs, the voltages were all regulated to the permissible range. As a result, the operation of the OLTC could be avoided.

5. Conclusions

DR is becoming an important application of smart grids. Utilizing flexible resources such as PV systems and CLs at the demand side can not only flatten the power demand curve, but also help the DSO to relieve the voltage regulation stress. This paper proposes an intelligent real-time search algorithm called VRSA to solve the optimal CL scheduling for the voltage regulation of power distribution systems. A simulation test was carried out in the IEEE 33-node distribution system. The proposed VRSA was compared with the VSM and GA. The simulation results illustrate that the VRSA had the best performance among the three algorithms. By utilizing flexible resources such as PV inverters and CLs, the number of voltage violations can be reduced. As a result, the number of tap operations by the OLTC can be reduced, and the voltage control stress of DSO can be relieved.

Author Contributions

Conceptualization, Q.X.; methodology, Q.X.; formal analysis, X.S.; investigation, X.S.; data curation, Y.H.; writing—original draft preparation, Q.X.; writing—review and editing, Y.D., X.W. and J.C.; supervision, Y.D.; project administration, Y.D.; funding acquisition, Q.X.

Funding

This research was funded by the Zhejiang Provincial Natural Science Foundation of China, Grant No. LQ18E070002, the State Grid Corporation of China (52110416001T) and the core curriculum construction of master course by Hangzhou Dianzi University under No. HXKC2017006.

Acknowledgments

The authors would like to thank the editor and reviewers whose comments and suggestions have improved the quality of this paper.

Conflicts of Interest

The authors declare no conflict of interest.

References

  1. Haque, M.M.; Wolfs, P. A review of high PV penetrations in LV distribution networks: Present status, impacts and mitigation measures. Renew. Sustain. Energy Rev. 2016, 62, 1195–1208. [Google Scholar] [CrossRef]
  2. Chaudhary, P.; Rizwan, M. Voltage regulation mitigation techniques in distribution system with high PV penetration: A review. Renew. Sustain. Energy Rev. 2018, 82, 3279–3287. [Google Scholar] [CrossRef]
  3. De Hoog, J.; Alpcan, T.; Brazil, M.; Thomas, D.A.; Mareels, I. Optimal charging of electric vehicles taking distribution network constraints into account. IEEE Trans. Power Syst. 2015, 30, 365–375. [Google Scholar] [CrossRef]
  4. Mahmud, N.; Zahedi, A. Review of control strategies for voltage regulation of the smart distribution network with high penetration of renewable distributed generation. Renew. Sustain. Energy Rev. 2016, 64, 582–595. [Google Scholar] [CrossRef]
  5. Salih, S.N.; Chen, P. On coordinated control of oltc and reactive power compensation for voltage regulation in distribution systems with wind power. IEEE Trans. Power Syst. 2016, 31, 4026–4035. [Google Scholar] [CrossRef]
  6. Molina-García, Á.; Mastromauro, R.A.; García-Sánchez, T.; Pugliese, S.; Liserre, M.; Stasi, S. Reactive power flow control for PV inverters voltage support in LV distribution networks. IEEE Trans. Smart Grid 2017, 8, 447–456. [Google Scholar] [CrossRef]
  7. Tonkoski, R.; Lopes, L.A.C.; El-Fouly, T.H.M. Coordinated active power curtailment of grid connected PV inverters for overvoltage prevention. IEEE Trans. Sustain. Energy 2011, 2, 139–147. [Google Scholar]
  8. Liu, X.; Aichhorn, A.; Liu, L. Coordinated control of distributed energy storage system with tap changer transformers for voltage rise mitigation under high photovoltaic penetration. IEEE Trans. Smart Grid 2012, 3, 897–906. [Google Scholar] [CrossRef]
  9. Tant, J.; Geth, F.; Six, D.; Tant, P.; Driesen, J. Multiobjective battery storage to improve PV integration in residential distribution grids. IEEE Trans. Sustain. Energy 2013, 4, 182–191. [Google Scholar] [CrossRef]
  10. Vivekananthan, C.; Mishra, Y.; Ledwich, G.; Li, F. Demand response for residential appliances via customer reward scheme. IEEE Trans. Smart Grid 2014, 5, 809–820. [Google Scholar] [CrossRef]
  11. Mocci, S.; Natale, N.; Pilo, F.; Ruggeri, S. Demand side integration in LV smart grids with multi-agent control system. Electr. Power Syst. Res. 2015, 125, 23–33. [Google Scholar] [CrossRef]
  12. Yao, E.; Samadi, P.; Wong, V.W.S.; Schober, R. Residential demand side management under high penetration of rooftop photovoltaic units. IEEE Trans. Smart Grid 2015, 7, 1597–1608. [Google Scholar] [CrossRef]
  13. Xie, Q.; Hara, R.; Kita, H.; Tanaka, E. Coordinated control of OLTC and multi-CEMSs for overvoltage prevention in power distribution system. IEEJ Trans. Electr. Electron. Eng. 2017, 12, 692–701. [Google Scholar] [CrossRef]
  14. Mendaza, I.D.d.; Szczesny, I.G.; Pillai, J.R.; Bak-Jensen, B. Demand response control in low voltage grids for technical and commercial aggregation services. IEEE Trans. Smart Grid 2016, 7, 2771–2780. [Google Scholar] [CrossRef]
  15. Osório, G.J.; Shafie-kha, M.; Lotf, M.; Ferreira-Silva, B.J.M.; Catalão, J.P.S. Demand-side management of smart distribution grids incorporating renewable energy sources. Energies 2019, 12, 143. [Google Scholar] [CrossRef]
  16. Lujano-Rojas, J.M.; Dufo-Lopez, R.; Bernal-Agustin, J.L.; Dominguez-Navarro, J.A.; Osorio, G.J.; Catalao, J.P.S. Determining the optimal setting of voltage regulators for day-ahead management of distribution smart systems. In Proceedings of the 2017 IEEE Manchester PowerTech, Manchester, UK, 18–22 June 2017; pp. 4–9. [Google Scholar]
  17. Rahman, M.; Are, A.; Sha, G.M.; Hettiwatte, S. A new approach to voltage management in unbalanced low voltage networks using demand response and OLTC considering consumer preference. Electr. Power Energy Syst. 2018, 99, 11–27. [Google Scholar] [CrossRef]
  18. Demirok, E.; Gonz, P.C.; Frederiksen, K.H.B.; Sera, D.; Rodriguez, P.; Teodorescu, R. local reactive power control methods for overvoltage prevention of distributed solar inverters in low-voltage grids. IEEE J. Photovolt. 2011, 1, 174–182. [Google Scholar] [CrossRef]
  19. Hua, Y.; Shentu, X.; Xie, Q.; Ding, Y. Voltage/frequency deviations control via distributed battery energy storage syste m considering state of charge. Appl. Sci. 2019, 9, 1148. [Google Scholar] [CrossRef]
  20. Lin, Z.; Wen, F.; Xue, Y. A Restorative self-healing algorithm for transmission systems based on complex network theory. IEEE Trans. Smart Grid 2016, 7, 2154–2162. [Google Scholar] [CrossRef]
  21. Wang, S.; Chen, S.; Ge, L.; Wu, L. Distributed generation hosting capacity evaluation for distribution systems considering the robust optimal operation of OLTC and SVC. IEEE Trans. Sustain. Energy 2016, 7, 1111–1123. [Google Scholar] [CrossRef]
  22. Zhao, Z.; Lee, W.C.; Shin, Y.; Song, K. An optimal power scheduling method for demand response in home energy management system. IEEE Trans. Smart Grid 2013, 4, 1391–1400. [Google Scholar] [CrossRef]
  23. Mitsukuri, Y.; Hara, R.; Kita, H.; Kamiya, E.; Kataoka, Y.; Taki, S.; Kogure, E. Validation of Voltage Regulation Method in Distribution System Utilizing Electric Vehicles. In Proceedings of the 2012 3rd IEEE PES Innovative Smart Grid Technologies Europe (ISGT Europe), Berlin, Germany, 14–17 October 2012; pp. 1–7. [Google Scholar]
Figure 1. A simplified two-customer power distribution system model.
Energies 12 01902 g001
Figure 2. Diagram of an over-voltage profile.
Energies 12 01902 g002
Figure 3. Diagram of an under-voltage profile.
Energies 12 01902 g003
Figure 4. Flowchart of real-time voltage regulation via controllable load (CL).
Energies 12 01902 g004
Figure 5. Over-voltage regulation using customer flexible resources.
Energies 12 01902 g005
Figure 6. Flow chart of the voltage ranking search algorithm (VRSA): over-voltage regulation.
Energies 12 01902 g006
Figure 7. Flow chart of the VRSA: under-voltage regulation.
Energies 12 01902 g007
Figure 8. IEEE 33-node power distribution system.
Energies 12 01902 g008
Figure 9. Aggregated data of photovoltaic (PV) power and base load.
Energies 12 01902 g009
Figure 10. The aggregated CL power of the four cases.
Energies 12 01902 g010
Figure 11. The total changed CL schedule.
Energies 12 01902 g011
Figure 12. Voltage condition of the four cases. VSM—voltage sensitivity method; GA–genetic algorithm.
Energies 12 01902 g012
Figure 13. On-load tap changer (OLTC) operation of the four cases.
Energies 12 01902 g013
Figure 14. Voltage conditions and CL working schedule of node 18.
Energies 12 01902 g014
Figure 15. Voltage of the 33 nodes at time slot 40.
Energies 12 01902 g015
Figure 16. Sensitivity coefficients of nodes 14, 15, 16, 17, 18, and 33.
Energies 12 01902 g016
Figure 17. Voltage condition and OLTC operation of Case 1 and Case 4 using the model of Reference [23].
Energies 12 01902 g017
Table 1. Controllable load (CL) properties. EV–electric vehicle.
A i [ α A i , β A i ] T A i o t   ( min ) P A i   ( kW )
1Rice cooker6:00 a.m.–8:00 a.m.450.5
2Ventilator12:00 a.m.–11:59 p.m.600.3
3Washing machine12:00 a.m.–11:59 p.m.600.4
4Air conditioner9:00 a.m.–12:00 p.m.601.5
5Rice cooker9:00 a.m.–11:00 a.m.450.5
6Air conditioner12:00 p.m.–3:00 p.m.601.5
7Rice cooker3:00 p.m.–6:00 p.m.450.5
8Dish washer8:00 p.m.–6:00 a.m.450.6
9EV6:00 p.m.–6:00 a.m.3603
Table 2. Simulation results before on-load tap changer (OLTC) operation of the four cases. TCCU–total capacity of CLS utilized.
Case NumberOptimization TimeUnder-Voltage InstancesOver-Voltage InstancesTCCU
1-27219-
20.012114019.13
32.6150032.05
40.1170024.78
Table 3. Voltage and selected CL powers. VSM—voltage sensitivity method; VRSA—voltage ranking search algorithm.
Node Number141516171833
Voltage (per unit (pu))1.101.111.111.121.121.10
Selected CL power (100 kW)VSM02.221.82.71.9
VRSA0001.52.70
Table 4. Sensitivity coefficients of node 17 and 18.
Node Number141516171833
Sensitivity coefficient of node 183.924.184.545.145.520.99
Sensitivity coefficient of node 173.934.194.545.155.120.99

