Communication Performance Assessment for Advanced Metering Infrastructure


Departmental of Electrical Engineering, National Sun Yat-Sen University, Kaohsiung 80424, Taiwan
*
Author to whom correspondence should be addressed.
Energies 2019, 12(1), 88; https://doi.org/10.3390/en12010088
Submission received: 28 November 2018
/
Revised: 24 December 2018
/
Accepted: 25 December 2018
/
Published: 28 December 2018
(This article belongs to the Special Issue Selected Papers from IEEE ICKII 2018)
Abstract
:Advanced Metering Infrastructure (AMI), the foundation of smart grids, can be used to provide numerous intelligent power applications and services based on the data acquired from AMI. Effective and efficient communication performance between widely-spread smart meters and Data Concentrator Units (DCUs) is one of the most important issues for the successful deployment and operation of AMI and needs to be further investigated. This paper proposes an effective Communication Performance Index (CPI) to assess and supervise the communication performance of each smart meter. Some communication quality measurements that can be easily acquired from a smart meter such as reading success rate and response time are used to design the proposed CPI. Fuzzy logic is adopted to combine these measurements to calculate the proposed CPI. The CPIs for communication paths, DCUs and whole AMI can then be derived from meter CPIs. Simulation and experimental results for small-scale AMIs demonstrate the validity of the proposed CPI. Through the calculated CPIs, the communication performance and stability for AMI can be effectively assessed and supervised.
1. Introduction
The integration of renewable energy generation into power grids has been looked upon as one of the most effective and efficient methodologies to reduce carbon emissions from energy demand increases. However, the power output of renewable energy generation is quite stochastic with high uncertainty and raises difficulties in the planning and operation of power grids. Smart grids, integrated with new communication interfaces, smart sensing measurement technologies, advanced control strategies, intelligent decision supporting systems etc., are therefore considered to be the best way to facilitate the integration of renewable energy generation. A contemporary smart grid must at least include the functionalities of control and management for renewable energy generation, self-healing from power events, demand response for consumers, optimal power assent usage and management, new market service development and so on [1,2,3,4,5].
Due to the uncertainties and complexities of smart grids, the deployment of Advanced Metering Infrastructure (AMI) has been treated as the foundation for the realization of smart grids [6,7,8,9,10,11]. In general, AMI consists of smart meters, meter data management system, communication infrastructure etc. and can provide useful information based on the data acquired from smart meters to realize numerous intelligent controls and services for smart grids. For example, Reference [11] proposed two methods to discover abnormal electricity consumption by utilizing contextual and factual information from AMI, including energy consumption patterns, nature of supply and category of day to logically group meters. The AMI market has experienced a large growth in demand due to the increasing implementation of smart grid technology. The total number of smart meter installations in 2017 was close to 88.2 million and is predicted to reach a cumulative figure of over 588 million by 2022 [6]. Reference [7] forecasted that during the period 2017–2023, the worldwide AMI market is estimated to grow by 9 billion USD by 2023 at a compound annual growth rate of 14%. Some countries including the US, Japan, South Korea and so on have legislated to achieve the target of 100% smart meter deployment. In 2012–2013, an AMI pilot project with about twelve-thousand smart meters has been deployed in Taiwan. Two hundred thousand smart meters are deployed now and this will grow in the next few years to five-million meters. Effective and efficient communication performance between widely-spread smart meters and Data Concentrator Units (DCUs), the core of data management in an AMI providing the technology to measure and collect energy usage data from smart meters to the meter data management system, is one of the most important issues for the successful deployment and operation of AMI. If the communication performance and stability is poor, all AMI functionalities cannot be successfully realized [8,9,10,11,12,13,14,15,16,17,18,19,20,21,22,23,24]. Wire and wireless communications are both the commonly-used communication interfaces. Wire communication with huge construction costs has the advantage of high reliability. The conventional wireless communication techniques have the disadvantages of lower reliability, lower data rate, uncertain time-delay etc. The recent local-area-network communications such as ZigBee and Power Line Communication (PLC), also used in Taiwan’s AMI, have been verified to be suitable for the communication network of AMI between the smart meters and DCUs. Some new ZigBee and PLC techniques are still being developed, for example, Reference [15] proposed a new PLC-based smart metering architecture. The coupling interfaces were experimentally verified in a wide frequency range up to 200 kHz using different modulations.
Many papers have been published to discuss the communication deployment for AMI [12,13,14,15,16,17,18,19,20,21,22,23,24]. Most of the published papers focused on the issues of data acquisition point placement, routing protocol, delay analysis etc. for AMI communication networks [12,13,14,15,16,17,18]; however, these proposed technologies are not suitable for communication performance assessment. Few papers proposed the methodologies suitable to evaluate the communication performance before AMI deployment [19,20,21,22,23,24]; however, the question of how to supervise the communication performance continuously still needs to be further investigated. Some methodologies based on the Gale–Shapley algorithm were proposed to analyze the capacity sharing for a set of geographically distributed independent items to integrate their resources and demand forecasts for a specific production objective [25,26]. The communication performance assessment wasn’t included in the proposed capacity sharing. This paper proposed an effective Communication Performance Index (CPI) to assess on a daily basis and supervise the communication performance of each smart meter after the AMI has been implemented. Some useful communication quality measurements that can be easily acquired from a smart meter such as reading success rate and response time are used to design the proposed CPI. The reading success rate is used to record meter reading success rate on a per hour, day or month basis. A higher reading success rate usually indicates the better stability of a communication network. The response time is the elapsed time between the end of an inquiry on a DCU or meter data management system and the beginning of a response. Faster response time also implies a higher communication performance. Fuzzy logic is employed to integrate these measurements into the proposed CPI calculation. The CPIs for communication paths, DCUs and whole AMI can then be derived from meter CPIs. Simulation and experimental results for small-scale AMIs demonstrate the validity of the proposed CPI. The main contributions of this paper include:
- Using some communication quality measurements easily acquired from a smart meter to design a CPI.
- Through the calculated CPIs, the communication performance and stability of AMI can be effectively assessed and supervised.
- The proposed CPI and communication performance assessment would be supportive of the future deployment and operation of AMI.
2. Design of an Effective CPI
Many communication quality parameters such as the link quality indicator, received signal strength indicator, signal-to-noise ratio, reading error rate etc. are commonly used to define the performance of a communication network. However, the response time of a smart meter is an essential factor to determine the response speed of the smart meter in the communication network. Besides, the reading success rate of a smart meter, used to make sure whether the reading process was successful, is also an important factor for observing the stability of a communication network. The response time and reading success rate are easily acquired from a smart meter and therefore are adopted in this paper to assess the communication performance. The CPI adopting those factors for a single smart meter is derived first, the CPIs for DCUs and AMI are then developed. Most smart meters in an AMI provide meter data every 15 min; therefore, the total reading number is 96 in a day. If the meter data are completely received by the meter data management system, then it will be counted as a successful reading. The reading success rate of a smart meter in a period of one day can be expressed as
where NRS is the number of reading successes. RSR(%) is the reading success rate. If the number of reading successes is 95, the reading success rate is 98.96%.
The average response time of a day can also be calculated by
where RT(ms) is the average response time. RT(i) is the response time for the ith reading success. is the set of reading success number in a day.
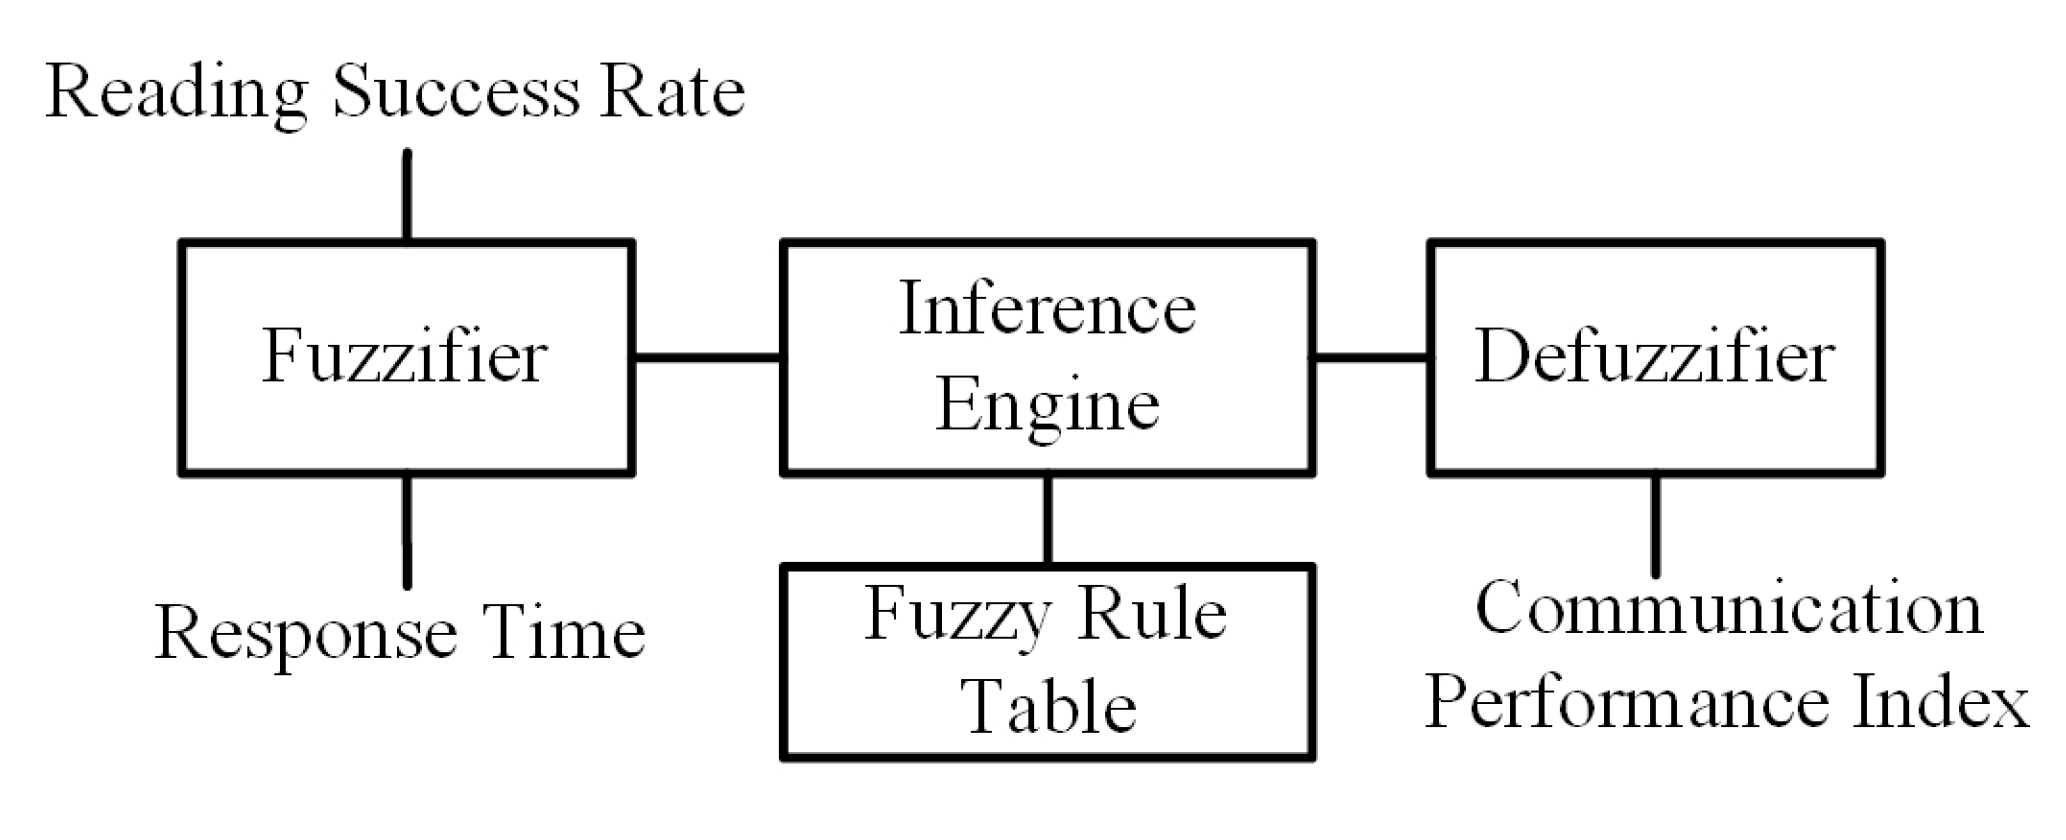
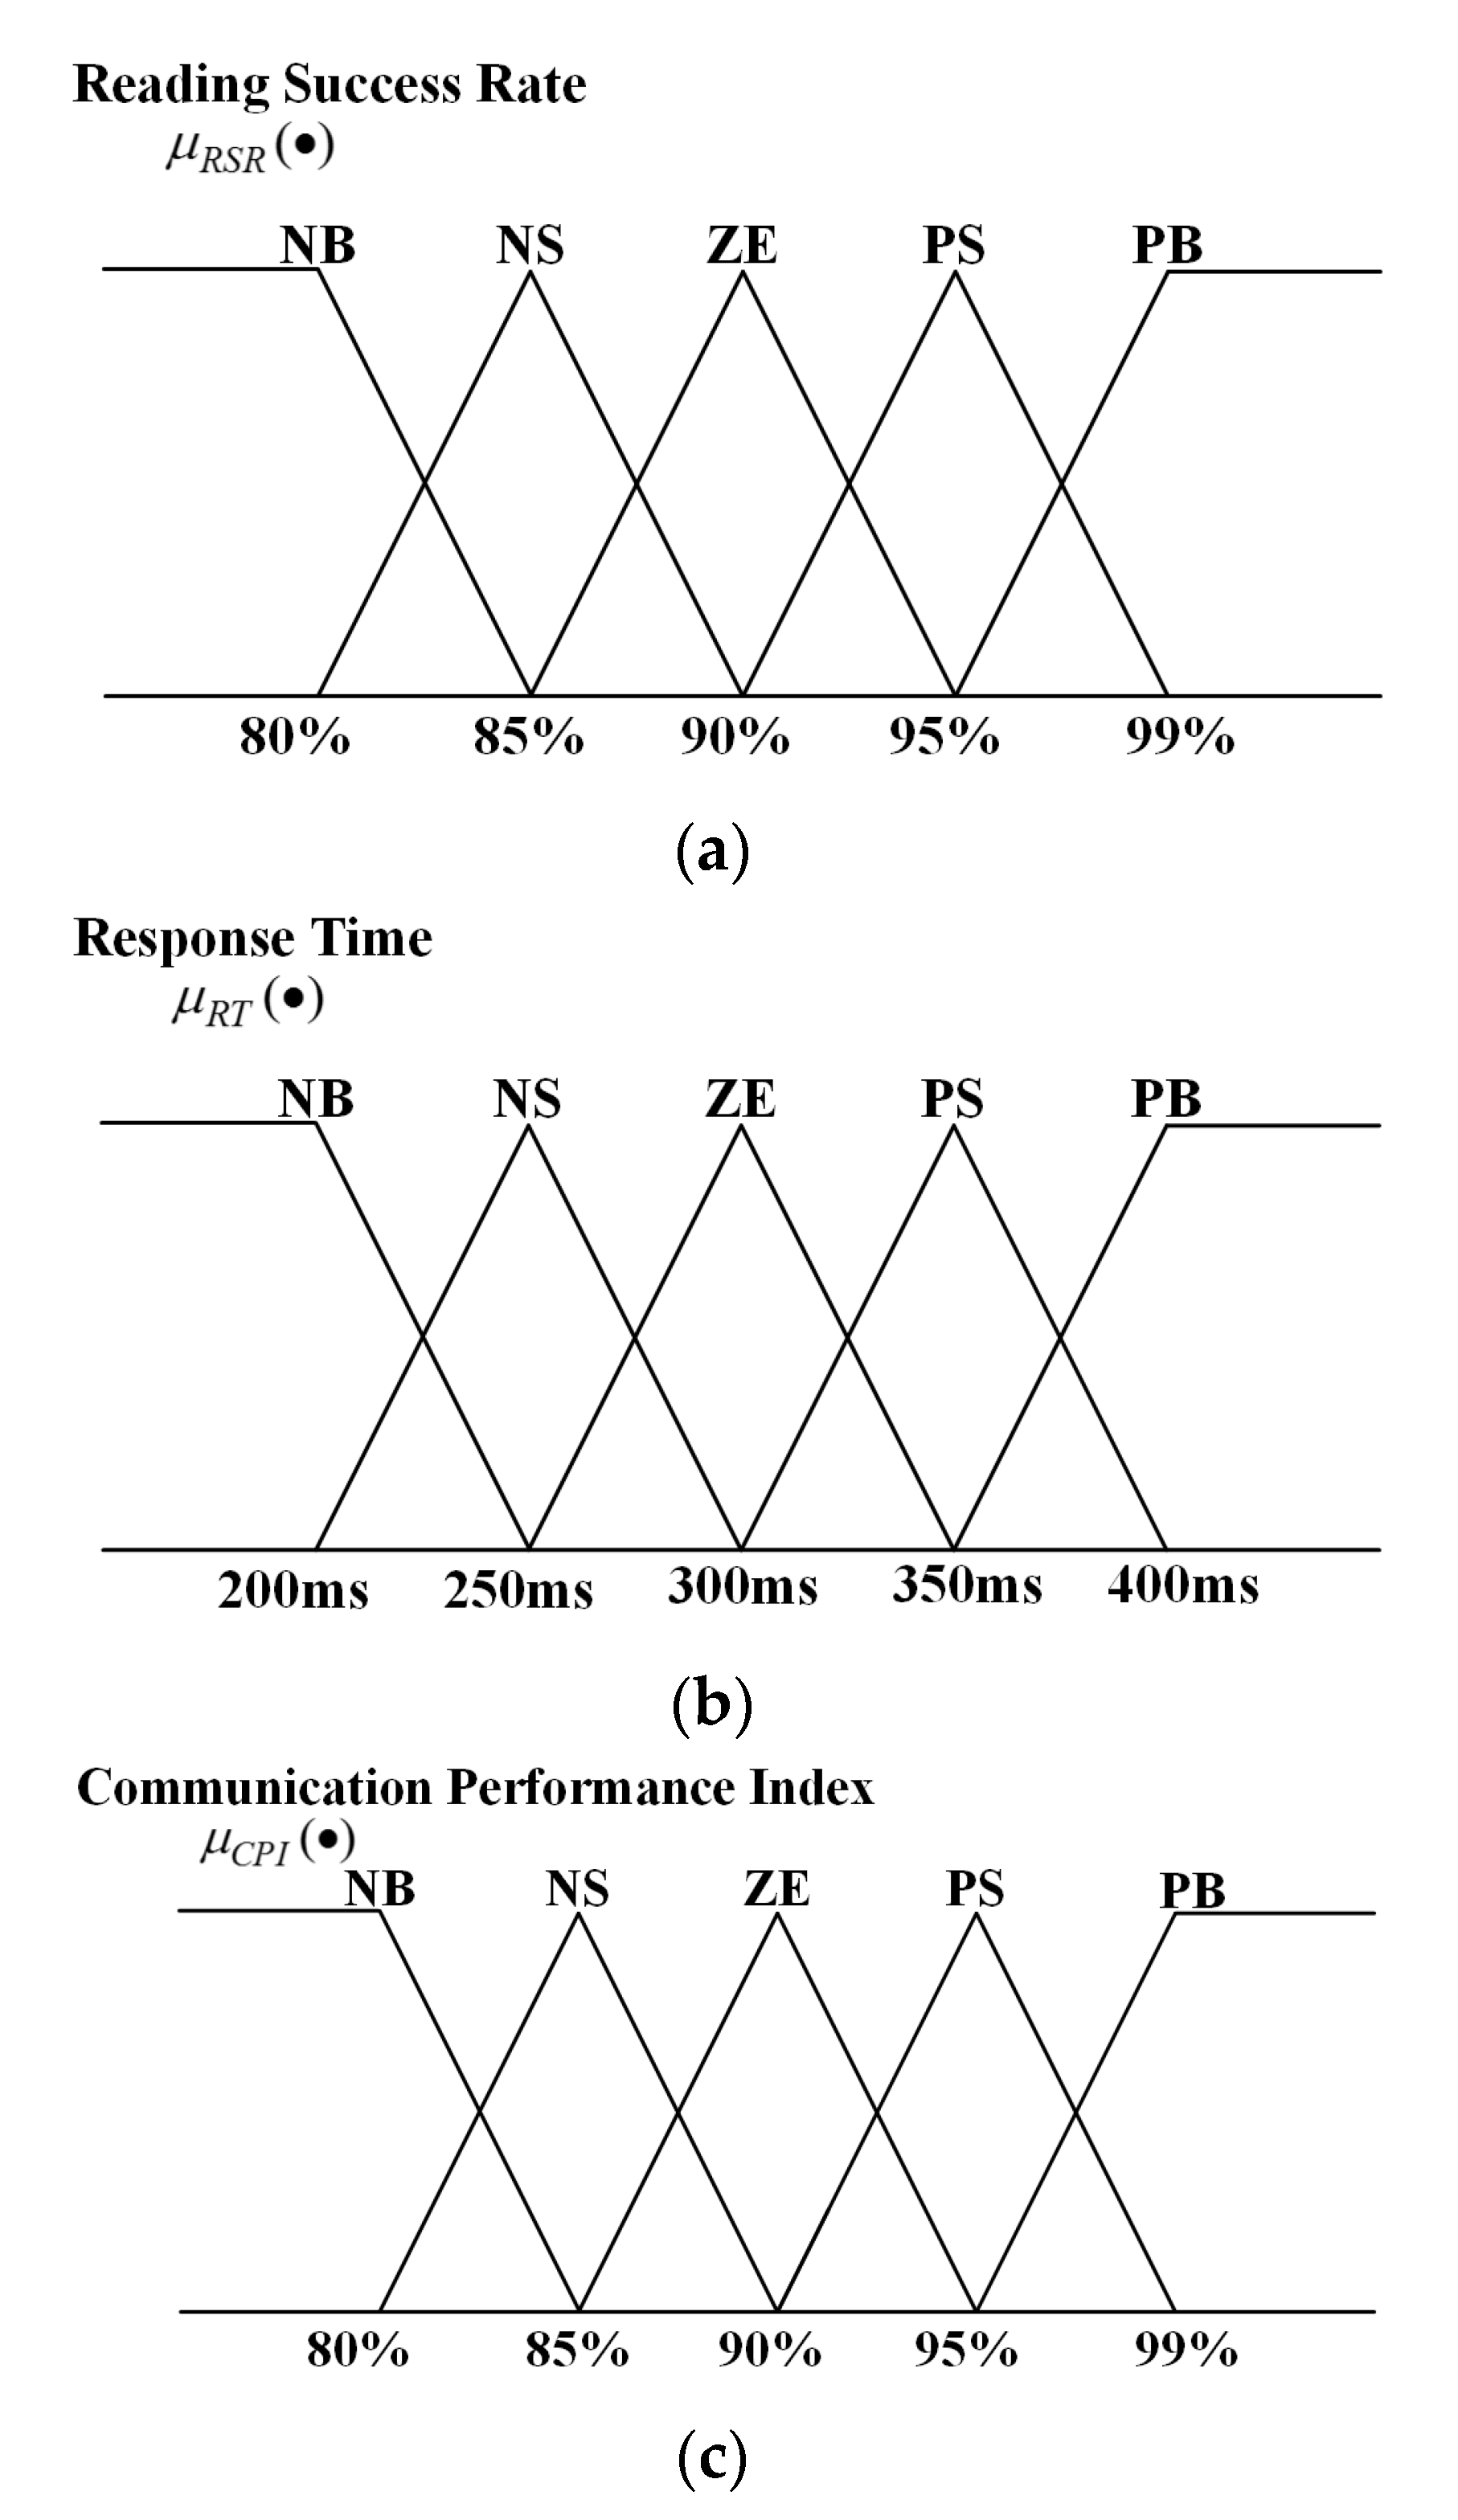
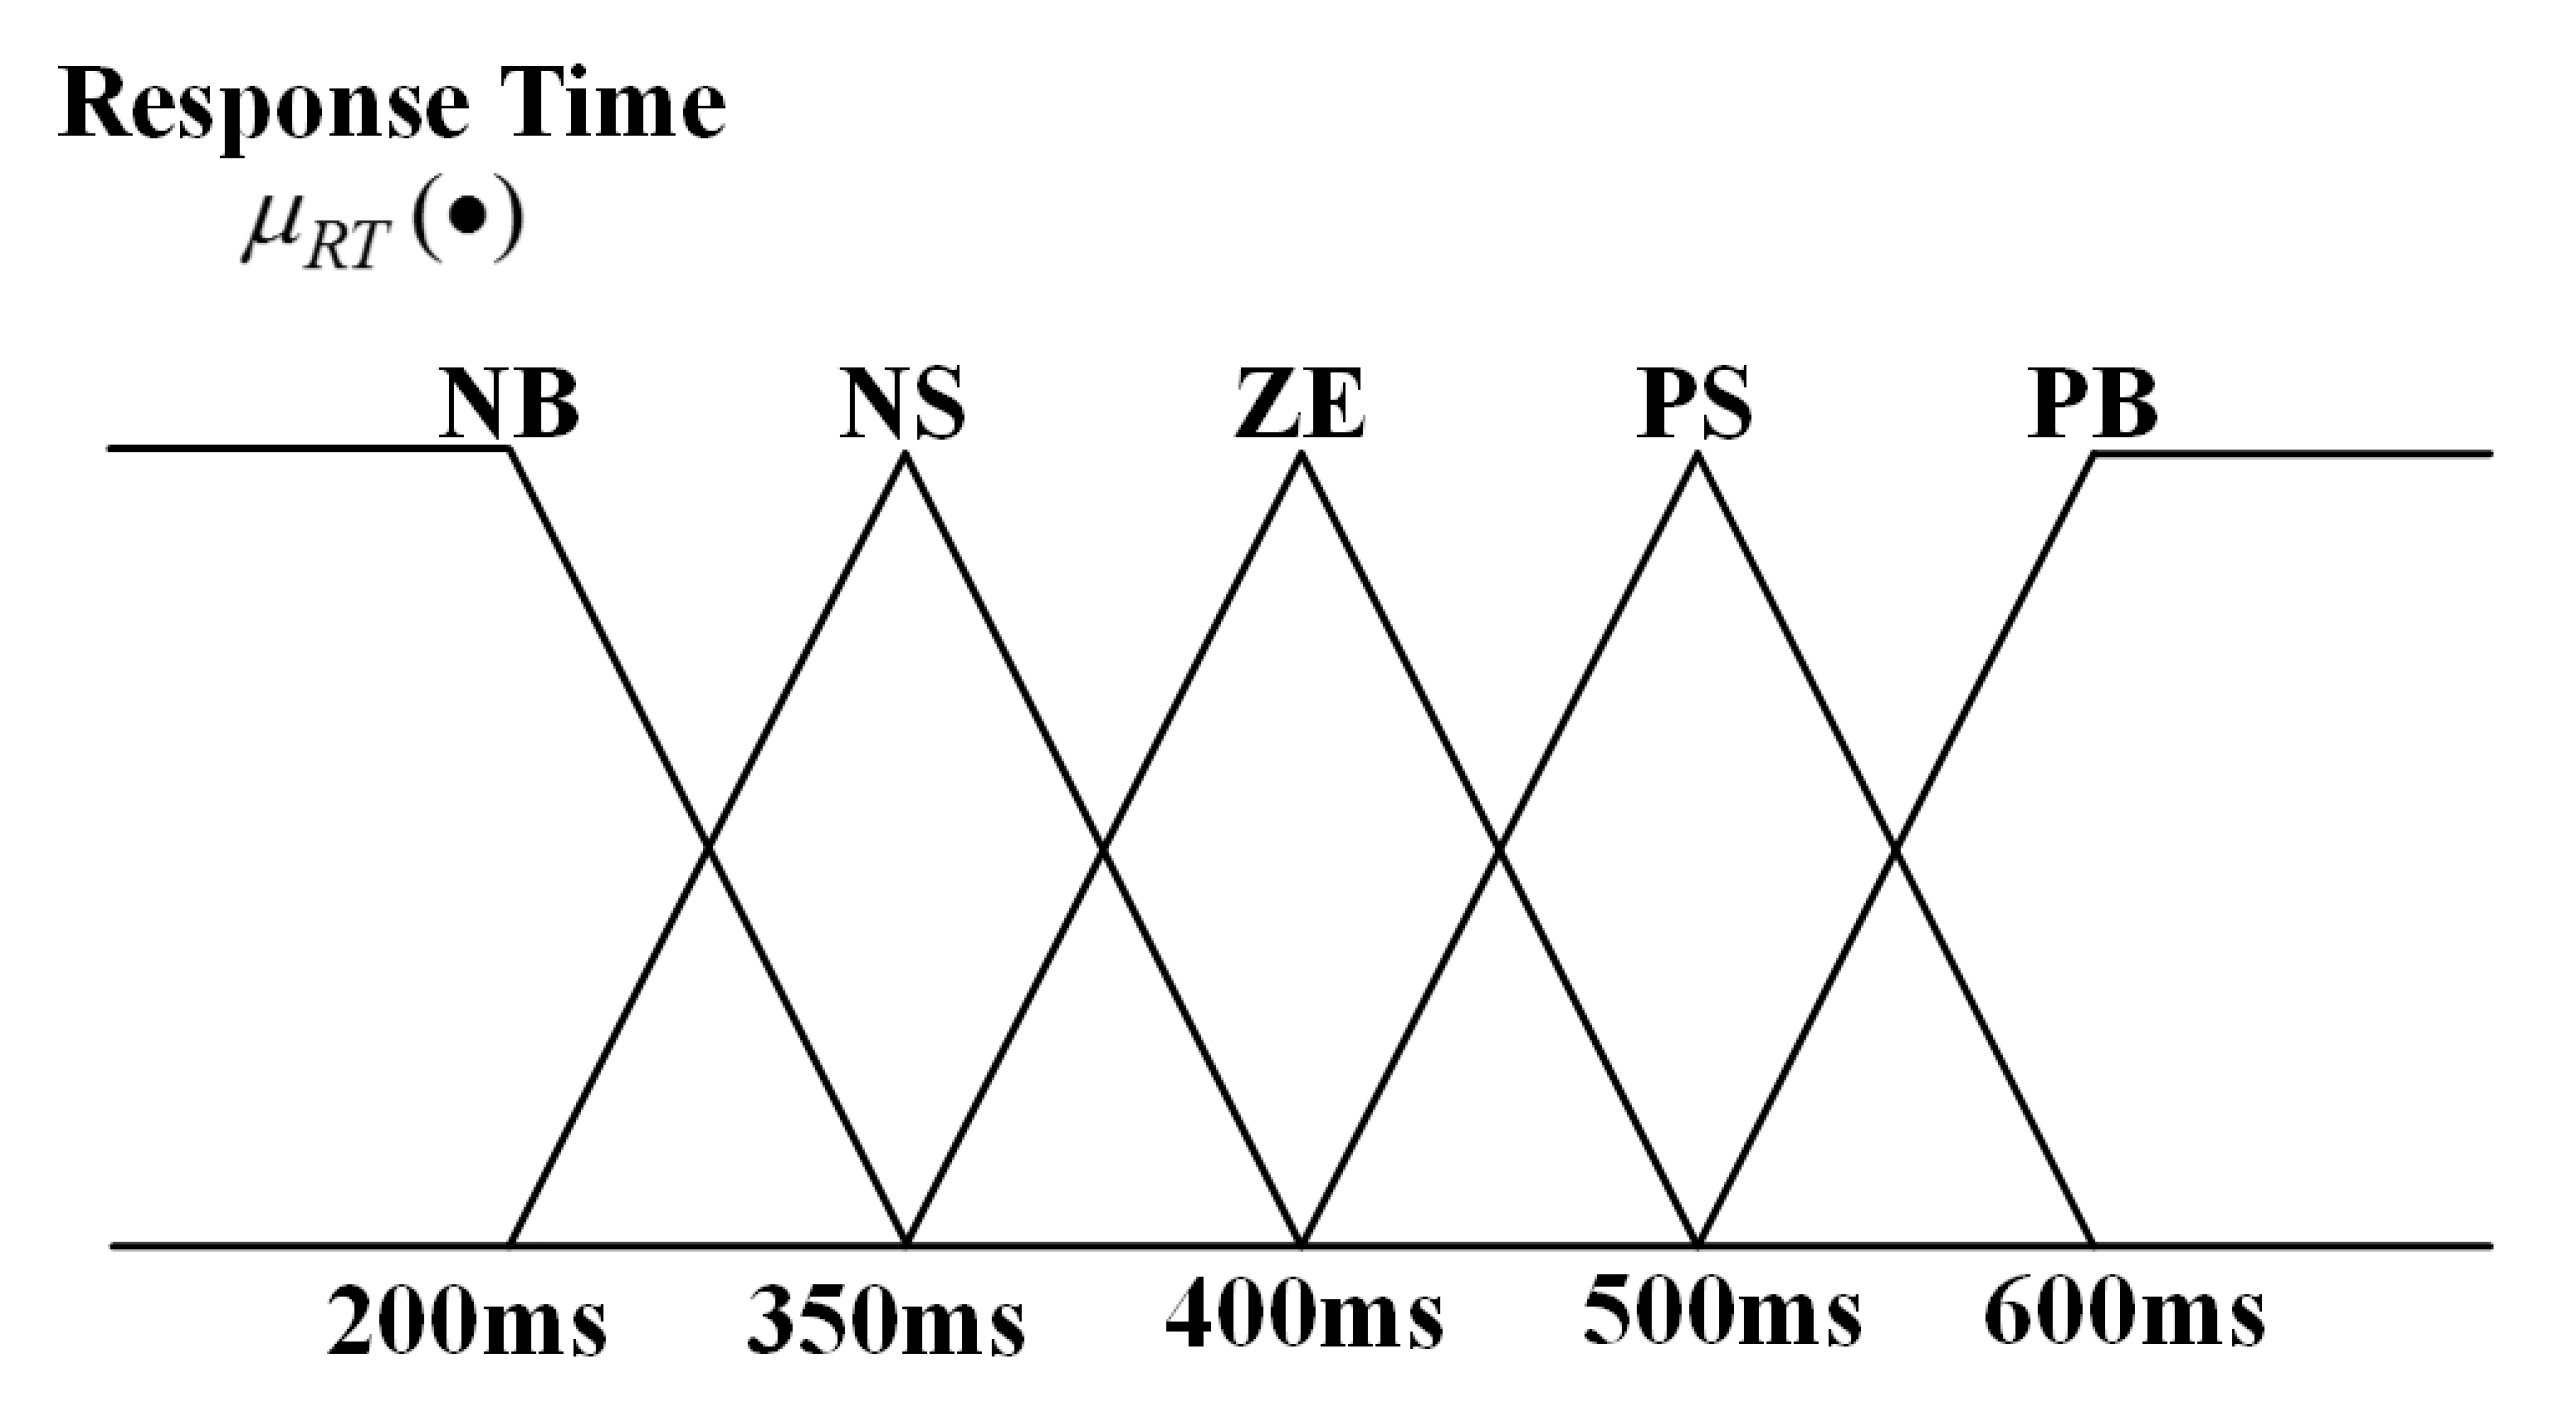
Since at least daily response time and reading success rate acquired from a smart meter are adopted to assess the CPI and the absolute correlation between these two factors is difficult to undoubtedly determine, fuzzy logic is employed in this paper to integrate these two factors into the proposed CPI calculation. Fuzzy logic has been widely used in solving many industrial control and quality problems [27,28,29,30]. Figure 1 shows the procedures of fuzzy logic realized for the proposed CPI. The reading success rate and response time of a smart meter are used as input variables and passed through the fuzzifier. The fuzzy rules and inference engine act like an expert to adjust the weightings between the input variables and then the defuzzifier scores the CPI for the meter. A triangular membership function with five levels, Negative Big (NB), Negative Small (NS), Zero (ZE), Positive Small (PS) and Positive Big (PB), is used in this paper. Figure 2 illustrates the membership functions used to fuzzify and defuzzify the input and the output variables. , and in Figure 2 indicate the membership functions for reading success rate, response time and CPI of a meter, respectively. As an example, the membership functions of reading success rate and response time are in the range of 80% to 99% and in the range of 200 ms to 400 ms, respectively. Note that the ranges can be adjusted according to the actual communication network used. Variable membership functions including Gaussian, trapezoidal, polynomial etc. can also be adopted in calculating CPI without modifying the proposed procedures.
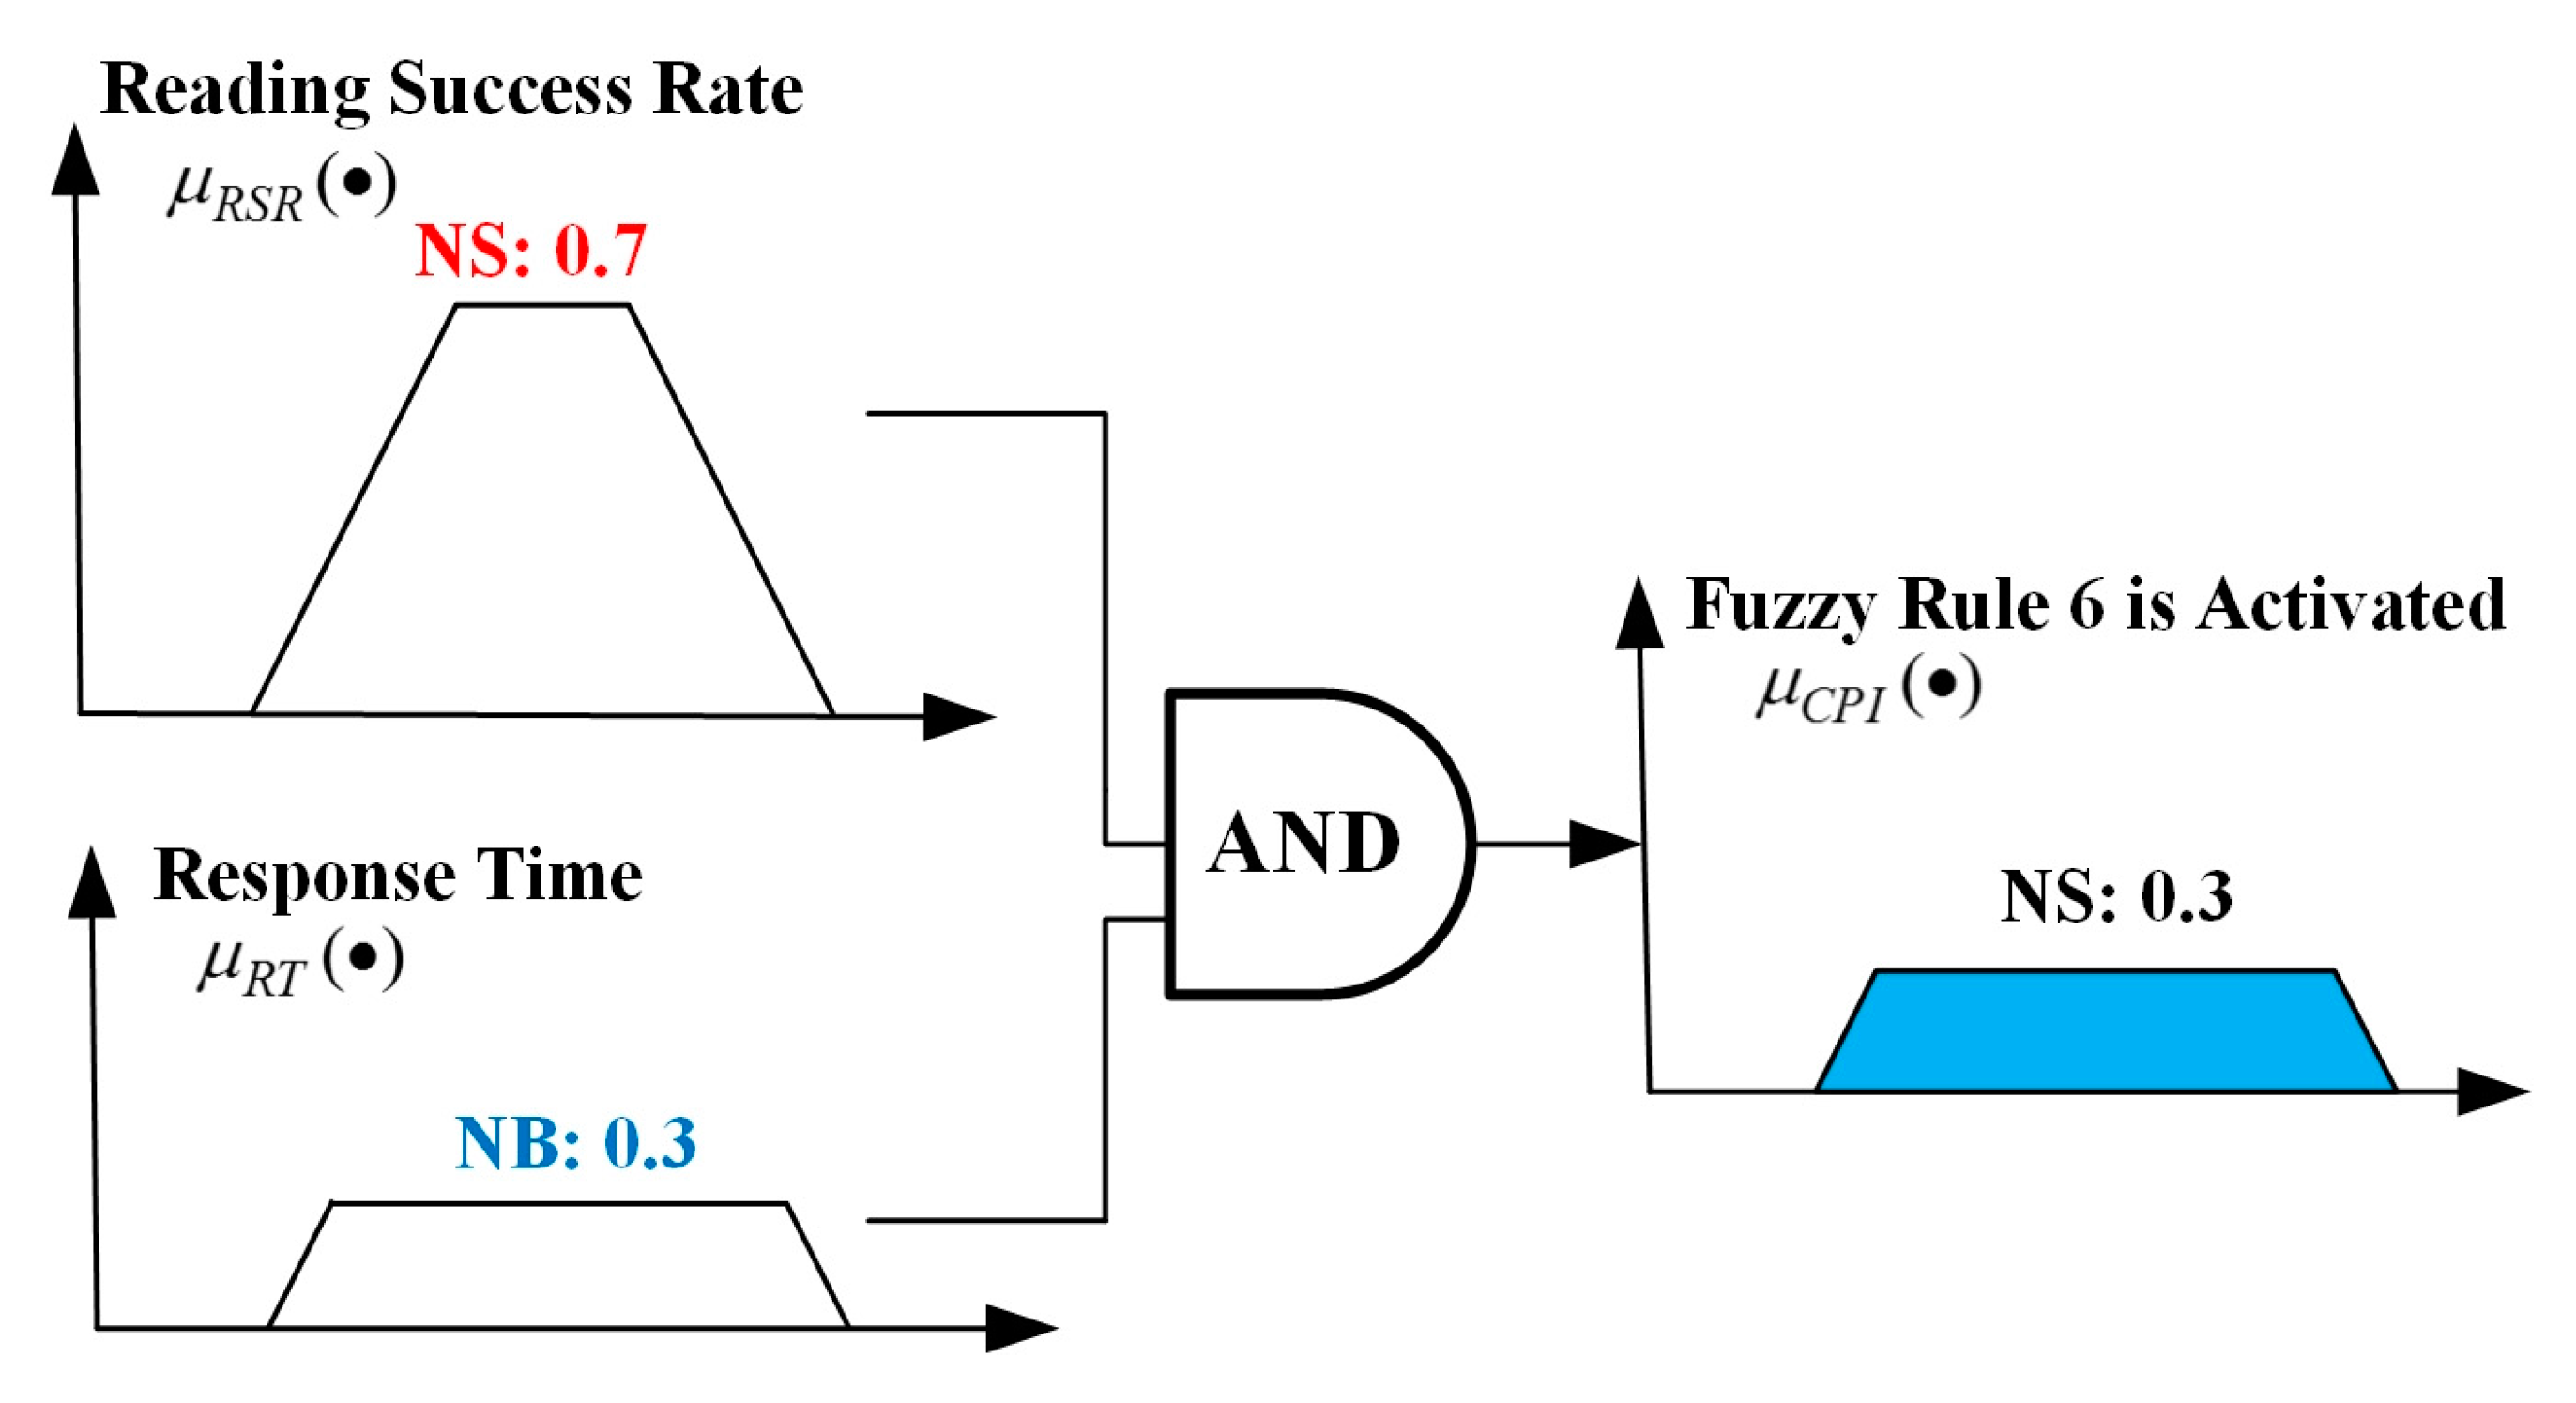
Table 1 illustrates the fuzzy rules for the proposed CPI. The basic concept of fuzzy rules is that a higher reading success rate and lower response time should have a higher CPI. A minimum inference engine and center of gravity defuzzifier are used in this paper. Figure 3 shows the concept of a minimum inference engine. An example of this is if Rule 6 is activated and the values of and are NS of 0.7 and NB of 0.3, respectively. The minimum inference engine picks the smaller of the two; therefore, the result of Rule 6 will be NS of 0.3. The CPI defuzzified by center of gravity can be calculated by
A simple example with a reading success rate of 98% and response time of 260 ms, respectively is used to describe how to calculate the proposed CPI. Figure 4 shows the results through the fuzzifier. From Figure 4, it can be observed that the values of are PB of 0.75 and PS of 0.25 and the values of are NS of 0.8 and ZE of 0.2. From Table 2, it can be observed that Rule 17, Rule 18, Rule 22 and Rule 23 are activated and the results obtained from minimum inference engine are
Rule 17: PS = min(0.25, 0.80) = 0.25
Rule 18: ZE = min(0.25, 0.20) = 0.20
Rule 22: PB = min(0.85, 0.80) = 0.80
Rule 23: PS = min(0.85, 0.20) = 0.20
3. Communication Performance Assessment for AMI
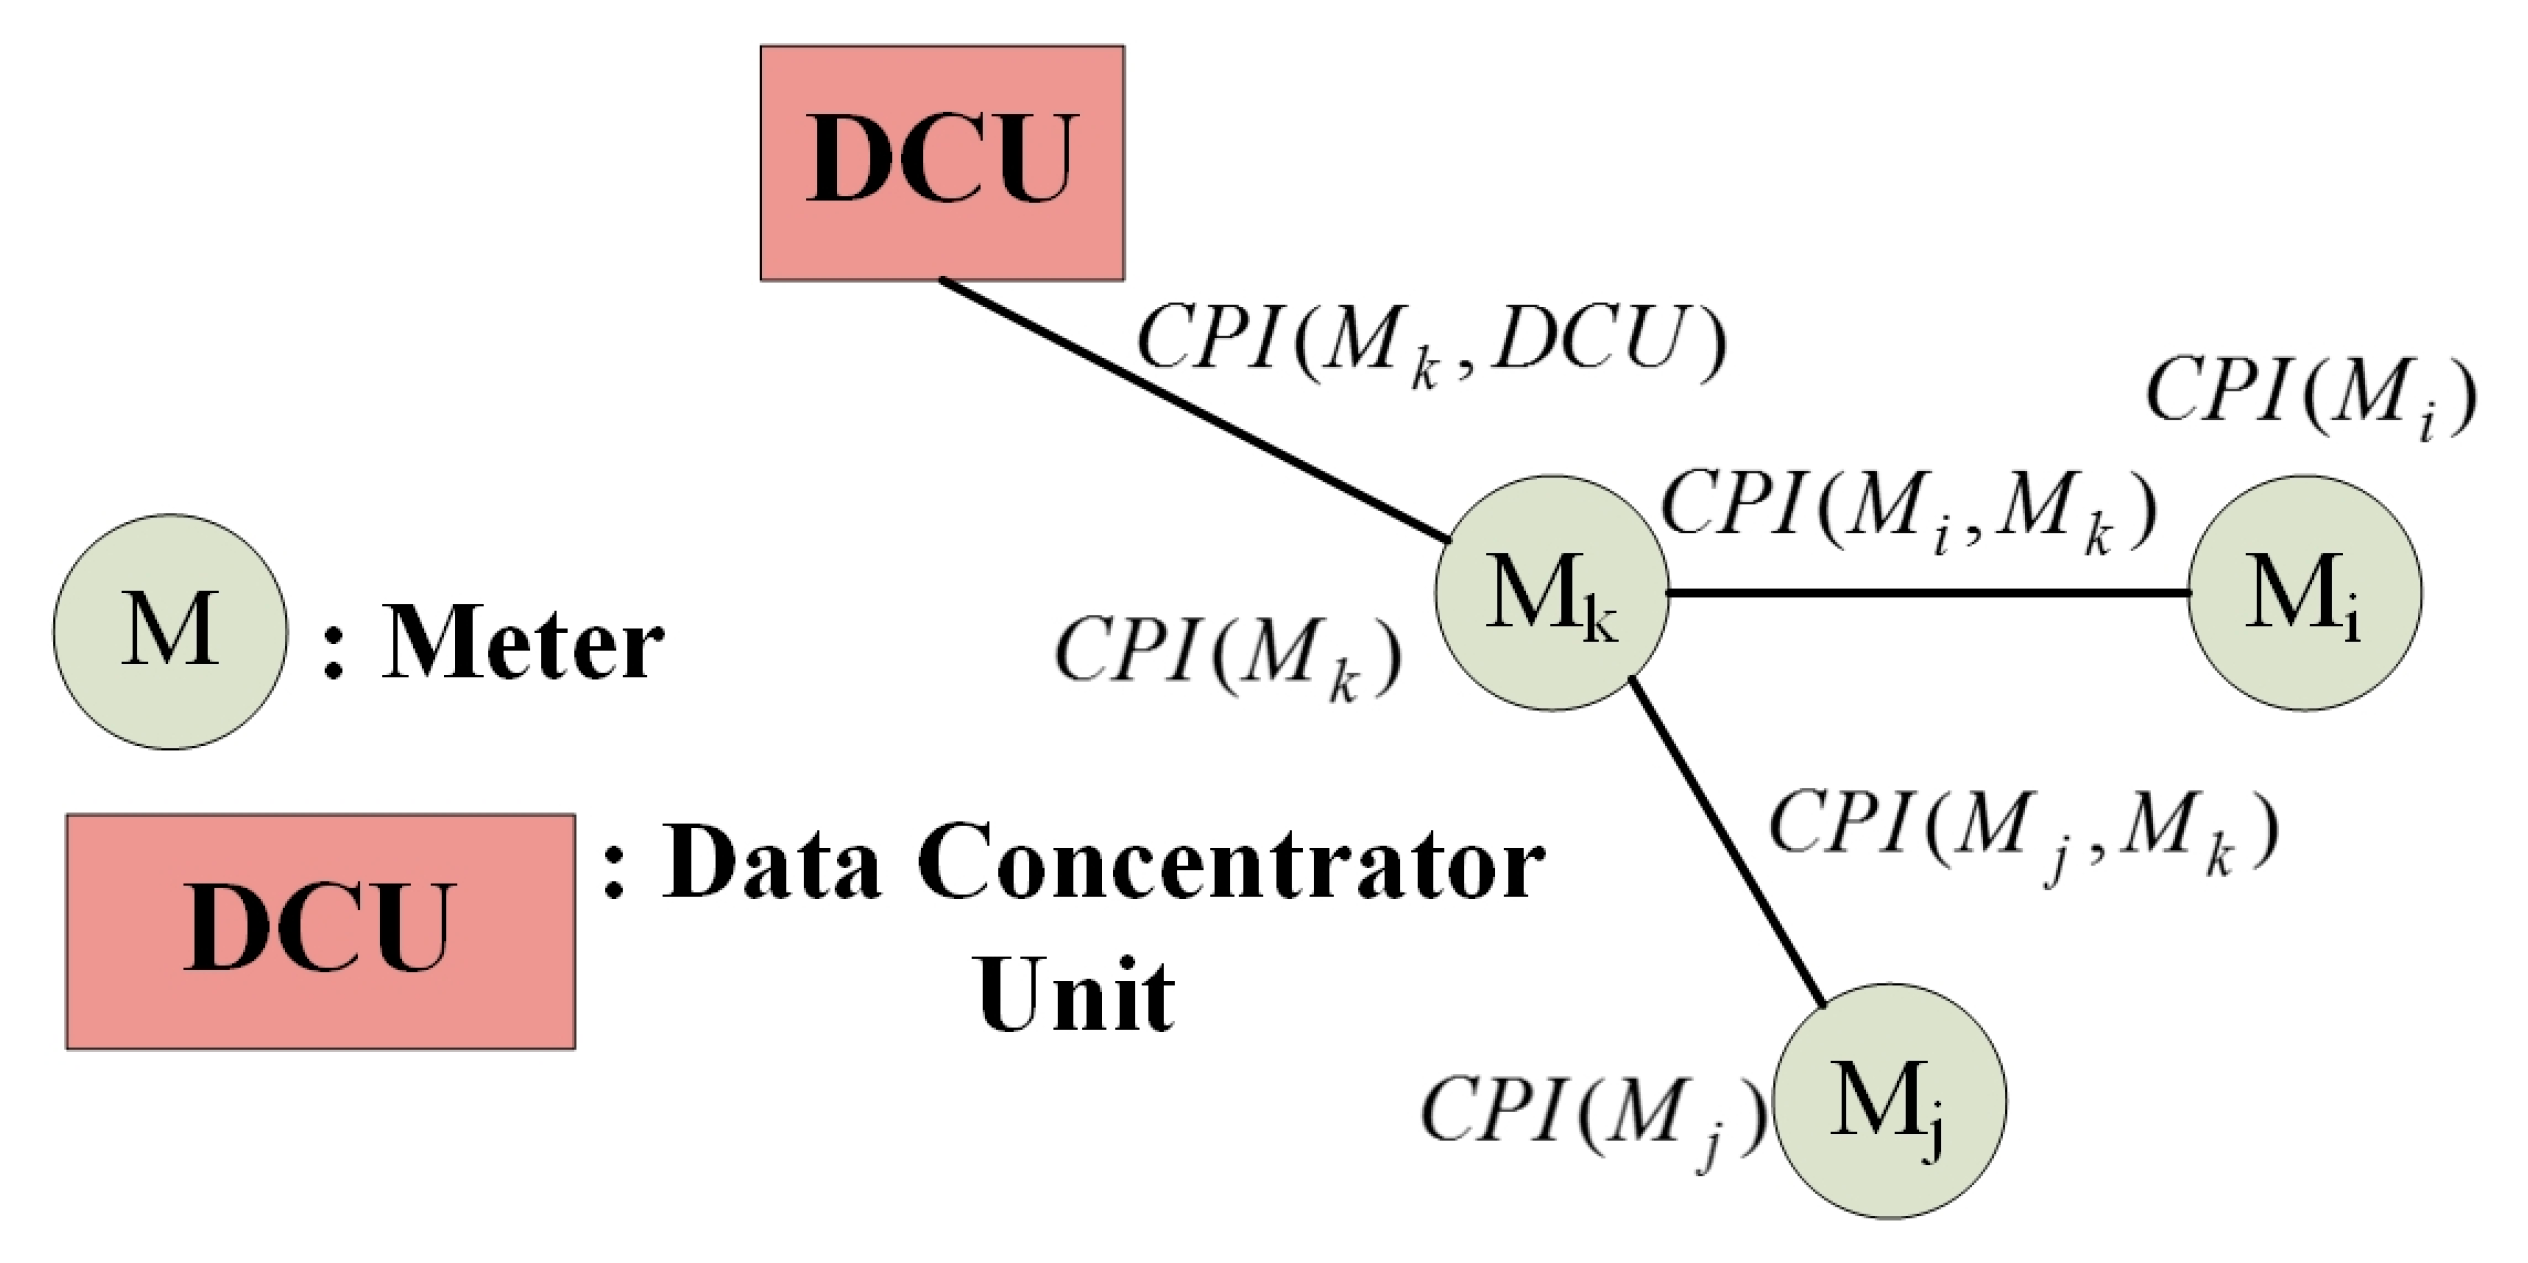
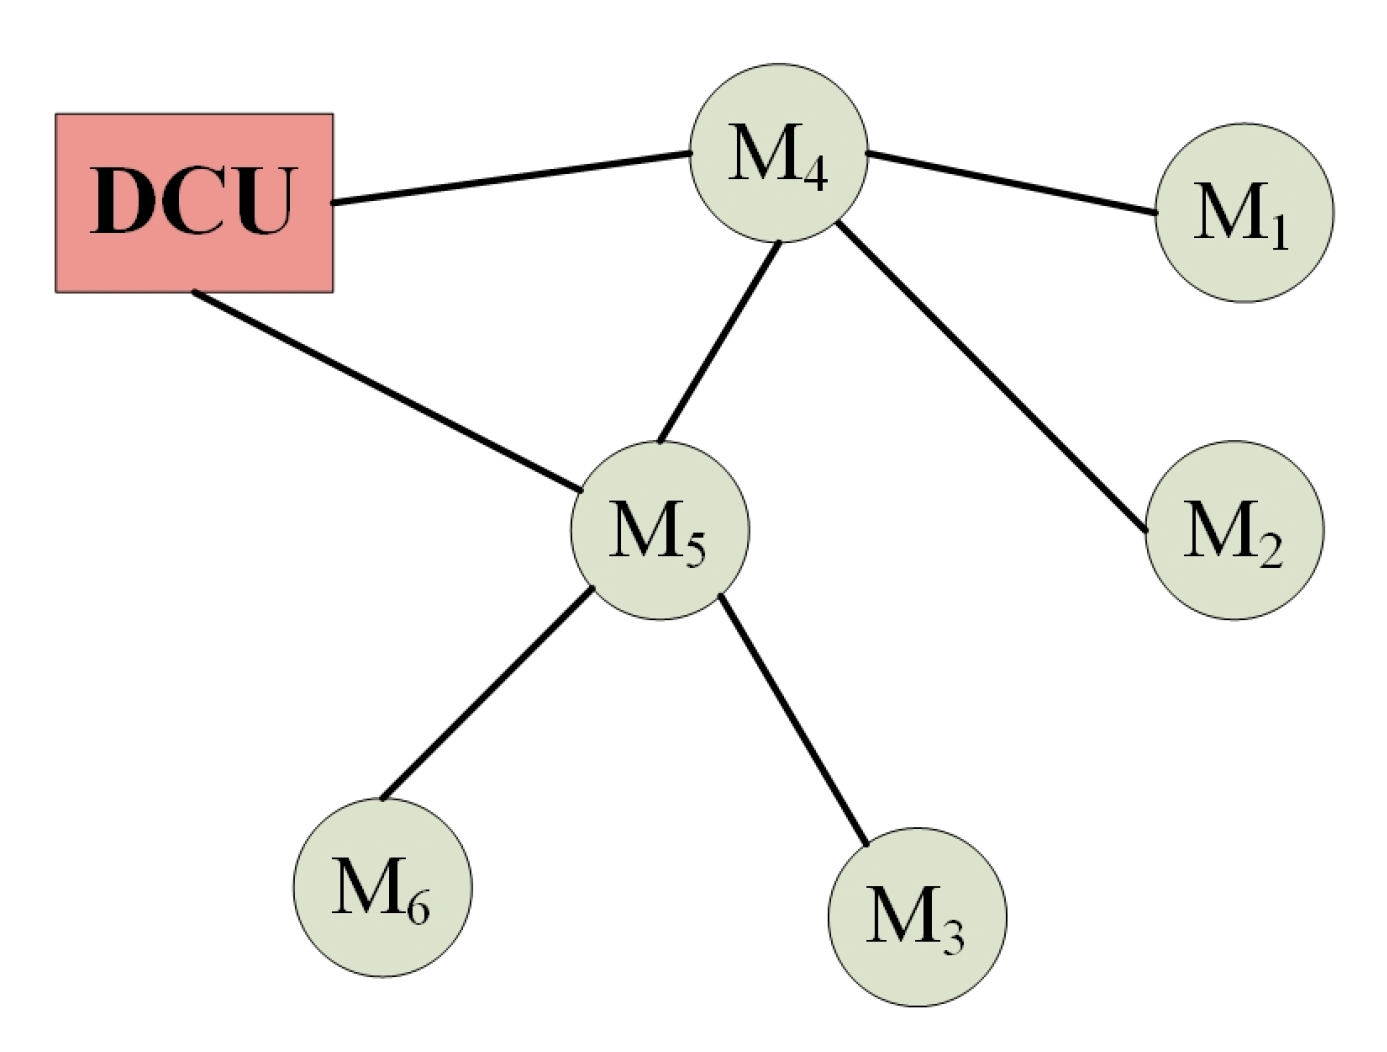
Through the proposed CPI of a smart meter, the CPI for the communication path between the meters can also be calculated. Using Figure 6 as an example, it can be obviously seen that the CPIs for communication paths between smart meters Mi and Mk and smart meters Mj and Mk are equal to the CPIs of Mi and Mj, respectively. Therefore, the CPIs for communication paths between smart meters Mi and Mk and smart meters Mj and Mk can be expressed as
where is the calculated CPI for smart meter Mx. is the CPI for the communication path between smart meters Mx and My.
A smart meter needs to send its own meter data to DCU; therefore, smart meter Mk will act like a router and transmit the meter data received from smart meters Mi and Mj to DCU. The CPI for the communication path between DCU and smart meter Mk can be calculated by the geometric average and is expressed as
where is the number of data transmission from meter Mx.
Obviously, in Figure 6 can be determined as the CPI of this DCU.
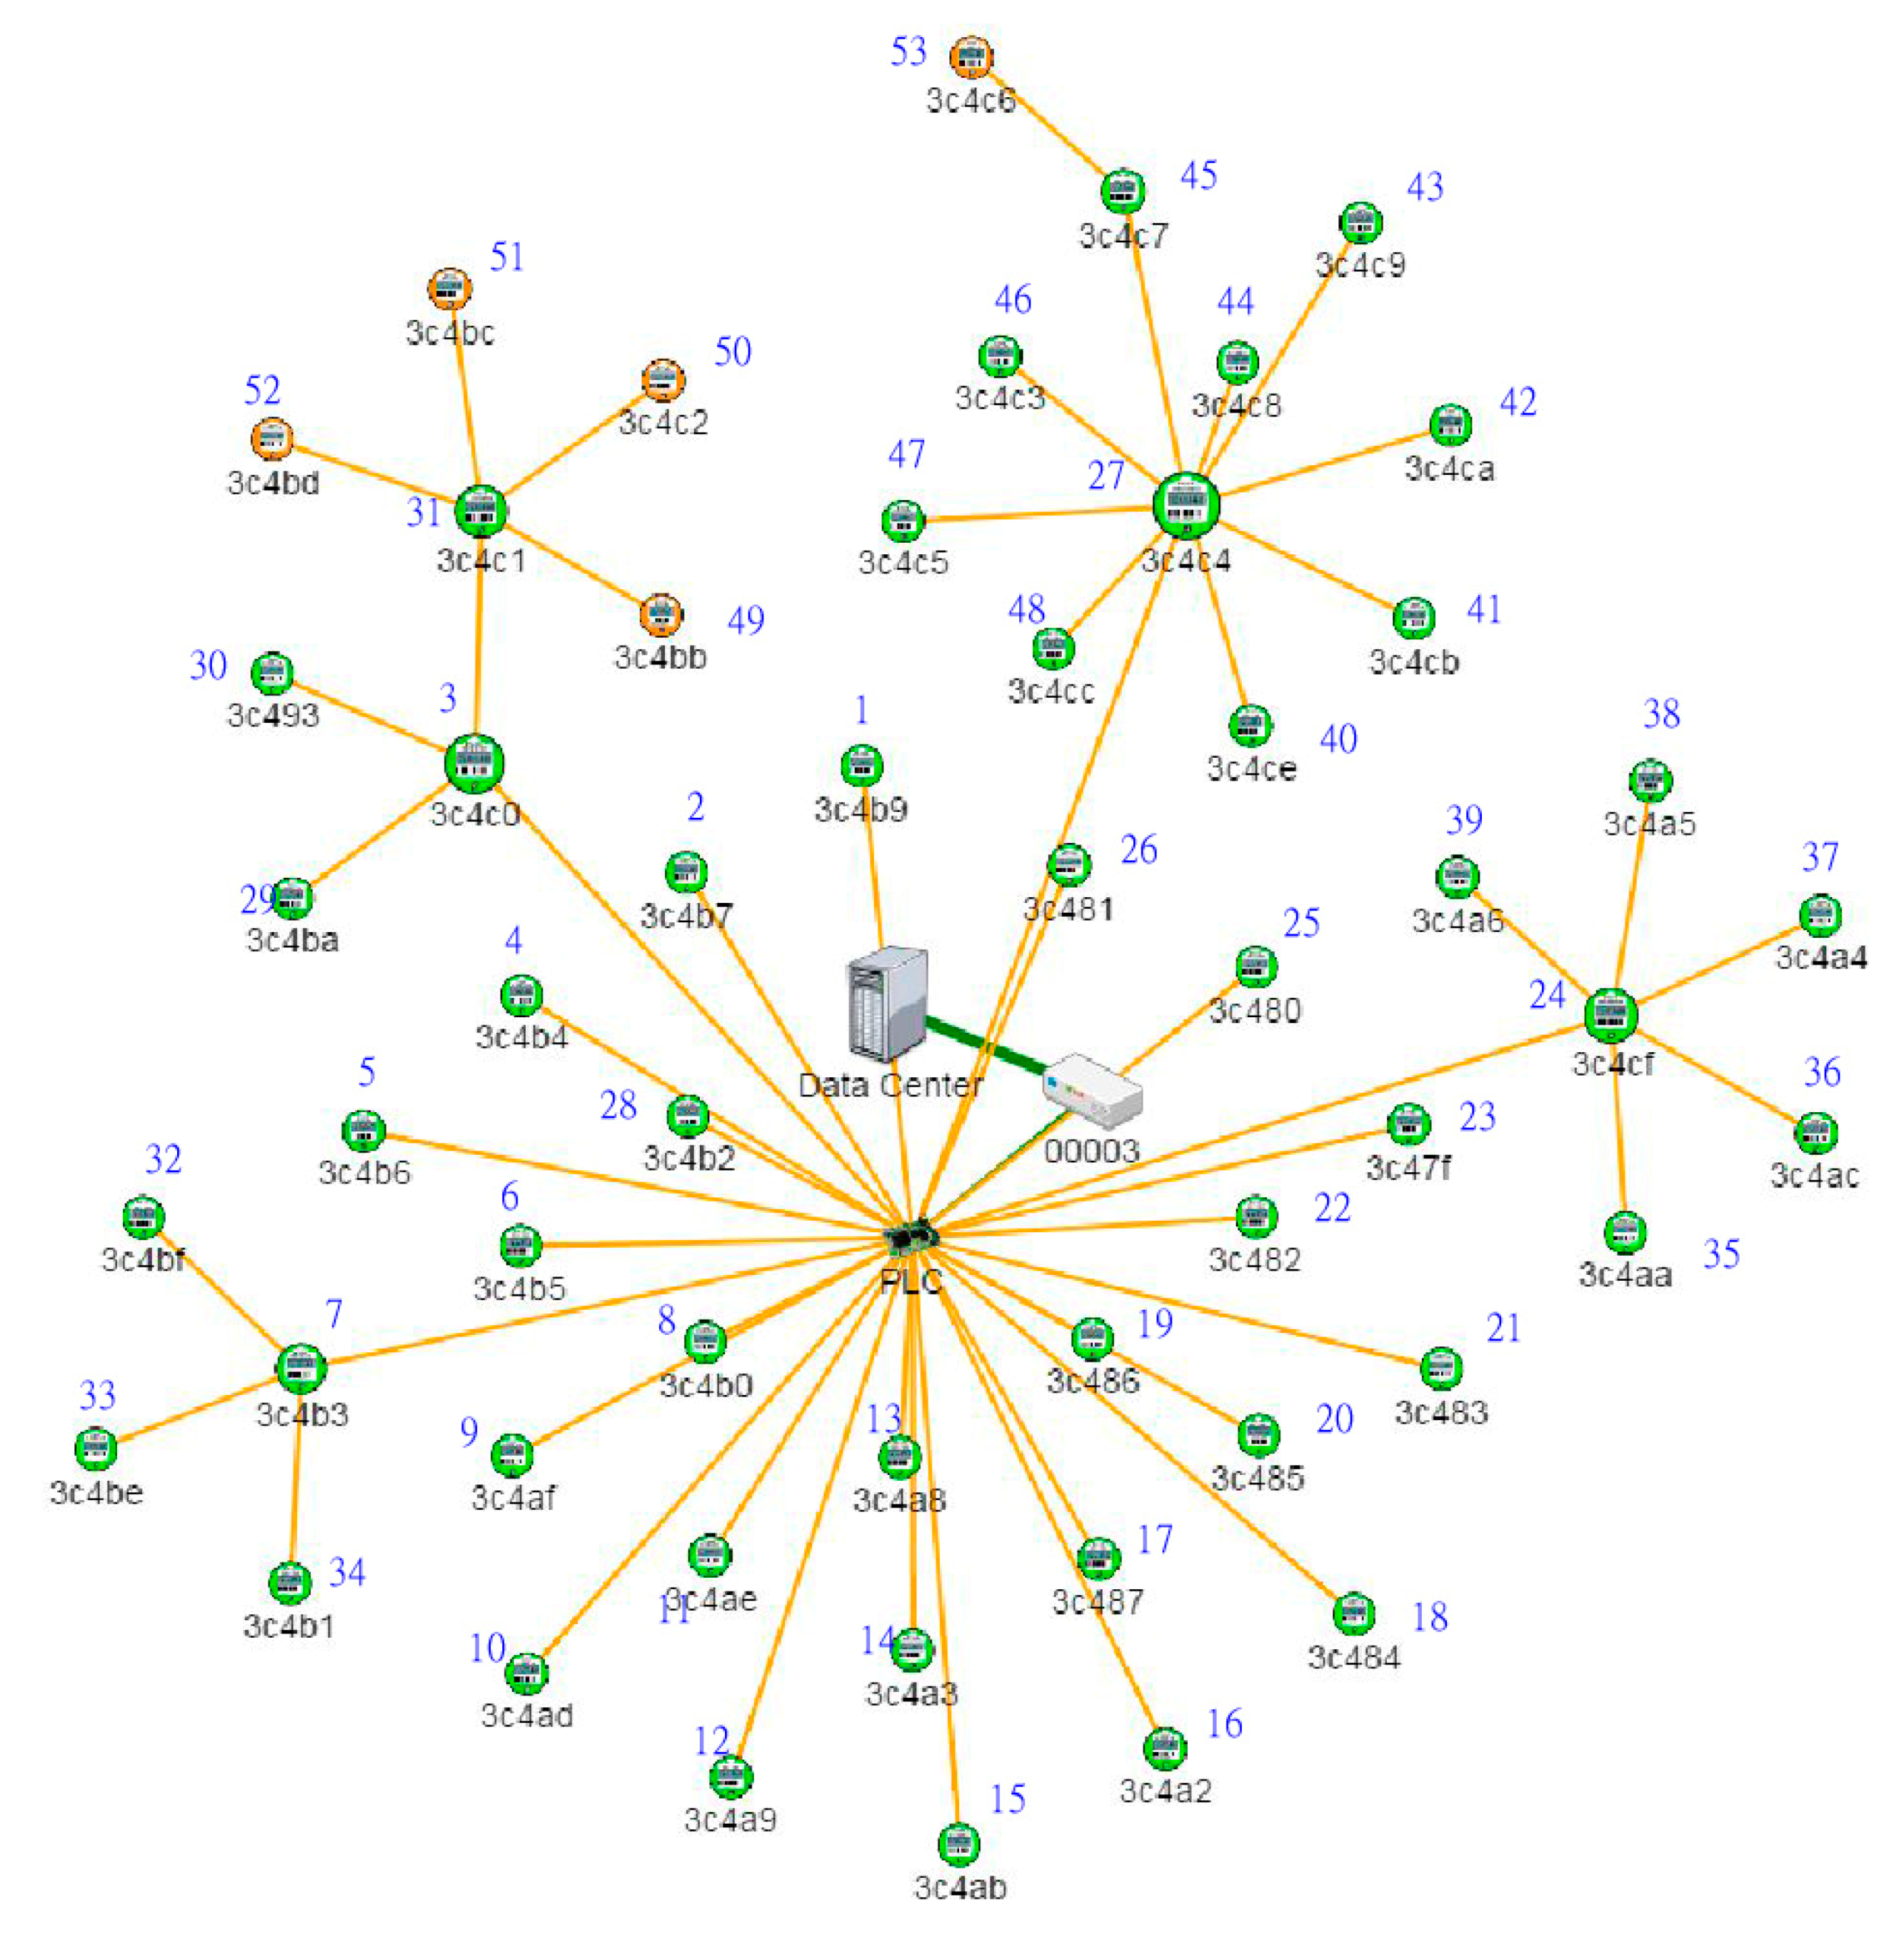
The above-mentioned procedure can be easily extended to assess the communication performance of an actual AMI. Figure 7 shows an actual small-scale PLC-based AMI acquired from the Institute for Information Industry of Taiwan, the CPI of each communication path can be calculated by
where indicates the meter set using the communication path between smart meter Mx and My to transmit data to DCU. is the number of data transmission for smart meter Mm belonging to and using the communication path between smart meters Mx and My.
The CPI of each smart meter can be assessed first and then the CPIs for the communication paths, DCUs and whole AMI can be calculated accordingly based on the CPIs of smart meters. With the proposed communication performance assessment, the communication performance and stability for an AMI can be effectively supervised.
4. Simulation and Experimental Results
4.1. A Simple Six-Meter Case
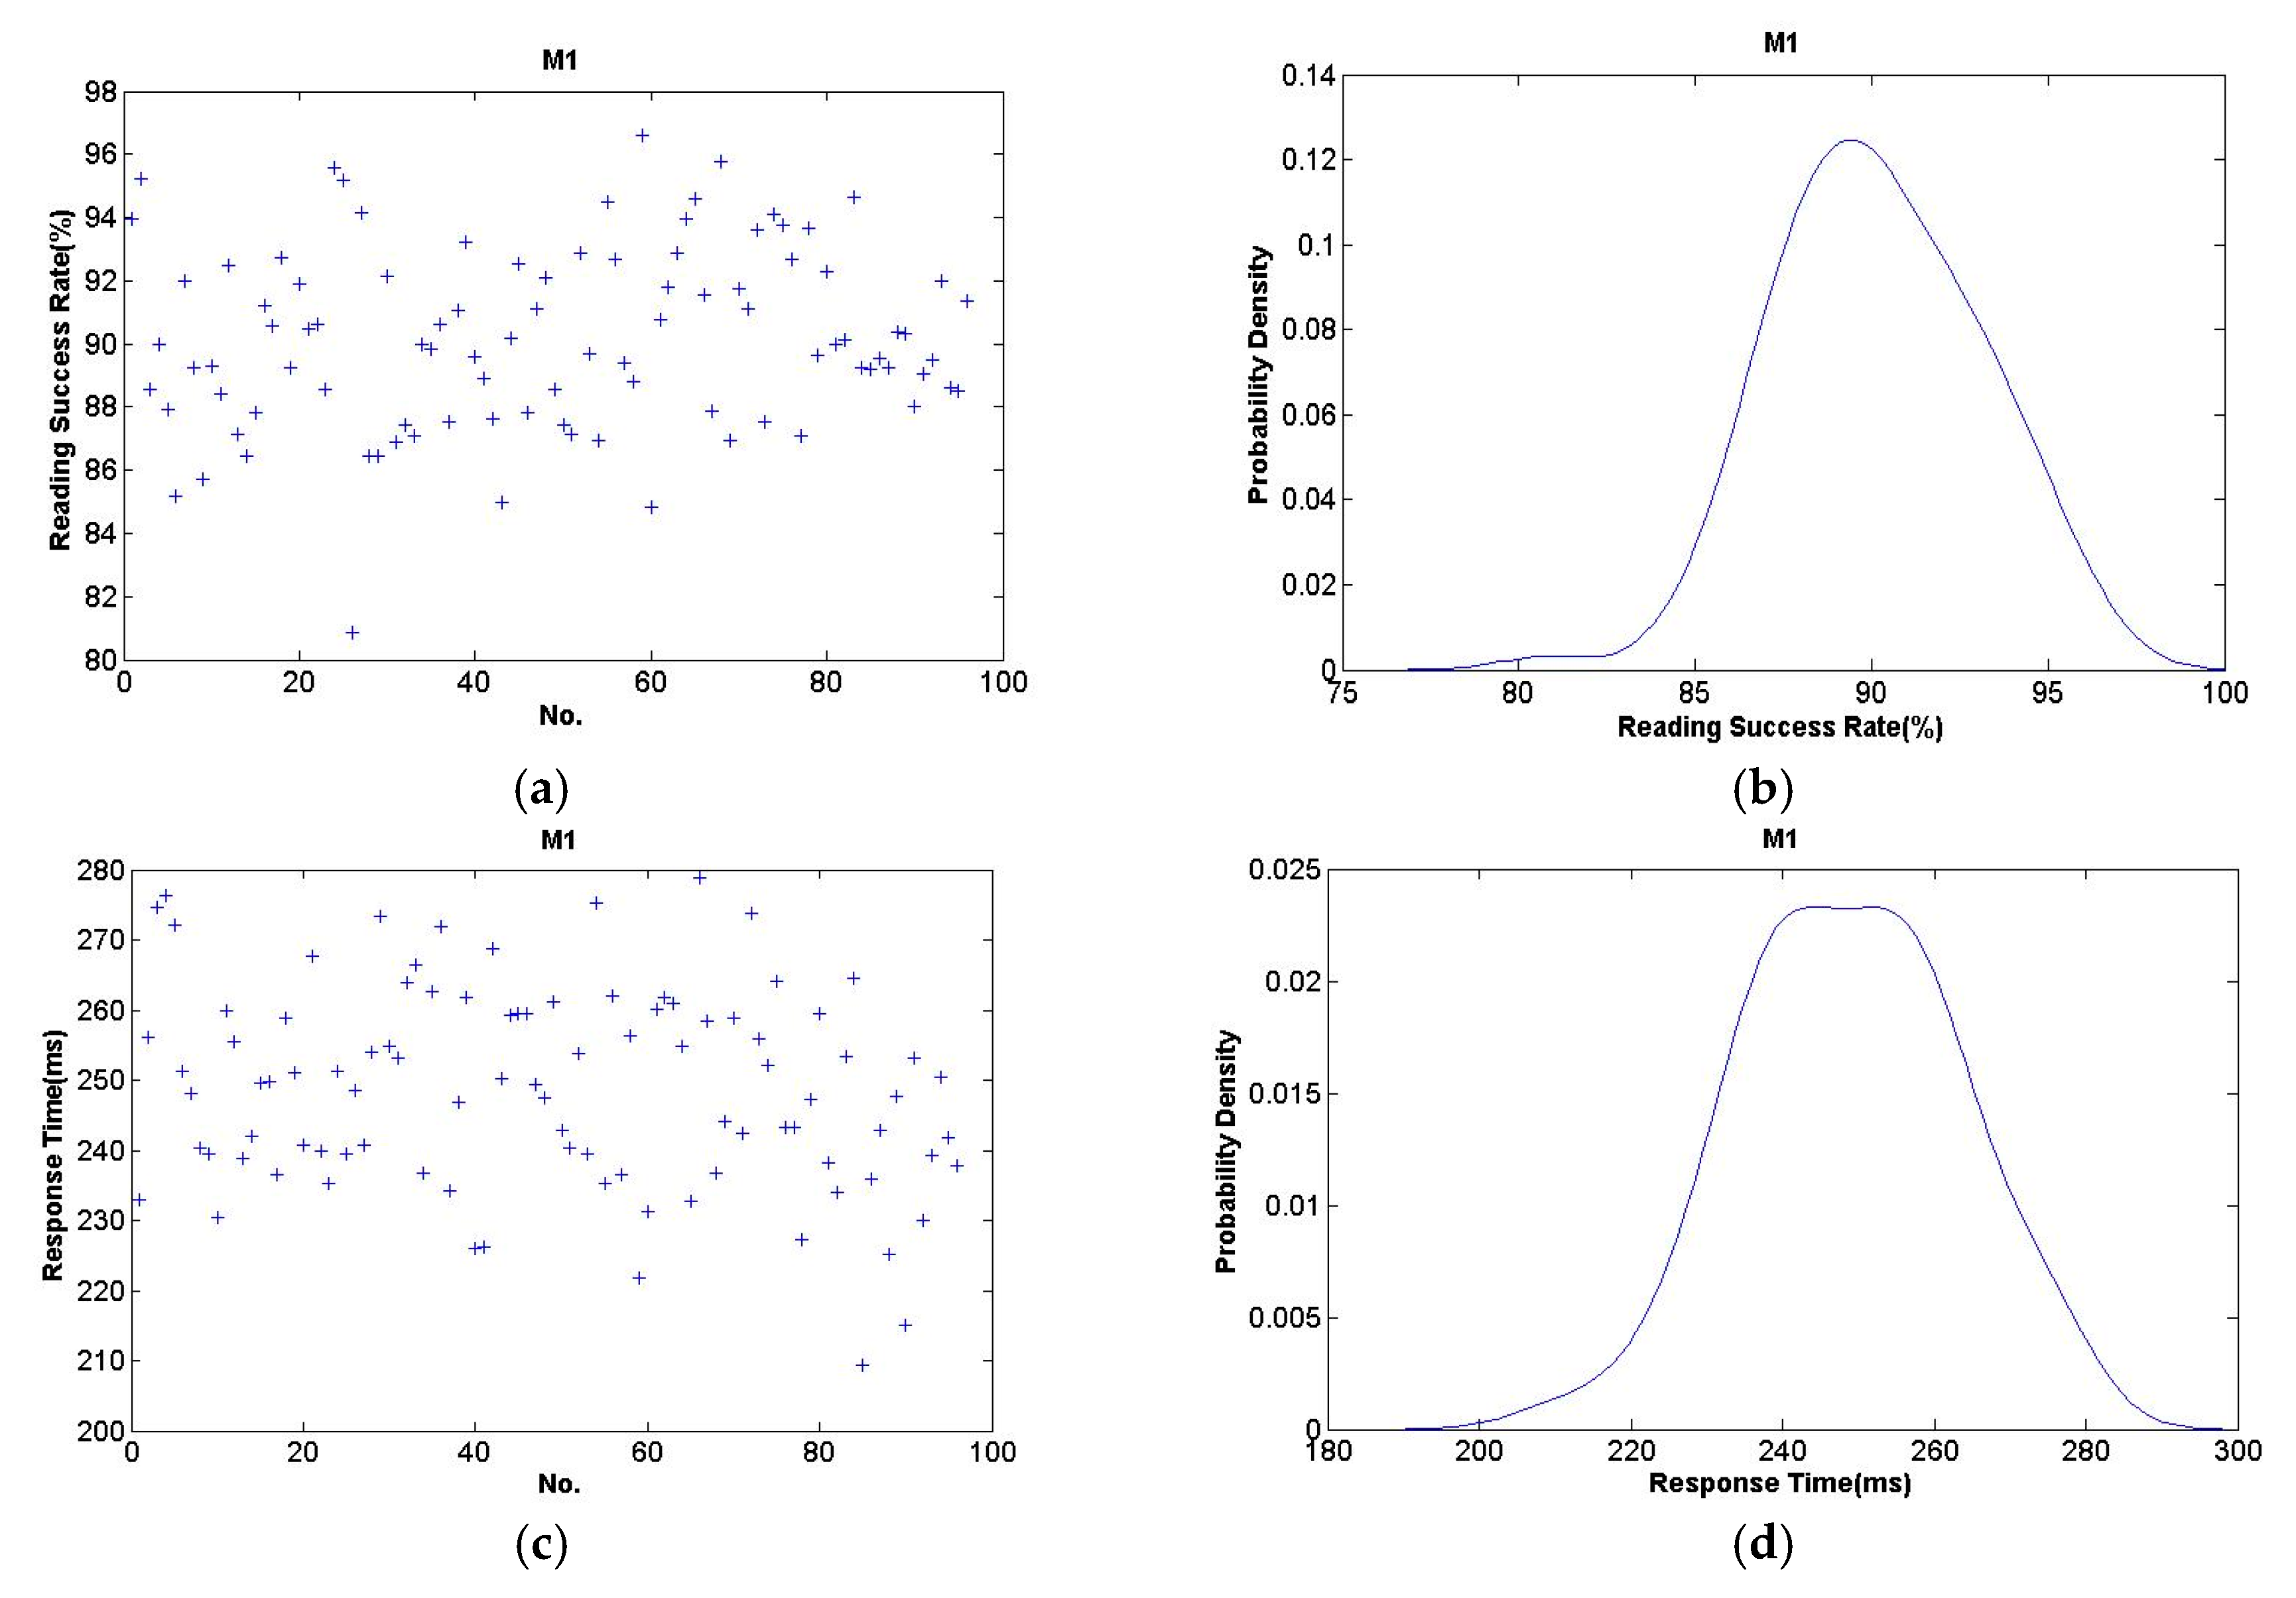
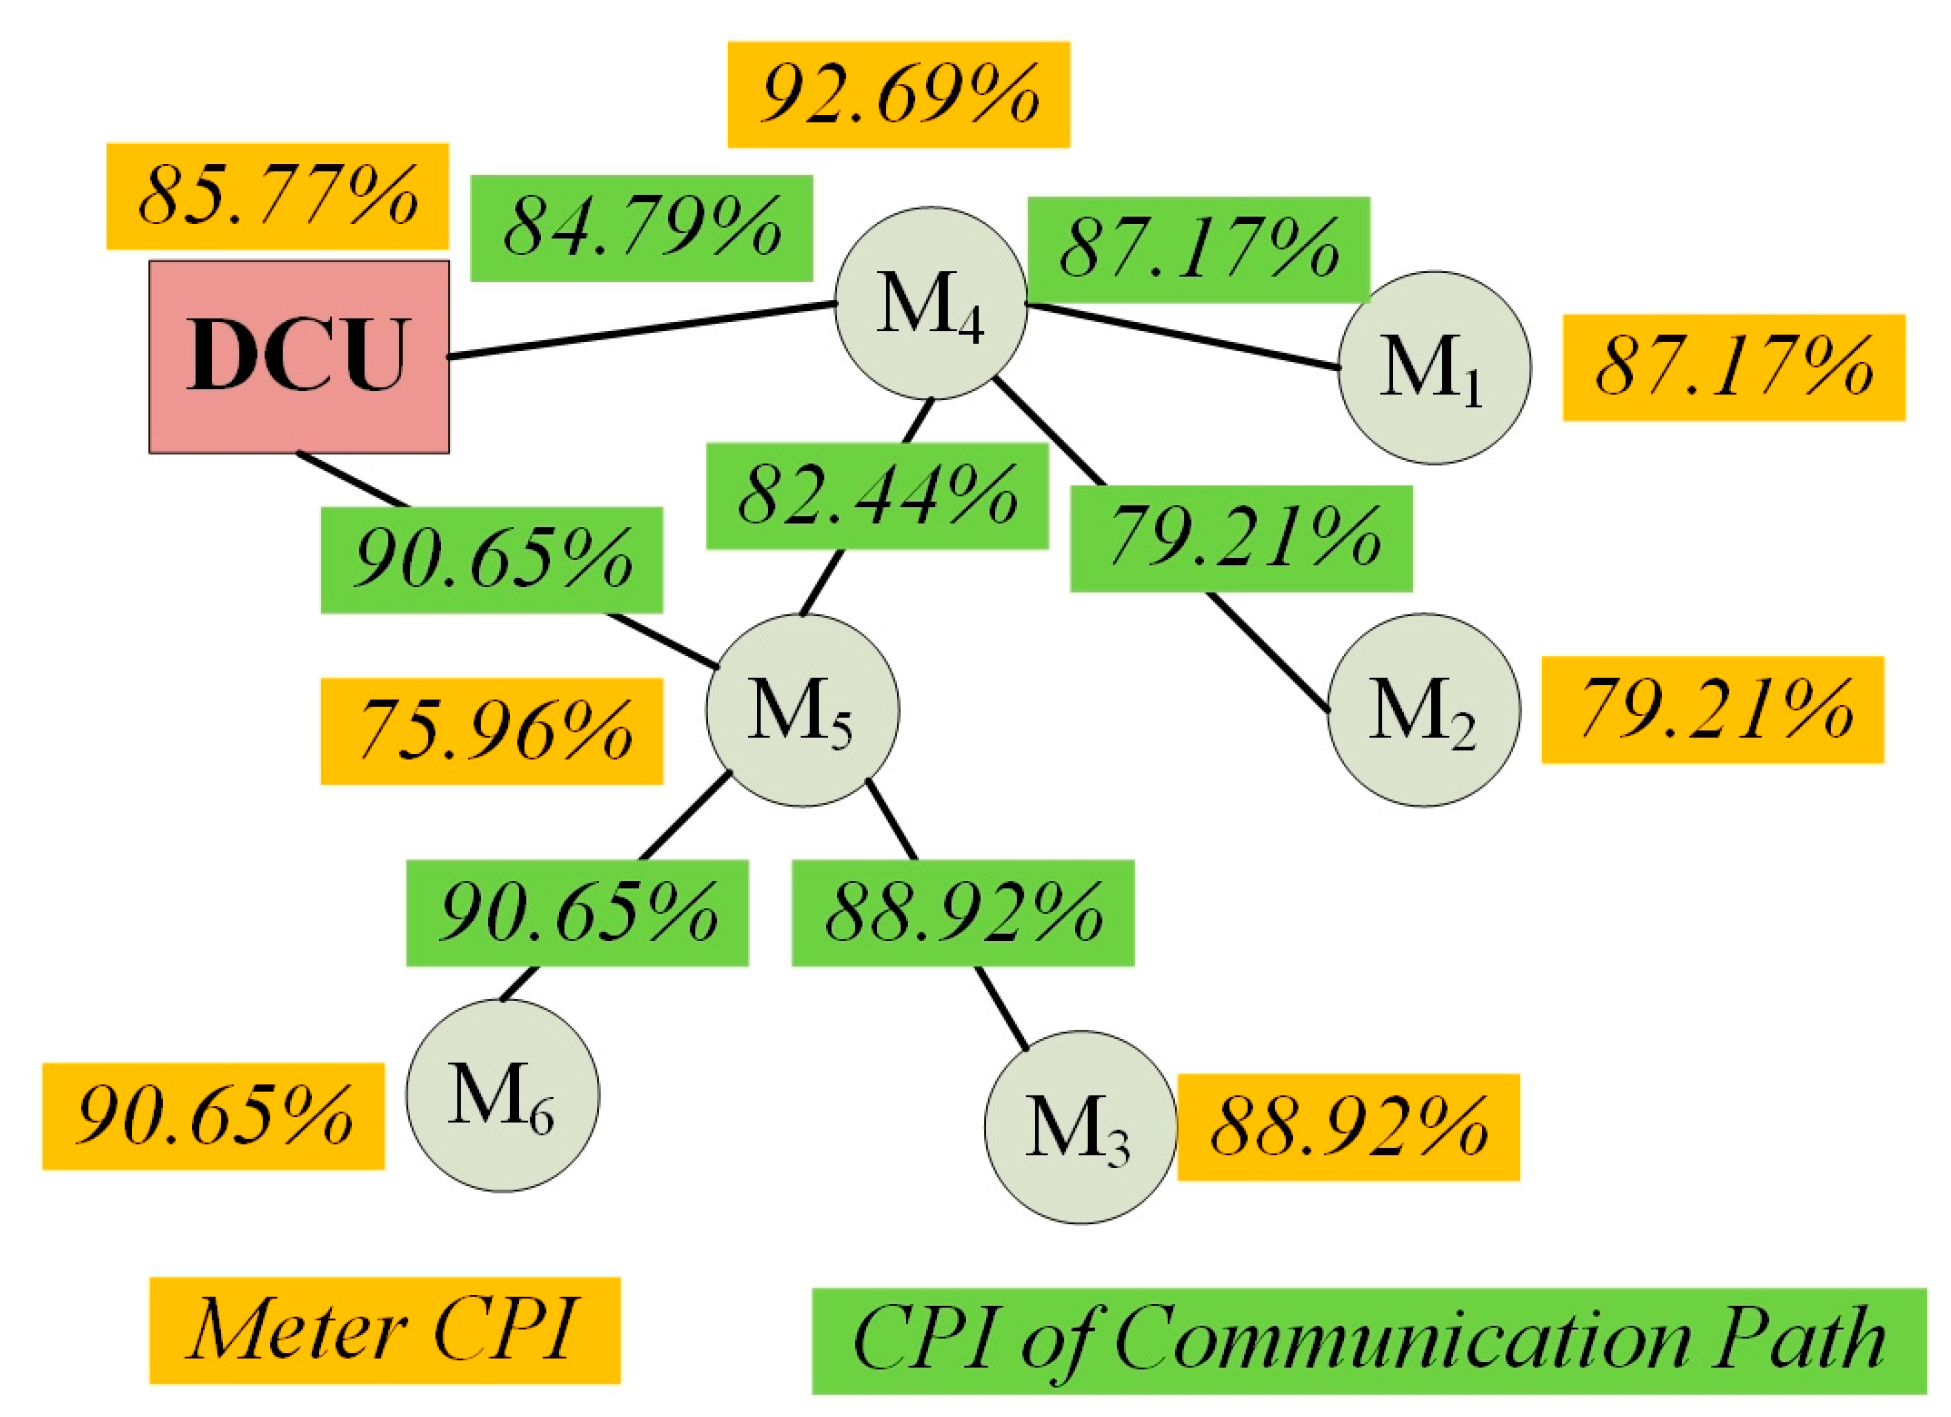
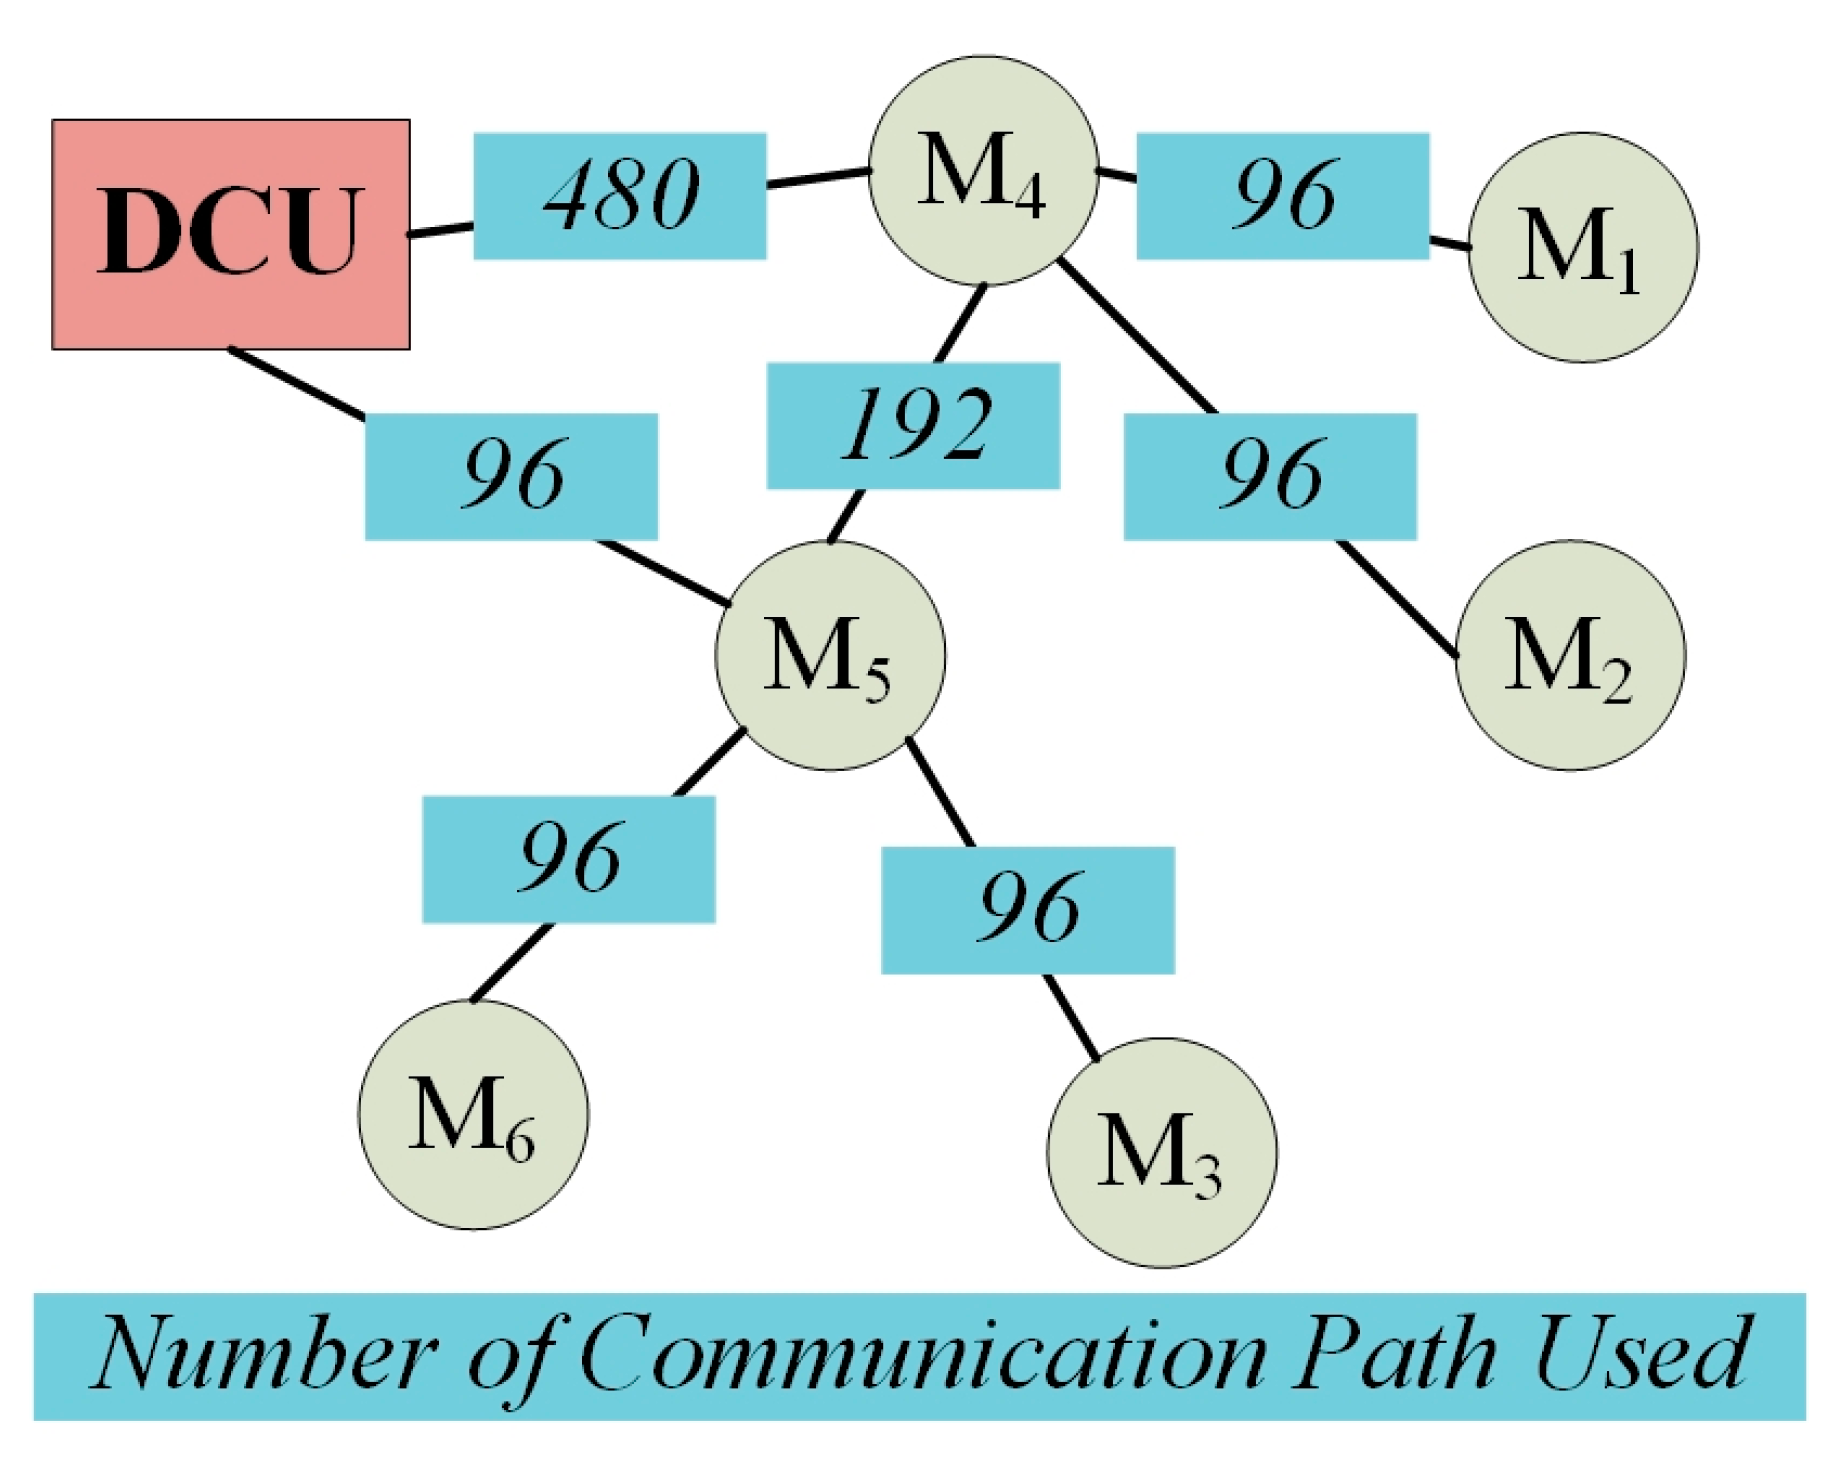
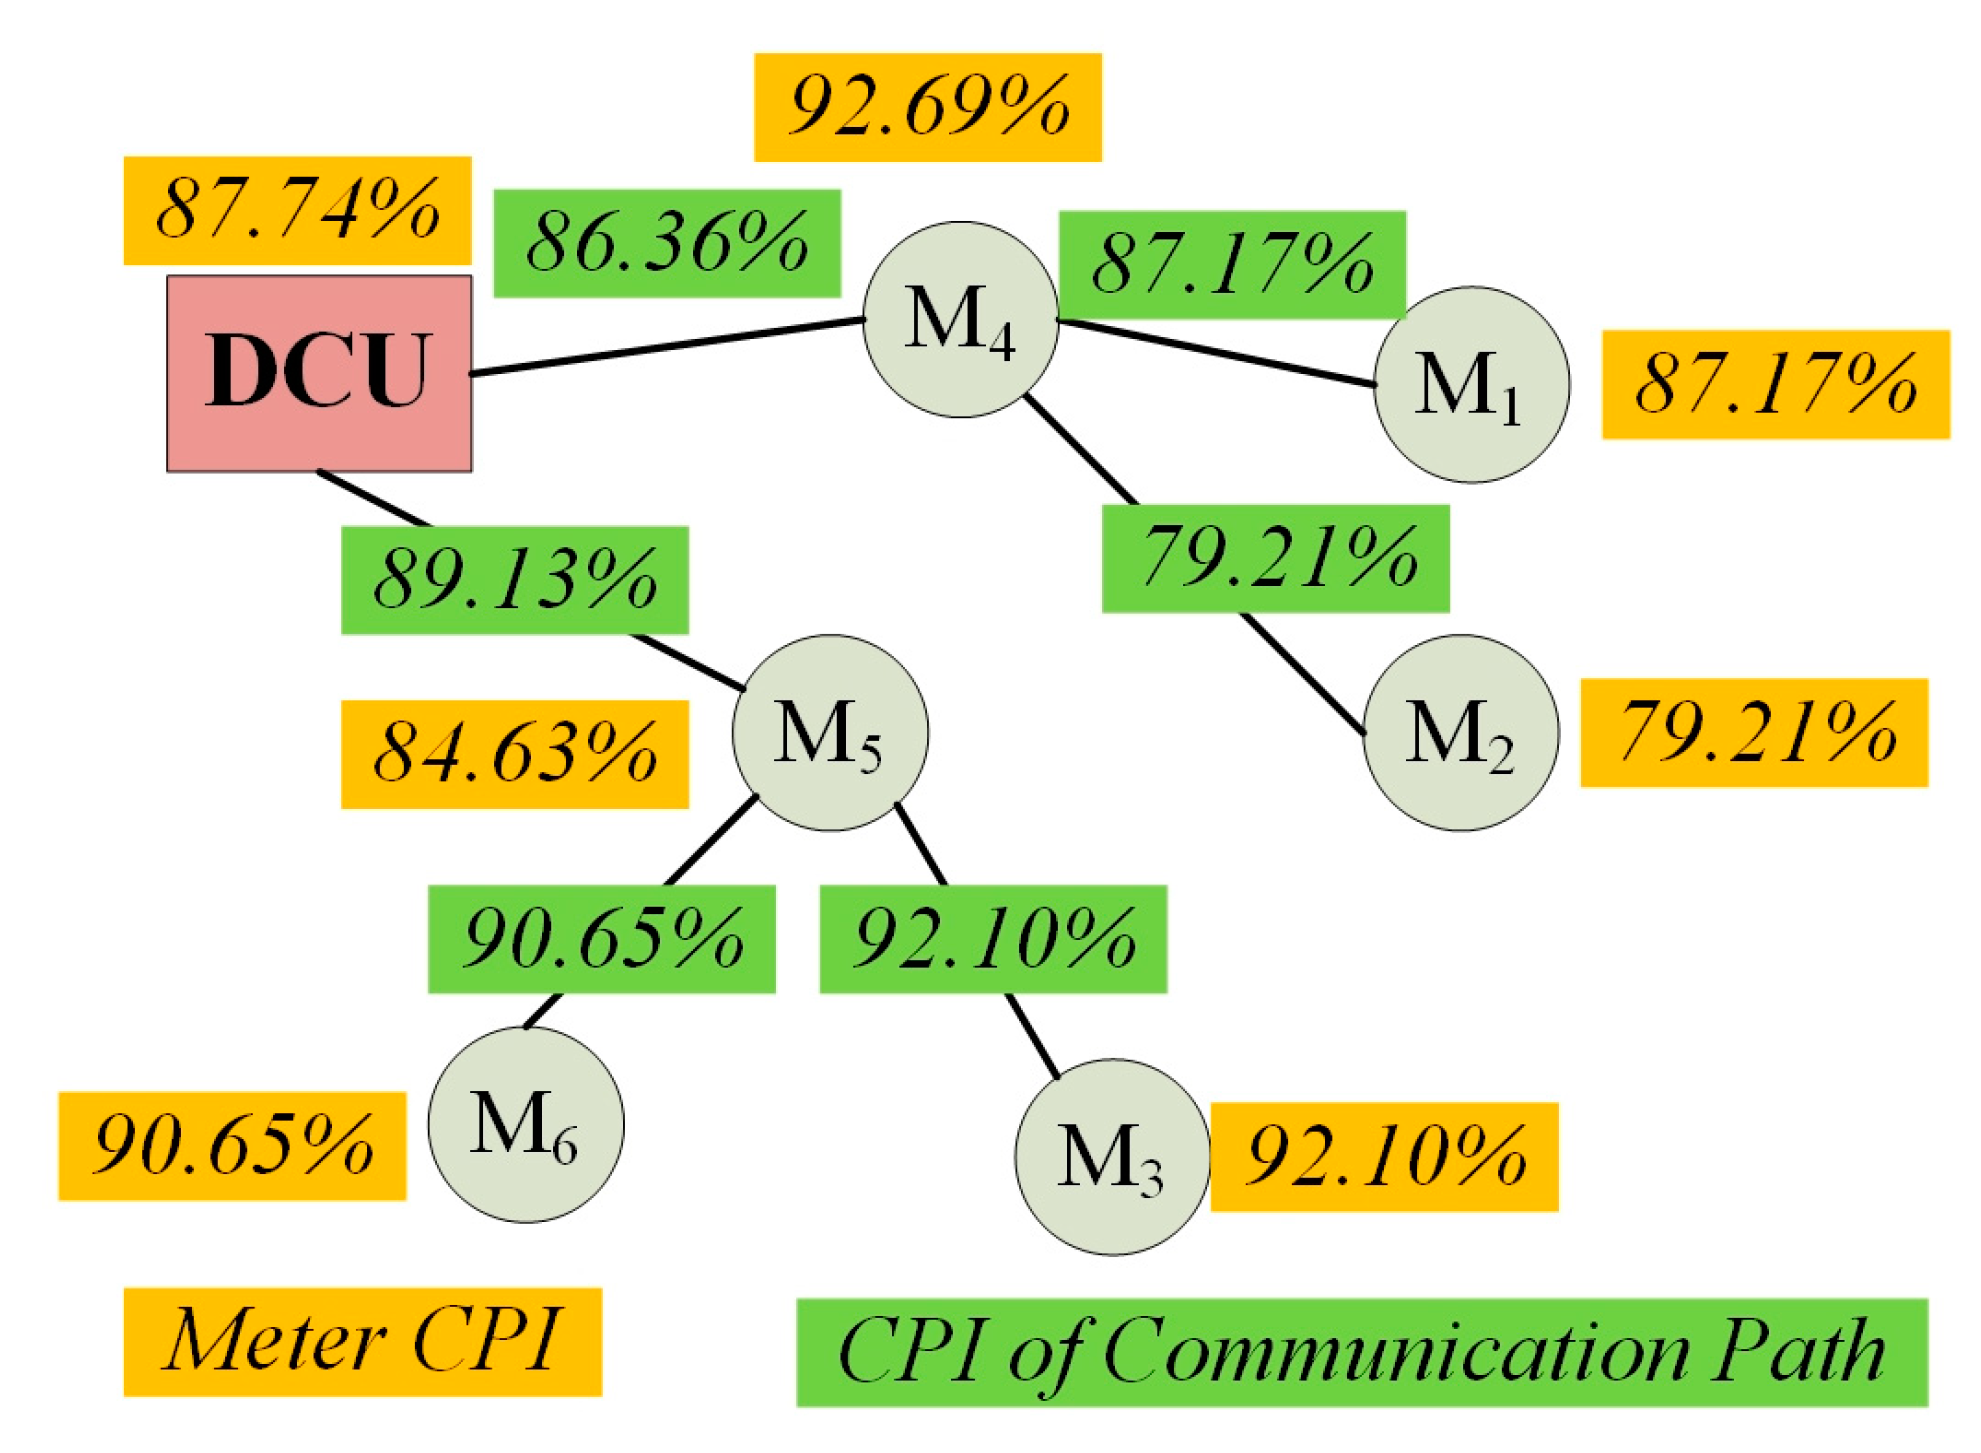
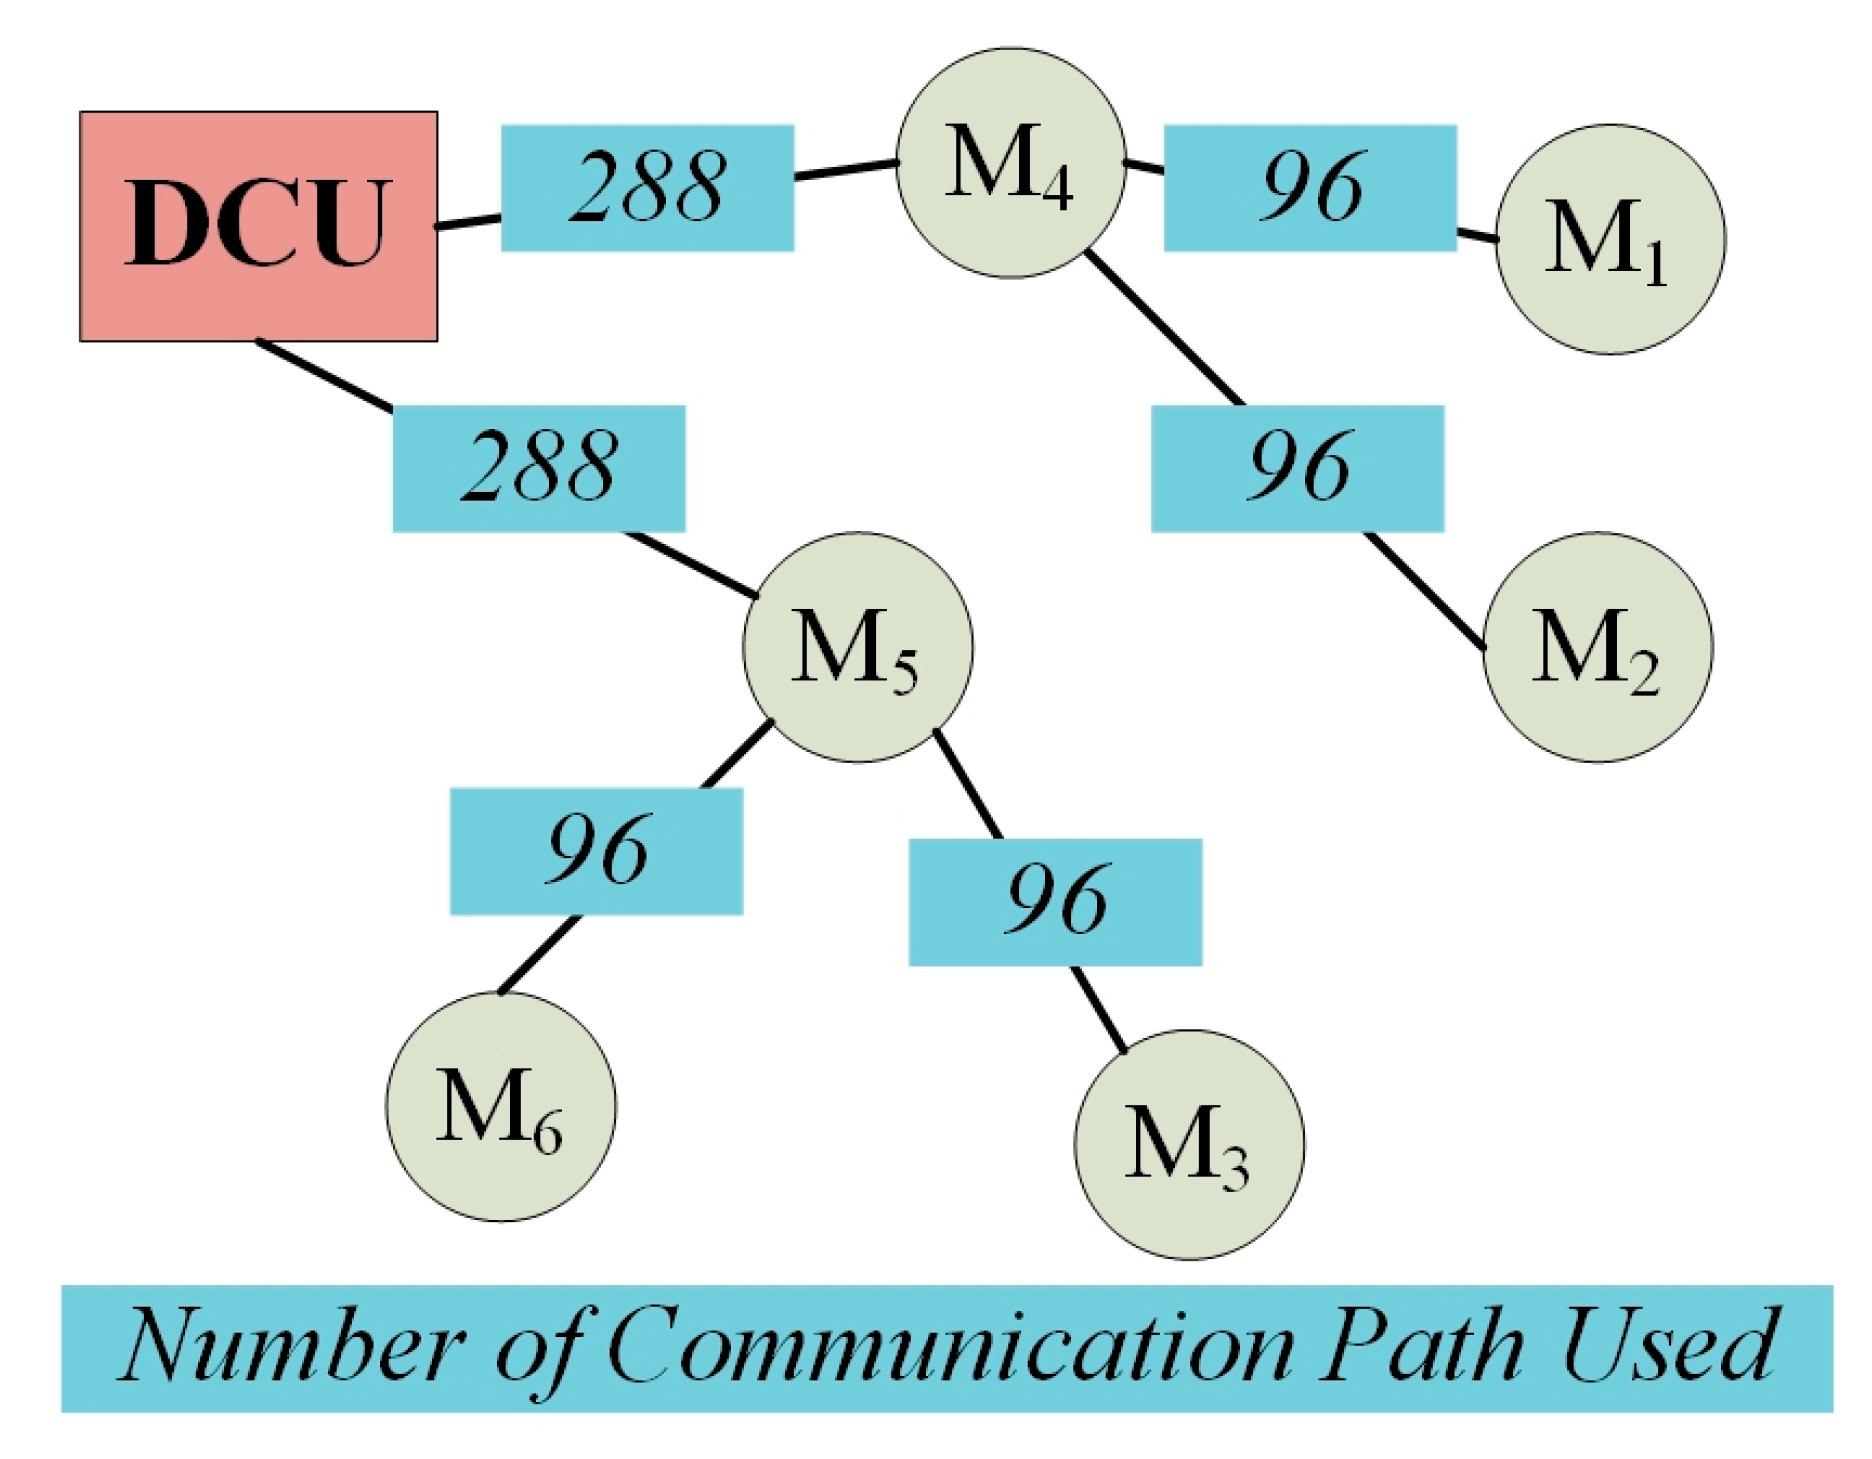
Figure 8 shows the communication network configuration of a simple six-meter case used to clarify the basic concepts and implementation of proposed CPI. Table 3 shows the communication paths of the six-meter case. Figure 9 and Figure 10 is the values and Probability Density (PD) of reading success rate and response time for smart meters M1 and M4. Due to limited space, the other data is not shown here. The CPIs calculated by the proposed method is shown in Figure 11. The CPIs of smart meters, communication paths and DCU can be easily observed from Figure 11. The number of each communication path used can be calculated and the results are as shown in Figure 12. From Figure 11 and Figure 12, it can be observed that smart meter M5 with the communication path “5→4→DCU” has the lower CPI and the communication path between M5 and DCU has higher CPI. Therefore, if the communication path of smart meter M5 is changed to “5→DCU”, then the overall CPI may be increased. Figure 13 and Figure 14 show the calculated CPI and the number of each communication path used after the communication paths of smart meter M3 changed to “3→5→DCU” and of smart meter M5 changed to “5→DCU”, respectively. Figure 13 indicates that the CPIs with the changes of communication paths are enhanced; therefore, the proposed CPI and the number of each communication path used can be adopted to find the optimal communication path of each meter. This paper provides an effective mechanism to assess and supervise the communication performance of AMI, the optimal communication path selection integrating with other routing algorithms [12,13,14,15,16,17,18], [31,32,33] will be investigated in the future.
4.2. Field Measurements and Communmication Performance Assessment
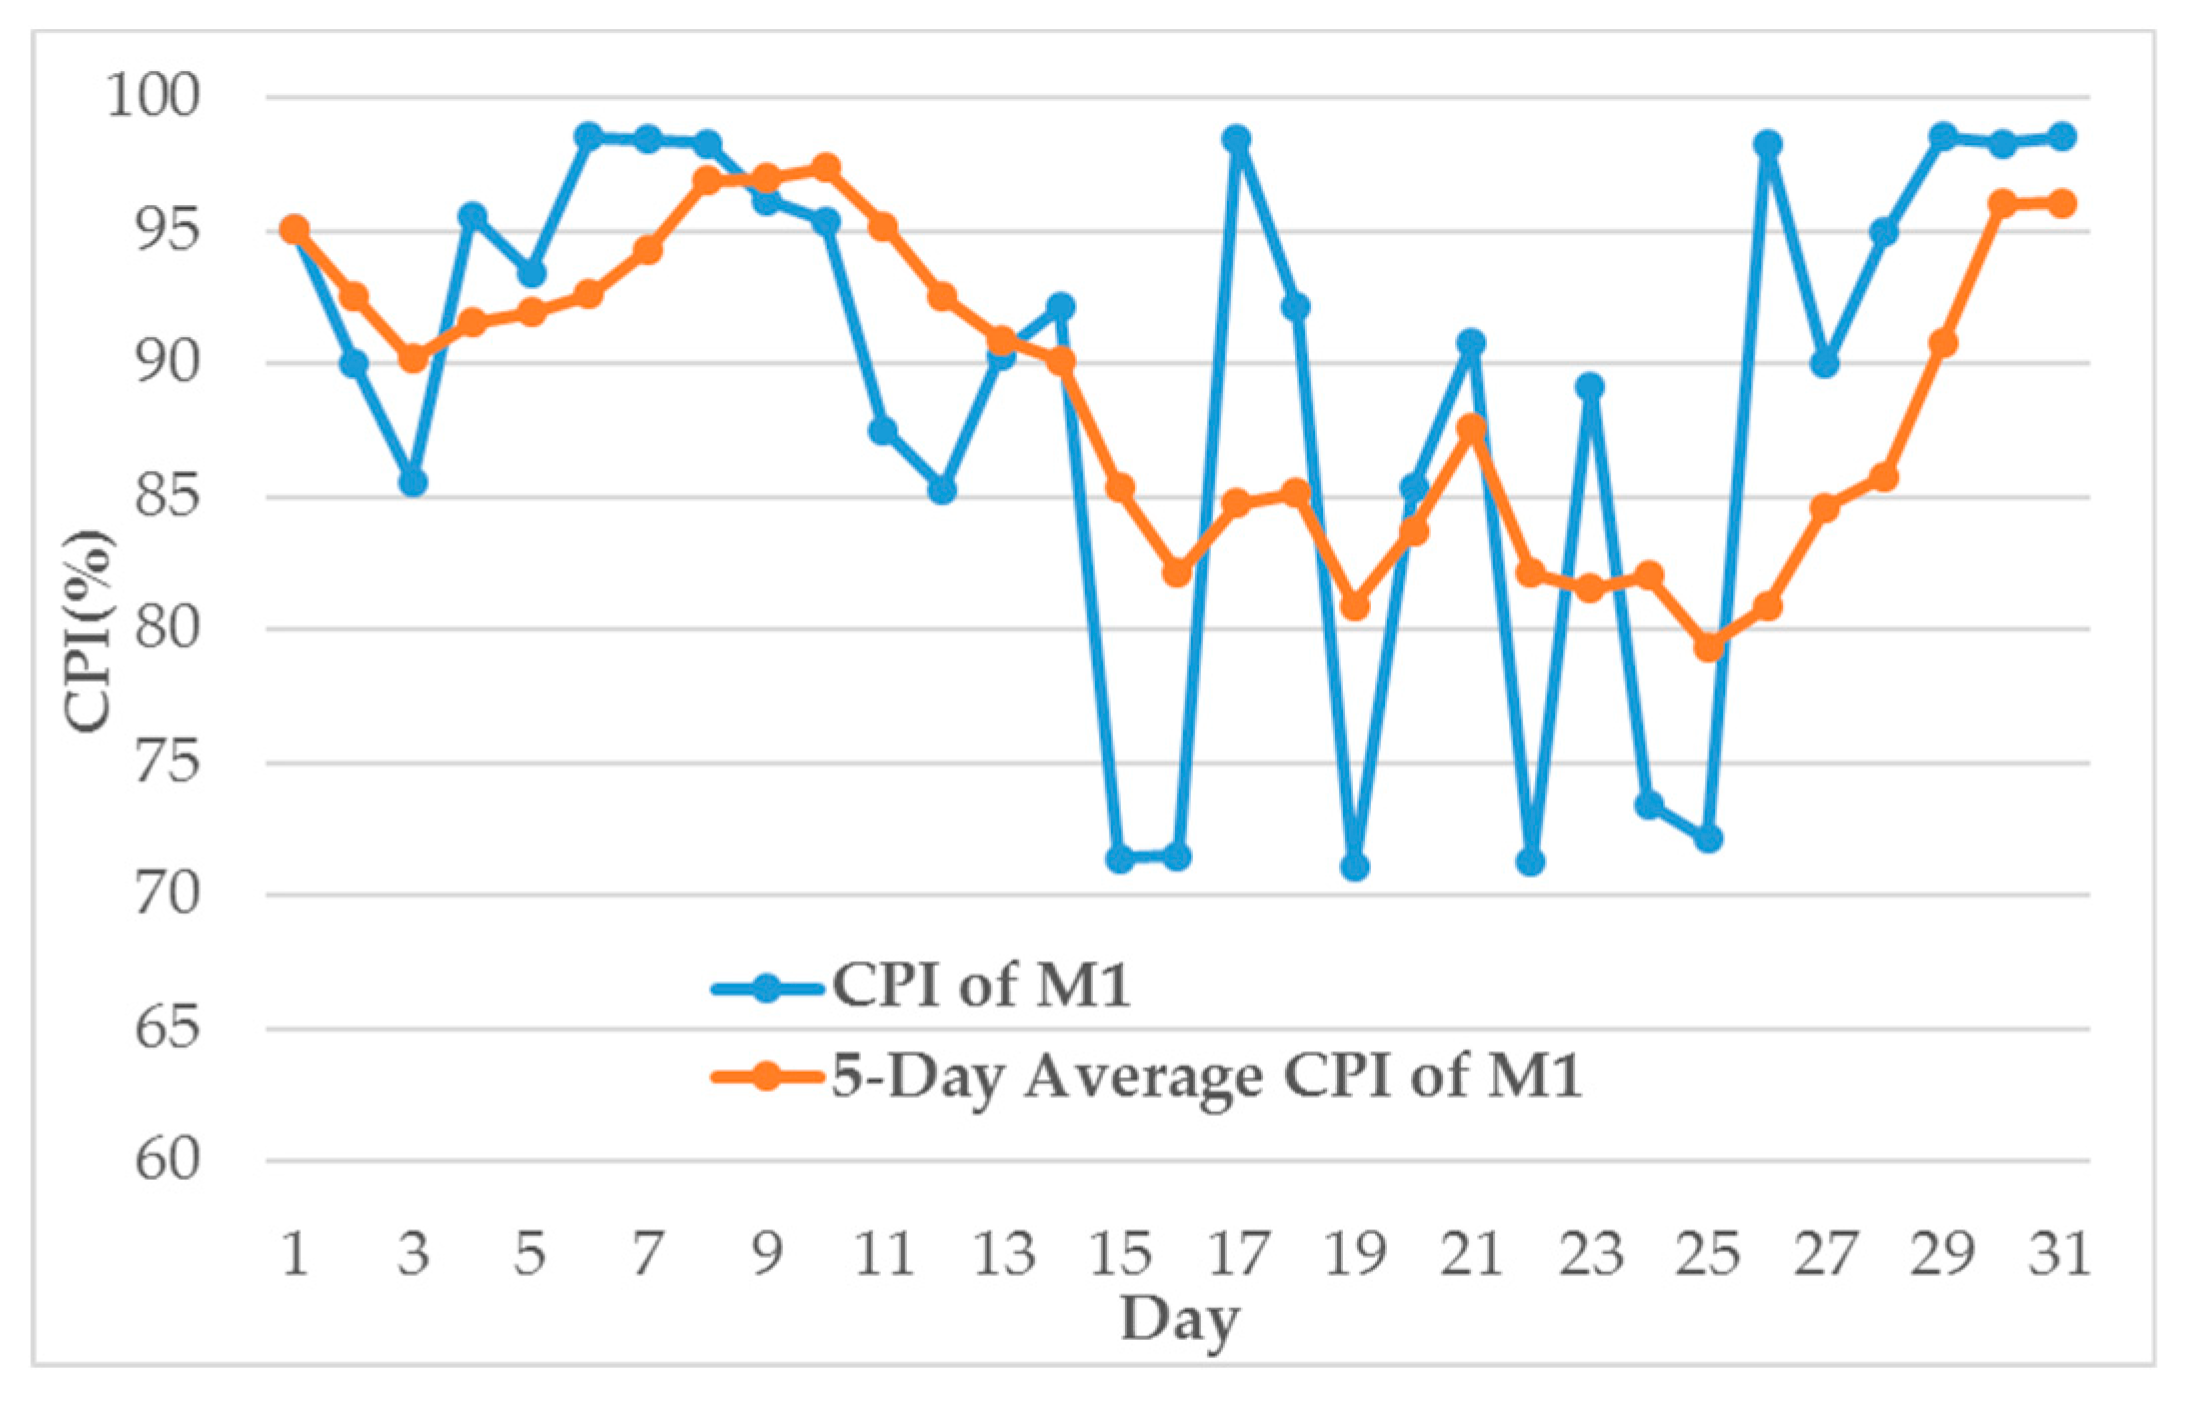
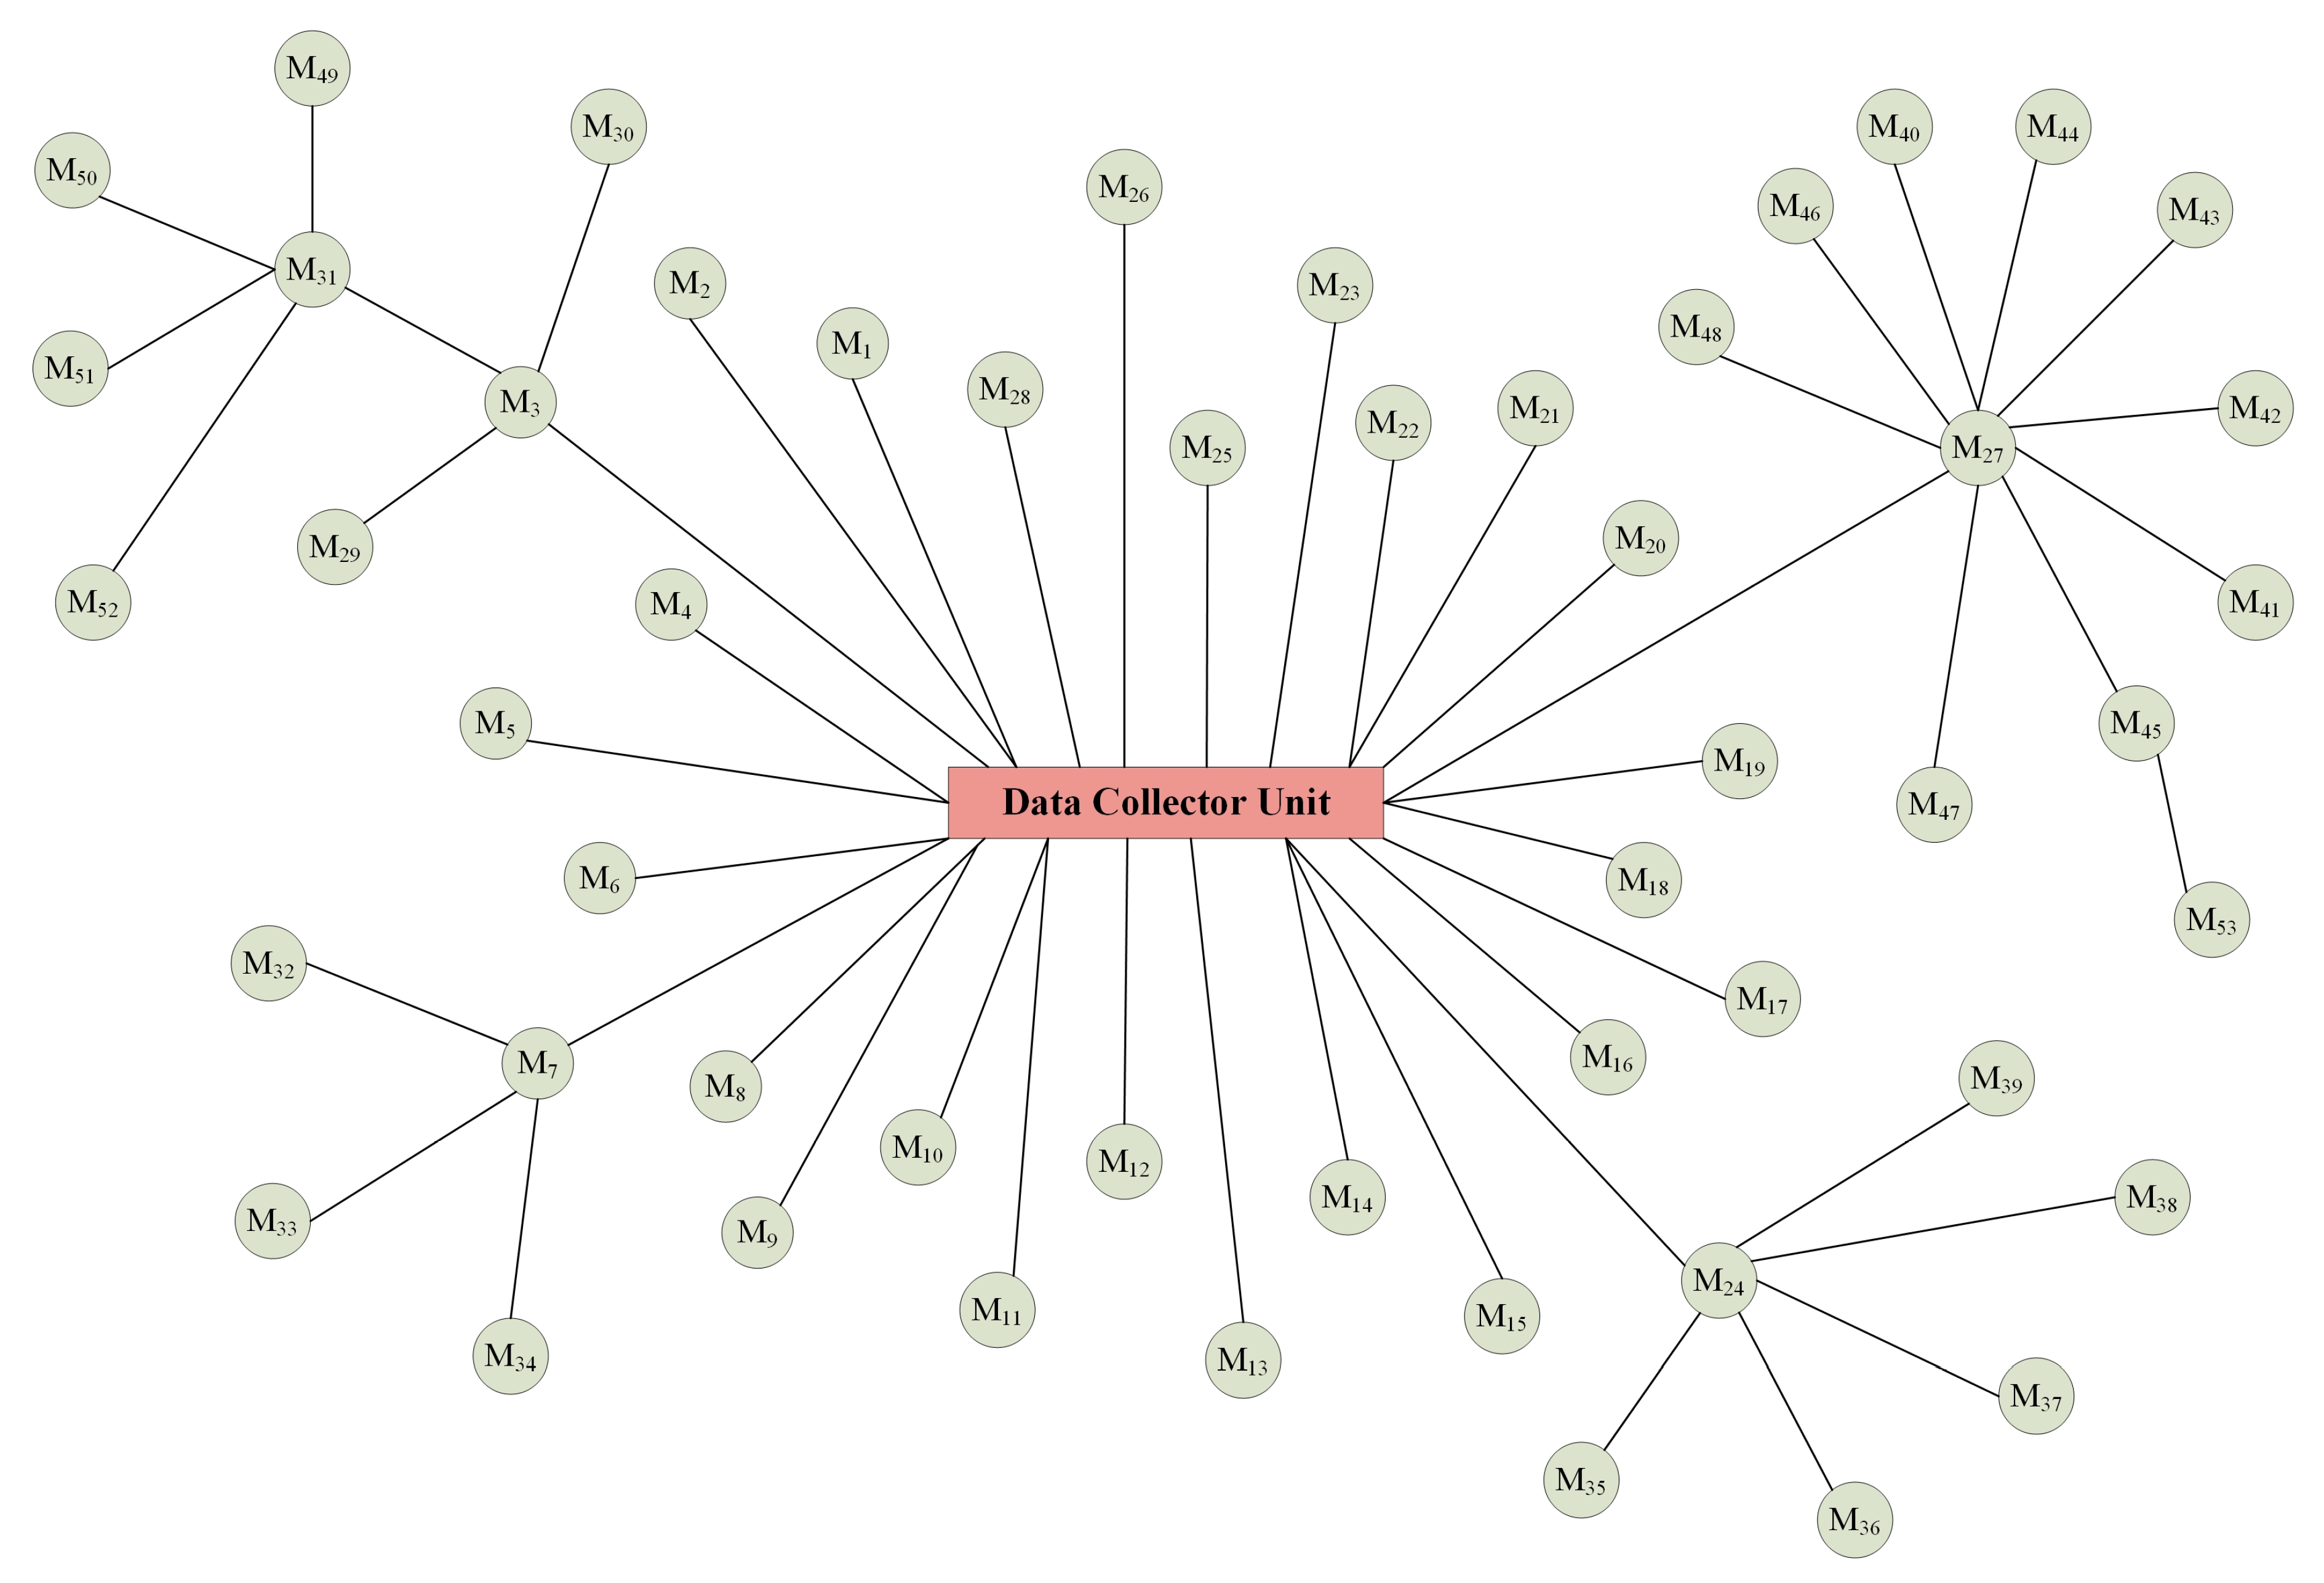
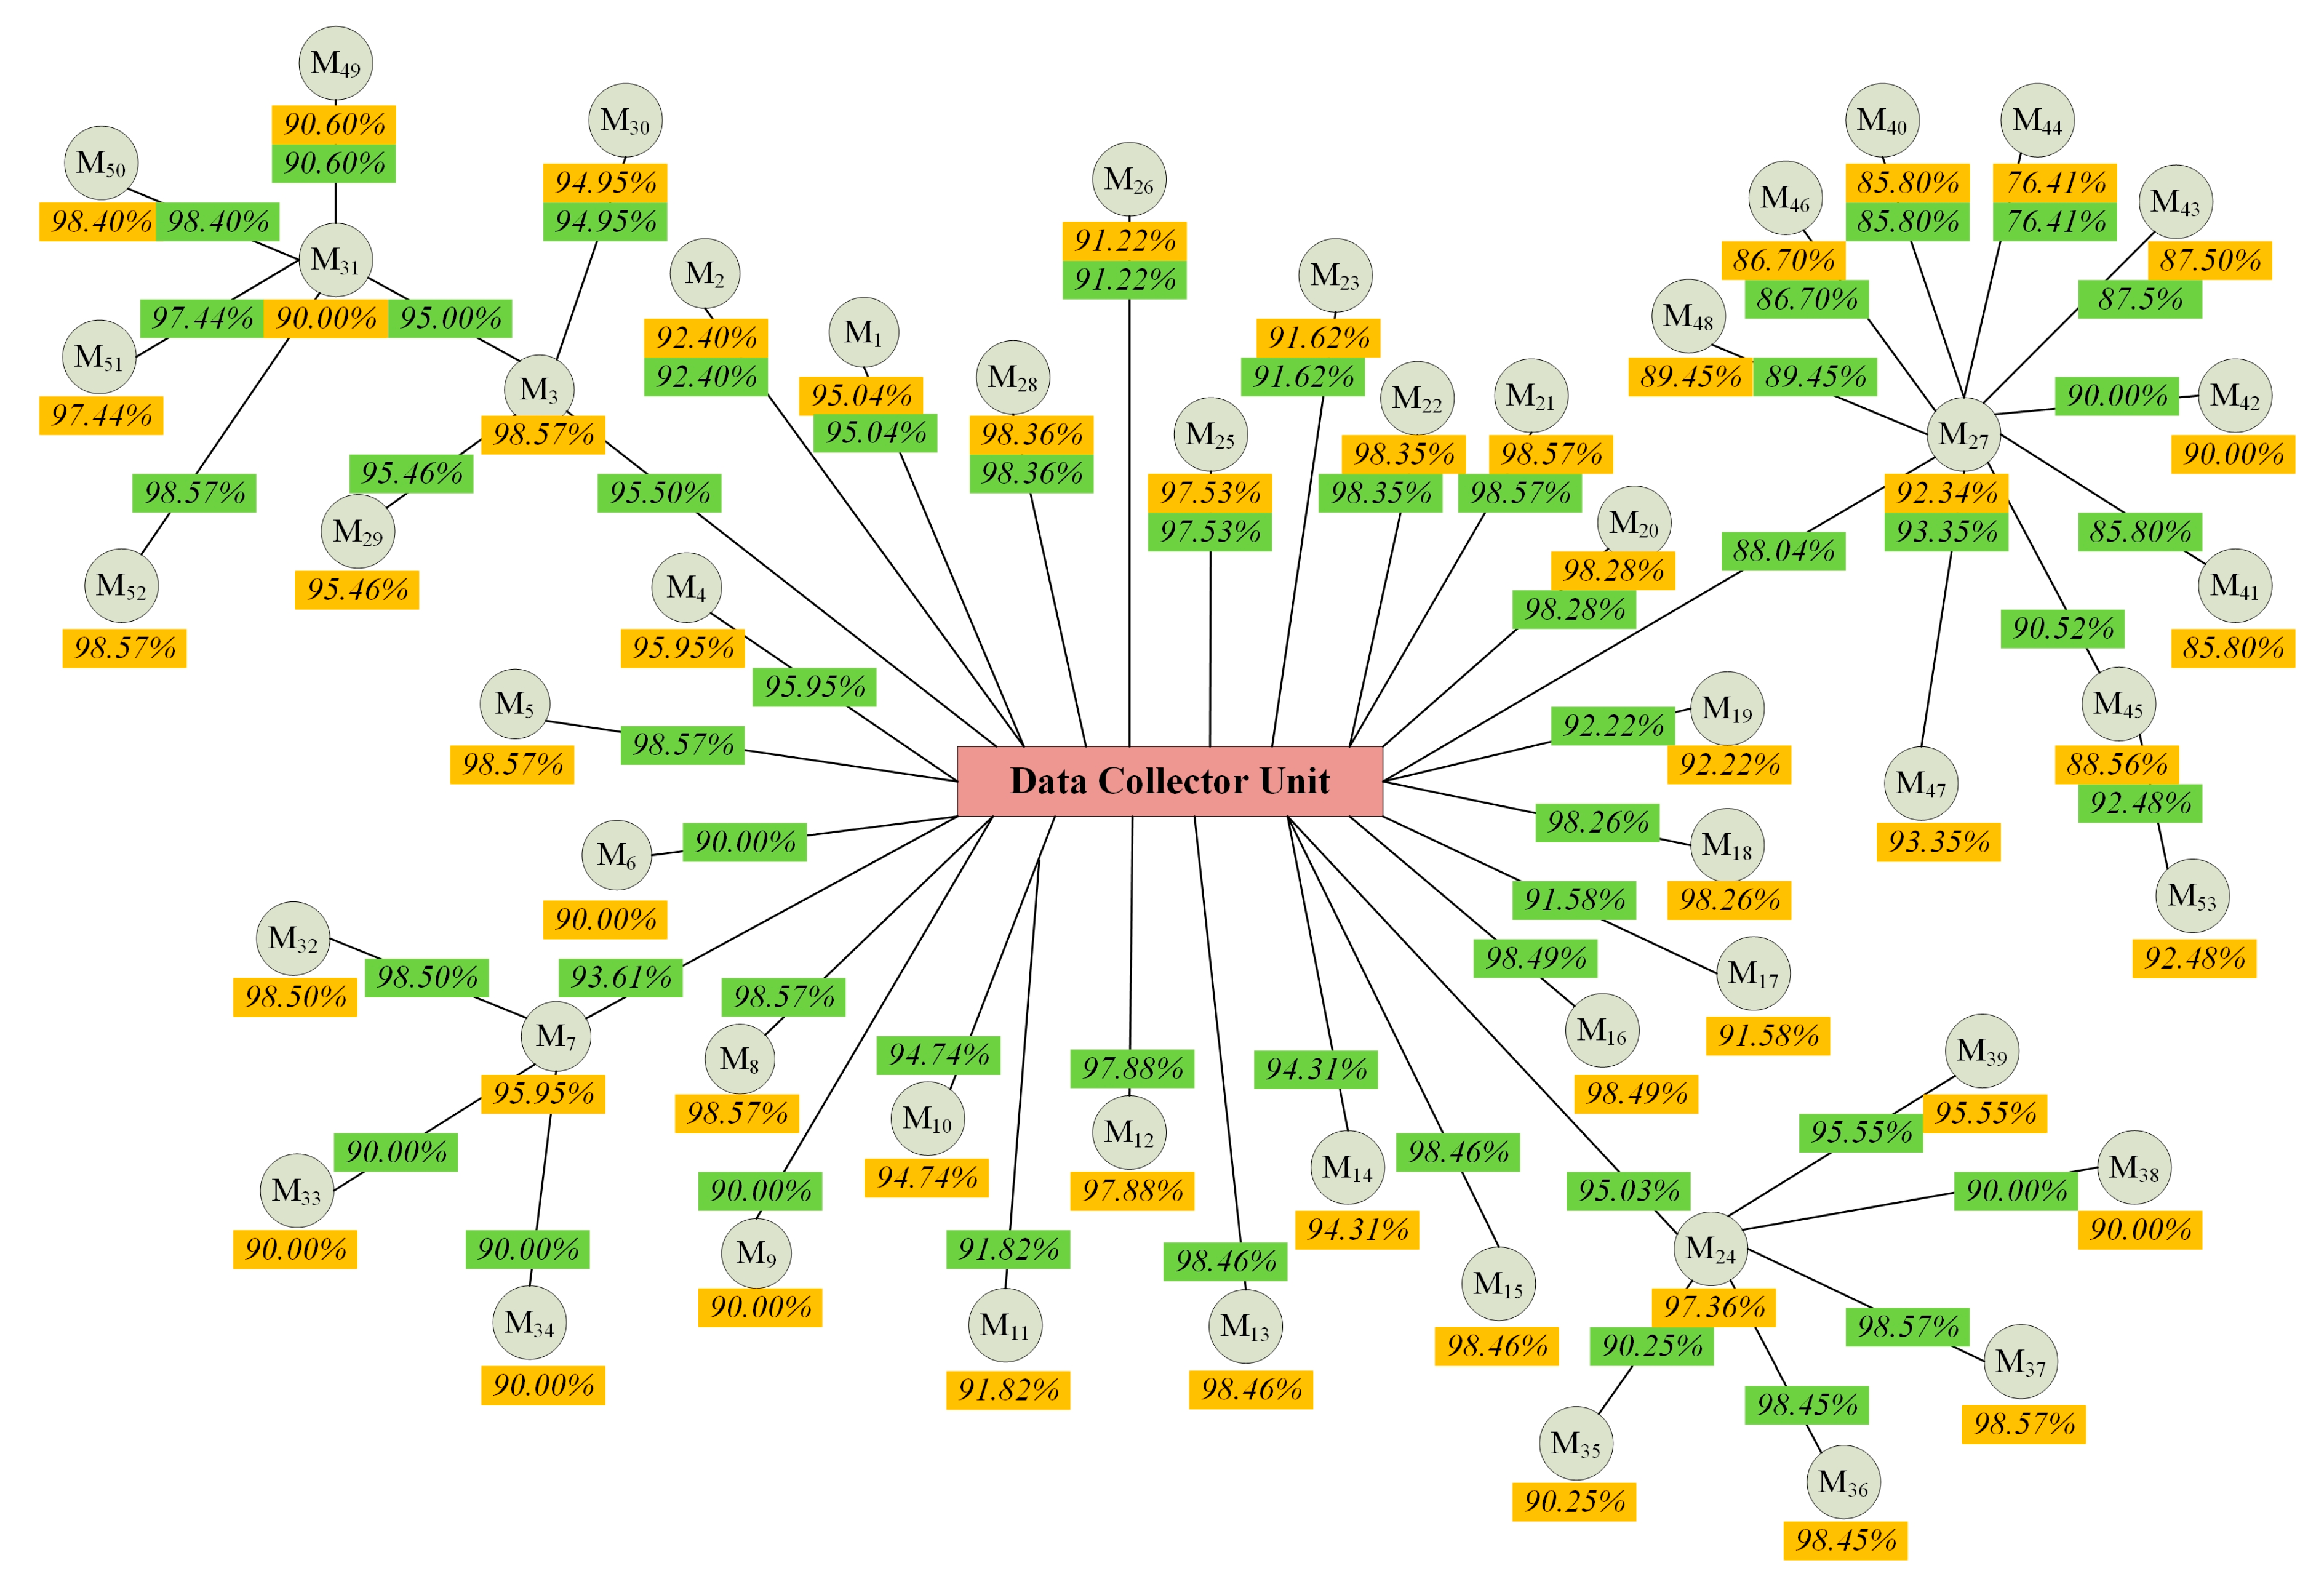
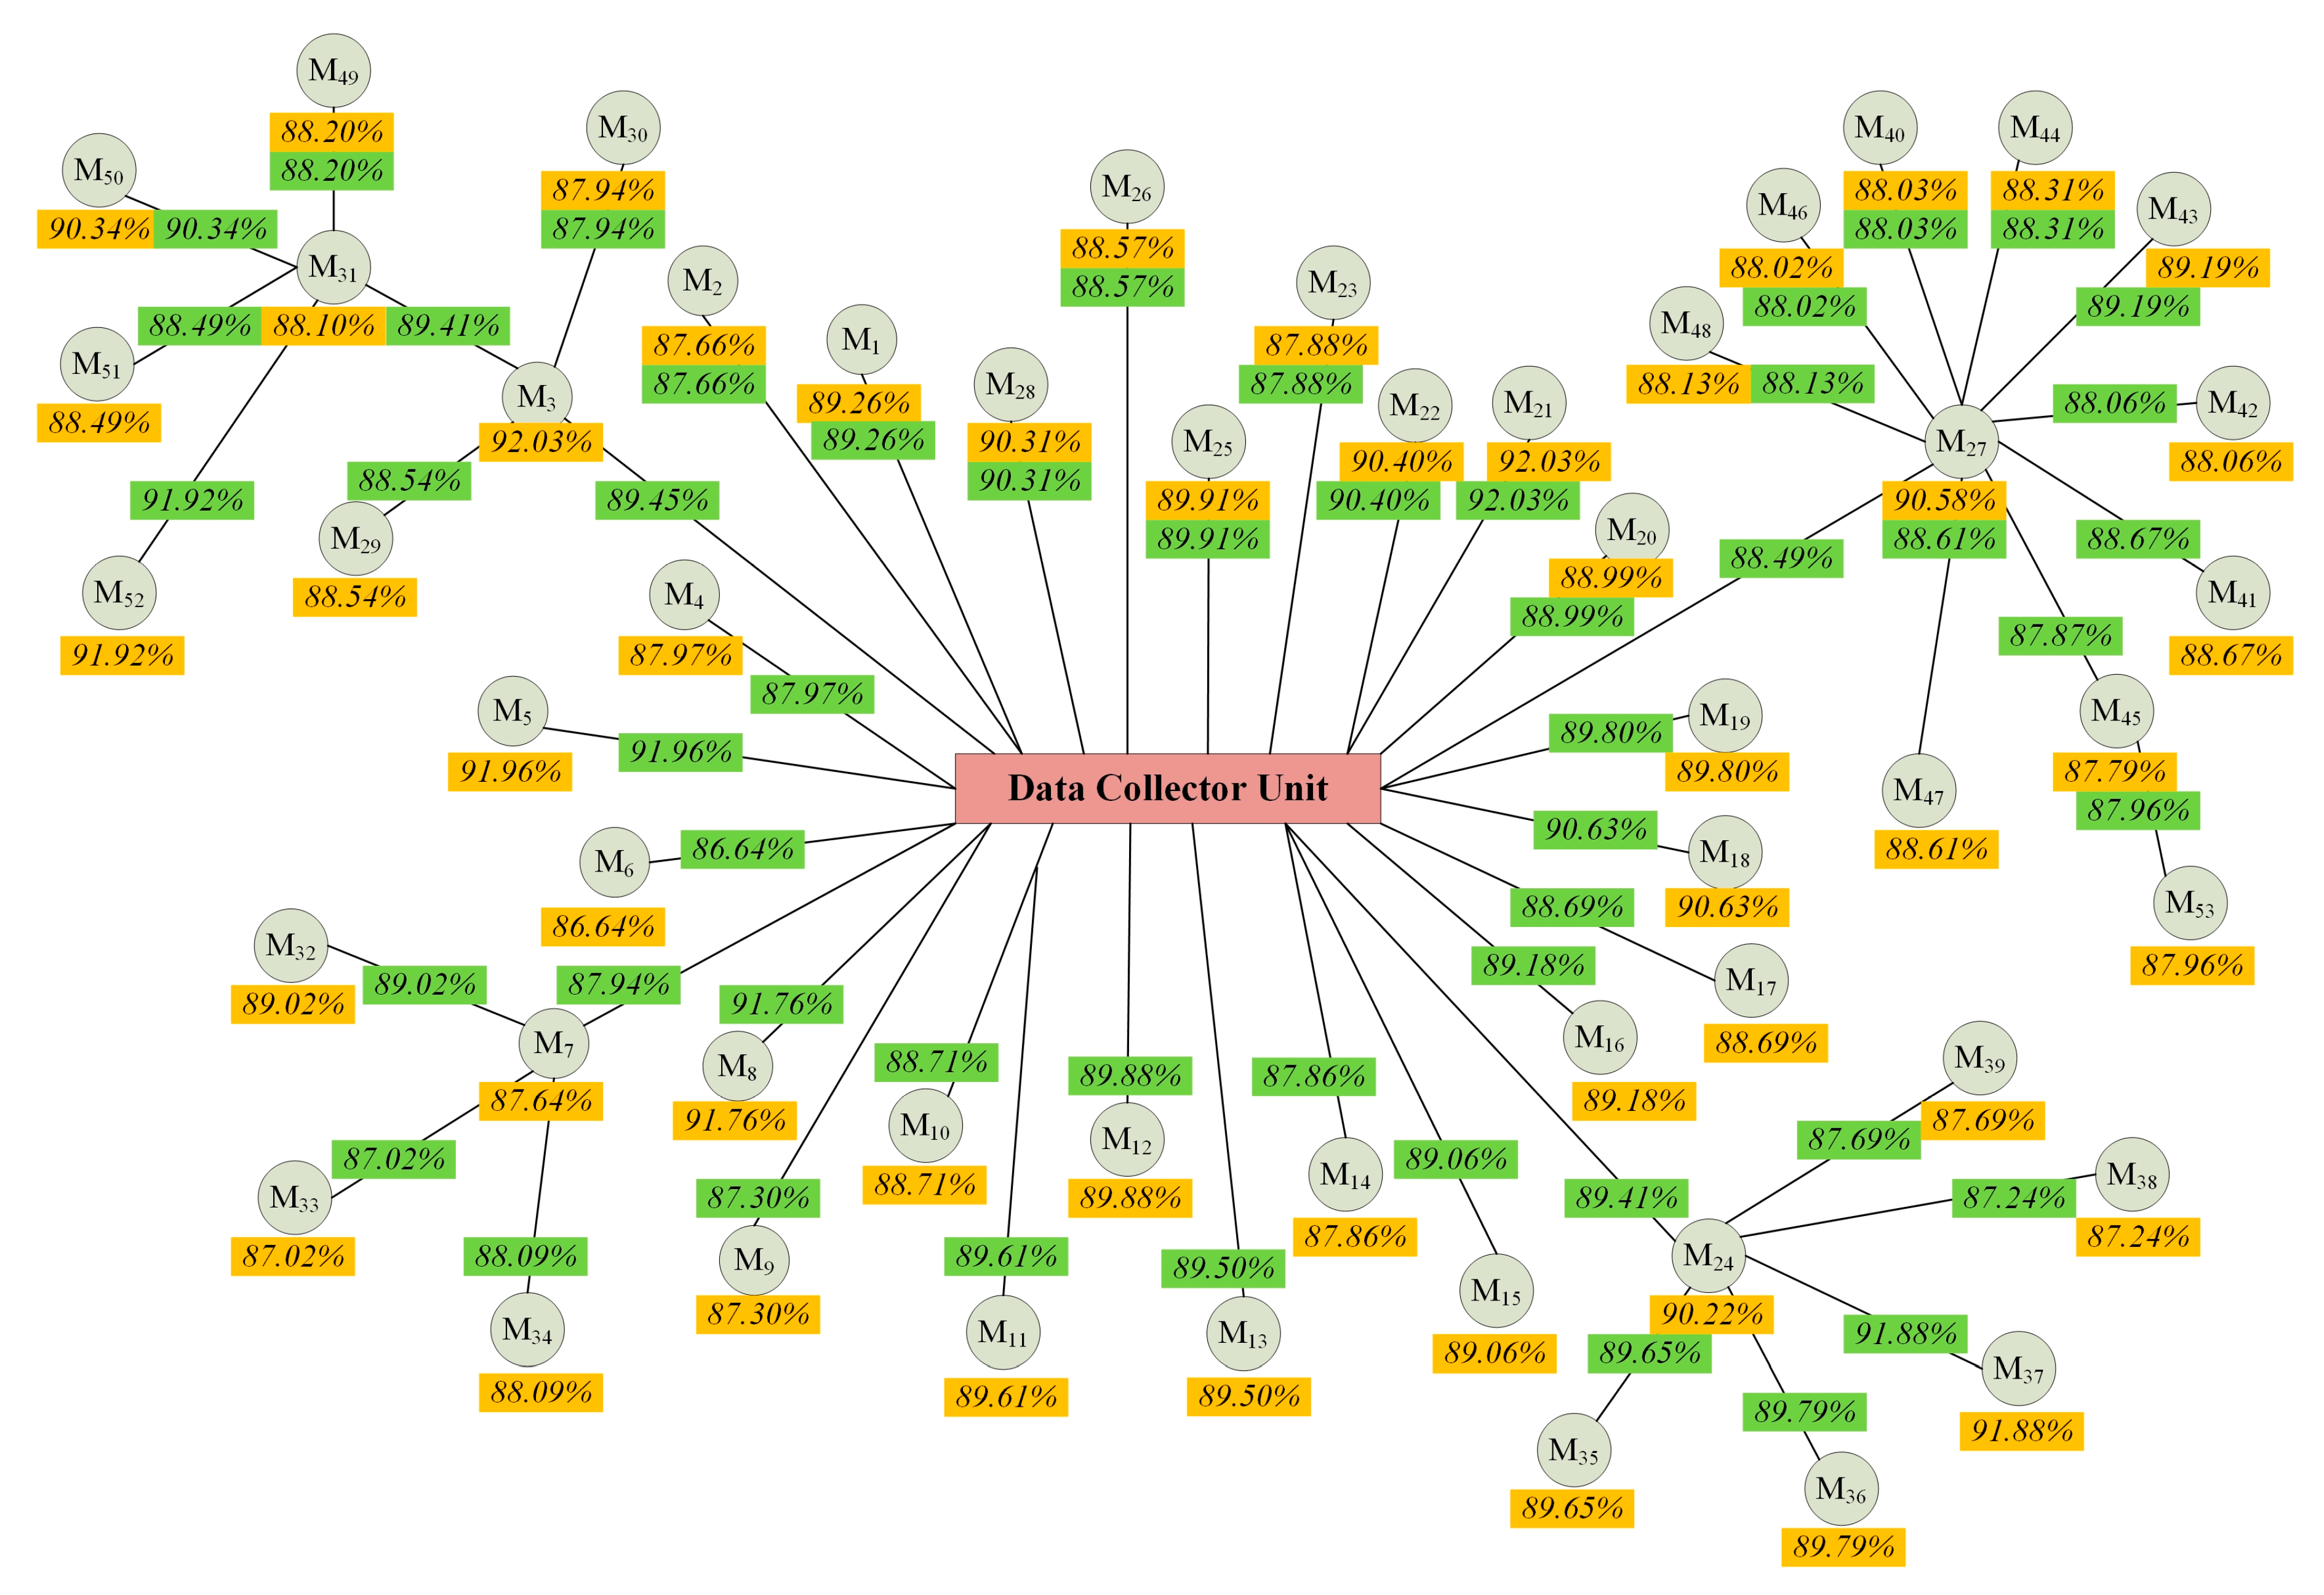
An actual small-scale PLC-based AMI as illustrated in Figure 7 is used to demonstrate the validity of the proposed CPI. For convenient observation, Figure 7 is redrawn as Figure 15 and the meters are renumbered and listed in Table 4. From Figure 15 and Table 4, it can be seen that there are 53 m and the DCU is used to collect energy usage data from these meters to the meter data management system. Smart meters M3, M7, M24, M27, M31, and M45 act like the routers and transmit the meter data received from other smart meters to DCU. Table 5 shows the field communication measurements of smart meter M1 used in the proposed CPI calculation. From Table 5, it can be observed that the reading success rates are between 28.13% and 100% with average and standard deviation of 89.15% and 16.74%, respectively. The reading success rate can be considered as an indicator of communication network stability. The response times are between 148.6 ms and 620 ms, with an average and standard deviation of 331.72 ms and 114.63 ms, respectively. The membership function of response time is designed in the range of 200 ms to 600 ms and is shown in Figure 16 from the field measurements. Figure 17 and Figure 18 illustrates the calculated CPIs and calculated average CPIs for Day 1 and from Days 1 to 31, respectively. The average and standard deviation of meter CPIs from Days 1 to 31 are also listed in Table 6. Based on the calculated CPIs, the communication performance of each meter can be supervised. For example, Figure 19 shows the CPIs and 5-day average CPIs of smart meter M1. From Figure 19, it can be observed that M1 has worse CPIs in Days 14, 15, 19, 22, 23 and 24. The possible causes can be further investigated. Obviously, from Figure 17, Figure 18 and Figure 19 and Table 6 the communication performance and stability of smart meter M1 can be effectively and efficiently assessed and supervised. Since the field communication measurements used in the proposed CPI can be effortlessly acquired from smart meters, the proposed communication performance assessment has great potential to be integrated into a large-scale AMI to support its operation.
5. Conclusions
If the communication performance and stability is poor, all AMI functionalities cannot be effectively realized. Therefore, communication performance and stability between widely-spread smart meters and DCUs should be assessed and supervised for the successful deployment and operation of AMI. An effective CPI used to assess and supervise the communication performance of each smart meter was proposed in this paper. Reading success rate and response time were used to design the proposed CPI. A higher reading success rate usually indicates better stability of the communication network. A faster response time implies a higher communication performance. Fuzzy logic was adopted to integrate these measurements to calculate the proposed CPI. The CPIs for communication paths, DCUs and whole AMI can then be obtained from meter CPIs. Simulation results were used to clarify the basic concepts and implementation of proposed CPI. The field communication measurements acquired from an actual small-scale PLC-based AMI were used to demonstrate the validity of the proposed CPI. From experimental results, it can be observed that the CPIs for each meter and communication path can be assessed and supervised. Long-term monitoring of CPIs for meters, DCUs and communication paths, will be able to identify the weaknesses of communication network and be supportive of the operation of AMI. Other communication factors such as the link quality indicator, received signal strength indicator, signal-to-noise ratio etc. can also be measured and integrated into the proposed CPI and will be further investigated. The proposed CPI can also be used to access and supervise the communication performance of smart cities and will also be studied in future research.
Author Contributions
J.-H.T., C.-W.C. and B.-H.L. proposed and designed the effective and efficient CPI for AMI. J.-H.T., C.-W.C., B.-H.L., W.-H.H. and J.-C.C. worked together to collect the filed measurements of the actual small-scale PLC-based AMI and finished the simulation and experimental results for the communication performance assessment of AMI.
Acknowledgments
This research was financially supported by the “Project for Research on International Energy Policy and Technologies Development on AMI Value-Added Services” of the Institute for Information Industry subsidized by the Ministry of Economy Affairs of Taiwan and Ministry of Science and Technology of Taiwan under Contracts MOST 107-3113-E-110-001 and MOST 104-2221-E-110-042-MY3.
Conflicts of Interest
The authors declare no conflicts of interest.
References
- Samad, T.; Annaswamy, A.M. Controls for smart grids: Architectures and applications. Proc. IEEE 2017, 105, 2244–2261. [Google Scholar] [CrossRef]
- Masera, M.; Bompard, F.E.; Profumo, F.; Hadjsaid, N. Smart (electricity) grids for smart cities: Assessing roles and societal impacts. Proc. IEEE 2018, 106, 613–625. [Google Scholar] [CrossRef]
- Collier, S.E. Ten steps to a smarter grid. IEEE Ind. Appl. Mag. 2010, 16, 62–68. [Google Scholar] [CrossRef]
- Liu, W.-H.E. Analytics and information integration for smart grid applications. In Proceedings of the IEEE Power and Energy Society General Meeting, Detroit, MI, USA, 24–29 July 2010; pp. 1–3. [Google Scholar]
- Farhangi, H. The path of the smart grid. IEEE Power Energy Mag. 2010, 8, 18–28. [Google Scholar] [CrossRef]
- “Global Smart Meter Market Expected to See Huge Rollout”. GlobalData Energy. Available online: https://www.power-technology.com/comment/global-smart-meter-market-expected-see-huge-rollout/ (accessed on 17 September 2018).
- “Advanced Metering Infrastructure Market Research Report—Global Forecast to 2023”. Half-Cooked Research Reports. Available online: https://www.marketresearchfuture.com/reports/advanced-metering-infrastructure-market-5185 (accessed on 20 November 2018).
- Strother, N.; Lockhart, B. Smart Electric Meters, Advanced Metering Infrastructure, and Meter Communications: Global Market Analysis and Forecasts; Navigant Research: Boulder, CO, USA, 2014. [Google Scholar]
- Uribe-Pérez, N.; Hernández, L.; de la Vega, D.; Angulo, I. State of the Art and Trends Review of Smart Metering in Electricity Grids. Appl. Sci. 2016, 6, 68. [Google Scholar] [CrossRef]
- Ghosal, A.; Conti, M. Key Management Systems for Smart Grid Advanced Metering Infrastructure: A Survey. arXiv 2018, arXiv:1806.00121v1. [Google Scholar]
- Sial, A.; Singh, A.; Mahanti, A.; Gong, M. Heuristics-Based Detection of Abnormal Energy Consumption. In Proceedings of the SmartGIFT 2018: Smart Grid and Innovative Frontiers in Telecommunications, Auckland, New Zealand, 23–24 April 2018; pp. 21–31. [Google Scholar]
- Yan, Y.; Qian, Y.; Sharif, H.; Tipper, H. A Survey on Smart Grid Communication Infrastructures: Motivations, Requirements and Challenges. IEEE Commun. Surv. Tutor. 2013, 15, 5–20. [Google Scholar] [CrossRef] [Green Version]
- Matanza, J.; Alexandres, S.; Rodriguez-Morcillo, C. Advanced metering infrastructure performance using European low-voltage power line communication networks. IET Commun. 2014, 8, 1041–1047. [Google Scholar] [CrossRef]
- Chi, H.R.; Tsang, K.F.; Chui, K.T.; Chung, S.H.; Ling, B.W.K.; Lai, L.L. Interference-mitigated ZigBee-based advanced metering Infrastructure. IEEE Trans. Ind. Inform. 2016, 12, 672–684. [Google Scholar] [CrossRef]
- Artale, G.; Cataliotti, A.; Cosentino, V.; Cara, D.; Fiorelli, R.; Guaiana, S.; Panzavecchia, N.; Tinè, G. A new PLC-based smart metering architecture for medium/low voltage grids: Feasibility and experimental characterization. Measurement 2018, 129, 479–488. [Google Scholar] [CrossRef]
- Aalamifar, F.; Lampe, L. Optimized data acquisition point placement for an advanced metering infrastructure based on power line communication technology. IEEE Access 2018, 6, 45347–45358. [Google Scholar] [CrossRef]
- Ancillotti, E.; Bruno, R.; Conti, M. The role of the RPL routing protocol for smart grid communications. IEEE Commun. Mag. 2013, 51, 75–83. [Google Scholar] [CrossRef]
- Yang, Z.; Ping, S.; Sun, H.; Aghvami, A.H. CRB-RPL: A receiver-based routing protocol for communications in cognitive radio enabled smart grid. IEEE Trans. Veh. Technol. 2017, 66, 5985–5994. [Google Scholar] [CrossRef]
- Malandra, F.; Sansò, B. A Markov-modulated end-to-end delay analysis of large-scale RF mesh networks with time-slotted ALOHA and FHSS for smart grid applications. IEEE Trans. Wirel. Commun. 2018, 17, 7116–7127. [Google Scholar] [CrossRef]
- Gentile, C.; Griffith, D.; Souryal, M. Wireless network deployment in the smart grid: Design and evaluation issues. IEEE Netw. 2012, 26, 48–53. [Google Scholar] [CrossRef]
- Jiang, J.; Qian, Y. Distributed communication architecture for smart grid applications. IEEE Commun. Mag. 2016, 54, 60–67. [Google Scholar] [CrossRef]
- Ramírez, D.F.; Céspedes, S.; Becerra, C.; Lazo, C. Performance evaluation of future AMI applications in Smart Grid Neighborhood Area Networks. In Proceedings of the IEEE Colombian Conference on Communication and Computing (IEEE COLCOM 2015), Popayán, Colombia, 13–15 May 2015; pp. 1–6. [Google Scholar]
- Malandra, F.; Sanso, B. PeRF-Mesh: A performance analysis tool for large scale RF-mesh-based smart meter networks with FHSS. In Proceedings of the 2015 IEEE International Conference on Smart Grid Communications (SmartGridComm), Miami, FL, USA, 2–5 November 2015; pp. 792–797. [Google Scholar]
- Vondrouš, O.; Macejko, P.; Hégr, T.; Kocur, Z. Testing methodology for performance evaluation of communication systems for smart grid. In Proceedings of the 2016 2nd International Conference on Intelligent Green Building and Smart Grid (IGBSG), Prague, Czech Republic, 27–29 June 2016; pp. 1–6. [Google Scholar]
- Argoneto, P.; Renna, P. Capacity sharing in a network of enterprises using the Gale–Shapley model. Int. J. Adv. Manuf. Technol. 2013, 69, 1907–1916. [Google Scholar] [CrossRef]
- Liu, Y.K.; Zhang, L.; Tao, F.; Wang, L. Resource service sharing in cloud manufacturing based on the Gale–Shapley algorithm: Advantages and challenge. Int. J. Comput. Integr. Manuf. 2017, 30, 420–432. [Google Scholar]
- Zadeh, L.A. The concept of a linguistic variable and its applications to approximate reasoning-I. Inf. Sci. 1975, 8, 199–249. [Google Scholar] [CrossRef]
- Zadeh, L.A. The concept of a linguistic variable and its applications to approximate reasoning-II. Inf. Sci. 1975, 8, 301–357. [Google Scholar] [CrossRef]
- Teng, J.H.; Liao, S.H.; Wen, C.K. Design of a fully decentralized controlled electric vehicle charger for mitigating charging impact on power grids. IEEE Trans. Ind. Appl. 2017, 52, 1497–1505. [Google Scholar] [CrossRef]
- Hannan, M.A.; Ghani, Z.A.; Mohamed, A.; Uddin, M.N. Real-time testing of a fuzzy-logic-controller-based grid-connected photovoltaic inverter system. IEEE Trans. Ind. Appl. 2015, 51, 4775–4784. [Google Scholar] [CrossRef]
- Chang, E.J.; Hsin, H.K.; Lin, S.Y.; Wu, A.Y. Path-congestion-aware adaptive routing with a contention prediction scheme for network-on-chip systems. IEEE Trans. Comput.-Aided Des. Integ. Circuits Syst. 2014, 33, 113–126. [Google Scholar] [CrossRef]
- Wu, D.; Ci, S.; Wang, H.H.; Katsaggelos, A.K. Application-centric routing for video streaming over multi-hop wireless networks. IEEE Trans. Circuits Syst. Video Technol. 2010, 20, 1721–1734. [Google Scholar] [CrossRef]
- Ma, K.; Liu, X.; Yang, J.; Liu, Z.; Yuan, Y. Optimal Power Allocation for a Relaying-Based Cognitive Radio Network in a Smart Grid. Energies 2017, 10, 909. [Google Scholar] [CrossRef]
Figure 1.
Fuzzy Logic Procedures for the Proposed CPI.

Figure 2.
Membership Functions Used for Proposed CPI. (a) Reading Success Rate; (b) Response Time; (c) CPI.
Figure 2.
Membership Functions Used for Proposed CPI. (a) Reading Success Rate; (b) Response Time; (c) CPI.

Figure 3.
Concept of Minimum Inference Engine.

Figure 4.
Minimum Inference Engine. (a) Reading Success Rate; (b) Response Rate.
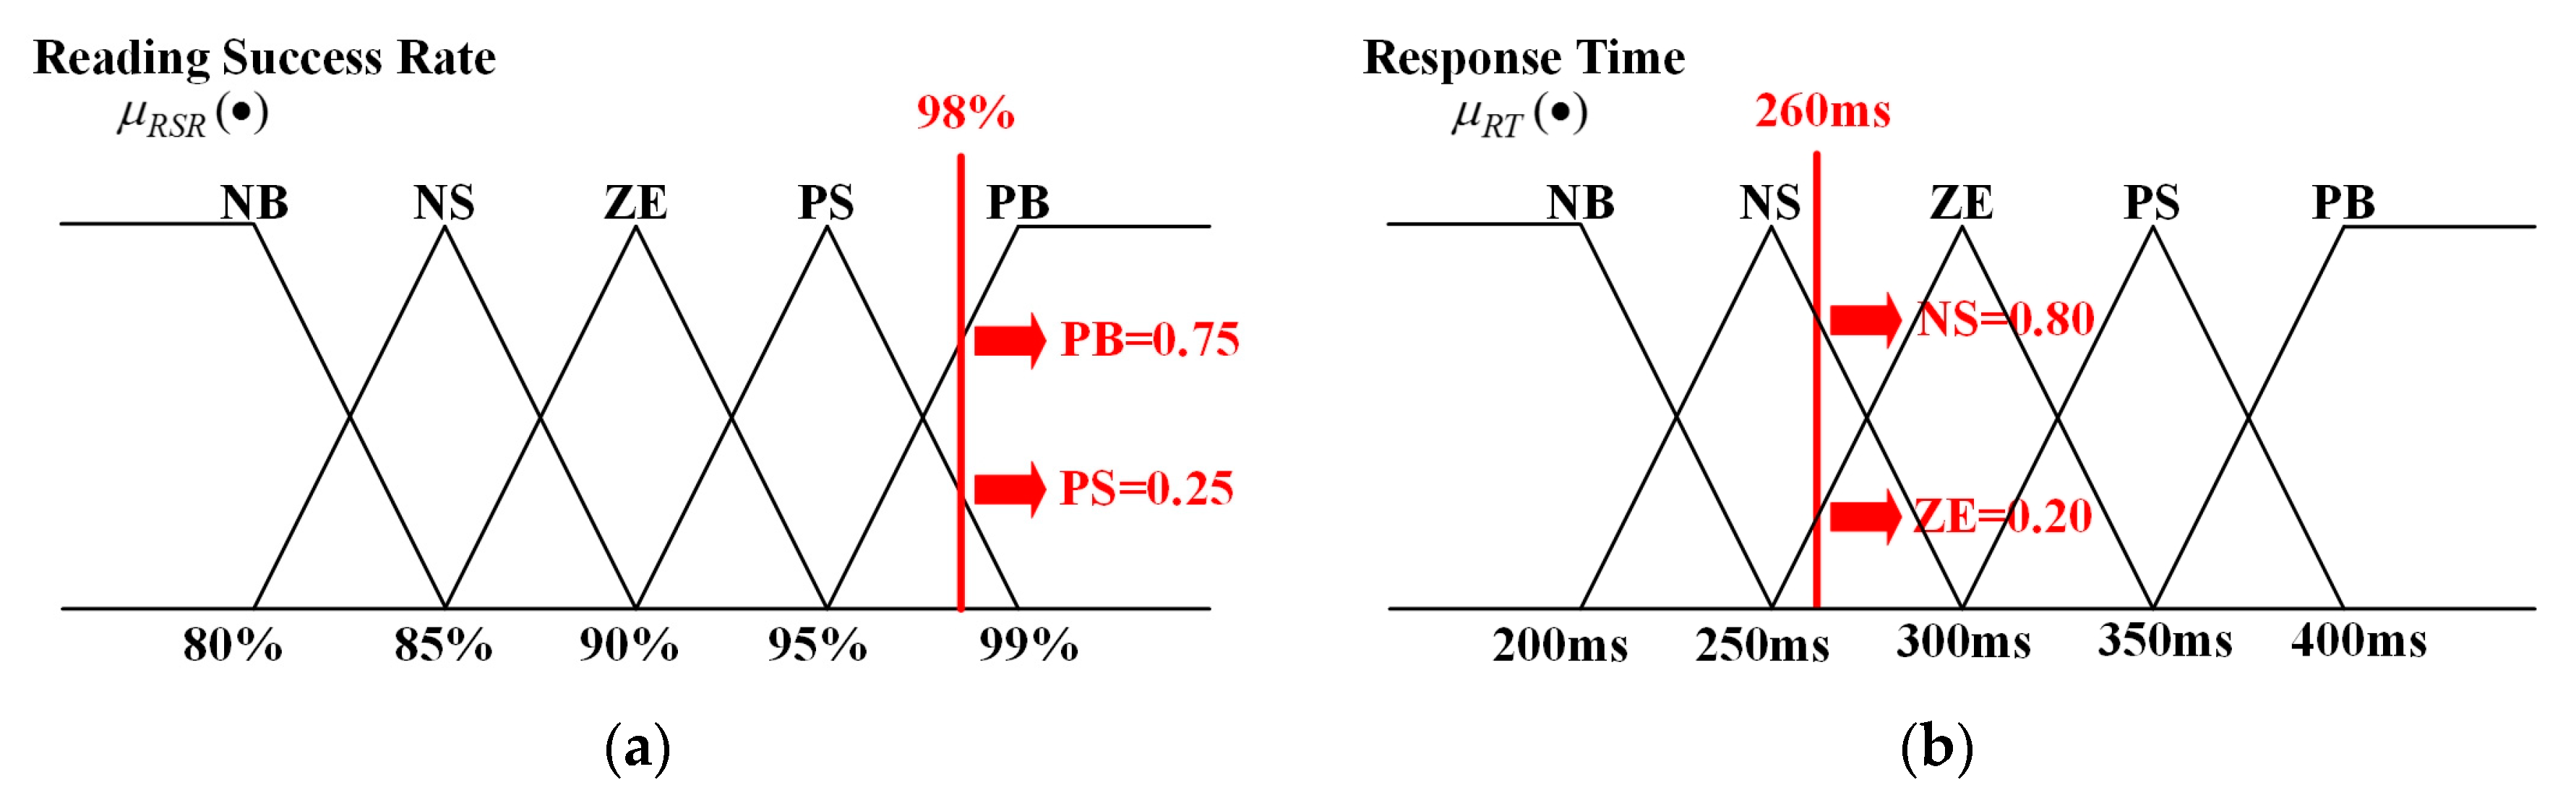
Figure 5.
Results of Fuzzy Rules and Minimum Inference Engine.
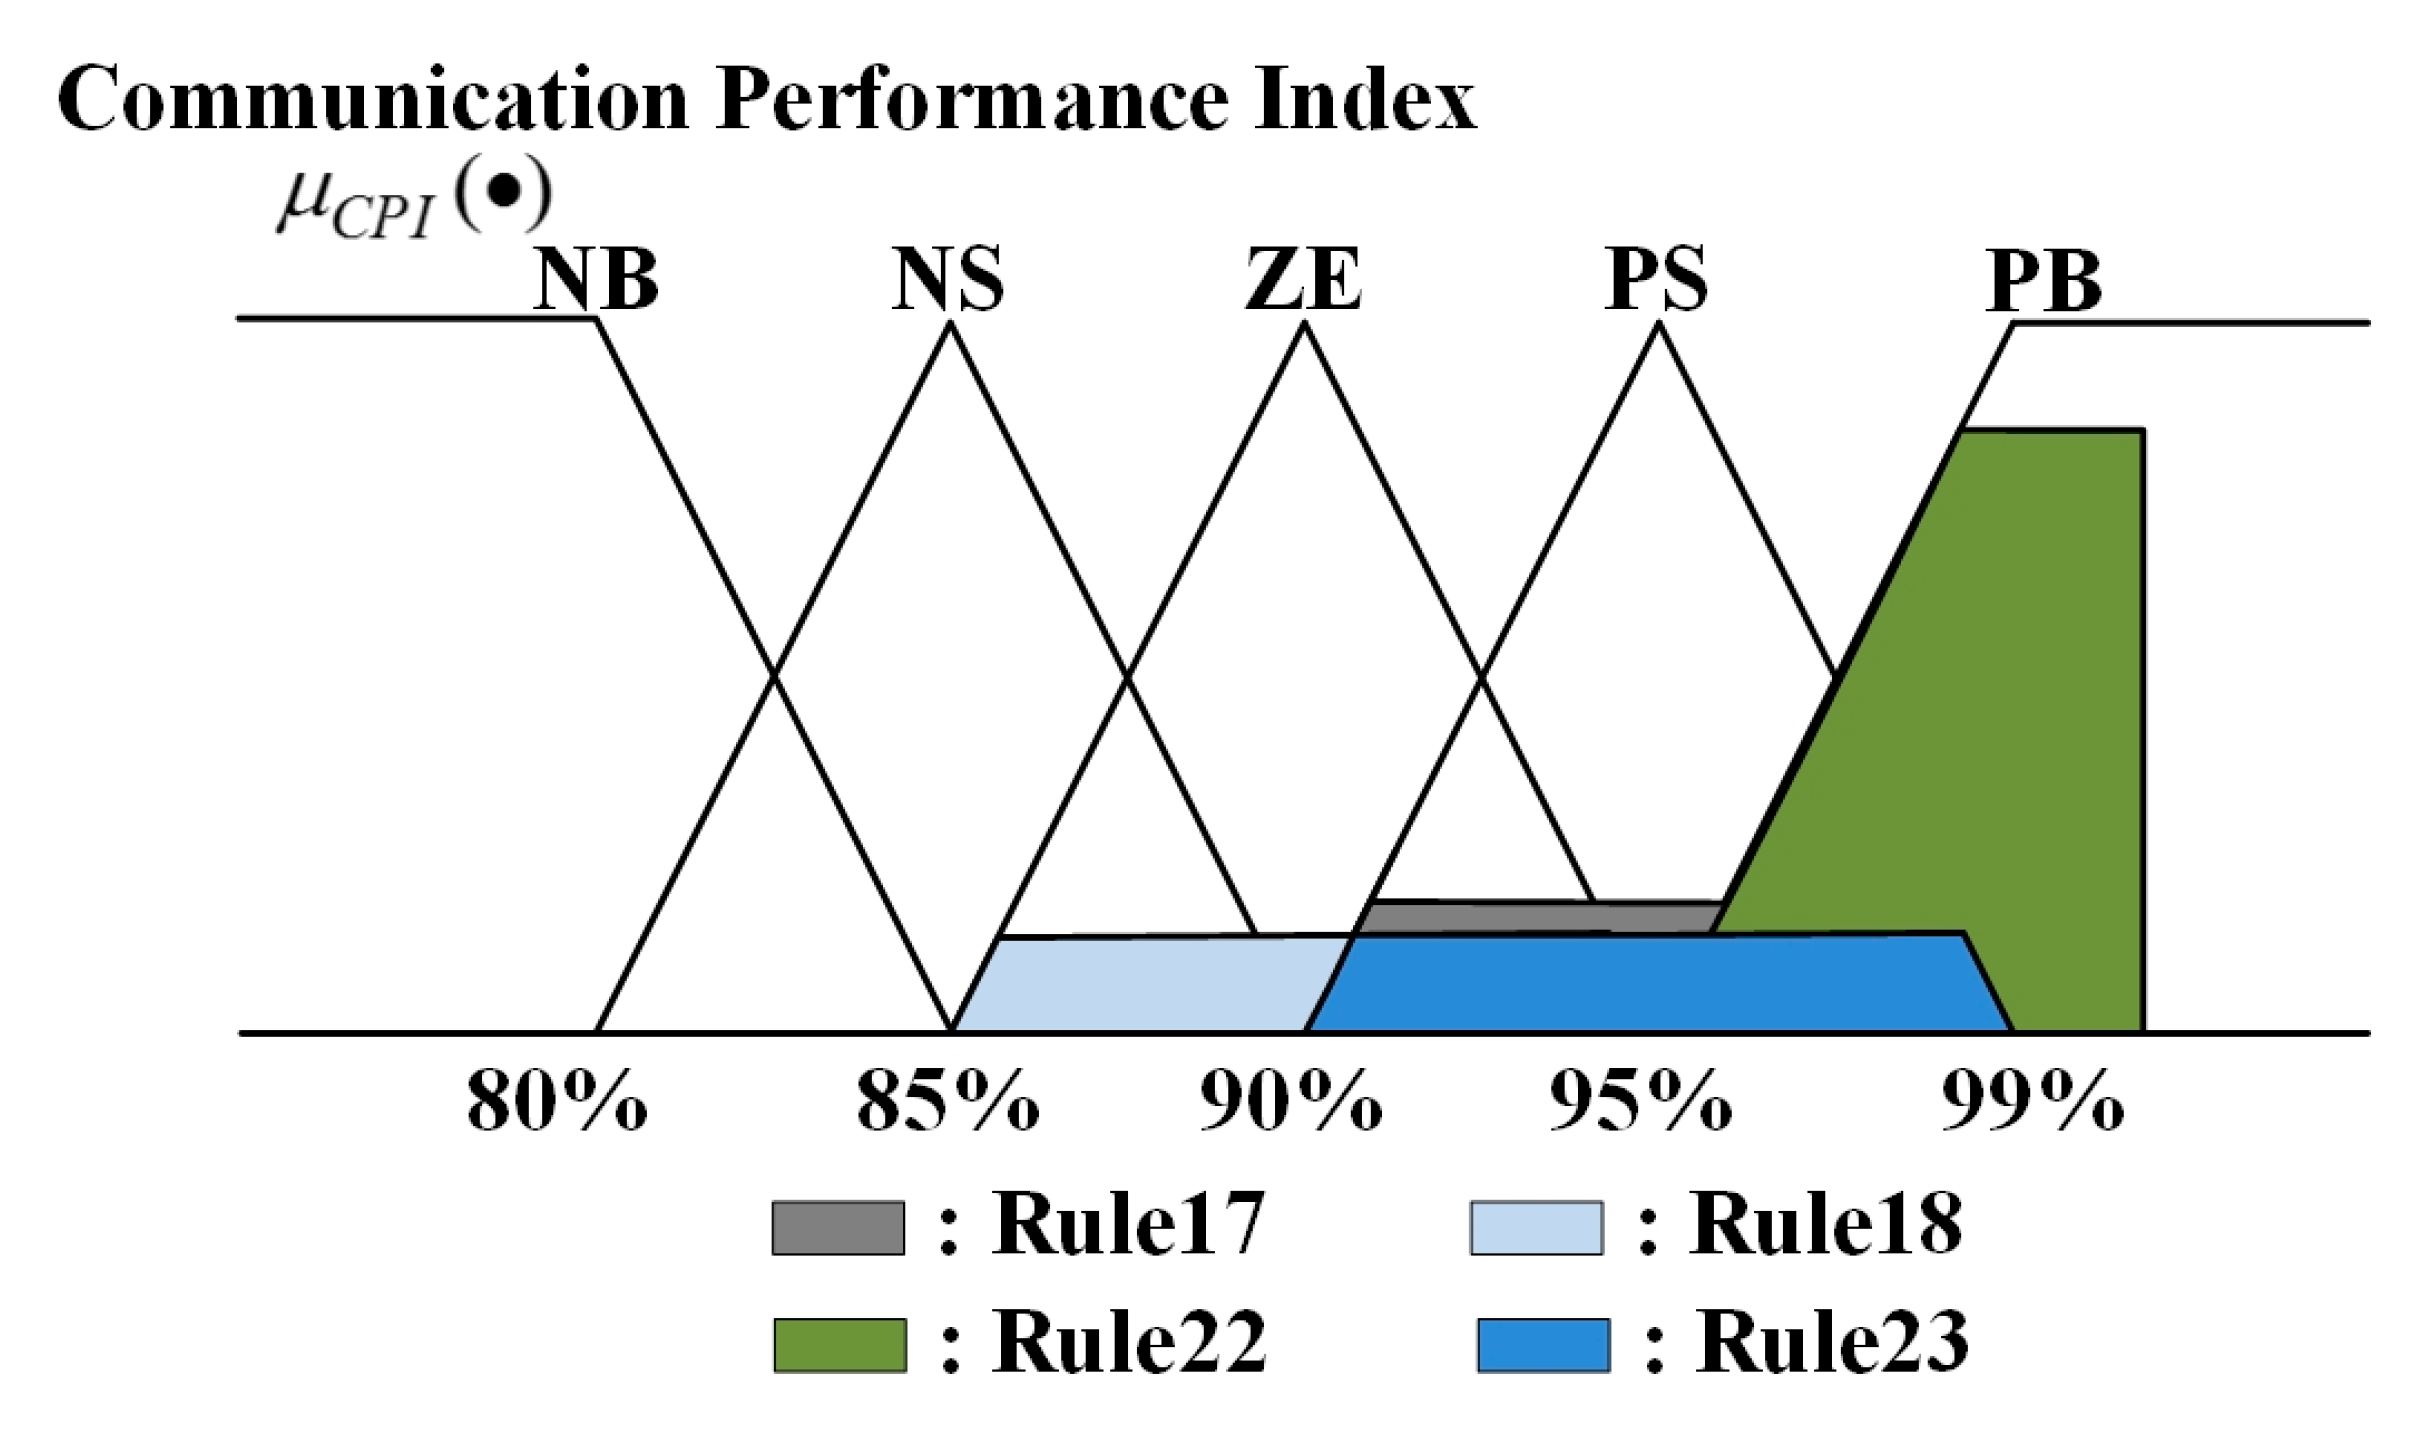
Figure 6.
Part of Communication Network under DCU.

Figure 7.
An Actual Small-Scale PLC-based AMI.

Figure 8.
Communication Network of a Simple Six-Meter Case.

Figure 9.
Measurements and PDs of M1. (a) Reading Success Rate; (b) PD of Reading Success Rate; (c) Response Time; (d) PD of Response Time.
Figure 9.
Measurements and PDs of M1. (a) Reading Success Rate; (b) PD of Reading Success Rate; (c) Response Time; (d) PD of Response Time.

Figure 10.
Measurements and PDs of M4. (a) Reading Success Rate; (b) PD of Reading Success Rate; (c) Response Time; (d) PD of Response Time.
Figure 10.
Measurements and PDs of M4. (a) Reading Success Rate; (b) PD of Reading Success Rate; (c) Response Time; (d) PD of Response Time.
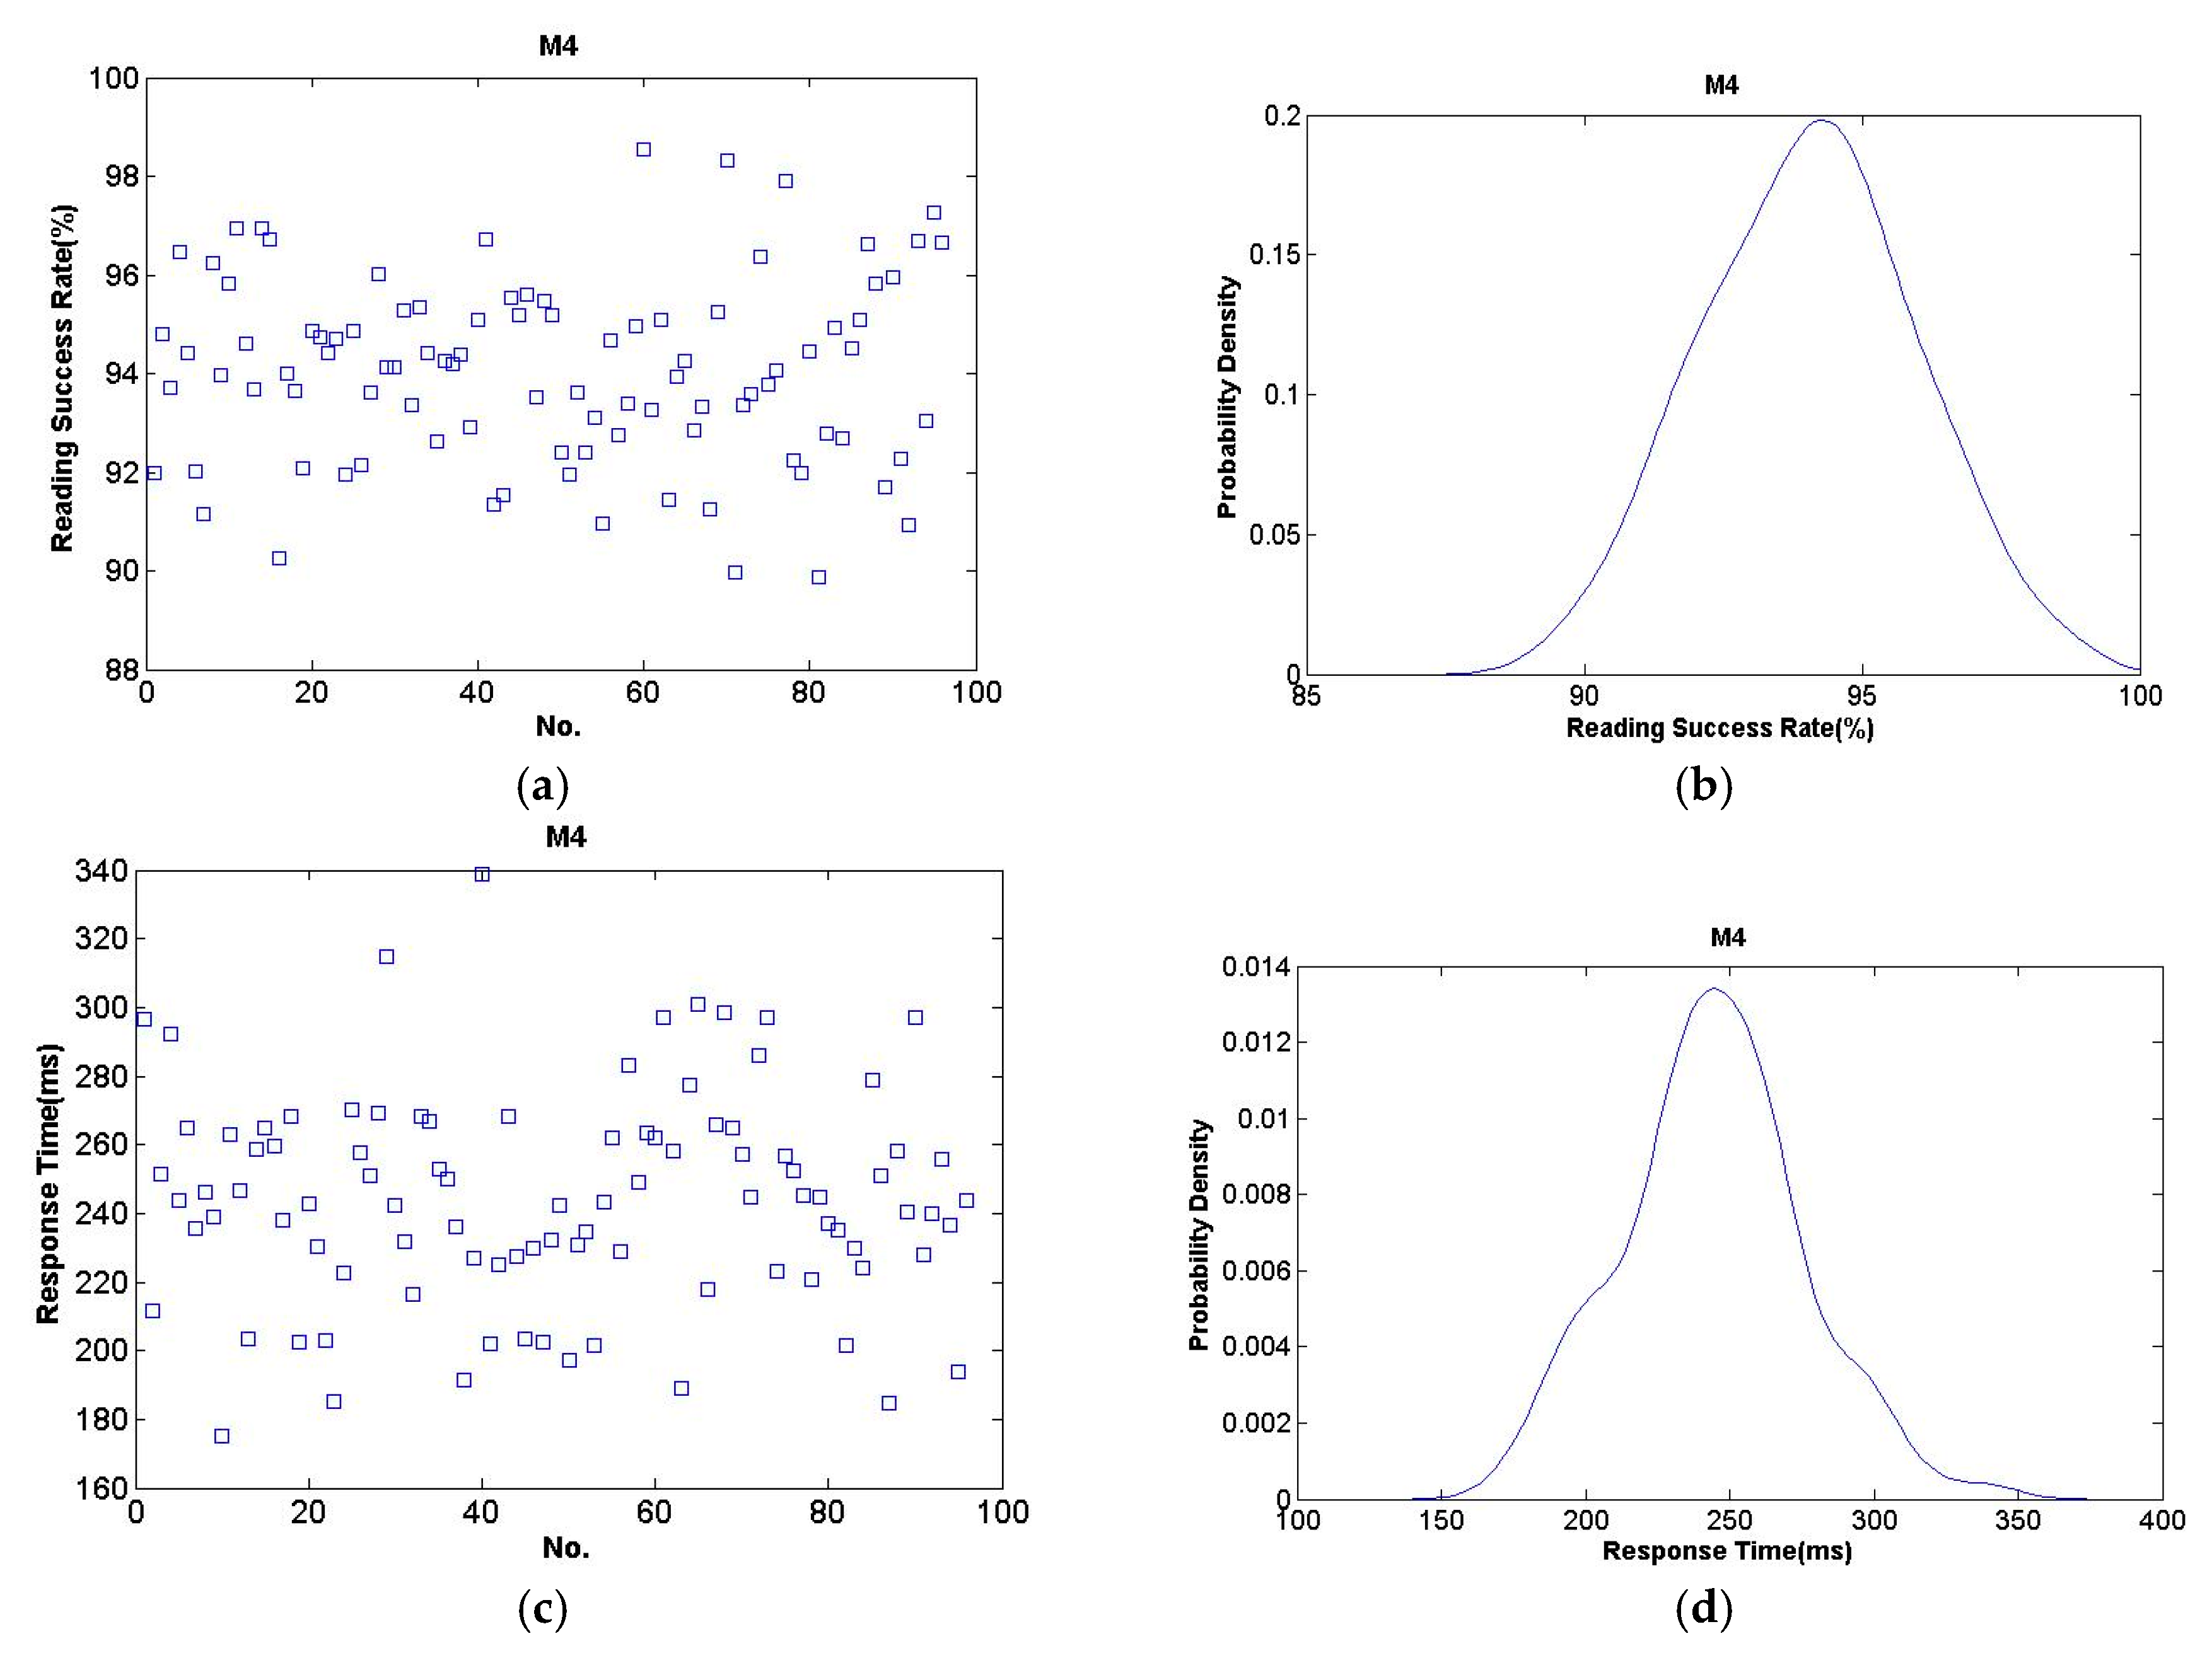
Figure 11.
CPIs for the Six-Meter Case.

Figure 12.
Number of Communication Paths Used for the Six-Meter Case.

Figure 13.
CPIs for the Six-Meter Case after Communication Path Changed.

Figure 14.
Number of Communication Paths Used for the Six-Meter Case after Communication Paths Changed.
Figure 14.
Number of Communication Paths Used for the Six-Meter Case after Communication Paths Changed.

Figure 15.
Communication Network Configuration of Actual Small-Scale PLC-based AMI.

Figure 16.
Membership Function of Response Time for Actual Small-Scale PLC-based AMI.

Figure 17.
Calculated CPIs of Day 1 for Actual Small-Scale PLC-based AMI.

Figure 18.
Calculated Average CPIs from Days 1 to 31 for Actual Small-Scale PLC-based AMI.

Figure 19.
CPIs and 5-Day Average CPIs of Smart Meter M1.

Table 1.
Fuzzy Rules for Proposed CPI.
| RSR * | RT * | ||||
|---|---|---|---|---|---|
| NB | NS | ZE | PS | PB | |
| NB | Rule1 NB | Rule2 NB | Rule3 NB | Rule4 NB | Rule5 NB |
| NS | Rule6 NS | Rule7 NS | Rule8 NB | Rule9 NB | Rule10 NB |
| ZE | Rule11 ZE | Rule12 ZE | Rule13 NS | Rule14 NS | Rule15 NB |
| PS | Rule16 PS | Rule17 PS | Rule18 ZE | Rule19 NS | Rule20 NS |
| PB | Rule21 PB | Rule22 PB | Rule23 PS | Rule24 ZE | Rule25 ZE |
* RT and RSR indicates response time and reading success rate, respectively.
Table 2.
Results of Activated Fuzzy Rules.
| RSR | RT | ||||
|---|---|---|---|---|---|
| NB | NS | ZE | PS | PB | |
| NB | Rule1 NB | Rule2 NB | Rule3 NB | Rule4 NB | Rule5 NB |
| NS | Rule6 NS | Rule7 NS | Rule8 NB | Rule9 NB | Rule10 NB |
| ZE | Rule11 ZE | Rule12 ZE | Rule13 NS | Rule14 NS | Rule15 NB |
| PS | Rule16 PS | Rule17 PS = min(0.25,0.80) | Rule18 ZE = min(0.25,0.20) | Rule19 NS | Rule20 NS |
| PB | Rule21 PB | Rule22 PB = min(0.85,0.80) | Rule23 PS = min(0.85,0.20) | Rule24 ZE | Rule25 ZE |
Table 3.
Communication Paths of the Simple Six-Meter Case.
| Meter | Communication Path |
|---|---|
| 1 | 1→4→DCU |
| 2 | 2→4→DCU |
| 3 | 3→5→4→DCU |
| 4 | 4→DCU |
| 5 | 5→4→DCU |
| 6 | 6→5→DCU |
Table 4.
Meter Number for the Actual Small-Scale PLC-based AMI.
| Meter | ID | Meter | ID | Meter | ID | Meter | ID |
|---|---|---|---|---|---|---|---|
| 1 | 3c4b9 | 15 | 3c4ab | 29 | 3c4ba | 43 | 3c4c9 |
| 2 | 3c4b7 | 16 | 3c4a2 | 30 | 3c493 | 44 | 3c4c8 |
| 3 | 3c4c0 | 17 | 3c487 | 31 | 3c4c1 | 45 | 3c4c7 |
| 4 | 3c4b4 | 18 | 3c484 | 32 | 3c4bf | 46 | 3c4c3 |
| 5 | 3c4b6 | 19 | 3c486 | 33 | 3c4be | 47 | 3c4c5 |
| 6 | 3c4b5 | 20 | 3c485 | 34 | 3c4b1 | 48 | 3c4cc |
| 7 | 3c4b3 | 21 | 3c483 | 35 | 3c4aa | 49 | 3c4bb |
| 8 | 3c4b0 | 22 | 3c482 | 36 | 3c4ac | 50 | 3c4c2 |
| 9 | 3c4af | 23 | 3c47f | 37 | 3c4a4 | 51 | 3c4bc |
| 10 | 3c4ad | 24 | 3c4cf | 38 | 3c4a5 | 52 | 3c4bd |
| 11 | 3c4ae | 25 | 3c480 | 39 | 3c4a6 | 53 | 3c4c6 |
| 12 | 3c4a9 | 26 | 3c481 | 40 | 3c4ce | - | - |
| 13 | 3c4a8 | 27 | 3c4c4 | 41 | 3c4cb | - | - |
| 14 | 3c4a3 | 28 | 3c4b2 | 42 | 3c4ca | - | - |
Table 5.
Field Measurements of M1 for the Actual Small-Scale PLC-based AMI.
| Day | Number of Reading Success | Reading Success Rate (%) | Response Time (ms) | Day | Number of Reading Success | Reading Success Rate (%) | Response Time (ms) |
|---|---|---|---|---|---|---|---|
| 1 | 96 | 100.00 | 381.2 | 17 | 96 | 100.00 | 215 |
| 2 | 96 | 100.00 | 620 | 18 | 84 | 87.50 | 148.6 |
| 3 | 82 | 85.42 | 421.4 | 19 | 65 | 67.71 | 401.7 |
| 4 | 96 | 100.00 | 358.7 | 20 | 77 | 80.21 | 261.7 |
| 5 | 96 | 100.00 | 418.8 | 21 | 84 | 87.50 | 320 |
| 6 | 96 | 100.00 | 293.8 | 22 | 77 | 80.21 | 510 |
| 7 | 96 | 100.00 | 218.8 | 23 | 84 | 87.50 | 364.3 |
| 8 | 96 | 100.00 | 260 | 24 | 77 | 80.21 | 361.7 |
| 9 | 96 | 100.00 | 341.3 | 25 | 73 | 76.04 | 178.6 |
| 10 | 96 | 100.00 | 366.3 | 26 | 96 | 100.00 | 240 |
| 11 | 84 | 87.50 | 400 | 27 | 96 | 100.00 | 547.5 |
| 12 | 77 | 80.21 | 178.3 | 28 | 96 | 100.00 | 386.3 |
| 13 | 96 | 100.00 | 493.8 | 29 | 96 | 100.00 | 205 |
| 14 | 84 | 87.50 | 205.7 | 30 | 96 | 100.00 | 258.7 |
| 15 | 27 | 28.13 | 368.6 | 31 | 96 | 100.00 | 297.5 |
| 16 | 46 | 47.92 | 260 | - | - | - | - |
Table 6.
Average and Standard Deviation of Meter CPIs for the Actual Small-Scale PLC-based AMI.
| Meter | Average of CPI (%) | Standard Deviation of CPI (%) | Meter | Average of CPI (%) | Standard Deviation of CPI (%) | Meter | Average of CPI (%) | Standard Deviation of CPI (%) |
|---|---|---|---|---|---|---|---|---|
| 1 | 89.26 | 9.63 | 19 | 89.80 | 10.05 | 37 | 91.88 | 9.29 |
| 2 | 87.66 | 10.66 | 20 | 88.99 | 10.27 | 38 | 87.24 | 9.94 |
| 3 | 92.03 | 9.36 | 21 | 92.03 | 9.31 | 39 | 87.69 | 10.50 |
| 4 | 87.97 | 10.09 | 22 | 90.40 | 9.29 | 40 | 88.03 | 10.09 |
| 5 | 91.96 | 9.32 | 23 | 87.88 | 8.59 | 41 | 88.67 | 10.74 |
| 6 | 86.64 | 10.28 | 24 | 90.22 | 10.02 | 42 | 88.06 | 9.49 |
| 7 | 87.64 | 10.91 | 25 | 89.91 | 9.23 | 43 | 89.19 | 10.00 |
| 8 | 91.76 | 9.29 | 26 | 88.57 | 9.42 | 44 | 88.31 | 10.12 |
| 9 | 97.30 | 10.50 | 27 | 90.57 | 8.80 | 45 | 87.79 | 9.69 |
| 10 | 88.71 | 10.55 | 28 | 90.31 | 9.12 | 46 | 88.02 | 9.7 |
| 11 | 89.61 | 9.52 | 29 | 88.54 | 9.85 | 47 | 88.61 | 10.00 |
| 12 | 89.88 | 10.91 | 30 | 87.94 | 10.20 | 48 | 88.13 | 10.62 |
| 13 | 89.50 | 9.75 | 31 | 88.10 | 10.64 | 49 | 88.20 | 8.91 |
| 14 | 87.86 | 10.17 | 32 | 89.02 | 10.32 | 50 | 90.34 | 9.41 |
| 15 | 89.06 | 10.59 | 33 | 87.02 | 10.09 | 51 | 88.49 | 10.17 |
| 16 | 89.18 | 9.71 | 34 | 88.09 | 9.18 | 52 | 91.92 | 9.30 |
| 17 | 88.69 | 8.82 | 35 | 89.65 | 9.09 | 53 | 87.96 | 10.13 |
| 18 | 90.63 | 9.03 | 36 | 89.79 | 9.37 |
© 2018 by the authors. Licensee MDPI, Basel, Switzerland. This article is an open access article distributed under the terms and conditions of the Creative Commons Attribution (CC BY) license (http://creativecommons.org/licenses/by/4.0/).
Share and Cite
MDPI and ACS Style
Teng, J.-H.; Chao, C.-W.; Liu, B.-H.; Huang, W.-H.; Chiu, J.-C. Communication Performance Assessment for Advanced Metering Infrastructure. Energies 2019, 12, 88. https://doi.org/10.3390/en12010088
AMA Style
Teng J-H, Chao C-W, Liu B-H, Huang W-H, Chiu J-C. Communication Performance Assessment for Advanced Metering Infrastructure. Energies. 2019; 12(1):88. https://doi.org/10.3390/en12010088
Chicago/Turabian StyleTeng, Jen-Hao, Chia-Wei Chao, Bin-Han Liu, Wei-Hao Huang, and Jih-Ching Chiu. 2019. "Communication Performance Assessment for Advanced Metering Infrastructure" Energies 12, no. 1: 88. https://doi.org/10.3390/en12010088
Note that from the first issue of 2016, this journal uses article numbers instead of page numbers. See further details here.