A Novel Electrochemical Hydrogen Storage-Based Proton Battery for Renewable Energy Storage


1
Mechanical Engineering Department, Thapar Institute of Engineering and Technology, Patiala-147004, India
2
Electrical and Instrumentation Engineering Department, Thapar Institute of Engineering and Technology, Patiala-147004, India
3
Chemical Engineering Department, Thapar Institute of Engineering and Technology, Patiala-147004, India
*
Author to whom correspondence should be addressed.
Energies 2019, 12(1), 82; https://doi.org/10.3390/en12010082
Submission received: 25 November 2018
/
Revised: 7 December 2018
/
Accepted: 7 December 2018
/
Published: 28 December 2018
(This article belongs to the Section D: Energy Storage and Application)
Abstract
:The inherently variable nature of renewable energy sources makes them storage-dependent when providing a reliable and continuous energy supply. One feasible energy-storage option that could meet this challenge is storing surplus renewable energy in the form of hydrogen. In this context, storage of hydrogen electrochemically in porous carbon-based electrodes is investigated. Measurements of hydrogen storage capacity, proton conductivity, and capacitance due to electrical double layer of several porous activated carbon electrodes are reported. The hydrogen storage capacity of the tested electrodes is found in the range of 0.61−1.05 wt.%, which compares favorably with commercially available metal hydride-based hydrogen storage, lithium polymer batteries, and lithium ion batteries in terms of gravimetric energy density. The highest obtained proton conductivity was 0.0965 S/cm, which is near to that of the commercial polymer-based proton conductor, nafion 117, under fully hydrated conditions. The obtained capacitance due to double-layers of the tested electrodes was in the range of 28.3–189.4 F/g. The relationship between specific surface area, micropore volume and hydrogen storage capacity of the carbon electrodes is discussed. The contribution of capacitance to the equivalent hydrogen storage capacity of carbon electrodes is reported. The implications of the obtained experimental results are discussed.
1. Introduction
The regular use of fossil-based fuels for various activities (such as transport, electricity generation, etc.) has led to the increased dependency of humankind on fossil fuels with associated serious consequences and, therefore, has been causing an issue of global warming [1,2,3]. Moreover, the increased consumption of fossil fuels has pushed the available reserves on earth towards depletion [4,5]. These challenges are rendering it mandatory to switch, over coming decades, to a zero-emission renewable energy-based economy [6].
In this historical shift of technology, technologies to harness, store, and transport renewable energy have a vital role to play [7,8,9]. To address this challenge, hydrogen generation from electrolysis of water and storing it for reuse later in fuel cells to give electricity and water was suggested in the early 1970s by Bockris [10]. Hydrogen produced from renewable energy can be stored in several forms and used as an alternative to petroleum, natural gas, and coal-based fuels [11,12]. Moreover, as hydrogen in fuel cells can lead to a zero-emission transportation structure [13,14], as well as providing long-term storage of renewable energy on the main electricity grid systems [15].
Hydrogen may be stored in gaseous, liquid, or solid (as a chemical compound) forms out of which the first two involve heavy energy expenditures. However, solid or electrochemical hydrogen storage has attracted considerable research interest in the past decade because it is comparatively safe to handle hydrogen in solid form [16,17]. In electrochemical storage, hydrogen is held in a porous material via weak chemical bonding with the material’s inner surfaces. However, achieving a high energy-storage density and meeting the US Department of Energy target of 4.5 wt.% for 2020 [17] remains a major challenge to be met by researchers. Hence different porous media for electrochemical hydrogen storage are being explored.
Andrews and Mohammadi (2014) described about the development and testing of a solid metal hydride-based electrode for hydrogen storage, integrated into a reversible polymer electrolyte membrane fuel cell (PEMFC), and named the system as ‘proton battery’. The basic technical viability of a proton battery with a metal hydride-based integrated electrode was shown, but the degree of reversibility of the solid-state hydrogen storage achieved was very low [18,19]. In addition, metal alloys for hydrogen storage are heavy and expensive as they are made from rare earth metals.
Over the last decade, carbon-based materials have emerged as strong potential candidates for electrochemical hydrogen storage [20,21,22,23]. Carbon possesses low atomic mass as compared to the metals generally used in a metal hydride. Besides, low cost, larger internal pore surface area, and availability of precursors are some key advantages that make carbons a preferred medium for electrochemical hydrogen storage [22,23,24,25,26].
The present paper is focused on measuring and comparing the electrochemical hydrogen storage capacities of seven different activated carbon (aC) electrodes produced from phenolic resin and activated with varying quantities of potassium hydroxide (KOH). Measurements of capacitance due to electric double layer and proton conductivity were performed and reported. Electrochemical Impedance Spectroscopy (EIS) was used to measure proton conductivity, cyclic voltammetry for capacitance, and galvanostatic charging and discharging for hydrogen storage capacity of the fabricated electrodes. The results obtained allowed estimation of the share of capacitance in the total equivalent hydrogen storage in the fabricated electrodes, separately to the contribution of Faradaic bonding reactions between hydrogen and carbon atoms. The relationship between the Brunauer-Emmett-Teller (BET) surface area of the various aC electrodes and their hydrogen storage capacity is investigated and discussed, thus improving understanding of the hydrogen storage behavior of aC electrode for fuel cell applications.
2. Materials and Methods
2.1. Fabrication and Characterisation
The activated mesoporous carbon was prepared by KOH chemical activation with different C/KOH ratio at 850 °C for 1 h [27]. The prepared aC samples were named as aC 1:1, aC 1:3, aC 1:5 and aC 1:7. A measured quantity of each aC sample was mixed with commercial PTFE solution of 60 wt. % dispersion in H2O. The PTFE was employed as a binder in the electrode to hold the aC particles together as shown diagrammatically in Figure 1. A set volume of PTFE solution was added so that, after heating and subsequent removal of the solvent by evaporation, the mass of PTFE left in the solid electrode was just enough to join the aC particles together in the form of an electrode. The mixture was stirred and mixed completely in a glass beaker for 1 h at ambient conditions. The beaker containing the mixture and a magnetic stirrer was then heater and stirred simultaneously on a hot plate at a constant temperature of 50°C for 1 h to evaporate solvent and obtain slurry. The slurry was transferred to a mold of rectangular shape (as shown in Figure 2) and baked in a laboratory electric oven for 2 h between 110–120 °C to obtain a solid electrode. Similar procedure was adopted to fabricate all seven electrodes using different aC samples.
The measured values are given in Table 1. A surface area analyzer (Micromeritics, ASAP 2020) was employed to measure nitrogen gas adsorption-desorption isotherms at 77 K for all the carbon samples. Degassing of samples was done under vacuum for 6 h at 350 °C prior to the measurements. The BET method was used to calculate the specific surface area (SSA) [27].
2.2. Conductivity Measurement
An ideal electrode for electrochemical storage of hydrogen needs to conduct both electron and proton [28]. Therefore, both proton and electron conductivity are essential parameters to be considered for selection of any material to be employed in a proton battery as hydrogen storage medium. Electron conductivity of the fabricated aC electrodes was calculated from the measured electrical resistance, known area and thickness of electrode. For electrical resistance, the sample electrode was held between two electrically conductive metal plates and a commercial multi-meter was used to read the resistance directly.
For proton conductivity, resistance of the electrode towards the flow of protons was measured through EIS. The known proton resistance, area and thickness of electrodes were used to determine the proton resistance. The sample aC electrode was soaked in 1 M dilute sulfuric acid for 24 h before testing. Sulfuric acid was to act as a medium for conducting protons within the aC electrode. The acid-soaked electrode was held between two nafion-117 membranes and metal plates, as shown in Figure 3, and impedance was made to pass across the plates. Total resistance of the entire set-up was determined through EIS and the output in the form of a Nyquist plot was obtained between imaginary and real parts of the applied impedance. At the high frequency end of the Nyquist plot any intercept with the real axis is considered to be the total series proton resistance [28]. The individual proton resistances of membranes and plates were deducted from the total value to obtain the aC electrode’s proton resistance. The electron as well as the proton conductivity were calculated by using Equation (1) and know electron and proton resistances.
where;
σp = t/A × R
- σp→ proton conductivity, S/cm.
- t→ thickness of electrode, cm.
- A→ area of electrode, cm2.
- R→ proton resistance of electrode, ohms.
2.3. Measurement of Double-Layer Capacitance
Any metal electrode immersed in a liquid electrolyte forms a particular inter-facial region known as a double-layer [29]. This approach of double-layer associated with opposing charging at metal surface, when immersed in liquid electrolyte, was given by Helmholtz in 1879. Material involved in chemical reaction is affected significantly by an electrical double-layer because it acts as a capacitor when current flows at working electrode which is immersed in liquid electrolyte. Therefore, double-layer capacitance was considered to be an important contributor to aC electrode’s hydrogen storage capacity in the current work. To verify this fact, capacitance of the fabricated aC electrodes associated with double-layer was determined using a split flat coin cell (as shown in Figure 4) and cyclic voltammetry.
Two electrodes of 15 mm diameter were fabricated from sample aC powder to match with cavity in the split flat coin cell as shown in Figure 1. The method of fabrication is mentioned in Section 2.1 of this paper. Both the fabricated electrodes were placed in the cavity of split flat coin cell and were separated by a porous non-conducting filter paper. Dilute sulfuric acid was poured into the cell to serve as electrolyte. The cell was closed tightly, and an electric potential was applied across through electrochemical workstation. A cyclic voltammogram was obtained and used to read the value of peak current which was later used in calculations to calculate the double-layer capacitance from Equation (2).
where,
- C→ capacitance, F/g.
- Ipeak→ peak current, mA.
- Vt→ scan rate, mV/s.
- Mc→ carbon mass in the electrode, g.
2.4. Electrochemical H-Storage Capacity Measurement
Galvanostatic charging followed by galvanostatic discharging was employed at constant currents to determine the electrochemical H-storage capacity. The experimental set-up consisted of a typical 3-electrode electrolytic cell containing the fabricated carbon-based electrode was used as working, platinum wire as counter, and Hg/HgO as reference electrodes respectively (Refer Figure 5). The 3-eletrode electrolytic cell was filled with dilute sulfuric acid (used as electrolyte here) to immerse the electrodes fully. Two separate graduated cylinders were connected to collect the gases over working and counter electrodes as shown in Figure 5 and Figure 6. The volume of collected hydrogen gas was noted and used in calculations later.
The electric potential was applied across the cell to commence charging and a constant current of 150 mA was maintained. A simple electrolysis test on all aC electrodes immersed in sulfuric acid was run prior to galvanostatic charging and discharging to note current and voltage points where hydrogen gas evolution started. The corresponding voltages of all the fabricated electrodes at which the hydrogen gas evolution started were in the range of 1.65–2.0 V. Based upon these results, the charging current was kept less than the marked values to avoid or suppress generation of hydrogen gas during charging.
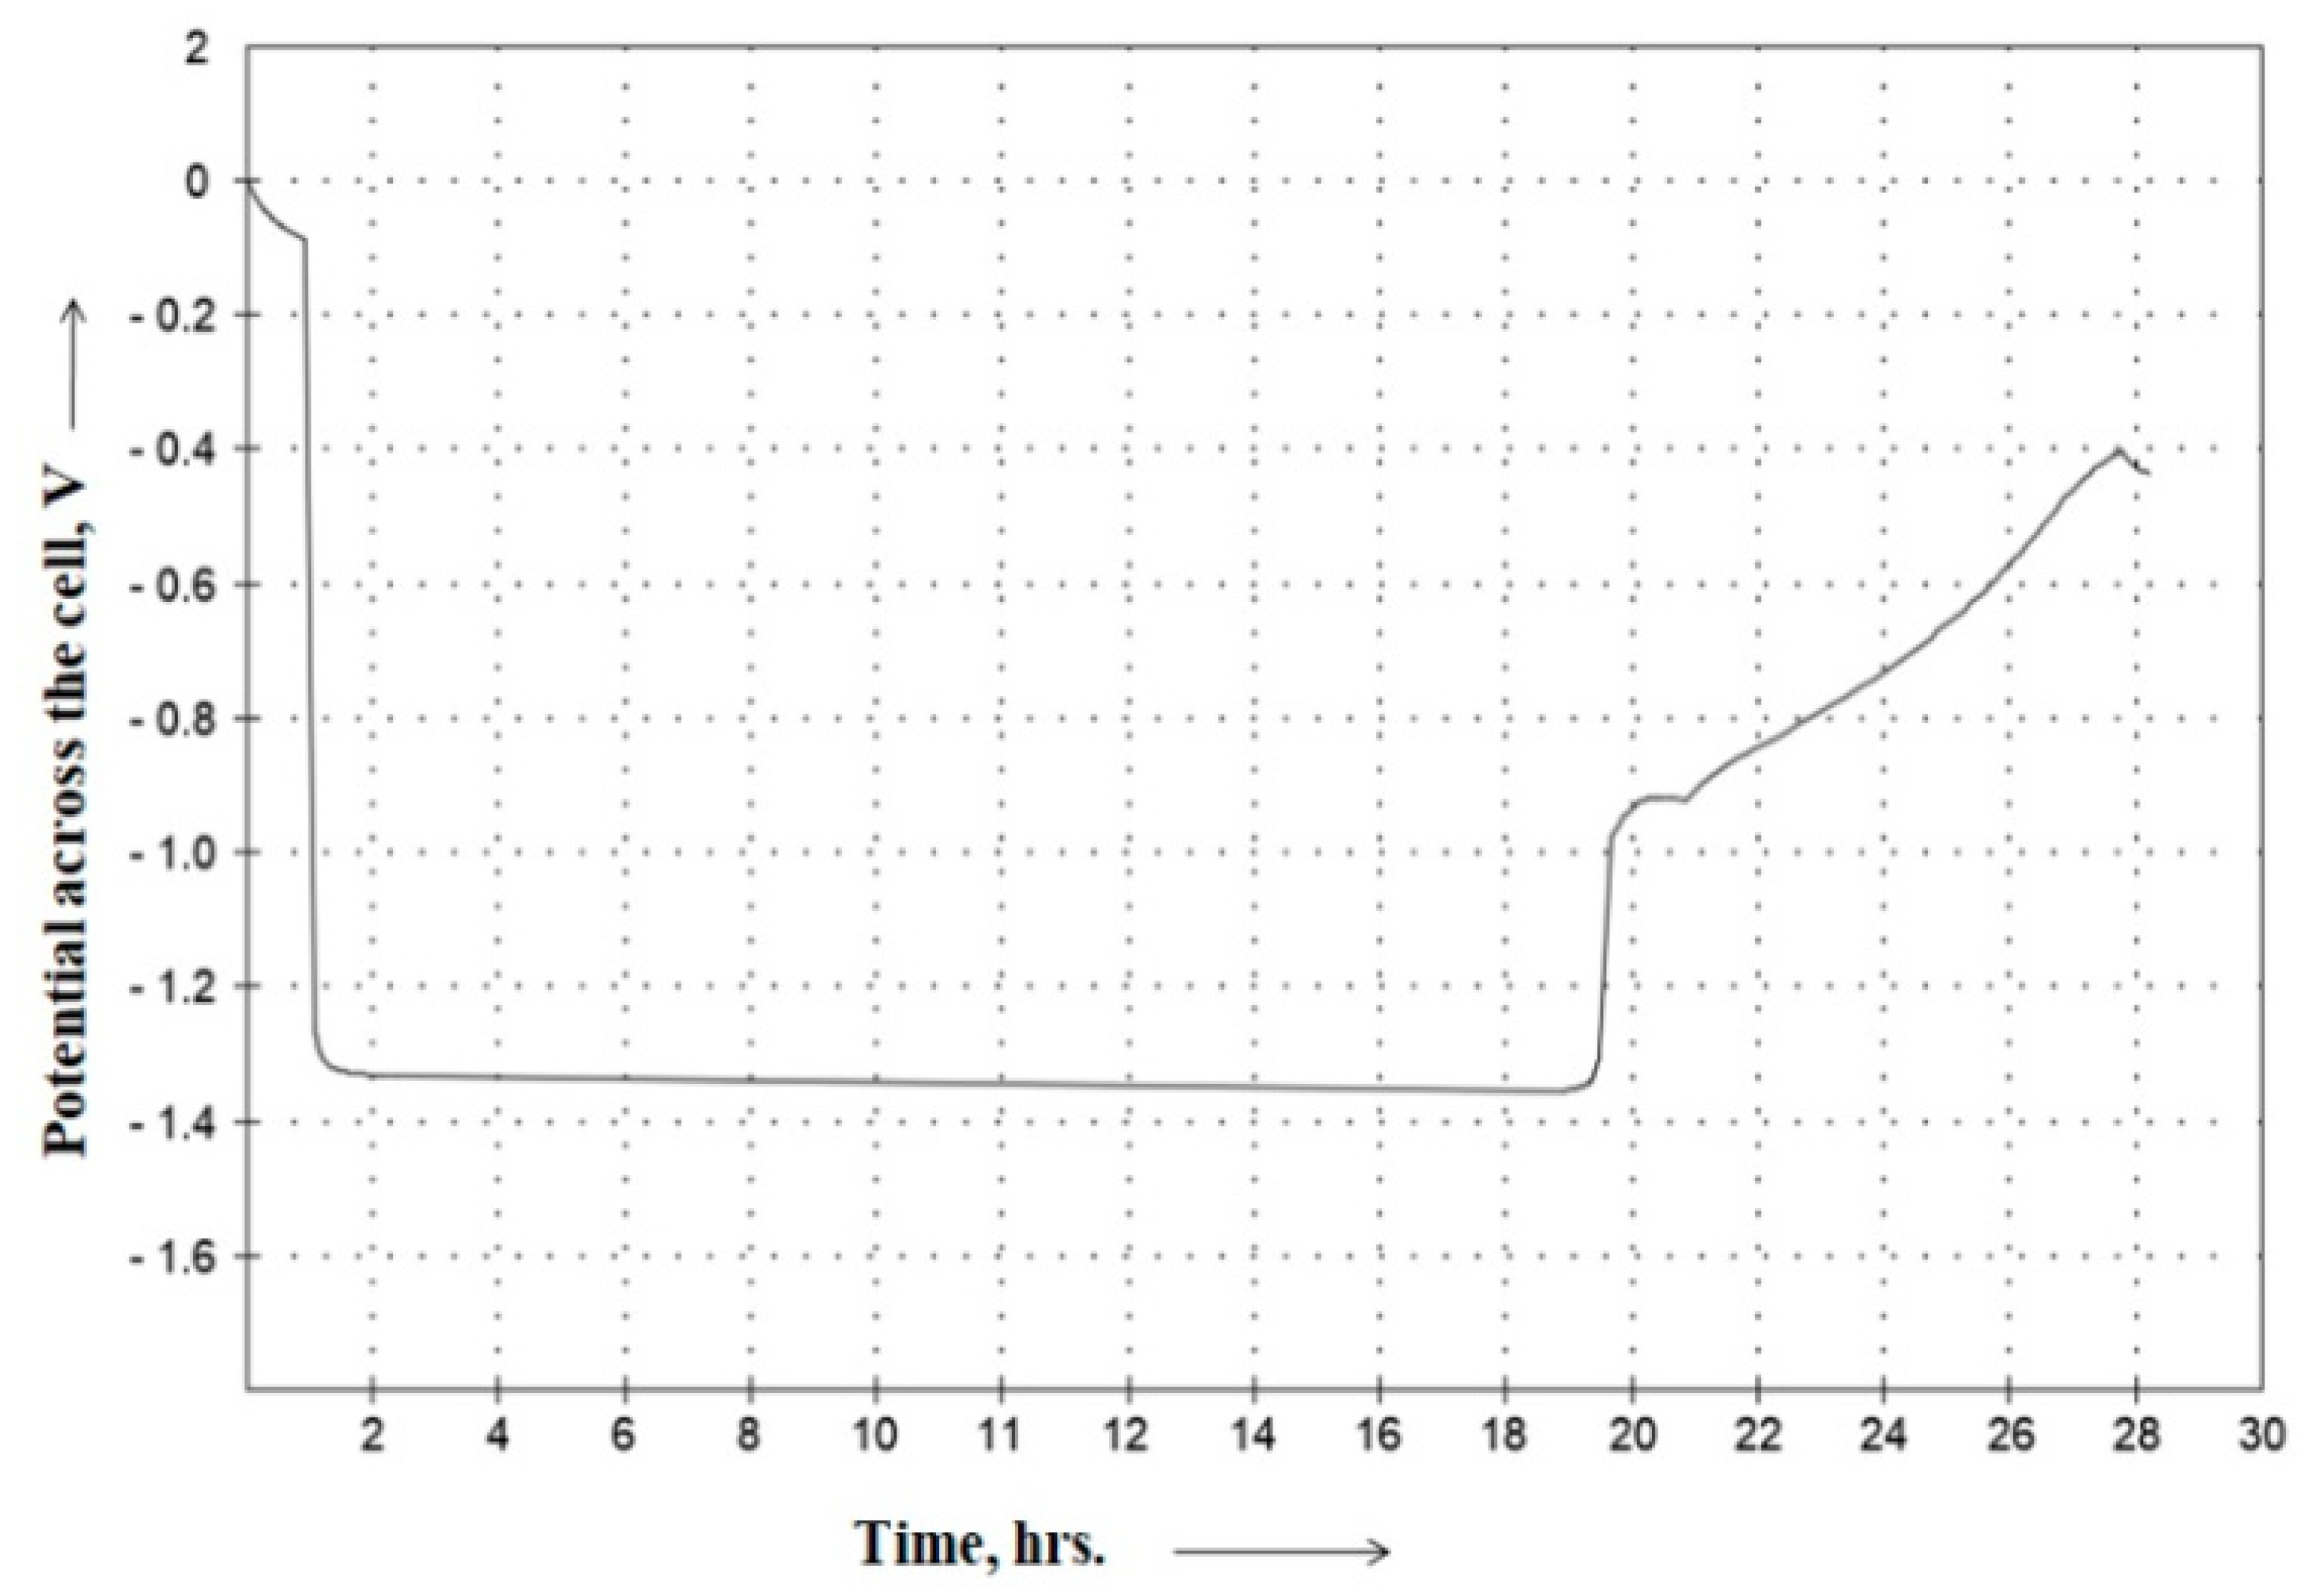
Hydrogen produced from electrolysis during charging of the cell partly entered the working electrode and the rest was liberated as gas. The operation was stopped when rapid generation of hydrogen gas bubbles was observed suggesting that the storage was full. Before starting discharging operation, the set-up was left idle for a couple of hours. For discharging, the current was drawn from the cell using the electrochemical workstation first at a constant value of 80 mA and then at 30 mA. The charging and discharging curves were recorded and are shown in Figure 7 and Figure 8. The discharging operation stopped automatically when the open open-circuit voltage was reached. Total time of discharge for both the cycles (i.e., discharging at 80 mA and at 30 mA) was recorded and used in calculations to estimate the electrochemical hydrogen storage capacity.
The amount of hydrogen produced during charging of the cell at the particular time was estimated from Faraday’s law using Equation (3).
where
H = It/(1000F)
- H→ total hydrogen produced, kg.
- I → current, mA.
- F → Faraday’s constant = 96,485 Coulombs/mol.
- t → time, s.
The amount of hydrogen that came out from the electrode was estimated from the charge flow during discharging. No external power source was used during discharging and charge flow was solely due to the stored hydrogen. The amount of hydrogen released from the electrode was the equivalent amount i.e., hydrogen stored due to chemical reaction and hydrogen stored due to double-layer capacitance effect. The latter was calculated separately and recorded to report its contribution to hydrogen storage capacity of aC. Equation (4) given below was used to calculate mass percent of hydrogen stored in aC.
where,
Mass % = [M/(M + MC)] × 100
- M → hydrogen mass, kg.
- MC→ activated carbon mass in the electrode, kg.
The hydrogen mass % stored in aC electrodes was converted into moles of hydrogen stored per kg of aC using Equation (5). On the other hand, volumetric energy density (VED), refer to the amount of energy stored in a unit volume of the medium for storage, was also calculated from Equation (6) to compare aC with commercially available energy-storage devices.
where,
Mo = (Mass of hydrogen stored in a unit mass of aC)/(molecular weight of hydrogen)
- Mo → moles of hydrogen stored per kg of aC.
VED = (m/1000) × 39.7 × η/ʋ
- m → hydrogen mass stored in electrode, g.
- η→ cell efficiency.
- ʋ→ electrode volume, L.
3. Results
The obtained conductivities (both proton and electron), after testing the sample aC electrodes, are listed in Table 2 below.
It was observed that proton conductivity of aC samples increased with the rise in level of porosity because more acid is accessible for proton conduction. This behavior is shown graphically in Figure 9.
The values of capacitance obtained with respect to the surface areas of sample aCs were found to be fairly close to the literature i.e., earlier results of Vix Guterl et al., 2005, as shown in Table 3. Sulfuric acid used as electrolyte in the presented work is a proton conductor. Due to increased pore volume of the sample aC the amount of sulfuric acid assessable to the deepest pores is more than the non-activated carbons. Hence, this allows more protons to pass through the sample thereby increasing the proton conductivity.
The results of capacitance of aC electrodes when plotted against their BET surface areas, a monotonic relationship was observed as shown in Figure 10, in line with the similar behavior cited in the literature (Vix Guterlet al., 2005). This is mainly due to comparatively larger internal pore surface area that is exposed to the liquid electrolyte and hence creating a larger solid-liquid interface that contributes towards capacitance due to double-layer.
Table 4 shows the calculated mass % of hydrogen that was stored in aC electrode and released during discharging.
Similar to the measured capacitance, H-storage capacity of the tested electrodes increased monotonically with increasing BET surface area, as shown in Figure 11. As expected, higher surface area offers more sites for storage of H+ ions on the pore’s inner surfaces where the hydrogen ions form weak chemical bonds with the storage material and get adsorbed physically in the deepest pores under the influence of Van der Waals forces. Therefore, the electrochemical hydrogen storage capacity of activated carbon material is directly dependent on internal pore surface area.
Table 5 below shows the values of VED of the fabricated aC electrodes calculated from Equation (5) mentioned in the experimental section.
Similar to BET surface area, aC electrodes showed fairly linear behavior in terms of hydrogen storage as it rose steadily with pore volume, as shown in Figure 12. Increased pore volume provides more room for the sulfuric acid to fill the tiniest pore and accommodate more liquid that would serve the medium for hydrogen proton conduction within the aC electrode. Therefore, more pore volume would contain more electrolyte and hence, more protons could travel to the smallest pores that are called ultra-micropores (diameter less 0.7 nm).
Figure 13 shows the contribution of hydrogen storage due to electrochemical reaction (involving charge transfer) and capacitance due to electric double layer (with no charge transfer) separately in the total equivalent stored hydrogen in the tested aC electrodes.With increased BET surface area, more active sites are available for hydrogen ions to travel through the electrolyte and form weak chemical bonds on the internal pore surfaces. Therefore, electrochemical hydrogen storage capacity of samples with high BET surface area is more reaction driven compared to storage due to electrical doublelayer that is dependent on the area of liquid-solid interface.
4. Discussion
The total ohmic resistance of the cell was determined from the Nyquist plot. Since the resistance of current collecting metal plates was very low, the obtained resistance was considered as the comprehensive resistance of the aC electrode and the two nafion membranes. Proton resistance of Nafion-117 membranes was measured separately and deducted from the total resistance to obtain proton resistance of the aC electrode. This value was used to calculate the proton conductivity of the electrode given its known area and thickness.
For same level of hydration, electron conductivity of the tested aC electrodes ranged between 12.86–14.47 S/cm, whereas proton conductivity varied from 0.05 to 0.09 S/cm. With increase in temperature the proton conductivity of sulfuric acid increased from 0.1 to 0.143 S/cm. Also, higher porosity due to activation leads to higher bulk electron conductivity of the electrodes because of the relatively tight packing of the carbon particles around the consecutive pores/voids.
The method mentioned in the materials and methods section of this paper was used to determine the capacitance due to double-layer for all aC electrodes. The values of capacitance obtained with respect to the surface areas of sample aCs were found to be fairly close to the literature i.e., earlier results of Vix Guterl et al., 2005, as shown in Table 3.
The obtained capacitance of the fabricated electrodes ranged between 120.0–189.4 F/g. The results of capacitance of aC electrodes when plotted against their BET surface areas, a monotonic relationship was observed as shown in Figure 9, in line with the similar behavior cited in the literature (Vix Guterlet al., 2005). Among all the samples, aC 1:7 was found to be the best performer in terms of BET surface area of 1922 m2/g and capacitance of 189.4 F/g.
The method mentioned in the materials and method section of this paper was employed to determine the aC electrode’s capacity to store hydrogen electrochemically. A typical 3-electrode electrochemical/electrolytic cell was employed for experimentation and the cell was charged and discharged at constant pressure. With known constant current and discharge time the mass of hydrogen released from the tested aC electrode was estimated using Faraday’s law.
The obtained H-storage capacity of the tested aC electrodes ranged between 0.61–1.05 mass % in the first charge and discharge cycle, whereas in the second cycle it varied from 0.59 to 0.93 mass %. It was observed that the H-storage capacity of all the tested aC electrodes in the second cycle was between 2–8% points lower than in the first charge and discharge cycle. This phenomenon indicates that limited hydrogen penetrated in the electrode during the second charge cycle, while the corresponding hydrogen gas production on the working electrode increased. A possible reason for this variation is that not all the hydrogen stored in the first charge cycle was released from the storage while discharging, thus decreasing the availability of hydrogen storage sites during the second charge cycle.
Please note that the mass of hydrogen stored in sample electrodes and given in Table 6 is the equivalent mass of hydrogen stored due to chemical reaction and double-layer capacitance. The storage of hydrogen due to reaction occurs by two phenomenons—physisorption (physical adsorbtion of hydrogen in tiny pores of aC due to Vander Waals forces) and chemisorption (chemical adsorption where H+ and e− form weak surface chemical bonds with aC). The latter was calculated separately and was found to have contributed significantly (refer Figure 12).
5. Conclusions
All the tested aC electrodes made from phenolic resin showed encouraging figures of electrochemical hydrogen storage. The hydrogen storage capacity was found to be in the range 0.61–1.05 mass %, with a steady rise as the micropore volume and BET surface area of the sample increased. At the upper end of this range, the stored hydrogen mass % is worthy of comparison with the MH-based solid hydrogen cylinders that are commercially available and require 10–20 bar of input pressure. These carbon-based hydrogen storages are also less expensive to produce than a metal hydride system.
While the achieved results in terms of gravimetric energy density of activated carbons is well below the US DoE target of 4.5 wt. %, the latter is for compressed hydrogen gas storage that requires to raise the pressures around 700 bar by spending energy. By contrast this work on electrochemical hydrogen storage is for systems operating at atmospheric pressure and temperature.
Future work will focus on testing the aC electrodes under multiple cycling and investigating their corresponding hydrogen storage capacity. To attain a better understanding between electrochemical hydrogen storage capacity and physical as well as chemical characteristics aC samples with varying pore size distributions, higher micropore volumes and BET surface areas will be fabricated and tested for their H-storage capacities. Other aC samples from different precursors will be tested with proton conducting gel and protic ionic liquid as a replacement for sulfuric acid within aC electrodes for proton conduction. It is outlined to employ aC electrodes made from different precursors into a proton battery and measure its roundtrip efficiency and electrical energy-storage capacity.
Author Contributions
All the listed authors have contributed significantly in the present research work. The design of the experiments was carried out by the first author-A.S.O. The fabrication of the electrode was also done by the first author. P.N. possesses an expertise in electrical circuits and contributed substantially in designing the electrical part of the entire experimentation. The charging and discharging of the cell was carried out by the second author. P.S. did detailed analysis of the results to relate the obtained values with the chemical and physical characteristics of the storage material.
Funding
This research received no external funding.
Conflicts of Interest
The authors declare no conflict of interest. No funding was involved in the presented research work and hence, no funders had any role in the design of the study; in the collection, analyses, or interpretation of data; in the writing of the manuscript, or in the decision to publish the results.
References
- Ramanathan, V.; Feng, Y. Air Pollution, Greenhouse Gases and Climate Change: Global and Regional Perspectives. Atmos. Environ. 2009, 43, 37–50. [Google Scholar] [CrossRef]
- Houghton, J.T.; Ding, Y.; Griggs, D.J.; Noguer, M.; Dai, X.; Maskell, K.; Johnson, C.A. Third Assessment Report of the Intergovernmental Panel on Climate Change; Intergovernmental Panel on Climate Change: Geneva, Switzerland, 2001. [Google Scholar]
- Oreskes, N. The Scientific Consensus on Climate Change. Science 2004, 306, 1686–1699. [Google Scholar] [CrossRef] [PubMed]
- Höök, M.; Tang, X. Depletion of Fossil Fuels and Anthropogenic Climate Change—A Review. Energy Pol. 2013, 52, 797–809. [Google Scholar] [CrossRef]
- Aleklett, K.; Campbell, C.J. The Peak and Decline of World Oil and Gas Production. Miner. Energy 2003, 18, 5–20. [Google Scholar] [CrossRef] [Green Version]
- Panwar, N.L.; Kaushik, S.C.; Kothari, S. Role of Renewable Energy Sources in Environmental Protection: A Review. Renew. Sustain. Energy Rev. 2011, 15, 1513–1524. [Google Scholar] [CrossRef]
- Sathaye, J.; Lucon, O.; Rahman, A.; Christensen, J.; Denton, F.; Fujino, J.; Heath, G.; Kadner, S.; Mirza, M.; Rudnick, H.; et al. IPCC Special Report on Renewable Energy Sources and Climate Change Mitigation; IPCC: Geneva, Switzerland, 2011; pp. 707–790. [Google Scholar]
- Jaramillo, N.L.; Río, P.D. Contribution of Renewable Energy Sources to the Sustainable Development of Islands: An Overview of the Literature and a Research Agenda. J. Sustain. 2010, 2, 783–811. [Google Scholar] [CrossRef] [Green Version]
- Cortez, E.; Moreno-Eguilaz, M.; Soriano, F. Advanced Methodology for the Optimal Sizing of the Energy Storage System in a Hybrid Electric Refuse Collector Vehicle Using Real Routes. Energies 2018, 11, 3279. [Google Scholar] [CrossRef]
- Bockris, J. Energy, The Solar-Hydrogen Alternative, 1st ed.; John Wiley and Sons Inc.: Hawthorne, CA, USA, 1975; ISBN 10:0470084294. [Google Scholar]
- Gracia, L.; Casero, P.; Bourasseau, C.; Chabert, A. Use of Hydrogen in Off-Grid Locations, a Techno-Economic Assessment. Energies 2018, 11, 3141. [Google Scholar] [CrossRef]
- Kharel, S.; Shabani, B. Hydrogen as a Long-Term Large-Scale Energy Storage Solution to Support Renewables. Energies 2018, 11, 2825. [Google Scholar] [CrossRef]
- Andrews, J. Designing a Sustainable Hydrogen Energy Economy. Int. J. Sustain. Des. 2011, 1, 361–380. [Google Scholar] [CrossRef]
- Andrews, J.; Shabani, B. Where does Hydrogen Fit in a Sustainable Energy Economy? Procedia Eng. 2012, 49, 15–25. [Google Scholar] [CrossRef]
- Andrews, J.; Shabani, B. Re-envisioning the role of hydrogen in a sustainable energy economy. Int. J. Hydrogen Energy 2012, 37, 1184–1203. [Google Scholar] [CrossRef]
- Züttel, A.; Borgschulte, A.; Schlapbach, L. Hydrogen as a Future Energy Carrier; Wiley Publications: Hoboken, NJ, USA, 2008. [Google Scholar]
- Oberoi, A.S. Reversible Electrochemical Storage of Hydrogen in Activated Carbons from Victorian Brown Coal and Other Precursors. Ph.D. Thesis, RMIT University, Melbourne, Australia, 2015. [Google Scholar]
- Andrews, J.; Mohammadi, S.S. Towards a ‘Proton Flow Battery’: Investigation of A Reversible PEM Fuel Cell with Integrated Metal-hydride Hydrogen Storage. Int. J. Hydrogen Energy 2014, 39, 1740–1751. [Google Scholar] [CrossRef]
- Mohammadi, S.S. Investigation of a Reversible PEM Fuel Cell with Integrated Metal-Hydride Hydrogen Storage. Master’s Thesis, RMIT University, Melbourne, Australia, 2013. [Google Scholar]
- Lee, S.M.; Park, K.S.; Choi, Y.C.; Park, Y.S.; Bok, J.M.; Bae, D.J.; Nahm, K.S.; Choi, Y.G.; Yu, S.C.; Kim, N.; et al. Hydrogen Adsorption and Storage in Carbon Nanotubes. Synth. Met. 2000, 113, 209–216. [Google Scholar] [CrossRef]
- Jurewicz, K.; Frackowiak, E.; Beguin, F. Electrochemical Storage of Hydrogen in Activated Carbons. Fuel Process. Technol. 2002, 77, 415–421. [Google Scholar] [CrossRef]
- Li, S.; Pan, W.; Mao, Z. A Comparative Study of the Electrochemical Hydrogen Storage Properties of Activated Carbon and Well-Aligned Carbon Nanotubes Mixed with Copper. Int. J. Hydrogen Energy 2005, 30, 643–648. [Google Scholar] [CrossRef]
- Oberoi, A.S.; Andrews, J.; Chaffee, A.L.; Ciddor, L. Hydrogen Storage Capacity of Selected Activated Carbon Electrodes Made from Brown Coal. Int. J. Hydrogrn Energy 2016, 41, 23099–23108. [Google Scholar] [CrossRef]
- Jazaeri, M.J. The Feasibility of a Unitized Regenerative Fuel Cell with a Reversible Carbon-Based Hydrogen Storage Electrode. Master’s Thesis, RMIT University, Melbourne, Australia, 2013. [Google Scholar]
- Guterl, C.V.; Frackowiak, E.; Jurewicz, K.; Friebe, M.; Parmentier, J.; Beguin, F. Electrochemical Energy Storage in Ordered Porous Carbon Materials. Carbon 2005, 43, 1293–1302. [Google Scholar] [CrossRef]
- Heidari, S.; Mohammadi, S.S.; Oberoi, A.S.; Andrews, J. Technical Feasibility of a Proton Battery with an Activated Carbon Electrode. Int. J. Hydrogen Energy 2018, 43, 6197–6209. [Google Scholar] [CrossRef]
- Karthik, M.; Redondo, E.; Goikolea, E.; Roddatis, V.; Doppiu, S.; Mysyk, R. Effect of Mesopore Ordering in otherwise Similar Micro/Mesoporous Carbons on the High-Rate Performance of Electric Double-Layer Capacitors. J. Phys. Chem. 2014, 118, 27715–27720. [Google Scholar] [CrossRef]
- Oberoi, A.S.; Andrews, J. Metal Hydride-Nafion Composite Electrode with Dual Proton and Electron Conductivity. Int. J. Smart Grid Clean Energy 2014, 3, 270–274. [Google Scholar] [CrossRef]
- Scholz, F. Electroanalytical Methods, 1st ed.; Springer: Heidelberg/Berlin, Germany, 2002; Volume 31, pp. 3–8. ISBN 978-3-662-04757-6. [Google Scholar]
Figure 1.
Schematic representing a solid-aC electrode with PTFE binder holding the aC particles together. Grey portion represents PTFE, black as activated carbon particles, and white as empty space. The pattern in the figure does not represent the texture of the electrode.
Figure 1.
Schematic representing a solid-aC electrode with PTFE binder holding the aC particles together. Grey portion represents PTFE, black as activated carbon particles, and white as empty space. The pattern in the figure does not represent the texture of the electrode.

Figure 2.
Mold/die of size 2.5 sq. cm × 0.5 cm used for fabrication of the aC electrode.

Figure 3.
Arrangement of acid-soaked aC electrode, nafion-117 membranes and metal plates for EIS.

Figure 4.
Split flat coin cell of 15 mm diameter.

Figure 5.
Pictorial view of the3-electrode electrolytic cell where WE, CE, and RE refer to as working, counter, and reference electrodes, respectively.
Figure 5.
Pictorial view of the3-electrode electrolytic cell where WE, CE, and RE refer to as working, counter, and reference electrodes, respectively.

Figure 6.
Schematic of the testing system used for hydrogen storage capacity measurement.

Figure 7.
A typical galvanostatic curve of the aC electrode obtained after testing.

Figure 8.
A typical current vs. voltage curve of cell discharging.

Figure 9.
Graph showing relation between pore volume and proton conductivity of the tested electrodes.
Figure 9.
Graph showing relation between pore volume and proton conductivity of the tested electrodes.

Figure 10.
Graph representing relation between BET surface area and capacitance of the tested aC electrodes.
Figure 10.
Graph representing relation between BET surface area and capacitance of the tested aC electrodes.

Figure 11.
Graph showing relation between the stored hydrogen in first charge cycle and BET surface area of the aC electrodes.
Figure 11.
Graph showing relation between the stored hydrogen in first charge cycle and BET surface area of the aC electrodes.

Figure 12.
Graph representing relation between the pore volume and the stored hydrogen in first charge cycle of electrodes.
Figure 12.
Graph representing relation between the pore volume and the stored hydrogen in first charge cycle of electrodes.

Figure 13.
Graph showing contribution of electrochemical reaction and capacitance due electric double layer in equivalent mass of hydrogen stored in aC electrodes.
Figure 13.
Graph showing contribution of electrochemical reaction and capacitance due electric double layer in equivalent mass of hydrogen stored in aC electrodes.


Table 1.
List of various physical characteristics of the tested carbon electrodes.
| Sample Name | BET Surface Area from N2Adsorption (sq. m/g) | Micropore Volume (cu. cm/g) | Meso-Pore Volume (cu. cm/g) | Average Micropore Size nm | Average Meso-Pore Size nm | Bulk Density (g/cu. cm) |
|---|---|---|---|---|---|---|
| aC 1:1 | 988 | 0.286 | 0.44 | 0.68 | 3.26 | ~0.64 |
| aC 1:3 | 1272 | 0.391 | 0.49 | 0.72 | 3.27 | ~0.50 |
| aC 1:5 | 1659 | 0.514 | 0.687 | 0.82 | 3.64 | ~0.42 |
| aC 1:7 | 1923 | 0.585 | 0.805 | 0.92 | 3.68 | ~0.36 |
Table 2.
The obtained values of proton conductivity of the tested electrodes.
| Name of Sample | Electron Resistance (ohm) | Proton Resistance (ohm) | Electron Conductivity (S/cm) | Proton Conductivity (S/cm) |
|---|---|---|---|---|
| aC 1:1 | 0.002 | 0.66 | 12.86 | 0.05 |
| aC 1:3 | 0.002 | 0.46 | 13.35 | 0.07 |
| aC 1:5 | 0.002 | 0.41 | 13.89 | 0.08 |
| aC 1:7 | 0.002 | 0.36 | 14.47 | 0.09 |
| Sulfuric acid * (at 25 °C) | - | 0.5 | - | 0.1 |
| Sulfuric acid * (at 50 °C) | - | 0.35 | - | 0.143 |
* Measured separately by the procedure described in the text in experimental section.
Table 3.
The obtained results of capacitance of the fabricated electrodes and comparisons with the literature.
Table 3.
The obtained results of capacitance of the fabricated electrodes and comparisons with the literature.
| Sample Name | Peak Current (mA) | Scan Rate (mV/s) | BET Surface Area (m2/g) | Capacitance (F/g) | Comparison with Vix Guterl et al., 2005 | |
|---|---|---|---|---|---|---|
| TSA * (m2/g) | Capacitance (F/g) | |||||
| aC 1:1 | 480 | 2 | 989 | 120.0 | 850 | 109 |
| aC 1:3 | 680 | 2 | 1271 | 167.5 | 1470 | 167 |
| aC 1:5 | 720 | 2 | 1658 | 177.3 | 1470 | 167 |
| aC 1:7 | 765 | 2 | 1922 | 189.4 | 2200 | 200 |
* TSA → Total Surface Area of per gram of carbon.
Table 4.
Amount of hydrogen stored electrochemically in the tested aC electrodes and released during discharging.
Table 4.
Amount of hydrogen stored electrochemically in the tested aC electrodes and released during discharging.
| Sample Name | Cycle No. | Discharge Current [mA] | Discharge Time [h] | Hydrogen Mass Stored [mass %] | Hydrogen Mass Stored [mAh/g] | Hydrogen Mass Stored [mol_H/kg_aC] |
|---|---|---|---|---|---|---|
| aC 1:1 | 1 | 80 | 3.75 | 0.61 ± 0.05 | 164.7 | 0.0125 |
| 2 | 30 | 6 | 0.59 ± 0.05 | 159.3 | 0.0121 | |
| aC 1:3 | 1 | 80 | 4 | 0.84 ± 0.05 | 226.8 | 0.0171 |
| 2 | 30 | 8 | 0.79 ± 0.05 | 213.3 | 0.0161 | |
| aC 1:5 | 1 | 80 | 3.75 | 0.94 ± 0.05 | 253.8 | 0.0192 |
| 2 | 30 | 9.25 | 0.91 ± 0.05 | 245.7 | 0.0186 | |
| aC 1:7 | 1 | 80 | 4 | 1.05 ± 0.05 | 283.5 | 0.0214 |
| 2 | 30 | 9.5 | 0.93 ± 0.05 | 251.1 | 0.0189 |
Table 5.
Hydrogen storage capacity of the fabricated aC electrodes with their corresponding volumetric energy densities.
Table 5.
Hydrogen storage capacity of the fabricated aC electrodes with their corresponding volumetric energy densities.
| Sr. No. | Sample Name | Electrode Volume (L) | Stored Hydrogen (g) | Volumetric Energy Storage Density (kWhe/L) |
|---|---|---|---|---|
| 1 | aC 1:1 | 0.003125 | 0.0127 | 0.080 |
| 2 | aC 1:3 | 0.003125 | 0.0128 | 0.081 |
| 3 | aC 1:5 | 0.003125 | 0.0129 | 0.082 |
| 4 | aC 1:7 | 0.003125 | 0.0130 | 0.0825 |
Table 6.
Contribution of electrochemical reaction and capacitance due electric double layer in equivalent mass of hydrogen stored in aC electrodes.
Table 6.
Contribution of electrochemical reaction and capacitance due electric double layer in equivalent mass of hydrogen stored in aC electrodes.
| Sample Name | Equivalent Hydrogen Stored due to Capacitance (wt. %) | Equivalent Hydrogen wt. % Stored due to Reaction (wt. %) | Equivalent Hydrogen Obtained in Discharging (wt. %) |
|---|---|---|---|
| aC 1:1 | 0.12 | 0.49 | 0.61 ± 0.05 |
| aC 1:3 | 0.17 | 0.67 | 0.84 ± 0.05 |
| aC 1:5 | 0.18 | 0.76 | 0.94 ± 0.05 |
| aC 1:7 | 0.19 | 0.86 | 1.05 ± 0.05 |
© 2018 by the authors. Licensee MDPI, Basel, Switzerland. This article is an open access article distributed under the terms and conditions of the Creative Commons Attribution (CC BY) license (http://creativecommons.org/licenses/by/4.0/).
Share and Cite
MDPI and ACS Style
Oberoi, A.S.; Nijhawan, P.; Singh, P. A Novel Electrochemical Hydrogen Storage-Based Proton Battery for Renewable Energy Storage. Energies 2019, 12, 82. https://doi.org/10.3390/en12010082
AMA Style
Oberoi AS, Nijhawan P, Singh P. A Novel Electrochemical Hydrogen Storage-Based Proton Battery for Renewable Energy Storage. Energies. 2019; 12(1):82. https://doi.org/10.3390/en12010082
Chicago/Turabian StyleOberoi, Amandeep Singh, Parag Nijhawan, and Parminder Singh. 2019. "A Novel Electrochemical Hydrogen Storage-Based Proton Battery for Renewable Energy Storage" Energies 12, no. 1: 82. https://doi.org/10.3390/en12010082
Note that from the first issue of 2016, this journal uses article numbers instead of page numbers. See further details here.