Article

Modelling Hourly Global Horizontal Irradiance from Satellite-Derived Datasets and Climate Variables as New Inputs with Artificial Neural Networks

1
Centre for Landscape and Climate Research, School of Geography, Geology and Environment, University of Leicester, University Road, Leicester LE1 7RH, UK
2
Department of Geography, College of Humanities, University of Sulaimani, Kirkuk Road, Sulaimani 46001, Iraq-Kurdistan Region, Iraq
3
National Centre for Earth Observation (NCEO), University of Leicester, University Road, Leicester LE1 7RH, UK
*
Author to whom correspondence should be addressed.
Energies 2019, 12(1), 148; https://doi.org/10.3390/en12010148
Submission received: 3 December 2018 / Revised: 26 December 2018 / Accepted: 31 December 2018 / Published: 2 January 2019

Abstract

:
More accurate data of hourly Global Horizontal Irradiance (GHI) are required in the field of solar energy in areas with limited ground measurements. The aim of the research was to obtain more precise and accurate hourly GHI by using new input from Satellite-Derived Datasets (SDDs) with new input combinations of clear sky (Cs) and top-of-atmosphere (TOA) irradiance on the horizontal surface and with observed climate variables, namely Sunshine Duration (SD), Air Temperature (AT), Relative Humidity (RH) and Wind Speed (WS). The variables were placed in ten different sets as models in an artificial neural network with the Levenberg–Marquardt training algorithm to obtain results from training, validation and test data. It was applied at two station types in northeast Iraq. The test data results with observed input variables (correlation coefficient (r) = 0.755, Root Mean Square Error (RMSE) = 33.7% and bias = 0.3%) are improved with new input combinations for all variables (r = 0.983, RMSE = 9.5% and bias = 0.0%) at four automatic stations. Similarly, they improved at five tower stations with no recorded SD (from: r = 0.601, RMSE = 41% and bias = 0.7% to: r = 0.976, RMSE = 11.2% and bias = 0.0%). The estimation of hourly GHI is slightly enhanced by using the new inputs.

Graphical Abstract

1. Introduction

Several studies have estimated Global Horizontal Irradiance (GHI) from various methods, but a higher temporal resolution of GHI is likely necessary for several applications such as photovoltaic panel and concentrated solar power projects. Recently, the demand for GHI has increased for solar energy projects. This is owing to problems related to non-renewable energies, a lack of other energy sources, increasing the use of energy and potential availability of solar energy [1,2,3,4]. Stations with long historical measurements of GHI are limited because of the cost of installation and maintenance, and issues related to the pyranometers [5]. Therefore, several studies have tried to estimate GHI empirically from the early 20th century until now from other climate variables, namely, Sunshine Duration (SD), Air Temperature (AT), cloud cover, and other variables, using the top-of-atmosphere irradiance on the horizontal surface (TOA) [6,7,8,9,10,11] and with linear regression models [12,13,14]. Recently, machine learning approaches have also been broadly used [15,16], which mostly include Artificial Neural Networks (ANNs), which will be discussed in a later section, Support Vector Machines, Random Forest [5,17,18] and some other machine learning models [19,20]. Some of these and other approaches have used satellite image data and interpolation techniques to cover the limitation of spatial resolution [3,21,22,23].
Geostationary satellites such as Meteosat First Generation (MFG), Meteosat Second Generation (MSG)/Spinning Enhanced Visible, Infrared Imager (SEVIRI), the Japanese Geostationary Meteorological Satellite (GMS), and the Geostationary Operational Environmental Satellite system (GOES) are considered to be more acceptable for obtaining high temporal resolution of GHI data than other satellites. Heliosat-2 is a method that has been widely used for converting satellite images to GHI. The reader is referred to Refs [24,25] for further information about Heliosat-2. Some other approaches can also be found in the literature with the same aim [26,27]. Consequently, several datasets and services are providing GHI data with various spatial and temporal resolutions globally. More detailed information about them can be found in [28]. The HelioClim-3 (HC3) and Copernicus Atmosphere Monitoring Service (CAMS) Radiation Service (CRS) are the most widely used Satellite-Derived Datasets (SDDs) which cover Europe, Africa and Asia [29]. They provide GHI data at the sub-hourly scale and have been built using the Heliosat-2 and Heliosat-4 algorithms, respectively. Their data have been validated in several climate regions, with overall results that show good agreements with quality-controlled ground data [30,31,32,33]. Full information and its availability can be found in [29]. Therefore, this study will use hourly GHI data from HC3 version-5 (HC3v5) and CRS version-3 (CRSv3) and combine them with climate variable ground data in an ANN algorithm for modelling GHI in areas where recorded GHI ground data are scarce.
SDDs have also been utilised with ground data to improve GHI datasets. For instance, Journee et al. in two different studies have merged SDD from MFG and MSG with GHI ground data to make a solar map over Belgium using kriging interpolation [34,35]. A map of GHI has been created by the combination of those datasets. SDDs are also important for other uses, such as for showing long-term trends of GHI over Europe and updating existing records [36]. It has also been used for a crop estimation model [37] and to obtain a coefficient of regression for calibrating a model for the same purpose [38]. Those studies revealed that SDDs are affordable for improving the results of GHI estimation.
Other research has used ANN models to analyse satellite images for estimating GHI and other components of solar radiation. For example, Meteosat-6 images have been analysed to estimate monthly GHI over Turkey [39]. Similarly, Meteosat-9 images have also been used with extra data in a model in Andalusia, Spain [40]. ANNs have also been used with Heliosat-2 for converting multi-spectral MSG images to estimate hourly GHI [41]. In addition, images from the Japanese Multifunctional Transport Satellites (MTSAT) have been analysed and combined with other data in an ANN for predicting GHI [42]. Other studies have analysed satellite images for obtaining climate variable data (such as land surface temperature) which were then paired with ground measurements in a model to estimate GHI [43,44]. Another case is Qin et al. [45], who input monthly precipitation calculated from TRMM satellite data with surface temperature from the Moderate Resolution Imaging Spectroradiometer (MODIS) to a model with GHI as an output. These papers have examined the use of ANNs with some climate parameters from satellite images to estimate GHI, but the high temporal availability of those parameters is limited.
ANNs have also been used to forecast GHI with various data and over various time intervals. For example, HC3, climate variables and other inputs have been analysed in ANN models to forecast GHI in intra-day and 1–6 h ahead in Gran Canary, Spain in two different studies [46,47]. They demonstrated that the SDD improved the forecasting results. Cloud properties and metric velocity data from satellite images with ground data have been used in an ANN model to forecast GHI at 30, 60, 90 and 120 min time scales [48]. Clear sky irradiance on a horizontal surface (Cs) and weather research data have been used to forecast 24 h ahead with an ANN model [49]. Hybrid ANN models have also been used to forecast one hour ahead [2,50]. Those papers demonstrated the role of ANNs in forecasting GHI at various time scales, and the role of SDDs and Cs as inputs to improve the model results. Another study has utilised machine learning algorisms to forecast GHI on a tilted panel based on several inputs namely climate variables, satellite data and solar position [19].
ANNs are considered one of the most powerful algorithms to find relationships between dependent and independent variables. They have been used broadly in literature to estimate GHI and other solar components with different types of data. For instance, geographical and meteorological parameters at different time scales as various inputs have been used with ANN models for a variety of climate regions and countries. For example, two cities in Oman [51]; eight cities [52] and nine cities [53] in China; 195 cities in Nigeria [54]; 27 stations [55], seven cities [56] and 30 cities [57] in Turkey; five stations in Argentina [12]; six cities in the Yucatan peninsula, Mexico [18]; five cities in Italy [58]; four cities in the USA; and two cities [59], 10 cities [60] and 12 cities in Iran [61]; and Cairo city in Egypt [17]. Generally, the results of those models in the literature show good agreement with ground data. This indicates the importance of various types of ANN models and algorithms for estimating GHI. However, those studies mainly focused on daily timescales and in a few cases on monthly scales, not at an hourly time scale, which is the focus of this study.
After an extensive review of recent literature, only four studies have been found that have used ANNs to estimate GHI on the hourly timescale. The studies focused on one city each in Algeria [62], Malaysia [63] and Morocco [64], and on five cities in North Africa and Jordan [5]. They are fully described and compared to this study in Table 1. On the other hand, other studies have estimated Direct Normal Irradiance (DNI) [58,65], Diffuse Horizontal Irradiance (DHI) [66,67] and have forecasted GHI, as mentioned in the previous paragraphs using ANN models on hourly time scales.
The studies (Table 1) also used other machine learning approaches with ANNs, estimated other solar components and estimated timescales, whereas the descriptions in the table are focused on the ANNs for estimating hourly GHI.
It seems clear from the literature that studies using SDDs and combining them with observed climate variables (SD, AT, Relative Humidity (RH) and Wind Speed (WS)) and with TOA and Cs as several new input combinations in an ANN model to estimate hourly GHI are limited. The aim of this study was to model hourly GHI in areas with few ground measurements by using new input variable combinations, which have not been seen in the previously mentioned studies on hourly scales or even on daily scales.

2. Materials and Methods

2.1. Study Site, Ground Data and Satellite-Derived Datasets

The case study is located between latitudes [34°08′20″–37°22′36″], and longitudes [42°32′00″–46°14′29″] in northeast Iraq. The Mediterranean Sea and semi-arid climate regions are seen in the area according to the Koppen classification [68] (Figure 1).
The hourly ground data of SD AT, RH and WS and GHI, were collected from two station types. First, the data from tower stations are all the above variables except SD. The pyranometer used for recording GHI in these stations is the Kipp and Zonen CMP6 Pyranometer. The data were collected for the period 2011–2014 from five stations, some of which lacked data from some years, from the Ministry of Electricity, Kurdistan Regional Government (KRG) (Table 2). Others are automatic stations at which SD is also recorded as well as the above variables. The GHI equipped in these stations is the Vaisala QMS101 Pyranometer. The data were collected from 2013–2016 by the General Directorate of Meteorology and Seismology, KRG, for four stations (Table 3). Both datasets are missing date from some months or years.
The SDDs, which are HC3v5 and CRSv3 with Cs and TOA, are collected from the Solar Radiation Data (SoDa) portal [29]. The SDDs are calculated with the Heliosat-2 and Heliosat-4 algorithms, utilising cloud properties from MSG images; full details can be found at [29,32,69,70]. The temporal resolution of MSG image is 15 min, and its spatial resolution is 5 km in the case study. The data were provided by SoDa based on those resolutions from 15 min, sub-hourly, hourly and monthly data with aggregation. Cs uses the McClear sky model data; full details about this can be found at [71]. The McClear sky is a model for providing hourly GHI under clear-sky conditions which are based on several inputs (solar zenith angle, ground albedo, ozone and water vapour column, aerosol, gases, time interval, location and its elevation) some of the inputs are measured with physical low, and some others came from satellite products [71]. The TOA is irradiance of the sun at the top of the atmosphere, which is calculated, based on blackbody radiation with Stefan–Boltzmann law, and it is adjusted with the sun-earth distance. Then it is multiplied by the cosine of the solar zenith angle of an area to calculate it on a horizontal plane of that area [72]. TOA and Cs are available at SoDa.

2.2. Quality Control of GHI Measurements and Evolution of SDDs

A full quality control procedure was applied to all nine stations of ground measurements to detect systematic errors, to select questionable data and to find gaps and not applicable (NA) values. The quality control procedure is published in a study with full details [73].
The station data were harmonised with SDDs (HC3v5 and CRSv3) and with TOA and Cs. All data were merged into one dataset. The dataset was configured based on true solar time when the solar elevation angle was above 15°. Systematic errors, NA values and a few questionable data points were then removed. In this way, the SDDs are evaluated against quality-controlled ground data. The validation is published in full detail in another study [30].
The output data from the nine stations in the study area in the two mentioned studies from which ground measurements were tested [73] and SDDs were evaluated [30], were used in this study.

2.3. Data Pre-Processing

The data were normalised to 0–1, as is recommended for the ANNs. The input normalised data of SD, AT, RH, WS, Cs, TOA, HC3v5 and CRSv3 were set as ten different inputs. Each input contained some of the above variables in both tower and automatic stations (Table 4). Each set of input combinations were named model-1 (M1) to model-10 (M10). Hereafter, each combination of inputs in each station M1–M10 was trained, and the results were presented using those names, as demonstrated in Table 4. The data in each station were randomly distributed for each model from M1–M10 as training (70%), validation (15%) and test (15%) data.

2.4. Artificial Neural Networks

ANNs are soft computing techniques which are based on how the human brain works. ANNs are considered one of the most powerful algorithms for finding a relationship between inputs and outputs. They have been used broadly in the literature for modelling GHI and have been described in detail (Section 1). ANNs contain three primary layers, which are the input layer, hidden layer and output layer (Figure 2). The weight and bias in each layer’s neurons are adjusted based on the activation function and algorithms for training the model, which depend on error minimising between the desired output and the target.
The neural network fitting toolbox (nftool) of MATLAB R2016a academic use [74] was used in this study. After the data were normalised to 0–1 and inputs and outputs were designated as M1–M10 for each station, the data were divided into training, validation and test sets. The Levenberg–Marquardt backpropagation algorithm was used to train each model with activation functions, sigmoid in the hidden layer and linear in the output layer (Figure 2). The number of neurons in the hidden layer for each model was selected after several tests based on the performance and balance of under or overfitting among the training, validation and test datasets. All other processes such as initial weight and bias and connections between layers were automatically completed.
The Levenberg–Marquardt algorithm was used due to its reduced time required for convergence, and its results are better than others such as the Bayesian Regularization and Scaled Conjugate Gradient in the case of modelling GHI [54,75,76,77]. However, another reason is that we compared the initial results of Levenberg–Marquardt to the other two training algorithms and its results were better than they were. Therefore, it was the only method utilised in this study.
The methodology steps are illustrated in Figure 3.

2.5. Evaluation Criteria

The performance and reliability of the results for models M1–M10 for training, validation and test data against ground measurements were evaluated by statistical indicators such as correlation coefficient (r) in Equation (1), the bias in Equation (2), and the relative bias in Equation (3), the root mean square error (RMSE) in Equation (4), and the relative RMSE (rRMSE) in Equation (5).
r = i = 1 n ( X i X ¯ ) ( Y i Y ¯ ) i = 1 n ( X i X ¯ ) 2 i = 1 n ( Y i Y ¯ ) 2
B i a s = i = 1 n ( Y i X i ) n
r B i a s = B i a s M e a n X i 100
R M S E = i = 1 n ( Y i X i ) 2 n
r R M S E = R M S E M e a n X i 100
where n = the number of observations, Xi = the GHI of ground data and Yi = the estimated GHI.

3. Results

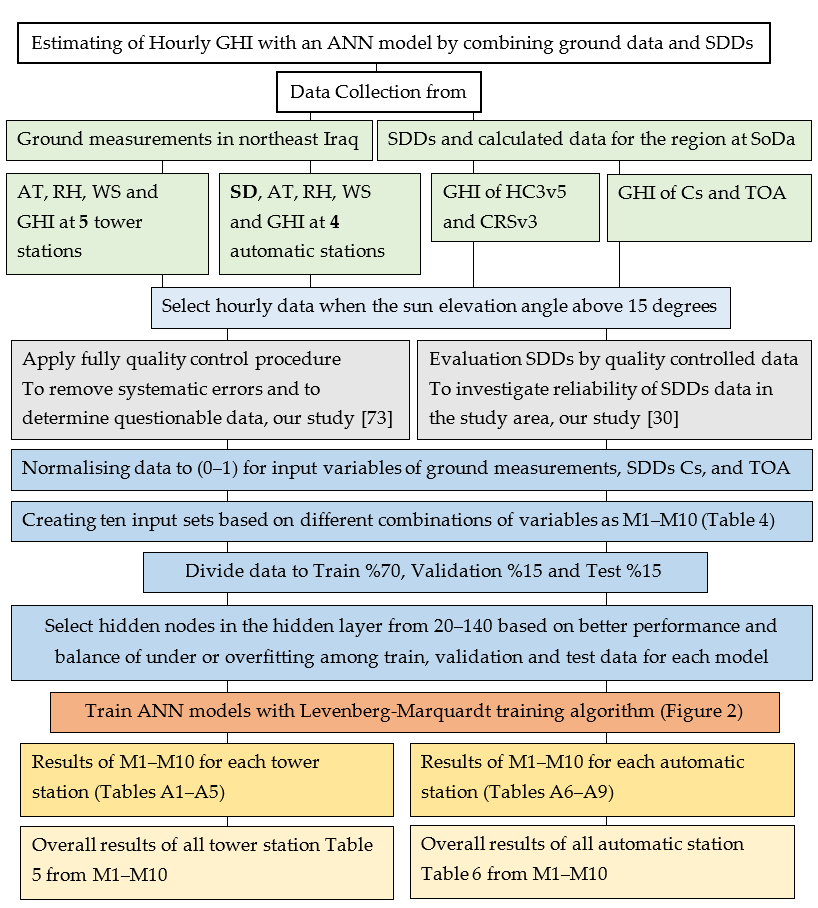
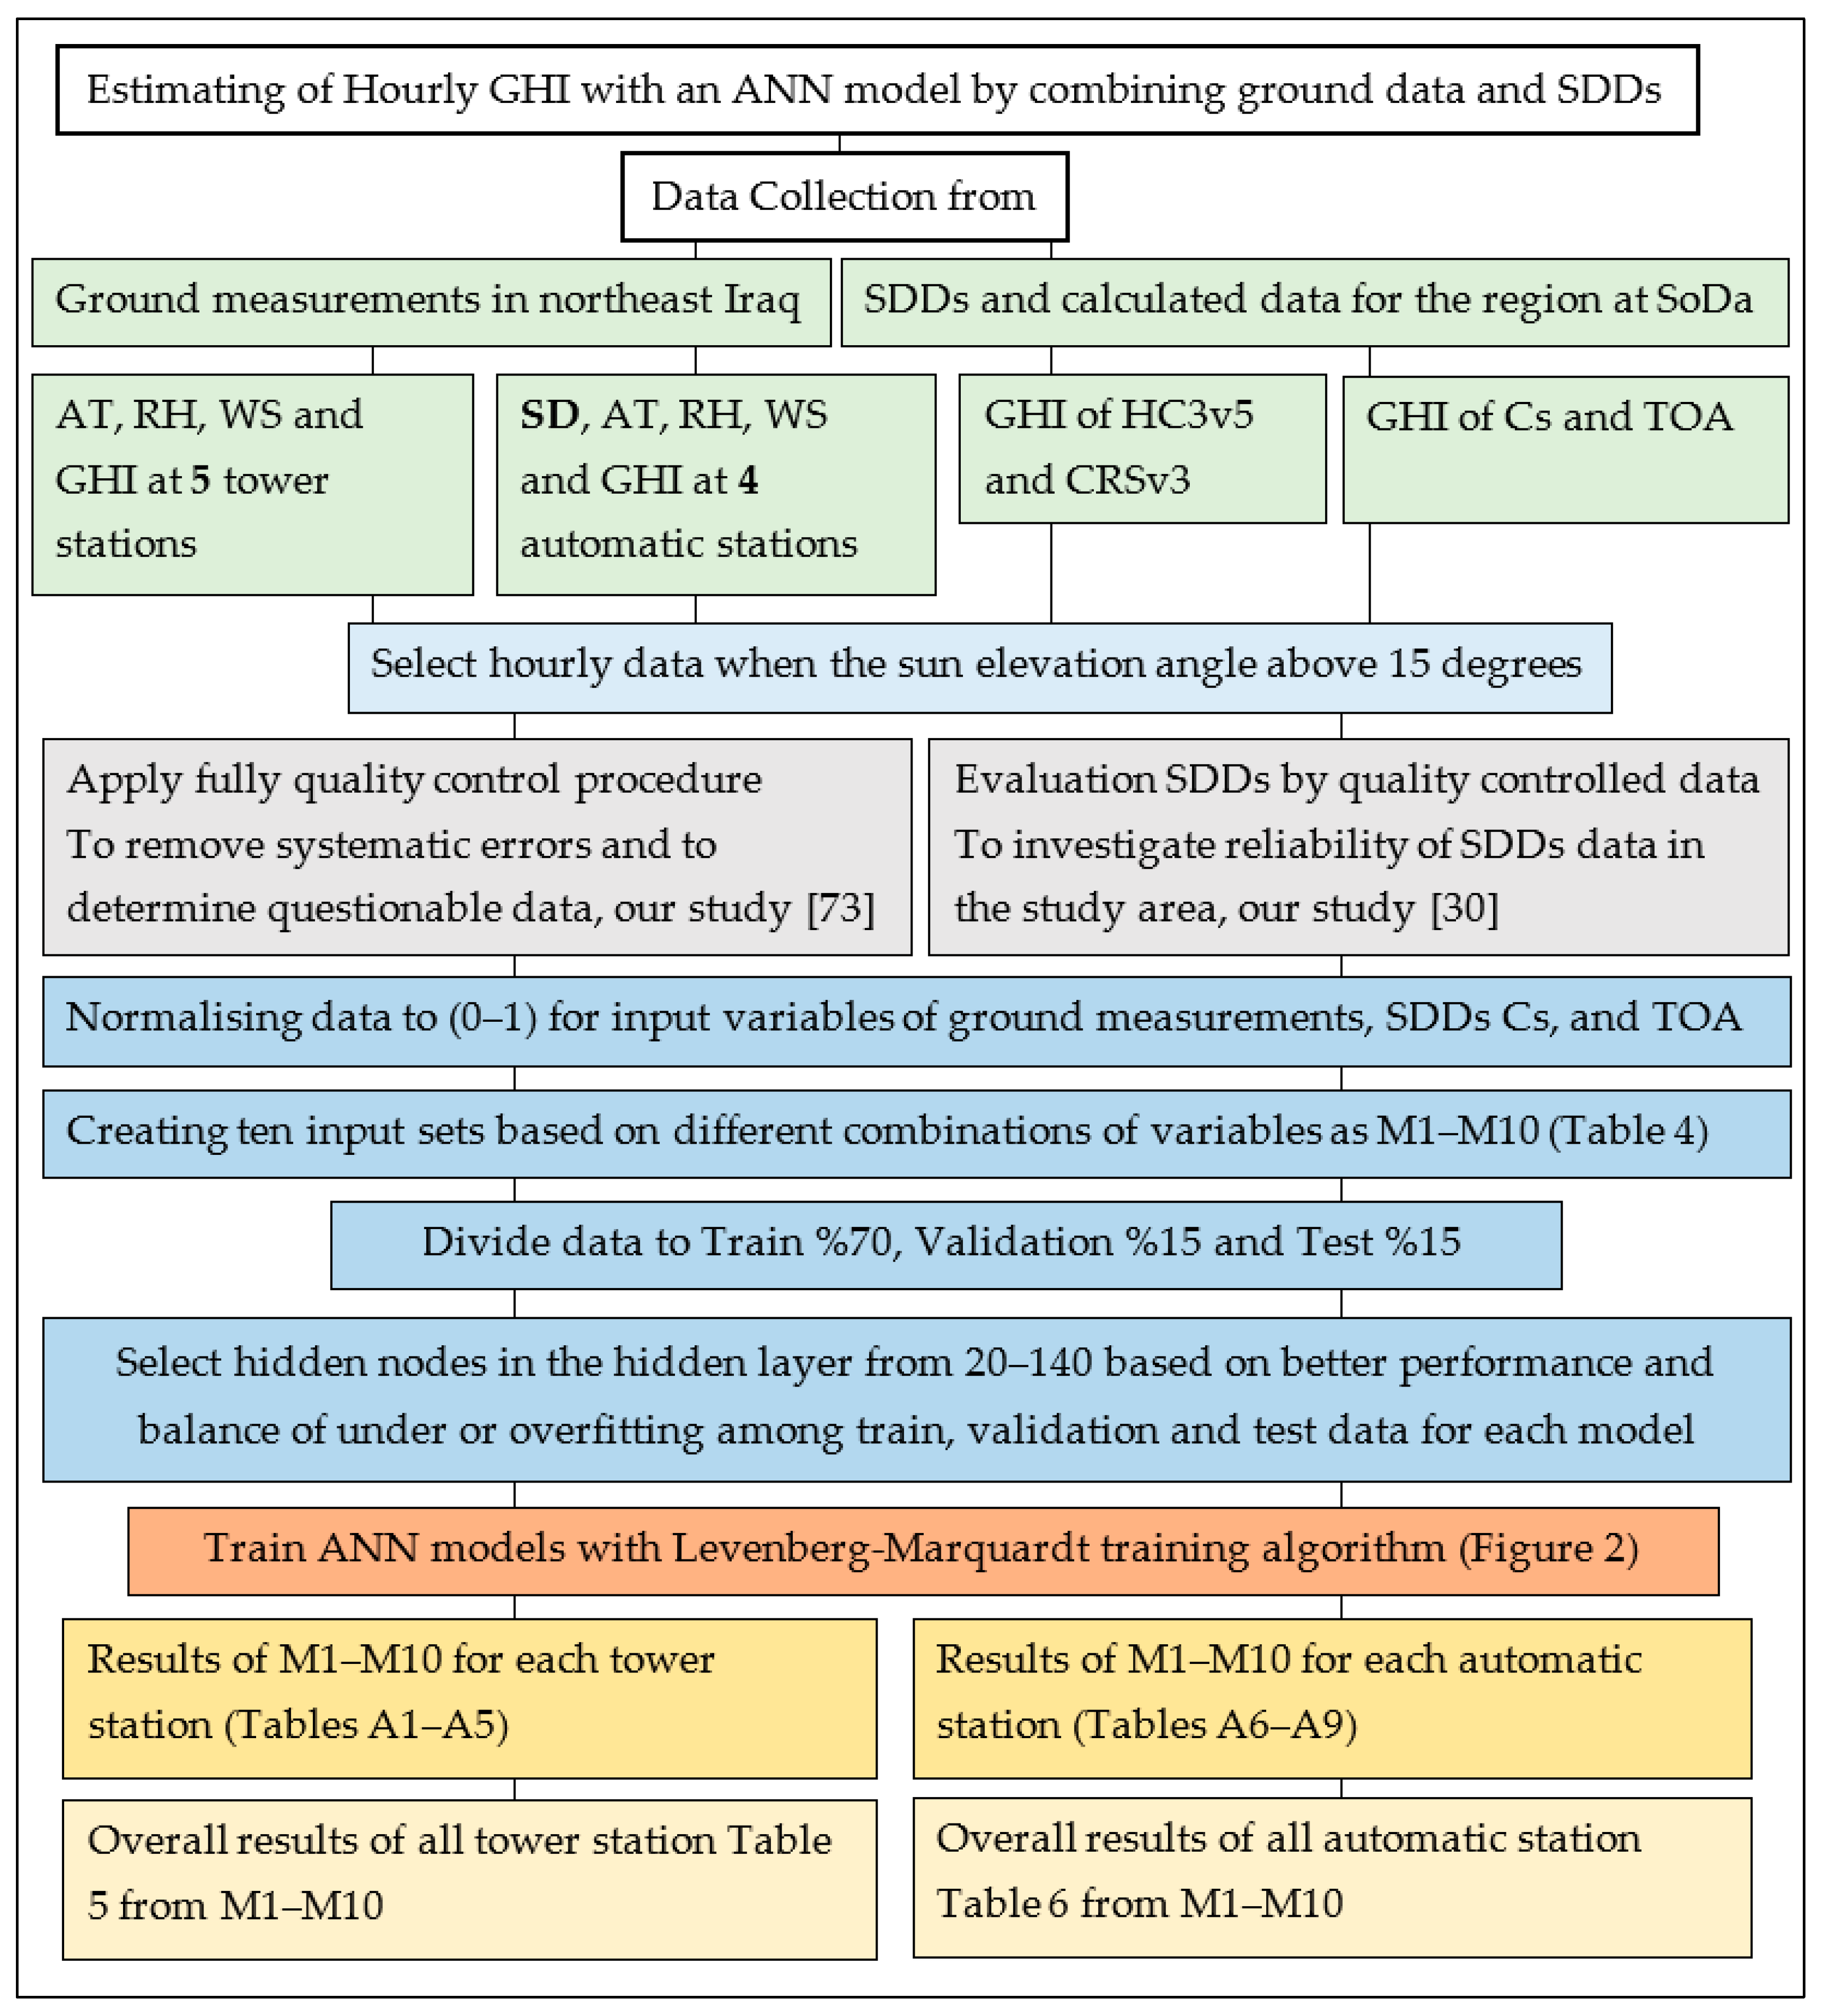
The results of hourly GHI with ANN models from M1–M10 based on variable inputs for training, validation and test data were averaged for four automatic stations and five tower stations and are presented in Table 5 and Table 6 respectively. However, the same results with the number of neurons in the hidden layer, number of datasets used and mean of GHI ground data for every individual station types are presented in Table A1, Table A2, Table A3, Table A4, Table A5, Table A6, Table A7, Table A8 and Table A9 with two Figure A1 and Figure A2 of relative bias and RMSE of test data for further demonstration. Figure 4 and Figure 5 show a further comparison of the relative bias and RMSE between the models and the station types in the test data. In addition, the results of M1–M10 in the test data are shown with scatterplots of ground vs models and estimated vs residuals in Figure 6, Figure 7, Figure 8 and Figure 9 for both station types respectively.
As can be seen in Table 5 (tower stations) and Table 6 (automatic stations), there is no significant difference (the differences are lower than 3% in all individual cases) when comparing training and validation data with test data, which is in line with the stated methodology. Therefore, the results will be presented and discussed according to the models’ independent test data, which is more important to demonstrate the reliability of each model.
The overall results of GHI estimation by ANN models compared to ground data show the better performance of automatic stations than tower stations in all models based on r values, bias and RMSE (Table 5 and Table 6, Figure 4, Figure 5, Figure 6, Figure 7, Figure 8 and Figure 9).
The lowest r value range among the models are 0.601 and 0.755 in M1 for both station types, respectively. The highest r value is 0.983 in M9 automatic stations and 0.976 in M10 tower stations. Other r values range from 0.903–0.982 in both station types (Table 5 and Table 6). Despite both high and low r values, the values of M3 and M5 compared to other remaining values are low in automatic stations. This is also true for M2, M3 and M6 to others at tower stations.
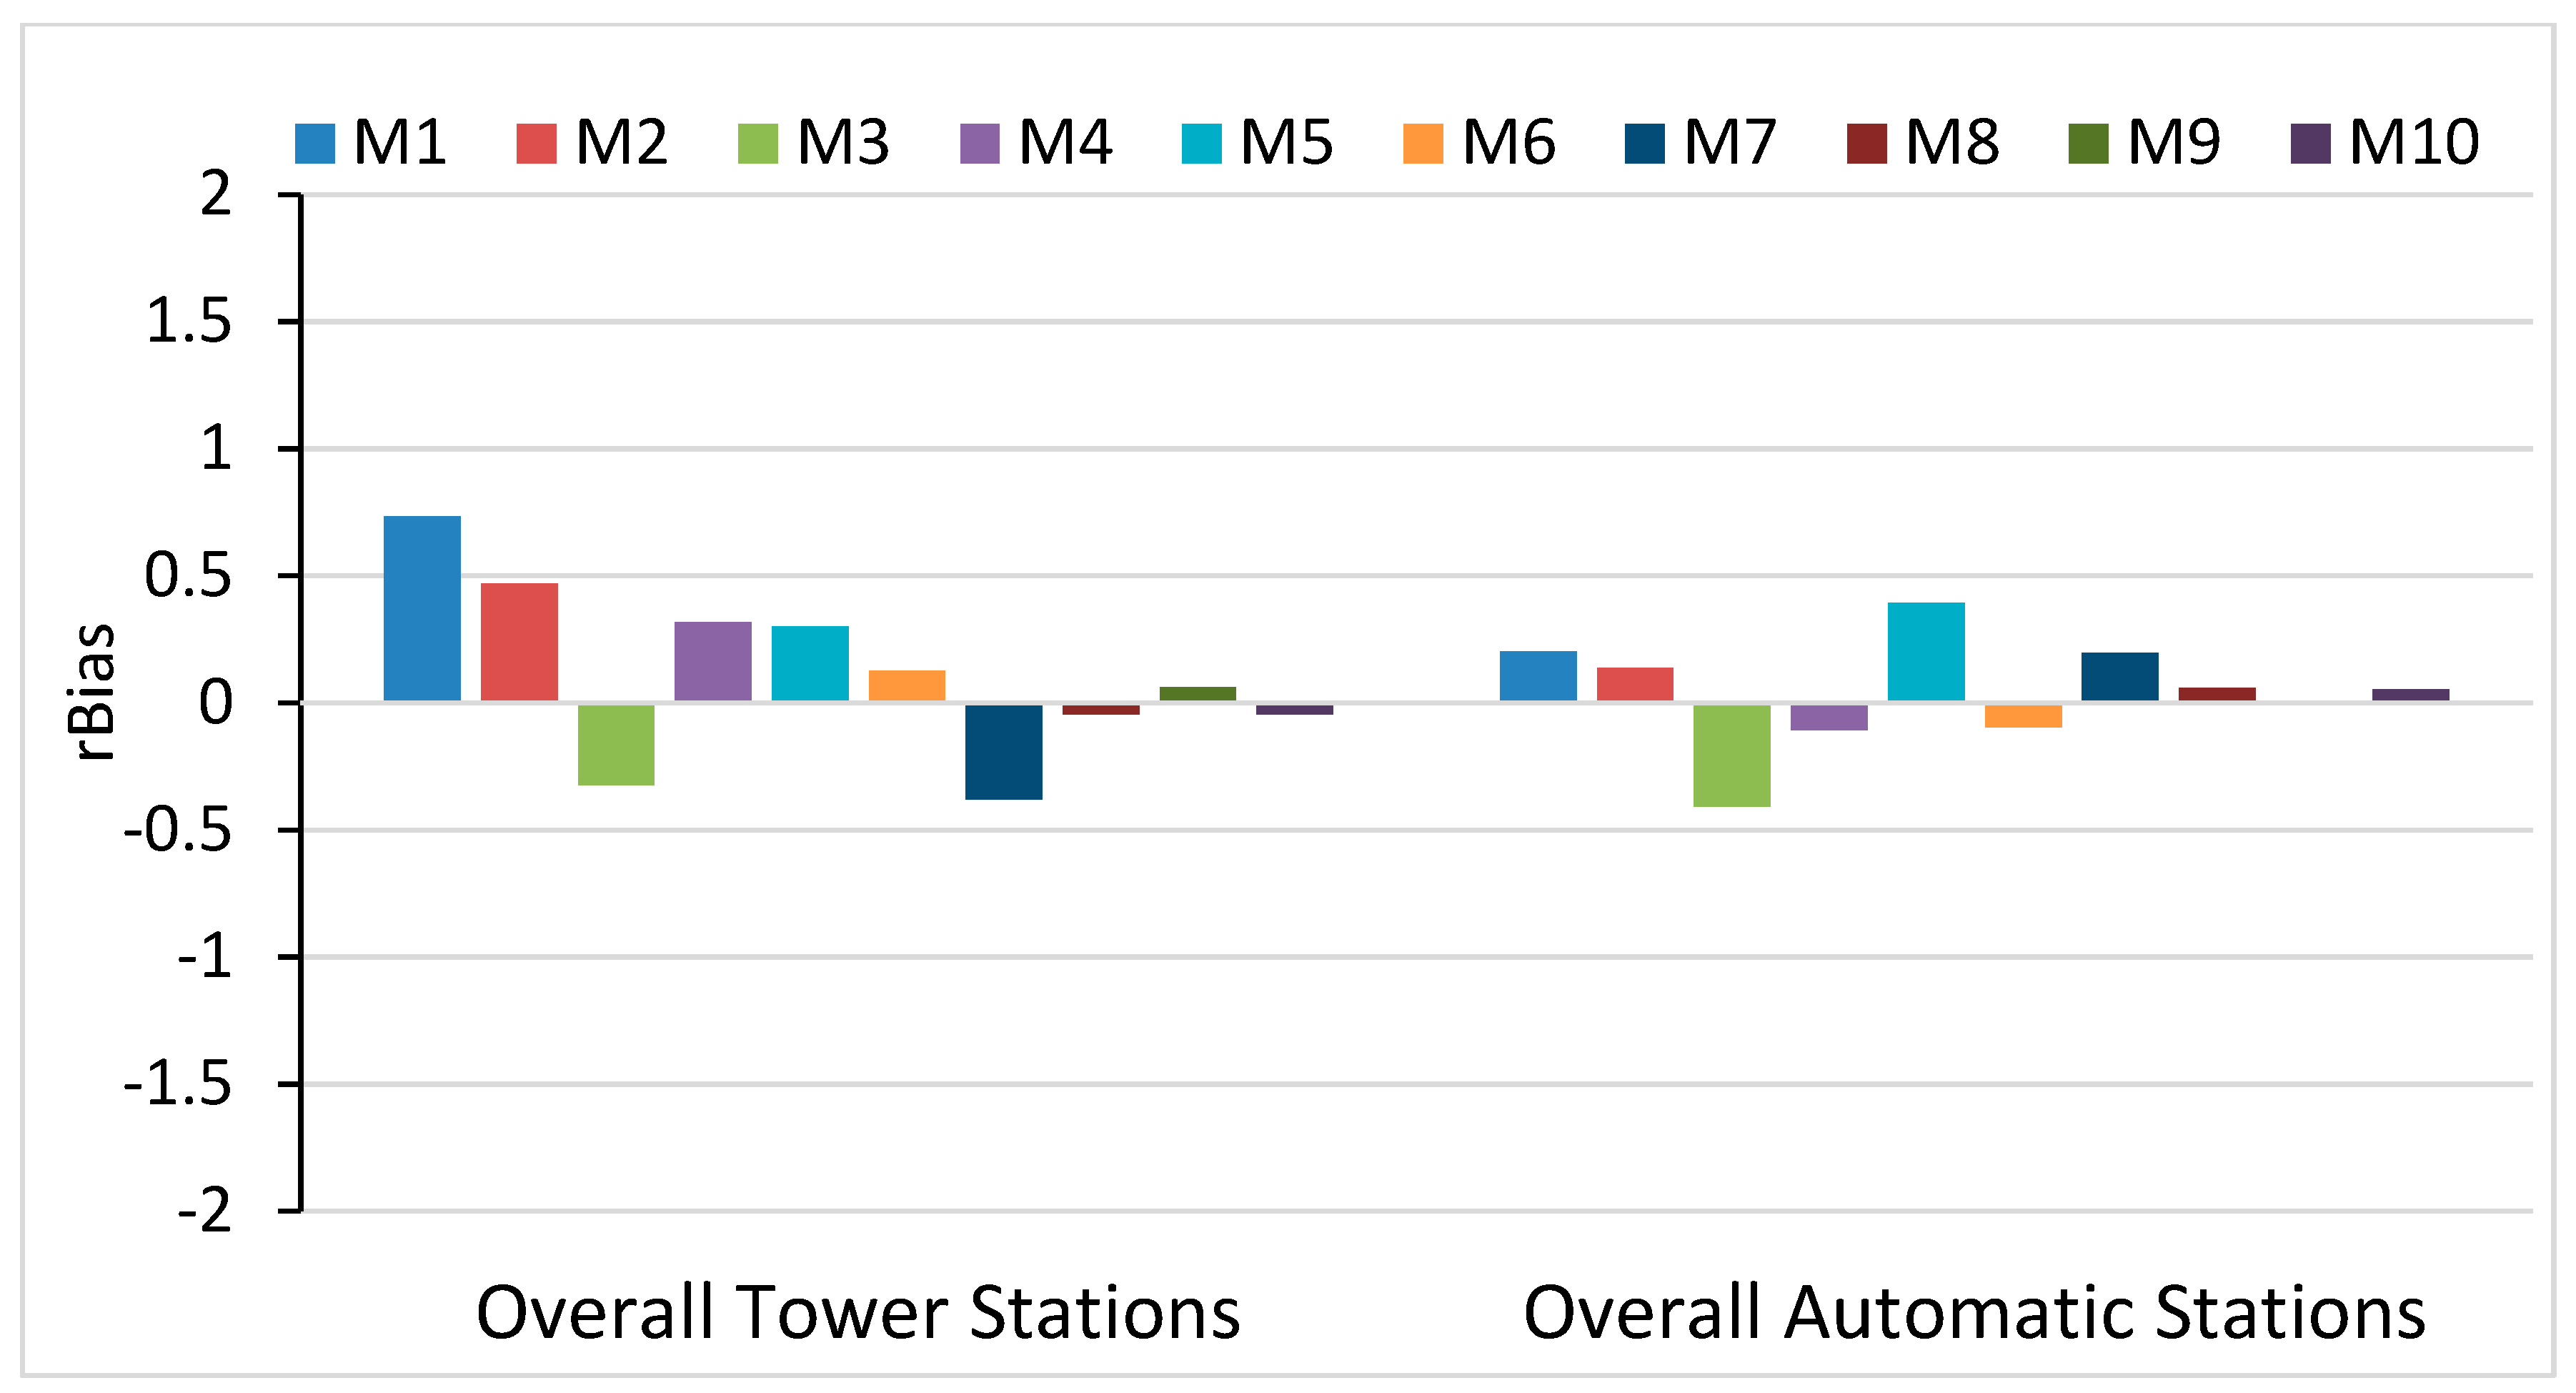
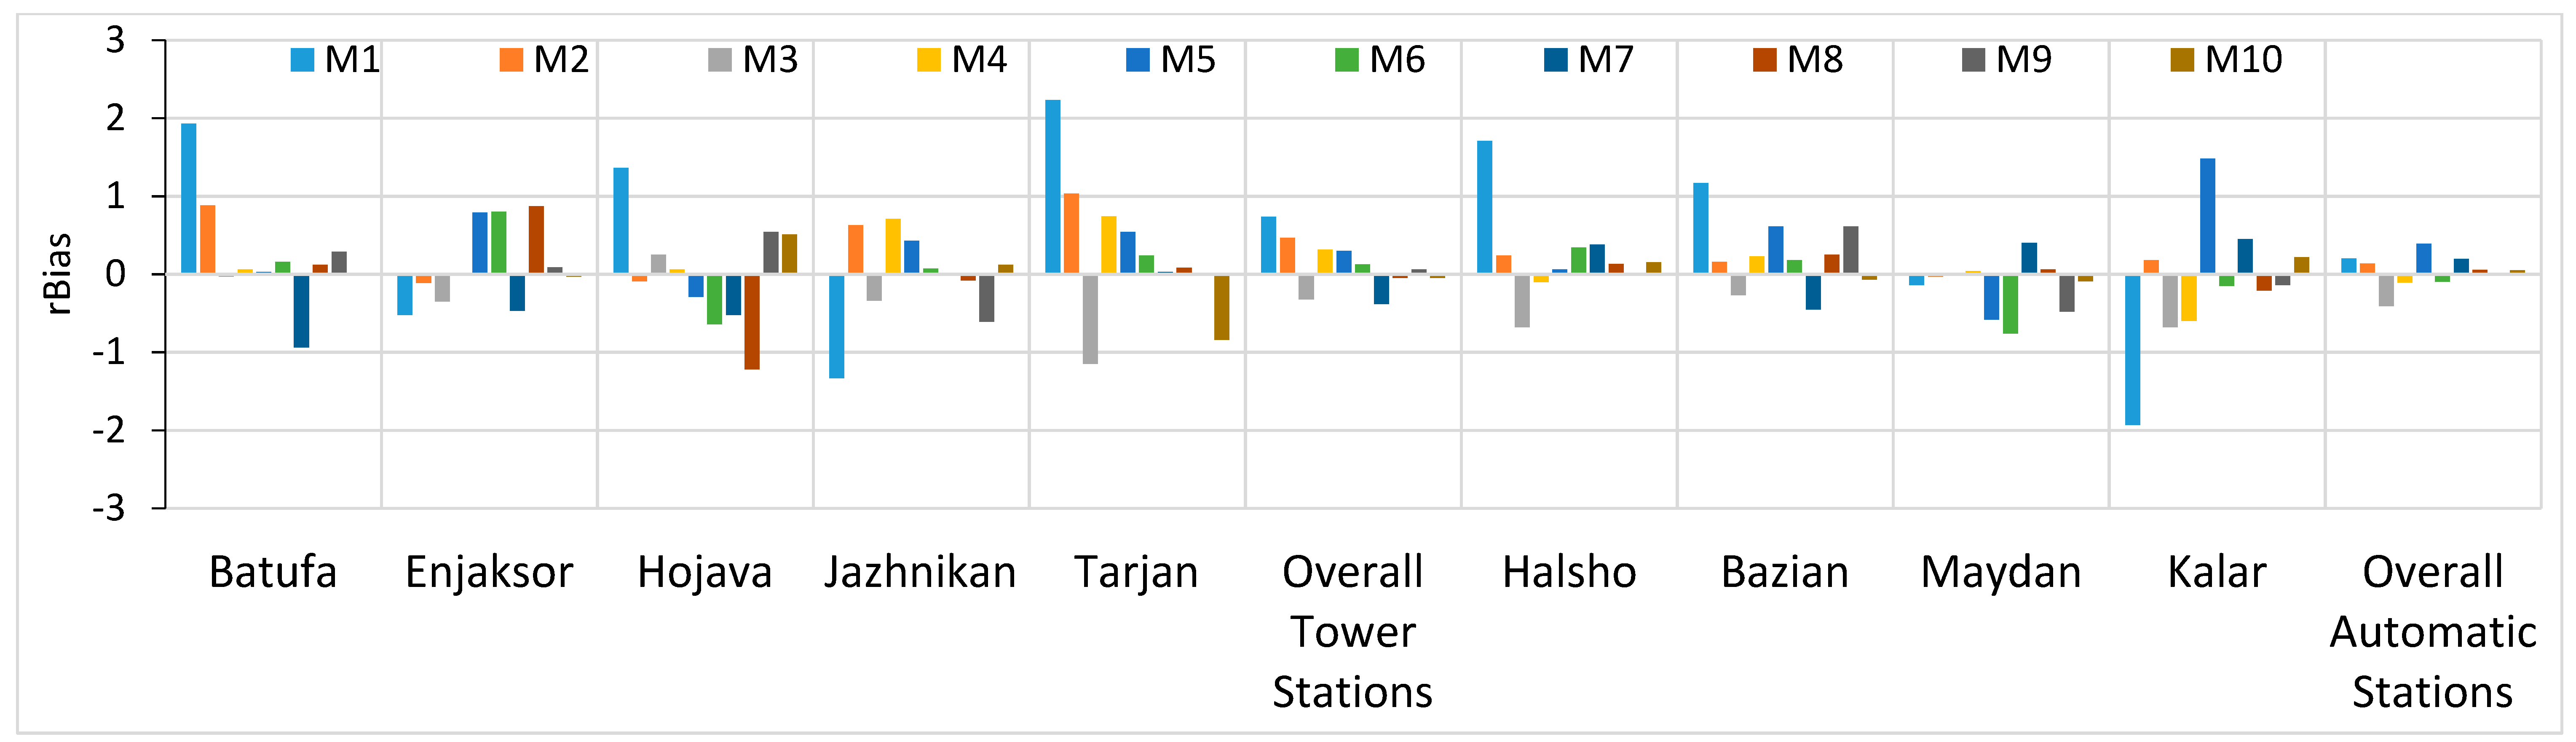
The values of bias were significantly low in all cases in the study area, which is under 1% of mean ground data for M1–M10. In the tower stations, the highest bias was recorded in M1 (3.4 W/m2) 0.7%. It was 0.4% (2.3 W/m2) in M2, a negative bias of −0.4% (−2 W/m2) in M7 and the others’ rates were below 0.3%. However, in the automatic stations, the highest bias was recorded in M3 (−2 W/m2) −0.4%. It was 0.3% in M1 and M5, and the others were below that value. The lowest bias was recorded at M8, M9 and M10, which were close to zero in both station types (Table 5 and Table 6, Figure 4). Figure 4 demonstrates the low rates of relative bias among M1-M10 for both station types.
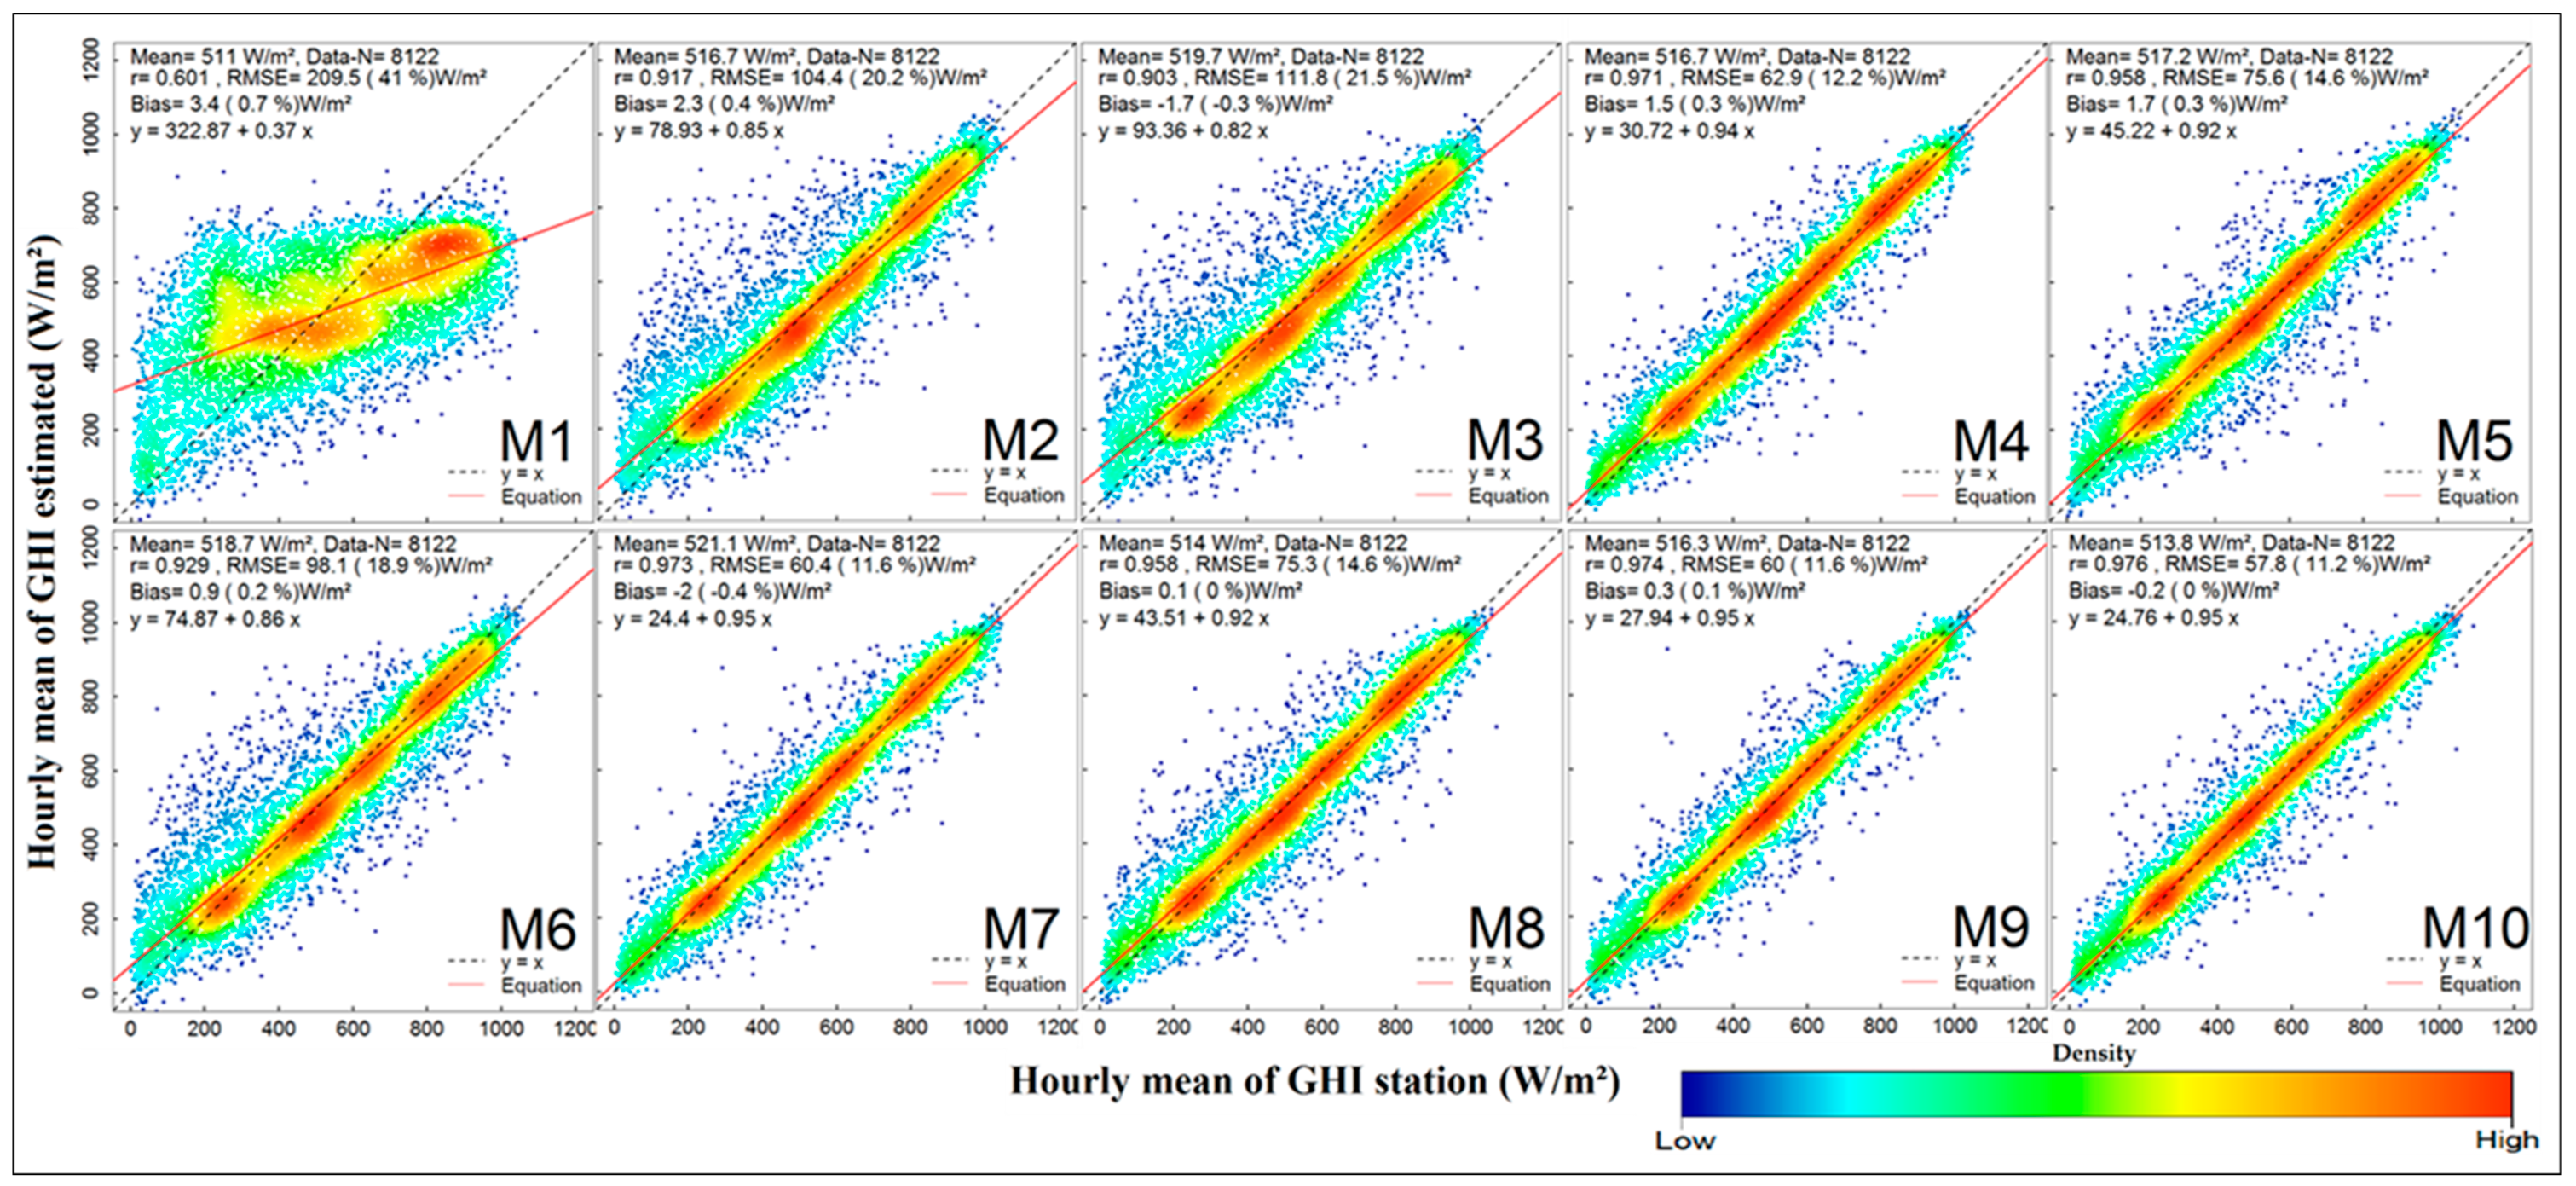
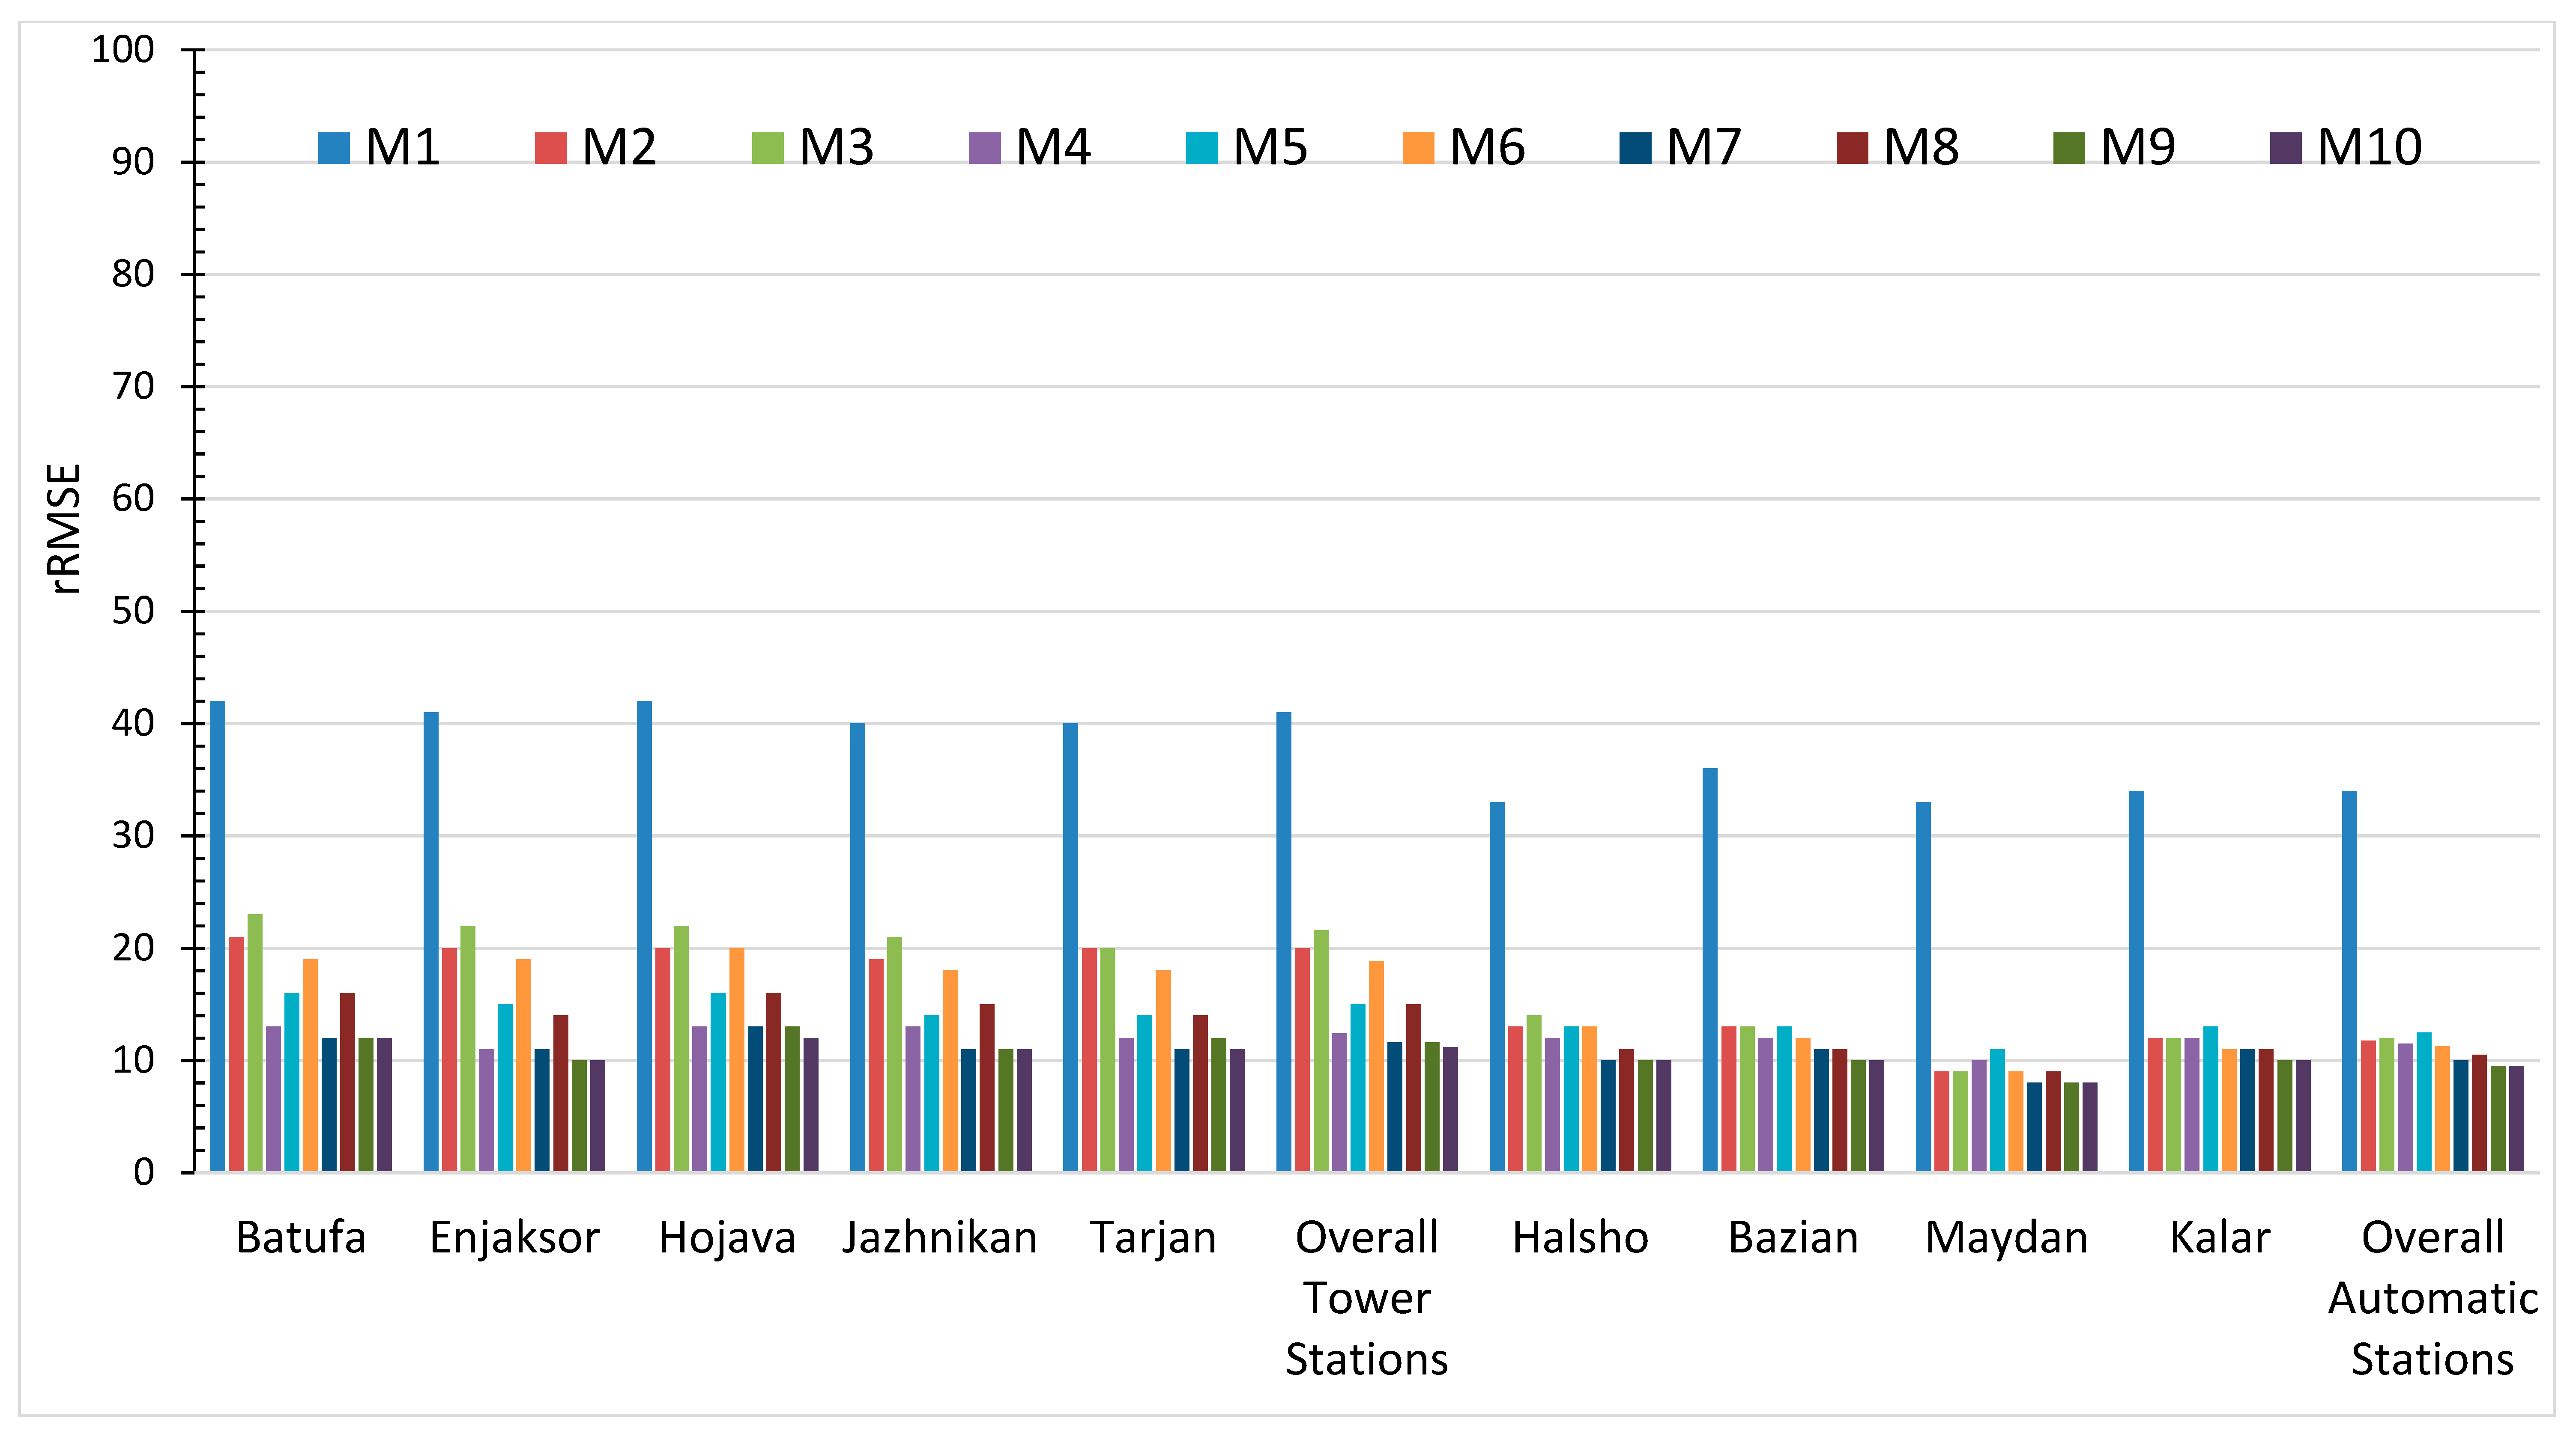
The RMSE results showed similarity with bias. The highest RMSE in tower stations was recorded in M1 (209.5 W/m2 41%). It decreased to 111.8 W/m2 (21.5%) and to 104.4 W/m2 (20.2%) in M3 and M2 respectively. The lowest recorded RMSE values were 57.8 W/m2 (11.2%), 60 W/m2 (11.6%) and 60.4 W/m2 (11.6%) in M10, M9 and M7 respectively. Other rates are between 12–19%.
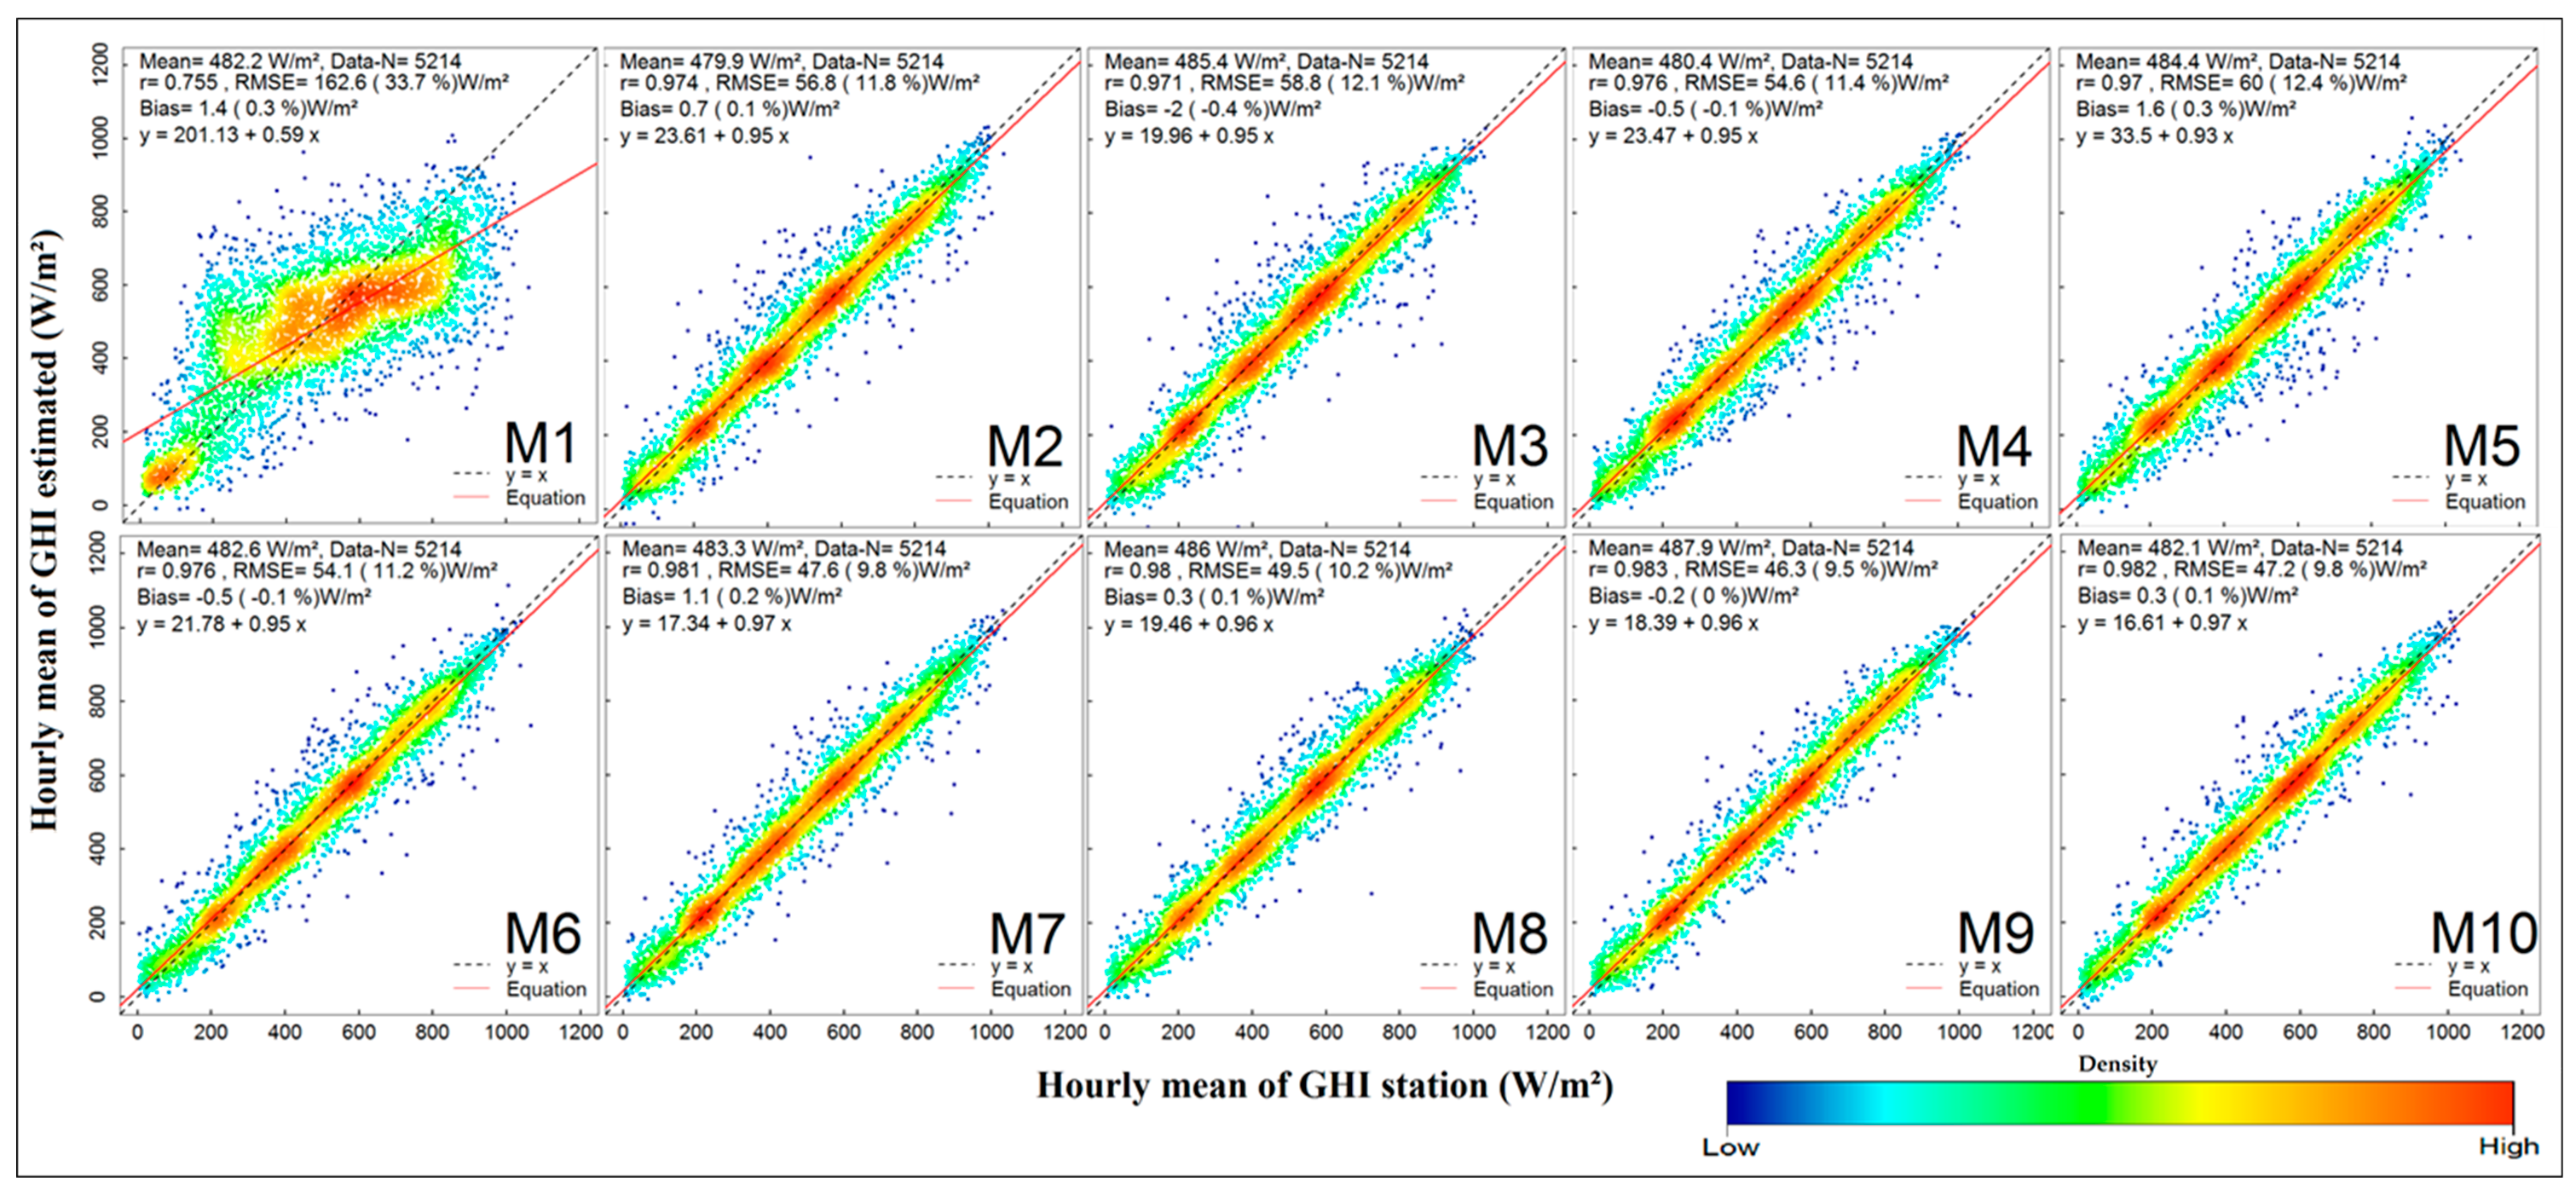
On the other hand, the RMSE at automatic stations are low compared to tower stations for each model. However, the highest one was recorded in M1 (163.6 W/m2 33.7%). It decreased to 60 W/m2 (12.4%) in M3. The lowest RMSE was recorded in M9 (46.3 W/m2 9.5%) and there were slightly higher values in M7 (47.6 W/m2 9.8%) and M10 (47.2 W/m2 9.8%). The other remaining values were between 10–12% (Table 5 and Table 6, Figure 5). Figure 5 shows the stability of relative RMSE in automatic stations after M1 among the other models whereas it shows fluctuations for tower stations for the same situation.
Those rates of RMSE can be noted clearly by a close look at the scatterplots of each model in Figure 6 (tower stations) and Figure 8 (automatic stations), which are demonstrating the results of hourly GHI models in test data against ground measurements. The observations are concentrated around the 1:1 line in better performance models (M8, M9 and M10), where the regression lines are correspondingly close to the 1:1 line. The opposite is seen in M1 for both station types. However, in models M2, M3 and M6 (tower stations) the observations are far from the 1:1 line and the regression line in red is not close to the 1:1 line, corresponding to high recorded RMSE compared to other models (Figure 6).
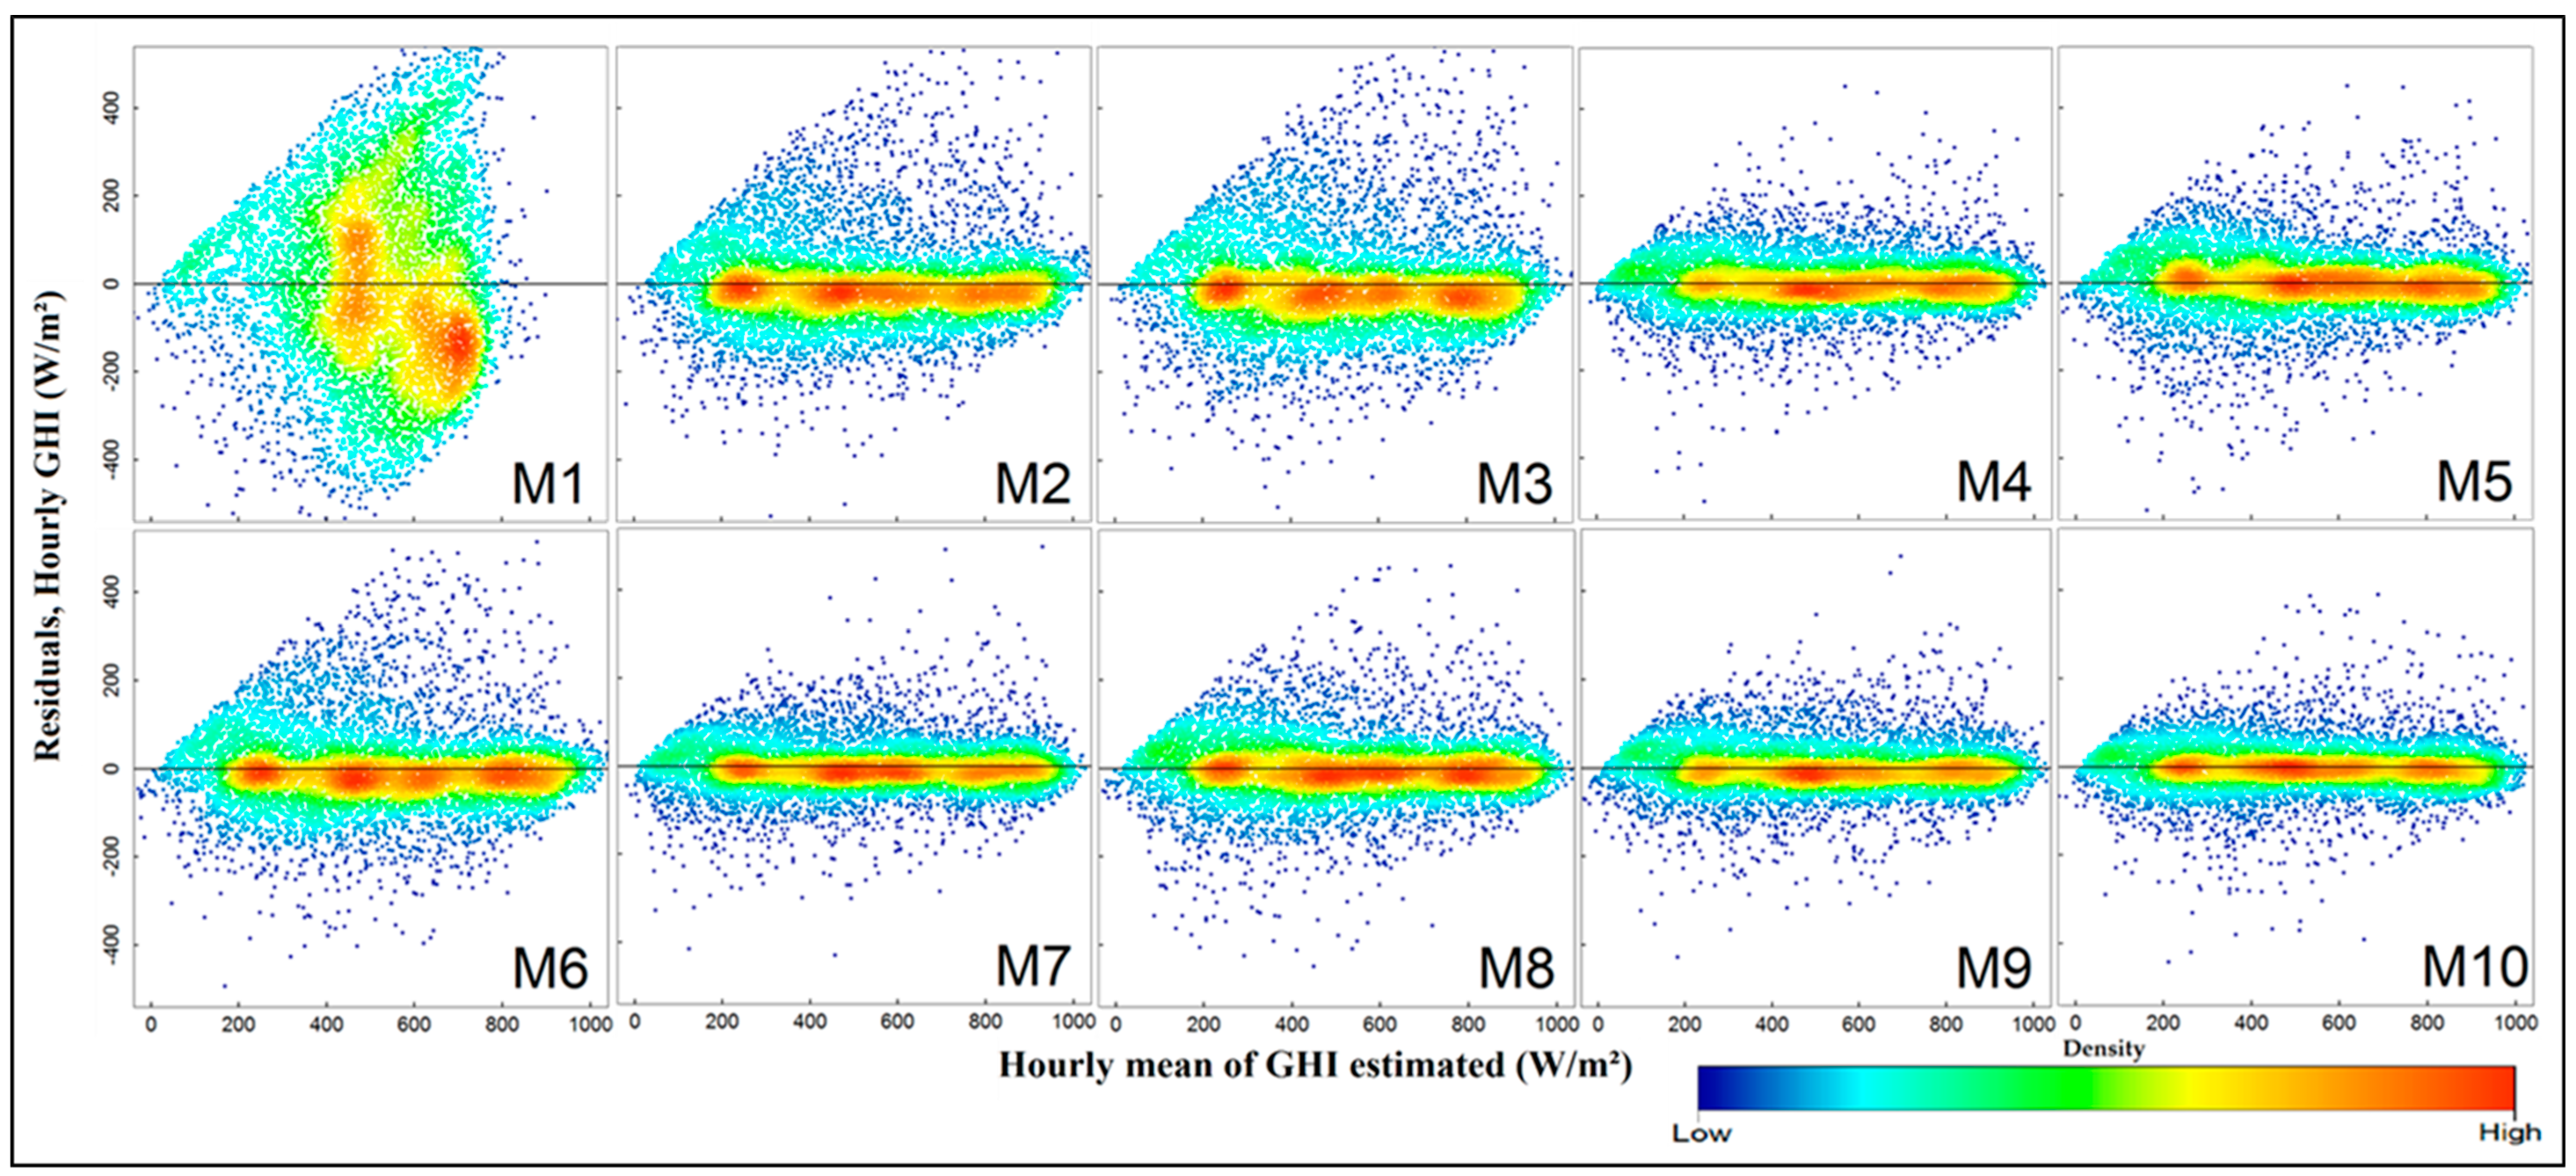
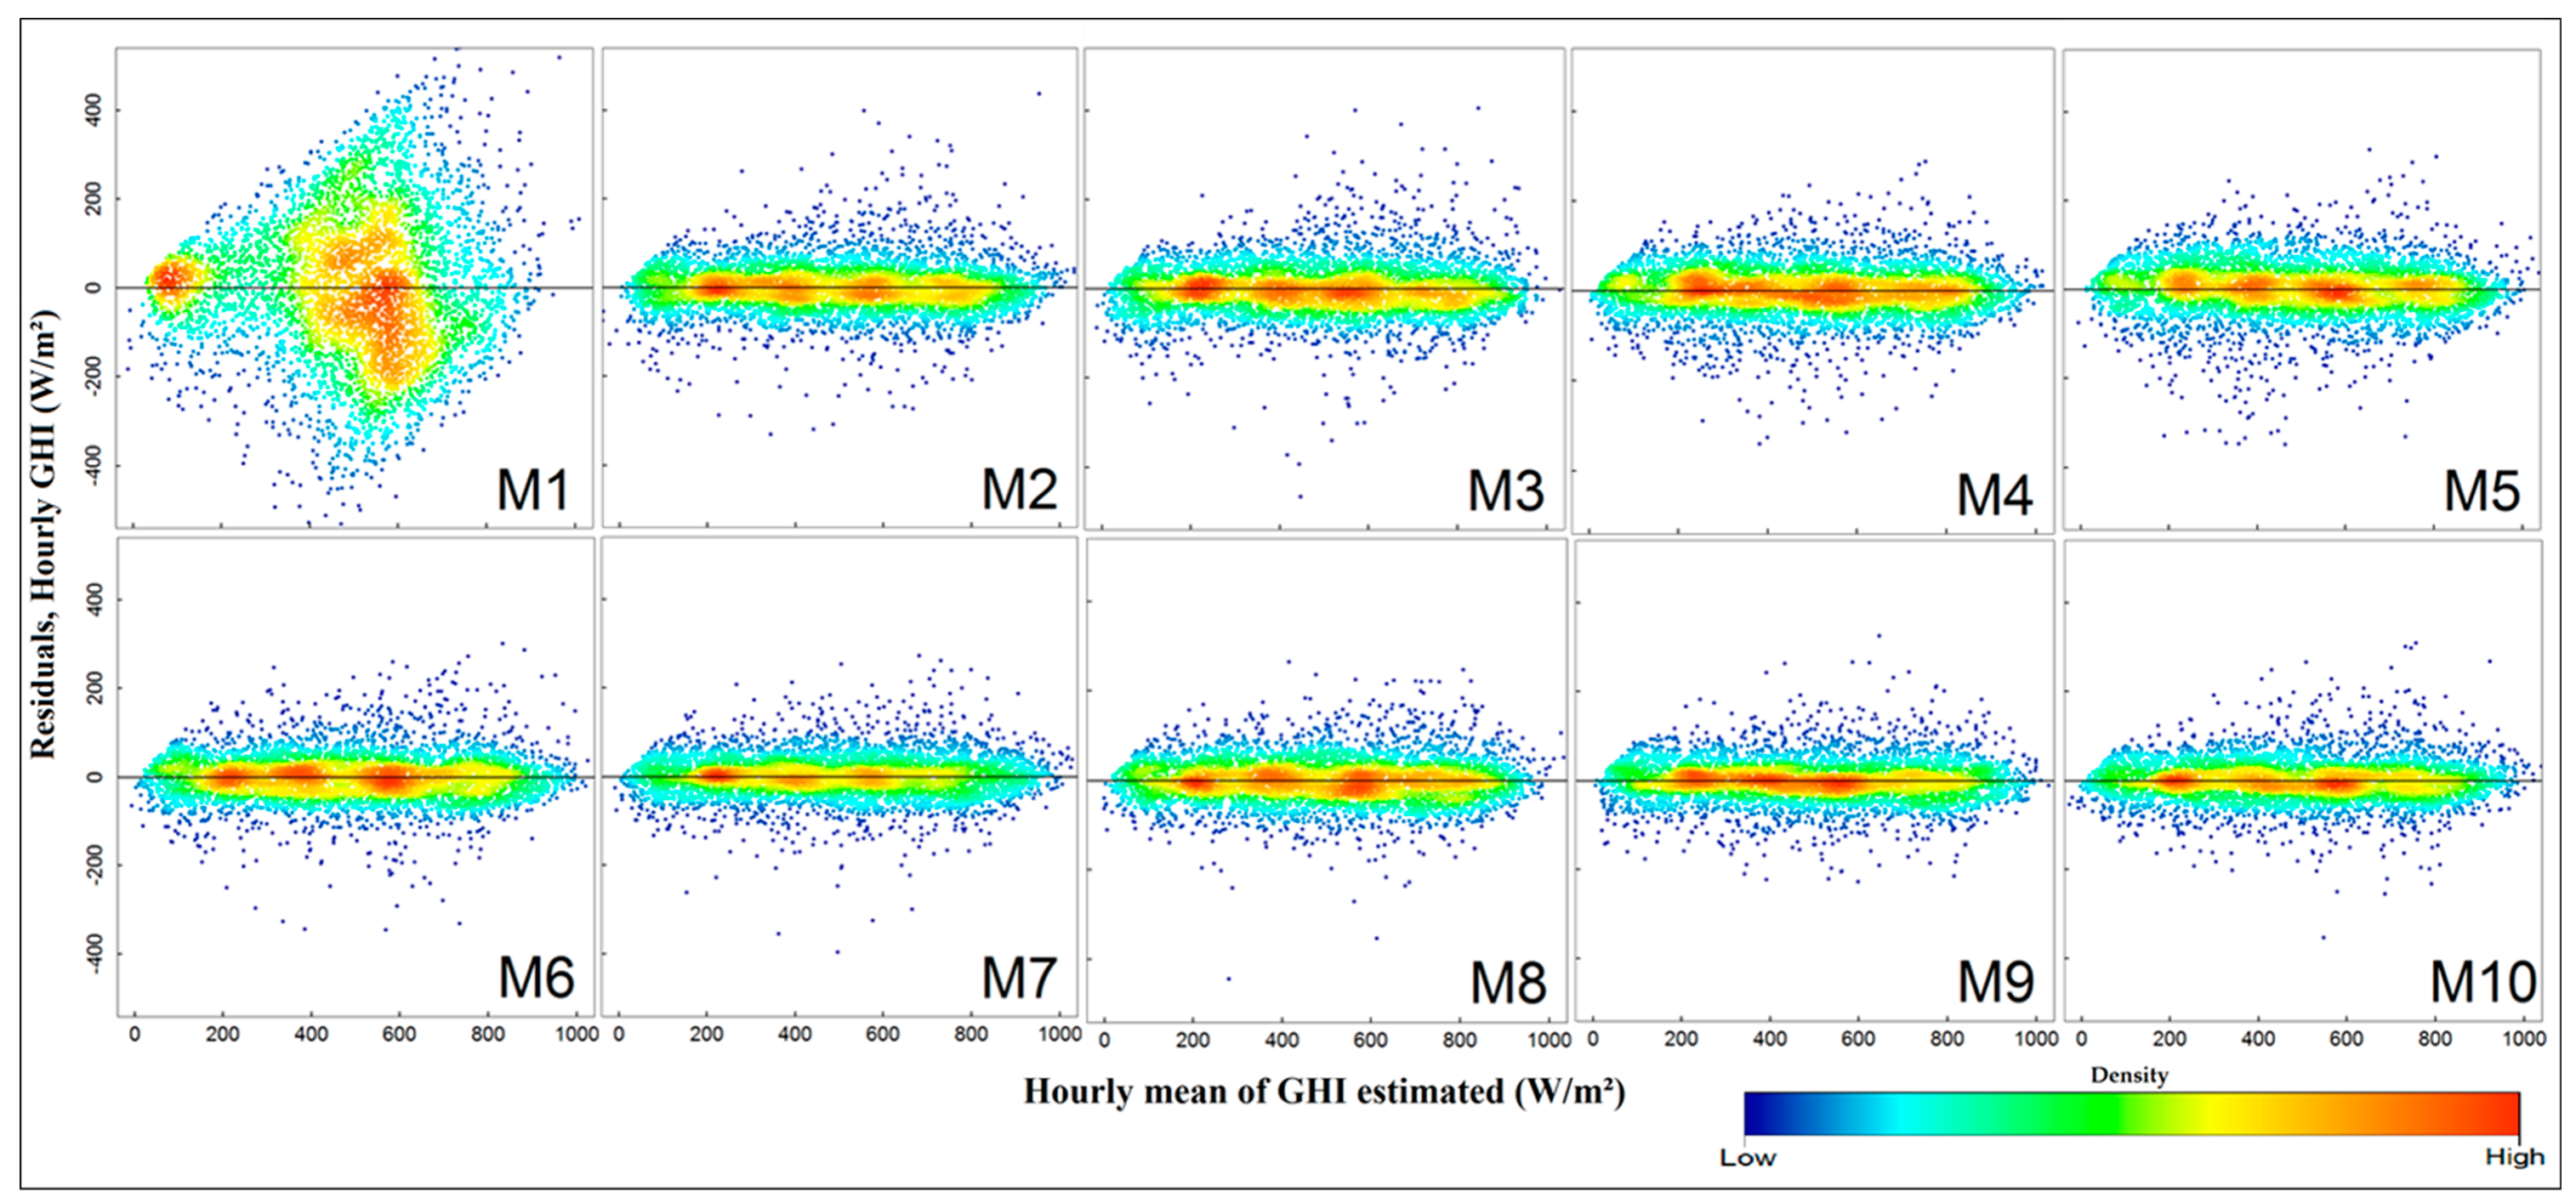
Figure 7 (for tower stations) and Figure 9 (for automatic stations) show the scatterplots of residuals against estimated hourly GHI of test data in each model. The clustered patterns of residuals are seen only in M1 in both station types whereas all other residuals are randomly distributed and the densities of observation are around zero. However, low performance can be noted at M2, M3 and M6 (Figure 7).

4. Discussion

The hourly GHI was estimated over nine stations in Iraq by using observed inputs (SD, AT, RH and WS), calculated inputs (TOA and Cs) and new input from SDDs (HC3v5 or CRSv3) to the ten M1-M10 ANN models based on the number and combination of inputs. The results of the overall performance are r values from 0.601–0.976, bias from −0.4–0.0–0.7% and RMSE from 11.2–41% at tower stations and r values from 0.755–0.983, bias from −0.4–0.0–0.3% and RMSE from 9.5–33.7% at automatic stations. Excellent performance was recorded in M9 (9.5%), and M10 (11.2%) and low performance was recorded in M1 at automatic and tower stations respectively. The better results of those models at hourly time scales compared to the previous studies for similar estimation (Table 1) are related to the new inputs such as Cs, TOA and SDDs together in this study.
The overall better performance, with a lower percent of automatic stations than tower stations in all models, is obtained by the use of SD as inputs in automatic stations—SD is unrecorded in tower stations. It is also reported [6,62,64,77] that the role of SD increases the performance of models.
The low performance of M1 in both station types is related to the small number of inputs, which do not include any of the calculated inputs. The calculated inputs such as Cs have a unique role to increase the model performance as seen in M2 compared to M1 in both stations. This is in agreement to improved results in some limited studies which used Cs as inputs either for modelling or forecasting GHI [47,49,78,79].
The low recorded bias in most of the models is related to the good estimation of GHI by ANN models as mentioned in several studies [12,17,62,64]. We presented the overall bias among stations, which led to a decrease in the bias because of positive bias in some stations and negative bias in others in the same model, whereas the bias in all individual stations was lower than 2% except one case of 2.2% (Table A1, Table A2, Table A3, Table A4, Table A5, Table A6, Table A7, Table A8 and Table A9, Figure A1).
The fluctuation of RMSE among models at tower stations and its stability among models at automatic stations (Figure 5 and Figure A2, Table 5 and Table 6) are mainly related to the role of SD, which was used as input in the later ones. The highest record of RMSE in M1 in both station types is related to inputs which contain only four climate variables. This is reported by literature where GHI was estimated at a daily time scale [55,77]. The improved performance in M2 and M3 compared to M1 is related to the use of additional variables of Cs and TOA in those models respectively (Table 4). Hence, the low performance of M2, M3 and M6 compared to better performance in M4 and M5 are related to the use of SDDs as new inputs with climate variables. This has been reported by studies which have used SDDs in foresting GHI [46,47]. The better performance of M7 and M8 compared to the previous M1–M6 is related to the use of Cs with SDDs in those models. The role of Cs is mentioned in literature [49,79], but in those cases, it was not combined with SDDs. The overall better performances of M9 and M10 from the other models (M1–M8) are related to the combination of all variables in those models. These demonstrate the better performance of this study compared to similar studies [5,62,63,64].
The performance of HC3v5 as input with only four climate variables is better than CRSv3 as demonstrated in the comparison between M4 and M5 in both station types, whereas in other models (M7–M10) the difference between them are minimal. The former result (M4–M5) is related to the accurate reproduction of the GHI ground data by HC3v5 as described in the literature [30,32,33]. The latter (M7–M10) is related to the use of Cs and TOA as separate inputs.
This study revealed that using SDDs, Cs, and TOA with climate variables in ANN models has improved the results of estimation for hourly GHI with an overall r value of 0.980, bias lower than 2% and RMSE lower than 10% compared to similar studies with no combination of those inputs [5,62,63,64].
The results of this study demonstrate that this way of modelling allows the retrieval or management of a dataset of GHI for decades where the inputs are available, but where GHI is not recorded as in most areas in the case study and similar regions with a scarcity of ground data, it can be achieved by using the trained models.
The new inputs of SDDs and Cs which improved the results are easily and openly available for most regions [29] unlike other variables such as cloud cover and SD [21,73,80]. Therefore, the mentioned new variables can be used for modelling and forecasting the solar components for better results.
The limitations are principally as follows: This study estimated GHI but no other solar components, which are required directly in fields such as DNI in concentrated solar power. Hence, some studies have estimated DNI and DHI from GHI [64,81,82]. However, further research is required for that in this type of area with a scarcity of ground data. Another limitation is the scarcity of long-term GHI ground data at timescales beyond five years or more, which are better for training this kind of model.

5. Conclusions

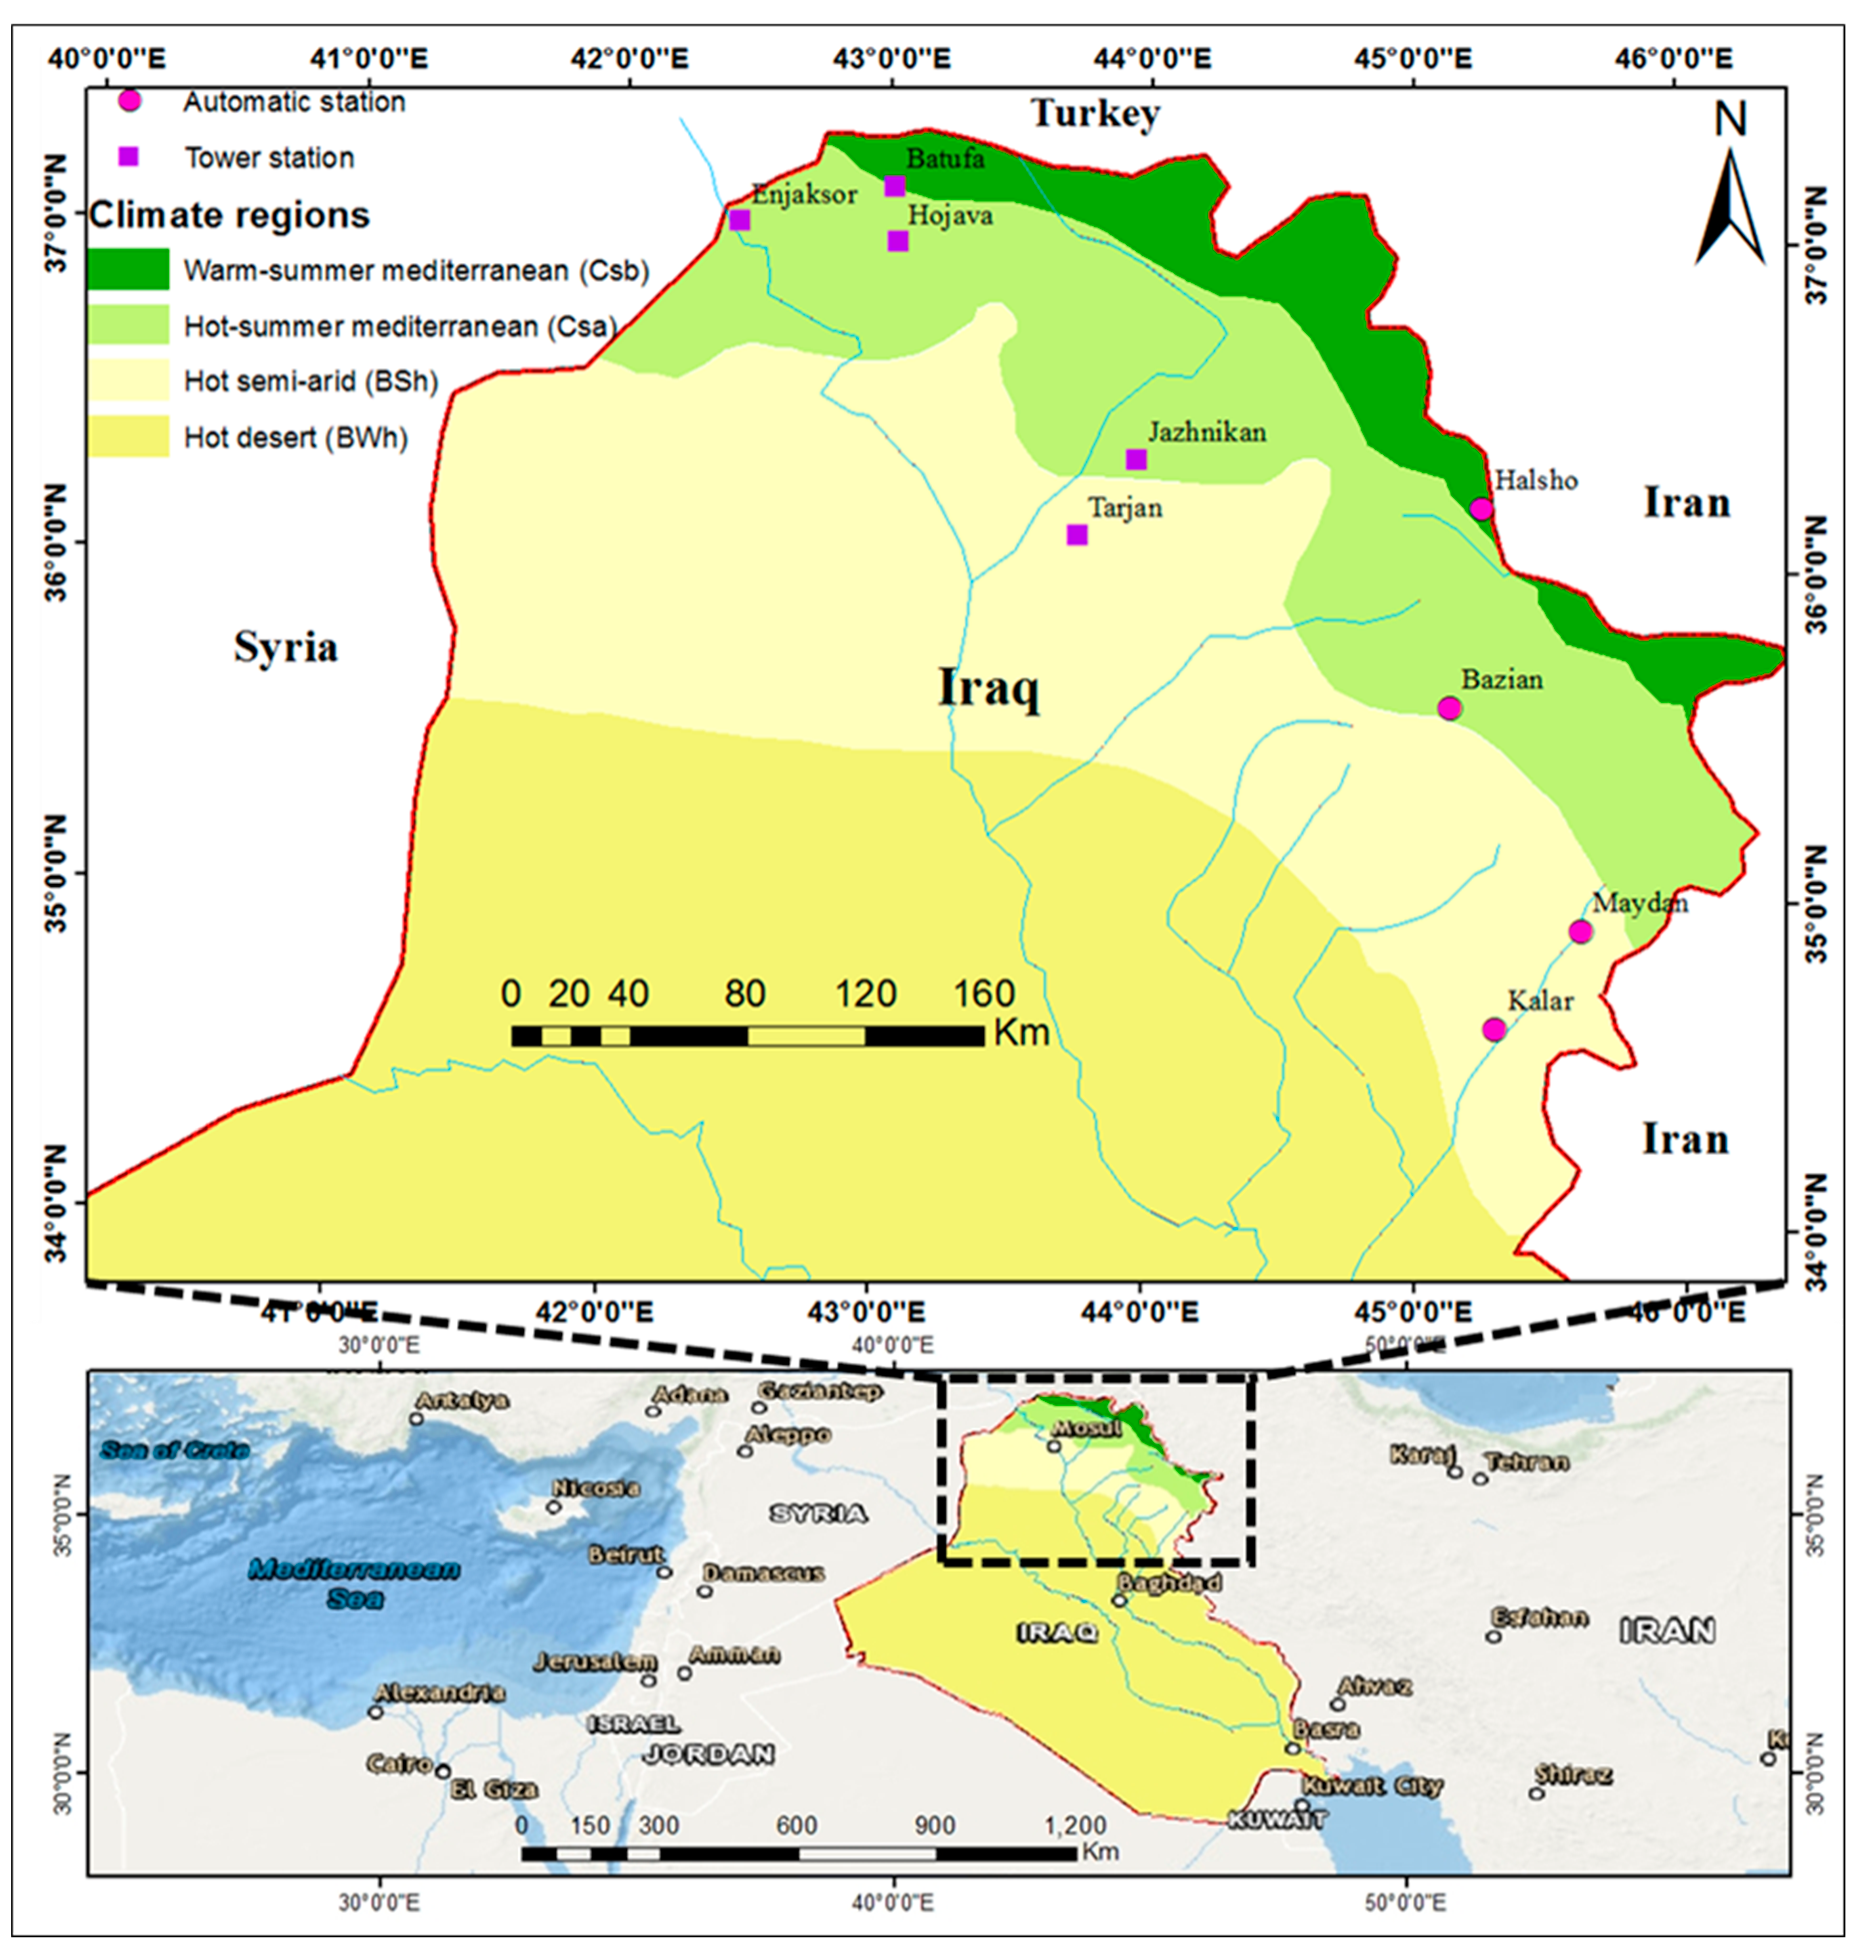
This paper aimed to use a new input of SDDs together with Cs, TOA and observed climate variables SD, AT, RH and WS as new input combinations in ten ANN models to estimate GHI at the hourly time scale with a Levenberg–Marquardt training algorithm. The inputs were arranged into ten different sets, as models M1–M10, to demonstrate the role of new inputs. The data at four automatic stations of all the above variables and five tower stations without SD in northeast Iraq were used.
The test results demonstrated a good improvement from M1 to M10 based on adding the new inputs such as TOA with observed variables (M3), Cs with observed variables (M2), SDDs with all observed climate variables (M4–M5), other combinations (M6–M8) and all together (M9–M10) with low percent fluctuation between both station types. The best results are r = 0.983, RMSE = 9.5% and bias = 0.0% in M9 and r = 0.976, RMSE = 11.2% and bias = 0.0% in M10 and the worst results are r = 0.755, RMSE = 33.7% and bias = 0.3% in M1 and r = 0.601, RMSE = 41% and bias = 0.7% in M1 at automatic and tower stations, respectively.
This study demonstrated the role of new input combinations for estimating hourly GHI with high accuracy. While the models have been trained with a few years of data, it would be better to train them with more years of data with such algorithms.
Further research is required for using new inputs with other machine learning approaches and empirical models.

Author Contributions

B.A. conducted this research manuscript as part of his Ph.D. Conceptualization, B.A.; methodology, B.A.; software, B.A.; validation, B.A.; formal analysis, B.A.; data curation, B.A.; writing—original draft preparation, B.A.; writing—review and editing, B.A., H.B., C.J., and J.W.; supervision, H.B., and C.J.

Funding

The Higher Committee for Education Development in Iraq (HCED) funded this study as a scholarship, the Centre for Landscape and Climate Research (CLCR) and the National Centre for Earth Observation (NCEO) supported it.

Acknowledgments

Thanks for HCED, CLCR and NCEO for their support. The authors are extremely grateful for the assistance of the Directorate of Meteorology—Sulaymaniyah and KRG Ministry of electricity for providing meteorological data. The authors are grateful to Soda Service for allowing access and free use of GHI SDD of CRSv3 data and for a subscription to use the HC3v5 data.

Conflicts of Interest

The authors declare no conflict of interest. The funders had no role in the design of the study; in the collection, analyses, or interpretation of data; in the writing of the manuscript, or in the decision to publish the results.

List of Abbreviations

ANNsArtificial Neural Networks
ATAir Temperature
CAMSCopernicus Atmosphere Monitoring Service
CRSCAMS Radiation Service
CRSv3CRS version-3
CsClear sky irradiance on the horizontal surface
DHIDiffuse Horizontal Irradiance
DNIDirect Normal Irradiance
GHIGlobal Horizontal Irradiance
GMSThe Japanese Geostationary Meteorological Satellite
GOESGeostationary Operational Environmental Satellite system
HC3HelioClim-3
HC3v5HC3 version-5
KRGKurdistan Regional Government
m/smeter per second
M1Model-1 (The same until M10)
MFGMeteosat First Generation
MODISModerate Resolution Imaging Spectroradiometer
MSGMeteosat Second Generation
MTSATJapanese Multifunctional Transport Satellites
NAnot applicable
rCorrelation coefficient
rbiasRelative bias
RHRelative Humidity
RMSERoot Mean Square Error
rRMSERelative RMSE
SDSunshine Duration
SDDsSatellite-Derived Datasets
SEVIRISpinning Enhanced Visible and Infrared Imager
SoDaSolar Radiation Data
TOAtop-of-atmosphere irradiance on the horizontal surface
W/m2watt per square meter
WSWind Speed

Appendix A

Table A1. Statistical results of hourly GHI models and neuron numbers in the hidden layer for Batufa tower station. Mean, bias and RMSE units are W/m2.
ModelsTrainValidationTestNeurons
MeanBias%RMSE%rMeanBias%RMSE%rMeanBias%RMSE%r
M15230.030.01211400.6545147.111.38212410.6395129.871.93215420.63970
M25233.340.64110210.9195117.611.49112220.9145174.540.88110210.9280
M35192.680.52115220.912528−0.42−0.08117220.906518−0.18−0.03120230.904140
M45170.930.1866130.9715340.860.1665120.9735220.30.0666130.97270
M5518−0.6−0.1283160.9555231.110.2179150.9595280.180.0382160.95670
M65211.320.25100190.9325061.410.28108210.9235330.830.16101190.93590
M7522−5.23−164120.974514−2.29−0.4566130.971519−4.86−0.9464120.97370
M85210.530.179150.959525−1.32−0.2580150.9575130.630.1281160.95770
M95192.510.4864120.9745261.790.3464120.9745221.50.2965120.97350
M10522−0.55−0.1161120.9765130.980.1963120.9755210.070.0161120.97690
Table A2. As in Table A1, but for Enjaksor tower station.
ModelsTrainValidationTestNeurons
MeanBias%RMSE%rMeanBIAS%RMSE%rMeanBias%RMSE%r
M1518−1.36−0.26207400.608521−3.85−0.74208400.6515−2.67−0.52209410.59690
M2518−2.02−0.39103200.919520−2.97−0.57105200.916512−0.57−0.11104200.917120
M35142.270.44112220.9035300.420.08113210.901524−1.84−0.35113220.898100
M45140.210.0457110.976529−2.32−0.4457110.9755240.040.0157110.97660
M55173.930.7675150.9585212.450.4775140.9585174.090.7975150.95990
M6518−0.83−0.1698190.926519−2.64−0.51102200.925174.120.8100190.92570
M75190.240.0554100.979512−1.03−0.256110.977519−2.45−0.4756110.97760
M85175.471.0673140.965214.340.8373140.9615194.490.8772140.96150
M9516−0.45−0.0954100.9785250.560.1155100.9775200.490.0954100.97960
M105200.730.1452100.985130.630.1251100.98511−0.14−0.0352100.98100
Table A3. As in Table A1, but for Hojava tower station.
ModelsTrainValidationTestNeurons
MeanBias%RMSE%rMeanBias%RMSE%rMeanBias%RMSE%r
M1504−1.63−0.32205410.634514−6.44−1.25207400.6184916.661.36208420.62190
M25045.031106210.9184950.470.09106210.916509−0.44−0.09103200.9290
M35041.820.36112220.908503−0.78−0.16111220.9065011.250.25110220.90890
M45030.450.0964130.975010.110.0264130.975090.30.0665130.96980
M5504−2−0.479160.9554982.350.4783170.947504−1.46−0.2979160.95580
M6501−4.56−0.9198200.93512−0.81−0.16100200.925504−3.23−0.6499200.927100
M7501−3.24−0.6564130.97507−2.2−0.4362120.972511−2.67−0.5264130.9780
M8504−4.46−0.8875150.959504−3.53−0.778150.957500−6.12−1.2278160.95780
M95040.320.0664130.971503−0.83−0.1764130.974992.70.5463130.97180
M105024.010.857110.9765144.160.8163120.9724992.560.5161120.97480
Table A4. As in Table A1, but for Jazhnikan tower station.
ModelsTrainValidationTestNeurons
MeanBias%RMSE%rMeanBias%RMSE%rMeanBias%RMSE%r
M1518−1.85−0.36208400.59518−0.13−0.03208400.584519−6.91−1.33209400.586100
M25168.121.5799190.92451610.191.97102200.9185303.360.63102190.917110
M35180.990.19108210.9075120.030.01111220.906526−1.78−0.34109210.903110
M45213.410.6562120.975093.590.7163120.975163.670.7166130.968120
M5518−1.5−0.2972140.96521−3.16−0.6175140.9585142.210.4371140.96100
M65180.630.1289170.938514−1.4−0.2791180.9345220.390.0796180.927130
M7514−0.4−0.0858110.974524−1.07−0.260110.9735300.01060110.972120
M8517−2.8−0.5470140.963524−3.44−0.6669130.964516−0.39−0.0875150.955140
M9516−0.58−0.1156110.976525−1.27−0.2457110.976523−3.2−0.6159110.974140
M105203.270.6353100.9795033.450.6959120.9725230.650.1259110.973130
Table A5. As in Table A1, but for Tarjan tower station.
ModelsTrainValidationTestNeurons
MeanBias%RMSE%rMeanBias%RMSE%rMeanBias%RMSE%r
M15233.010.58202390.5985144.390.85207400.55751711.552.23207400.552100
M25203.830.7499190.9175264.760.9102190.9175185.331.03102200.91280
M35190.890.17111210.895521−1.26−0.24112210.894528−6.07−1.15106200.90770
M45244.080.7861120.975192.510.4864120.9695103.790.7462120.967100
M55211.20.2371140.9595192.330.4571140.9595232.820.5471140.95920
M65220.490.0990170.932519−0.66−0.1391180.9355181.220.2493180.92980
M75221.010.1959110.9725080.950.1958110.9725270.180.0359110.97260
M8520−2.17−0.4268130.962522−2.81−0.5471140.965210.410.0871140.9660
M95230.10.0258110.9735141.690.3358110.974517−0.04−0.0160120.97140
M10522−1.16−0.2256110.975520−0.32−0.0655110.975516−4.35−0.8457110.97360
Table A6. As in Table A1, but for Halsho automatic station.
ModelsTrainValidationTestNeurons
MeanBias%RMSE%rMeanBias%RMSE%rMeanBias%RMSE%r
M14821.130.23153320.8354682.390.51153330.8344748.111.71155330.82780
M2479−0.76−0.1657120.979487−1.08−0.2259120.9774721.110.2461130.976120
M3478−2.87−0.662130.9744750.320.0767140.97485−3.28−0.6866140.972120
M4481−0.11−0.0255110.984762.360.555120.98474−0.49−0.156120.9860
M54770.640.1360130.9764811.440.362130.9744840.310.0662130.975100
M6479−0.52−0.1158120.978482−0.14−0.0357120.9784771.60.3460130.97640
M74781.450.349100.9844791.370.2950100.9844811.810.3849100.98420
M8478−0.37−0.0851110.9834810.950.254110.9814820.650.1351110.98330
M9477−0.14−0.0348100.9854831.540.3248100.985484−0.1−0.0249100.98450
M104760.40.0847100.985489004690.9864810.730.1549100.98540
Table A7. As in Table A1, but for Bazian automatic station.
ModelsTrainValidationTestNeurons
MeanBias%RMSE%rMeanBias%RMSE%rMeanBias%RMSE%r
M1482−0.46−0.1166340.724477−3.28−0.69168350.7124685.491.17168360.71670
M24803.410.7162130.9664820.250.0563130.9654730.780.1662130.96760
M3479−0.11−0.0260130.968475−0.63−0.1363130.965484−1.32−0.2761130.96770
M44770.940.255120.9734904.310.8855110.9734771.110.2356120.97350
M54802.780.5861130.9674714.941.0564140.9634832.970.6161130.96960
M6478−0.31−0.0657120.971484−0.26−0.0561130.9674760.880.1858120.97170
M74782.470.5250100.979486−0.62−0.1350100.978476−2.14−0.4550110.97820
M8480−0.04−0.0152110.9764762.20.4653110.9764761.180.2553110.97520
M94782.60.5446100.9824840.740.1546100.9824772.930.6148100.97940
M104800.370.0846100.9814801.820.3847100.98472−0.31−0.0749100.97850
Table A8. As in Table A1, but for Maydan automatic station.
ModelsTrainValidationTestNeurons
MeanBias%RMSE%rMeanBias%RMSE%rMeanBias%RMSE%r
M15030.060.01165330.72350113.042.6170340.701507−0.72−0.14169330.760
M2503−0.1−0.024390.983506−1.09−0.224590.982499−0.16−0.034690.98260
M35060.420.084590.9824941.640.3348100.984980.0204790.98150
M45030.170.0348100.98509−1.94−0.3850100.9784990.190.0449100.97860
M5504−2.29−0.4554110.974499−2.64−0.5359120.969505−2.93−0.5857110.97170
M6500−1.41−0.284280.984514−1.11−0.224380.983506−3.86−0.764490.98280
M75040.960.193770.9884991.260.253980.9865032.020.44080.98660
M85030.160.034080.986503−0.32−0.064280.9845050.280.064390.98360
M95050.60.123570.989488−1.37−0.283570.989511−2.43−0.483980.98750
M105040.330.073880.9875020.180.044080.986500−0.46−0.094180.98570
Table A9. As in Table A1, but for Kalar automatic station.
ModelsTrainValidationTestNeurons
MeanBias%RMSE%rMeanBias%RMSE%rMeanBias%RMSE%r
M1473−1.63−0.34158330.689479−7.26−1.52157330.695479−9.24−1.93161340.70570
M2475−0.91−0.1955120.9684711.170.2556120.9664750.840.1856120.96660
M34750.030.0155120.968473−6.31−1.3358120.965474−3.22−0.6858120.96250
M4475−1.14−0.2457120.966477−1.44−0.358120.964473−2.85−0.657120.96460
M54784.841.0160130.9624714.310.9262130.964646.891.4860130.96190
M6473−0.48−0.154110.97485−3.77−0.7855110.969471−0.73−0.1552110.97180
M7474−0.02048100.976482−0.47−0.150100.9754722.120.4551110.97260
M84750.770.1651110.972467−3.03−0.6551110.972479−1.02−0.2151110.97240
M9476−0.21−0.044590.979465−0.77−0.1748100.975477−0.66−0.1448100.97740
M104780.030.0147100.9774620.340.0748100.9764741.050.2249100.97360
Figure A1. Comparison of rBias for the hourly GHI among models, stations, and overall results of station types.
Energies 12 00148 g0a1
Figure A2. As in Figure A1, but for rRMSE.
Energies 12 00148 g0a2

References

  1. Boussaada, Z.; Curea, O.; Remaci, A.; Camblong, H.; Mrabet Bellaaj, N. A nonlinear autoregressive exogenous (narx) neural network model for the prediction of the daily direct solar radiation. Energies 2018, 11, 620. [Google Scholar] [CrossRef]
  2. Jadidi, A.; Menezes, R.; de Souza, N.; de Castro Lima, A. A hybrid ga–mlpnn model for one-hour-ahead forecasting of the global horizontal irradiance in Elizabeth city, North Carolina. Energies 2018, 11, 2641. [Google Scholar] [CrossRef]
  3. Palmer, D.; Cole, I.; Betts, T.; Gottschalg, R. Interpolating and estimating horizontal diffuse solar irradiation to provide UK-wide coverage: Selection of the best performing models. Energies 2017, 10, 181. [Google Scholar] [CrossRef]
  4. Palmer, D.; Koubli, E.; Cole, I.; Betts, T.; Gottschalg, R. Satellite or ground-based measurements for production of site specific hourly irradiance data: Which is most accurate and where? Sol. Energy 2018, 165, 240–255. [Google Scholar] [CrossRef]
  5. Hassan, M.A.; Khalil, A.; Kaseb, S.; Kassem, M.A. Exploring the potential of tree-based ensemble methods in solar radiation modeling. Appl. Energy 2017, 203, 897–916. [Google Scholar] [CrossRef]
  6. Ampratwum, D.B.; Dorvlo, A.S.S. Estimation of solar radiation from the number of sunshine hours. Appl. Energy 1999, 63, 161–167. [Google Scholar] [CrossRef]
  7. Badescu, V.; Dumitrescu, A. New types of simple non-linear models to compute solar global irradiance from cloud cover amount. J. Atmos. Sol.-Terr. Phys. 2014, 117, 54–70. [Google Scholar] [CrossRef]
  8. Besharat, F.; Dehghan, A.A.; Faghih, A.R. Empirical models for estimating global solar radiation: A review and case study. Renew. Sustain. Energy Rev. 2013, 21, 798–821. [Google Scholar] [CrossRef]
  9. De Souza, J.L.; Lyra, G.B.; Dos Santos, C.M.; Ferreira Junior, R.A.; Tiba, C.; Lyra, G.B.; Lemes, M.A.M. Empirical models of daily and monthly global solar irradiation using sunshine duration for Alagoas state, northeastern brazil. Sustain. Energy Technol. Assess. 2016, 14, 35–45. [Google Scholar] [CrossRef]
  10. Nwokolo, S.; Ogbulezie, J. A critical review of theoretical models for estimating global so-lar radiation between 2012-2016 in Nigeria. Int. J. Phys. Res. 2017, 5, 60. [Google Scholar] [CrossRef] [Green Version]
  11. Supit, I.; Kapper, R.V. A simple method to estimate global radiation. Sol. Energy 1998, 63, 147–160. [Google Scholar] [CrossRef]
  12. Jimenez, V.A.; Barrionuevo, A.; Will, A.; Rodríguez, S. Neural network for estimating daily global solar radiation using temperature, humidity and pressure as unique climatic input variables. Smart Grid Renew. Energy 2016, 07, 94–103. [Google Scholar] [CrossRef]
  13. Fan, J.; Wang, X.; Wu, L.; Zhang, F.; Bai, H.; Lu, X.; Xiang, Y. New combined models for estimating daily global solar radiation based on sunshine duration in humid regions: A case study in south China. Energy Convers. Manag. 2018, 156, 618–625. [Google Scholar] [CrossRef]
  14. Davy, R.J.; Huang, J.R.; Troccoli, A. Improving the accuracy of hourly satellite-derived solar irradiance by combining with dynamically downscaled estimates using generalised additive models. Sol. Energy 2016, 135, 854–863. [Google Scholar] [CrossRef]
  15. Mohanty, S.; Patra, P.K.; Sahoo, S.S. Prediction and application of solar radiation with soft computing over traditional and conventional approach—A comprehensive review. Renew. Sustain. Energy Rev. 2016, 56, 778–796. [Google Scholar] [CrossRef]
  16. Yadav, A.K.; Chandel, S.S. Solar radiation prediction using artificial neural network techniques: A review. Renew. Sustain. Energy Rev. 2014, 33, 772–781. [Google Scholar] [CrossRef]
  17. Hassan, M.A.; Khalil, A.; Kaseb, S.; Kassem, M.A. Potential of four different machine-learning algorithms in modeling daily global solar radiation. Renew. Energy 2017, 111, 52–62. [Google Scholar] [CrossRef]
  18. Quej, V.H.; Almorox, J.; Arnaldo, J.A.; Saito, L. Anfis, svm and ann soft-computing techniques to estimate daily global solar radiation in a warm sub-humid environment. J. Atmos. Sol.-Terr. Phys. 2017, 155, 62–70. [Google Scholar] [CrossRef]
  19. Wei, C.C. Predictions of surface solar radiation on tilted solar panels using machine learning models: A case study of Tainan city, Taiwan. Energies 2017, 10, 1660. [Google Scholar] [CrossRef]
  20. Hou, M.; Zhang, T.; Weng, F.; Ali, M.; Al-Ansari, N.; Yaseen, Z. Global solar radiation prediction using hybrid online sequential extreme learning machine model. Energies 2018, 11, 3415. [Google Scholar] [CrossRef]
  21. Urraca, R.; Martinez-de-Pison, E.; Sanz-Garcia, A.; Antonanzas, J.; Antonanzas-Torres, F. Estimation methods for global solar radiation: Case study evaluation of five different approaches in central Spain. Renew. Sustain. Energy Rev. 2017, 77, 1098–1113. [Google Scholar] [CrossRef]
  22. Zou, L.; Wang, L.; Lin, A.; Zhu, H.; Peng, Y.; Zhao, Z. Estimation of global solar radiation using an artificial neural network based on an interpolation technique in southeast China. J. Atmos. Sol.-Terr. Phys. 2016, 146, 110–122. [Google Scholar] [CrossRef]
  23. Gutierrez-Corea, F.V.; Manso-Callejo, M.A.; Moreno-Regidor, M.P.; Velasco-Gomez, J. Spatial estimation of sub-hour global horizontal irradiance based on official observations and remote sensors. Sensors 2014, 14, 6758–6787. [Google Scholar] [CrossRef] [PubMed]
  24. Rigollier, C.; Lefevre, M.; Cros, S.; Wald, L. Heliosat 2: An improved method for the mapping of the solar radiation from meteosat imagery. In Proceedings of the 2002 EUMETSAT Meteorological Satellite Conference, Dublin, Ireland, 1–6 September 2002; EUMETSAT: Darmstadt, Germany, 2002; pp. 585–592. [Google Scholar]
  25. Rigollier, C.; Lefèvre, M.; Wald, L. The method heliosat-2 for deriving shortwave solar radiation from satellite images. Sol. Energy 2004, 77, 159–169. [Google Scholar] [CrossRef]
  26. Janjai, S.; Pankaew, P.; Laksanaboonsong, J. A model for calculating hourly global solar radiation from satellite data in the tropics. Appl. Energy 2009, 86, 1450–1457. [Google Scholar] [CrossRef]
  27. Zhang, H.; Huang, C.; Yu, S.; Li, L.; Xin, X.; Liu, Q. A lookup-table-based approach to estimating surface solar irradiance from geostationary and polar-orbiting satellite data. Remote. Sens. 2018, 10, 411. [Google Scholar] [CrossRef]
  28. Polo, J.; Wilbert, S.; Ruiz-Arias, J.A.; Meyer, R.; Gueymard, C.; Súri, M.; Martín, L.; Mieslinger, T.; Blanc, P.; Grant, I.; et al. Preliminary survey on site-adaptation techniques for satellite-derived and reanalysis solar radiation datasets. Sol. Energy 2016, 132, 25–37. [Google Scholar] [CrossRef]
  29. SoDa. Solar Radiation Data. Available online: http://www.soda-pro.com/ (accessed on 20 March 2018).
  30. Ameen, B.; Balzter, H.; Jarvis, C.; Wey, E.; Thomas, C.; Marchand, M. Validation of hourly global horizontal irradiance for two satellite-derived datasets in northeast Iraq. Remote. Sens. 2018, 10, 1651. [Google Scholar] [CrossRef]
  31. Eissa, Y.; Korany, M.; Aoun, Y.; Boraiy, M.; Abdel Wahab, M.; Alfaro, S.; Blanc, P.; El-Metwally, M.; Ghedira, H.; Hungershoefer, K.; et al. Validation of the surface downwelling solar irradiance estimates of the helioclim-3 database in Egypt. Remote. Sens. 2015, 7, 9269–9291. [Google Scholar] [CrossRef]
  32. Marchand, M.; Al-Azri, N.; Ombe-Ndeffotsing, A.; Wey, E.; Wald, L. Evaluating meso-scale change in performance of several databases of hourly surface irradiation in south-eastern Arabic pensinsula. Adv. Sci. Res. 2017, 14, 7–15. [Google Scholar] [CrossRef]
  33. Thomas, C.; Wey, E.; Blanc, P.; Wald, L. Validation of three satellite-derived databases of surface solar radiation using measurements performed at 42 stations in Brazil. Adv. Sci. Res. 2016, 13, 81–86. [Google Scholar] [CrossRef] [Green Version]
  34. Journée, M.; Bertrand, C. Geostatistical merging of ground-based and satellite-derived data of surface solar radiation. Adv. Sci. Res. 2011, 6, 1–5. [Google Scholar] [CrossRef] [Green Version]
  35. Journée, M.; Müller, R.; Bertrand, C. Solar resource assessment in the benelux by merging meteosat-derived climate data and ground measurements. Sol. Energy 2012, 86, 3561–3574. [Google Scholar] [CrossRef]
  36. Sanchez-Lorenzo, A.; Wild, M.; Brunetti, M.; Guijarro, J.A.; Hakuba, M.Z.; Calbó, J.; Mystakidis, S.; Bartok, B. Reassessment and update of long-term trends in downward surface shortwave radiation over Europe (1939–2012). J. Geophys. Res. Atmos. 2015, 120, 9555–9569. [Google Scholar] [CrossRef]
  37. Roerink, G.J.; Bojanowski, J.S.; de Wit, A.J.W.; Eerens, H.; Supit, I.; Leo, O.; Boogaard, H.L. Evaluation of msg-derived global radiation estimates for application in a regional crop model. Agric. For. Meteorol. 2012, 160, 36–47. [Google Scholar] [CrossRef]
  38. Bojanowski, J.S.; Vrieling, A.; Skidmore, A.K. Calibration of solar radiation models for Europe using meteosat second generation and weather station data. Agric. For. Meteorol. 2013, 176, 1–9. [Google Scholar] [CrossRef]
  39. Şenkal, O.; Kuleli, T. Estimation of solar radiation over Turkey using artificial neural network and satellite data. Appl. Energy 2009, 86, 1222–1228. [Google Scholar] [CrossRef]
  40. Linares-Rodriguez, A.; Ruiz-Arias, J.A.; Pozo-Vazquez, D.; Tovar-Pescador, J. An artificial neural network ensemble model for estimating global solar radiation from meteosat satellite images. Energy 2013, 61, 636–645. [Google Scholar] [CrossRef]
  41. Quesada-Ruiz, S.; Linares-Rodríguez, A.; Ruiz-Arias, J.A.; Pozo-Vázquez, D.; Tovar-Pescador, J. An advanced ann-based method to estimate hourly solar radiation from multi-spectral msg imagery. Sol. Energy 2015, 115, 494–504. [Google Scholar] [CrossRef]
  42. Lu, N.; Qin, J.; Yang, K.; Sun, J. A simple and efficient algorithm to estimate daily global solar radiation from geostationary satellite data. Energy 2011, 36, 3179–3188. [Google Scholar] [CrossRef]
  43. Şenkal, O. Modeling of solar radiation using remote sensing and artificial neural network in Turkey. Energy 2010, 35, 4795–4801. [Google Scholar] [CrossRef]
  44. Fallahi, S.; Amanollahi, J.; Tzanis, C.G.; Ramli, M.F. Estimating solar radiation using noaa/avhrr and ground measurement data. Atmos. Res. 2018, 199, 93–102. [Google Scholar] [CrossRef]
  45. Qin, J.; Chen, Z.; Yang, K.; Liang, S.; Tang, W. Estimation of monthly-mean daily global solar radiation based on modis and trmm products. Appl. Energy 2011, 88, 2480–2489. [Google Scholar] [CrossRef]
  46. Aguiar, L.M.; Pereira, B.; Lauret, P.; Diaz, F.; David, M. Combining solar irradiance measurements, satellite-derived data and a numerical weather prediction model to improve intra-day solar forecasting. Renew. Energy 2016, 97, 599–610. [Google Scholar] [CrossRef]
  47. Mazorra Aguiar, L.; Pereira, B.; David, M.; Díaz, F.; Lauret, P. Use of satellite data to improve solar radiation forecasting with bayesian artificial neural networks. Sol. Energy 2015, 122, 1309–1324. [Google Scholar] [CrossRef]
  48. Marquez, R.; Pedro, H.T.C.; Coimbra, C.F.M. Hybrid solar forecasting method uses satellite imaging and ground telemetry as inputs to anns. Sol. Energy 2013, 92, 176–188. [Google Scholar] [CrossRef]
  49. Lima, F.J.L.; Martins, F.R.; Pereira, E.B.; Lorenz, E.; Heinemann, D. Forecast for surface solar irradiance at the Brazilian northeastern region using nwp model and artificial neural networks. Renew. Energy 2016, 87 Pt 1, 807–818. [Google Scholar] [CrossRef]
  50. Crisosto, C.; Hofmann, M.; Mubarak, R.; Seckmeyer, G. One-hour prediction of the global solar irradiance from all-sky images using artificial neural networks. Energies 2018, 11, 2906. [Google Scholar] [CrossRef]
  51. Al-Alawi, S.M.; Al-Hinai, H.A. An ann-based approach for predicting global radiation in locations with no direct measurement instrumentation. Renew. Energy 1998, 14, 199–204. [Google Scholar] [CrossRef]
  52. Jiang, Y. Computation of monthly mean daily global solar radiation in China using artificial neural networks and comparison with other empirical models. Energy 2009, 34, 1276–1283. [Google Scholar] [CrossRef]
  53. Feng, J.; Wang, W.; Li, J. An lm-bp neural network approach to estimate monthly-mean daily global solar radiation using modis atmospheric products. Energies 2018, 11, 3510. [Google Scholar] [CrossRef]
  54. Fadare, D.A. Modelling of solar energy potential in Nigeria using an artificial neural network model. Appl. Energy 2009, 86, 1410–1422. [Google Scholar] [CrossRef]
  55. Ozgoren, M.; Bilgili, M.; Sahin, B. Estimation of global solar radiation using ann over Turkey. Expert Syst. Appl. 2012, 39, 5043–5051. [Google Scholar] [CrossRef]
  56. Kisi, O. Modeling solar radiation of Mediterranean region in Turkey by using fuzzy genetic approach. Energy 2014, 64, 429–436. [Google Scholar] [CrossRef]
  57. Kaba, K.; Sarıgül, M.; Avcı, M.; Kandırmaz, H.M. Estimation of daily global solar radiation using deep learning model. Energy 2018, 162, 126–135. [Google Scholar] [CrossRef]
  58. Renno, C.; Petito, F.; Gatto, A. Ann model for predicting the direct normal irradiance and the global radiation for a solar application to a residential building. J. Clean. Prod. 2016, 135, 1298–1316. [Google Scholar] [CrossRef]
  59. Sharifi, S.S.; Rezaverdinejad, V.; Nourani, V. Estimation of daily global solar radiation using wavelet regression, ann, gep and empirical models: A comparative study of selected temperature-based approaches. J. Atmos. Sol.-Terr. Phys. 2016, 149, 131–145. [Google Scholar] [CrossRef]
  60. Jahani, B.; Mohammadi, B. A comparison between the application of empirical and ann methods for estimation of daily global solar radiation in Iran. Theor. Appl. Clim. 2018. [Google Scholar] [CrossRef]
  61. Khosravi, A.; Nunes, R.O.; Assad, M.E.H.; Machado, L. Comparison of artificial intelligence methods in estimation of daily global solar radiation. J. Clean. Prod. 2018, 194, 342–358. [Google Scholar] [CrossRef]
  62. Dahmani, K.; Notton, G.; Voyant, C.; Dizene, R.; Nivet, M.L.; Paoli, C.; Tamas, W. Multilayer perceptron approach for estimating 5-min and hourly horizontal global irradiation from exogenous meteorological data in locations without solar measurements. Renew. Energy 2016, 90, 267–282. [Google Scholar] [CrossRef]
  63. Ibrahim, I.A.; Khatib, T. A novel hybrid model for hourly global solar radiation prediction using random forests technique and firefly algorithm. Energy Convers. Manag. 2017, 138, 413–425. [Google Scholar] [CrossRef]
  64. Loutfi, H.; Bernatchou, A.; Raoui, Y.; Tadili, R. Learning processes to predict the hourly global, direct, and diffuse solar irradiance from daily global radiation with artificial neural networks. Int. J. Photoenergy 2017, 2017, 1–13. [Google Scholar] [CrossRef]
  65. Lopez, G.; Batlles, F.; Tovar-Pescador, J. Selection of input parameters to model direct solar irradiance by using artificial neural networks. Energy 2005, 30, 1675–1684. [Google Scholar] [CrossRef]
  66. Alam, S.; Kaushik, S.; Garg, S. Assessment of diffuse solar energy under general sky condition using artificial neural network. Appl. Energy 2009, 86, 554–564. [Google Scholar] [CrossRef]
  67. Soares, J.; Oliveira, A.P.; Božnar, M.Z.; Mlakar, P.; Escobedo, J.F.; Machado, A.J. Modeling hourly diffuse solar-radiation in the city of São paulo using a neural-network technique. Appl. Energy 2004, 79, 201–214. [Google Scholar] [CrossRef]
  68. Kottek, M.; Grieser, J.; Beck, C.; Rudolf, B.; Rubel, F. World map of the köppen-geiger climate classification updated. Meteorol. Z. 2006, 15, 259–263. [Google Scholar] [CrossRef]
  69. Schroedter-Homscheidt, M.; Hoyer-Klick, C.; Killius, N.; Lefèvre, M.; Wald, L.; Wey, E.; Saboret, L. User’s Guide to the Cams Radiation Service; 31/12/2017, CAMS72_2015SC2_D72.1.3.1-2017_UserGuide_v1; DLR-German Aerospace Center: Kölner, Germany, 2017. [Google Scholar]
  70. Blanc, P.; Gschwind, B.; Lefèvre, M.; Wald, L. The helioclim project: Surface solar irradiance data for climate applications. Remote. Sens. 2011, 3, 343–361. [Google Scholar] [CrossRef]
  71. Lefèvre, M.; Oumbe, A.; Blanc, P.; Espinar, B.; Gschwind, B.; Qu, Z.; Wald, L.; Schroedter-Homscheidt, M.; Hoyer-Klick, C.; Arola, A.; et al. Mcclear: A new model estimating downwelling solar radiation at ground level in clear-sky conditions. Atmos. Meas. Tech. 2013, 6, 2403–2418. [Google Scholar] [CrossRef]
  72. Reno, M.J.; Hansen, C.W.; Stein, J.S. Global Horizontal Irradiance Clear Sky Models: Implementation and Analysis; SAND2012-2389; Sandia National Laboratories: Albuquerque, NM, USA; Livermore, CA, USA, 2012.
  73. Ameen, B.; Balzter, H.; Jarvis, C. Quality control of global horizontal irradiance estimates through bsrn, toacs and air temperature/sunshine duration test procedures. Climate 2018, 6, 69. [Google Scholar] [CrossRef]
  74. MATLAB. The Neural Network Toolbox; R2016a; The Mathworks, Inc.: Natick, MA, USA, 2018. [Google Scholar]
  75. Khosravi, A.; Koury, R.N.N.; Machado, L.; Pabon, J.J.G. Prediction of hourly solar radiation in Abu Musa island using machine learning algorithms. J. Clean. Prod. 2018, 176, 63–75. [Google Scholar] [CrossRef]
  76. López, G.; Gueymard, C.A.; Bosch, J.L.; Rapp-Arrarás, I.; Alonso-Montesinos, J.; Pulido-Calvo, I.; Ballestrín, J.; Polo, J.; Barbero, J. Modeling water vapor impacts on the solar irradiance reaching the receiver of a solar tower plant by means of artificial neural networks. Sol. Energy 2018, 169, 34–39. [Google Scholar] [CrossRef]
  77. Premalatha, M.; Naveen, C. Analysis of different combinations of meteorological parameters in predicting the horizontal global solar radiation with ann approach: A case study. Renew. Sustain. Energy Rev. 2018, 91, 248–258. [Google Scholar]
  78. Ramedani, Z.; Omid, M.; Keyhani, A.; Shamshirband, S.; Khoshnevisan, B. Potential of radial basis function based support vector regression for global solar radiation prediction. Renew. Sustain. Energy Rev. 2014, 39, 1005–1011. [Google Scholar] [CrossRef]
  79. Voyant, C.; Muselli, M.; Paoli, C.; Nivet, M.-L. Optimization of an artificial neural network dedicated to the multivariate forecasting of daily global radiation. Energy 2011, 36, 348–359. [Google Scholar] [CrossRef]
  80. Hassan, G.E.; Youssef, M.E.; Mohamed, Z.E.; Ali, M.A.; Hanafy, A.A. New temperature-based models for predicting global solar radiation. Appl. Energy 2016, 179, 437–450. [Google Scholar] [CrossRef]
  81. Pérez-Burgos, A.; Díez-Mediavilla, M.; Alonso-Tristán, C.; Dieste-Velasco, M. Retrieval of monthly average hourly values of direct and diffuse solar irradiance from measurements of global radiation in Spain. J. Renew. Sustain. Energy 2018, 10, 023707. [Google Scholar] [CrossRef]
  82. Lee, H.-J.; Kim, S.-Y.; Yun, C.-Y. Comparison of solar radiation models to estimate direct normal irradiance for Korea. Energies 2017, 10, 594. [Google Scholar] [CrossRef]
Figure 1. Climate regions and station types in the study area.
Energies 12 00148 g001
Figure 2. ANN architecture description.
Energies 12 00148 g002
Figure 3. Flowchart of the methodology steps.
Energies 12 00148 g003
Figure 4. Comparison of rBias for the hourly GHI among models and for the overall results of station types.
Energies 12 00148 g004
Figure 5. As in Figure 4, but for relative Root Mean Square Error (rRMSE).
Energies 12 00148 g005
Figure 6. Scatterplots of hourly GHI ground measurements and ANN model estimated from M1–M10 at test data for overall results at tower stations.
Energies 12 00148 g006
Figure 7. Scatterplots of hourly GHI residuals versus ANN model estimated from M1-M10 at test data for overall results at tower stations. The plots clearly reveal that the models were a good fit at M4, M5 and M7–M10 whereas it is not fit at M1 and low fit are seen at M2, M3 and M6.
Energies 12 00148 g007
Figure 8. Scatterplots of hourly GHI ground measurements and ANN model estimated from M1–M10 at test data for overall results at automatic stations.
Energies 12 00148 g008
Figure 9. Scatterplots of hourly GHI residuals versus ANN model estimated from M1–M10 at test data for overall results at tower stations. The plots clearly reveal that the models were a good fit for all except M1.
Energies 12 00148 g009
Table 1. The literature for estimating Global Horizontal Irradiance (GHI) with Artificial Neural Networks (ANN) models on hourly time scales.
ReferenceInputsNeurons in the Hidden LayerTraining AlgorithmBest RMSE
[62]SD, AT, RH, WS, TOA, precipitation, Pressure, Declination, Zenith angle and Wind direction1–8 By 1 or 2feed-forward backpropagation Levenberg–Marquardt13.3%
[63]AT, RH, sunshine ratio, Day number, Month number, Number of an hour per day3 and 6Firefly algorithm18.9%
[64]SD, AT, RH, WS, Declination angle, GHI daily, daylight hours, TOA, a sunshine fraction10, 15 and 20feed-forward Levenberg–Marquardt13.1%
[5]TOA, Solar time and Day number100, 180, 210 and 300 -17%
This studySD, At, RH, WS, Cs, TOA, HC3v5 and CRSv320–140 by 10feed-forward backpropagation Levenberg–Marquardt?
Table 2. Tower stations with hourly data of Air Temperature (AT), Relative Humidity (RH) and Wind Speed (WS) and GHI at ground measurements with GHI of two Satellite-Derived Datasets (SDDs) and with calculated clear sky (Cs) and top-of-atmosphere (TOA) irradiance.
StationCoordinates (Degrees)Elevation a.s.l (m)Period (dd/mm/yy)
Batufa37.1764 N43.0236 E94701/01/2011–31/12/2013
Enjaksor37.0603 N42.4353 E50901/01/2011–31/12/2014
Hojava37.0075 N43.0369 E93301/01/2011–31/12/2013
Jazhnikan36.3564 N43.9556 E43001/01/2011–31/10/2013
Tarjan36.1258 N43.7353 E27601/01/2011–31/12/2013
Table 3. Automatic stations as data in Table 2, plus SD.
StationCoordinates (Degrees)Elevation a.s.l (m)Period (dd/mm/yy)
Halsho36.2097 N45.2598 E110501/01/2013–31/12/2016
Bazian35.6021 N45.1376 E89201/04/2014–30/12/2016
Maydan34.9194 N45.6224 E33001/01/2014–31/12/2016
Kalar34.6244 N45.3049 E21801/01/2014–31/12/2016
Table 4. Inputs and output to the ANN models.
ModelsInputs (Automatic Stations)Inputs (Tower Stations)Output
M1SD, AT, RH, WSAT, RH, WSGHI
M2SD, AT, RH, WS, CsAT, RH, WS, CsGHI
M3SD, AT, RH, WS, TOAAT, RH, WS, TOAGHI
M4SD, AT, RH, WS, HC3v5AT, RH, WS, HC3v5GHI
M5SD, AT, RH, WS, CRSv3AT, RH, WS CRSv3GHI
M6SD, AT, RH, WS, Cs, TOAAT, RH, WS, Cs, TOAGHI
M7SD, AT, RH, WS, Cs, HC3v5AT, RH, WS, Cs, HC3v5GHI
M8SD, AT, RH, WS, Cs, CRSv3AT, RH, WS, Cs CRSv3GHI
M9SD, AT, RH, WS, Cs, TOA, HC3v5AT, RH, WS, Cs, TOA, HC3v5GHI
M10SD, AT, RH, WS, Cs, TOA, CRSv3SD, AT, RH, WS, Cs, TOA, CRSv3GHI
Table 5. Statistical results of hourly GHI models averaged for each model M1–M10 for tower stations. Mean, bias and RMSE units are W/m2.
ModelsTrainValidationTest
MeanBias%RMSE%rMeanBias%RMSE%rMeanBias%RMSE%r
M1517.2−0.4−0.1206.6400.617516.20.20.0208.440.20.6005113.40.7209.5410.601
M2516.23.70.7103.4200.919513.64.00.8105.420.40.916516.72.30.4104.420.20.917
M3514.81.70.3111.621.60.905518.8−0.4−0.1112.821.60.903519.7−1.7−0.3111.821.50.903
M4515.81.80.36212.20.971518.41.00.262.6120.971516.71.50.362.912.20.971
M5515.60.20.076150.957516.41.00.276.614.80.956517.21.70.375.614.60.958
M6516−0.6−0.19518.40.932514−0.8−0.298.419.40.927518.70.90.298.118.90.929
M7515.6−1.5−0.359.811.40.974513−1.1−0.260.411.60.973521.1−2.0−0.460.411.60.973
M8515.8−0.7−0.17314.20.961519.2−1.4−0.374.214.20.960514−0.10.075.314.60.958
M9515.60.40.159.211.40.974518.60.40.159.611.40.974516.30.30.16011.60.974
M10517.21.30.255.810.80.977512.61.80.458.211.40.975513.8−0.20.057.811.20.976
Table 6. As in Table 5, but for automatic stations.
ModelsTrainValidationTest
MeanBias%RMSE%rMeanBias%RMSE%rMeanBias%RMSE%r
M1485−0.2−0.1160.533.00.743481.21.20.2162.033.80.736482.21.40.3163.633.70.755
M2484.20.40.154.311.50.974486.5−0.20.055.811.50.973479.90.70.156.811.80.974
M3484.5−0.6−0.155.511.80.973479.2−1.2−0.359.012.30.970485.4−2.0−0.458.812.10.971
M44840.00.053.811.30.9754880.80.254.511.30.974480.4−0.5−0.154.611.40.976
M5484.71.50.358.812.50.970480.52.00.461.813.00.967484.41.60.360.012.40.970
M6482.5−0.7−0.152.810.80.976491.2−1.3−0.354.011.00.974482.6−0.5−0.154.111.20.976
M7483.51.20.346.09.30.982486.50.40.147.39.50.981483.31.10.247.69.80.981
M84840.10.048.510.30.979481.7−0.10.050.010.30.9784860.30.149.510.20.980
M94840.70.143.59.00.9844800.00.044.39.30.983487.9−0.20.046.39.50.983
M10484.50.30.144.59.50.983483.20.60.145.39.30.982482.10.30.147.29.80.982

