Investigation on Water Hammer Control of Centrifugal Pumps in Water Supply Pipeline Systems


Department of Hydraulic Engineering, College of Civil Engineering and Architecture, Zhejiang University, Hangzhou 310058, China
*
Author to whom correspondence should be addressed.
Energies 2019, 12(1), 108; https://doi.org/10.3390/en12010108
Submission received: 28 November 2018
/
Revised: 19 December 2018
/
Accepted: 29 December 2018
/
Published: 29 December 2018
(This article belongs to the Special Issue Fluid Flow and Heat Transfer)
Abstract
:Water hammer control in water supply pipeline systems is significant for protecting pipelines from damage. The goal of this research is to investigate the effects of pumps moment of inertia design on pipeline water hammer control. Based on the method of characteristics (MOC), a numerical model is established and plenty of simulations are conducted. Through numerical analysis, it is found that increasing the pumps moment of inertia has positive effects both on water hammer control as well as preventing pumps rapid runaway speed. Considering the extra cost of space, starting energy, and materials, an evaluation methodology of efficiency on the increasing moment of inertia is proposed. It can be regarded as a reference for engineers to design the moment of inertia of pumps in water supply pipeline systems. Combined with the optimized operations of the valve behind the pumps, the pipeline systems can be better protected from accident events.
1. Introduction
Due to the non-uniformity on spatial and temporal distribution of water resources, long-distance water supply systems are required to deliver water from humid regions to arid regions, and from the wilderness to the cities [1]. Water hammer is an undesired hydraulic phenomenon in this kind of engineering, especially in pressured pipelines. It is a pressure wave caused when the running condition of the system is changed, for example, a sudden valve closure at the end of a pipeline system, causing a pressure wave to propagate in the pipe. Extreme water hammer can cause pipe and device damage by high overpressure or low negative pressure [2,3,4,5]. Operations such as rapid opening and closing of the valves, starting and shutting down the pumps, and other sudden changes on devices along the pipeline will cause water hammers. To reduce harmful extreme water hammers, designers usually use pressure control devices such as surge tanks [6,7,8], air valves [9,10], and pressure vessels [11,12,13], as well as changing the operation time of valves [14,15,16], to keep the extreme pressure in a safe range. Usually, it is the water hammer occurring place that will load the most extreme pressure. For example, the valve at the end of a pipeline will bear the highest pressure in the whole pipeline in a water hammer after a rapid closing of it, and the outlet tube of a pump will suffer the lowest negative pressure in a water hammer caused by a pump stop event [17,18,19]. The magnitude of extreme pressure of the worst case is related to the wave speed of water hammer and the time for valve closing according to the Joukowsky formula [20], and it can be significantly reduced by expanding the closing time of the valves. The pressure control devices can protect the part of the pipeline on the other side of it, opposite to the pressure wave source [21]. Thus, the pressure control devices are normally recommended to be set somewhere most likely to produce a water hammer, if the geographical conditions permit this [22]. Nevertheless, pressure control devices set at other special positions may have a great positive influence too. For instance, in-line valves are selected to isolate parts of the system from a high-pressure source to a low-pressure water hammer event [14], in this way greatly reducing or eliminating any return surge.
Sometimes, the pressure control devices are limited by the geographical conditions. For instance, surge tanks provide a free surface to reflect the pressure wave and store energy, reducing the reflection time of the system and limits the influence of the pressure wave, which helps to protect the upstream section from higher pressure. Meanwhile, there is a problem with the limited heights, caused by mass oscillations between the reservoir and the surge tanks, which can be limited by throttles in the surge tanks [23,24,25]. On the other hand, when the pipeline is buried deep underground, the air valve is difficult to install. Except for adding pressure control devices in the pipeline systems, there are other methods to reduce the extreme pressure. Li et al. [26] proposed an improved bypass pipe which overcomes the limitations of conventional bypass pipes and can significantly help to reduce the maximum extreme pressure in a pumped water supply system. Triki [27,28] investigated other water hammer control strategies using an in-line polymeric short-section, and a branched polymeric penstock, respectively, and found both have a significant effect on mitigating the pressure increase and decrease induced by water hammer waves. Zeng et al. [29] analyzed different guide vane closing schemes on reducing water hammer intensity. Considering controlling the pulsating pressure and runaway speed during the transient processes, a three-phase valve closing scheme showed an obvious advantage, and is validated by correspondingly conducted experiments. Ballun [30] investigated advantages of different kinds of valves and proposed a methodology for designers to predict and ultimately prevent the valve slam. Hur et al. [31] used a frequency response analysis to study the homologous relationships between the rotational speed of a pump and its head or discharge, and derived the transfer functions for the head and discharge between the upstream and downstream pumps. Wan et al. [32], on the other hand, presented an optimal collaborative scheme to prevent inverse rotation and overpressure during the startup process.
In this research, another strategy is proposed to control the transient processes by adjusting the pumps moment of inertia in pumped water supply systems. Compared to other strategies, it can be accessed directly by changing the size of the flywheel of a pump and does not require further artificial operations. Through 1D pressured water supply pipeline model establishment and plenty of numerical simulations, the principles of adding a moment of inertia are analyzed. It is found that this strategy has a positive effect on both extreme pressure and pumps runaway speed control. Combining the operations on valves, more cases are studied, and a kind of evaluation methodology is proposed to judge the improvement. The results show that an optimized strategy of staging the valve closing period, and an appropriate increase of pumps moment of inertia can significantly reduce the water hammer intensity and protect the devices.
2. Materials and Methods
2.1. Method of Characteristics
In this study, the simulation was conducted by programming in FORTRAN based on MOC and the boundary conditions of the involved devices. To simulate a transient process, there are a lot of numerical methods, including the Finite Difference Method (FDM) [33] and the Finite Element Method (FEM) [34,35]. The FDM method of characteristics (MOC) is one of the most widely used methods recently, because of its convenience and accuracy. In water supply pipeline systems, using the method of characteristics [36], the complete dynamic governing equations can be expressed as Equations (1) and (2). There are some assumptions made in the derivation of the equations. The flow in a pipe is one-dimensional and the control volume is fixed relative to the pipe. The velocity and pressure are uniform at the cross sections of the pipe, and the fluid density is constant. The pipe walls and fluid are linearly elastic, that is, stress is proportional to the strain. And the temperature is assumed to be constant [36]:
where and are independent variables denoting the location and the time, respectively, and correspondingly, the h and v are dependent variables denoting, respectively, the hydraulic pressure and the flow velocity. is the instantaneous wall shear stress, which can be divided into two parts [37]. One is , representing the quasi-steady component, where denotes the Darcy friction factor, which is valued as 0.029 in the simulation of this study, denotes the diameter of the pipeline, and is the dominant friction factor in a steady flow. , the unsteady component, has a significant influence on the water hammer intensity reducing process. However, it affects little on the value of the extreme pressure, which is usually the first strike when the water hammer occurs. To simulate the unsteady component, various numerical methods were proposed. Instantaneous acceleration-based (IAB) models and weighting function-based (WFB) are the two popular models [37]. represents the angle between the pipeline and the horizontal plane. However, in this research, it is the extreme pressure that we care about, the unsteady friction factor was therefore neglected. Controlling the characteristic relation between wave speed and meshes, which is the essential assumption of MOC, is shown as Equation (3),
the variables at the next time step on the middle node can be inferred from the parameters at the last time step on those three adjacent nodes, expressed as Equation (4) derived from Equation (1)–(3):
in which , , denotes the water head at section at time ; denotes the discharge at section at time ; denotes the water head at section at time ; denotes the discharge at section at time ; denotes the water head at section at time , and denotes the discharge at section at time . The access of the variables at the next time step can be expressed as two characteristic lines, shown in Figure 1. The positive characteristic line represents the controlling relationship between the variables of the node at section at time , and the hydraulic head and discharge of the node at section at time . While the negative characteristic line represents the controlling relationship between the variables of the node at section at time , and the variables of the node at the downstream adjacent section at time . As the variables of the adjacent nodes at time are already known, the middle node at the next time step can be solved by combining the two characteristic lines. In this way, the variables can be solved in every inner section except the boundary sections.
Furthermore, in a water supply system, there are always many kinds of devices set along the pipelines, such as valves, tanks, pumps, etc. Therefore, to simulate the transient processes in water supply systems, those boundary conditions need to be solved first. In previous research, boundary conditions have been a significant topic in numerical simulations [8,38,39,40,41]. Till now, researchers have investigated a series of reliable and effective accesses in numerical simulations of transients in water supply systems.
2.2. Boundary Conditions of Pumps
Pumps are frequently used in hydraulic systems. To simulate a transient process of a hydraulic system with a pump station, the boundary conditions of pumps are necessary to be solved correctly. The running characteristics of a pump depend on several parameters. Four quantities are involved in the characteristics, including the dynamic head , the flow discharge , the shaft torque , as well as the rotational speed .
In addition, every single pump has its own complete characteristics curve, which determines the relationship among these four quantities. According to the rated dynamic head , the rated flow discharge , the rated shaft torque , and the rated rotational speed , the complete characteristics can be expressed in the following form as Equation (5):
where and are two defined dimensionless quantities representing the features of the pumps, the curve of which consists the relationships among the four dominant variables mentioned above. Once two of the variables are determined, the others can be derived using the characteristic curves represented by and . Figure 2 shows the complete characteristic curve of the pump used in this simulation model. It is an imaginary turbine with the parameters changed according to the example described in reference [2]. The abscissa represents the instantaneous position of pump operation. That means only two quantities among them are independent. Along with the complete characteristic curve, a certain operating condition can be concretely expressed numerically.
3. Model Establishment
3.1. Pipeline Meshing
In a long water supply system, there are various kinds of pipelines, including steel pipes, PCCP pipes and tunnels etc. that divides a water supply system into several zones. Due to the differences in the diameter, roughness, and elasticity, the wave velocity and rubbing effect in the zones are not the same. At the connecting profile of two continuous pipeline sections, usually, it may not be divided just exactly at the abrupt change profile. To deal with the meshing problem, the wave speed or pipe length must be modified in the numerical simulation model, and that inevitably leads to a system error. The best way to limit the simulation system error is to compact the meshing. The closer the adjacent sections are set, the more accurate the simulation will be. However, while increasing the accuracy by using dense mesh, the calculating time and internal storage required in the computer are enhanced at the same time.
In the simplified model shown in Figure 4, there are two reservoirs upstream and downstream, whose boundary conditions are assumed to regard the water level of them kept constant during the transient processes. A pump station is located at the upstream side to provide hydraulic head, and the pipeline is a long tunnel through a mountain connecting the two reservoirs. The meshing is uniformly distributed according to Equation (3), which should satisfy the Courant condition [36]. The maximum value of time step mainly depends on the rate at which the transient process occurs. There is no compulsory restriction on the minimum value of time step, in theory, however, the less the time step is set, the longer the running time of the program, and the higher the cost. From previous investigations [42], it is found that when the time step is in the order of 0.01 s, the detailed reflection of device operations, and the simulation accuracy can be ensured. Considering the running time and accuracy of the calculation, the time step is chosen to be 0.01 s in this numerical model empirically. According to the basic assumption of MOC, Equation (3), which requires the location step to equal the time step multiplying the wave speed. Therefore the mesh density is set every 10 m, as the wave speed is considered as 1000 m/s in the model.
3.2. Pumps Moment of Inertia
In a water supply system, pumps are the energy providing devices, pressurizing the delivering liquids meters to tens of meters’ water head. Both starting and stopping the pumps can cause water hammer in the pipelines. Starting a pump can cause a positive pressure rising wave delivering downstream, while stopping a pump may lead to a sudden pressure decrease. In a pressured pipeline system, extreme negative pressure is always an undesired phenomenon that may cause the stability failure of pipelines. Determined by the material, the pipelines can tolerate a certain range of negative pressure, which is the available static pressure, similar to its loading capacity of positive pressure. When the intensity of negative pressure is within the tolerable range, it is not severe and can be resisted by the pipeline. However, when the intensity of the negative pressure is beyond the tolerable range of the pipelines, it will be critical.
The moment of inertia is a kind of inherent parameter that determines the rotate speed changing processes, with a dominant influence on the restrictive relationship among the four variables illustrated above, connected with Equation (5). In Equation (7), is the unbalanced torque, is the moment of inertia, is the weight of the rotating part plus entrained liquid, is the radius of gyration of the rotating mass, is the angular velocity in radians, and represents the angular acceleration. It shows that the angular acceleration is inversely proportional to the moment of inertia.
Figure 5 shows the negative pressure wave producing process in a controlled volume behind the pump after pump stopping. After the pump power off, while the discharge through section remains as large as the steady condition, the discharge through section decreases with the rotate speed of the pump. In this way, the water supplied from upstream cannot fulfill the room in the control volume anymore. The faster the angular velocity ω decreases, the worse the negative water hammer will be. Therefore, we prefer the angular acceleration to be less, which demands the moment of inertia of the pump to raise. When the moment of inertia of the pump increases, the acceleration processes of pump start and stop last longer. It should have a positive effect on water hammer control by expanding the transient responding time after a sudden operation.
4. Simulation and Analysis
4.1. Pump Load Process and Extreme Pressure Along Pipeline
The parameters of the simulated pipeline and pumps are listed in Table 1. The simulated conditions are shown in Table 2, which are changed at the moment of inertia or valve operations to investigate different aspects as follows. is the start time of valve operation, is the time period of the first stage of valve operation, is the time period of the first stage of valve operation, is the closed ratio of the first stage, and is the closed ratio of the second stage. To investigate the influence of changing pumps moment of inertia on water hammer protection, the first five cases shown in Table 2, which use different moments of inertia without valve operations, are simulated respectively for comparison. In all the simulated cases, the pump failure times are set as 1000 s uniformly. Actually, the model does not need that long to achieve stability, however, it is set at this value to imitate a sudden failure during a normal running condition. As the length of the pipeline is 40 km, and the pressured wave speed is 1000 m/s, the reflection time is therefore s after the pump’s failure. It is the time of the first water hammer response transferring back after the event occurrence. The upstream water level is 0 m, while the downstream water level is 30 m higher, which needs the pumps to provide the head difference and extra energy to overcome the friction along the pipeline. Therefore, after pumps failure, the water will flow backward and push the pumps to inverse if the valve is not closed. In this part of the analysis, the valve is kept open, thus, the backflow would cause the pumps inversion. The operations of the valve will be analyzed in the following section. Increasing the pumps moment of inertia can be easily accessed by adding a flywheel onto the pump’s spindles, as shown in Figure 6.
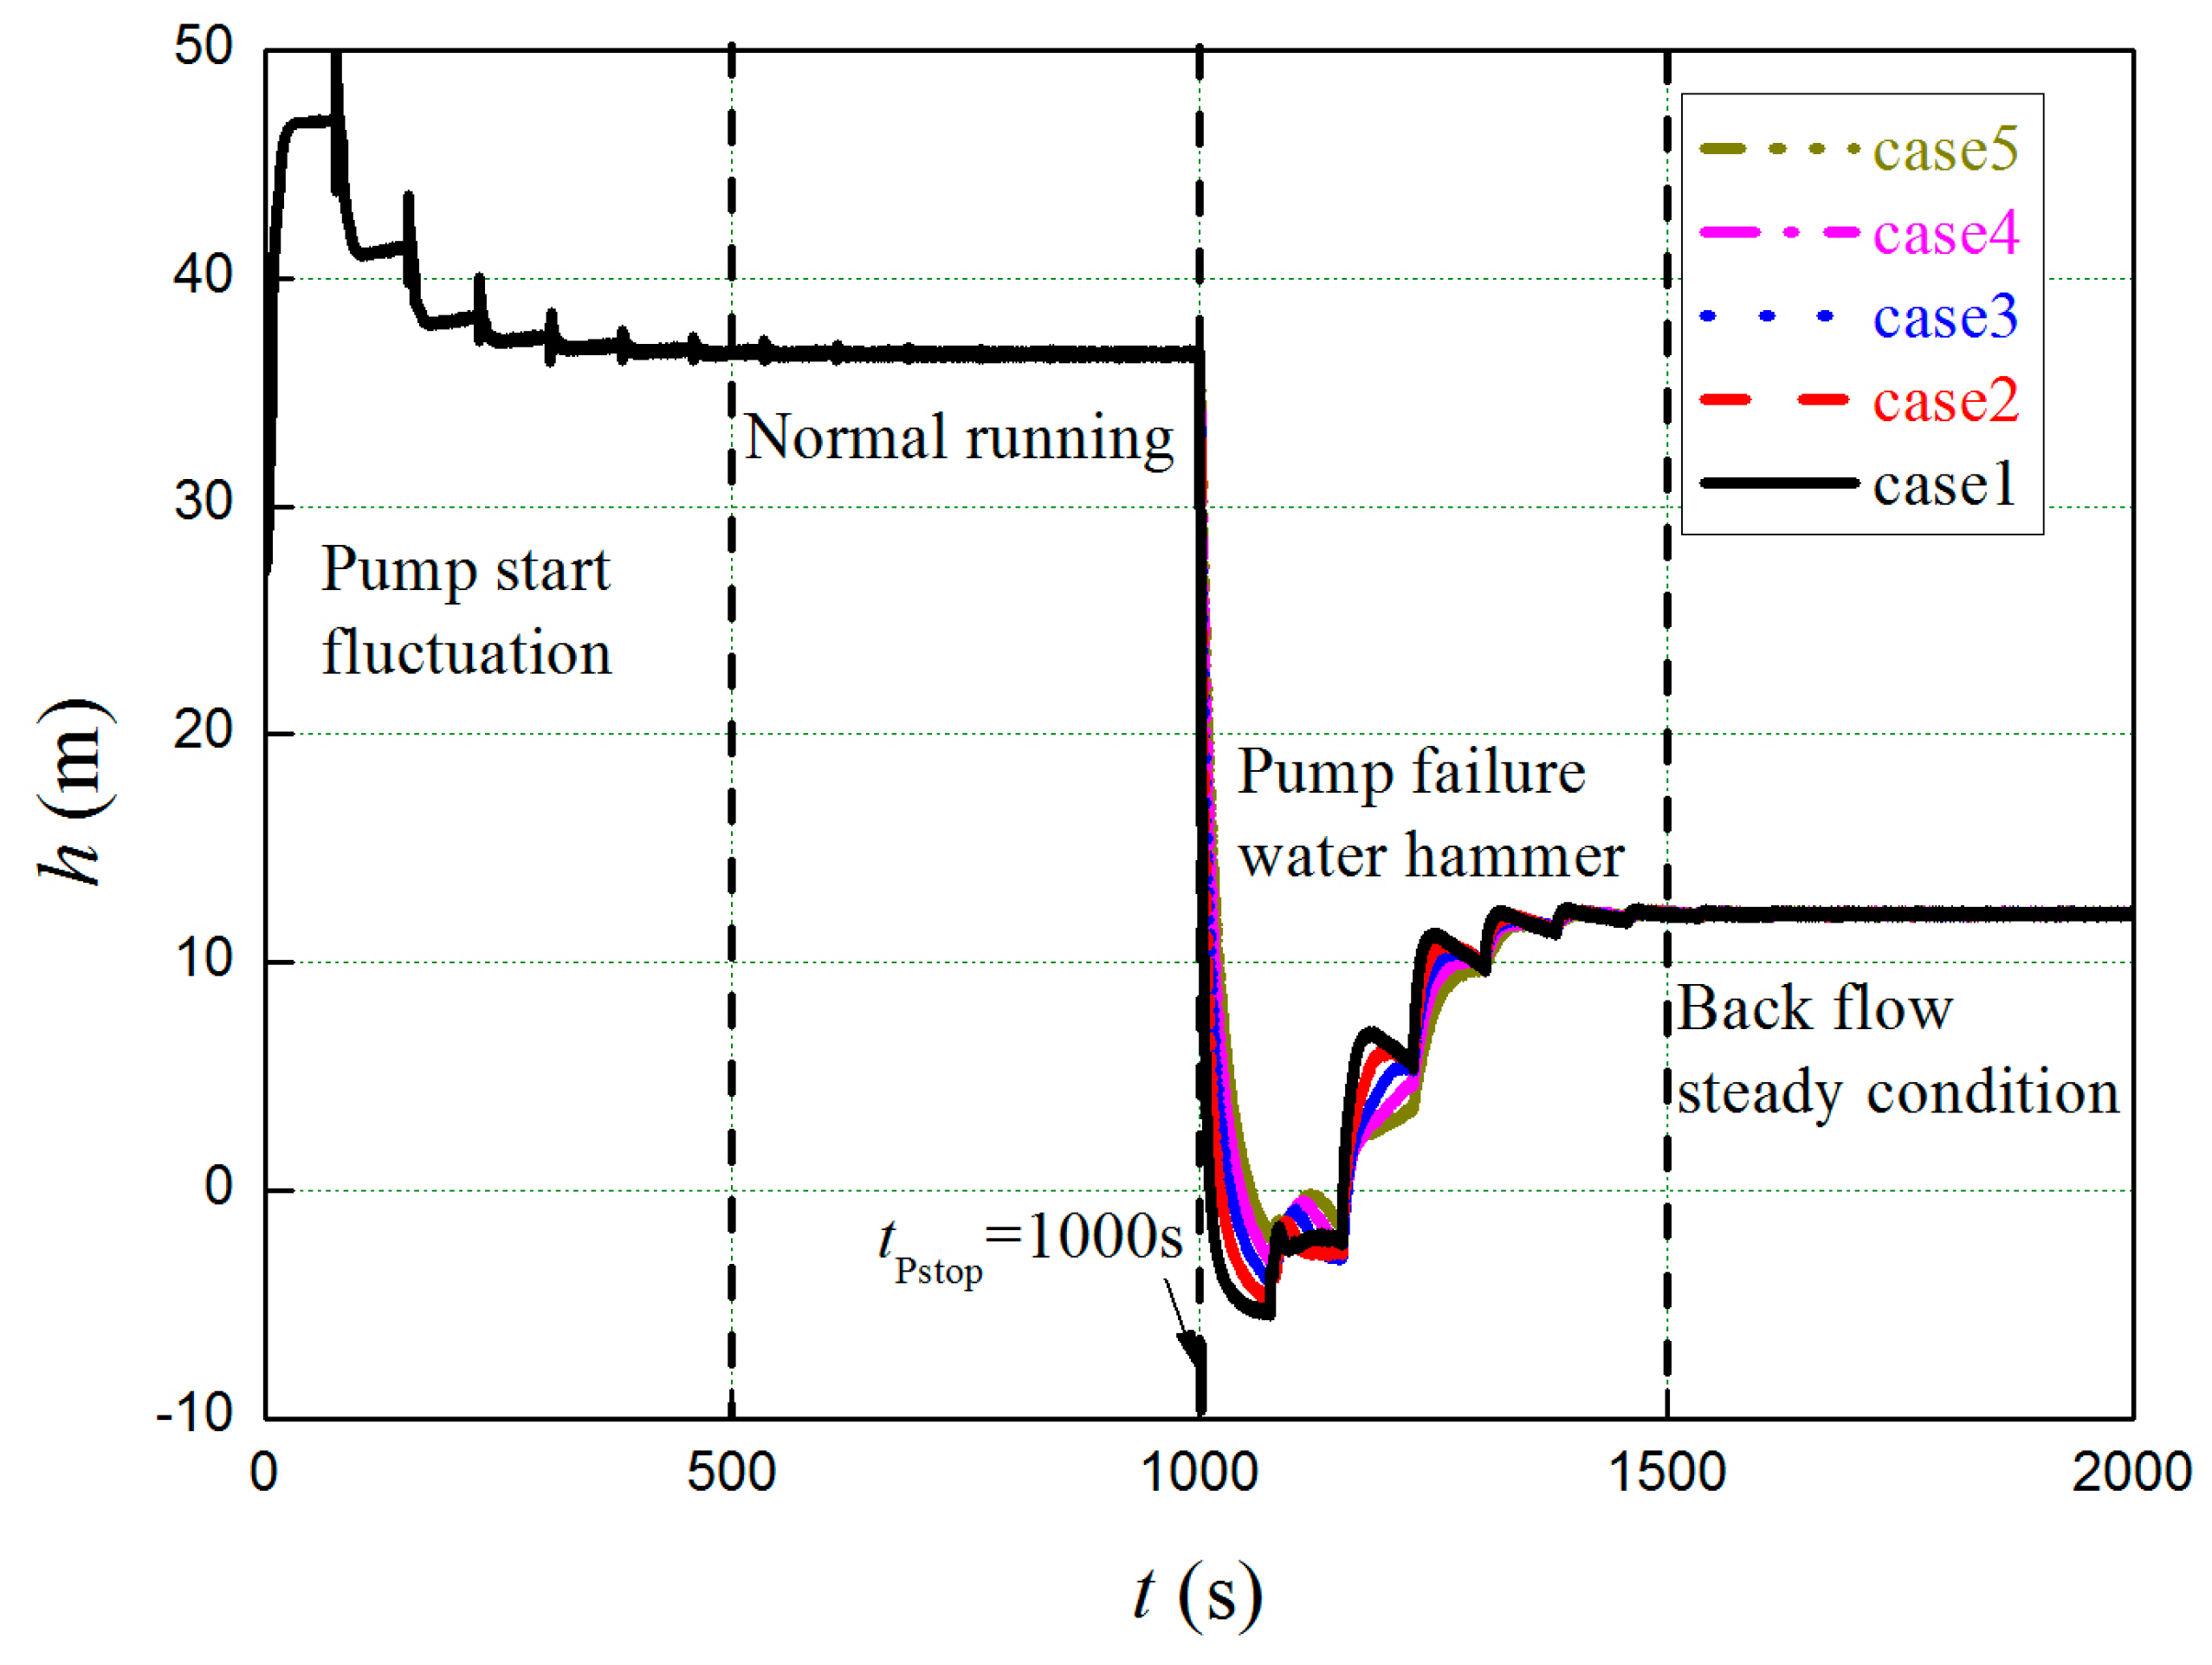
After a sudden power off, the pumps lose electric force resource to sustain the water supply function, turning gradually slower due to the inertia. In this way, the water discharge drawn through the pumps decreases, while the outlet of the control volume in Figure 5 remains at a high velocity. Therefore, the negative pressure wave occurs as the momentum of the water in the control volume decreases. Figure 7 shows the complete pressure processes behind the pump of the whole simulation under a series of conditions including the pumps’ start, normal running condition, pumps’ failure, and backflow steady condition. Under different conditions of additional moment of inertia, the start period, normal running, and backflow steady conditions differ little, while the difference in the pump failure period is obvious. For a clear comparison, a detailed view of the pressure changing process in the pump failure period at the location right behind the pumps is shown in Figure 8. After the power off, the hydraulic head behind the pumps decreases dramatically, which produces a negative water hammer. Using pumps with a high moment of inertia, the head dropping process shows a relatively smooth trend compared to other conditions. That leads to a protection effect for the water supply system by reducing the negative water hammer intensity. However, there is an interesting inversion of those pressure curves under different conditions. In this set of curves, the inversion zone appears at about 150 s after the pumps power off. It reveals that the pressure process under a low moment of inertia condition not only decreases rapidly but also has a quicker rise back than the other conditions. Obviously, it can be regarded as a sign of a stronger intensity of the produced negative water hammer.
Figure 9 shows the non-dimensional rotate speed of the pumps and the non-dimensional velocity of the water flowing through the pumps. The non-dimensional rotate speed is using the actual rotate speed divided by the rated rotate speed of the pump, and the non-dimensional velocity is using the actual discharge divided by the rated discharge of the pump. During the period of the normal running condition, the flow discharge is 3.74 m3/s, the cross area of the pipeline is 19.6 m2, and the flow velocity is 0.19 m/s. After about 500 s since the pump failure with no operations on the valve, the system reaches another steady condition, where the backflow discharge is −6.1 m3/s, and the corresponding velocity is −0.31 m/s. The hydraulic head analyzed in this study, sometimes called the piezometer head, does not include the velocity head. The velocity head is as large as , and the velocity . Then, the velocity head of the normal condition and backflow steady condition are, respectively, 0.0018 m and 0.0049 m. Compared to the changes on the hydraulic head, the velocity head affects little. As for the pumps’ behavior, in normal conditions, the rotate speed is 375 r/min, equal to the rated rotate speed. In the backflow steady condition after the pumps’ failure without valve operations, the pumps will be forced to inverse by the backflow force provided by the water level difference between the upstream and downstream reservoirs. The non-dimensional rotate speed of inversion will reach −0.87, finally, which is about −326 r/min. The inversion needs to be controlled, because the extended rapid runaway speed may cause damage to the pumps as well. In comparison, it can be seen that the normal running condition and backflow steady condition do not differ as the moment of inertia changes. The moment of inertia only affects the unsteady transient processes. Apparently, regardless of the rotate speed or fluid velocity, pumps of higher moment of inertia show better stability and produce slighter water hammer than those of low moment of inertia. Thus, it is clear that using pumps with a high moment of inertia is definitely a more secure choice for water hammer control in engineering.
In reality, we are concerned more about the extreme pressure along the pipeline rather than the water hammer process at a certain place. That is because the center pipeline altitude can be changed limited by the topographic conditions. For instance, the pipeline should be deeper underground when crossing a river, and it may rise along with a hillside. Thus, the long-distance water supply pipelines are usually not horizontal. Figure 10 shows the comparison of the extreme pressure curve along the pipeline. The simulation results show that increasing the pumps moment of inertia can not only protect the most severe negative pressure zone but also reduce the water hammer intensity in the whole pipeline system.
4.2. Quantity of Additional Moment of Inertia
The moment of inertia can be accessed by changing the mechanic structure of the pumps. Except for improving the working accuracy by reducing the water hammer intensity, it will accelerate the cost and the occupied space at the same time. Except for adding an additional moment of inertia of pumps, there are still plenty of ways to reduce the water hammer intensity, such as surge tanks, air valves, optimization of operations, etc. Therefore, there is no need to increase the pumps moment of inertia with no limit. That will cost unnecessary economical and space resources. To numerically compare the value of positive effect, two quantities are defined. represents the difference of the extreme low pressure at the side of pipe right next to the pumps, where the negative pressure wave first occurs under the conditions of case n1# and case n2#, where n1 and n2 are two integers, representing the order number of two different cases selected from five different cases shown in Table 1. In most conditions, that is the location of the worst zone in a water hammer caused by a pump power off event. Therefore, it is regarded as a typical quantity to measure the protecting effect. However, in the conditions with a low moment of inertia, the rotate speed of the pumps would reduce quickly. The filled water inlet may only relieve the negative pressure of the upstream part but cannot access the downstream part to relieve the negative pressure wave delivered there. Therefore it is possible that the minimum pressure will occur somewhere else in the pipeline. The hydraulic head , sometimes called piezometer head, equals the pipe center line height adding the relative pressure inside the pipe. When the hydraulic head curve is lower than the altitude of the pipe center line, the pipe will suffer negative pressure. In normal conditions, there is no negative pressure in the pipeline. However, in a water hammer process, the negative pressure wave may bring about a dramatic head decrease, and when the head decrease is greater than the original positive pressure at that point, negative pressure occurs. Therefore, other than additional devices and optimization of operations, reducing the pipeline height can significantly help to prevent negative pressure occurrence in the pipeline, while increasing the positive pressure. Take case 1# for example, the negative pressure wave influence is shown in Figure 11. There are three locations along the pipeline picked out to show the negative pressure delivering process, which are, respectively, , , and . The other one is , the whole area surrounded by two extreme pressure curves of different conditions, which represents the effect along the whole water supply system. Figure 12 shows the definition of and .
To find a rule between the additional moment and the caused positive effect on pressure control, more conditions are simulated, since the original five cases were not adequate to reflect the trend. Seven of them were selected to show the trend of the two defined quantities. Figure 13 shows the relationship between the times of additional moment and the caused positive effect represented by those two quantities of adjacent cases, using the first seven cases listed in Table 2.
Obviously, as the increase of the additional moment of inertia, the efficiency of the improvement on extreme pressure control effect will not be maintained at a high level. Especially , which represents the sight of the whole pipeline system, which keeps decreasing while the moment grows. Concerning the most severe zone in the pipeline, which is the point right behind the pump station, the helpful quantity of additional moment is limited below 6 times of the original moment of inertia. However, that can only be a qualitative conclusion, because the concrete numerical value is only suitable for the model established in this study, thus there is a lack of universality.
4.3. Considering the Valve
The simulations conducted above are without considering operations of valves. Normally, to ensure the pumps are not damaged from rapid runaway speed, there is always a non-returning valve set behind the rotors, as shown in Figure 5. Once the pump starts to inverse, the valve should be closed to protect the pump. However, operation of the valve can also bring undesired consequences to the system. If the valve is closed too fast or not at a suitable time, it will cause another water hammer event even more severe than the one caused by pump failure. In order to figure out the effect of putting off the valve closing time, as well as staging the valve operation, three more cases were added to make a comparison. The valve operations’ corresponding connection with the system is reflected in Figure 14. Figure 15 and Figure 16 show, respectively, the pressure processes behind the pump and the dimensionless rotate speed, and velocity changing progresses in the conditions considering valve closing listed as cases 8#, 9#, and 10# in Table 2.
Comparisons among case 8#, case 9#, and case 10# represents two kinds of ways to adjust the operation of the valve, putting off the valve operation time and staging the closing operation. Obviously, putting off the valve closing operation time has a slight influence on pressure control, and a negative effect on controlling the runaway speed. That means the backflow discharge should be controlled by a quick reduction of the valve open ratio before it increases to cause a rapid runaway speed. Though case 10# shows a significant improvement on both runaway speed and pressure control, it magnifies the extreme negative pressure behind the pump at the same time. That is because the rapid close stage I limited the discharge supplement into the negative pressure zone.
Adding pumps moment of inertia, and staging valve closing operation, plenty of more cases are investigated. The remaining other parameters were unchanged, only adjusting the moment of inertia and the time of valve closing in stage I. Ranging moment of inertia from 100,000 to 600,000, and time of valve closing stage I from 60 s to 120 s, the lowest pressure behind the pumps and the maximum runaway speed non-dimensional rotate speed are shown in Figure 17.
As shown, increasing pumps moment of inertia benefits on both aspects. Prolongation of valve closing time can help reduce extreme negative pressure but enlarge runaway speed at the same time. The key region is the period that the flow direction remains forward, which is within about 90 s shown in Figure 9. The best operation is to let the flow go on running to fill the negative pressure zone and close the valve to prevent runaway speed when backflow returns. Staging the time of valve closing is for accessing two aims at the same time. The first is stage I, rapid closing till 20% opening ratio, that is for preventing runaway speed. The other is stage II, slow closing till entirely closed, to avoid another water hammer caused by valve closing.
5. Discussion
Surge tanks, air valves, and pressure vessels are widely used to the control intensity of water hammer. They are usually of good value to improve the system running security. However, the pipeline arrangement of a long-distance water supply system is subject to the geographical conditions. For instance, to cross a river, the pipeline is usually put under the riverbed, or above the water surface like a bridge, and surge tanks are usually limited by the height of the covered thickness above the pipeline. Indeed, the height of the surge tanks can be increased by building a tower upon the land but it leads to much labor and financial cost at the same time. Therefore, reasonable adjustment on devices is a relatively convenient and effective way to control extreme pressure in water hammers. Especially in the projects when the altitude of the pipeline is higher than the pumps. The rising zone of the pump’s outlet pipe cannot be protected by surge tanks or other additional devices. The pressure control ability primarily depends on the characteristics of pumps and the operations of valves. Optimizing the operations processes and adding pumps moment of inertia can also help to control the extreme pressure along the pipeline and protect the pumps from fast runaway speed. The comparison among case 1# to 7# indicates that additional moment of inertia has a positive effect on negative pressure control and there is a most effective quantity of it. Furthermore, comparison among case 1#, and 8# to 10#, show the best cooperation of the valve to control the pump’s runaway speed is staging time and to avoid the forward flow period. The simulated cases in this research are under specific limitations on pipeline design and pump parameters, the conditions of actual water supply engineering may have complex situations on the devices and pipeline design, including faster flow velocity and larger water hammer intensity. Nevertheless, the advantages of the additional moment of inertia remain the same.
To claim the assumptions used in this research, expect for the physical model simplification, the numerical model used for simulation has some assumptions. The first is the basic assumption of MOC, which requires the relationship between meshing grid and pressure wave speed, which is illustrated in Equation (3). The second is the neglect of unsteady friction factor, which actually has little influence on the prediction of extreme pressure value and does not affect the investigation results either. Besides, the flow in the pipe is one-dimensional and the control volume is fixed relative to the pipe. The velocity and pressure are uniform at the cross sections of the pipe, and the fluid density is constant. The pipe walls and fluid are linearly elastic, that is, stress is proportional to strain. And the temperature is assumed to be constant. Increasing the pumps moment of inertia can be easily accessed by adding a flywheel to the pump’s spindles. It makes the response of pumps to accident events slower and slighter, which is normally a helpful change for device protection. It has to be pointed out that the efficiency of improvement will decline as the additional moment increases. For different engineering, there are corresponding valued limits of the additional moment of inertia. In addition, an added moment of inertia requires extra materials, space, and energy consumption. However, it does not need extra power to keep running in steady running conditions. Considering the security improvement on accident events in water supply systems, it is a recommendation to design the pumps with a reasonably high moment of inertia. Though, it has to be clarified that there are still some limitations, the effect of additional pump moment of inertia has just a relieving function for negative pressure when pumps fail. It has little benefit for water hammer control caused by downstream valve rapid closing or other devices operations inside the pipeline. In further research, the investigation on other parameters of pumps and pipeline design will be conducted, such as the complete characteristic curves of the pumps and draft tube design of the pump station.
6. Conclusions
In this study, a 1D numerical model containing a pump station, valves, reservoirs, and pipeline was established. After investigations on the effect of changing the pumps moment of inertia and operations of valves behind the pumps after a power off event, the following conclusions were drawn:
In water supply pipe systems, except for normal pressure control devices, additional pumps moment of inertia can help prevent extreme negative pressure occurring behind the pumps in accident events such as electric power off. Moreover, the extreme pressure curve along the pipeline can also be reduced. Considering the construction cost and the efficiency, there is always an efficient zone of the additional moment of inertia according to different engineering.
The pumps design and optimized valve operations are significant to protect pipe and pump from damage when accident events occur. Through various cases of numerical simulations based on the method of characteristics, it was found that increasing the moment of inertia benefits both negative pressure control after pumps power off and preventing pumps runaway speed. Closing the valve is for protecting the pumps from rapid runaway speed.
Staging the valve closing time can significantly reduce the water hammer caused by valve closing. To limit the negative pressure intensity, the dominant part of valve closing should begin after the period that the pipe flow direction remains forward. As when the flow direction is still forward, the filling water can help reduce the negative pressure caused by pump failure. The best operation is to let the flow go on running to fill the negative pressure zone and close the valve to prevent runaway speed when backflow returns.
Author Contributions
Conceptualization, W.W., and B.Z.; methodology, B.Z.; software, B.Z. and X.C.; validation, B.Z.; formal analysis, B.Z.; investigation, B.Z.; resources, W.W.; data curation, B.Z. and X.C.; writing-original draft preparation, B.Z.; writing-review and editing, W.W.; visualization, W.W.; supervision, W.W.; project administration, W.W.; funding acquisition, W.W.
Funding
This work was supported by the National Key R&D Program of China (2018YFC0407203), the National Natural Science Foundation of China (Nos. 51779216, 51279175) and the Zhejiang Provincial Natural Science Foundation of China (Grant No. LZ16E090001).
Conflicts of Interest
The authors declare no conflict of interest.
Acronyms
| MOC | method of characteristics |
Nomenclature
| Acceleration of gravity (m/s2) | |
| Pressure head (m) | |
| Distance along pipe from the inlet (m) | |
| Time, as subscript to denote time (s) | |
| Flow velocity (m/s) | |
| Instantaneous wall shear stress | |
| The angle between pipe and the horizontal plane. | |
| The quasi-steady component | |
| The unsteady component | |
| Darcy–Weisbach friction factor | |
| Main pipe diameter (m) | |
| Wave speed of water hammer (m/s) | |
| Time step (s) | |
| A defined constant parameter of a pipeline | |
| A defined constant parameter of a pipeline | |
| Serial number of nodes (s) | |
| Discharge (m3/s) | |
| Area of section (m2) | |
| length of element, space interval step (m) | |
| Head of the pump (m) | |
| Discharge through the pump (m3/s) | |
| Torque of the pump (Nm) | |
| Rotate speed of the pump | |
| A defined dimensionless variable representing a pump’s characteristic | |
| A defined dimensionless variable representing a pump’s characteristic | |
| Instantaneous position of pump operation | |
| Rated head of the pump (m) | |
| Rated speed of the pump | |
| Rated discharge of the pump (m3/s) | |
| Rated torque of the pump (Nm) | |
| Constant | |
| The moment of inertia (kgm2) | |
| The weight of rotating parts plus entrained liquid (kg) | |
| The radius of gyration of the rotating mass (m) | |
| The angular velocity in radians | |
| Non-dimensional rotate speed of the pump | |
| Section number | |
| The length of pipeline (m) | |
| Time of the pump powering off (m2) | |
| The maximum hydraulic head (m) | |
| The minimum hydraulic head (m) | |
| The difference of hydraulic head (m) | |
| The number of cases | |
| The whole area surrounded by two extreme pressure curves | |
| Non-dimensional coefficient | |
| The hydraulic head at pump in the second steady condition (m) | |
| The minimum hydraulic head at pump in a transient process (m) | |
| The hydraulic head at pump in the first steady condition (m) |
References
- Kummu, M.; de Moel, H.; Ward, P.J.; Varis, O. How Close Do We Live to Water? A Global Analysis of Population Distance to Freshwater Bodies. PLoS ONE 2011, 6. [Google Scholar] [CrossRef] [PubMed]
- Wylie, E.B.; Streeter, V.L. Fluid Transients; McGraw-Hill International Book Co.: New York, NY, USA, 1978. [Google Scholar]
- Kwan, E.S.K.; Heilman, C.B.; Shucart, W.A.; Klucznik, R.P. Enlargement of basilar artery aneurysms following balloon occlusion—“water-hammer effect” Report of 2 cases. J. Neurosurg. 1991, 75, 963–968. [Google Scholar] [CrossRef] [PubMed]
- Brunone, B.; Karney, B.W.; Mecarelli, M.; Ferrante, M. Velocity profiles and unsteady pipe friction in transient flow. J. Water Resour. Plann. Manag.-Asce 2000, 126, 236–244. [Google Scholar] [CrossRef]
- Bergant, A.; Simpson, A.R.; Tijsseling, A.S. Water hammer with column separation: A historical review. J. Fluids Struct. 2006, 22, 135–171. [Google Scholar] [CrossRef] [Green Version]
- Xu, B.; Chen, D.; Zhang, H.; Wang, F. Modeling and stability analysis of a fractional-order Francis hydro-turbine governing system. Chaos Solitons Fractals 2015, 75, 50–61. [Google Scholar] [CrossRef]
- Fang, H.; Chen, L.; Dlakavu, N.; Shen, Z. Basic Modeling and simulation tool for analysis of hydraulic transients in hydroelectric power plants. IEEE Trans. Energy Convers. 2008, 23, 834–841. [Google Scholar] [CrossRef]
- Wan, W.; Zhang, B. Investigation of Water Hammer Protection in Water Supply Pipeline Systems Using an Intelligent Self-Controlled Surge Tank. Energies 2018, 11, 16. [Google Scholar] [CrossRef]
- Stephenson, D. Effects of air valves and pipework on water hammer pressures. J. Transp. Eng.-ASCE 1997, 123, 101–106. [Google Scholar] [CrossRef]
- Bergant, A.; Kruisbrink, A.; Arregui, F. Dynamic Behaviour of Air Valves in a Large-Scale Pipeline Apparatus. Strojniski Vestn.-J. Mech. Eng. 2012, 58, 225–237. [Google Scholar] [CrossRef]
- Wan, W.; Huang, W.; Li, C. Sensitivity Analysis for the Resistance on the Performance of a Pressure Vessel for Water Hammer Protection. J. Press. Vessel Technol. Trans. Asme 2014, 136. [Google Scholar] [CrossRef]
- Stephenson, D. Simple guide for design of air vessels for water hammer protection of pumping lines. J. Hydraul. Eng. Asce 2002, 128, 792–797. [Google Scholar] [CrossRef]
- De Martino, G.; Fontana, N. Simplified Approach for the Optimal Sizing of Throttled Air Chambers. J. Hydraul. Eng. Asce 2012, 138, 1101–1109. [Google Scholar] [CrossRef]
- Karney, B.W.; Simpson, A.R. In-line check valves for water hammer control. J. Hydraul. Res. 2007, 45, 547–554. [Google Scholar] [CrossRef] [Green Version]
- Tian, W.; Su, G.; Wang, G.; Qiu, S.; Xia, Z. Numerical simulation and optimization on valve-induced water hammer characteristics for parallel pump feedwater system. Annals Nucl. Energy 2008, 35, 2280–2287. [Google Scholar] [CrossRef]
- Bazargan-Lari, M.R.; Kerachian, R.; Afshar, H.; Bashi-Azghadi, S.N. Developing an optimal valve closing rule curve for real-time pressure control in pipes. J. Mech. Sci. Technol. 2013, 27, 215–225. [Google Scholar] [CrossRef]
- Zhou, J.; Xu, Y.; Zheng, Y.; Zhang, Y. Optimization of Guide Vane Closing Schemes of Pumped Storage Hydro Unit Using an Enhanced Multi-Objective Gravitational Search Algorithm. Energies 2017, 10, 911. [Google Scholar] [CrossRef]
- Zhou, D.; Chen, H.; Zhang, L. Investigation of Pumped Storage Hydropower Power-Off Transient Process Using 3D Numerical Simulation Based on SP-VOF Hybrid Model. Energies 2018, 11, 1020. [Google Scholar] [CrossRef]
- Nagode, K.; Skrjanc, I. Modelling and Internal Fuzzy Model Power Control of a Francis Water Turbine. Energies 2014, 7, 874–889. [Google Scholar] [CrossRef] [Green Version]
- Carratelli, E.P.; Viccione, G.; Bovolin, V. Free surface flow impact on a vertical wall: A numerical assessment. Theor. Comput. Fluid Dyn. 2016, 30, 403–414. [Google Scholar] [CrossRef]
- Moghaddas, S.M.J.; Samani, H.M.V.; Haghighi, A. Transient protection optimization of pipelines using air-chamber and air-inlet valves. Ksce J. Civ. Eng. 2017, 21, 1991–1997. [Google Scholar] [CrossRef]
- Kim, H.; Hur, J.; Kim, S. The Optimization of Design Parameters for Surge Relief Valve for Pipeline Systems. In Proceedings of the Applied Mathematics and Computer Science Conference, Rome, Italy, 27–29 January 2017. [Google Scholar]
- Richter, W.; Zenz, G.; Schneider, J.; Knoblauch, H. Surge tanks for high head hydropower plants—Hydraulic layout—New developments/Wasserschlösser für Hochdruck-Wasserkraftanlagen—Hydraulische Auslegung—Neue Entwicklungen. Geomech. Tunn. 2015, 8, 60–73. [Google Scholar] [CrossRef]
- Gabl, R.; Righetti, M. Design criteria for a type of asymmetric orifice in a surge tank using CFD. Eng. Appl. Comp. Fluid Mech. 2018, 12, 397–410. [Google Scholar] [CrossRef]
- Adam, N.J.; De Cesare, G.; Nicolet, C.; Billeter, P.; Angermayr, A.; Valluy, B.; Schleiss, A.J. Design of a Throttled Surge Tank for Refurbishment by Increase of Installed Capacity at a High-Head Power Plant. J. Hydraul. Eng. 2018, 144, 10. [Google Scholar] [CrossRef]
- Li, X.; Zhu, M.; Xie, J. Numerical Simulation of Transient Pressure Control in a Pumped Water Supply System Using an Improved Bypass Pipe. Strojniski Vestn.-J. Mech. Eng. 2016, 62, 614–622. [Google Scholar] [CrossRef]
- Triki, A. Water-Hammer Control in Pressurized-Pipe Flow Using a Branched Polymeric Penstock. J. Pipeline Syst. Eng. Pract. 2017, 8. [Google Scholar] [CrossRef]
- Triki, A. Water-hammer control in pressurized-pipe flow using an in-line polymeric short-section. Acta Mech. 2016, 227, 777–793. [Google Scholar] [CrossRef]
- Zeng, W.; Yang, J.; Hu, J.; Yang, J. Guide-Vane Closing Schemes for Pump-Turbines Based on Transient Characteristics in S-shaped Region. J. Fluids Eng.-Trans. Asme 2016, 138. [Google Scholar] [CrossRef]
- Ballun, J.V. A methodology for predicting check valve slam. J. Am. Water Work Assoc. 2007, 99. [Google Scholar] [CrossRef]
- Hur, J.; Kim, S.; Kim, H. Water hammer analysis that uses the impulse response method for a reservoir-pump pipeline system. J. Mech. Sci. Technol. 2017, 31, 4833–4840. [Google Scholar] [CrossRef]
- Wan, W.; Li, F. Sensitivity Analysis of Operational Time Differences for a Pump-Valve System on a Water Hammer Response. J. Press. Vessel Technol.-Trans. Asme 2016, 138. [Google Scholar] [CrossRef]
- Chaudhry, M.; Hussaini, M. Second-order accurate explicit finite-difference schemes for waterhammer analysis. J. Fluids Eng. 1985, 107, 523–529. [Google Scholar] [CrossRef]
- Kontzialis, K.; Moditis, K.; Paidoussis, M.P. Transient Simulations of the Fluid-Structure Interaction Response of a Partially Confined Pipe Under Axial Flows in Opposite Directions. J. Press. Vessel Technol.-Trans. Asme 2017, 139. [Google Scholar] [CrossRef]
- Kochupillai, J.; Ganesan, N.; Padmanabhan, C. A new finite element formulation based on the velocity of flow for water hammer problems. Int. J. Press. Vessels Pip. 2005, 82, 1–14. [Google Scholar] [CrossRef]
- Wylie, E.B.; Streeter, V.L.; Suo, L. Fluid Transients in Systems; Prentice Hall Englewood Cliffs: Englewood, NJ, USA, 1993. [Google Scholar]
- Meniconi, S.; Duan, H.F.; Brunone, B.; Ghidaoui, M.S.; Lee, P.J.; Ferrante, M. Further Developments in Rapidly Decelerating Turbulent Pipe Flow Modeling. J. Hydraul. Eng. 2014, 140. [Google Scholar] [CrossRef]
- Karney, B.W.; McInnis, D. Efficient calculation of transient flow in simple pipe networks. J. Hydraul. Eng.-Asce 1992, 118, 1014–1030. [Google Scholar] [CrossRef]
- Wan, W.; Huang, W. Investigation on complete characteristics and hydraulic transient of centrifugal pump. J. Mech. Sci. Technol. 2011, 25, 2583–2590. [Google Scholar] [CrossRef]
- Wan, W.; Huang, W. Investigation of Fluid Transients in Centrifugal Pump Integrated System With Multi-Channel Pressure Vessel. J. Press. Vessel Technol.-Trans. Asme 2013, 135. [Google Scholar] [CrossRef]
- Hou, Q.; Zhang, L.; Tijsseling, A.S.; Kruisbrink, A.C.H. Rapid filling of pipelines with the SPH particle method. In Proceedings of the International Conference on Advances in Computational Modeling and Simulation, Kunming, China, 14–16 December 2011. [Google Scholar]
- Wan, W.; Huang, W. Water hammer simulation of a series pipe system using the MacCormack time marching scheme. Acta Mech. 2018, 229, 3143–3160. [Google Scholar] [CrossRef]
Figure 1.
Meshing of the method of characteristics (MOC) in the pipeline.

Figure 2.
Complete characteristic curve of the pumps. [2].
Figure 2.
Complete characteristic curve of the pumps. [2].

Figure 3.
Characteristic lines of a pump.

Figure 4.
The physical model of a simplified case established for simulation.

Figure 5.
Physical analysis of negative pressure occurring in a pump stopping progress.

Figure 6.
Physical model of a pump with an additional flywheel to increase the moment of inertia.

Figure 7.
Pressure processes behind the pump of complete time series under different moment of inertia conditions.
Figure 7.
Pressure processes behind the pump of complete time series under different moment of inertia conditions.

Figure 8.
Detailed comparison of pressure processes behind the pump under different moment of inertia conditions.
Figure 8.
Detailed comparison of pressure processes behind the pump under different moment of inertia conditions.

Figure 9.
Comparisons of dimensionless rotate speed and dimensionless velocity changing progress under different moment of inertia conditions.
Figure 9.
Comparisons of dimensionless rotate speed and dimensionless velocity changing progress under different moment of inertia conditions.

Figure 10.
Comparison of the extreme dynamic head along the pipeline under different moment of inertia conditions.
Figure 10.
Comparison of the extreme dynamic head along the pipeline under different moment of inertia conditions.

Figure 11.
The negative pressure wave delivering process in case 1#.

Figure 12.
Description of the defined quantities and .

Figure 13.
The trend of and changing with increased moment of inertia.

Figure 14.
Parameters of the simulated operating conditions considering valve operations.

Figure 15.
Comparison of pressure processes behind the pump under different valve closing operations.
Figure 15.
Comparison of pressure processes behind the pump under different valve closing operations.

Figure 16.
Comparison of dimensionless rotate speed and dimensionless velocity changing progresses under different valve closing operations.
Figure 16.
Comparison of dimensionless rotate speed and dimensionless velocity changing progresses under different valve closing operations.

Figure 17.
Comparisons of pressure processes behind the pump and dimensionless rotate speed under different additional moment of inertia when combining different valve closing operations.
Figure 17.
Comparisons of pressure processes behind the pump and dimensionless rotate speed under different additional moment of inertia when combining different valve closing operations.


Table 1.
Parameters of the simulated pipeline.
| Pumps | Pipeline | ||||||
|---|---|---|---|---|---|---|---|
| (m) | QR (m3/s) | (r/min) | (N · m) | (km) | (m) | (m/s) | (m2) |
| 35.57 | 8.60 | 375 | 84,583 | 40 | 5 | 1000 | 19.6 |
Table 2.
Parameters of the simulated conditions.
| Cases | (kg · m2) | Valve Closing | ||||
|---|---|---|---|---|---|---|
| # ( = 1,2,…,7) | · 105 | / | / | / | / | / |
| 8# | 105 | 1000 | 600 s | 100% | 0 s | 0% |
| 9# | 105 | 1100 | 600 s | 100% | 0 s | 0% |
| 10# | 105 | 1000 | 60 s | 80% | 540 s | 20% |
© 2018 by the authors. Licensee MDPI, Basel, Switzerland. This article is an open access article distributed under the terms and conditions of the Creative Commons Attribution (CC BY) license (http://creativecommons.org/licenses/by/4.0/).
Share and Cite
MDPI and ACS Style
Wan, W.; Zhang, B.; Chen, X. Investigation on Water Hammer Control of Centrifugal Pumps in Water Supply Pipeline Systems. Energies 2019, 12, 108. https://doi.org/10.3390/en12010108
AMA Style
Wan W, Zhang B, Chen X. Investigation on Water Hammer Control of Centrifugal Pumps in Water Supply Pipeline Systems. Energies. 2019; 12(1):108. https://doi.org/10.3390/en12010108
Chicago/Turabian StyleWan, Wuyi, Boran Zhang, and Xiaoyi Chen. 2019. "Investigation on Water Hammer Control of Centrifugal Pumps in Water Supply Pipeline Systems" Energies 12, no. 1: 108. https://doi.org/10.3390/en12010108
Note that from the first issue of 2016, this journal uses article numbers instead of page numbers. See further details here.