A New Consideration for Validating Battery Performance at Low Ambient Temperatures


Energy Innovation Centre (EIC), WMG, University of Warwick, Coventry CV4 7AL, UK
*
Author to whom correspondence should be addressed.
Energies 2018, 11(9), 2439; https://doi.org/10.3390/en11092439
Submission received: 30 July 2018
/
Revised: 5 September 2018
/
Accepted: 12 September 2018
/
Published: 14 September 2018
Abstract
:Existing validation methods for equivalent circuit models (ECMs) do not capture the effects of operating lithium-ion cells over legislative drive cycles at low ambient temperatures. Unrealistic validation of an ECM may often lead to reduced accuracy in electric vehicle range estimation. In this study, current and power are used to illustrate the different approaches for validating ECMs when operating at low ambient temperatures (−15 °C to 25 °C). It was found that employing a current-based approach leads to under-testing of the performance of lithium-ion cells for various legislative drive cycles (NEDC; FTP75; US06; WLTP-3) compared to the actual vehicle. In terms of energy demands, this can be as much as ~21% for more aggressive drive cycles but even ~15% for more conservative drive cycles. In terms of peak power demands, this can range from ~27% for more conservative drive cycles to ~35% for more aggressive drive cycles. The research findings reported in this paper suggest that it is better to use a power-based approach (with dynamic voltage) rather than a current-based approach (with fixed voltage) to characterise and model the performance of lithium-ion cells for automotive applications, especially at low ambient temperatures. This evidence should help rationalize the approaches in a model-based design process leading to potential improvements in real-world applications for lithium-ion cells.
1. Introduction
Reduced driving range and battery performance at low ambient temperatures are a key market adoption barrier for battery electric vehicles (BEVs) [1]. This limitation is primarily attributed to increased energy and power demands from on-board battery pack at low ambient temperatures [2,3]. This is further exacerbated by reduced accuracy in driving range estimation, which often contribute to an increased range anxiety amongst BEV users at such ambient temperatures [4,5]. The accuracy of the Equivalent Circuit Model (ECM) in the on-board battery management system (BMS) is therefore of paramount importance for accurate driving range estimation [4,5].
The State of Charge (SOC) and cell voltage estimated by the ECM are used to calculate the remaining driving range [6,7]. An inaccurate estimation of SOC and/or cell voltage by ECM will lead to misleading estimates for the remaining driving range [8,9]. To ensure that ECM correctly estimates SOC and cell voltage in the real-world; parameterisation and validation data used to develop the ECM should also reflect the real-world driving scenarios [8,9,10].
The dependence of ECM parameters on SOC, current, temperature has been widely considered in literature [11,12,13], as well as the dependence of Open Circuit Voltage (OCV) versus SOC relationship on voltage hysteresis and ambient temperature [14,15]. These published research findings have shown that model accuracy increases with increasing model complexity (for example, higher number of RC networks), which can often imply higher costs in implementation and uncertainties [8,16,17,18]. Furthermore, the accuracy in output voltage estimation was found to reduce as the ambient temperature reduces [10]. In terms of legislative drive cycle analysis, ECM validation is often primarily limited to NEDC [10]. Even then, the lowest ambient temperature range at which an ECM is validated varies between 5 °C to 10 °C, but real-world winter ambient temperatures can be as low as −20 °C [10,16,18]. Although there are some ECMs that have been validated at ambient temperatures around −20 °C; the drive cycles considered in these reports cannot be generalised [19,20].
The existing validation methods for an ECM often represent idealised driving scenarios without accounting for real-world behaviour [16,17]. This is because to obtain validation data for an ECM, lithium-ion cells are conventionally characterised using a current-based approach (with a fixed voltage) [21,22,23]. For example, Keil et al. employed a nominal voltage of 3.6 V while scaling down the US06 drive cycle to test commercial 18,650 lithium-ion cells [24]. However, the actual cell voltage keeps changing (between 4.2 and 3 V) as the cell is cycled over a US06 drive cycle. This means that while the current demanded by the duty cycle is met by the cell, the power demand is not met as power depends not just on current, but also on cell voltage and in turn SOC and internal cell resistances to get the required voltage drop [25]. Furthermore, at low ambient temperatures, current-based approach fails to account for the dynamic nature of cell voltage in two ways: (a) Owing to greater internal cell resistances, lower operating voltages will be the norm for a legislative drive cycle. But, by employing fixed reference voltage, low operating voltages are not covered. (b) The transient nature of realistic drive cycles such as the US06 coupled with the more prominent dependence of internal cell resistances on operating current and voltage, will cause the transient nature of cell voltage to become more prominent. But, by employing fixed reference voltage, the inherently transient nature of voltage is ignored. On the other hand, a power-based approach takes into account the above considerations implicitly without making any assumptions for a particular drive cycle or ambient temperature. The use of fixed voltage is prevalent in literature for a number of different types of investigations. To validate SOC and State of Health (SOH) estimation algorithms, Andre et al. employed current profiles for the FTP72 legislative drive cycle at 25 °C ambient temperature in order to simulate real-world driving scenarios [26]. Analogous to SOC, State-of-Energy (SOE) measures remaining energy (in Watt-hours) [4]. Recently, researchers have argued that SOE may be a more direct indicator of the driving range because it takes into account the energy wasted to self-heating within a battery/cell [8,27].
To validate a SOE estimation algorithm, Wang et al. employed the current profile for the dynamic stress test (DST) at 25 °C ambient temperature to simulate typical working conditions [8]. Similarly, Hosseinzadeh et al. employed current profiles for the Worldwide harmonized Light vehicles Testing Procedure Class 3 (WLTP-3) to validate their electro-thermal model between 5 and 45 °C ambient temperature range [21].
There is limited understanding with regards to the distinction between capacity (in Ampere-hours) and energy (in Watt-hours). For example, Jaguemont et al. employed discharged energy to measure lithium-ion cell performance at low ambient temperatures whereas Li et al. used discharged capacity to investigate the same [28,29]. However, in their development and validation of a model for an HEV battery pack, Jaguemont et al. employed a current-based approach and validated their model against an arbitrary current profile (with fixed nominal voltage) [19].
In their research, Barai et al. argue that discharged energy considers cell voltage evolution with changing operating temperature and hence accounts for heat losses to self-heating [30]. They reported that while the discharged capacity increased with C-rate, discharged energy decreased with C-rate at 25 °C ambient temperature. Grandjean et al. recommended that at low ambient temperatures, it is better to discharged cells at a higher C-rate to extract a greater capacity [31]. However, it may be the case that at lower ambient temperatures, due to higher self-heating, a greater fraction of cell capacity discharged is wasted instead of actually delivering energy at the wheels [32,33].
The systematic use of power profiles for various legislative drive cycles for ECM validation is absent in literature. There is no investigation quantifying the impact of using power profiles instead of current profiles on state functions such as SOC and SOE. There is no investigation how the power profiles will affect ECM accuracy for various model orders, particularly at lower ambient temperatures. The differences in considering energy (Wh) instead of capacity (Ah) have not been quantified at cell level.
In this study, the authors compare current and power approaches for validating ECMs operating at low ambient temperatures. To obtain the current profile for the current-based approach, the power profile for a single cell was divided by the fixed nominal voltage (3.7 V) at each time step. These current values are only correct for a fixed voltage of 3.7 V and are not indicative of the actual current flowing through the cell to meet the power demands of a legislative drive cycle. For the power-based approach, the power profile for the power-based approach is the power demand calculated for a single cell [18]. In this case, the cell cycler modifies the current drawn from the cell based on the instantaneous cell voltage to meet the power demand at each time step.
The legislative drive cycles investigated in the paper are: NEDC, the FTP75, the US06 and WLTP (Class 3). The legislative drive cycles chosen as part of this manuscript were chosen based on the following considerations: (a) New European Driving Cycle (NEDC) was chosen as it is a modal drive cycle part of the EU standards and is commonly used by researchers to compare cell performance and to validate equivalent circuit models; (b) Federal Test Procedure (FTP75) was chosen as it is a transient drive cycle part of the EPA standards and includes a cold-start phase which means that the vehicle is started at the ambient temperature which may be the case in cold weather conditions; (c) The US06 Supplemental Federal Test Procedure (US06) was chosen as it is representative of aggressive high speed and high acceleration driving behaviour. The US06 has one of the highest power demand to energy demand ratios amongst legislative drive cycles; (d) Worldwide harmonized Light vehicles Test Procedure Class 3 (WLTP-3) was chosen as it is a proposed global standard for quantifying the urban range of light weight electric vehicle. These four legislative drive cycles are representative of European Union (NEDC), American (FTP75, US06) and Global (WLTP-3) standards and thus cover a vast majority of real-world driving scenarios.
The low ambient temperature range chosen was between −15 °C to 25 °C. The lower limit of −20 °C ambient temperature was chosen as it is representative of harsh winter conditions [19,34,35]. The upper limit of 25 °C ambient temperature is chosen as it is the minimum validation temperature where ECM performance is compared in the literature [10]. The starting SOC for each experiment was chosen as 65% SOC based on the OCV-SOC relationship collected. Experimental comparison is made on the basis of the relative capacity/energy values and relative peak current/power values. The modelling comparison is made on the basis of accuracy in output voltage estimation, change in SOC and estimated rise in operating temperature.
The manuscript is structured as follows: in Section 2, the experimental and modelling methodology used as part of this study is detailed. In Section 3, the effect of using both current-based and power-based approaches on lithium-ion cell characterization and equivalent circuit modelling is reported. The paper continues with a discussion of the impact in Section 4, and finishes with conclusions in Section 5.
2. Materials and Methods
2.1. Pouch Cells
Commercially available 40 Ah lithium-ion pouch cells with Nickel-Manganese-Cobalt (NMC) cathode and graphite anode were used in this study (see Table 1). The size, shape and chemistry of the cell was chosen based on similar cells used in passenger BEVs (e.g., a Nissan Leaf).
2.2. Legislative Drive Cycle Analysis
Four legislative drive cycles are investigated: NEDC, the FTP75, the US06 and WLTP (Class 3). Using a backward facing model, the legislative speed versus time profile was converted to a vehicle level power versus time profile [18,36]. The conversion was carried out for a typical passenger BEV with a gross vehicle weight of 1945 kg (curb weight is approximately 1600 kg [18,36,37]). Other parameters were: Coefficient of Drag, CD = 0.28, Density of Air, ρ = 1.225 kg/m3, Frontal Area of Vehicle, A = 2.744 m2, Gravitational Acceleration, g = 9.81 m/s2, Friction Coefficient, [36,37]. The gear-box ratio (G) was 7.94. The motor efficiency was assumed to be 0.7 at ambient temperatures [18], and 100% regenerative-braking efficiency (RE).
Since the study is focused at low ambient temperatures, a 5 kW load for cabin-heating was added at every time step [38]. It was assumed that the vehicle battery pack consisted of 48 modules and each module consisted of four cells arranged in a 2P2S architecture [18]. The nominal voltage of a single cell was 3.7 V, and nominal voltage of the battery pack was 355.2 V. The power demand per second of a single cell was calculated. The energy available from the battery pack at the nominal pack voltage was 28.4 kWh, comparable to a real BEV [39].
2.3. Equivalent Circuit Model Validation
To compare between current-based and power-based validation of ECM operating at low ambient temperatures, a 2nd order ECM with one-state hysteresis was developed using MATLAB 2017b (Simulink, The MathWorks, Natick, MA, USA). This model was developed due to agreement in literature that it is a compromise between increasing model accuracy and increasing model complexity [16,40]. The SOC for the ECM was updated based on the operating temperature and the input current by employing a 2D-lookup table. The Resistor-Capacitor (RC) parameters depended on SOC, operating temperature and magnitude/direction of input current (via 3D-lookup table) and were obtained using a least-squares curve-fitting technique from pulse power characterization data for 10 s charge/discharge pulses (Table 2).
The operating temperature was calculated using the cell surface temperature and a 1st order thermal model. The surface temperature of the cell was measured by attaching a single k-type thermocouple to the geometric centre of one surface of the pouch cell [33]. The OCV-SOC relationship was obtained at 25 °C ambient temperature from the method described in [41] using stepped 1C charge/discharge at intervals of 4% rated capacity. To estimate the SOC, the nominal capacity values were obtained from constant current continuous discharge duty cycles at different ambient temperatures and discharge C-rates. The ambient temperatures were those shown in Table 2 and the constant current continuous discharge C-rates consisted of 0.1C, 0.2C, 0.5C, 1C, 2C, 5C and 8C.
2.4. Battery Testing Equipment and Analysis
All experiments discussed in this paper were conducted in a Weiss Gallenkamp Votsch (VC 3 4060) thermal chamber (Konigswinter, Germany) (Figure 1). The lithium-ion cells were cycled using a Bitrode (MCV 16-100-5) cell-cycler and the relevant cycling software (VisuaLCN) was employed. The data was analysed using MATLAB 2017b.
3. Results
3.1. Experimental Results
Based on the power-based approach described in Section 2.2, the cell level energy and power demands of various legislative drive cycles were calculated (Table 3). The US06 was the most aggressive of the four legislative drive cycles considered as part of this study (Table 3). This is evidenced by the energy required per km at the cell level (1.81 Wh/km), the RMS power demand (212.92 W) and the peak power demand (801.97 W).
The NEDC has the lowest power demands of the four legislative drive cycles under consideration (Table 3). This is evidenced by the RMS power demand (83.71 W) and the peak power demand (337.04 W). The energy and power demands of a particular legislative drive cycle will be the same irrespective of the ambient temperature. Thus, in the rest of this paper, the energy and power demands for the various legislative drive cycles reported in Table 3 are taken as the 100% baseline to show the deficits in a current-based approach at low ambient temperatures. For example, for the US06, the energy demanded is 1.81 Wh irrespective of operating conditions (Table 3). This is the 100% baseline energy demand for the US06.
Based on the current-based approach described in Section 2.2, the cell level capacity and current demands of various legislative drive cycles were calculated (Table 4).
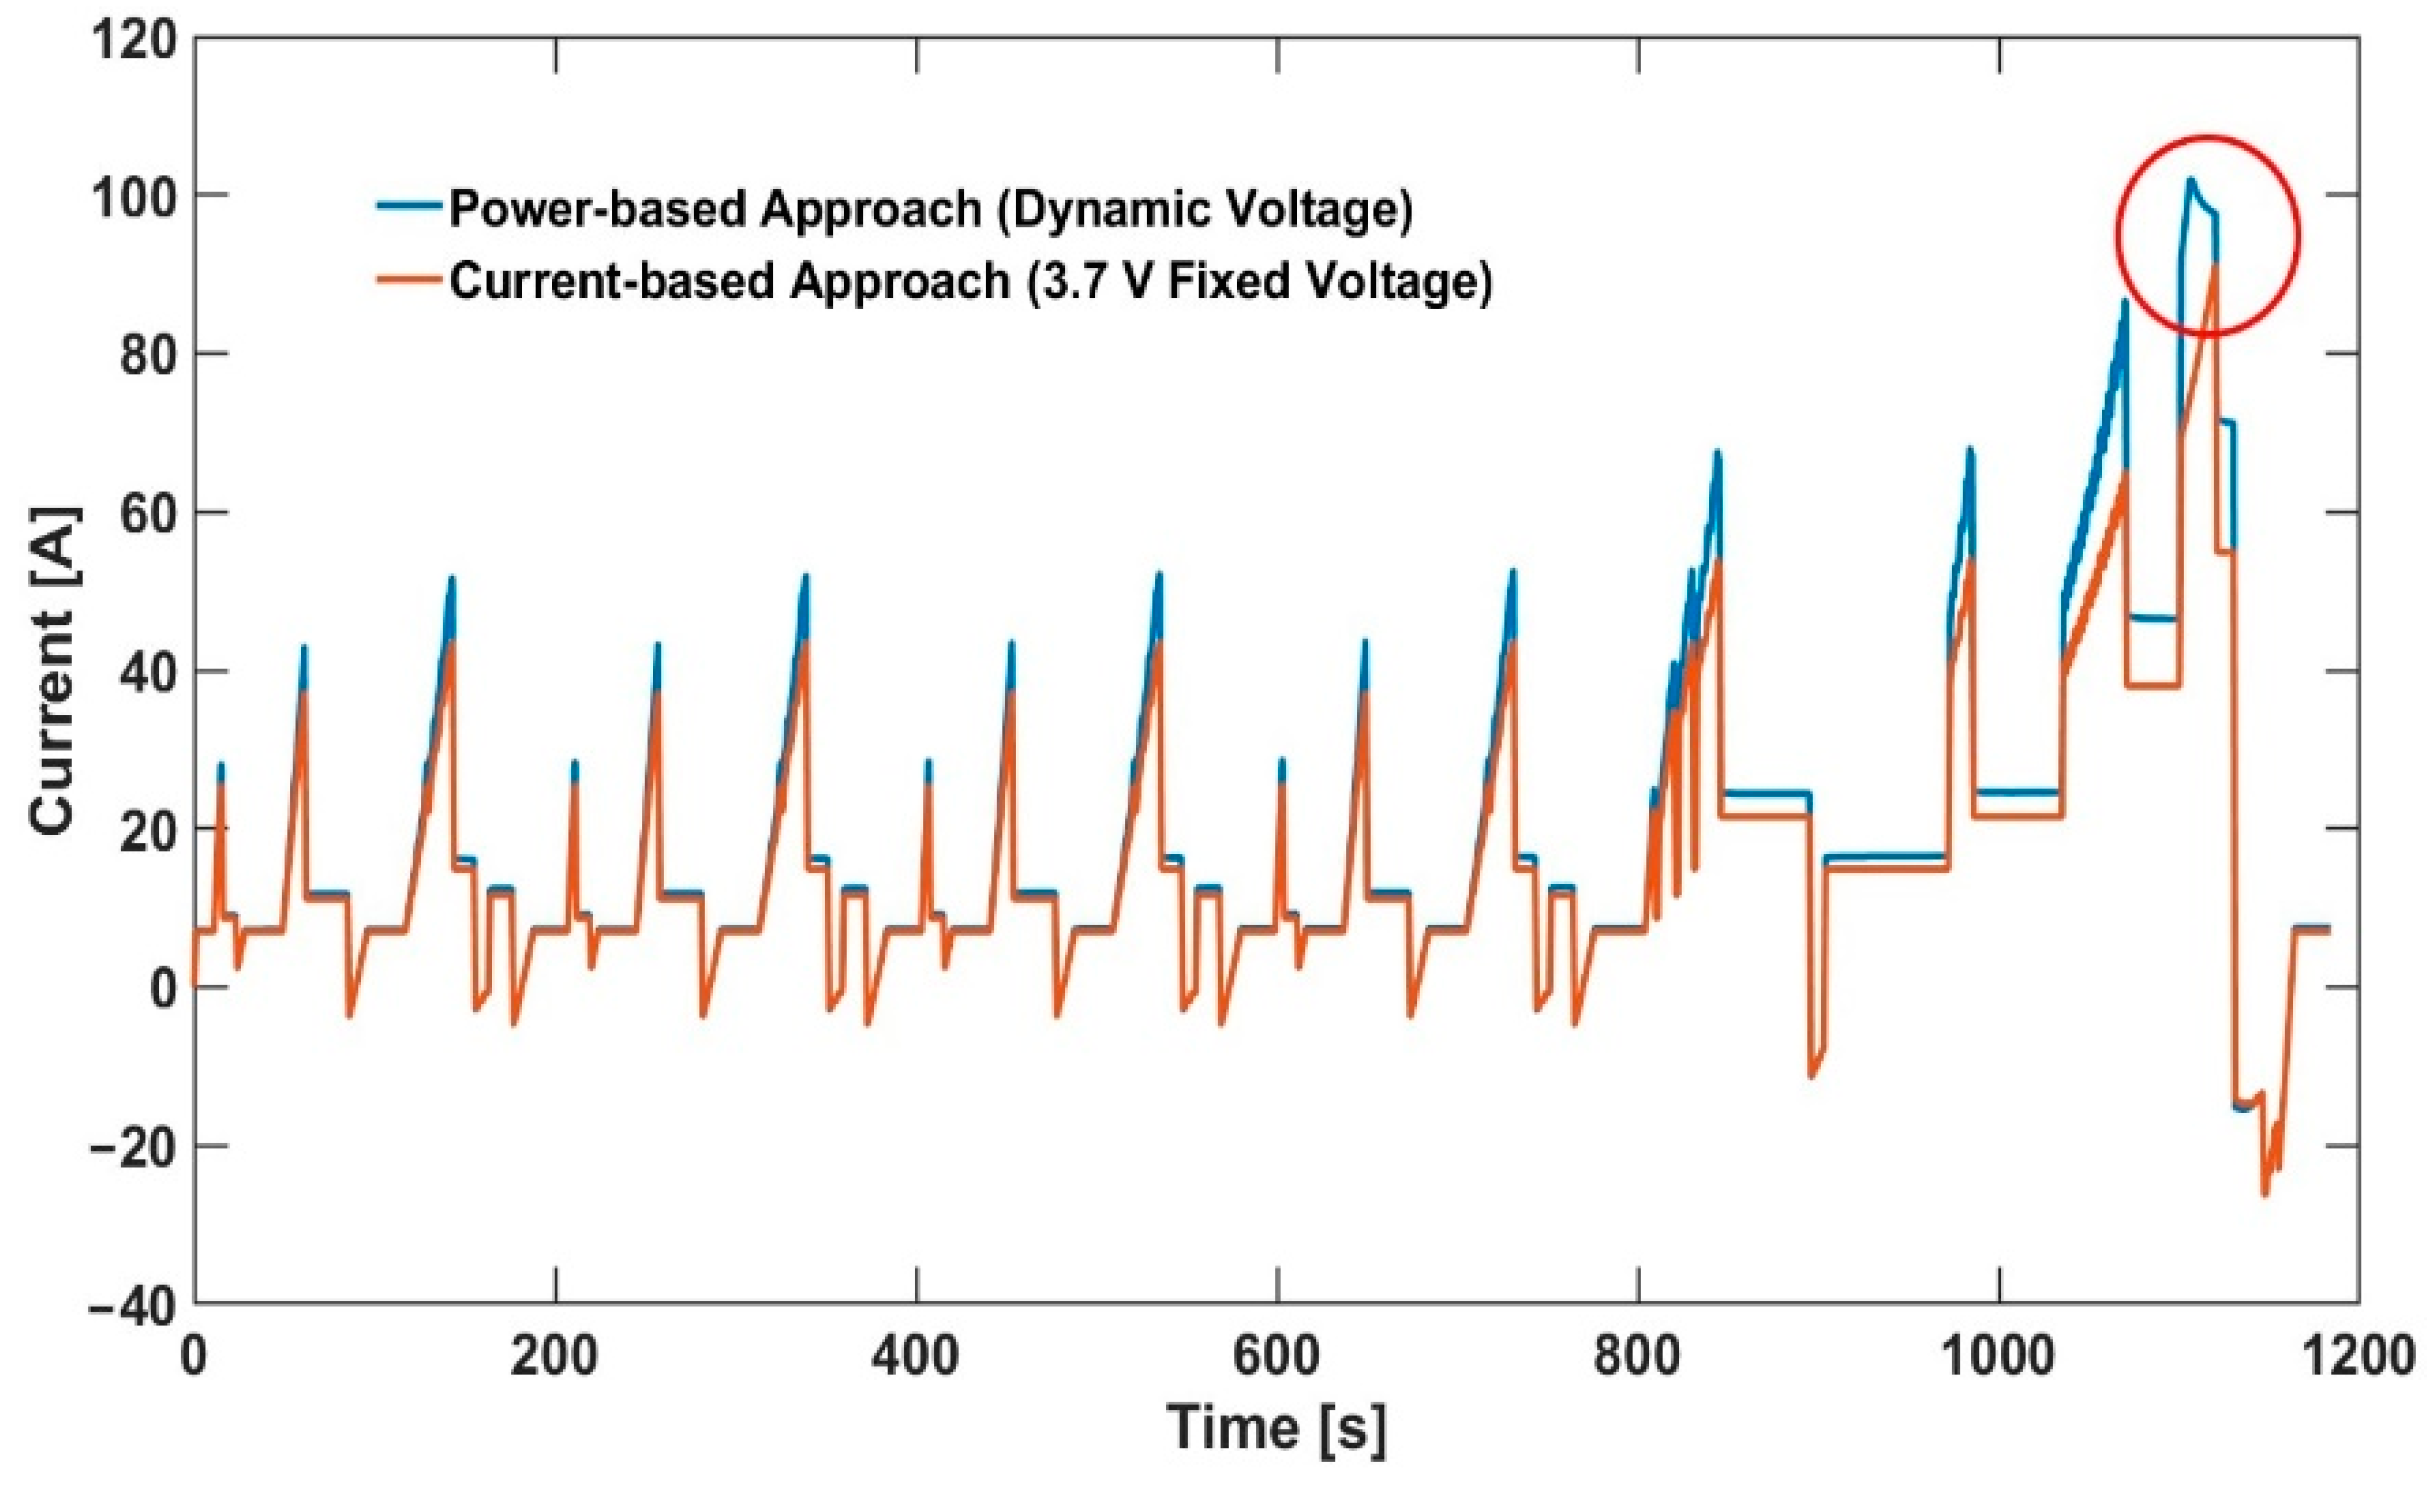
The current and capacity demands of the various legislative drive cycles are tacitly assumed to reflect power and energy demands of the legislative drive cycles, however, that is only true at the nominal voltage of 3.7 V. An illustrative example of the differences between the two approaches for NEDC at 65% starting SOC and −15 °C ambient temperature is given in Figure 2. While the RMS power for the power-based approach is 83.71 W, the corresponding value for the current-based approach is 71.15 W. This implies that energy demanded will also be higher for the power-based approach. While the total energy demanded by the NEDC at the cell level is 19.00 Wh for power-based approach, the total energy demanded for current-based approach is only 16.20 Wh; a reduction by 14.82%. While the peak power demanded for power-based approach is 337.04 W, the corresponding value for current-based approach is 261.13 W; a deficit by 22.52%.
In Figure 3, it can be seen that the discrepancy for the current-based approach (compared to the power-based approach) in peak power delivered was higher than the discrepancy in energy delivered as ambient temperature reduces.
For example, for US06, while the relative energy delivered reduces from 97.25% to 78.31% as ambient temperature decreases from 25 °C to −15 °C, the relative peak power reduces from 93.03% to 64.50% (Figure 3c). For a particular legislative drive cycle, the relative energy and power demands for which a cell should be tested for is given relative to the ambient temperature (the ‘green’ line in Figure 3).
In the rest of this section, the results for cells cycling under power-based approach will be compared against the current-based approach. An illustrative example for NEDC at 65% starting SOC is given in Figure 4. The current demanded for the power-based approach generally tends to be higher than the current demanded for the current-based approach at −15 °C ambient temperature. This implies that capacity used for the power-based approach (5.95 Ah) will also be higher than the capacity used for the current-based approach (5.14 Ah); which see an increase by 15.76%. In Figure 4, during power-based approach, the current demands of the NEDC are not met by the cells (circled). This is due to cells reaching cut-off voltage (2.7 V) during that time.
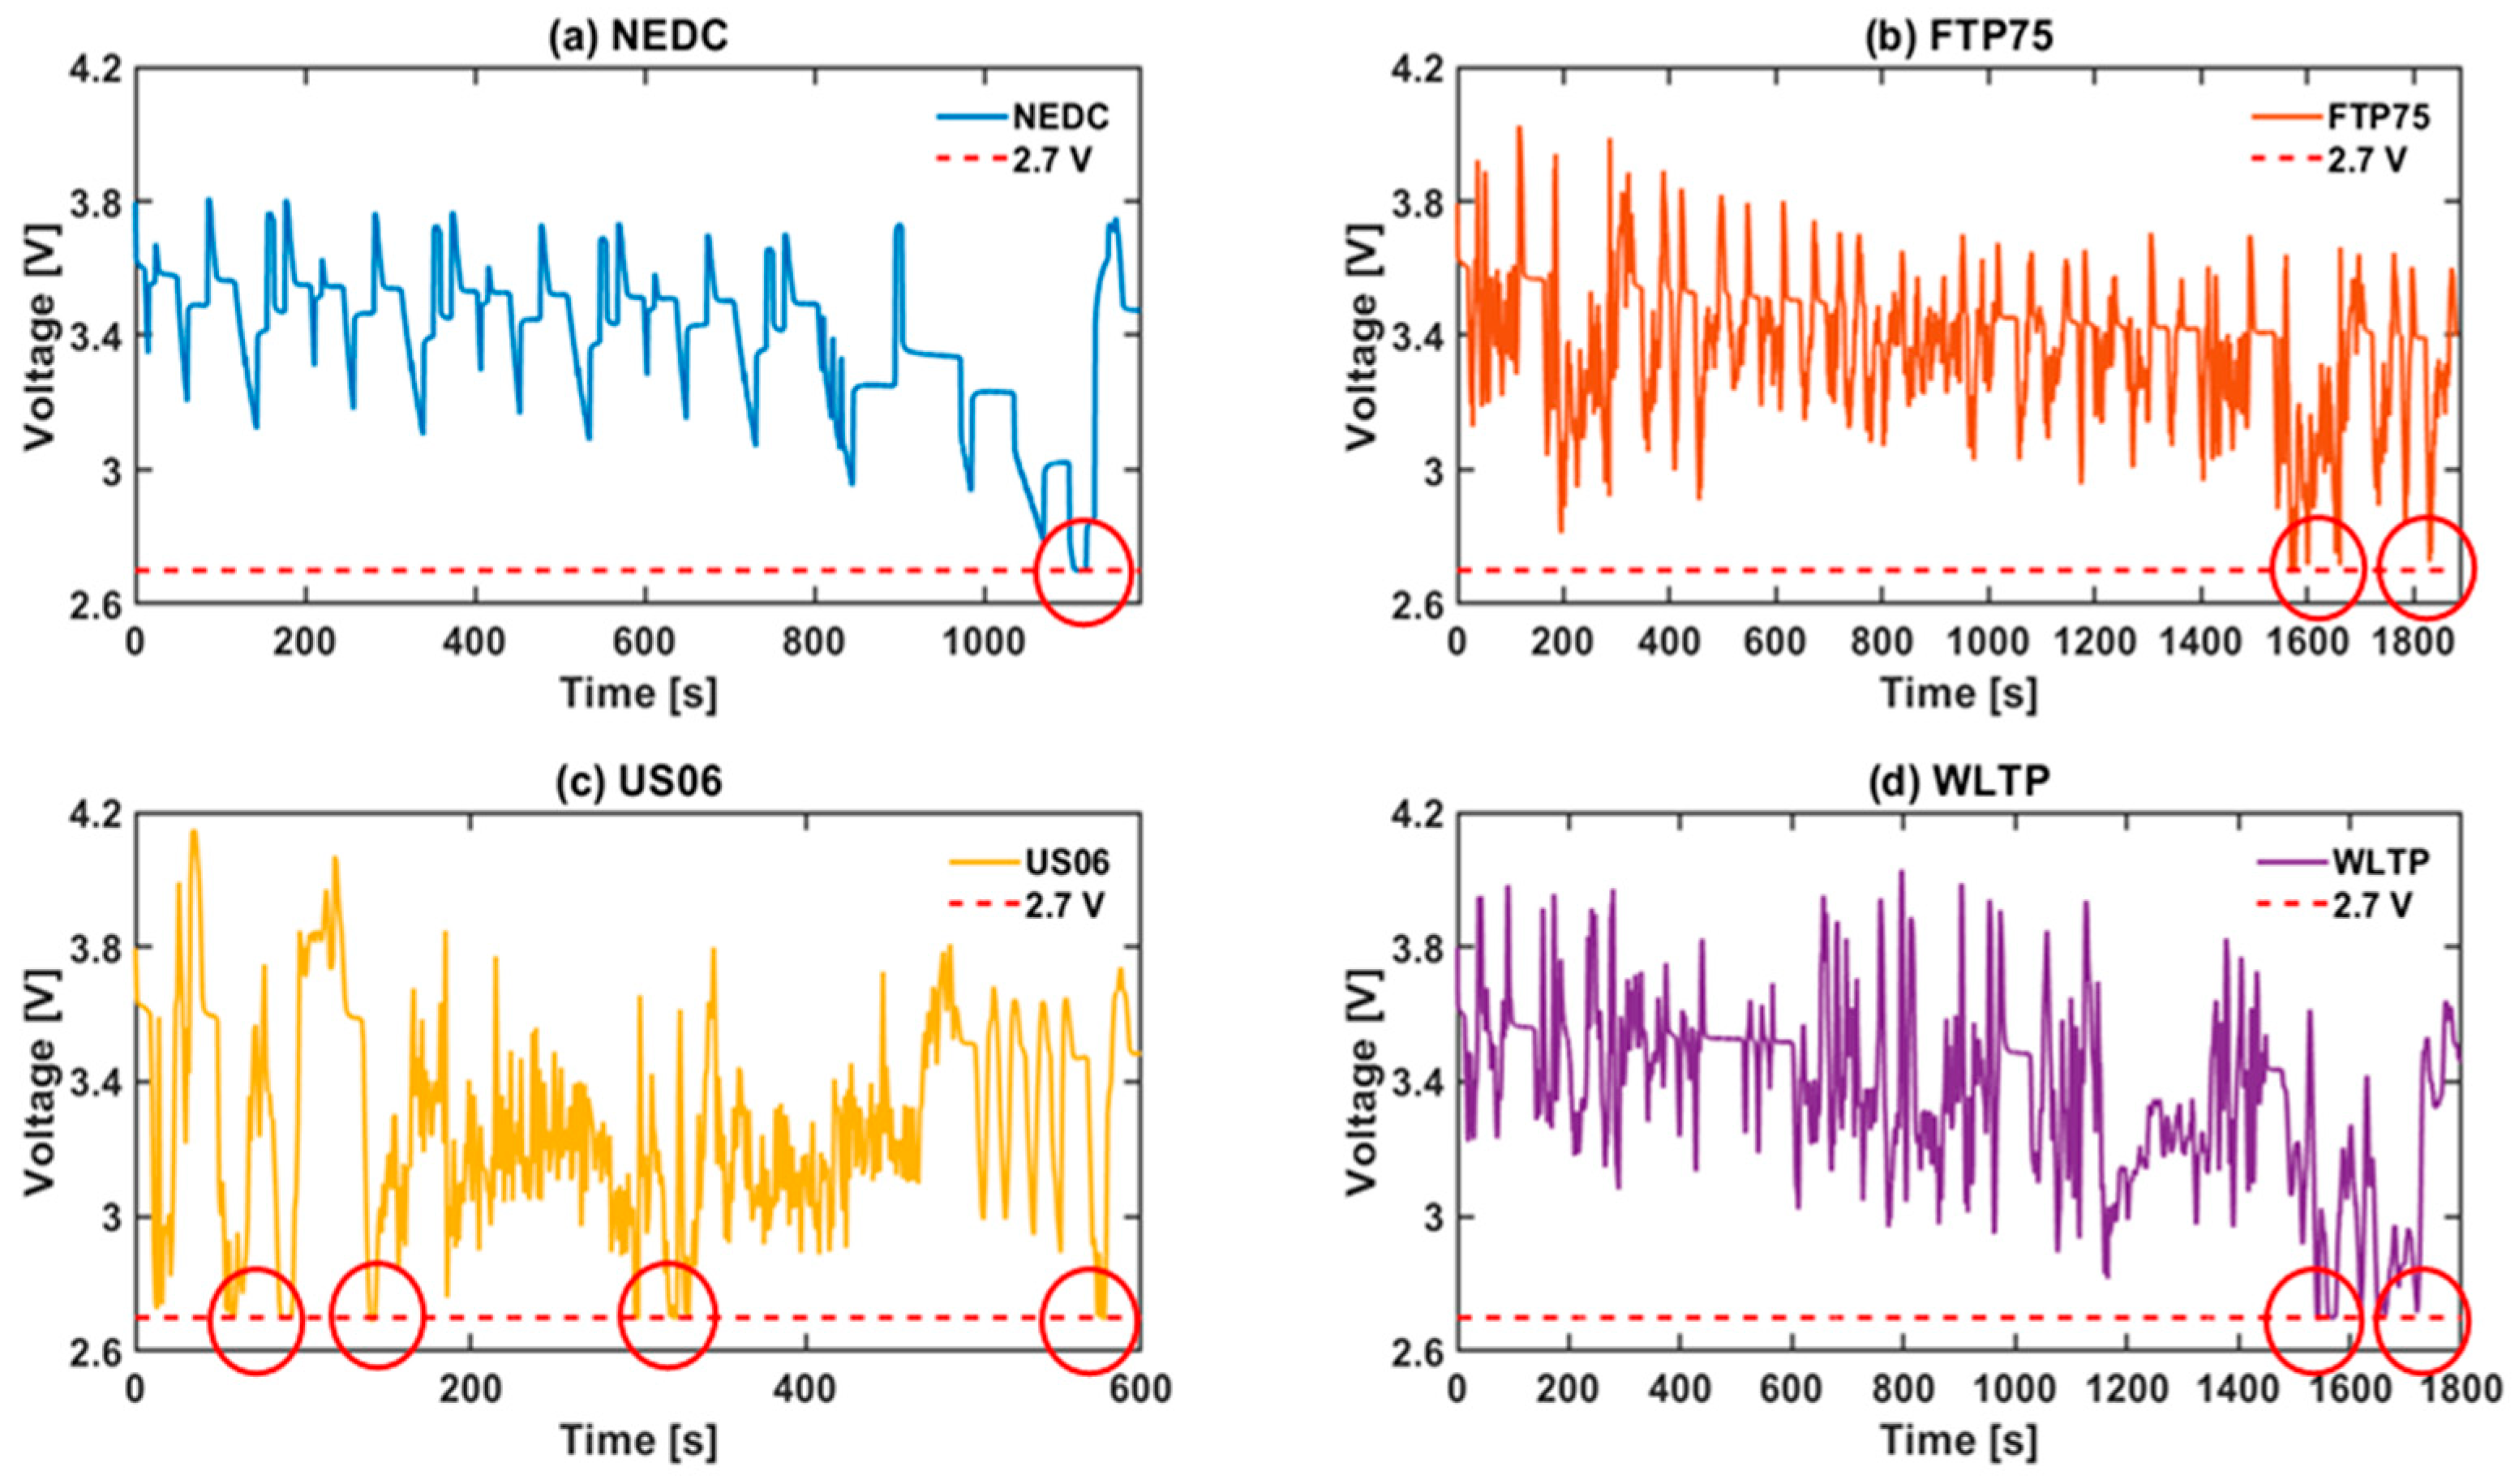
Depending on cell voltage and instantaneous current, the cells reached cut-off voltage at different points for each drive cycle. Using the power-based approach at −15 °C ambient temperature and 65% starting SOC (Figure 5).
However, due to lower power and current demands for current-based approach; no such observation was made for any of the drive cycles at −15 °C ambient temperature and 65% starting SOC. That is, the cells would all be considered to meet with the drive cycle demands in current-based approach.
In Figure 6, it can be seen that employing a power-based approach affects the peak current demands of the cell more than the cell’s capacity. This is evidenced by the fact that none of the cells were able to meet the instantaneous current (and hence, power) demands of the cells at −15 °C ambient temperature (Figure 5). To ensure that the energy requirements of a drive cycle are tested in a power-based approach, it is desirable to ‘over-test’ the cell in terms of capacity requirements (Figure 6).
On the other hand, to ensure that the instantaneous power demands are met in a power-based approach, it is important to consider that higher currents will flow through the cell than what may have been considered in a current-based approach. Higher operating currents will lead to greater self-heating and hence, higher temperature rise. For example, for the power-based US06 at −5 °C ambient temperature (Figure 6c), 135% of peak current demands and 115% of capacity demands compared to the current-based approach have to be considered for equivalence of testing. As ambient temperature reduces (in other words, current demand increases), the internal cell resistances will increase which consequently results in an over-potential increase and cell voltage decreases at a faster rate. This leads to a reduced power delivered and hence, reduced energy as ambient temperature reduces. This is despite ensuring consistency in current and hence, capacity delivery.
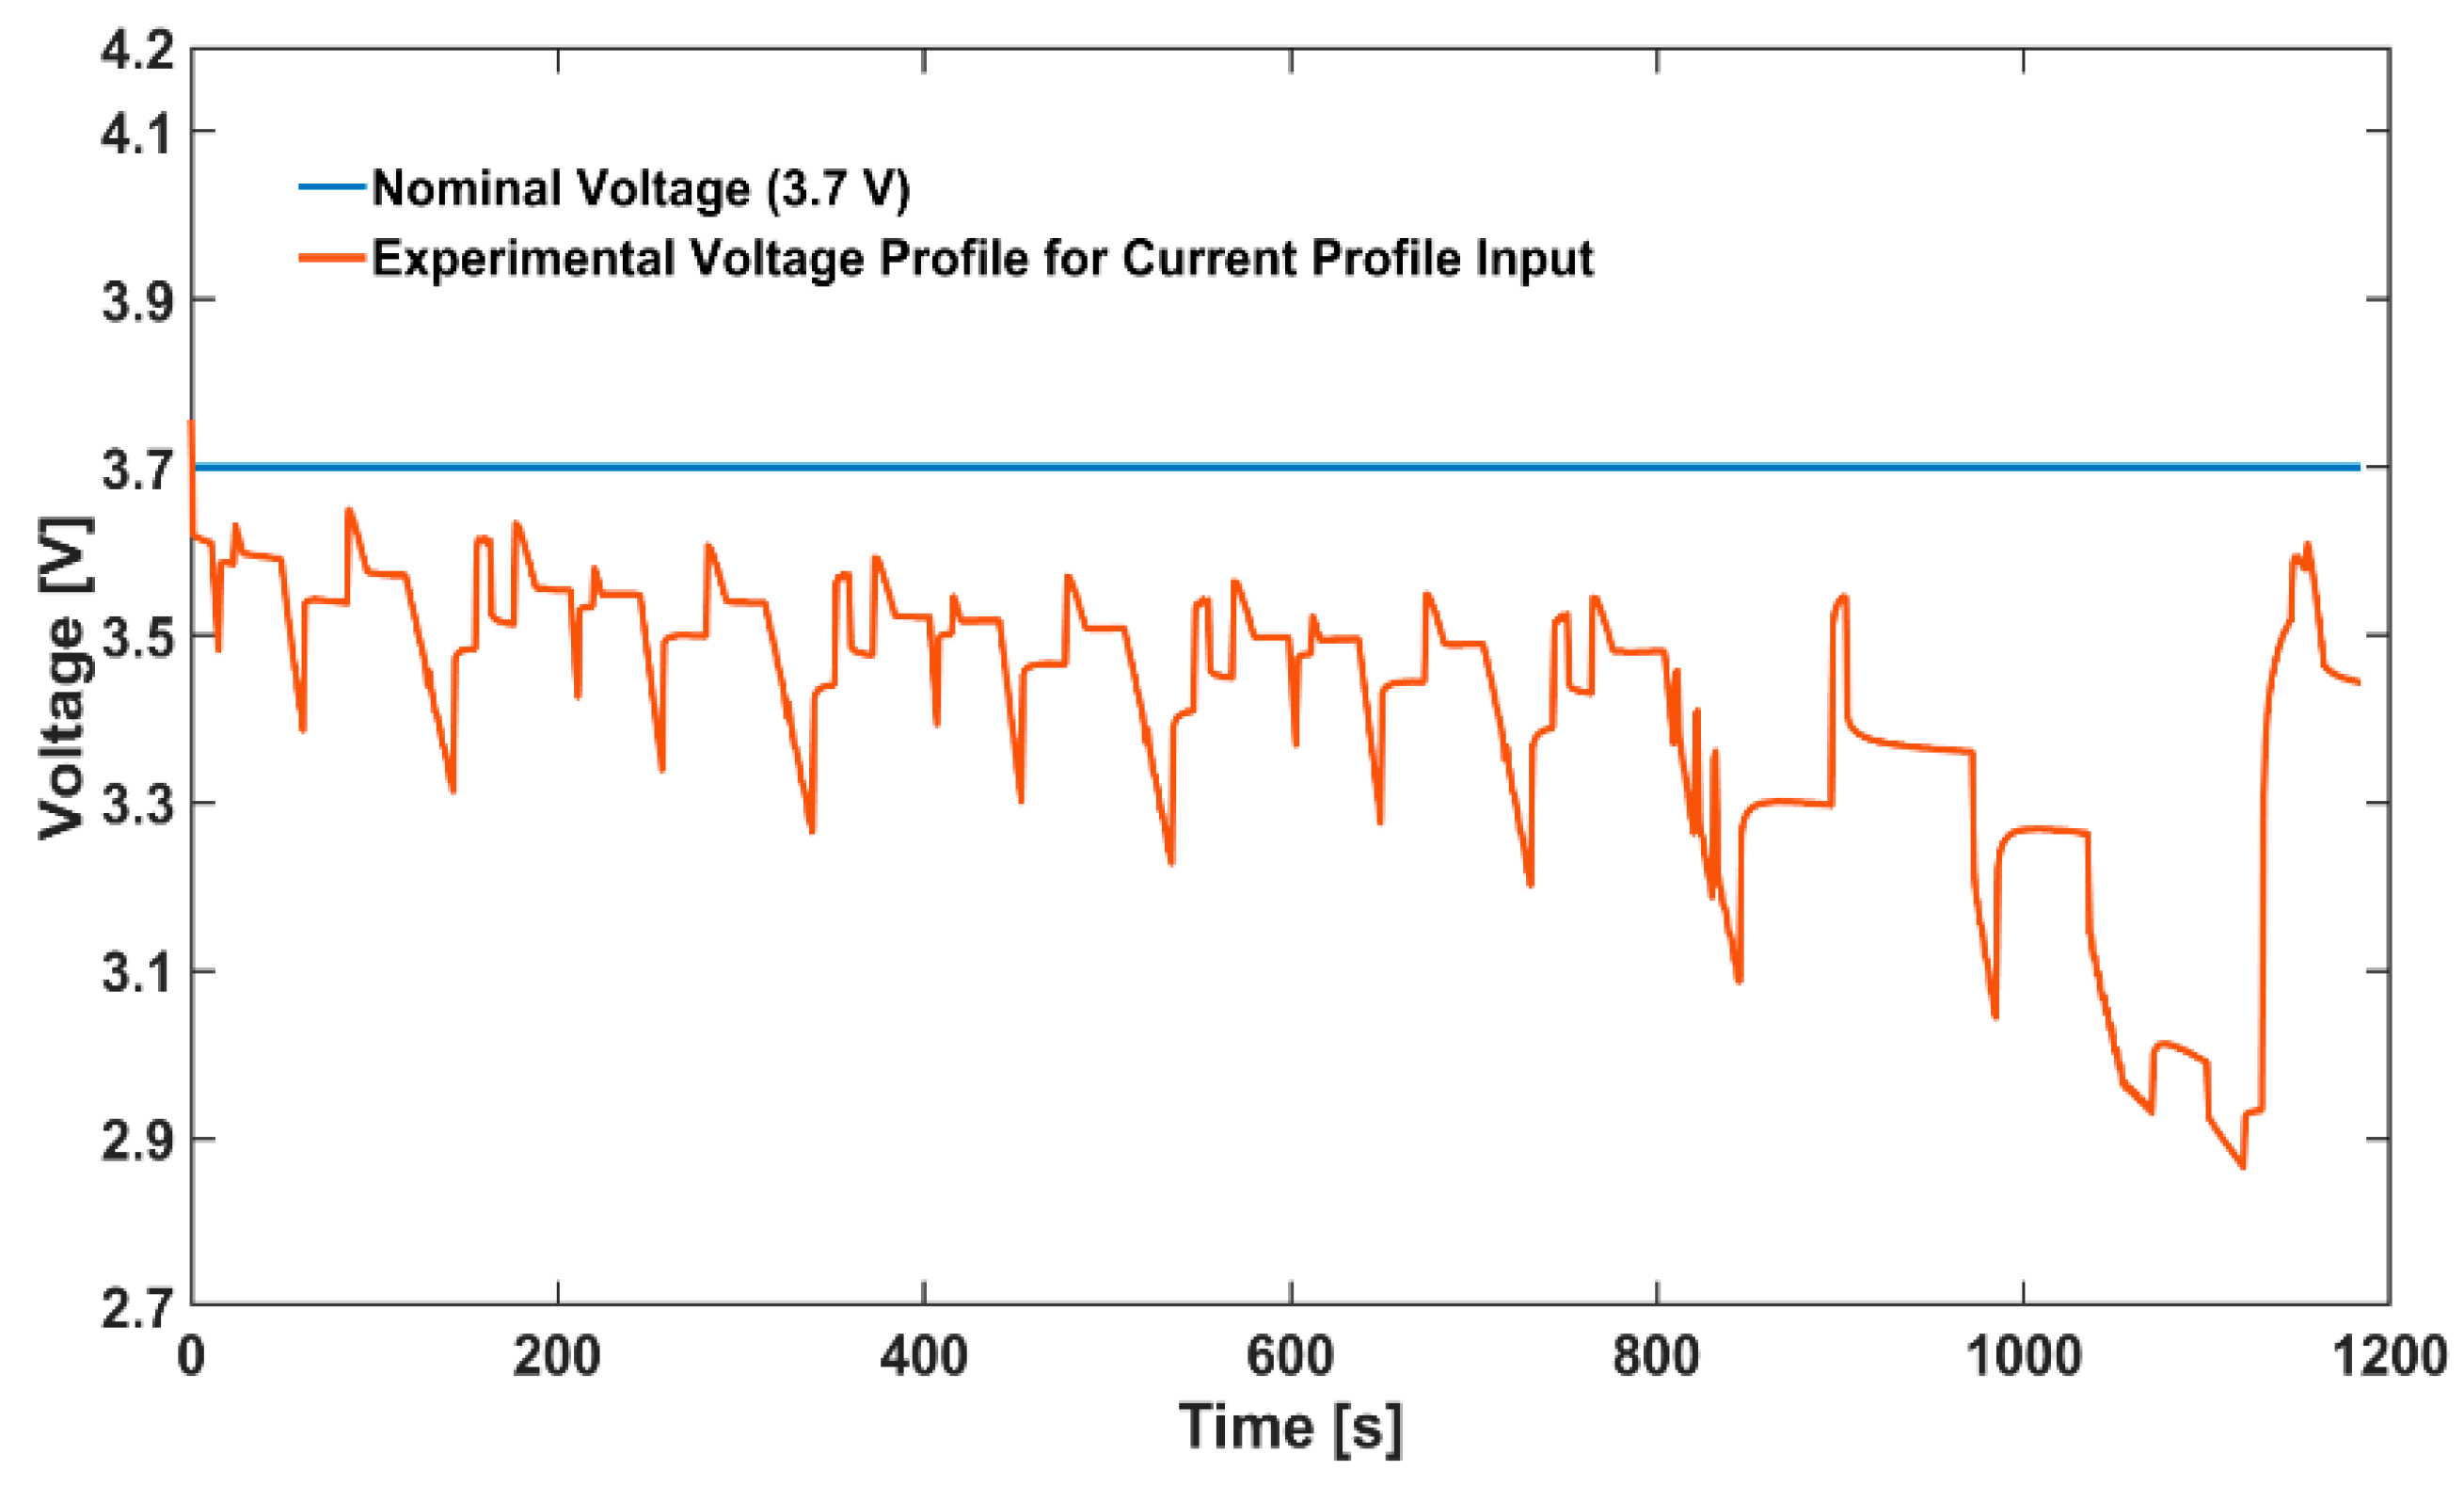
Employing a 3.7 V fixed voltage throughout a duty cycle is unrealistic as it fails to account not just for the lower operating cell voltages but also for the deviation from mean cell voltage. An illustrative example for the current-based NEDC at 65% starting SOC and −15 °C ambient temperature is given in Figure 7. While the nominal reference voltage is 3.7 V, the mean cell voltage for the profile is 3.42 V and the standard deviation from that mean cell voltage (σ) is 0.17 V.
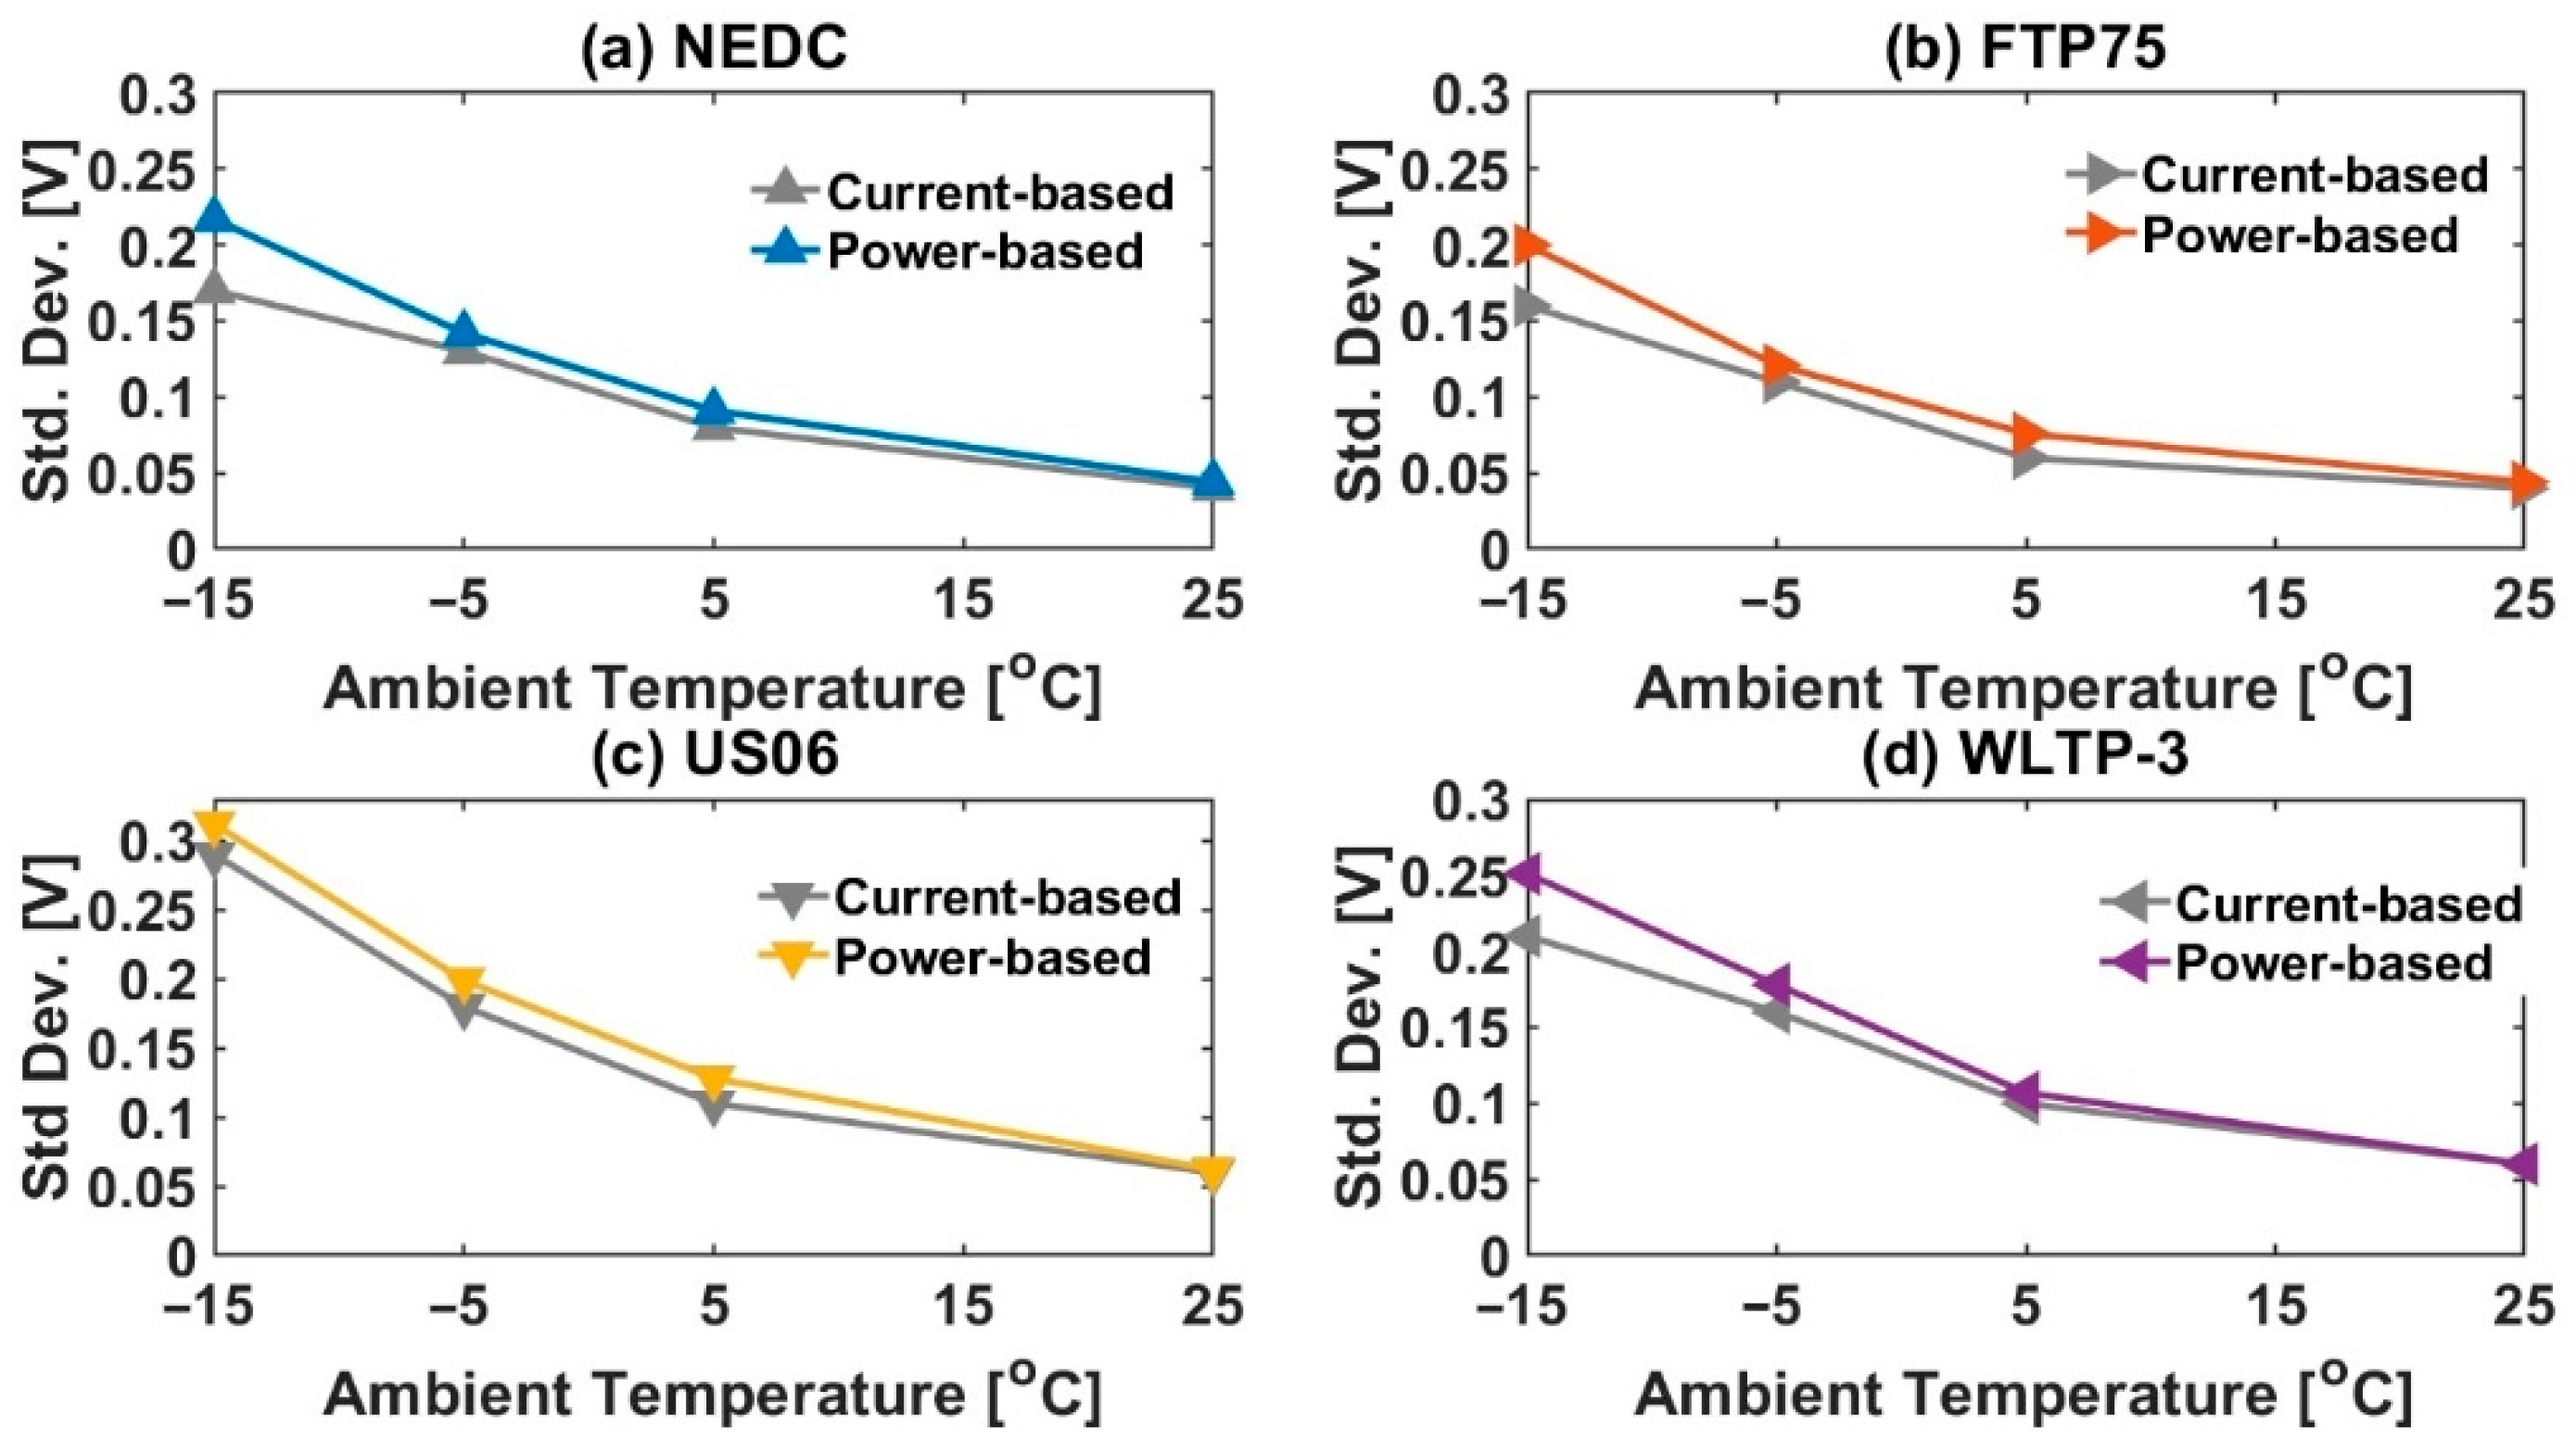
In Figure 8, the standard deviation from mean cell voltage (σ) for power-based approaches are compared to the corresponding values for the current-based approach at different ambient temperatures and legislative drive cycles. It can be seen that σ increases as ambient temperature decreases for a particular legislative drive cycle. For example, for the FTP75 as ambient temperature reduces from 25 to −15 °C, σ increases from 0.04 V to 0.20 V (Figure 8b). Further, σ recorded a higher value for the more aggressive drive cycle. While for NEDC, σ increases from 0.04 V to 0.22 V; but the corresponding rise for US06 is from 0.06 V to 0.31 V (Figure 8a,c).
The σ for power-based approach is higher than σ for current-based approach. For example, for WLTP at −15 °C ambient temperature, while σ for the current-based approach is 0.21 V and power-based approach is 0.25 V (Figure 8d). This implies that voltage profile for the power-based approach is more transient than for the current-based approach. Due to dynamically changing cell voltages, the true energy and power demands of various legislative drive cycles are not captured in a current-based approach in cell testing, which in turn implies that the cells may not considered to meet the drive cycle demands in the current-based approach. This further affirms the argument that using a profile with a fixed reference voltage (3.7 V in the current-based approach) is misleading for low ambient temperature characterisation for lithium-ion cells; particularly for legislative drive cycles with high current/power demands.
3.2. Modelling Results
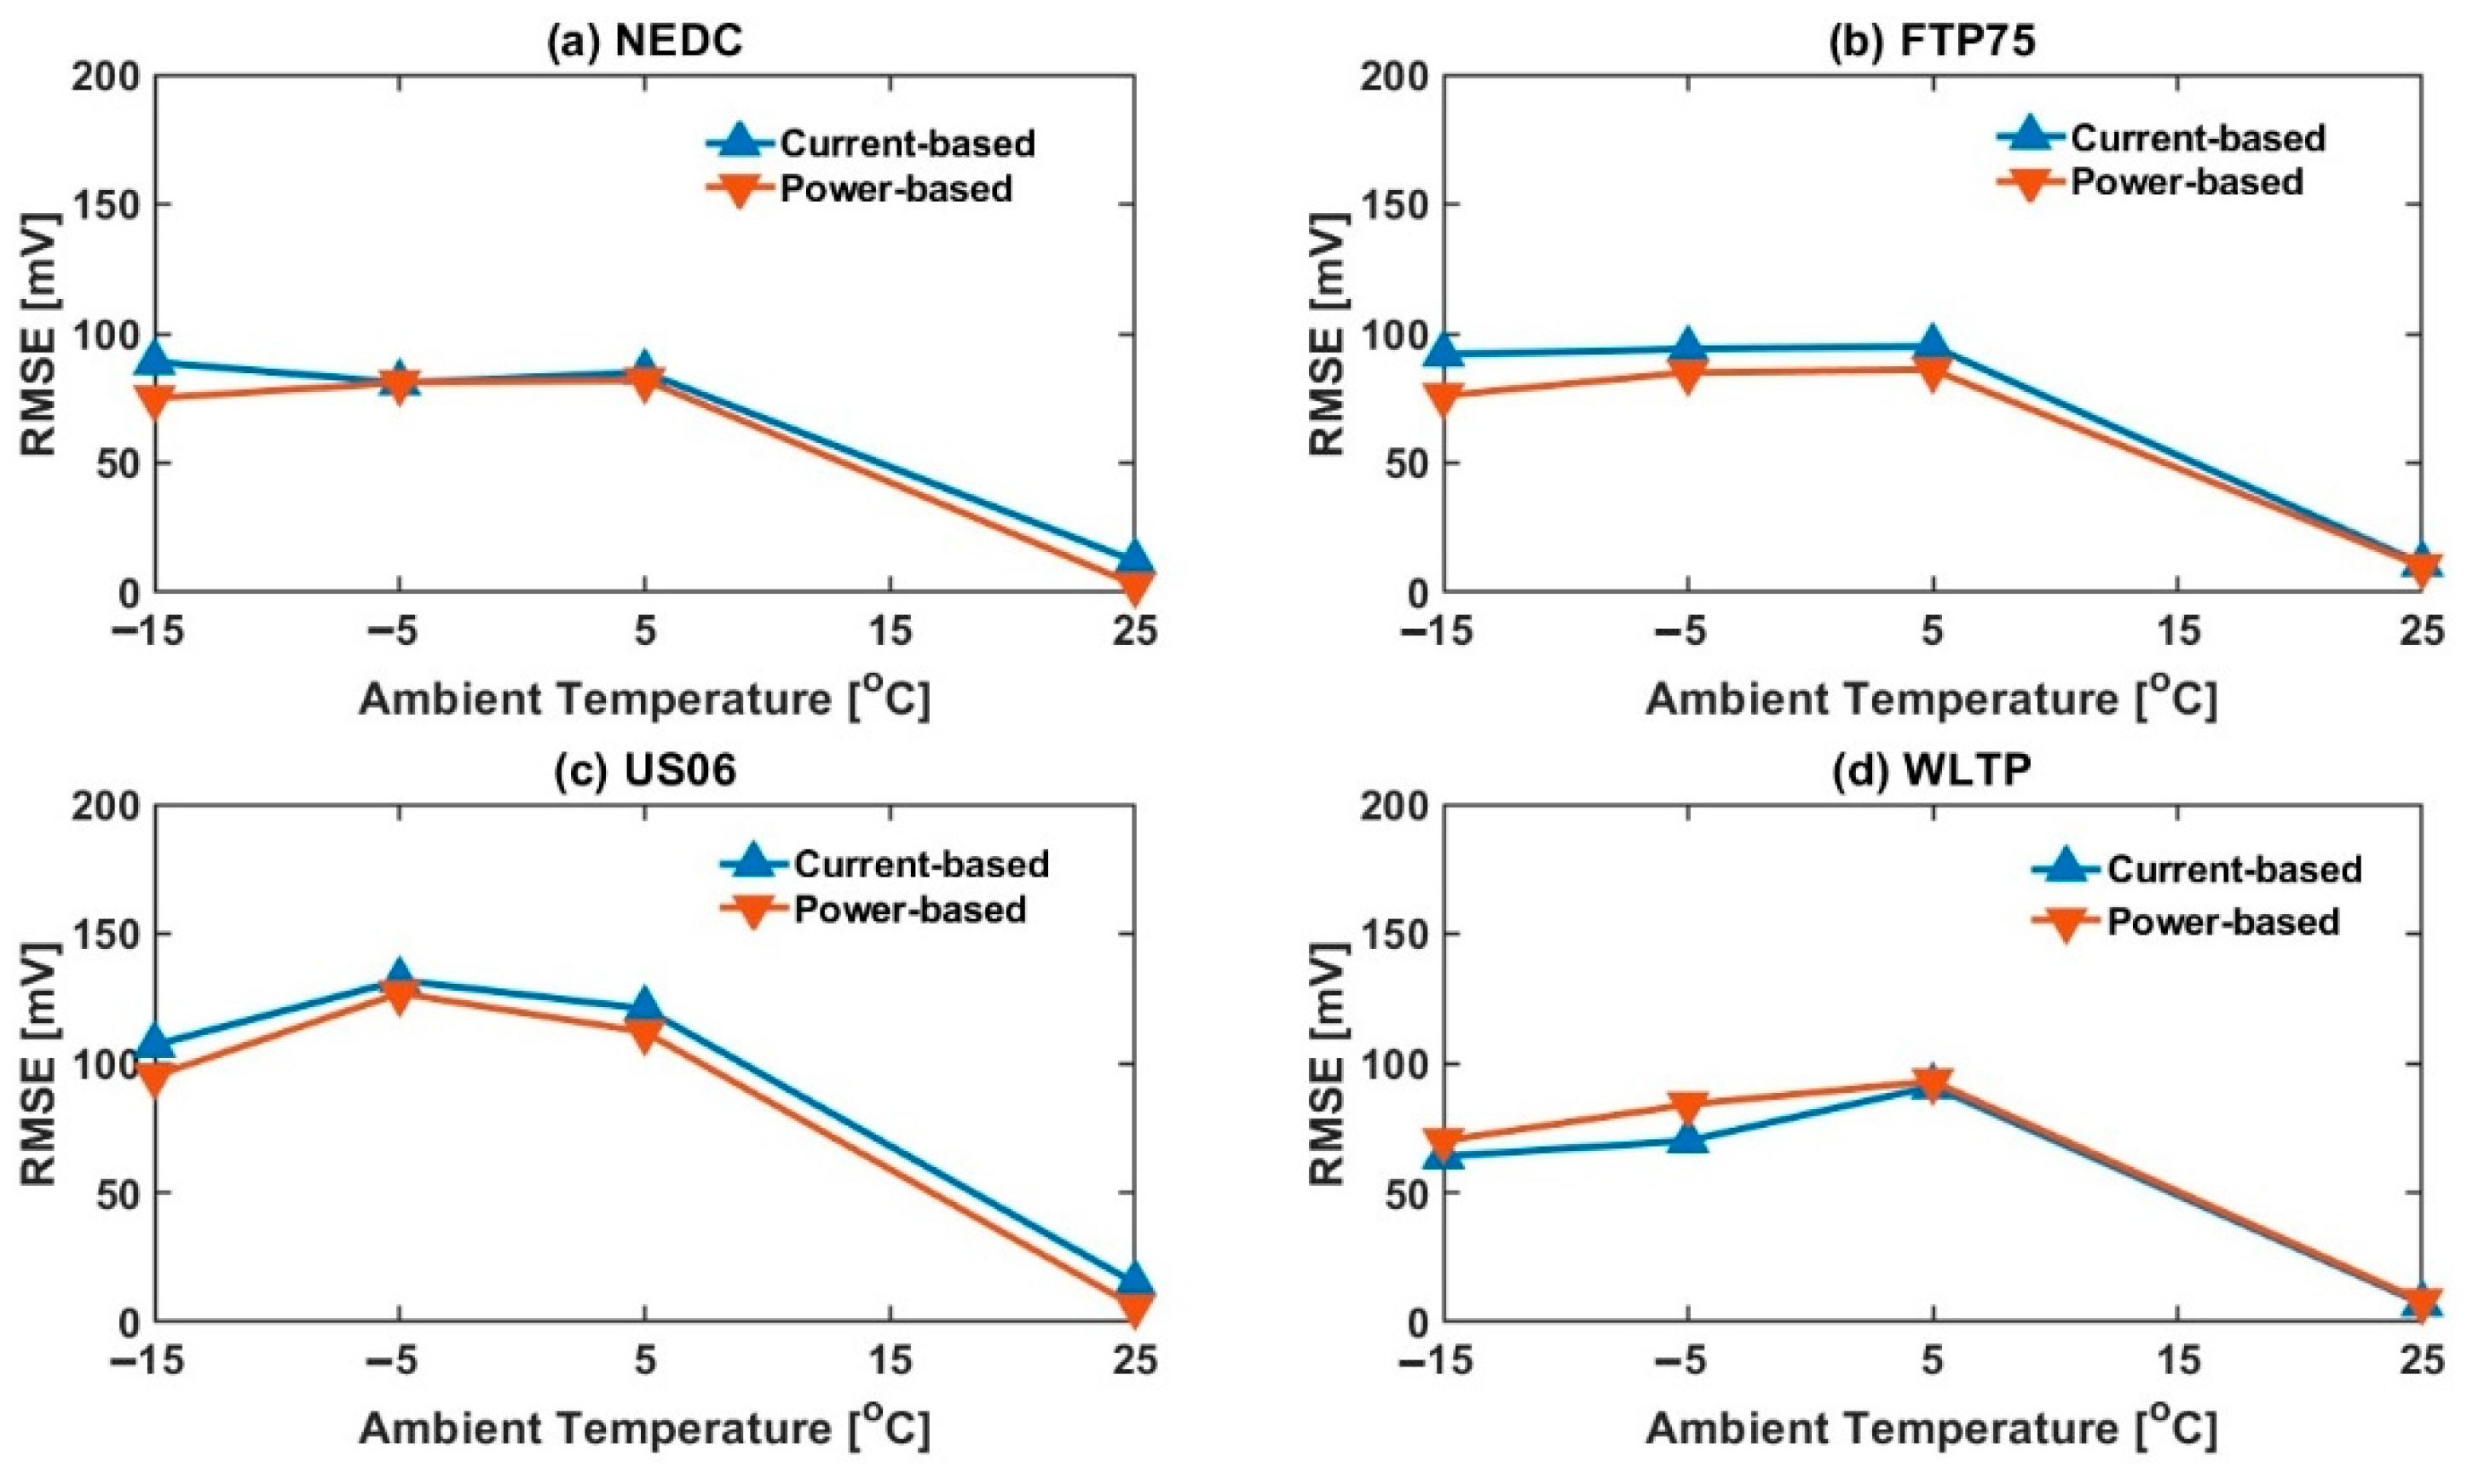
In Figure 9, the output voltage profile estimated by the 2nd order ECM is compared against the experimental voltage profiles for the current-based legislative drive cycles at 25 °C ambient temperature and 65% starting SOC. The normalized root-mean-squared-error (RMSE) in output voltage estimation averaged across the four legislative drive cycles was 11.8 mV, which is comparable with typical errors reported in the previous published reports [10,16].
As ambient temperature decreases, the ECM accuracy in output voltage estimation decreases for all the legislative drive cycles (Figure 10). The 2nd order ECM (‘2RC’), depending upon the legislative drive cycle, showed the lowest accuracy in output voltage estimation at −5 °C (US06) and 5 °C (NEDC, FTP75 and WLTP-3) ambient temperatures (Figure 10). This was seen for both current-based and power-based validation profiles.
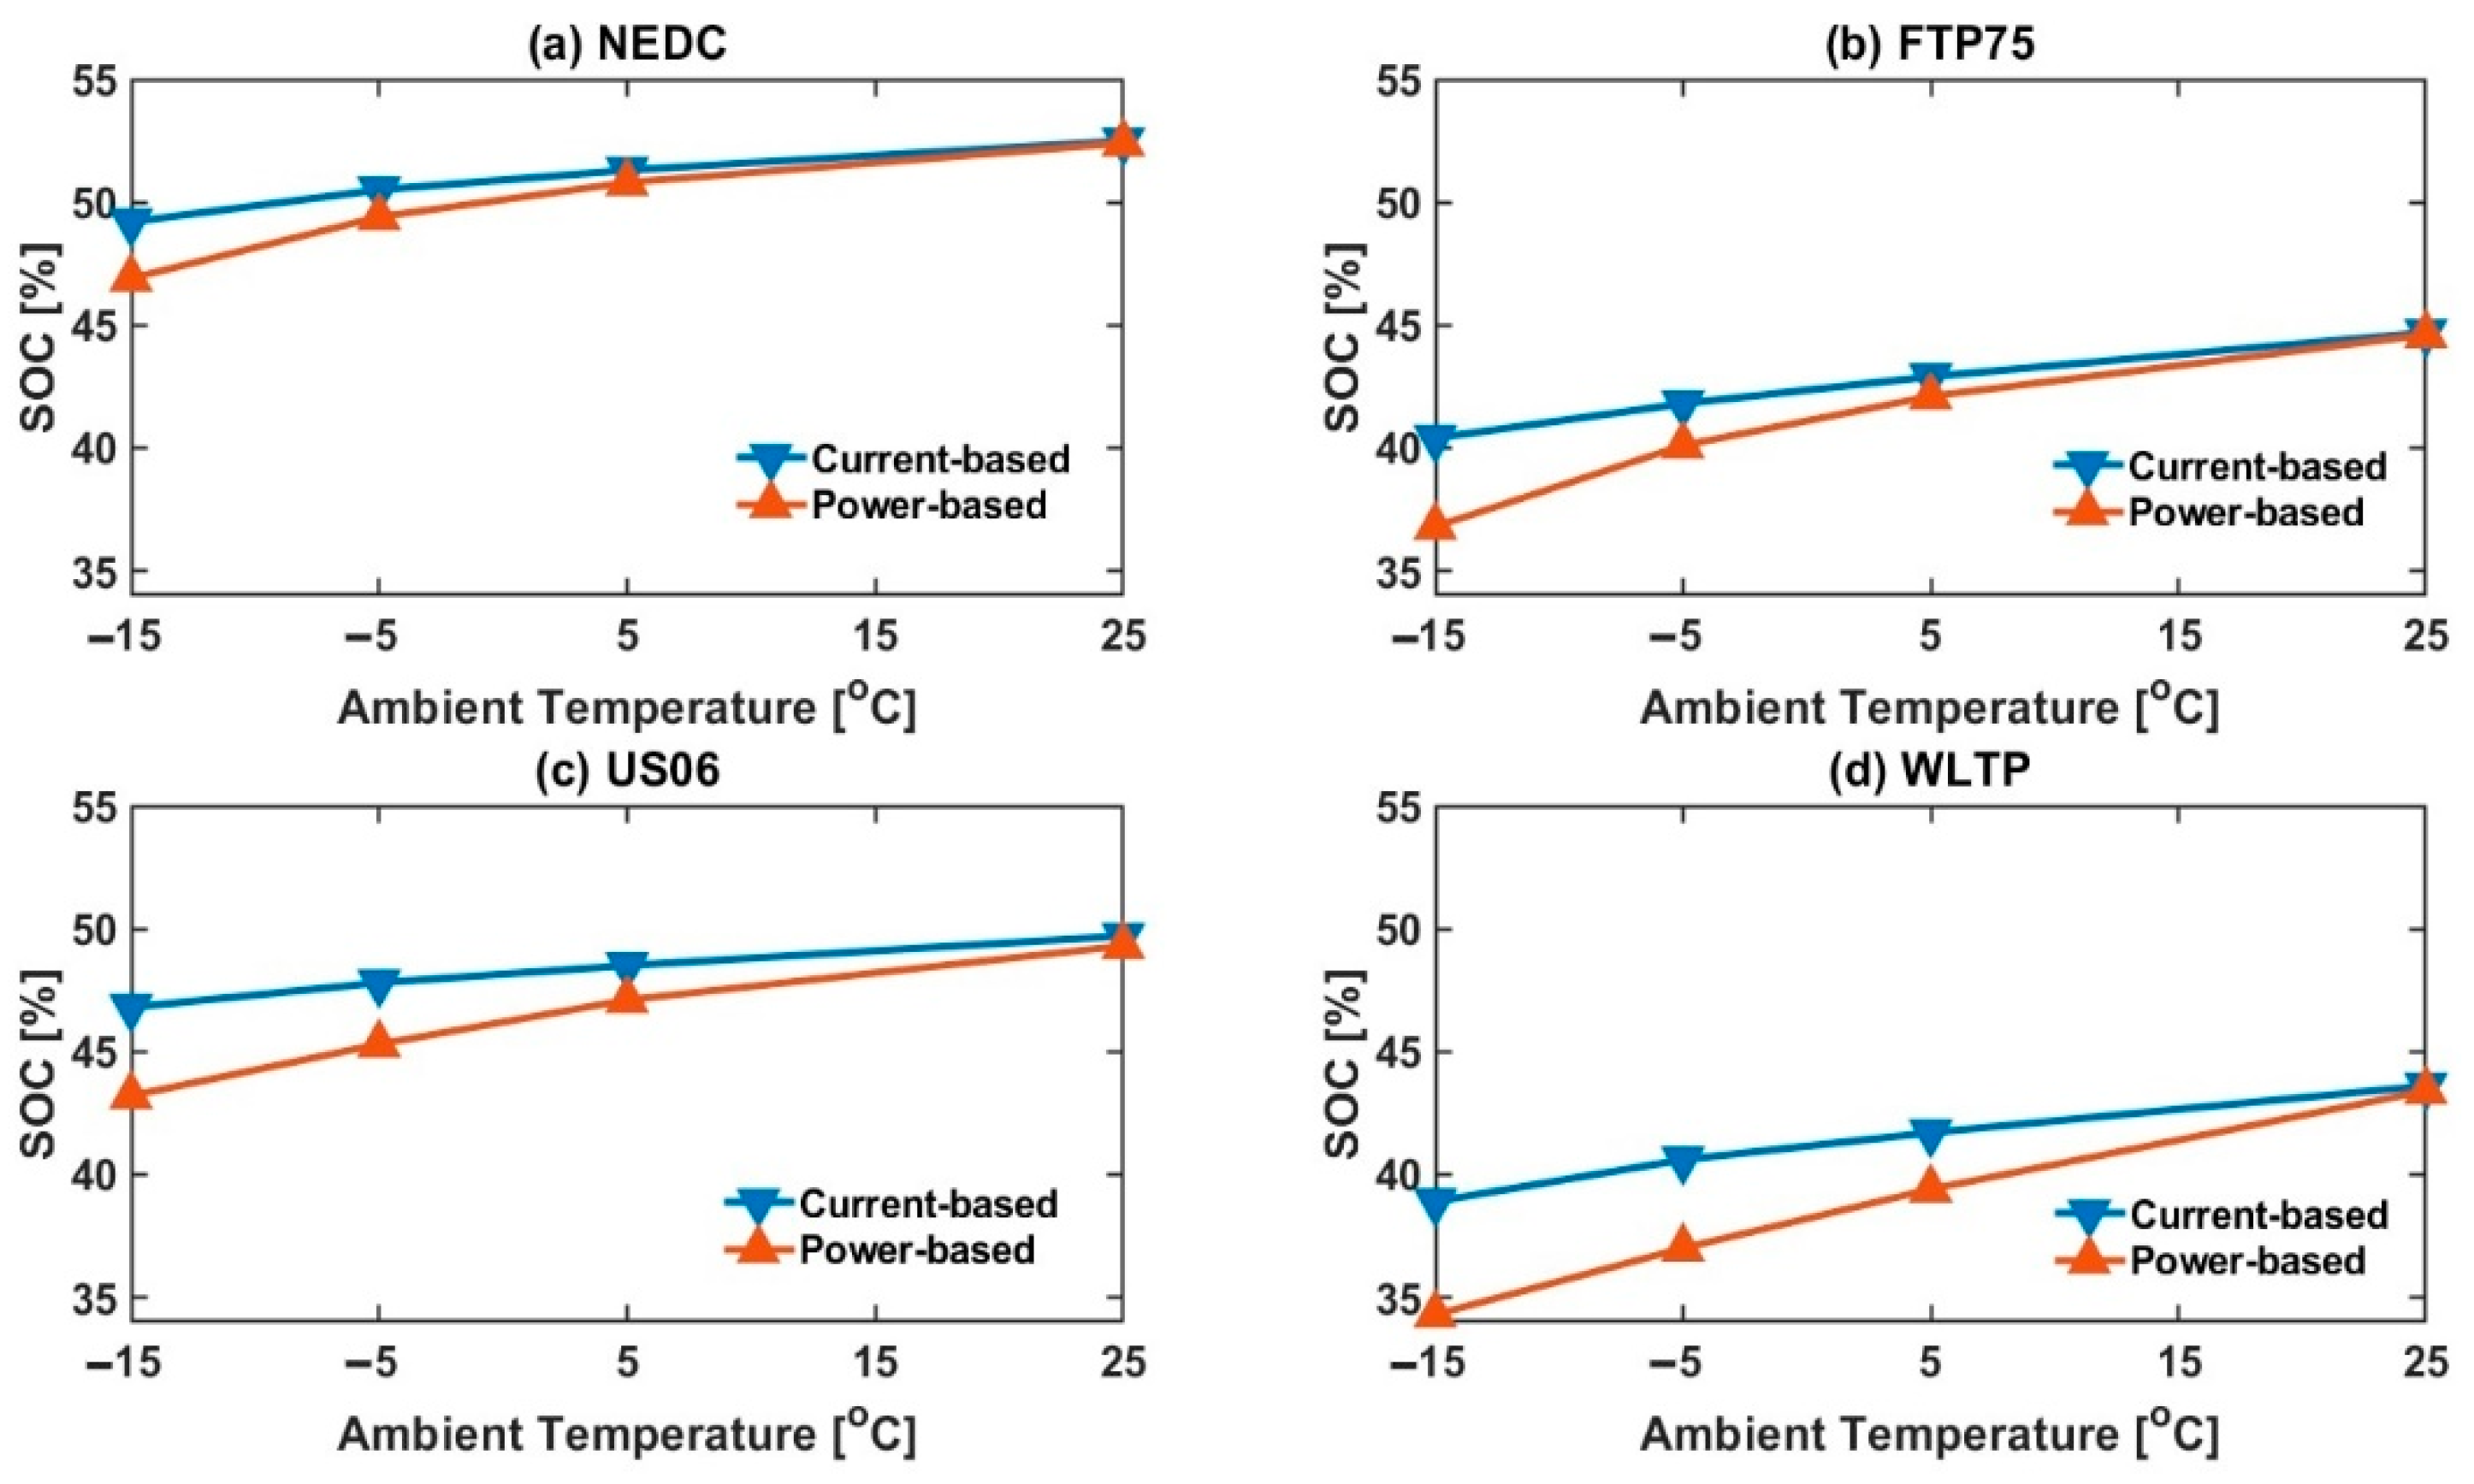
As the ambient temperature decreases, for a particular legislative drive cycle, the change in SOC from 65% starting SOC (∆SOC) increases for both current-based and power-based approaches (Figure 11). For example, for the current-based NEDC from a 65% starting SOC, while the final SOC is 52.5% at 25 °C ambient temperature, it is 49.2% at −15 °C ambient temperature (Figure 11a). While there is a negligible difference at 25 °C ambient temperature; as the ambient temperature decreases, the discrepancy in the SOC evolution for the current-based and power-based approaches for a particular drive cycle is greater (Figure 11). For example, for the current-based FTP75, from a 65% starting SOC, the final SOC decreases from 44.7% at 25 °C ambient temperature to 40.4% at −15 °C ambient temperature (Figure 11b); a reduction of ~9.6%. However, correspondingly for the power-based FTP75 the final SOC changes from 44.6% at 25 °C to 36.8% at −15 °C ambient temperature. This is a reduction of ~17.5%. This can be explained by the relatively higher power demands in the power-based approach due to higher currents passing through the cell (Figure 6). This means that SOC decreases faster for a given drive cycle for the power-based approach potentially affecting range.
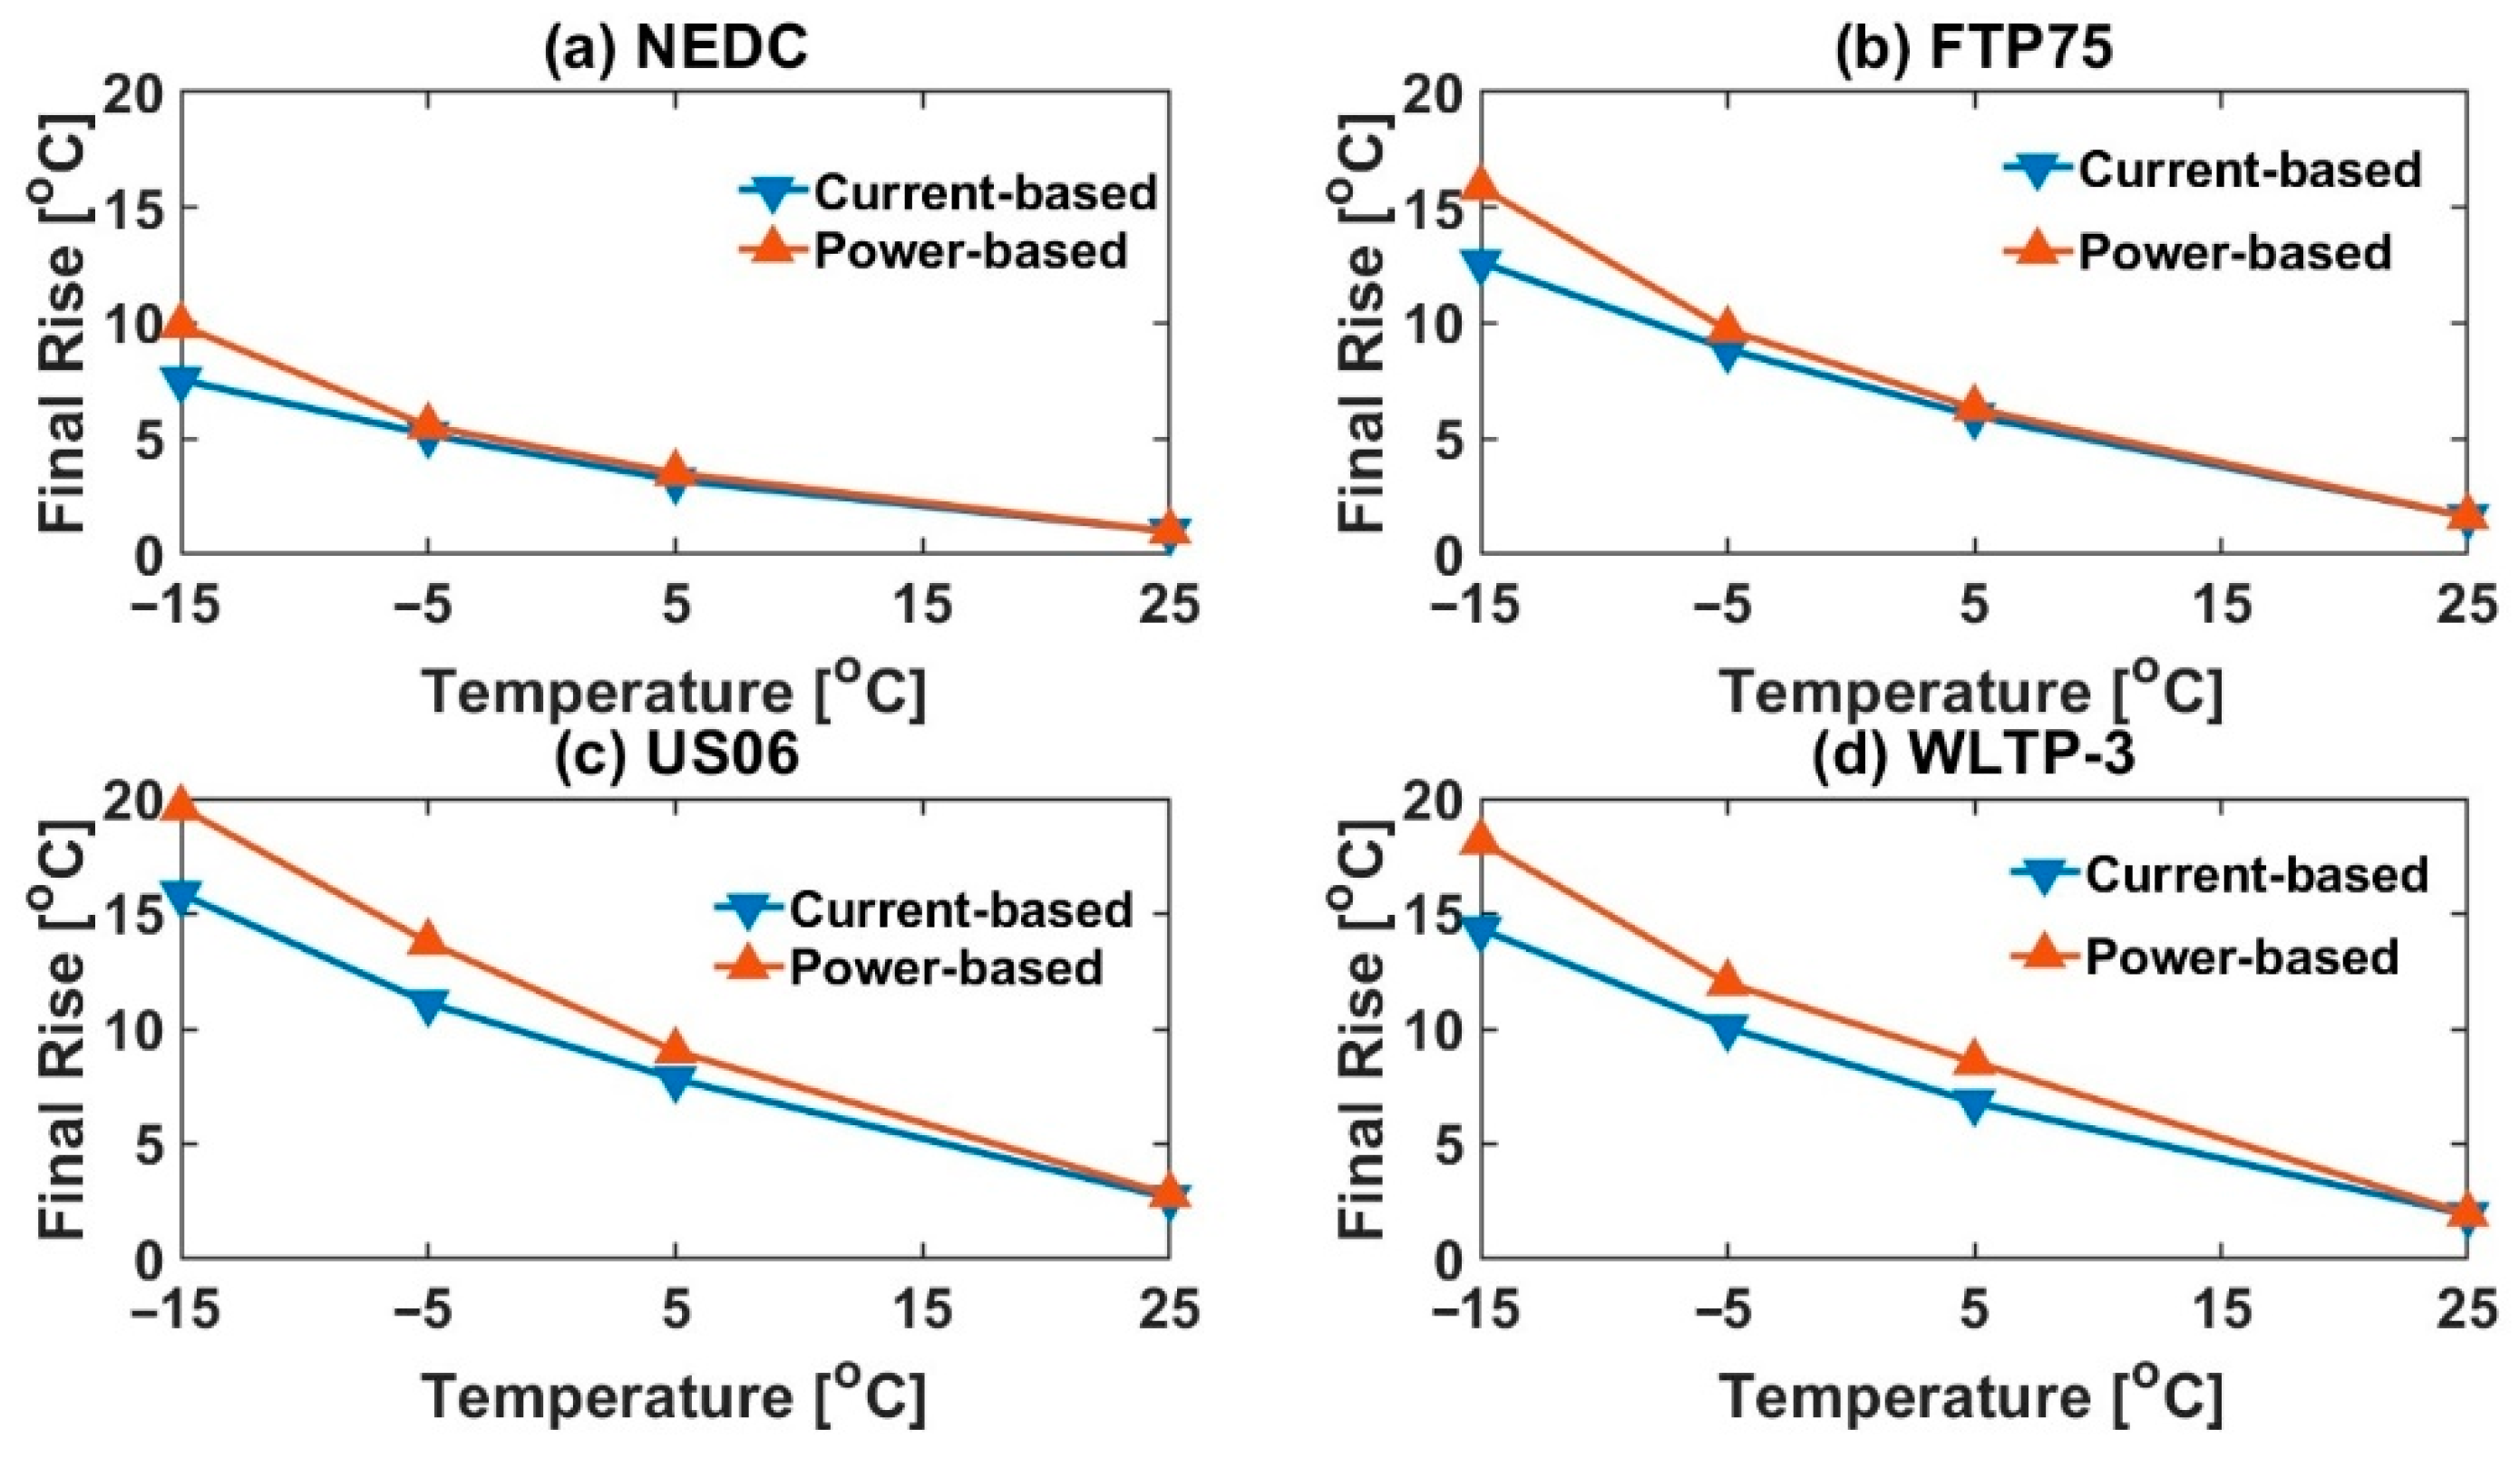
The discrepancy between current-based and power-based approaches has not only electrical implications, but thermal ones as well [42]. For a particular legislative drive cycle, employing a power-based approach led to a faster rise in the cell operating temperature compared to that for the current-based approach (Figure 12). This divergence increased with decreasing ambient temperature and increasing power demands of the legislative drive cycle. This discrepancy may affect thermal management strategies when it comes to real-world automotive applications [43,44]. For example, it holds the potential to reduce the amount of liquid heating required for battery packs. This will reduce the volume of oil/glycol, etc. required to heat the battery and will induce thermal runaway faster. If phase-change materials are considered, the size of the material used may need to be reduced. This in turn may cause battery pack weight to decrease; reducing cost.
4. Discussion
For a particular legislative drive cycle, the relative energy and power demands for which a cell should be tested for is 100% irrespective of the operating conditions in terms of ambient temperature and/or SOC. A current-based approach fails to ensure that this consistency in energy/power delivery is maintained as ambient temperature decreases and leads to ‘under-testing’ of the cells. It was shown in Figure 3 that the relative energy delivered reduces from 98.93% (25 °C) to 83.17% (−15 °C) across all four legislative drive cycles. Similarly, the relative peak power delivered reduced from 95.97% at 25 °C ambient temperature to 71.12% at −15 °C. Thus, the discrepancy in using a current-based approach as ambient temperature decreases is greater in terms of power delivery than for energy delivery. This implies that instantaneous power considerations are more important than cumulative energy considerations as ambient temperature decreases. This is particularly relevant in terms of characterising cell performance more accurately and obtaining more realistic validation data for the creation of equivalent circuit models (ECMs). Furthermore, the relative energy and relative peak power tested at −15 °C for the current-based NEDC is 85.18% and 72.98%, respectively (Figure 3a). Whereas, the corresponding values for the US06 are 78.31% and 64.50%, respectively (Figure 3c). Correspondingly, the peak power demanded is higher for the US06 than the NEDC by 137.95% (Table 3). This indicates that any issues with the current-based approach to cell testing at low ambient temperatures would be amplified, especially when power demand of the drive cycle increases.
The root of the issue underpinning the current-based approach for testing lithium-ion cells for legislative drive cycles is that the dynamic nature of the cell voltage is not captured during cycling. This is not an issue at 25 °C ambient temperature where the standard deviation from mean cell voltage averaged across the four legislative drive cycles is only 0.05 V. However, this becomes an issue at lower ambient temperatures. For example, the corresponding standard deviation at −15 °C ambient temperature is 0.21 V. It was shown in Figure 5 that if a power-based approach is employed, the cells reach cut-off voltage (2.7 V) at different points during tests at −15 °C ambient temperature. However, this was not shown for the corresponding current-based approach. This suggests that, if using a current-based approach, a cell may be classed as meeting the demands of a certain legislative drive cycle at −15 °C ambient temperature, but misleading which could lead to issues in subsequent design architecture [45].
On the other hand, employing a power-based approach to ensure consistency in energy/power delivery leads to certain considerations which may have been overlooked in the current-based approach. The cells are ‘over-tested’ in terms of capacity and current demands as ambient temperature decreases (Figure 6). While, this difference is negligible at 25 °C ambient temperature (average 1.25% extra capacity demand), it becomes increasingly prominent at lower ambient temperatures (average 18.48% extra capacity demand at −15 °C). Furthermore, the peak current demand is affected more than the corresponding capacity demand (Figure 6). This is evidenced by the fact that none of the cells were able to meet the peak current demands at −15 °C (Figure 5 and Figure 6). Not accounting for these higher currents could also have safety implications, e.g., there is a greater risk of the cells being cycled outside their nominal operating window which could lead to cell venting, thermal runaway and lithium plating short-circuit issues [46,47].
Thus, using a current-based approach towards validating battery performance at low ambient temperatures may lead to under-testing (energy and power demands of realistic drive cycles) whereas using a power-based approach may necessitate over-testing (capacity and C-rate capability of cell) which may have been overlooked otherwise. For example, in a battery pack, let it be assumed that a commercial decision has to be made to decide the number of cells in parallel. If using the current-based approach; any decision made on deciding the number of cells in parallel for a battery module will be incomplete as it may not take into account higher operating currents and consequently, greater heat generation rates, as seen in the real-world. For both current-based and power-based approaches to validate an ECM, the accuracy in output voltage estimation decreases as ambient temperature decreases from 25 °C. However, as ambient temperature further decreases, the accuracy in output voltage estimation increases further. This can be explained by greater coupling of electrical and thermal behaviour at low ambient temperatures and slower electrochemical processes [10,19]. For ‘2RC’ ECM, the performance validation tends to be more accurate in the power-based approach than current-based approach, especially at low ambient temperatures. A power-based approach necessitates higher operating currents, lower voltage operation and hence, greater self-heating and lower SOC operation. It is expected that temperature gradients result in internal SOC gradients may then be captured more accurately for higher operating currents and for lower operating voltages [29,42,48,49].
In Figure 11, it was shown that there is a discrepancy between SOC estimated for the current-based vs. power-based legislative drive cycle. This discrepancy become more pertinent when the ambient temperature decreases and drive cycle aggressiveness increases. For the power-based approach, lower SOC is estimated for higher operating currents which may lead to a more pessimistic, albeit realistic estimation of the remaining driving range. This in turn may be more in line with real-world behavior of BEVs at low ambient temperatures. This discrepancy will also be relevant for energy management strategies for PHEVs where accurate SOC window is critical for design decisions [50]. As an example, it was shown in Figure 11 that for 65% starting SOC and −15 °C ambient temperature, the end-SOC for the current-based approach would be 41% in the FTP75 drive cycle. However, the end-SOC would be 37% if this was based on the power-based approach. Therefore, for the current-based approach, the conclusion from the cell level experiments would be that the FTP75 is met by the cell without switching over to the charge sustaining mode; but the conclusion for the power-based approach would be the opposite.
5. Conclusions
Evidence provided in this paper should allow academia and industry to choose power (or energy) instead of current (or capacity) as the fundamental approach in a model-based design process. Existing validation methods for ECMs are inadequate for automotive applications at low ambient temperatures. Employing a current-based approach instead of a power-based approach leads to under-testing the performance of lithium-ion cells in terms of energy and power demanded for realistic drive cycles. This discrepancy becomes more prominent as ambient temperature decreases and/or power demand of the drive cycle increases. SOC estimation by employing a power profile is a more realistic interpretation of driving range as compared to that via a current profile. Owing to lower SOC and higher current estimates in the power profiles, the heat generation rates would be higher than for the current profiles. This could lead to implications for heating systems at low ambient temperatures. In short, employing a power-based approach to cell level modelling would lead to an improved confidence for subsequent design decisions, especially improving battery performance estimation for real-world vehicular operations especially at low ambient temperatures. This could ultimately contribute to improving thermal management strategies for lithium-ion cells operating at low ambient temperatures, which in turn could improve driving range estimation of battery electric vehicles in cold weather conditions.
Author Contributions
Y.T. conceptualized the study, designed and conducted the experiments, developed the models, performed data analysis and wrote the manuscript. A.M. helped identify the technical content of this study and contributed to manuscript writing. C.T.J.L. revised the manuscript and approved the final version for journal submission. A.M. and C.T.J.L. provided research supervision.
Funding
This research was funded by EPSRC through the grant reference number (ELEVATE; EP/M009394/1) and Innovate UK through the WMG centre High Value Manufacturing (HVM) Catapult in collaboration with Jaguar Land Rover and Tata Motors.
Acknowledgments
The findings reported in this paper represent Y.T.’s Ph.D. research programs (January 2015–June 2018) at the University of Warwick, WMG’s Energy Innovation Centre (EIC). Research facilities were provided by the Innovate UK’s funded program (https://hvm.catapult.org.uk/) through the WMG centre High Value Manufacturing (HVM) Catapult in collaboration with Jaguar Land Rover and TATA Motors. C.T.J.L. acknowledges EPSRC’s funding support in the multi-universities automotive battery project, entitled ELEctrochemical Vehicle Advanced Technology (ELEVATE; EP/M009394/1). Y.T. is especially thankful to the technician supports provided by John Palmer in EIC, and acknowledges the Ph.D. studentship provided by WMG.
Conflicts of Interest
The authors declare no conflict of interest.
References
- Zahabi, S.A.H.; Miranda-Moreno, L.; Barla, P.; Vincent, B. Fuel economy of hybrid-electric versus conventional gasoline vehicles in real-world conditions: A case study of cold cities in Quebec, Canada. Transp. Res. Part D Transp. Environ. 2014, 32, 184–192. [Google Scholar] [CrossRef]
- Ji, Y.; Wang, C.Y. Heating strategies for Li-ion batteries operated from subzero temperatures. Electrochim. Acta 2013, 107, 664–674. [Google Scholar] [CrossRef]
- Neubauer, J.; Wood, E. The impact of range anxiety and home, workplace, and public charging infrastructure on simulated battery electric vehicle lifetime utility. J. Power Sources 2014, 257, 12–20. [Google Scholar] [CrossRef]
- Liu, X.; Wu, J.; Zhang, C.; Chen, Z. A method for state of energy estimation of lithium-ion batteries at dynamic currents and temperatures. J. Power Sources 2014, 270, 151–157. [Google Scholar] [CrossRef]
- Bruen, T.; Hooper, J.M.; Marco, J.; Gama, M.; Chouchelamane, G.H. Analysis of a battery management system (BMS) control strategy for vibration aged Nickel Manganese Cobalt Oxide (NMC) Lithium-Ion 18650 battery cells. Energies 2016, 9, 255. [Google Scholar] [CrossRef]
- Seaman, A.; Dao, T.S.; McPhee, J. A survey of mathematics-based equivalent-circuit and electrochemical battery models for hybrid and electric vehicle simulation. J. Power Sources 2014, 256, 410–423. [Google Scholar] [CrossRef] [Green Version]
- Tripathy, Y.; McGordon, A.; Marco, J.; Gama-Valdez, M. State-of-Charge estimation algorithms and their implications on cells in parallel. In Proceedings of the 2014 IEEE International Electric Vehicle Conference (IEVC 2014), Florence, Italy, 17–19 December 2014. [Google Scholar]
- Wang, Y.; Zhang, C.; Chen, Z. An adaptive remaining energy prediction approach for lithium-ion batteries in electric vehicles. J. Power Sources 2016, 305, 80–88. [Google Scholar] [CrossRef]
- Grandjean, T.; McGordon, A.; Jennings, P. Structural Identifiability of Equivalent Circuit Models for Li-Ion Batteries. Energies 2017, 10, 90. [Google Scholar] [CrossRef]
- Nejad, S.; Gladwin, D.T.; Stone, D.A. A systematic review of lumped-parameter equivalent circuit models for real-time estimation of lithium-ion battery states. J. Power Sources 2016, 316, 183–196. [Google Scholar] [CrossRef] [Green Version]
- Watrin, N.; Roche, R.; Ostermann, H.; Blunier, B.; Miraoui, A. Multiphysical lithium-based battery model for use in state-of-charge determination. IEEE Trans. Veh. Technol. 2012, 61, 3420–3429. [Google Scholar] [CrossRef]
- Wu, B.; Yufit, V.; Marinescu, M.; Offer, G.J.; Martinez-botas, R.F.; Brandon, N.P. Coupled thermal e electrochemical modelling of uneven heat generation in lithium-ion battery packs. J. Power Sources 2013, 243, 544–554. [Google Scholar] [CrossRef]
- Smith, K.; Wang, C.-Y. Power and thermal characterization of a lithium-ion battery pack for hybrid-electric vehicles. J. Power Sources 2006, 160, 662–673. [Google Scholar] [CrossRef]
- Farmann, A.; Sauer, D.U. A study on the dependency of the open-circuit voltage on temperature and actual aging state of lithium-ion batteries. J. Power Sources 2017, 347, 1–13. [Google Scholar] [CrossRef]
- Xing, Y.; He, W.; Pecht, M.; Tsui, K.L. State of charge estimation of lithium-ion batteries using the open-circuit voltage at various ambient temperatures. Appl. Energy 2014, 113, 106–115. [Google Scholar] [CrossRef]
- Hu, X.; Li, S.; Peng, H. A comparative study of equivalent circuit models for Li-ion batteries. J. Power Sources 2012, 198, 359–367. [Google Scholar] [CrossRef]
- He, H.; Xiong, R.; Guo, H.; Li, S. Comparison study on the battery models used for the energy management of batteries in electric vehicles. Energy Convers. Manag. 2012, 64, 113–121. [Google Scholar] [CrossRef]
- Tripathy, Y.; McGordon, A.; Low, J.; Marco, J. Low temperature performance of lithium-ion batteries for different drive cycles. In Proceedings of the EVS 2016—29th International Electric Vehicle Symposium, Montreal, QC, Canada, 19–22 June 2016. [Google Scholar]
- Jaguemont, J.; Boulon, L.; Dube, Y. Characterization and Modeling of a Hybrid-Electric-Vehicle Lithium-Ion Battery Pack at Low Temperatures. IEEE Trans. Veh. Technol. 2016, 65, 1–14. [Google Scholar] [CrossRef]
- Andre, D.; Meiler, M.; Steiner, K.; Walz, H.; Soczka-Guth, T.; Sauer, D.U. Characterization of high-power lithium-ion batteries by electrochemical impedance spectroscopy. II: Modelling. J. Power Sources 2011, 196, 5349–5356. [Google Scholar] [CrossRef]
- Hosseinzadeh, E.; Genieser, R.; Worwood, D.; Barai, A.; Marco, J.; Jennings, P. A systematic approach for electrochemical-thermal modelling of a large format lithium-ion battery for electric vehicle application. J. Power Sources 2018, 382, 77–94. [Google Scholar] [CrossRef] [Green Version]
- Keil, P.; Jossen, A. Improving the low-temperature performance of electric vehicles by hybrid energy storage systems. In Proceedings of the 2014 IEEE Vehicle Power and Propulsion Conference (VPPC), Coimbra, Portugal, 27–30 October 2014. [Google Scholar] [CrossRef]
- Huria, T.; Ceraolo, M.; Gazzarri, J.; Jackey, R. High Fidelity Electrical Model with Thermal Dependence for Characterization and Simulation of High Power Lithium Battery Cells. Syst. Eng. 2012, 1–8. [Google Scholar] [CrossRef]
- Keil, P.; Jossen, A. Aging of Lithium-Ion Batteries in Electric Vehicles: Impact of Regenerative Braking. In Proceedings of the EVS28 International Electric Vehicle Symposium and Exhibition, Goyang, Korea, 3–6 May 2015; pp. 1–11. [Google Scholar] [CrossRef]
- Burke, A.; Miller, M. The power capability of ultracapacitors and lithium batteries for electric and hybrid vehicle applications. J. Power Sources 2011, 196, 514–522. [Google Scholar] [CrossRef]
- Andre, D.; Appel, C.; Soczka-Guth, T.; Sauer, D.U. Advanced mathematical methods of SOC and SOH estimation for lithium-ion batteries. J. Power Sources 2013, 224, 20–27. [Google Scholar] [CrossRef]
- Li, K.; Tseng, K.J. An Equivalent Circuit Model for State of Energy Estimation of Lithium-ion Battery. In Proceedings of the 2016 IEEE Applied Power Electronics Conference and Exposition (APEC), Long Beach, CA, USA, 20–24 March 2016; pp. 3422–3430. [Google Scholar]
- Jaguemont, J.; Boulon, L.; Dube, Y.; Poudrier, D. Low temperature discharge cycle tests for a lithium ion cell. In Proceedings of the 2014 IEEE Vehicle Power and Propulsion Conference (VPPC), Coimbra, Portugal, 27–30 October 2014. [Google Scholar] [CrossRef]
- Ji, Y.; Zhang, Y.; Wang, C.-Y. Li-Ion Cell Operation at Low Temperatures. J. Electrochem. Soc. 2013, 160, A636–A649. [Google Scholar] [CrossRef]
- Barai, A.; Uddin, K.; Widanalage, W.D.; McGordon, A.; Jennings, P. The effect of average cycling current on total energy of lithium-ion batteries for electric vehicles. J. Power Sources 2016, 303, 81–85. [Google Scholar] [CrossRef]
- Grandjean, T.; Barai, A.; Hosseinzadeh, E.; Guo, Y.; Mcgordon, A.; Marco, J. Large format lithium ion pouch cell full thermal characterisation for improved electric vehicle thermal management. J. Power Sources 2017. [Google Scholar] [CrossRef]
- Shidore, N.; Bohn, T. Evaluation of Cold Temperature Performance of the JCS-VL41M PHEV Battery using Battery HIL. SAE Tech. Pap. 2008. [Google Scholar] [CrossRef]
- Tripathy, Y.; Mcgordon, A.; Low, J.; Marco, J. Internal temperature prediction of Lithium-ion cell using differential voltage technique. In Proceedings of the 2017 IEEE Transportation and Electrification Conference and Expo (ITEC), Chicago, IL, USA, 22–24 June 2017. [Google Scholar]
- Rizalino, J.; Reyes, M.D.; Member, A.; Parsons, R.V.; Hoemsen, R. Winter Happens: The Effect of Ambient Temperature on the Travel Range of Electric Vehicles. IEEE Trans. Veh. Technol. 2016, 65, 4016–4022. [Google Scholar]
- Keil, P.; Englberger, M.; Jossen, A. Hybrid Energy Storage Systems for Electric Vehicles: An Experimental Analysis of Performance Improvements at Subzero Temperatures. IEEE Trans. Veh. Technol. 2016, 65, 998–1006. [Google Scholar] [CrossRef]
- Fiori, C.; Ahn, K.; Rakha, H.A. Power-based electric vehicle energy consumption model: Model development and validation. Appl. Energy 2016, 168, 257–268. [Google Scholar] [CrossRef]
- Doucette, R.T.; Mcculloch, M.D. Modeling the CO2 emissions from battery electric vehicles given the power generation mixes of different countries. Energy Policy 2010, 39, 803–811. [Google Scholar] [CrossRef]
- Kambly, K.; Bradley, T.H. Geographical and temporal differences in electric vehicle range due to cabin conditioning energy consumption. J. Power Sources 2015, 275, 468–475. [Google Scholar] [CrossRef]
- Myall, D.; Ivanov, D.; Larason, W.; Nixon, M.; Moller, H. Accelerated Reported Battery Capacity Loss in 30 kWh Variants of the Nissan Leaf. Preprints 2018, 2018, 2018030122. [Google Scholar] [CrossRef]
- He, H.; Xiong, R.; Fan, J. Evaluation of lithium-ion battery equivalent circuit models for state of charge estimation by an experimental approach. Energies 2011, 4, 582–598. [Google Scholar] [CrossRef]
- Barai, A.; Widanage, W.D.; Marco, J.; Mcgordon, A.; Jennings, P. A study of the open circuit voltage characterization technique and hysteresis assessment of lithium-ion cells. J. Power Sources 2015, 295, 99–107. [Google Scholar] [CrossRef] [Green Version]
- Goutam, S.; Timmermans, J.M.; Omar, N.; Van den Bossche, P.; Van Mierlo, J. Comparative study of surface temperature behavior of commercial li-ion pouch cells of different chemistries and capacities by infrared thermography. Energies 2015, 8, 8175–8192. [Google Scholar] [CrossRef]
- Chacko, S.; Chung, Y.M. Thermal modelling of Li-ion polymer battery for electric vehicle drive cycles. J. Power Sources 2012, 213, 296–303. [Google Scholar] [CrossRef]
- Jaguemont, J.; Boulon, L.; Dube, Y. A comprehensive review of lithium-ion batteries used in hybrid and electric vehicles at cold temperatures. Appl. Energy 2016, 164, 99–114. [Google Scholar] [CrossRef]
- Barai, A.; Ashwin, T.R.; Iraklis, C.; McGordon, A.; Jennings, P. Scale-up of lithium-ion battery model parameters from cell level to module level – identification of current issues. Energy Procedia 2017, 138, 223–228. [Google Scholar] [CrossRef]
- Barai, A.; Uddin, K.; Chevalier, J.; Chouchelamane, G.H.; McGordon, A.; Low, J.; Jennings, P. Transportation Safety of Lithium Iron Phosphate Batteries—A Feasibility Study of Storing at Very Low States of Charge. Sci. Rep. 2017, 7, 5128. [Google Scholar] [CrossRef] [PubMed]
- Han, X.; Ouyang, M.; Lu, L.; Li, J. Cycle life of commercial lithium-ion batteries with lithium titanium oxide anodes in electric vehicles. Energies 2014, 7, 4895–4909. [Google Scholar] [CrossRef]
- Klein, M.; Tong, S.; Park, J.W. In-plane nonuniform temperature effects on the performance of a large-format lithium-ion pouch cell. Appl. Energy 2016, 165, 639–647. [Google Scholar] [CrossRef]
- Marinescu, M.; Wu, B.; Von Srbik, M.; Yufit, V.; Offer, G.J. The effect of thermal gradients on the performance of battery packs in automotive applications. J. Power Sources 2014, 247, 1018–1025. [Google Scholar] [CrossRef]
- Rajan, B.V.P. Plug in Hybrid Electric Vehicle Energy Management System for Real World Driving. Ph.D. Thesis, University of Warwick, Coventry, UK, 2014. [Google Scholar]
Figure 1.
Graphical representation of test setup inside the thermal chamber.
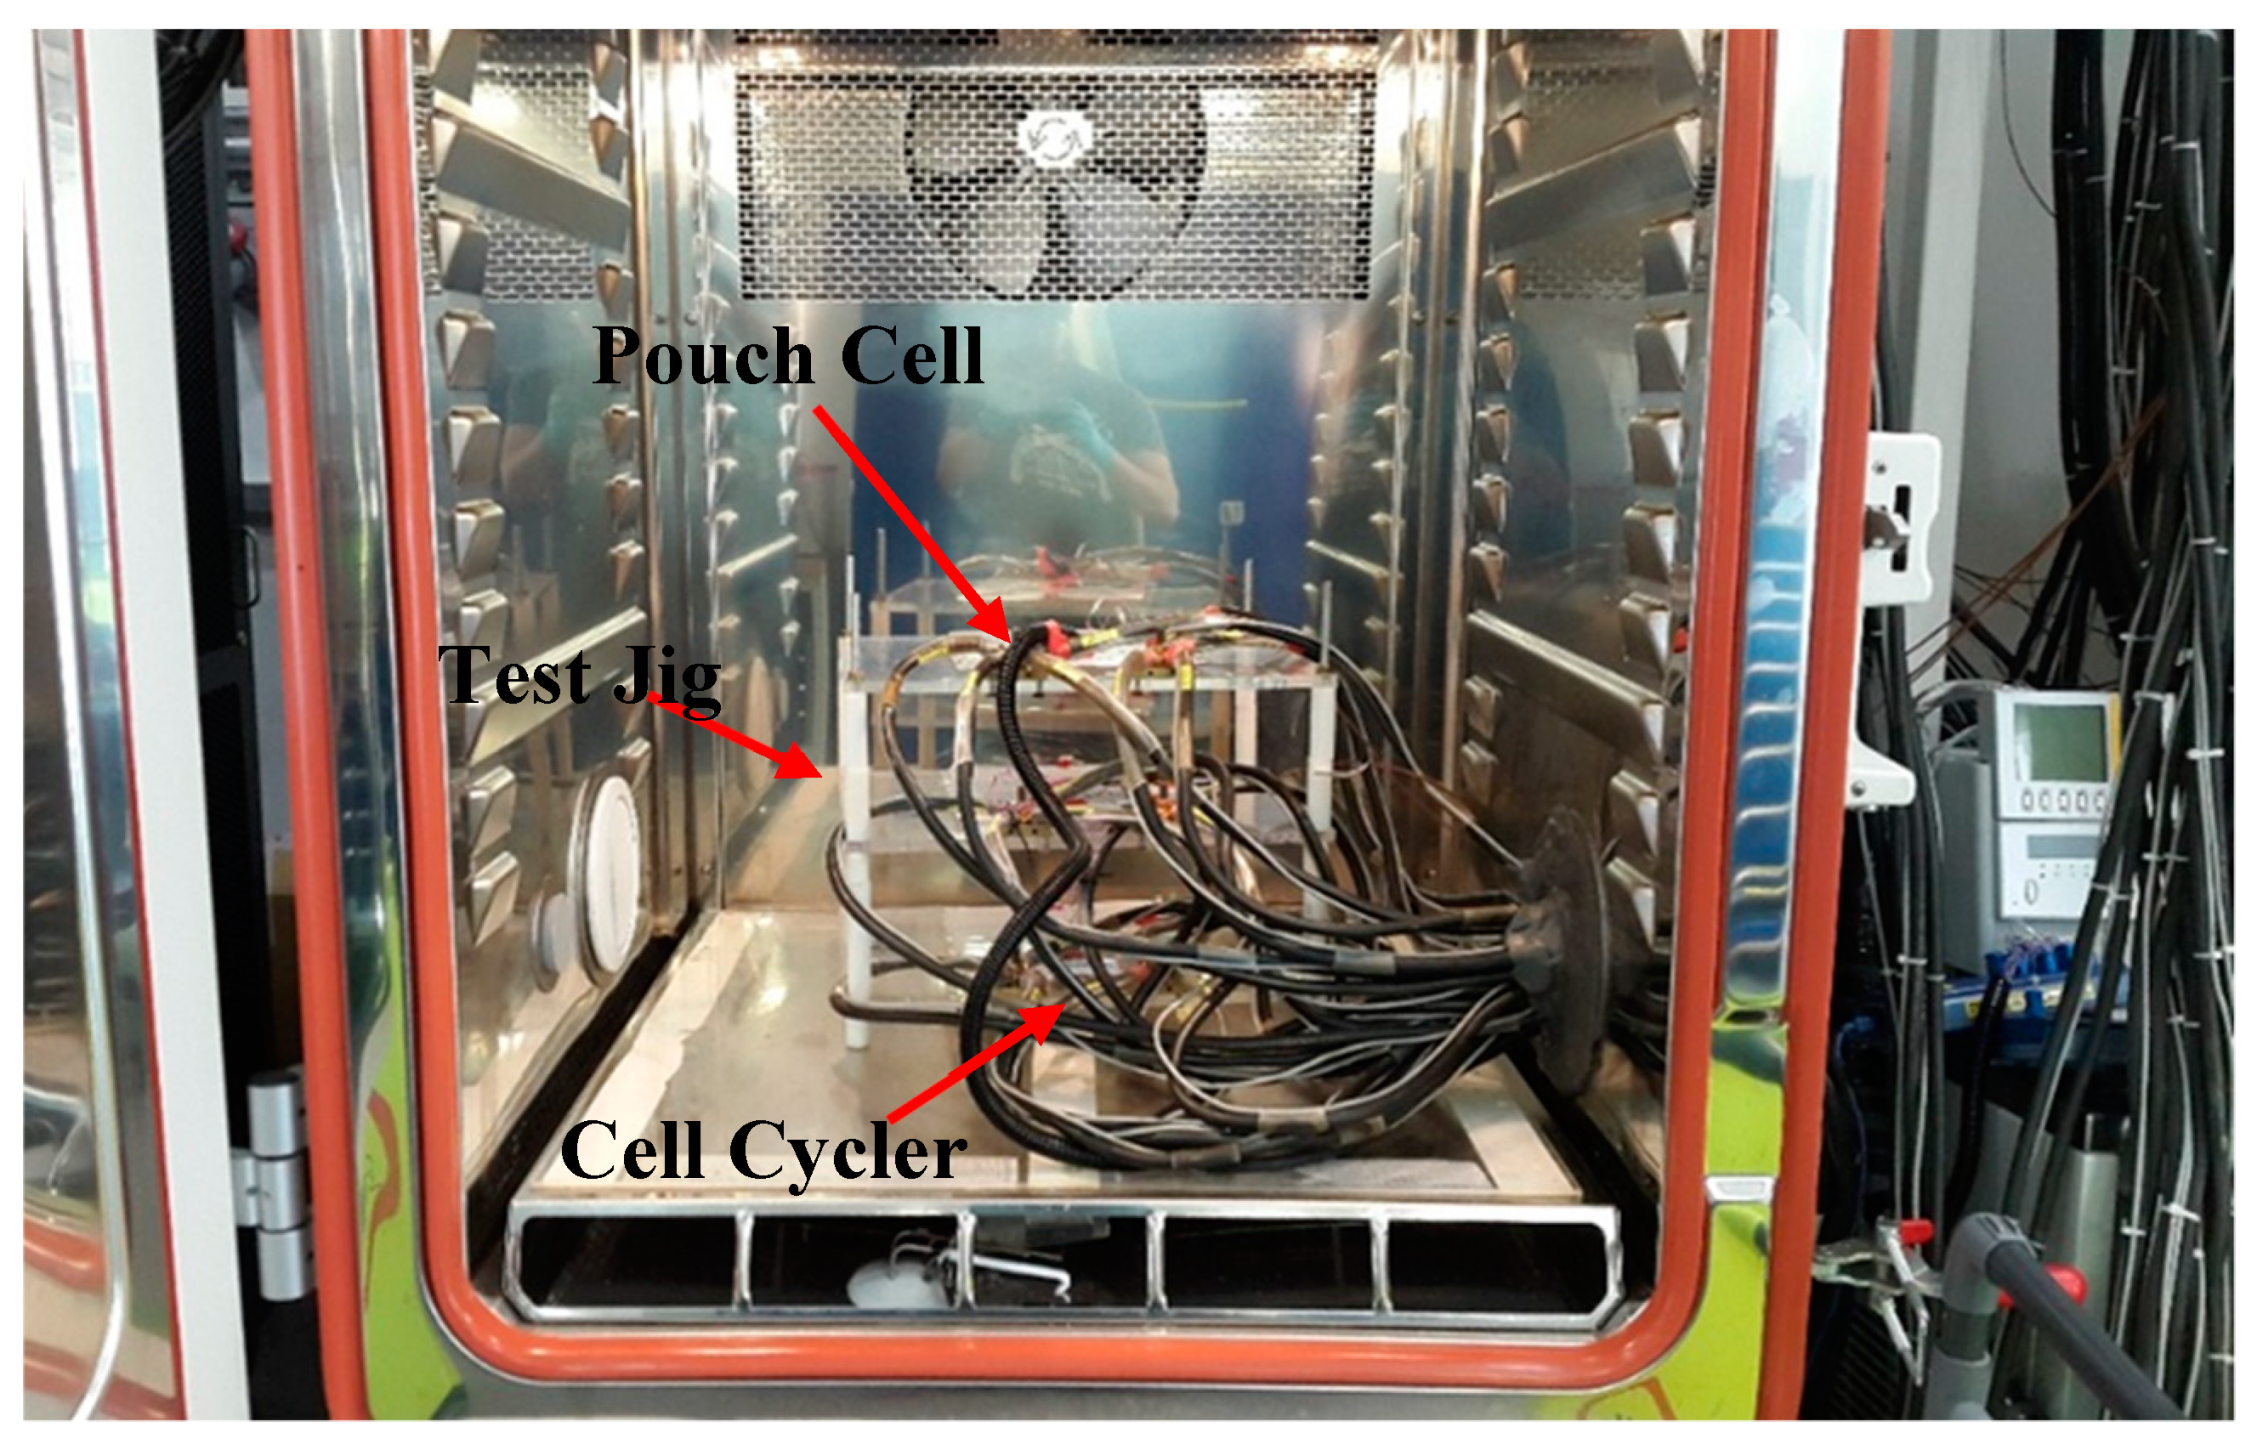
Figure 2.
Comparison between power demands for the power-based approach and current-based approach for NEDC at −15 °C ambient temperature and 65% starting State of Charge (SOC).
Figure 2.
Comparison between power demands for the power-based approach and current-based approach for NEDC at −15 °C ambient temperature and 65% starting State of Charge (SOC).
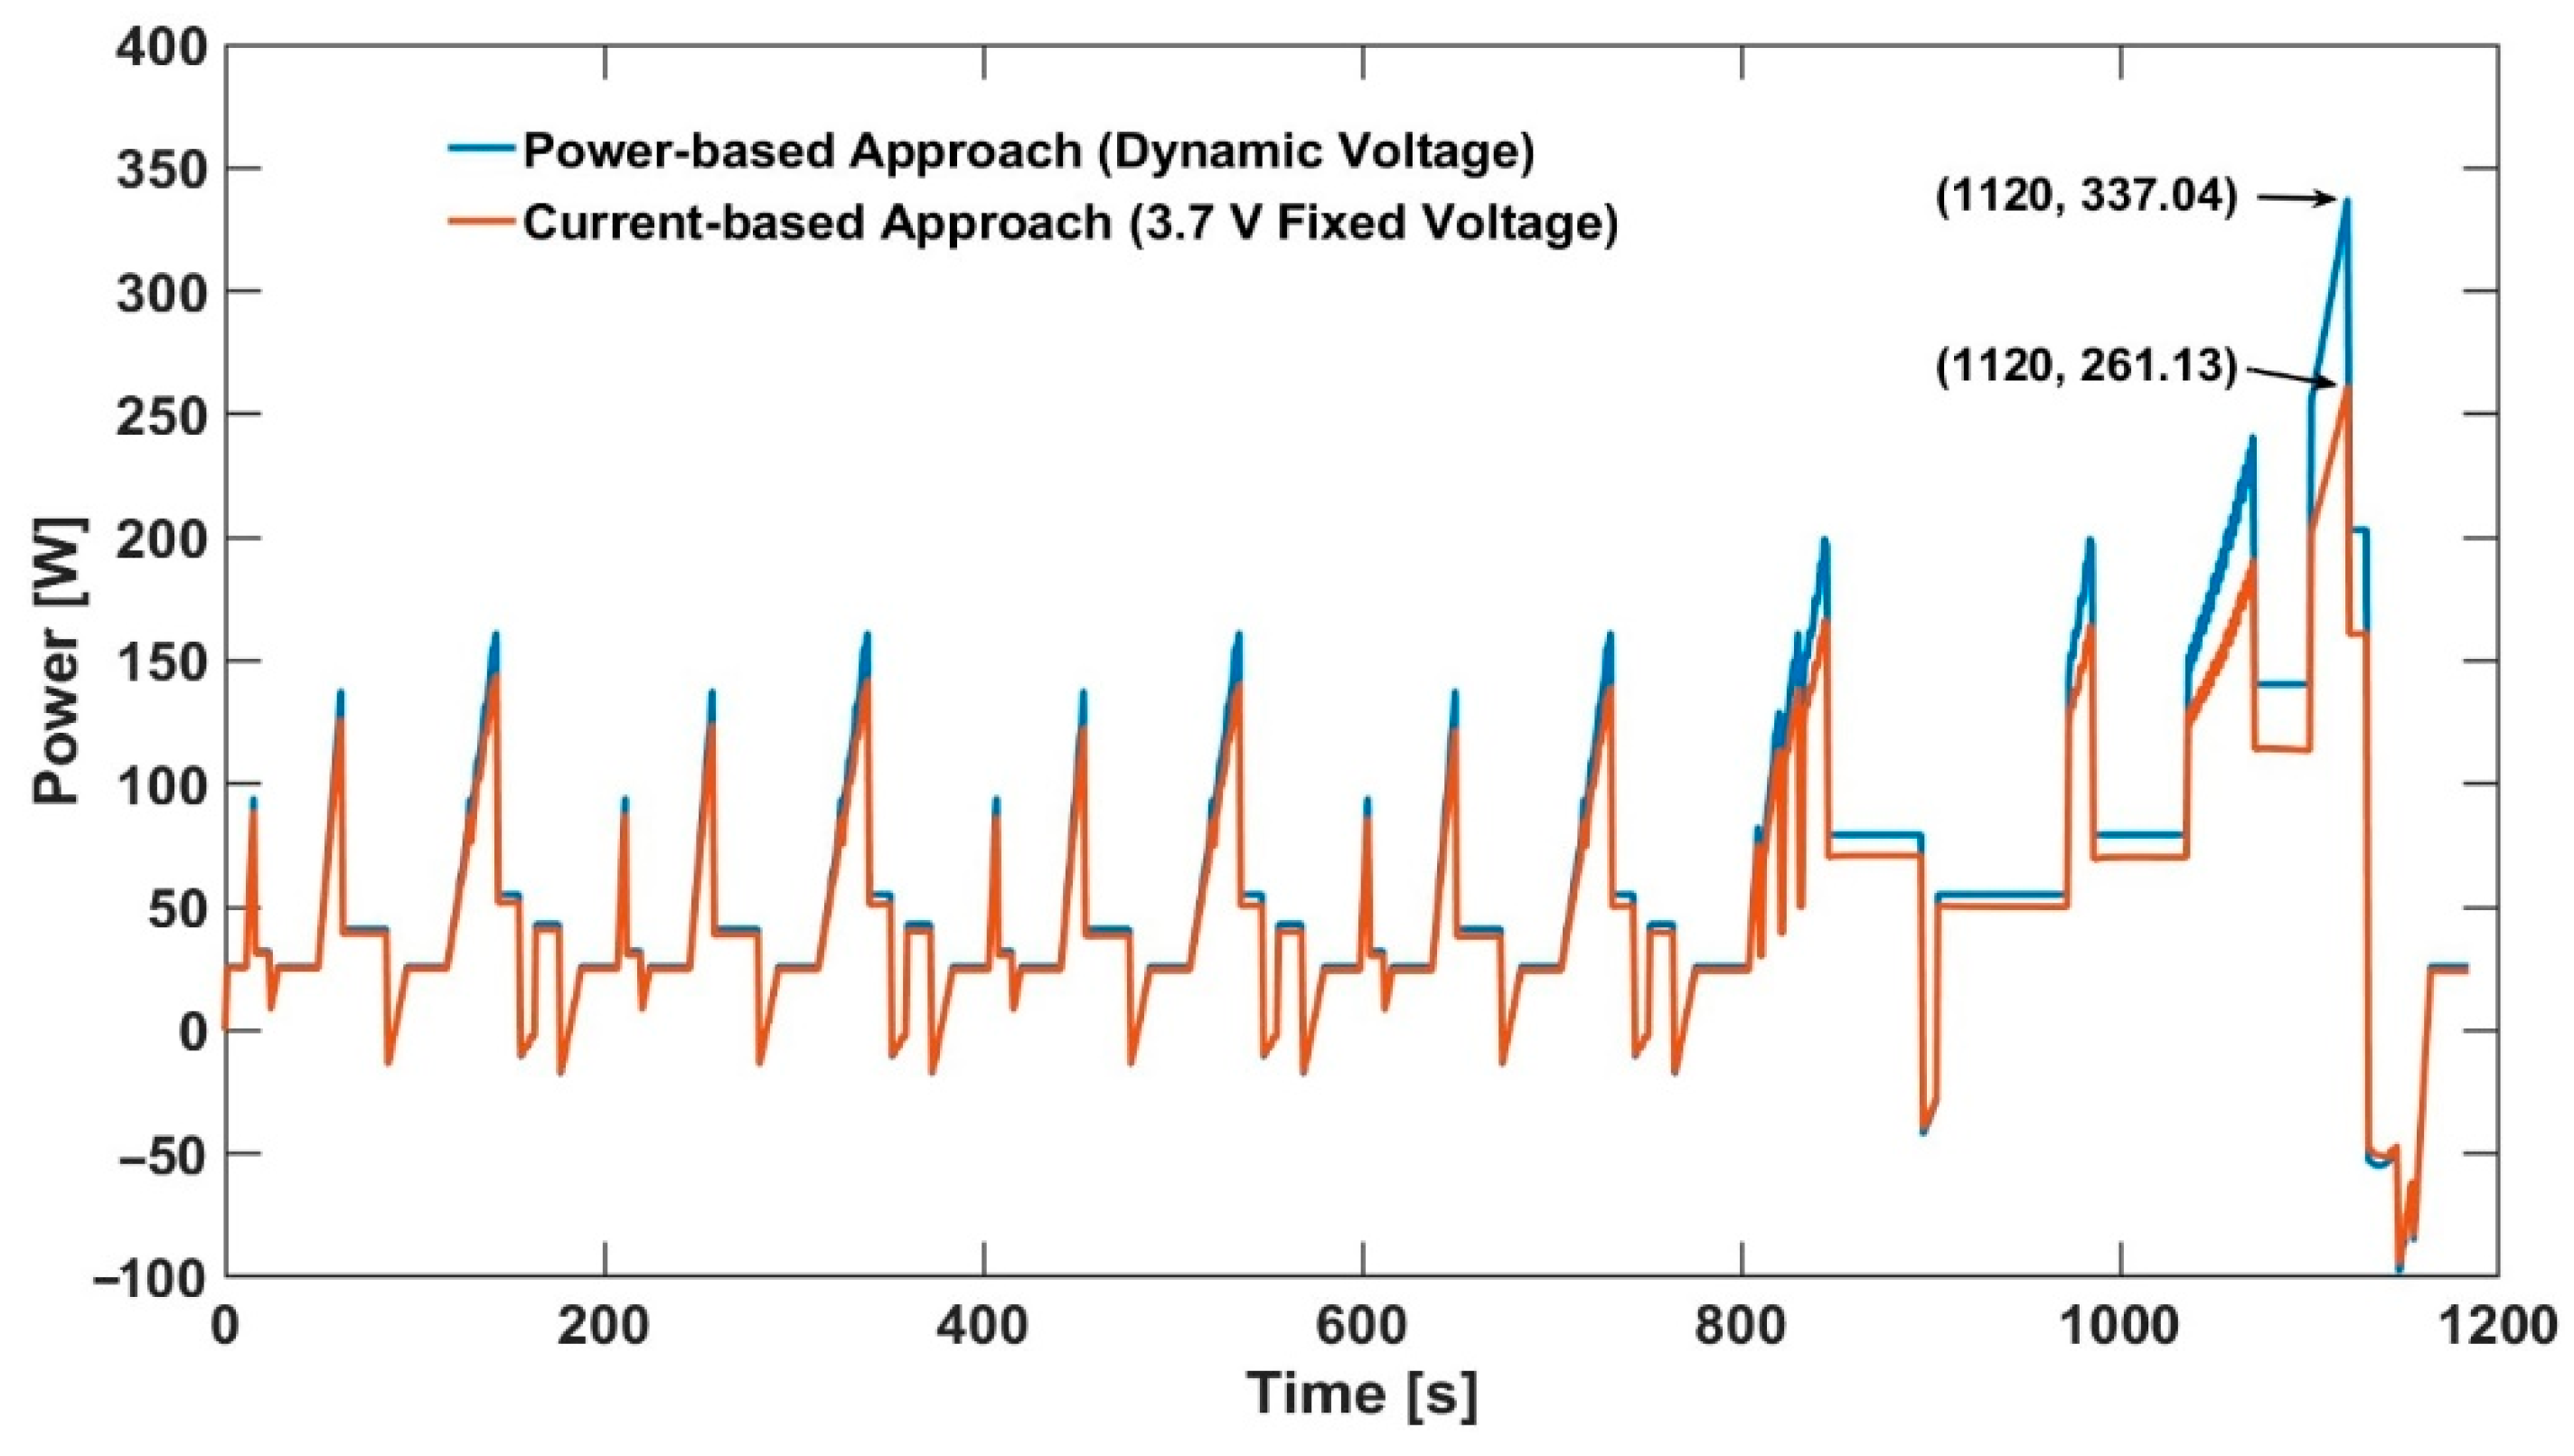
Figure 3.
Comparing Relative Peak Power Delivered and Relative Energy Delivered from Cell to Baseline Peak Power and Relative Energy Demanded for Various Ambient Temperatures and Legislative Drive Cycles for 65% starting SOC employing current-based approach: (a) NEDC, (b) FTP75, (c) US06 and (d) WLTP (Class 3).
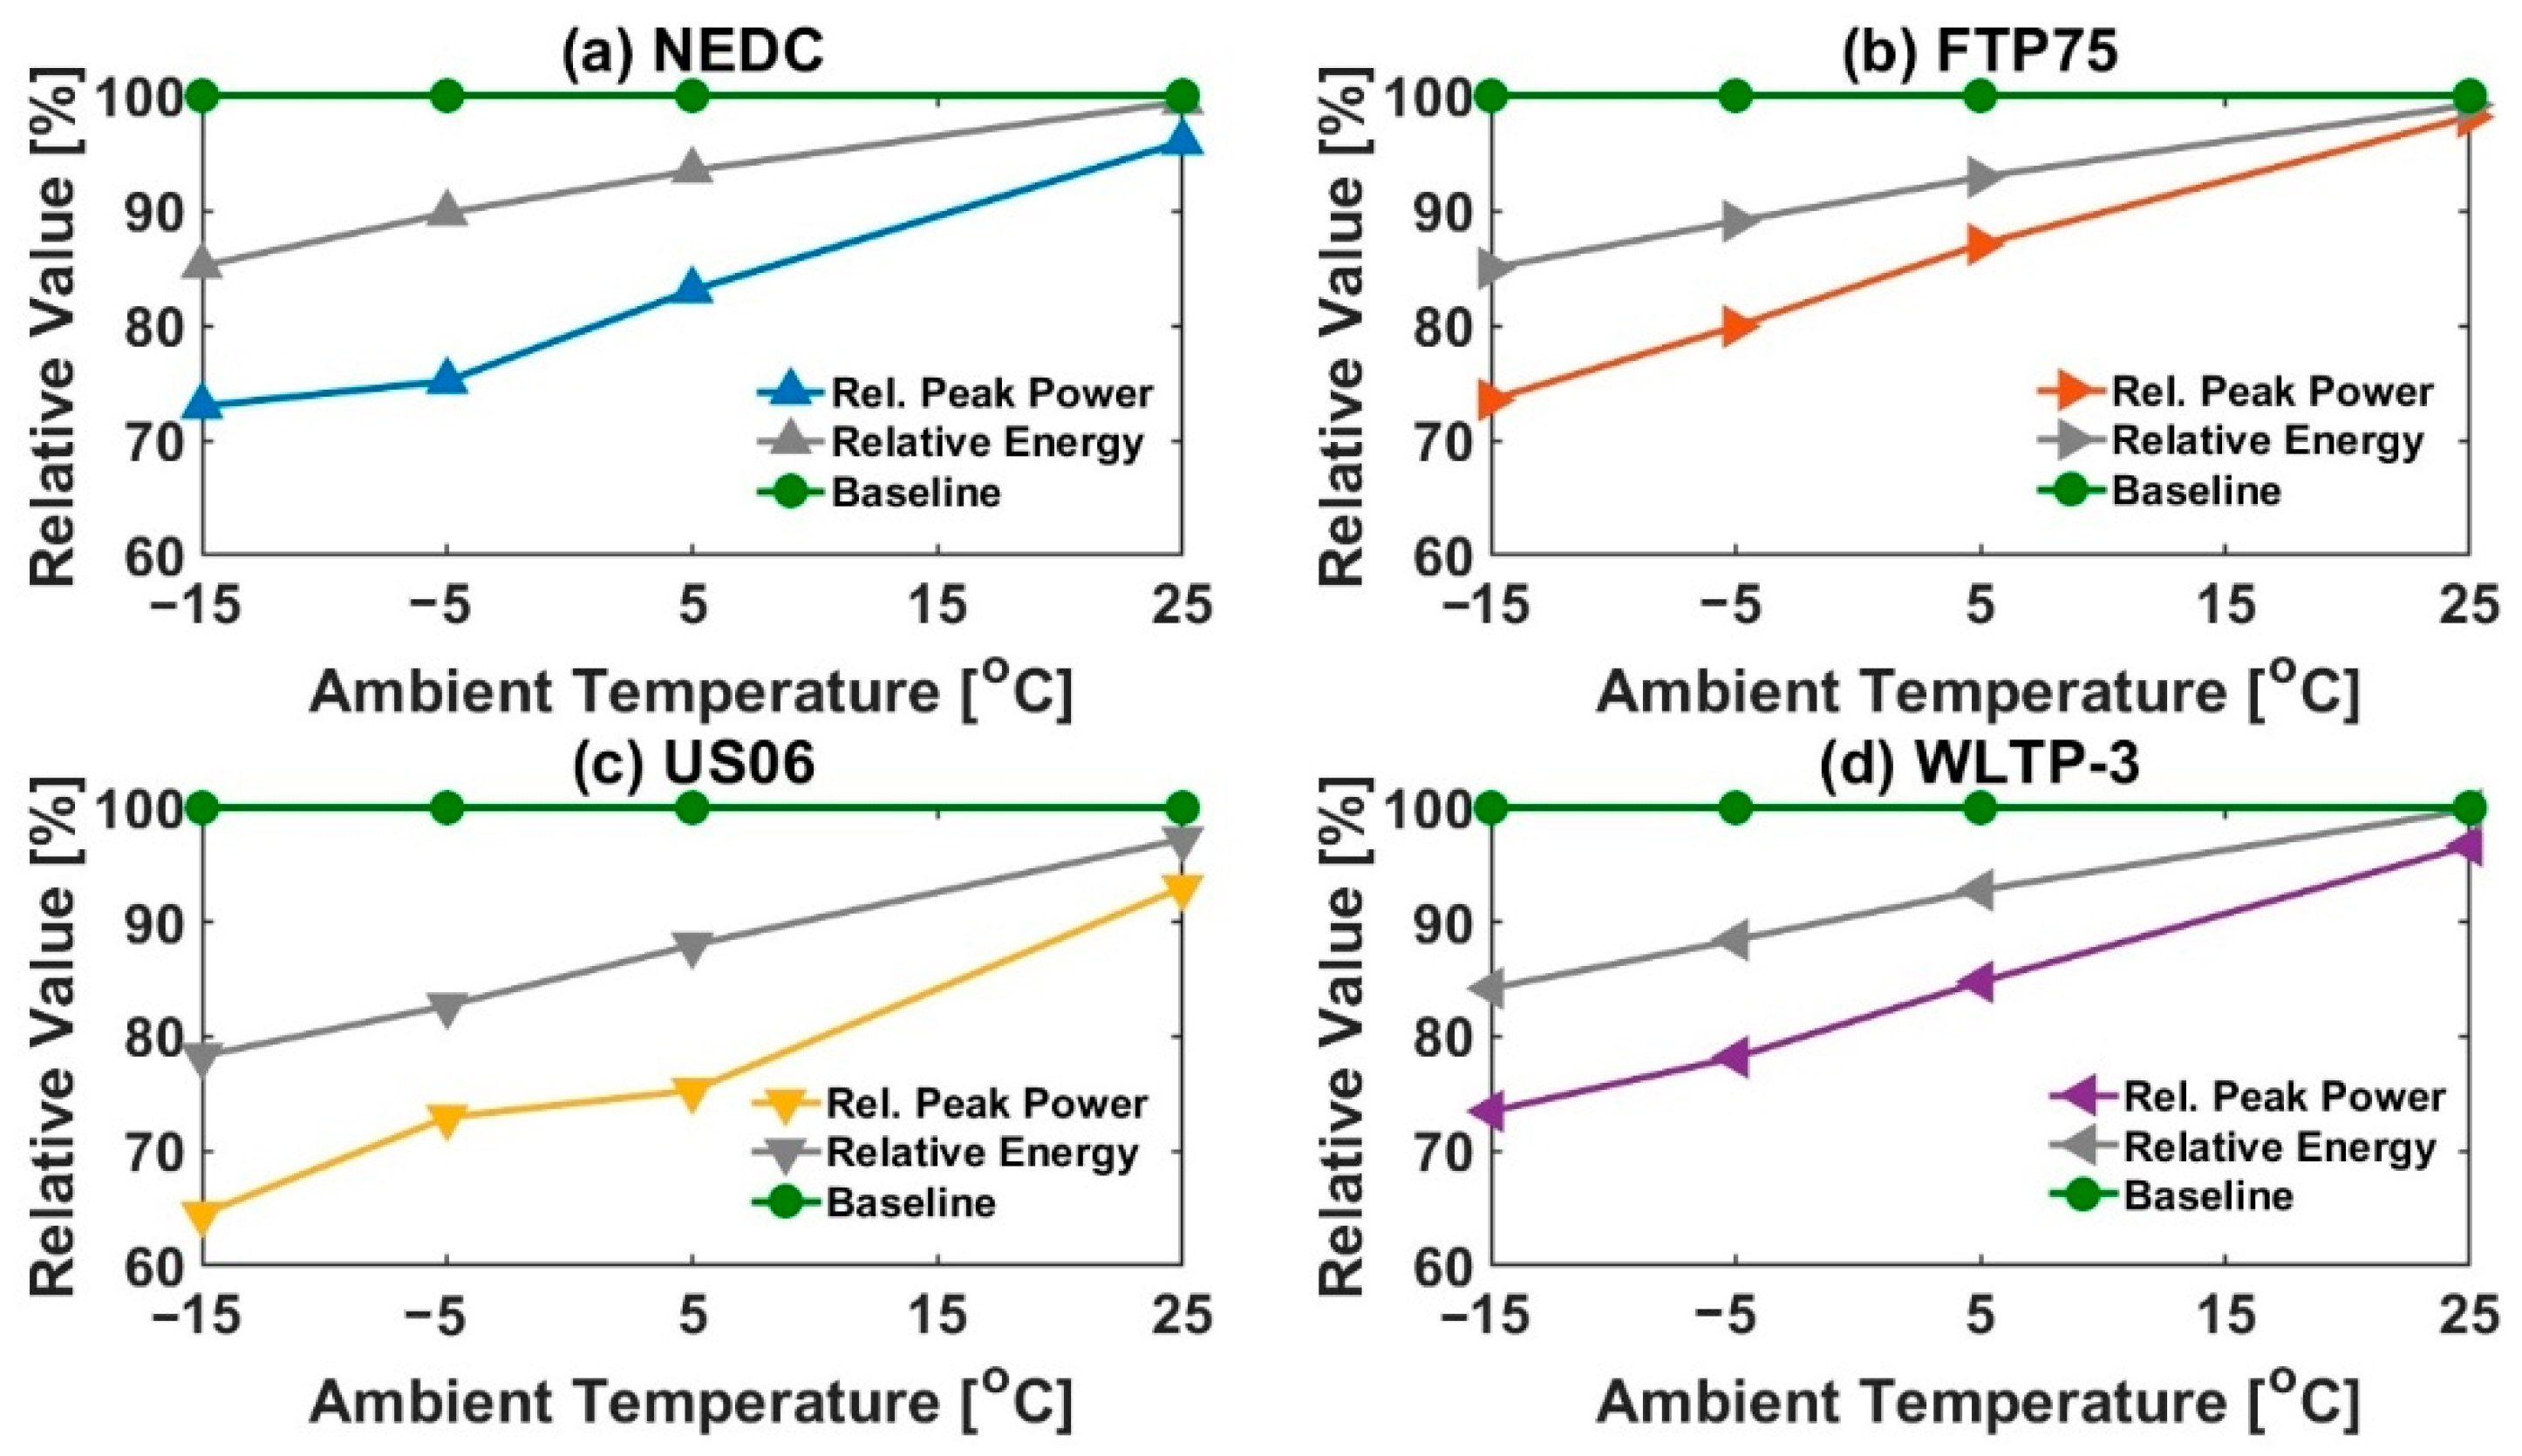
Figure 4.
Comparison between current profiles for power-based approach and current-based approach for NEDC at −15 °C ambient temperature and 65% starting SOC.
Figure 4.
Comparison between current profiles for power-based approach and current-based approach for NEDC at −15 °C ambient temperature and 65% starting SOC.

Figure 5.
Effect of power-based approach on voltage response of legislative drive cycles at 65% starting SOC and −15 °C ambient temperature: (a) NEDC, (b) FTP75, (c) US06 and (d) WLTP-3.
Figure 5.
Effect of power-based approach on voltage response of legislative drive cycles at 65% starting SOC and −15 °C ambient temperature: (a) NEDC, (b) FTP75, (c) US06 and (d) WLTP-3.

Figure 6.
Comparing relative peak current & relative capacity discharged from cell to baseline peak current and relative capacity demanded for various legislative drive cycles at different ambient temperatures for 65% starting SOC employing power-based approach: (a) NEDC, (b) FTP75, (c) US06 and (d) WLTP-3.
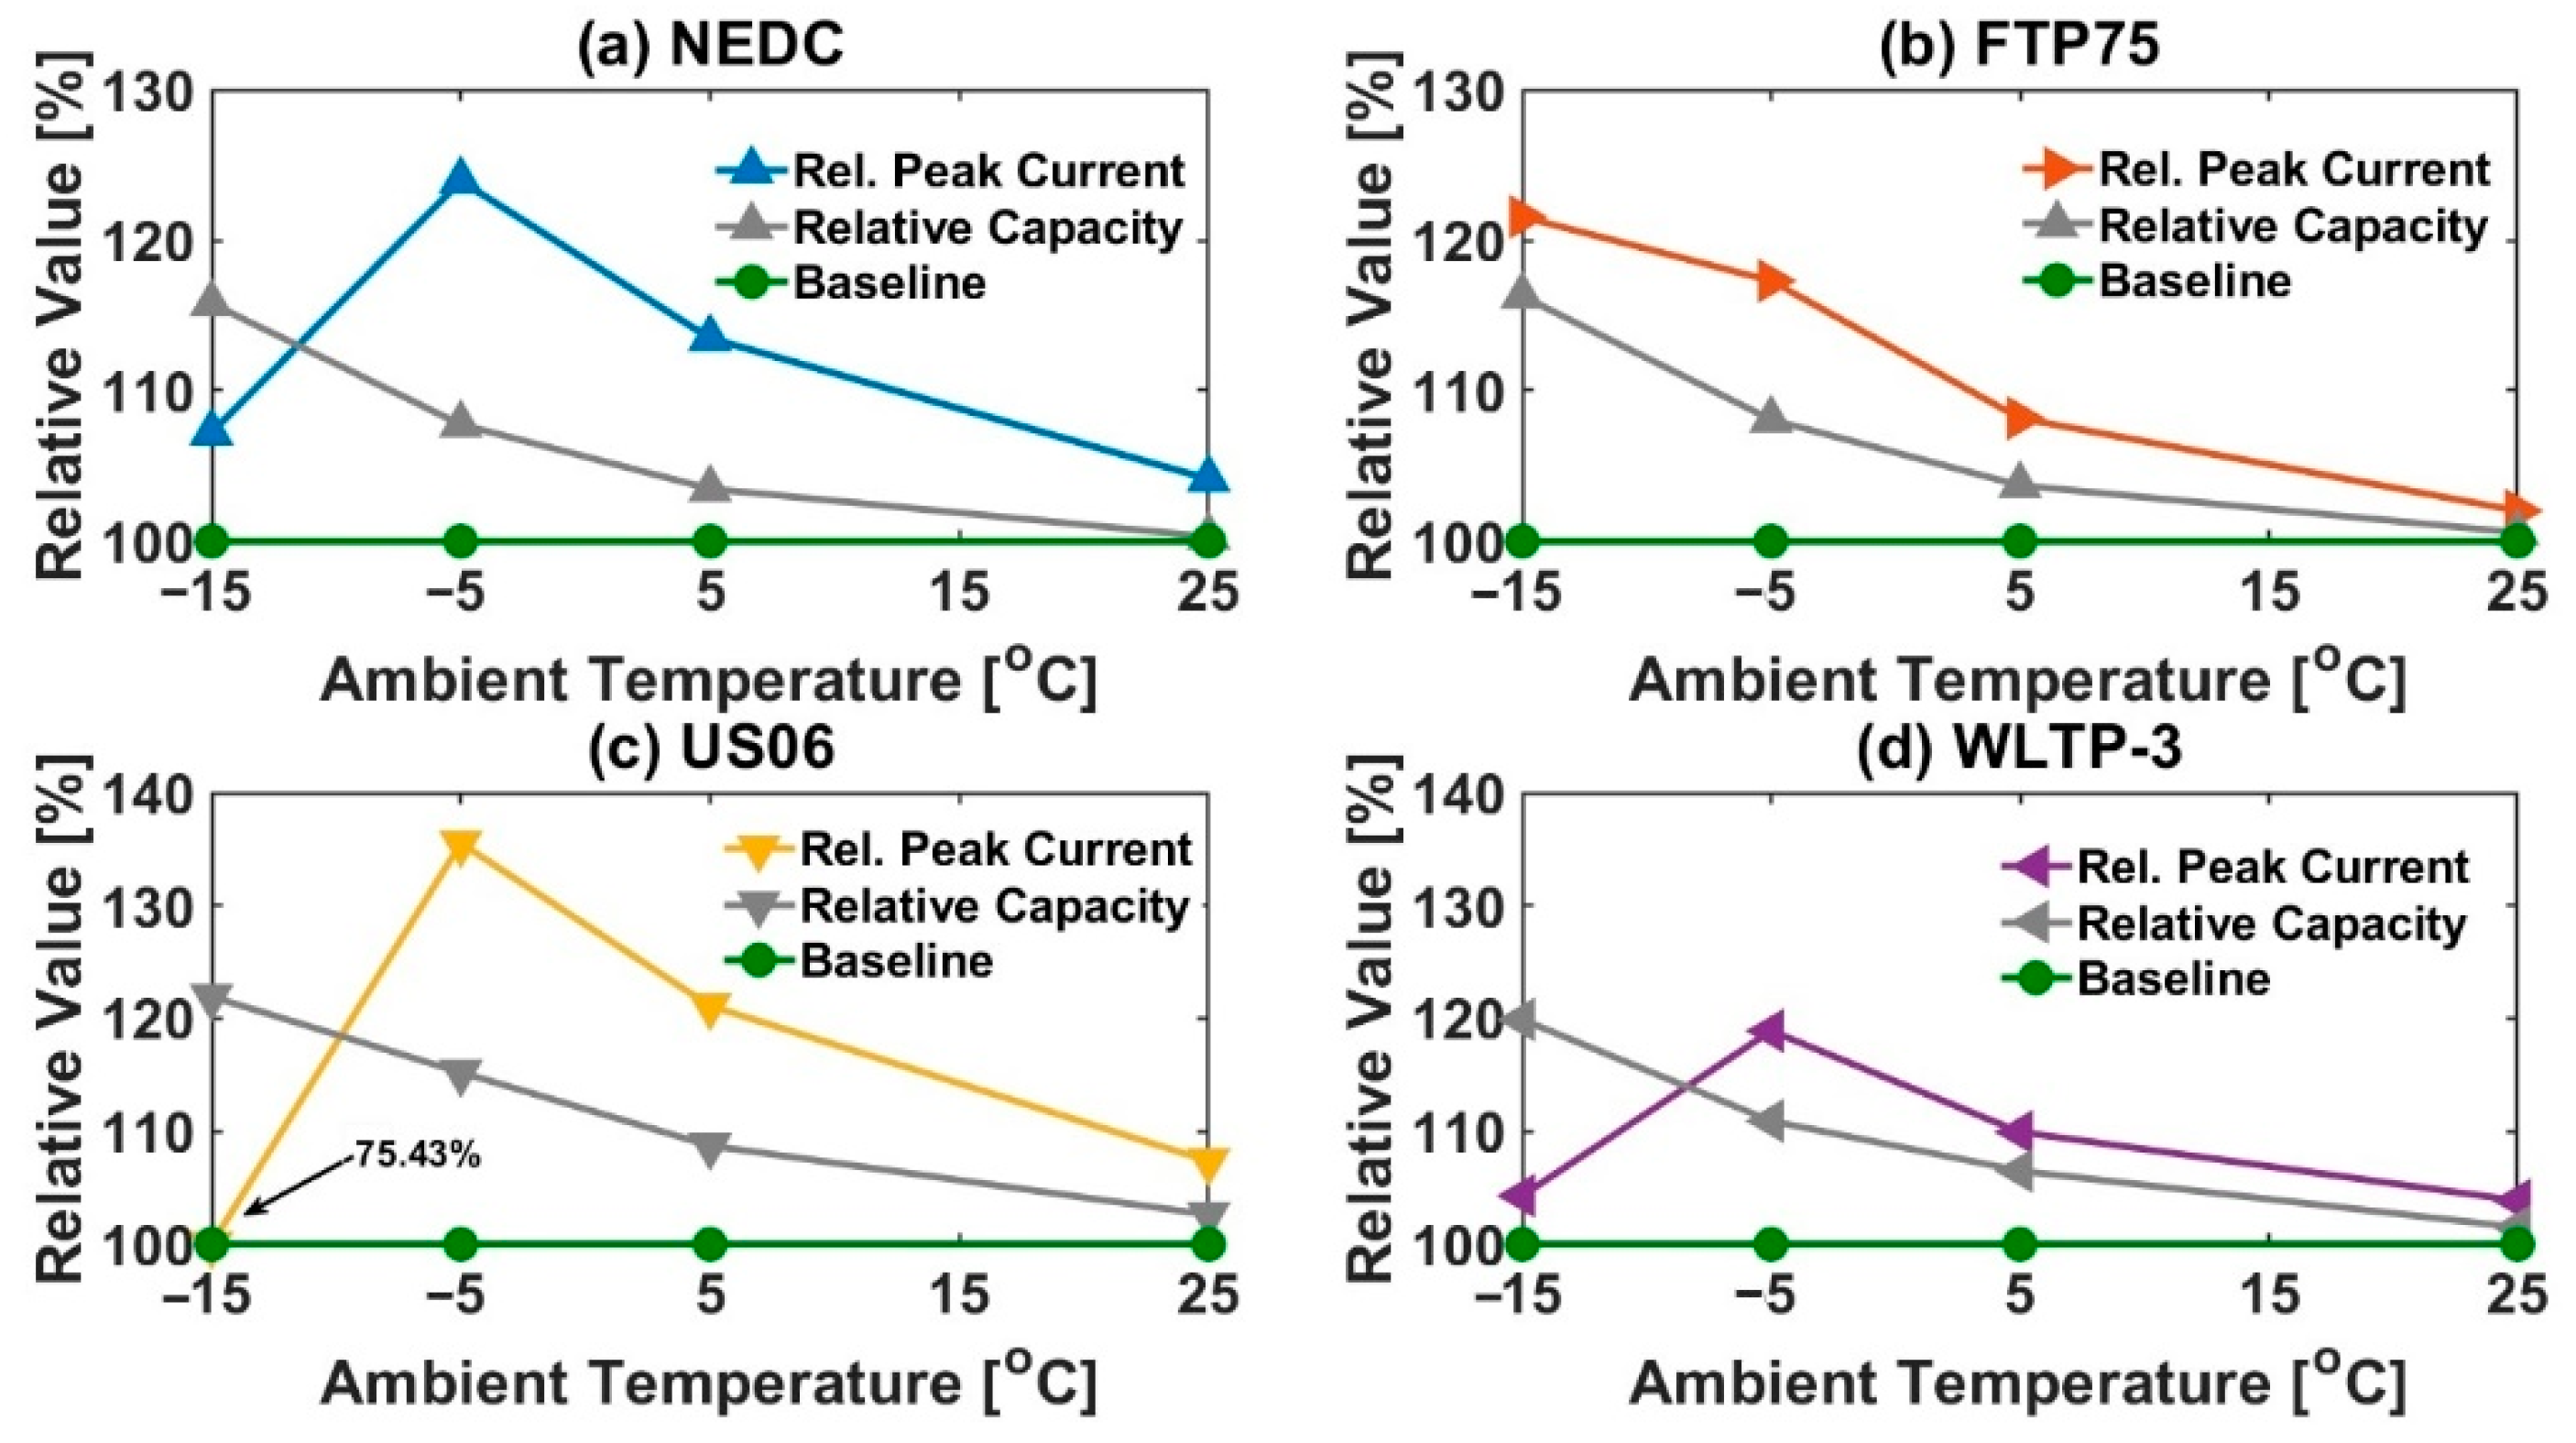
Figure 7.
Comparison between fixed nominal voltage and experimental voltage response for current-based NEDC at −15 °C ambient temperature and 65% starting SOC.
Figure 7.
Comparison between fixed nominal voltage and experimental voltage response for current-based NEDC at −15 °C ambient temperature and 65% starting SOC.

Figure 8.
Comparison of standard deviation from mean cell voltage (σ) for various ambient temperatures and legislative drive cycles for 65% starting SOC employing current-based and power-based approaches: (a) NEDC, (b) FTP75, (c) US06 and (d) WLTP-3.
Figure 8.
Comparison of standard deviation from mean cell voltage (σ) for various ambient temperatures and legislative drive cycles for 65% starting SOC employing current-based and power-based approaches: (a) NEDC, (b) FTP75, (c) US06 and (d) WLTP-3.

Figure 9.
Comparison between experimental and modelling (2RC) voltage profiles for current-based approach at 25 °C ambient temperature and 65% starting SOC: (a) NEDC, (b) FTP75, (c) US06 and (d) WLTP-3.
Figure 9.
Comparison between experimental and modelling (2RC) voltage profiles for current-based approach at 25 °C ambient temperature and 65% starting SOC: (a) NEDC, (b) FTP75, (c) US06 and (d) WLTP-3.
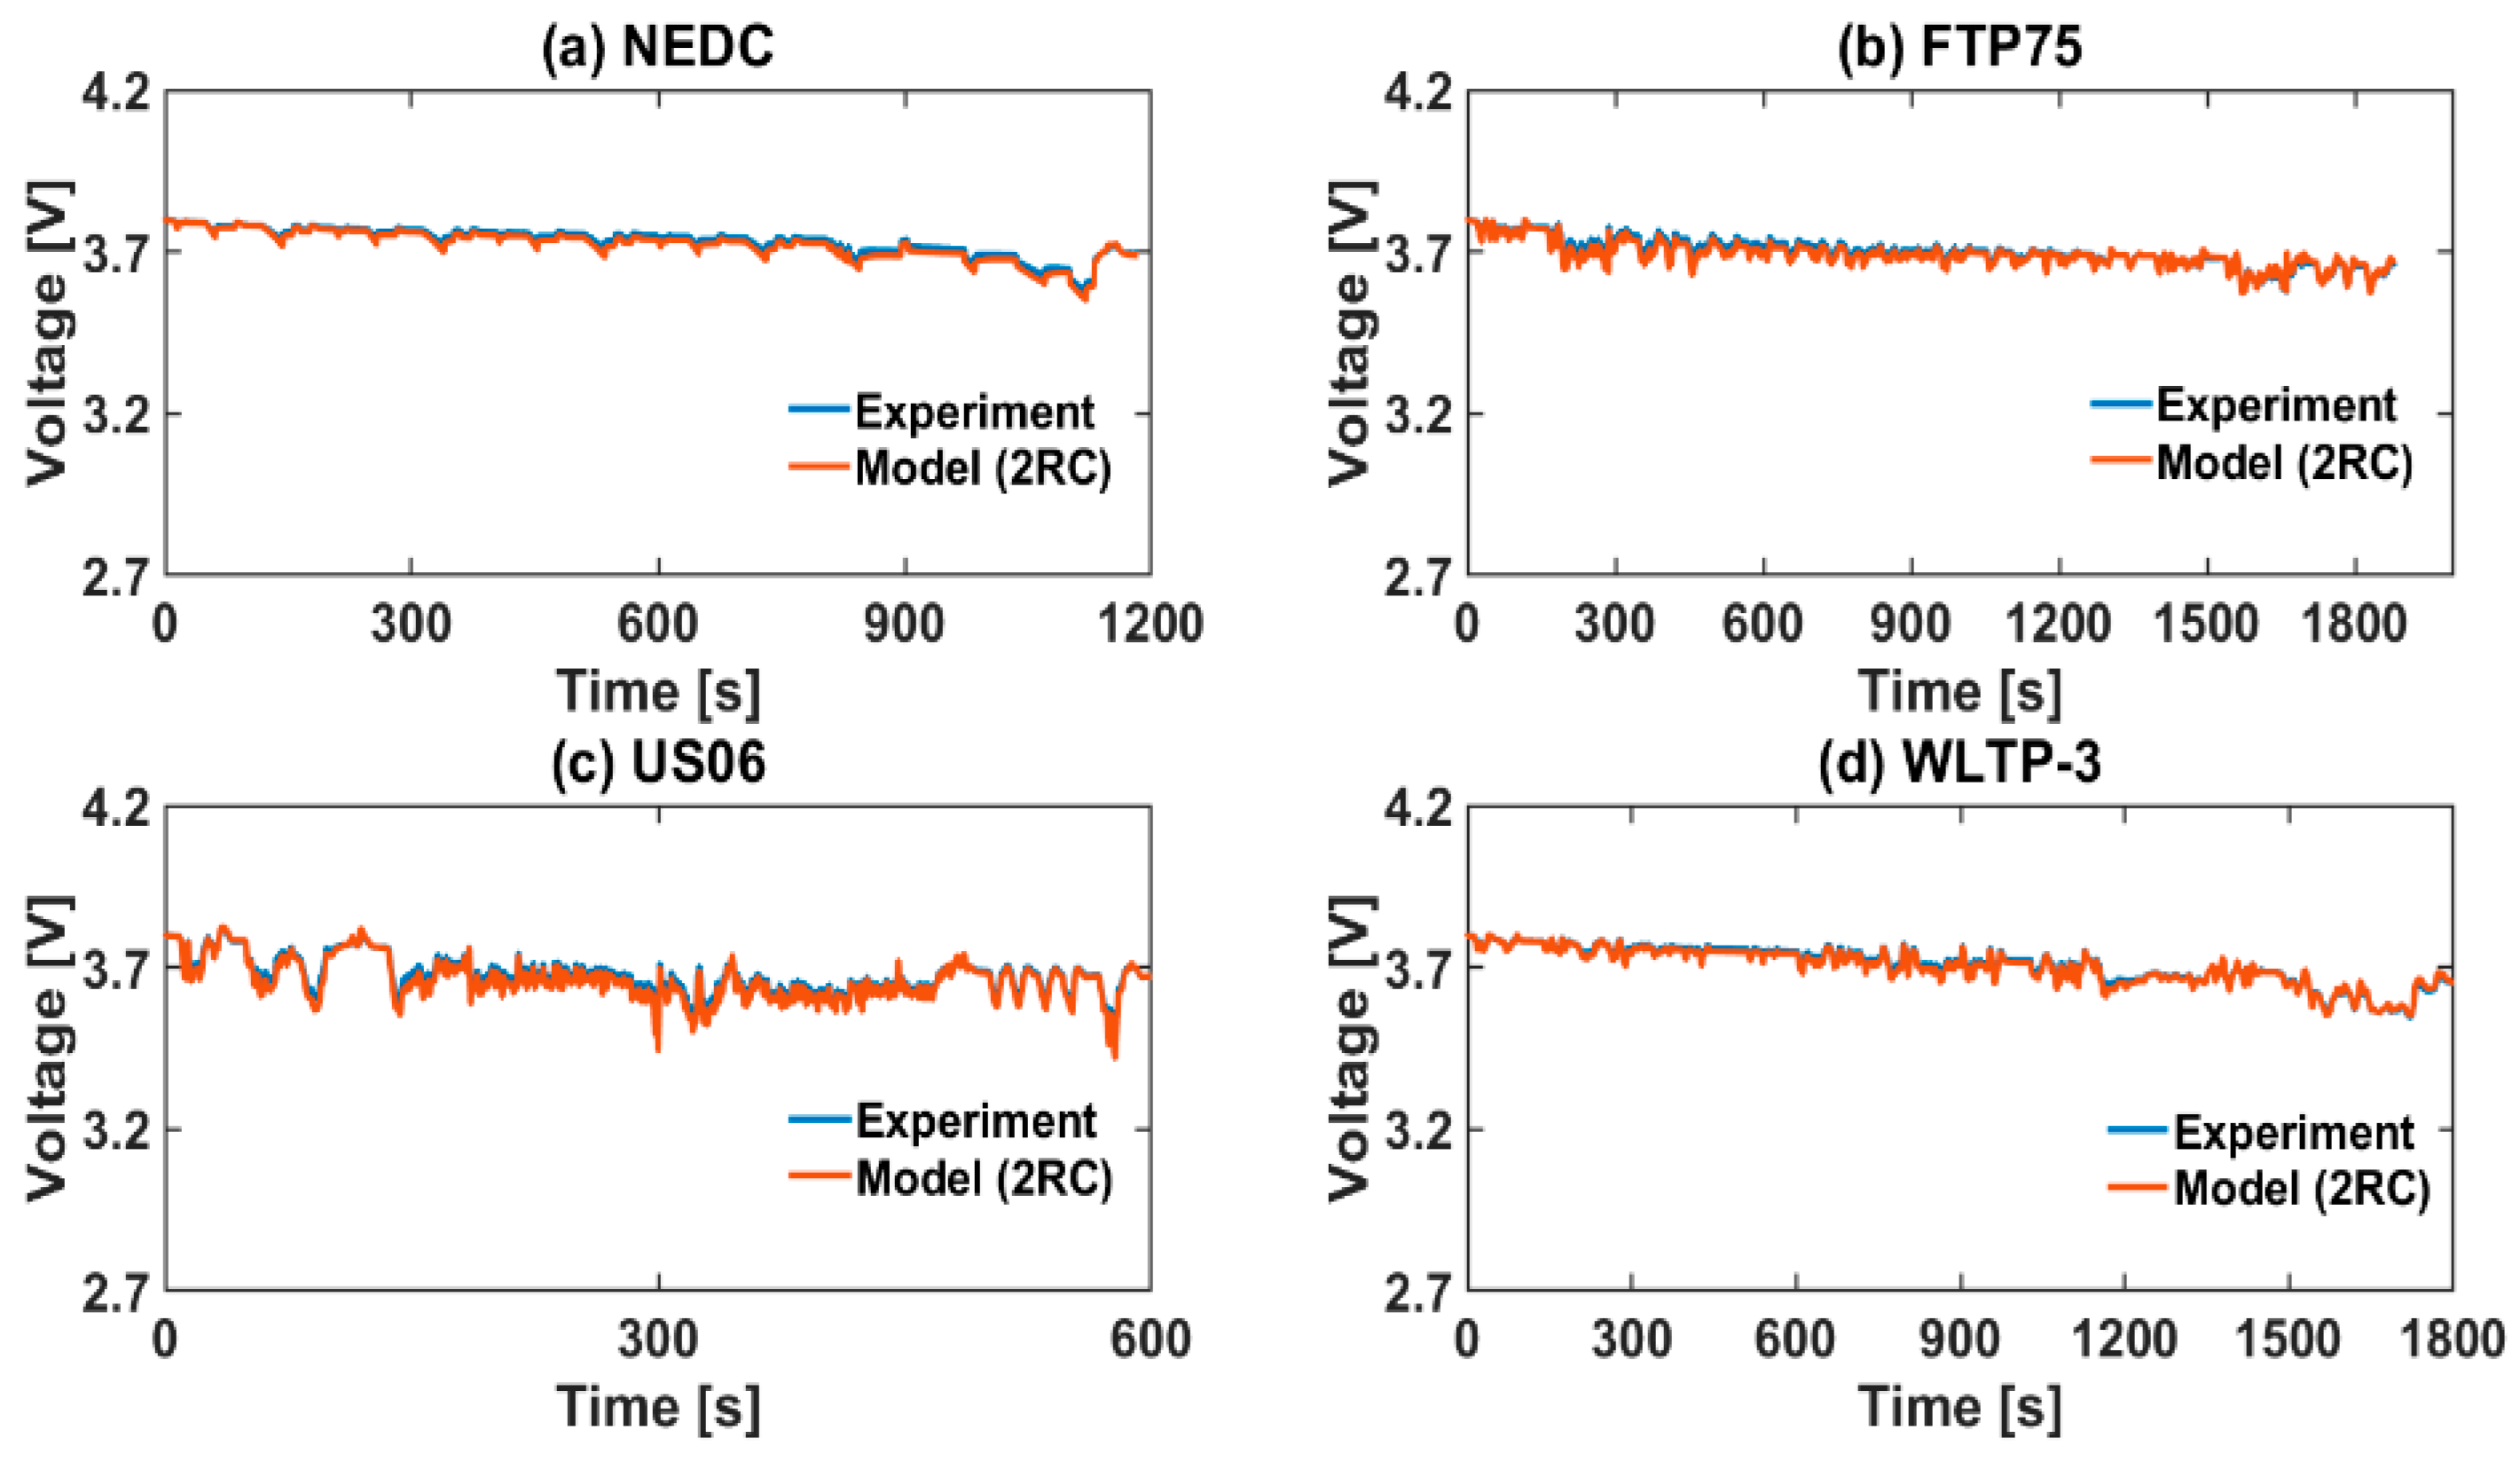
Figure 10.
Comparison of model accuracy (RMSE) for current-based (I (t)) and power-based (P (t)) approaches at low ambient temperatures for 65% starting SOC for various legislative drive cycles for ‘2RC’ ECM: (a) NEDC, (b) FTP75, (c) US06 and (d) WLTP-3.
Figure 10.
Comparison of model accuracy (RMSE) for current-based (I (t)) and power-based (P (t)) approaches at low ambient temperatures for 65% starting SOC for various legislative drive cycles for ‘2RC’ ECM: (a) NEDC, (b) FTP75, (c) US06 and (d) WLTP-3.

Figure 11.
Comparison of end SOCs for current-based (I (t)) and power-based (P (t)) Legislative drive cycles at different ambient temperatures for 65% starting SOC: (a) NEDC, (b) FTP75, (c) US06 and (d) WLTP-3.
Figure 11.
Comparison of end SOCs for current-based (I (t)) and power-based (P (t)) Legislative drive cycles at different ambient temperatures for 65% starting SOC: (a) NEDC, (b) FTP75, (c) US06 and (d) WLTP-3.

Figure 12.
Final operating temperature rise for both current-based and power-based profiles for different drive cycles at various ambient temperatures for 2nd order ECM: (a) NEDC, (b) FTP75, (c) US06 and (d) WLTP-3.
Figure 12.
Final operating temperature rise for both current-based and power-based profiles for different drive cycles at various ambient temperatures for 2nd order ECM: (a) NEDC, (b) FTP75, (c) US06 and (d) WLTP-3.

Table 1.
Performance Characteristics of 40 Ah Lithium-ion Pouch Cell.
| Maximum Constant C-Rate | Maximum Pulse C-Rate (10 s) | Nominal Voltage [V] | Upper Voltage Limit [V] | Lower Voltage Limit [V] | Operating Temperature Range [°C] |
|---|---|---|---|---|---|
| 8C | 10C | 3.7 | 4.2 | 2.7 | −20 to 60 |
Table 2.
Test Matrix for Pulse Power Characterization of Lithium-ion Pouch Cell.
| Ambient Temperature [°C] | SOC [%] | Discharge Pulse C-Rates | Charge Pulse C-Rates |
|---|---|---|---|
| −20, −10, 0 & 25 | 20, 50 & 80 | 0.1C, 0.2C, 0.5C, 1C, 2C, 5C, 8C & 10C | 0.1C, 0.2C, 0.5C, 1C, 2C & 3C |
Table 3.
Energy and Power Demands of Legislative Drive Cycles (Power-based Approach).
| Drive Cycle | NEDC | FTP75 | US06 | WLTP-3 |
|---|---|---|---|---|
| Duration [s] | 1184 | 1880 | 600 | 1800 |
| Distance [km] | 10.93 | 17.67 | 12.81 | 23.26 |
| Total Energy Required [Wh] | 19.00 | 30.71 | 23.15 | 32.19 |
| Energy Demand [Wh/km] | 1.74 | 1.74 | 1.81 | 1.38 |
| RMS Power Demand [W] | 83.71 | 86.61 | 212.92 | 98.28 |
| Peak Power Demand [W] | 337.04 | 346.03 | 801.97 | 32.53 |
Table 4.
Capacity & Current Demands of Legislative Drive Cycles (Current-based Approach).
| Drive Cycle | NEDC | FTP75 | US06 | WLTP-3 |
|---|---|---|---|---|
| Total Capacity Required [Ah] | 5.14 | 8.30 | 6.26 | 8.70 |
| Capacity Demand per km [Ah/km] | 0.47 | 0.47 | 0.49 | 0.37 |
| RMS Current Demand [A] | 22.33 | 23.31 | 55.94 | 26.30 |
| Peak Current Demand [A] | 91.09 | 93.52 | 216.75 | 89.87 |
© 2018 by the authors. Licensee MDPI, Basel, Switzerland. This article is an open access article distributed under the terms and conditions of the Creative Commons Attribution (CC BY) license (http://creativecommons.org/licenses/by/4.0/).
Share and Cite
MDPI and ACS Style
Tripathy, Y.; McGordon, A.; Low, C.T.J. A New Consideration for Validating Battery Performance at Low Ambient Temperatures. Energies 2018, 11, 2439. https://doi.org/10.3390/en11092439
AMA Style
Tripathy Y, McGordon A, Low CTJ. A New Consideration for Validating Battery Performance at Low Ambient Temperatures. Energies. 2018; 11(9):2439. https://doi.org/10.3390/en11092439
Chicago/Turabian StyleTripathy, Yashraj, Andrew McGordon, and Chee Tong John Low. 2018. "A New Consideration for Validating Battery Performance at Low Ambient Temperatures" Energies 11, no. 9: 2439. https://doi.org/10.3390/en11092439
Note that from the first issue of 2016, this journal uses article numbers instead of page numbers. See further details here.