Towards Zero Energy Stadiums: The Case Study of the Dacia Arena in Udine, Italy
by
 , ,
, ,
Mattia Manni
1 ,
,
Valentina Coccia
1,2,
Andrea Nicolini
1,2 ,
,
Guido Marseglia
3 and 
Alessandro Petrozzi
1,* 1
CIRIAF—Interuniversity Research Centre on Pollution and Environment “Mauro Felli”, 06125 Perugia, Italy
2
Department of Engineering, University of Perugia, 06125 Perugia, Italy
3
Research Department, Link Campus University of Rome, 00165 Rome, Italy
*
Author to whom correspondence should be addressed.
Energies 2018, 11(9), 2396; https://doi.org/10.3390/en11092396
Submission received: 13 July 2018
/
Revised: 3 September 2018
/
Accepted: 4 September 2018
/
Published: 11 September 2018
(This article belongs to the Special Issue Sustainable Energy Development Strategies: Energy Efficiency and Renewables)
Abstract
:The environmental impacts of sport events have been growing during the last decades, which has led to the organizing associations developing adequate countermeasures to both reduce carbon emissions due to construction and operational stages compensate for the emissions. This work aims at proposing an approach to stadiums energy enhancement that includes strategies largely recognized as effective and applicable to several building typologies (residential, commercial, academic, etc.). The selected case study is the Dacia Arena in northern Italy that has been recently refurbished and renovated. The proposed workflow has as a goal minimizing the increment of the operational emissions, caused by new heated areas in the stadium. Firstly, the energy consumption was estimated in dynamic state for Scenario 0 (current state) and Scenario 1 (refurbished state) to quantify the new plant’s energy demand. Secondly, two hypothetical system layouts were proposed and evaluated. In the first, the power for lighting, cooling and heating is supplied by a system that couples photovoltaic panels with heat pump. In the second, the same photovoltaic plant is integrated with a biomass plant and an absorption chiller. The comparison highlights the suitability of those interventions and the environmental advantages deriving from their exploitation.
1. Introduction
The buildings’ environmental impact on global energy demand and carbon emissions released in atmosphere have been constantly monitored during the last decades due to their significant increment. Over 40% of global energy consumption and about 18% of greenhouse gas (GHG) emissions are related to the building sector [1]. The current regulations concerning the reduction of building’s energy consumption focuses mainly on the operational phase [2,3,4]. The European Directive 28/2009 defines the strategic goals which should be achieved by 2020 [5]: (i) an increment by 20% of the energy derived from renewable energy sources (RES) on operational energy consumption; (ii) a reduction by 20% of the GHG emissions during the operational stage compared to the values in the 1990s; and (iii) an increment by 20% in terms of buildings’ energy efficiency. Furthermore, the declaration of intents stated that GHG emissions’ reduction should reach 30% by 2030 and a 50% by 2050, although the first percentage was revised up by 10% by a Communication of the European Commission on 2014 [6]. The World Green Building Council 2017 Report states that every building has to be carbon neutral by 2050 to maintain the global temperature variation within a range of 2.0 °C [7]. The document confirmed part of the declaration of intents signed at the end of the 21st Conference of the Parties, in Paris on 2016 [8].
Among all building typologies, stadiums are the ones which have achieved the highest increment of environmental impact: sports arenas have been getting continuously larger and complementary functions have been added to sport practicing (museums, stores, restaurants, and concerts). Furthermore, the most famous sport events, such as Olympic Games, FIFA World Championship or Super Bowl, attract more and more people every time, making necessary larger spaces to permit hosting more spectators. According to the data presented by Smulders and Imtech Building Service about European sports infrastructures, more than 4000 stadiums exploit up to 40 TWh/year, which are mainly generated from conventional fossil fuels [9]. A modern medium-sized stadium (55,000 spectators) reaches an energy use of 10,000 MWh/year which equals 3600 tCO2/year [10,11]. During the principal sports events, the arena’s energy consumption could achieve a level comparable to an African country: the 80,000-seat arena hosting the Super Bowl consumes up to 10 MW per hour of energy during the peak, which equals to 50 MW over the course of the game itself [12]. Liberia, a 43,000 square-mile country with four million people, has the capacity to pump less than a third of such a power into its national grid [13].
The increment of the arenas’ energy demand is also due to extended opening hours of the facilities. Indeed, contemporary stadiums do not open only on match day, but also host museums dedicated to the home-team and its history; sports stores, which promote the home-team’s brand; restaurants; supermarkets; and playgrounds for the youngest supporters. Those activities guarantee an important cash flow that is fundamental for the economic management. As long as the economics are concerned, the Italian government promoted a decree regarding sports infrastructure development and recognized compensation strategies [14]. Hence, it is possible to counterbalance the increased energy requirements due to extra opening hours by installing on-site power plants for energy production from renewable sources. Furthermore, the produced energy that is not directly used can be inputted to the grid and delivered to the neighborhood.
This research investigated the state of the arts regarding technologies which can be applicable to sports infrastructures to both reduce GHG emissions and produce renewable energy on-site. How the extra functions, which are nowadays hosted in modern sports infrastructures, affect the building energy demand was evaluated. Finally, a cluster of actions was proposed for the architectural restoration and energy refurbishment of the Dacia Arena in Udine (Italy). The case study was also modeled with specific software for energy dynamic simulations to evaluate the different scenarios.
1.1. Stadiums and Sustainability: From Timber Recyclable Structure to Qatar 2022
Although most available technologies to restrain energy use and CO2 emissions are not specifically developed for stadiums, they can have a much higher impact if implemented in sports arenas. Constructing stadiums energetically autonomous, or even able to generate extra-energy exploited by the surroundings, represents a fundamental step towards zero-emission arenas.
The suitability of eco-friendly materials such as partially-recycled concrete or glued laminated timber, has been successfully tested in stadiums recently. A joint proposal [15] couples the advantages due to glulam exploitation with the modular design of small- and medium-sized stadiums (5000–20,000 spectators). This includes up to the 80% of arenas. Thus, their energy refurbishment could have a larger impact. Such a green facility can be integrated with wind plants, photovoltaic systems and high-efficiency LED lighting devices. Furthermore, the modularity of its components allows rapidly upgrading the building and increasing its capacity without demolishing and rebuilding process. The whole stadium can also be easily disassembled and reassembled in a different area, reducing the carbon emissions from waste disposal.
Famous sports events, e.g., FIFA World Championship, usually encourage sustainable technological progress by incrementing each time the energy performance levels required to infrastructures. The 2022 FIFA World Championship, which will happen in Qatar, is challenging because of the hot climate-related issues faced by designers and planners. The Qatar Football Association (QFA) has to guarantee an adequate thermal comfort to both players and spectators by developing low carbon cooling systems, thereby lowering the ecological footprint. FIFA requires at least an air temperature equal to 25 °C in all the hospitality areas of the stadium, compared to the 46 °C ambient reached during the local summer season. The research carried out by Sofotasiou [16] presents a preliminary state of the art regarding the potential cooling strategies that can be applied to sports arenas. Furthermore, it estimates the cooling load for semi-outdoor stadiums in Qatar. The results underline how an oculus roof combined with a peripheral continuous opening could increase local ventilation rates. The proposal can even be integrated with an evaporative cooling technique from Middle Eastern countries (badger wind tower) [17]. The wind tower takes advantage of the Venturi effect [18] to create an air route over a wetted surface (in this case, the football pitch) to deliver cool air. Differently, adequate comfort conditions could be guaranteed by applying active systems powered by renewable energy sources (e.g., photovoltaic plant, solar panels, etc.). Solar panels (SP) seem to be more efficient than photovoltaic (PV) plants in hot-humid climates, as demonstrated by the study conducted by Aly [19]. The main advantage of using SP instead of PV is due to their efficiency. Indeed, for every degree Celsius above 25 °C of outdoor temperature, PV’s performance turns out to be reduced by 0.25–0.45% [20]. This tendency cannot be omitted in a hot climate country such as Qatar, where temperatures reach an average value equal to 33.4 °C.
The proposal by Arup Associates considers installing solar thermal collectors, which warm up the heat transfer fluid up to 200 °C. Then, its thermal energy is exploited in cooling cycle including absorption chiller and cooling desiccants [21]. It permits delivering air at 23 °C even when outdoor temperatures reach 44 °C. Nevertheless, there are still few uncertainties regarding this proposal since it needs at least four days to reach the comfort zone, even though it is a 500-seat arena. Furthermore, the cooling process tends to be worsened when strong wind patterns prevail, as demonstrated by computational fluid dynamic (CFD) simulations [22,23].
The FIFA directives about carbon emissions allow hosting countries to offset GHG emissions by promoting practices aiming at prevent them (i.e., compensation strategies). Those strategies were included on a specific master plan, “Green Qatar 2022”. The guidelines state that carbon neutral target of the event could be achieved by: (i) nulling the dependency from hydrocarbon resources; (ii) installing solar panels either integrated or located in buildings’ proximity; (iii) using balancing strategies to compensate the energy demand during the event with surplus electricity exported to the national grid; and (iv) exploiting the recovered heat on water distillation process [24,25,26].
1.2. FIFA World Championship, Towards Russia 2018
The FWC is the largest single-event sporting competition in the world [27] having significant effects on society, economy and environment of the host country, which leads the association to activate the “Football for the Planet” program that aims at mitigate negative environmental impacts by increasing event sustainability. The first step towards this greener policy was registered during the 2006 Germany FWC: it was the first tournament in which measurable environmental targets were set and monitored [27,28]. The most important strategies that have been applied since 2006 aim at offset the carbon footprint of both FWC (FIFA World Championship) events and FIFA (considered as organization) [29]. The main ones regard the realization of plants to generate electricity from sewage gas in South Africa (2006) to offset 92,000 tCO2; the installation of solar panels in 20 Football for Hope Centers across Africa (2010); and the reforestation project in Columbian Andes that permits to offset 9000 tons of GHG emissions by planting 35,000 trees (2011). Furthermore, from January 2012, FIFA has offset all its flight emissions (75% of its total emissions) through compensation projects in all FIFA zones.
A different approach was followed during the 2010 South Africa FWC, when the committee had great difficulties on realizing offsetting projects. Hence, they preferred to organize a low-carbon event [30]. Besides these actions, FIFA promoted the calculation and analysis of its annual carbon footprint: the first comprehensive assessment in 2009 estimated it equals 48,500 tCO2-eq per year [31]. A second evaluation limited to a single event (2010 South Africa FWC) states that total carbon emissions are 41,405 tCO2-eq. However, the calculation does not include the emissions due to transport of ticket holders as well as official venues, which significantly impact the result, as demonstrated in the 2014 Brazil FWC report. In that case, the carbon footprint reached 2,723,756 tCO2-eq by including these parameters (ticket holders transportation and official venues). To reduce this environmental impact, FIFA and Local Organizing Committee (LOC) are implementing: (i) GHG emissions compensation strategies; (ii) green stadiums design; and (iii) waste management in sports arenas.
The environmental goals included by FIFA and Brazilian LOC in the agreements were achieved through the design of sustainable venues, along with the definition of compensation strategies described on the previous paragraph. Concerns from FIFA and complaints from critics were shown regarding the economic sustainability and the unnecessary waste of money to build an excessive number of arenas. Indeed, the LOC insisted they wanted 12 host cities (12 new venues), whereas FIFA usually requires not more than eight [32]. However, this paragraph ostensible focuses on systems and plants installed in stadiums to improve their energy performances. Further information regarding the use of funds from FWC’s organization can be found in [32,33].
Among the Brazilian stadiums, Estádio Castelão was the first to be awarded the Leadership in Energy and Environmental Design (LEED) certification [34], whereas Estádio do Maracanã, Estádio Mineirão and Arena Pernambuco installed plants to exploit RES and minimize their energy demand. The Maracanã (78,000 seats) is equipped with a Building-integrated Photovoltaic (BiPV) system that is composed of 1500 PV cells placed on the roof. The plant allows reducing emissions by 2600 tCO2-eq by powering 390 kWp, which meets the energy demand of 240 single-family houses (when it is not match-day) [35]. Larger plants were installed on two other stadiums in Belo Horizonte and Recife, which can reach peak powers of 1.5 MWp and 1 MWp, respectively [36,37]. Furthermore, the LOC decided to evaluate alternative and less common solutions. Specially developed tiles were placed under the turf (56 mm) to convert the kinetic energy of players’ movements into electricity. The technology had already been tested in train stations in Europe [38], shopping centers in Australia [39] and Terminal 3 of London’s Heathrow Airport [40]. Indeed, the average footstep generates five watts per second. The system is coupled with PV panels providing the necessary lighting to the pitch [41].
1.3. European Football Championship 2016
The Union of European Football Associations (UEFA) demonstrated to take particular care of environment related issues during the continental championship. During the last European Cup in France, innovative and sustainable arenas were constructed in Lyon, Lille, Bordeaux and Nice (Figure 1) [42]. The planners achieved the reduction of the stadiums’ impact by increasing the events which could be hosted in addition to the football championship. The Pierre-Mauroy Stadium and the Allianz Riviera, in Lille and in Nice, respectively, can be turned into amphitheaters for concerts and similar events to improve the economical sustainability of the arenas. Furthermore, the new constructed stadiums are well integrated on the landscape, and they are provided with systems powered by RES such as PV plants or geothermal heating systems coupled with natural ventilation (Table 1).
1.4. Italian Stadiums
The process of renovation and construction of Italian stadiums started recently. Juventus F.C., A.C. Chievo Verona, Hellas Verona F.C., and Cagliari Calcio are the only teams in the Serie A which have already enhanced their arenas in Turin, Verona, and Cagliari, respectively. Atalanta B.C., F.C. International Milan, A.C. Milan, and A.S. Rome have started the same procedure to improve their stadiums (Table 2).
The Bentegodi Arena in Verona is the first Italian stadium to be partially covered. The 42,000-seat arena is provided a PV plant integrated on the roof that powers up to 1 MW with its 13,300 panels [48]. The PV system allows reduces emissions by 550 tons of CO2 and supplies energy equal to the consumption of 350 families. The Allianz Stadium in Turin was realized after the old Delle Alpi Stadium had been partially demolished. The new arena was built in the same area and some of the materials and structures from the previous building (i.e., concrete, aluminum, steel, and copper) was employed, which achieved a reduction in terms of environmental impact and economics, saving up to 2.3 million of euro. Furthermore, the energy consumption is partially covered by integrated solar panels coupled to PV modules. The first covers the heating energy requirements by delivering hot water with a district network; the latter powers up to 100 kWp [49].
2. Materials and Methods
2.1. Dacia Arena in Udine, Italy
The case study investigated in this research is Dacia Arena in Udine (Italy): it is the 23rd stadium in terms of capacity in Italy (25,144 seats). The venue was inaugurated in 1976 and it is characterized by an arched roof over the West Gallery—the only covered part of the original configuration. Its shape remained constant throughout all restorations and retrofits until 2013, when the infrastructure was completely renewed. The enhancement actions aimed at design a secure, modern and sustainable arena that could reach the fourth UEFA certification category. Among the structural and energy interventions, it is worth mentioning: (i) the enhancement of window frames; (ii) the design of the snow melting heating system below the playing pitch that is powered by a thermal power station (TPS) and regulated by a secondary station; (iii) the installation of an air source heat pump (ASHP) for heating and cooling the daily used areas in the West Gallery; and (iv) the demolition and reconstruction of the north, east and south sectors, which are covered by a continuous roof. Figure 2 reports the venue’s layout before and after the last restoration.
The reduction of the energy consumption as well as operational costs was achieved using a Building Automation system to optimize the arena’s management. Furthermore, modern lighting appliances and motion sensors were installed, decreasing the energy demand for lighting by 20%. Similarly, polycarbonate panels have been placed on the last 11 m of the roof to permit daylight reaching galleries and spectators.
The TPS and the ASHP were coupled to fit daily use and match-day energy requirements for heating and cooling. The TPS reaches a net power of 1380 kW and it powers the indoor heating system and the domestic hot water (DHW) that is warmed to 60–65 °C. A secondary station regulates the thermal power exploited for the snow melting system that is placed 27–30 cm below the football pitch. The exhausted gases are finally expelled from a cluster of grills integrated on the roof edge. The technical specifications for the football pitch’s heating system are reported in Table 3.
The ASHP was installed to cover the heating and cooling energy demand in the daily lived areas. They are all located in the West Gallery and they require a heating and a cooling power equal to 303.5 kW and 174.4 kW, respectively. The zones served by the ASHP are: (a) the locker rooms; (b) the administrative building, which is actually a separated volume but is connected to the same heating system; (c) the medical center; and (d) the fourth level of the West Gallery hosting a cafeteria and a break room.
2.2. Dynamic Simulation Settings
Dynamic simulations were conducted through Design Builder (DB) software, a specific tool that exploits Energy Plus engine to estimate building’s energy demand. First, the thermal loads which characterize the model were estimated. They were grouped into two main categories (outdoor and indoor thermal loads), as described in Table 4.
The analyses permitted estimating the energy demand in summer and winter conditions. They were calculated by considering different equations: the transient regime was applied to summer conditions (Equation (1)), whereas the steady regime was preferred for the winter conditions (Equation (2)).
The negative terms stand for the thermal outflow, whereas the positives stand for the thermal inflow. The Qwinter calculation does not include all the contributions (Qpers, Qappl, Qlight, and Qother) which can positively affect the heating energy demand. It permits estimating the energy consumption by considering the worst conditions in which the plant could operate. Furthermore, the values included in the calculation in winter conditions do not vary depending on time, but they are included as their maximum (steady regime). Hence, the heating system can be designed without risk of being undersized [52].
Then, the outdoor and indoor environmental conditions were defined. The following outdoor conditions were identified: (i) air temperature’s trend; (ii) relative humidity; (iii) wind velocity; and (iv) solar radiation. The data were suggested from specific Italian regulations such as UNI 10349 [53,54] since it was not possible to collect them using weather stations. The indoor conditions were defined based on the functions which are hosted in the facilities. An air temperature ranging from T = 20 ± 1 °C (winter conditions) to T = 26 ± 1 °C (summer conditions) should be guaranteed, whereas the relative humidity was set to 50 ± 10% through the whole year. The ventilation is characterized by an inlet air velocity that ranges between 0.05 m/s and 0.40 m/s. Thus, an average value equal to 0.15 m/s was considered. The Air Change per Hour (ACH) value was evaluated considering the user concentration rates as well as room volumes.
Table 5 and Table 6 summarize the information about localization that was included in the assessment. The values were obtained from Energy Plus database.
The DB model was integrated with information about the users’ pattern to conduct an accurate simulation in transient regime, in which energy demand varies along with outdoor conditions.
The heating system installed on the playing pitch is automatically activated by the managing system every time the temperature drops below the set-point. This value depends on the location and corresponds to the frost point: in this case, it equals 0.5 °C, and is achieved around 05:00. The temperature sensors, which activate the system, work only in proximity of practice and match days. In particular, during the two football seasons after their installation, it was observed that the heating system operated 32 (2014–2015 season) and 27 (2015–2016 season) times, respectively.
The areas in which the arena is divided are not used with the same frequency and must be considered when energy demand is estimated. They can be grouped into two clusters that are served by two different heating systems. The first group includes all those rooms which are exploited during match days: (a) offices for both UEFA and Lega Seria A functionaries; (b) several restoration areas; (c) VIP zones; (d) conference room; (e) media center; and (f) zones hosting other match days’ services. Adequate indoor comfort conditions are guaranteed by a 1380 kW heater powered by methane. In the second category, the daily used spaces are included: (g) locker rooms; (h) administrative offices; (i) the medical center; and (j) the fourth level of the West Gallery where a cafeteria and a break room for players are placed. All those areas are served by the ASHP, which is daily exploited.
A summary of the zones and their utilization are reported in Table 7 to give a complete overview of the use pattern.
2.3. Investigated Scenarios
Two scenarios were simulated in DB: Scenario 0 and Scenario 1.
Scenario 0 corresponds to the present arena configuration. It was modeled: (i) to verify the systems’ declared performance levels; (ii) to identify over- or under-sized plants; and (iii) to define a basis for comparing Scenario 1. In this paper, only (iii) is discussed since it permits estimating the extra energy demand due to the new facilities added to the arena. The discussion of both (i) and (ii) can be found in [52]. Scenario 0 configuration is the one described in the previous section. Most zones located under the West Gallery are served by the methane-TPS, whereas the remaining daily-used areas are heated (or cooled) by the ASHP. The modeling stage was conducted after the stadium was inspected to acquire information regarding structural packages as well as systems’ layout.
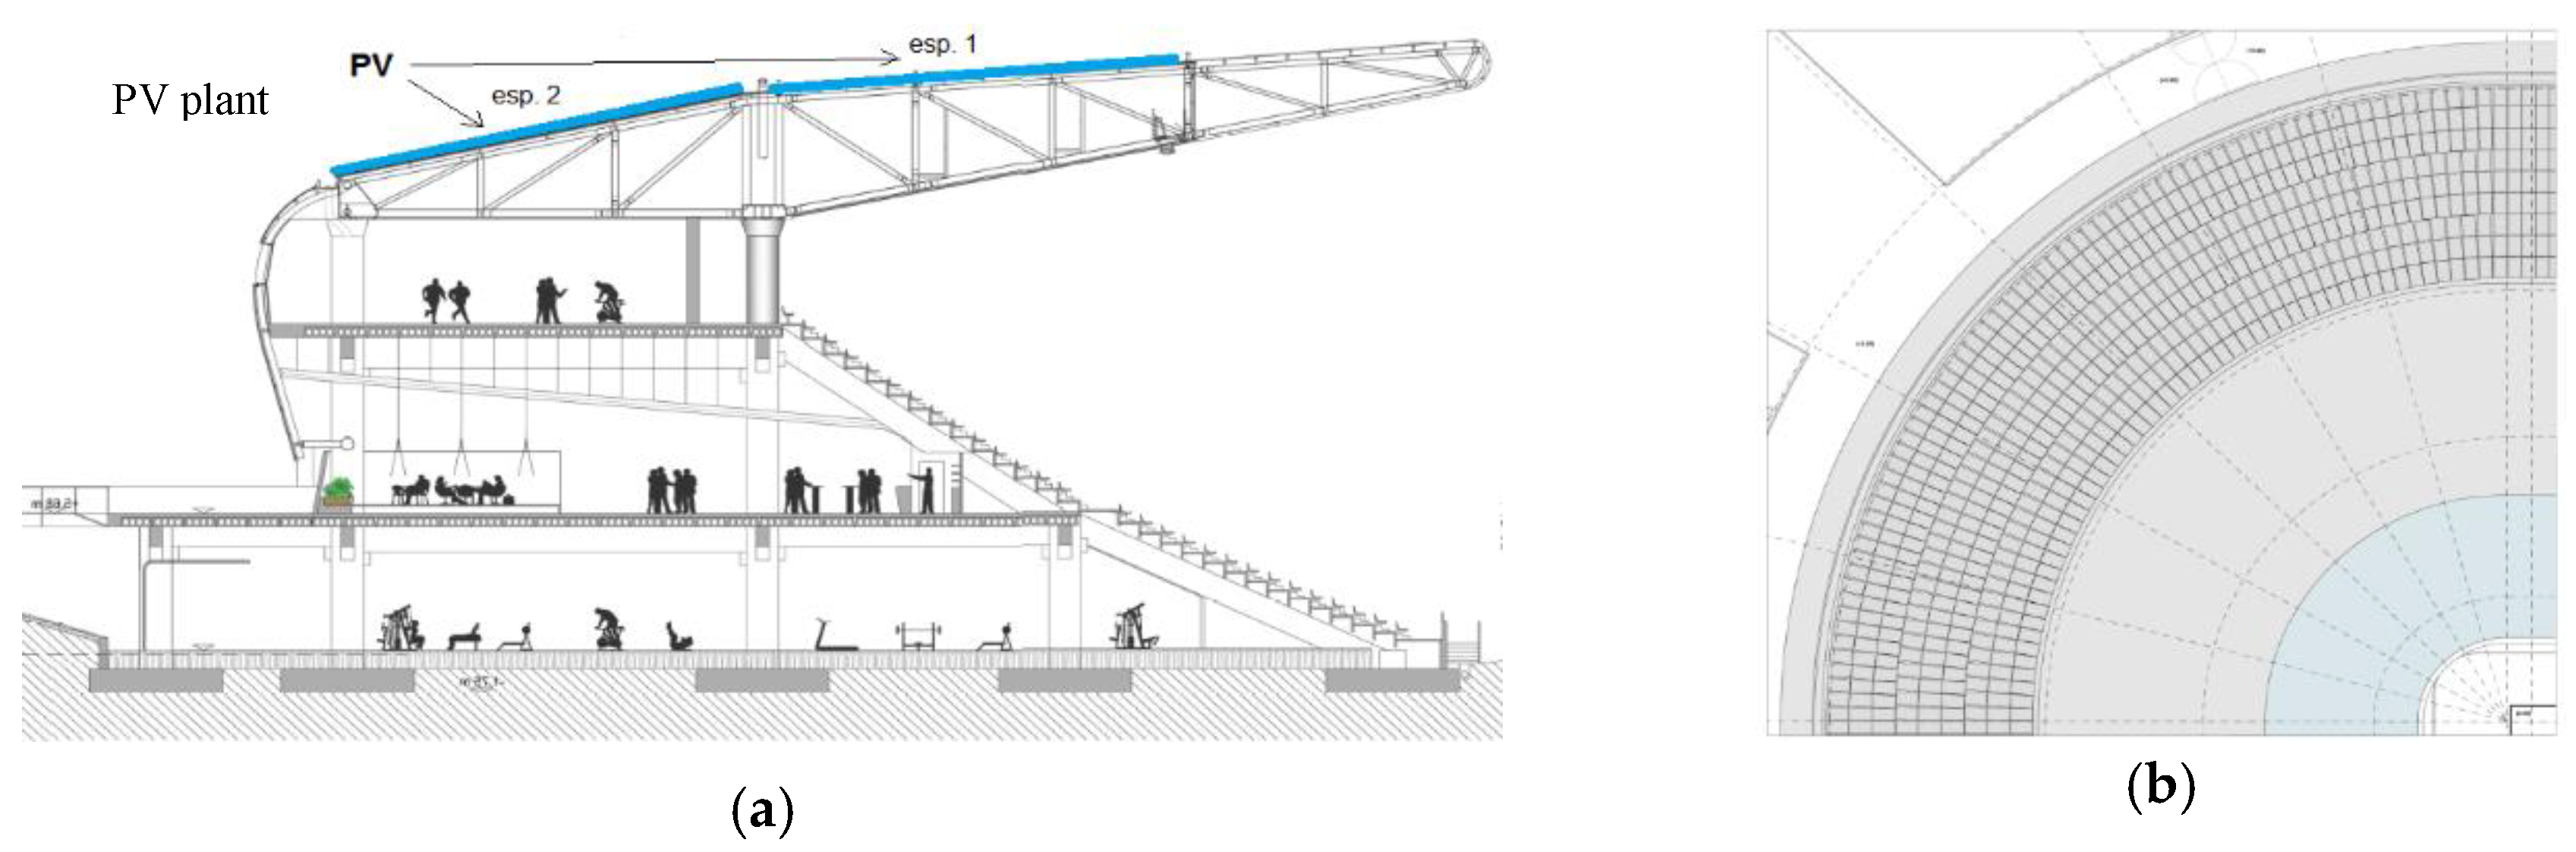
Scenario 1 corresponds to the enhanced configuration, where the modern stadium offers services not limited to sports events. In this scenario, the arena is open for the whole week, and the areas below the galleries—north, east and south in addition to the existent west—are exploited as restaurants, beauty centers, training facilities, sports stores, etc. In total, there are 20,000 m2 organized into two levels, as described in Figure 3. However, they are so far from the existent thermal stations that the realization of a new heating system was hypothesized. Indeed, the areas hosting match-day services are mainly open spaces, neither heated nor cooled.
The heating energy performances of the new areas were evaluated for each zone by considering the Primary Energy Index (PEi). The PEi refers to primary energy for heating calculated yearly for each square meter. It represents the ratio between the energy demand to achieve an 18 °C indoor temperature and the net surface. Depending on the energy categories which were assigned to the different rooms, an upper limit and a lower limit, expressed in kWh/m2 per year, can be defined in Table 8 [54]. Then, a mean value was chosen and multiplied by the surface to quantify the energy requirements for guaranteeing the achievement of the thermal comfort zone in every area. Accordingly, the properties of the building envelope were defined and used as input values in DB environment.
The configuration of the two levels and the hosted functions are reported in Figure 4a (Level 0) and Figure 4b (Level −1) as modeled on DB environment. Level 0 is 8000 m2 and it includes a 6000 m2 area for match-day services (toilets, bars, and other services) and two 1000 m2 extended, uncompleted zones. The completed parts—currently open air—could be closed with glazed envelopes and heated by the new system to improve users’ comfort. Considering their envelope (glazed) is not particularly effective in terms of thermal insulation, they were evaluated as C category zones according to Table 8. Differently, the uncompleted rooms, which would host a fast food restaurant and a wellness area, should achieve at least a B level of energy performance. Level −1 is located below street level and is characterized by an extension of 12,000 m2. Two facilities would be realized in this part of the arena: an indoor training center and a sports store to promote Udinese’s merchandising. Both were considered in the calculation as a B category zone.
3. Results and Discussion
The proposal for a sustainable plant to power the new zones (East, North, and South Galleries) was defined considering the results achieved by CIRIAF research group about energy efficiency [55]. Firstly, the energy demand was evaluated as described on the specific section. Then, two alternative systems’ layouts were designed and analyzed from an energy point of view. In one system, the PV plant is coupled with a geothermal heat pump, and, in the other system, the PV cells are integrated with a biomass plant and an absorption chiller for cooling and heating. Those plants would power the new areas hosting non-sport functions (training facilities, restaurants, wellness areas, etc.), which cannot be efficiently connected to the heating system present in the West Gallery.
3.1. Energy Requirements
In this section, the results of the dynamic simulations conducted in Design Builder environment are reported to define the building energy demand.
The energy consumptions are referred to Domestic Hot Water (DHW), heating, and cooling. They are organized based on the supplying plants: (a) methane-TPS; (b) ASHP; and (c) the new plant. The results of Scenario 0 included Plants (a) and (b), whereas Scenario 1 also exploits extra energy from Plant (c) to heat the new area (22,000 m2).
The assessments underline how the increment of heated surface could lead to increase the heating energy demand and the cooling needs by 35% and 63%, respectively. In particular, the new plant (Scenario 1) should supply 783,000 kWh for heating and 159,500 kWh for cooling, as reported in Table 9 and Figure 5.
3.2. Alternative Strategies towards Zero Energy Stadiums
The PV plant is integrated on the roof above the East and South Galleries. The panels are characterized by low tilt angles ranging from 3° and 9°, as reported in Figure 6. The roof is divided into three rings (outer, middle, and inner). Except for the inner part that is made of transparent panels to permit daylight reaching spectators, the remaining two sections (middle and outer) are covered by PV cells (about 7000 m2) [56].
The energy produced by the installed modules was estimated by the software Sunny Design for each roof’s sector. According to the current regulations [57], both the age of the infrastructure (part of the arena has been built after 2017) and the PV extension (7000 m2) were considered for evaluating the minimum required power, which turns out to be 140 kW. As summarized in Table 10, the plant can reach a peak power of 780 kWp (815,000 kWhe/year). It permits to supply enough energy for fitting the requirements related to lighting during the match day (around 60,000 kWhe/year) [52].
On the first proposed solution, the photovoltaic plant is coupled to a geothermal plant for supplying electricity and thermal energy. The ground properties were evaluated according to [58]. A yield equal to 50 W/m was estimated for the surroundings. Based on the dynamic simulation results, the heat pump should guarantee around 500 kWt and 175 kWf. The proposed system includes two heat pumps [59] which can power up to 240 kWt for each with a Coefficient of Performance (COP) equal to 4.6. The requirements to the ground in terms of power are 390 kW, thus 38 probes of 200 m depth should be realized. Nevertheless, considering the results obtained on the “Sistema di Climatizzazione da fonti Energetiche Rinnovabili” (SCER) pilot project [60], it is possible to reduce the probe number to 13 as long as a 250 m3 heat storage tank is added. Although the plant is largely recognized as efficient from an energy point of view, the interventions for its realization are characterized by a high level of environmental impact. However, the extra power produced can be delivered to the energy grid to lower the environmental impact of the facility. Indeed, only 260,000 kWh/year of the 815,000 kWhe per year powered by the PV plant are directly exploited by the heat pump, and the building is energetically autonomous for the 80% of the investigated period.
The solution proposed in this paragraph evaluated the possibility of exploiting biomass instead of geothermal power. Using biomass represents an efficient strategy to achieve the reduction of fossil energy source exploitation as confirmed by several studies conducted by the European Renewable Energy Council [61]. Biomass could cover up to the 50% of the European energy requirements by contributing at the same time to the achievement of the goals declared on COP 22 in terms of reduction of greenhouse gas emissions [62,63]. In this proposal, the PV panels are integrated with a biomass plant for supplying the required heating and cooling energy. The plant’s layout is similar to the one proposed on [55]. The boiler has a nominal power of 500 kWt obtained by installing two modules by 250 kWt [64]. Furthermore, two thermal storages were designed for the heating system and the DHW: their volumes are equal to 15 m3 and 6 m3, respectively. The cooling energy needs are supplied by an absorption chiller connected to the biomass plant: the water heated to 106 °C by the biomass plant generates 175 kWf. The cooling plant is completed by a 675 kW evaporative tower. In conclusion, the biomass consumption would be around 1250 m3 per year considering the calorific power of the chosen biomass (700–900 kWh/m3) and the yearly energy demand.
The primary energy is calculated for both the proposed solutions. In the first, the primary energy exploited by the geothermal plant is the electricity derived from the PV panels integrated on the roof. In the second, the primary energy consumption of the biomass plant is the chemical energy from biomass. Considering that the woodchips are characterized by a lower heating value and a density equal to 3.4 kWh/kg and 325 kg/m3, respectively [55], as well as the yearly woodchips consumption of 1250 m3 (440,000 kg), the primary energy is estimated around 1,500,000 kWh/year. This value is higher than the primary energy required by the geothermal heat pump (260,000 kWh/year). Table 11 summarizes the energy parameters presented in this study. These values are not enough to define the best solution from an environmental and economic point of view but they allow energetically evaluating the two alternatives as stated as the aim of the study.
4. Conclusions
The present work proposes a cluster of actions to reduce energy use of Dacia Arena. Most have already been realized during the upgrading of the West Gallery, and the demolition and reconstruction of the North, East and South Galleries. The interventions allow the creation of new areas—about 20,000 m2—available for commercial activities. Indeed, the economic crisis and the diffusion of other forms of on demand entertainment caused a reduction of the number of supporters at the stadium. Thus, developing and promoting activities that could be complementary to football would provide new profitability. The sustainability of the interventions has been evaluated in terms of operational energy use. The strategies included: (i) a photovoltaic system integrated on the new roof, for providing electricity; and (ii) a geothermal or a biomass plant for heating and cooling. The PV system turns out to be able to yearly power up to 815,000 kWhe. In the case of heat pump installation, part of that amount (around 500,000 kWh) is a surplus and it is not directly exploited by the arena facility. It is immitted in the energy grid and delivered to close neighborhoods to compensate the stadium’s carbon emissions. Differently, in the configuration with a biomass plant, the totality of the PV production could be delivered to the energy grid. In the first plant layout, the use of a geothermal heat pump system including two 240 kWt heat pumps was proposed. In the second, the biomass plant was composed by a boiler having a nominal power of 500 kWt (two modules by 250 kWt), integrated with an absorption chiller (175 kWf.) and an evaporative tower (675 kW). The energy analyses conducted on the two alternatives for the stadium plants layout demonstrated the feasibility of the proposed approaches, which could be replicated in other facilities.
Author Contributions
Writing—Original Draft Preparation, M.M.; Investigation, A.P.; Data Curation, V.C.; Validation, G.M.; and Supervision, A.N.
Funding
This research received no external funding.
Acknowledgments
The authors thank the technical studio Area Progetto Associati from Perugia and the Engineer Carlo Regni, which worked on the structural planning and the plant design of the new Dacia Arena in Udine, for the availability on sharing the results of their work with the Department of Engineering of the University of Perugia.
Conflicts of Interest
The authors declare no conflict of interest.
References
- IPCC. Climate Change 2014: Synthesis Report. Contribution of Working Groups I, II and III to the Fifth Assessment Report of the Intergovernmental Panel on Climate Change; IPCC: Geneva, Switzerland, 2014. [Google Scholar]
- European Commission. EPBD Directive 2010/31/EU of the European Parliament and of the Council of 19 May 2010 on the Energy Performance of Buildings; European Commission: Brussels, Belgium, 2010. [Google Scholar]
- ASHRAE (American Society of Heating, Refrigerating and Air-Conditioning Engineers). Energy Standard for Buildings except Low-Rise Residential Buildings; (ASHRAE) Standard, 90.1; ASHRAE: Atlanta, GA, USA, 2013. [Google Scholar]
- Berardi, U. A cross-country comparison of the building energy consumptions and their trends. Resour. Conserv. Recycl. 2017, 123, 230–241. [Google Scholar] [CrossRef]
- European Commission. Directive 2009/28/EC of the European Parliament and of the Council of 23 April 2009 on the Promotion of the Use of Energy from Renewable Sources and Amending and Subsequently Repealing Directives 2001/77/EC and 2003/30/EC; European Commission: Brussels, Belgium, 2008. [Google Scholar]
- European Commission. A Policy Framework for Climate and Energy in the Period from 2020 to 2030. In Technical Report COM; European Commission: Brussels, Belgium, 2014. [Google Scholar]
- World Green Building Council. World Green Building Council Annual Report; World Green Building Council: London, UK, 2017. [Google Scholar]
- C. O. T. Parties. COP21 2016. Available online: http://www.ambafrance-it.org/Parigi-2015-sul-Clima-COP21 (accessed on 20 February 2018).
- Smulders, T.; Graus, W.; van Rossom, R.; Noordermeer, G. Green Stadium: As Green as Grass. Master’s Thesis, University Utrecht, Utrecht, The Netherlands, 2012. [Google Scholar]
- Imtech. Vision Green Stadiums. 2011. Available online: http://imtech.eu/EN/corporate/About-Imtech/Visions/Vision-Green-Stadiums.html (accessed on 17 December 2012).
- Dovi, V.; Friedler, F.; Huisingh, D.; Klemes, J. Cleaner energy for sustainable future. J. Clean. Supply 2009, 17, 889–895. [Google Scholar] [CrossRef]
- Breech, J. Cowboys Stadium Uses More Electricity than Liberia, CBS Sport. Available online: https://www.cbssports.com/nfl/news/cowboys-stadium-uses-more-electricity-than-liberia/ (accessed on 23 February 2018).
- Love Energy Savings. How Football Is Driving Energy Efficiency & Sustainability Targets. Available online: https://www.loveenergysavings.com/guides/how-football-is-helping-to-drive-energy-efficiency-and-sustainability-targets/ (accessed on 23 February 2018).
- Legge n.147. Legge per lo Sviluppo Dell’impiantistica Sportiva. Available online: http://documenti.camera.it/Leg17/Dossier/Pdf/AFP006_II.pdf (accessed on 26 February 2018).
- Rubner Holzbau and Bear Stadiums. Gli Stadi del Futuro, Modulari, in Legno Lamellare ed Ecosostenibili. Available online: http://www.infobuild.it/approfondimenti/gli-stadi-del-futuro-modulari-in-legno-lamellare-ed-ecosostenibili/ (accessed on 26 February 2018).
- Sofotasiou, P.; Hughes, B.; Calautit, J. Qatar 2022: Facing the FIFA World Cup climatic and legacy challenges. Sustain. Cities Soc. 2015, 14, 16–30. [Google Scholar] [CrossRef] [Green Version]
- Pearlmutter, D.; Erell, E.; Etzion, Y.; Meir, I.; Di, H. Refining the use of evaporation in an experimental down-draft cool tower. Energy Build. 1996, 23, 191–197. [Google Scholar] [CrossRef]
- Laylin, T. Tangram 2022 World Cup Stadium Cools Itself Like a Lizard. Available online: http://stadiumdb.com/designs/qat/tangram_2022_world_cup_stadium (accessed on 26 February 2018).
- Aly, S.; Fathalah, K. Combined absorption-desiccant solar powered air conditioning system. Warme-und Stoffubertragung 1988, 23, 111–121. [Google Scholar] [CrossRef]
- Nagengast, A.; Hendrickson, C.; Matthews, H. Variations in photovoltaic performance due to climate and low-slope roof choice. Energy Build. 2013, 64, 493–502. [Google Scholar] [CrossRef]
- Arup Associates. Qatar Showcase. Available online: http://www.arupassociates.com/en/case-studies/qatar-showcase/ (accessed on 26 February 2018).
- Kennett, S. Qatar’s Zero Carbon Stadium: 96 Degrees in the Shade 2010. Available online: http://www.building.co.uk/buildings/qatars-zero-carbon-stadium-96-degrees-in-the-shade/5008557.article (accessed on 26 February 2018).
- Van Hooff, T.; Blocken, B.; Van Harten, M. 3D CFD simulations of wind flow and wind-driven rain shelter in sports stadia: Influence of stadium geometry. Build. Environ. 2011, 46, 22–37. [Google Scholar] [CrossRef]
- Qatar Foundation: Solar Energy Put to the Test. Available online: http://www.qf.org.qa/content/the-foundation/issue-49/solar-energy-put-to-the-test (accessed on 26 February 2018).
- Sartori, I.; Napolitano, A.; Voss, K. Net zero energy buildings: A consistent definition framework. Energy Build. 2012, 48, 220–232. [Google Scholar] [CrossRef] [Green Version]
- Hughes, B.R.; Rezazadeh, F.; Chaudhry, H.N. Economic viability of incorporating multi-effect distillation with district cooling systems in the United Arab Emirates. Sustain. Cities Soc. 2013, 7, 37–43. [Google Scholar] [CrossRef]
- Fédération Internationale de Football Association. Summary of the 2014 FIFA World Cup Brazil Carbon Footprint. Available online: http://resources.fifa.com/mm/document/fifaworldcup/generic/02/11/20/03/summaryofthe2014fwccarbonfootprint_neutral.pdf (accessed on 26 February 2018).
- Fèdèration Internationale de Football Association. FIFA Football for the Planet. Available online: http://www.fifa.com/sustainability/football-for-planet.html (accessed on 26 February 2018).
- Fèdèration Internationale de Football Association. Football for the Planet, Neutral Carbon Emissions. Available online: http://resources.fifa.com/mm/document/fifaworldcup/generic/02/11/19/92/footballfortheplaneten_neutral.pdf (accessed on 26 February 2018).
- Hayes, G.; Karamichas, J. Olympic Games, Mega-Events and Civil Societies: Globalization, Environment, Resistance; Palgrave Macmillan: Basingstoke, UK, 2012. [Google Scholar]
- Fédération Internationale de Football Association. Carbon Management and Climate Protection at FIFA, Football for the Planet. Available online: http://resources.fifa.com/mm/document/afsocial/environment/02/83/13/97/carbonmanagementandclimateprotectionatfifa_neutral.pdf (accessed on 26 February 2018).
- Azzoni, T. Brazil Trying to Make Good Use of New Stadiums, Las Vegas Sun. Available online: https://lasvegassun.com/news/2014/dec/19/brazil-trying-make-good-use-new-stadiums/ (accessed on 26 February 2018).
- Haisley, B. Brazil’s World Cup Stadiums Were a Colossal Waste of Money, Deadspin. Available online: https://deadspin.com/brazils-world-cup-stadiums-were-a-colossal-waste-of-mon-1703964012 (accessed on 26 February 2018).
- Fèdèration Intarnationale de Football Association. The Castelao, Brazil 2014’s First Green Stadium. Available online: http://www.fifa.com/worldcup/news/y=2014/m=1/news=the-castelao-brazil-2014-first-green-stadium-2266430.html (accessed on 26 February 2018).
- Solar, Y. Powering Brazil’s Most Iconic Football Stadium. Available online: http://www.solaripedia.com/files/1319.pdf (accessed on 25 June 2018).
- Turner, J. 8 Football Stadiums Designed to Save the World, Redbull. Available online: https://www.redbull.com/int-en/8-football-stadiums-designed-to-save-the-world (accessed on 26 February 2018).
- Deriu, M. Dal Brasile, lo Stadio Che Produce Energia per le Case. Available online: http://www.fotovoltaicosulweb.it/guida/dal-brasile-lo-stadio-che-produce-energia-per-le-case.html (accessed on 26 February 2018).
- Paris, N. Commuters’ Footsteps Power Part of Train Station, the Telegraph. Available online: http://www.telegraph.co.uk/travel/destinations/europe/france/nord-pas-de-calais/articles/Commuters-footsteps-power-part-of-train-station/ (accessed on 26 February 2018).
- The Institution of Engineers Australia. Smart Tiles Harness the Power of Footsteps. Available online: https://www.engineersaustralia.org.au/portal/news/smart-tiles-harness-power-footsteps (accessed on 26 February 2018).
- Pavagen, Heathrow Airport. Available online: http://www.pavegen.com/heathrow (accessed on 26 February 2018).
- BBC. The First Player-Powered Football Pitch Opens in Brazil. Available online: http://www.bbc.co.uk/newsbeat/article/29156221/the-first-player-powered-football-pitch-opens-in-brazil (accessed on 26 February 2018).
- Alitalia. Ulisse Magazine, June 2016; Volume 6.
- Stadium Database. Stade Pierre Mauroy (Grand Stade Lille-Métropole). Available online: http://stadiumdb.com/stadiums/fra/grand_stade_lille (accessed on 6 March 2018).
- AAS Architecture. Allianz-Riviera Stadium by Wilmotte & Associés. Available online: http://aasarchitecture.com/2014/12/allianz-riviera-stadium-wilmotte-associes.html (accessed on 6 March 2018).
- Architect Magazine. Nouveau Stade de Bordeaux Herzog & de Meuron. Available online: http://www.architectmagazine.com/project-gallery/nouveau-stade-de-bordeaux (accessed on 6 March 2016).
- Apollon Football Ltd. Company. Apollon F.C. Official Website. Available online: http://www.apollon.com.cy/en/news-detail/10567/accreditations (accessed on 6 March 2018).
- Union of European Football Associations. UEFA, Post Event Report 2016. Available online: https://www.uefa.com/MultimediaFiles/Download/OfficialDocument/uefaorg/General/02/42/47/58/2424758_DOWNLOAD.pdf (accessed on 6 March 2018).
- Wikipedia. List of Future Stadiums. Available online: https://en.wikipedia.org/wiki/List_of_future_stadiums (accessed on 6 March 2018).
- Football Italia. Atalanta Presents New Stadium Plans. Available online: https://www.football-italia.net/112563/atalanta-present-new-stadium-plans (accessed on 6 March 2018).
- Comune di Verona. Solare Fotovaltaico Su Edifici Pubblici. Available online: http://www.comune.verona.it/nqcontent.cfm?a_id=48635 (accessed on 6 March 2018).
- Studio, R.B. Engineering S.r.l. Commerciale, Area 12 Juventus Stadium. Available online: http://www.studiorb.it/progetti/commerciale/area-12-juventus-stadium/33 (accessed on 6 March 2018).
- Regni, C.; Petrozzi, A.; Pisello, A.L.; Cotana, F. Renewable Energy and Energy Efficiency in Sportive Infrastructure. The Case Study of Friuli Stadium in Udine. Master’s Thesis, Università degli Studi di Perugia, Perugia, Italy, 2016. [Google Scholar]
- Ente Italiano di Unificazione (UNI). Riscaldamento e Raffrescamento Degli Edifici. Available online: http://www.uni.com/index.php?option=com_content&view=article&id=4819:riscaldamento-e-raffrescamento-degli-edifici-pubblicata-la-serie-nazionale-uni-10349&catid=170&Itemid=2612 (accessed on 25 June 2018).
- Khalil, E. Flow patterns and thermal comfort around spectators in air conditioned sport facilities. In Proceedings of the 15th International Energy Conversion Engineering Conference, Atlanta, GA, USA, 10–12 July 2017. [Google Scholar]
- La Prestazione Energetica Degli Edifici Residenziali. Available online: https://www.certificazioneenergeticafacile.it/certificato-energetico/prestazione-energetica/ (accessed on 26 February 2018).
- Manni, M.; Tecce, R.; Cavalaglio, G.; Coccia, V.; Nicolini, A.; Petrozzi, A. Architectural and energy refurbishment of the headquarter of the University of Teramo. Energy Procedia 2017, 126, 565–572. [Google Scholar] [CrossRef]
- ENF Solar. Conergy PowerPlus 245-265P. Available online: https://it.enfsolar.com/pv/panel-datasheet/Polycrystalline/24127 (accessed on 26 February 2018).
- Piazza della Repubblica. Attuazione Della Direttiva 2009/28/CE Sulla Promozione Dell’uso Dell’energia Da Fonti Rinnovabili, Recante Modifica E Successiva Abrogazione Delle Direttive 2001/77/CE e 2003/30/CE; Gazzetta Ufficiale: Rome, Italy, 2011. [Google Scholar]
- Zarlenga, F. La possibilità di utilizzo della risorsa geotermica a bassa e media entalpia per la sostenibilità ambientale. EAT Energia Ambiente Territorio 2011, 3, 31–40. [Google Scholar]
- E.GEO. Available online: www.egeoitalia.com (accessed on 26 February 2018).
- Comune di Peugia. Nuovo Sistema di Climatizzazione di Edifici Artigianali in Ambito Urbano Basato Sulle Fonti Energetiche Rinnovabili. Available online: http://www.comune.perugia.it/pagine/progetto-scer (accessed on 26 February 2018).
- EREC. Chapter 5: 45% by 2030. Contribution of Renewable Energy Technologies for Final Energy Consumption. 2012. Available online: http://www.ewea.org/blog/2011/05/renewable-energy-target-of-45-by-2030-vital/ (accessed on 25 June 2018).
- UNFCCC. Marrakech Action Proclamation for Our Climate and Sustainable Development. 2016. Available online: https://unfccc.int/sites/default/files/marrakech_action_proclamation.pdf (accessed on 25 June 2018).
- UNFCCC. Report of the Conference of the Parties on Its Twenty-Second Session, Marrakech. 2017. Available online: https://unfccc.int/sites/default/files/16_cp.22.pdf (accessed on 25 June 2018).
Figure 1.
Overview of the arenas built for Euro 2016 in France. From the left to right: Pierre-Mauroy Stadium (Lille), Allianz-Riviera (Nice), Noveau Stade de Bordeaux (Bordeaux), and Parc Olympique Lyonnais (Lyon) [43,44,45,46].
Figure 2.
Dacia Arena, Udine, before (left) and after (right) the restoration.
Figure 3.
Dacia Arena, Udine, vertical sections of the: (a) West Gallery; (b) East Gallery.
Figure 4.
Dacia Arena, areas served by the new system; from the left: (a) Level 0; (b) Level −1.
Figure 5.
Energy demand evaluated by Design Builder software tool. The heating energy needs are reported as positive values, while the cooling ones are considered negatives.
Figure 5.
Energy demand evaluated by Design Builder software tool. The heating energy needs are reported as positive values, while the cooling ones are considered negatives.
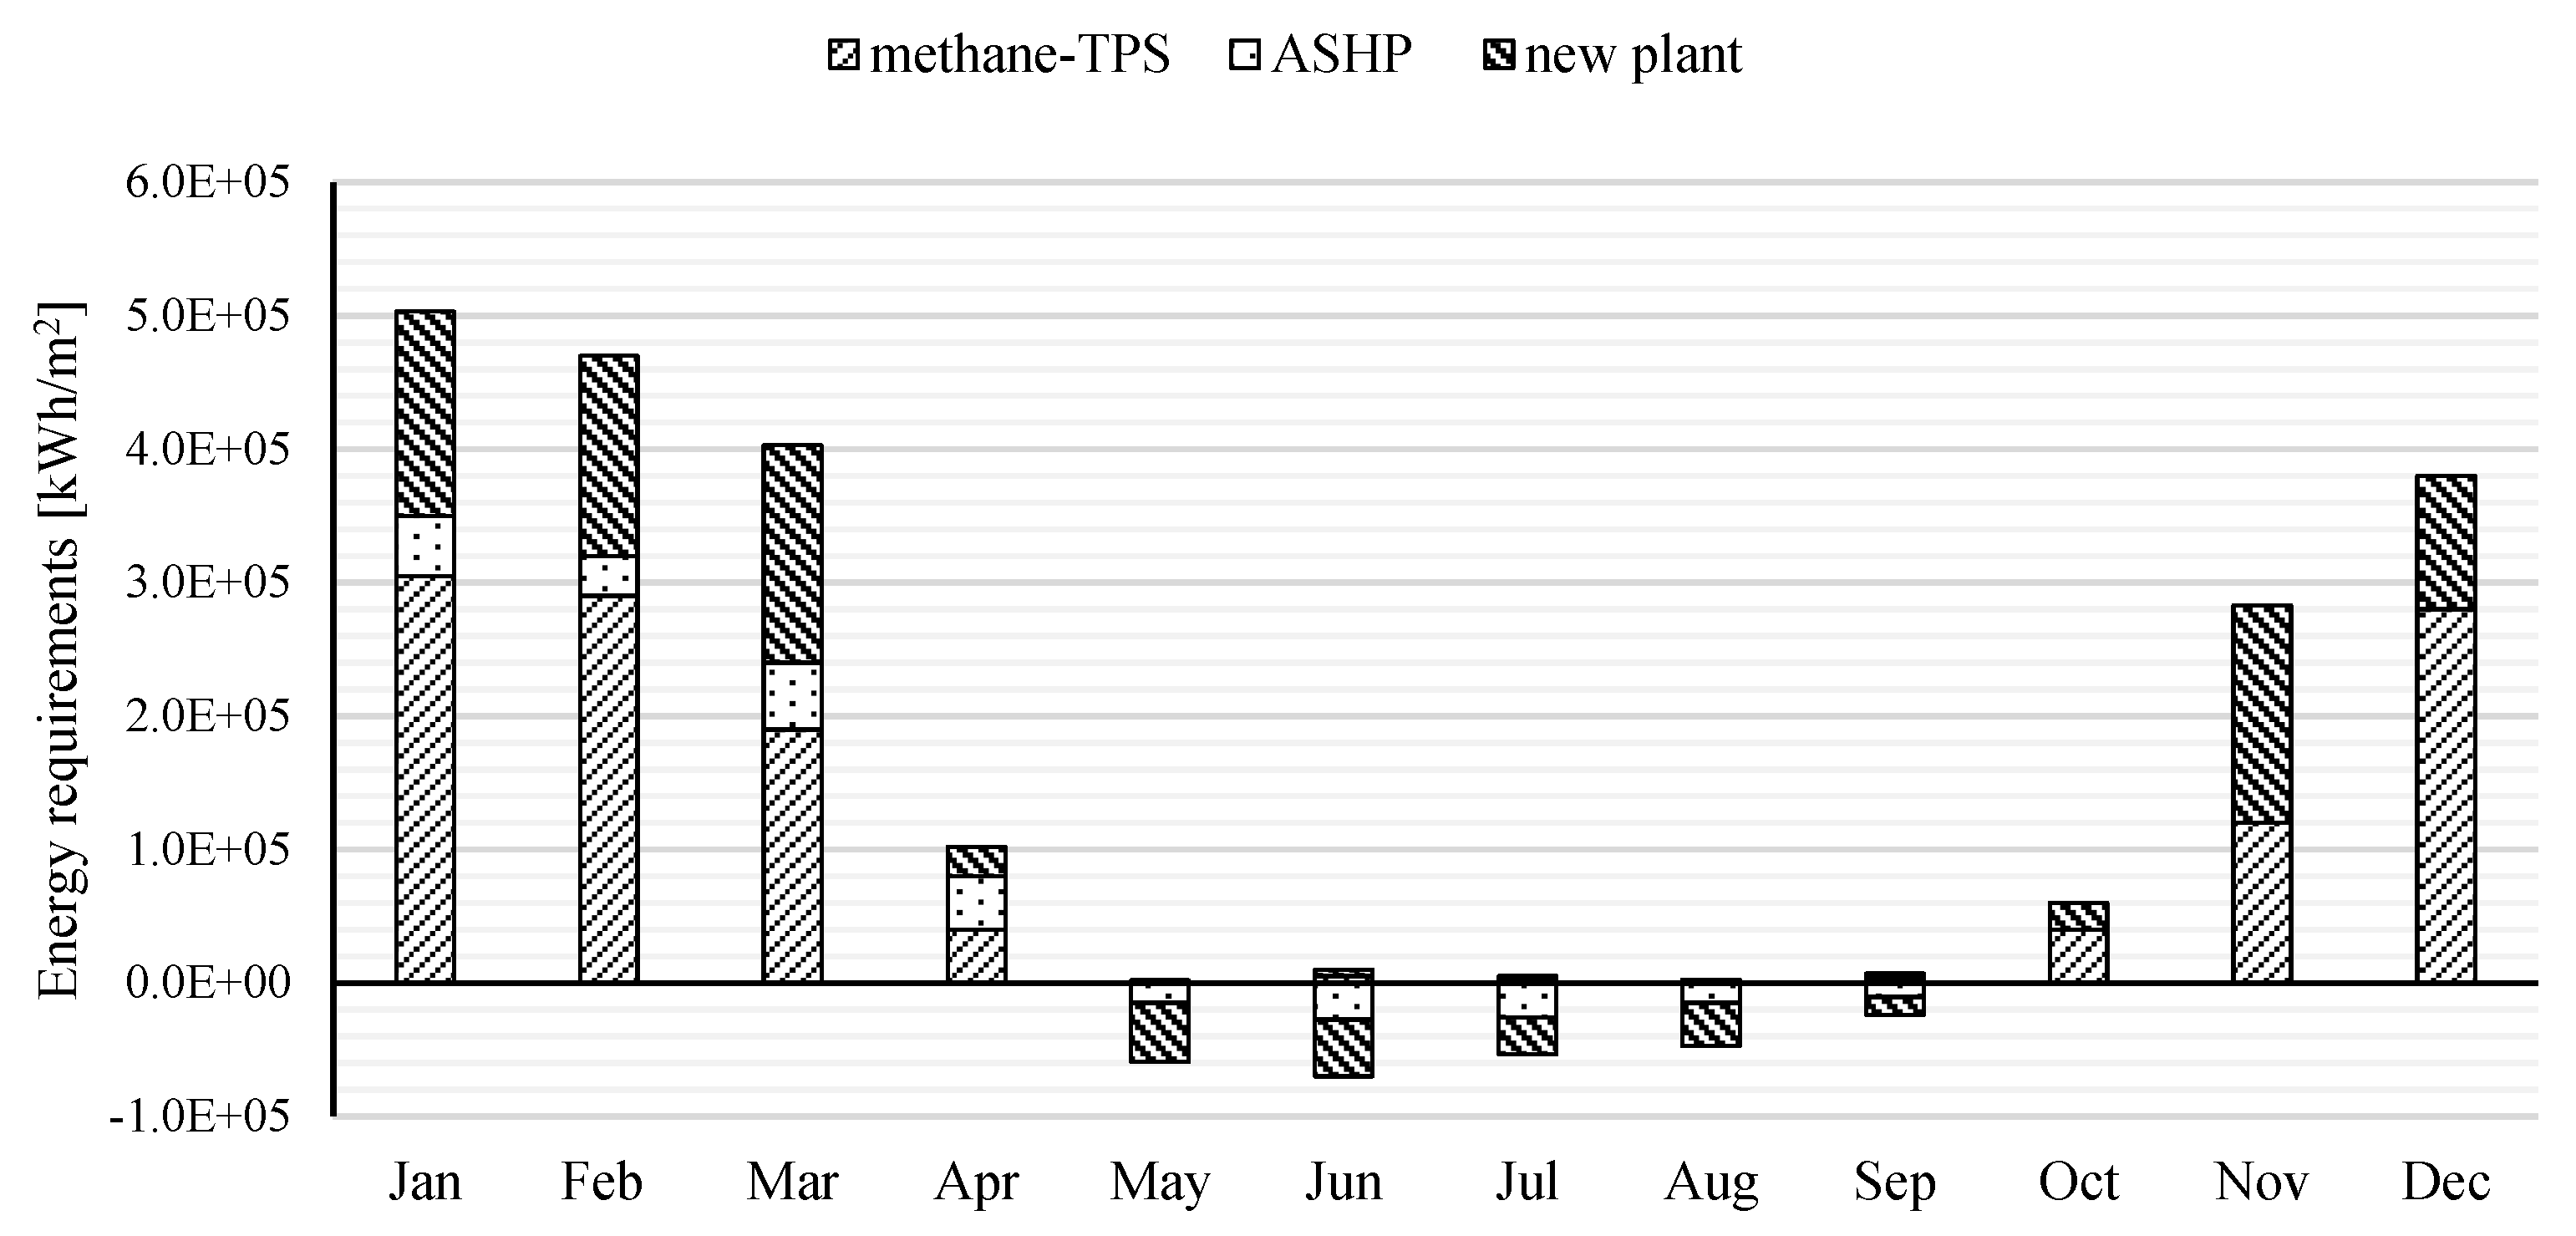
Figure 6.
Design of the photovoltaic plant integrated on the roofing: from the left: (a) section; (b) plan.
Figure 6.
Design of the photovoltaic plant integrated on the roofing: from the left: (a) section; (b) plan.


Table 1.
UEFA Euro 2016 new arenas’ configuration [47].
Table 1.
UEFA Euro 2016 new arenas’ configuration [47].
| Features | Lille | Nice | Bordeaux | Lyon |
|---|---|---|---|---|
| Accessibility | ||||
| Approximate UEFA capacity | 50,000 | 36,000 | 42,000 | 58,000 |
| Wheelchair spaces | 230 | 120 | 120 | 246 |
| Easy-access seats close to amenities | 115 | 100 | 100 | 123 |
| Transport | ||||
| Public transport accessibility | ✓ | ✓ | ✓ | ✓ |
| Energy | ||||
| Renewable energy generation in situ 1 | SP, Gt | SP | SP | SP |
| Renewable energy purchase | ✓ | |||
| Water | ||||
| Rainwater collection system | ✓ | ✓ | ✓ | ✓ |
| Optimization of water consumption | ✓ | intelligent sprinklers | - | motion detectors |
| Waste | ||||
| Selective sorting in non-public areas | ✓ | ✓ | ✓ | ✓ |
| Selective sourcing in public areas | ✓ | ✓ | - | - |
| Waste minimization 2 | a, b, c, d | a, b, c, d | a, b, c, d | a, b, c, d |
1 the renewable energy generation in these case studies, is conducted by installing solar panels (SP) and geothermal power (Gt); 2 the minimization is achieved by applying the following strategies: (a) reusable cups; (b) food donation; (c) signage reuse; and (d) composting.
Table 2.
List of the main stadium plans which have already been discussed by the local municipalities or which are under discussion at the moment [50,51].
| Stadium | Capacity | City | Tenant | Opening |
|---|---|---|---|---|
| Stadio della Roma | 52,500 | Rome | A.S. Rome | 2020 |
| New Fiorentina Stadium | 40,430 | Florence | A.C.F. Fiorentina | - |
| New Cagliari Stadium | 30,000 | Cagliari | Cagliari Calcio | 2021 |
| New Stadio Castellani | 20,266 | Empoli | Empoli F.C. | - |
| Atleti Azzurri D’Italia Arena | 24,000 | Bergamo | Atalanta B.F.C. | 2020 |
Table 3.
Technical specifications of the football pitch’s heating system.
| Features | Units | Values |
|---|---|---|
| Specific peak power per square meter | [W/m2] | 150 |
| Required peak power | [kW] | 1200 |
| Anti-freeze percentage concentration on thermos vector fluid | [%] | 34.0 |
| Pump flow rates | [m3/h] | 42–90 |
| Inlet temperature | [°C] | 42 |
| Outlet temperature | [°C] | 28–30 |
| Set-point temperature | [°C] | 20 |
Table 4.
Thermal loads considered in the Design Builder model.
| Outdoor Thermal Loads | Indoor Thermal Loads | ||
|---|---|---|---|
| Thermal flow through opaque walls | Qwall (t) | Thermal flow related to people presence | Qpers (t) |
| Thermal flow through glazed surfaces | Qglaz (t) | Thermal flow related to appliances | Qappl (t) |
| Thermal flow due to global irradiation | Qirr (t) | Thermal flow related to lighting system | Qlight (t) |
| Thermal flow due to thermal bridges | Qbridge (t) | Thermal flow due to other contributes | Qother (t) |
| Thermal flow due to ventilation | Qvent (t) |
Table 5.
Input data regarding the environment surrounding the Dacia Arena.
| Climate Parameters | Input Data |
|---|---|
| Location | Udine, Argentina Square |
| Latitude | 46°03′00″ |
| Longitude | 13°14′00″ |
| Altitude | 113 m above sea-level |
| Climatic Zone | E |
| Degree days | 2323 |
| Maximum wind velocity | 4 m/s |
| Average yearly relative humidity | 72% |
| Average amount of annual precipitation | 999.9 mm |
| Average annual maximum temperature | 17.0 °C |
| Average annual minimum temperature | 7.0 °C |
Table 6.
Monthly values of temperature and precipitation about Udine.
| Parameters | January | February | March | April | May | June | July | August | September | October | November | December |
|---|---|---|---|---|---|---|---|---|---|---|---|---|
| Tmeant [°C] | 3.1 | 4.5 | 7.9 | 12 | 16.6 | 20.1 | 22.3 | 21.8 | 18.5 | 13.6 | 8.2 | 4.4 |
| Tmin [°C] | −0.2 | 0.7 | 3.4 | 7.1 | 11.2 | 14.8 | 16.7 | 16.4 | 13.4 | 8.9 | 4.7 | 1.1 |
| Tmax [°C] | 6.5 | 8.4 | 12.5 | 17 | 22 | 25.4 | 28 | 27.2 | 23.7 | 18.4 | 11.8 | 7.8 |
| Rainfall [mm] | 75 | 76 | 86 | 117 | 107 | 150 | 98 | 120 | 132 | 124 | 138 | 118 |
Table 7.
Overview of the zones modeled on Design Builder to evaluate the energy requirements.
| Level | Zone | Hours per Day | Days per Week | System | |
|---|---|---|---|---|---|
| TPS * | ASHP ** | ||||
| 1 | Wellness area | 2 | 6 | - | ✓ |
| Locker rooms | 4 | 6 | - | ✓ | |
| Training facility | 4 | 3 | - | ✓ | |
| Media center | 4 | 2 | ✓ | - | |
| Offices (type A) | 10 | 7 | - | ✓ | |
| 2 | Offices (type A) | 10 | 7 | - | ✓ |
| 3 | Bar (VIP, West Gallery) | 4 | 0.5 | ✓ | - |
| Medical center | 6 | 6 | - | ✓ | |
| 4 | Conference room | 4 | 0.5 | ✓ | - |
| Restaurant | 6 | 7 | - | ✓ | |
| Area relax | 4 | 6 | - | ✓ | |
| 5 | Other services | 2 | 3 | ✓ | - |
| 6 | Other services | 2 | 3 | ✓ | - |
| 7 | Other services | 2 | 3 | ✓ | - |
| 8 | Other services | 2 | 3 | ✓ | - |
| 9 | Offices (type B) | 4 | 0,5 | ✓ | - |
* TPS stands for Thermal Power Station; ** ASHP stands for Air Source Heat Pump.
Table 8.
Classification depending on Primary Energy Index levels.
| Lower Limit [kWh/m2 year] | Category | Upper Limit [kWh/m2 year] |
|---|---|---|
| - | A | 26.0 |
| 26.0 | B | 39.0 |
| 39.0 | C | 52.0 |
| 52.0 | D | 65.0 |
| 65.0 | E | 78.0 |
| 78.0 | F | 91.1 |
| 91.1 | G | 130.1 |
Table 9.
Energy demands through the year for heating and cooling referred to each plant.
| Plant | Heating Energy Demand | Cooling Energy Demand | ||
|---|---|---|---|---|
| Total [kWh/year] | Max [kWh/year] | Total [kWh/year] | Max [kWh/year] | |
| methane-TPS | 1,278,700 | 305,000 | - | - |
| ASHP | 165,000 | 50,000 | 94,000 | 27,500 |
| new plant | 783,000 | 163,000 | 159,500 | 44,000 |
Table 10.
Energy requirements for heating and cooling referred to each plant.
| Location | Exposure | Tilt Angle | Surface [m2] | Power [kW] | Inverter [n] |
|---|---|---|---|---|---|
| outer ring | South | 9° | 1052 | 120 | 12 |
| Southeast | 663 | 72 | 7 | ||
| East | 1584 | 180 | 18 | ||
| middle ring | South | 3° | 1052 | 120 | 12 |
| Southeast | 982 | 106 | 11 | ||
| East | 1584 | 180 | 18 |
Table 11.
Energy requirements for heating and cooling referred to each plant.
| Configurations | Plant | Size | Primary Energy Type | Primary Energy Consumption [kWh/year] |
|---|---|---|---|---|
| Alternative a | Geothermal Heat Pump | (500 kWt, 175 kWf) | Electricity form PV | 260,000 |
| Alternative b | Biomass boiler and Absorption Chiller | Chemical Energy from biomass | 1,500,000 |
© 2018 by the authors. Licensee MDPI, Basel, Switzerland. This article is an open access article distributed under the terms and conditions of the Creative Commons Attribution (CC BY) license (http://creativecommons.org/licenses/by/4.0/).
Share and Cite
MDPI and ACS Style
Manni, M.; Coccia, V.; Nicolini, A.; Marseglia, G.; Petrozzi, A. Towards Zero Energy Stadiums: The Case Study of the Dacia Arena in Udine, Italy. Energies 2018, 11, 2396. https://doi.org/10.3390/en11092396
AMA Style
Manni M, Coccia V, Nicolini A, Marseglia G, Petrozzi A. Towards Zero Energy Stadiums: The Case Study of the Dacia Arena in Udine, Italy. Energies. 2018; 11(9):2396. https://doi.org/10.3390/en11092396
Chicago/Turabian StyleManni, Mattia, Valentina Coccia, Andrea Nicolini, Guido Marseglia, and Alessandro Petrozzi. 2018. "Towards Zero Energy Stadiums: The Case Study of the Dacia Arena in Udine, Italy" Energies 11, no. 9: 2396. https://doi.org/10.3390/en11092396
Note that from the first issue of 2016, this journal uses article numbers instead of page numbers. See further details here.