A Pilot Study on Geothermal Heat Pump (GHP) Use for Cooling Operations, and on GHP Site Selection in Tropical Regions Based on a Case Study in Thailand


 ,
,
Abstract
1. Introduction
2. Materials and Methods
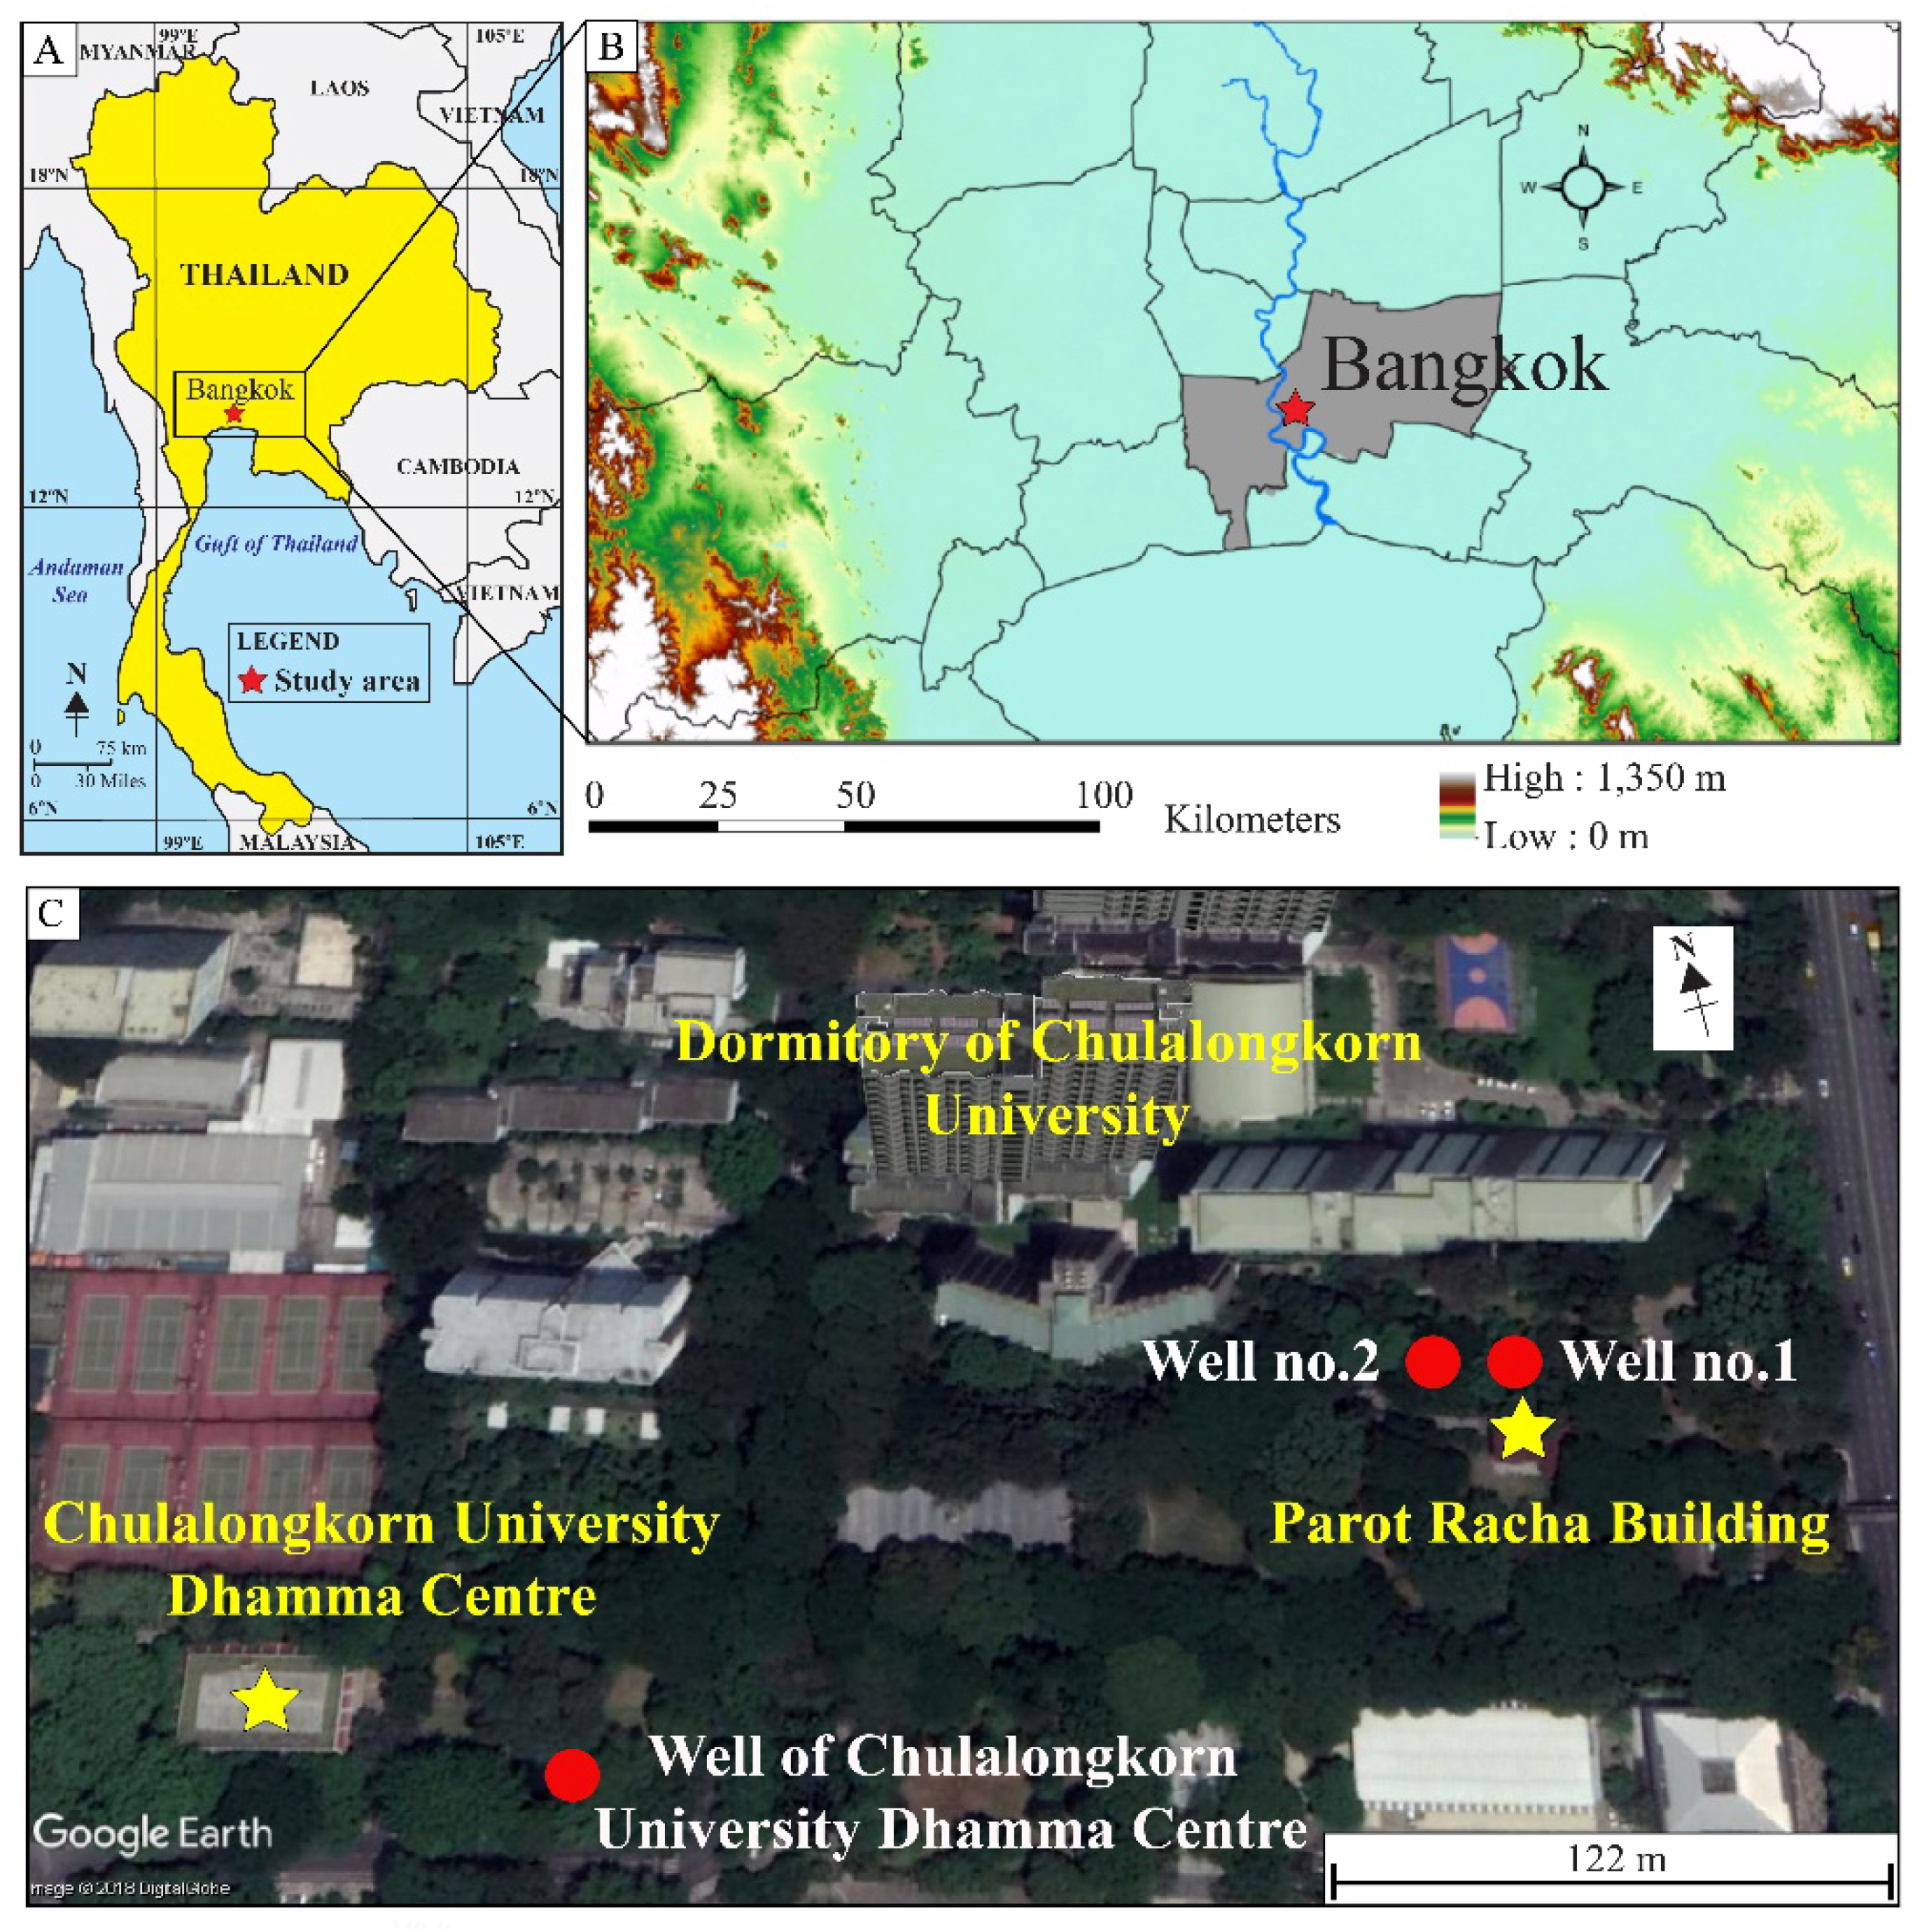
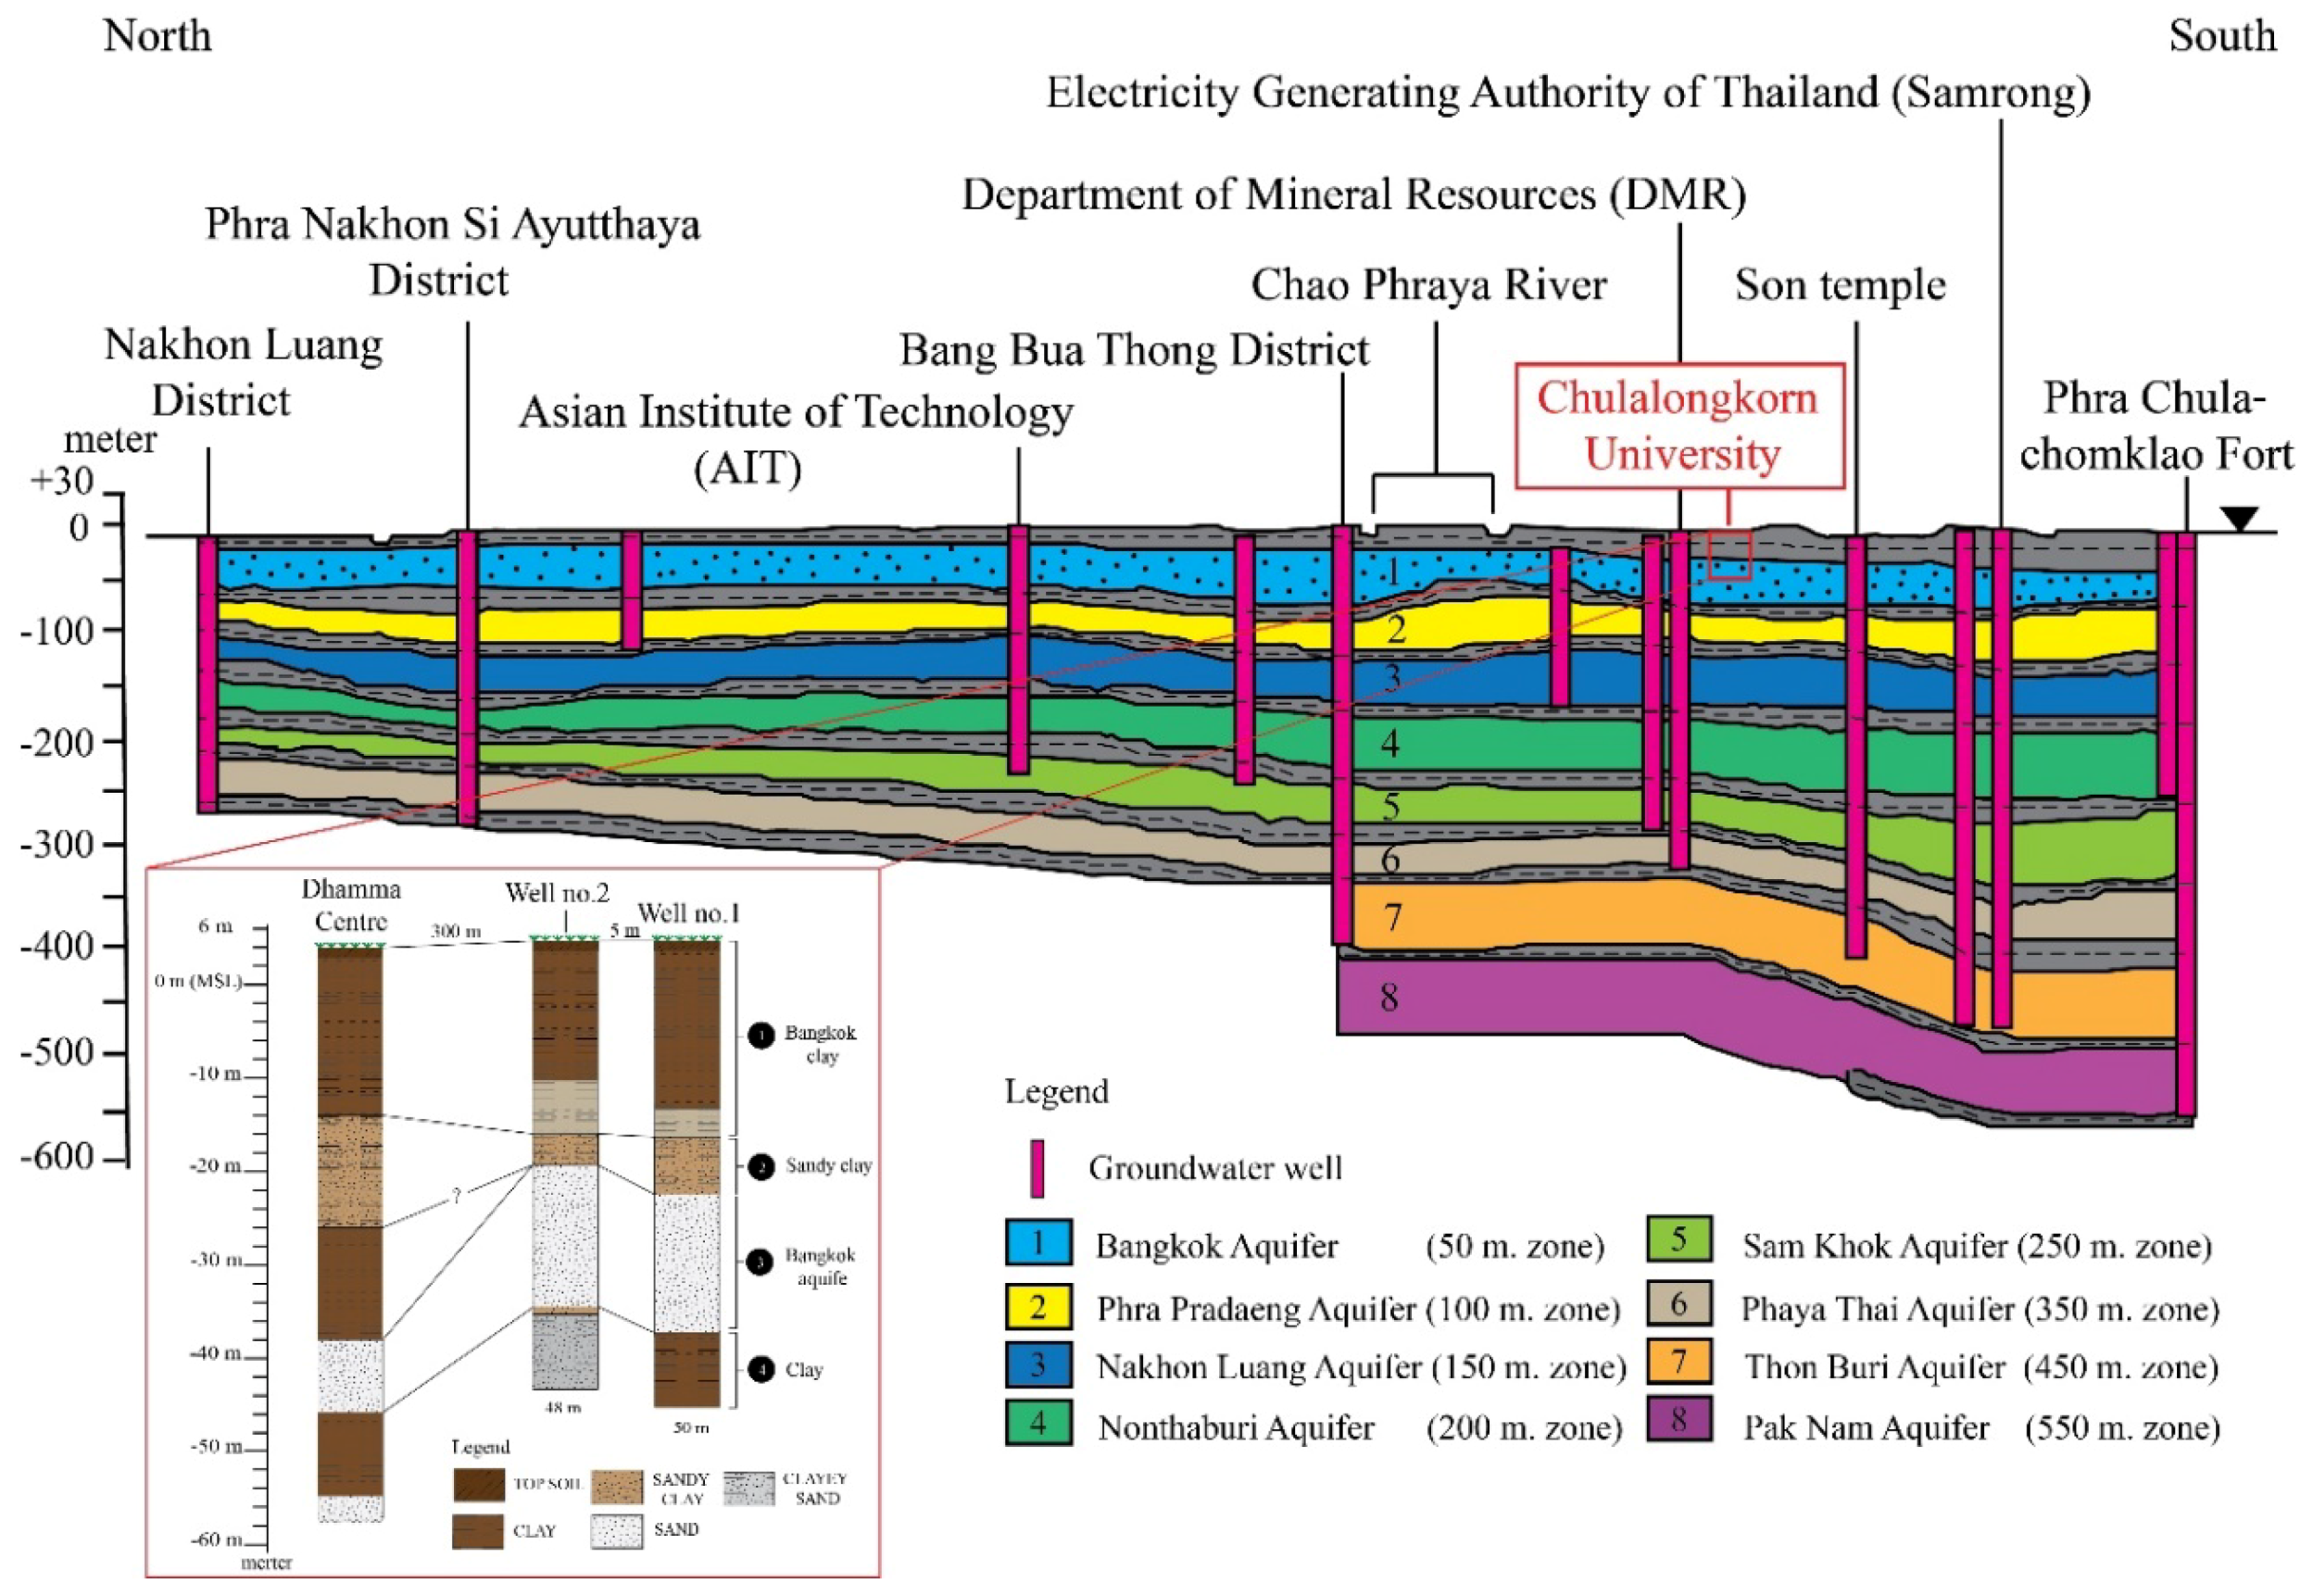
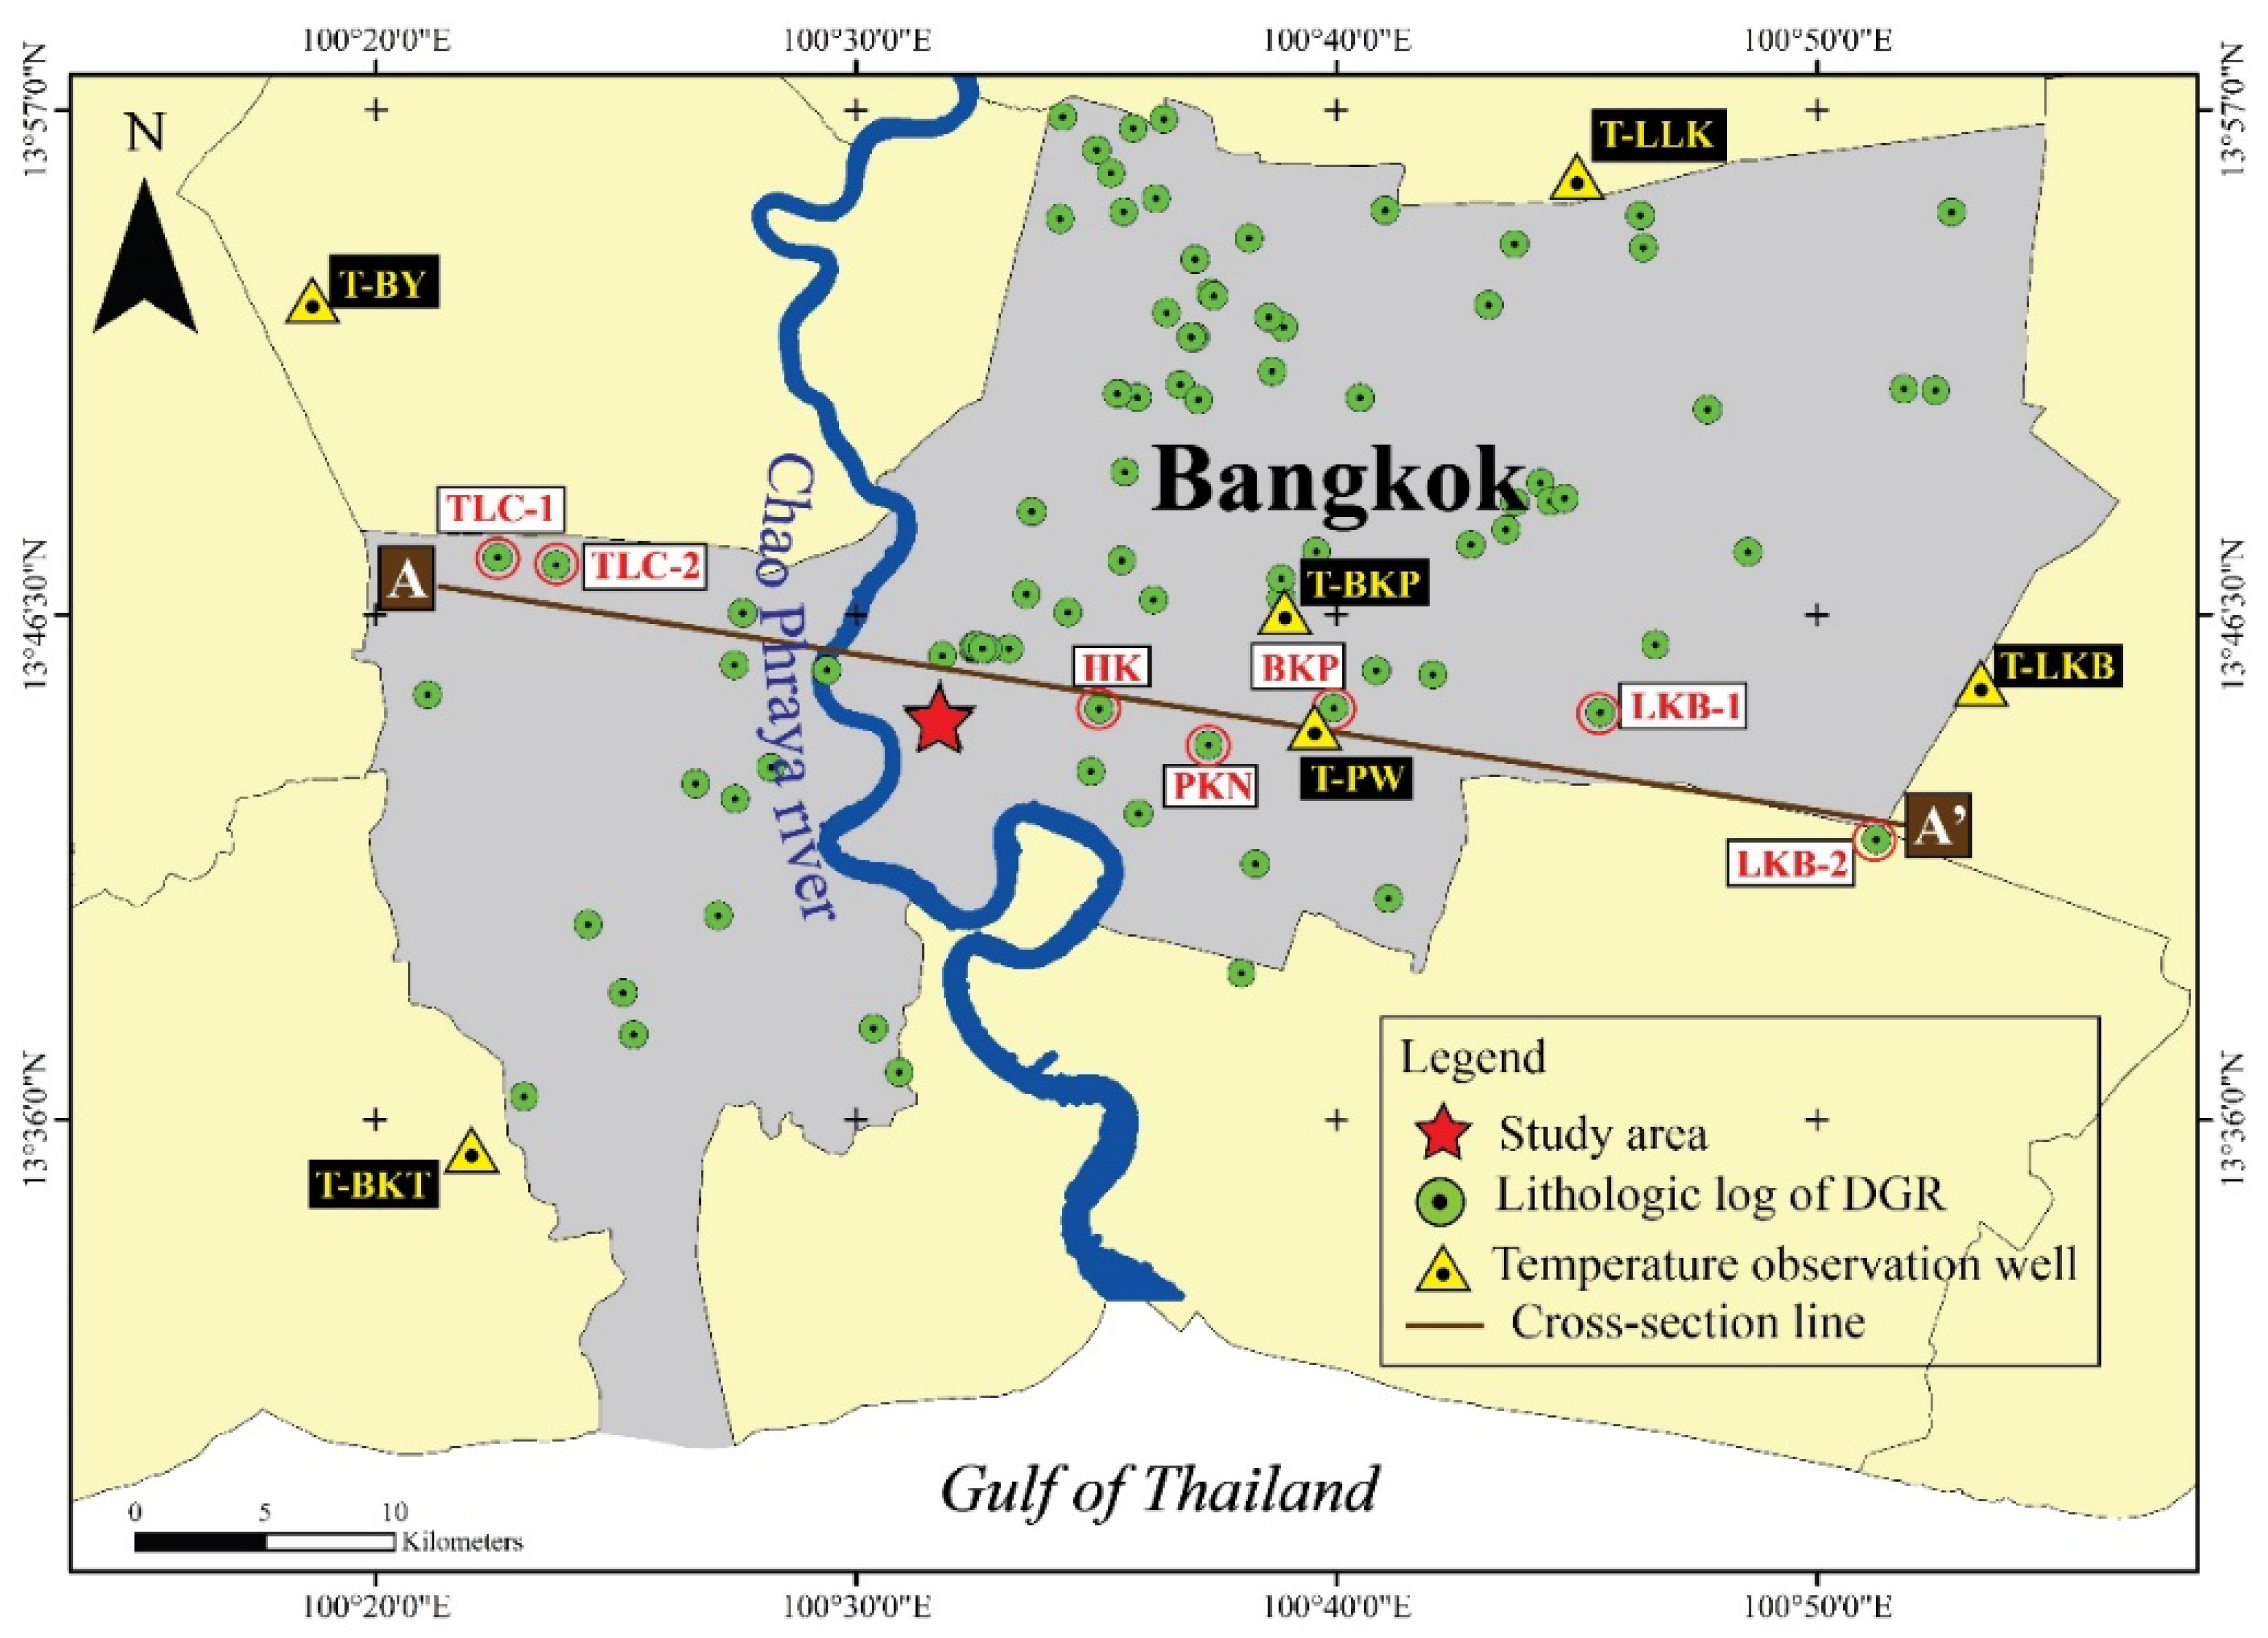
2.1. Geology and Underground Temperature of Bangkok Area
- -
- The 1st layer has a thickness of up to 20 m and consists mainly of clay with high plasticity and homogeneity.
- -
- The 2nd layer has an average thickness of 6 m and consists principally of pale brown to yellowish brown sandy clay. It is composed of 60% clay with moderate plasticity and heterogeneity and 40% sand with fine to medium grain sizes, relatively poorly sorted grains, and sub-angular shapes. Mineralogically, it is comprised essentially of quartz with subordinate feldspar and rock fragments.
- -
- The 3rd layer has an average thickness of 15 m and consists of pale brown sand with fine to medium grain sizes, good sorted grains, and sub-angular shapes. It is mostly composed of quartz with subordinate feldspar, rock fragments, and clay minerals.
- -
- The 4th layer has an average thickness of 9 m and comprises yellowish brown clay with moderate plasticity and a heterogeneous mixture of medium sand and silt.
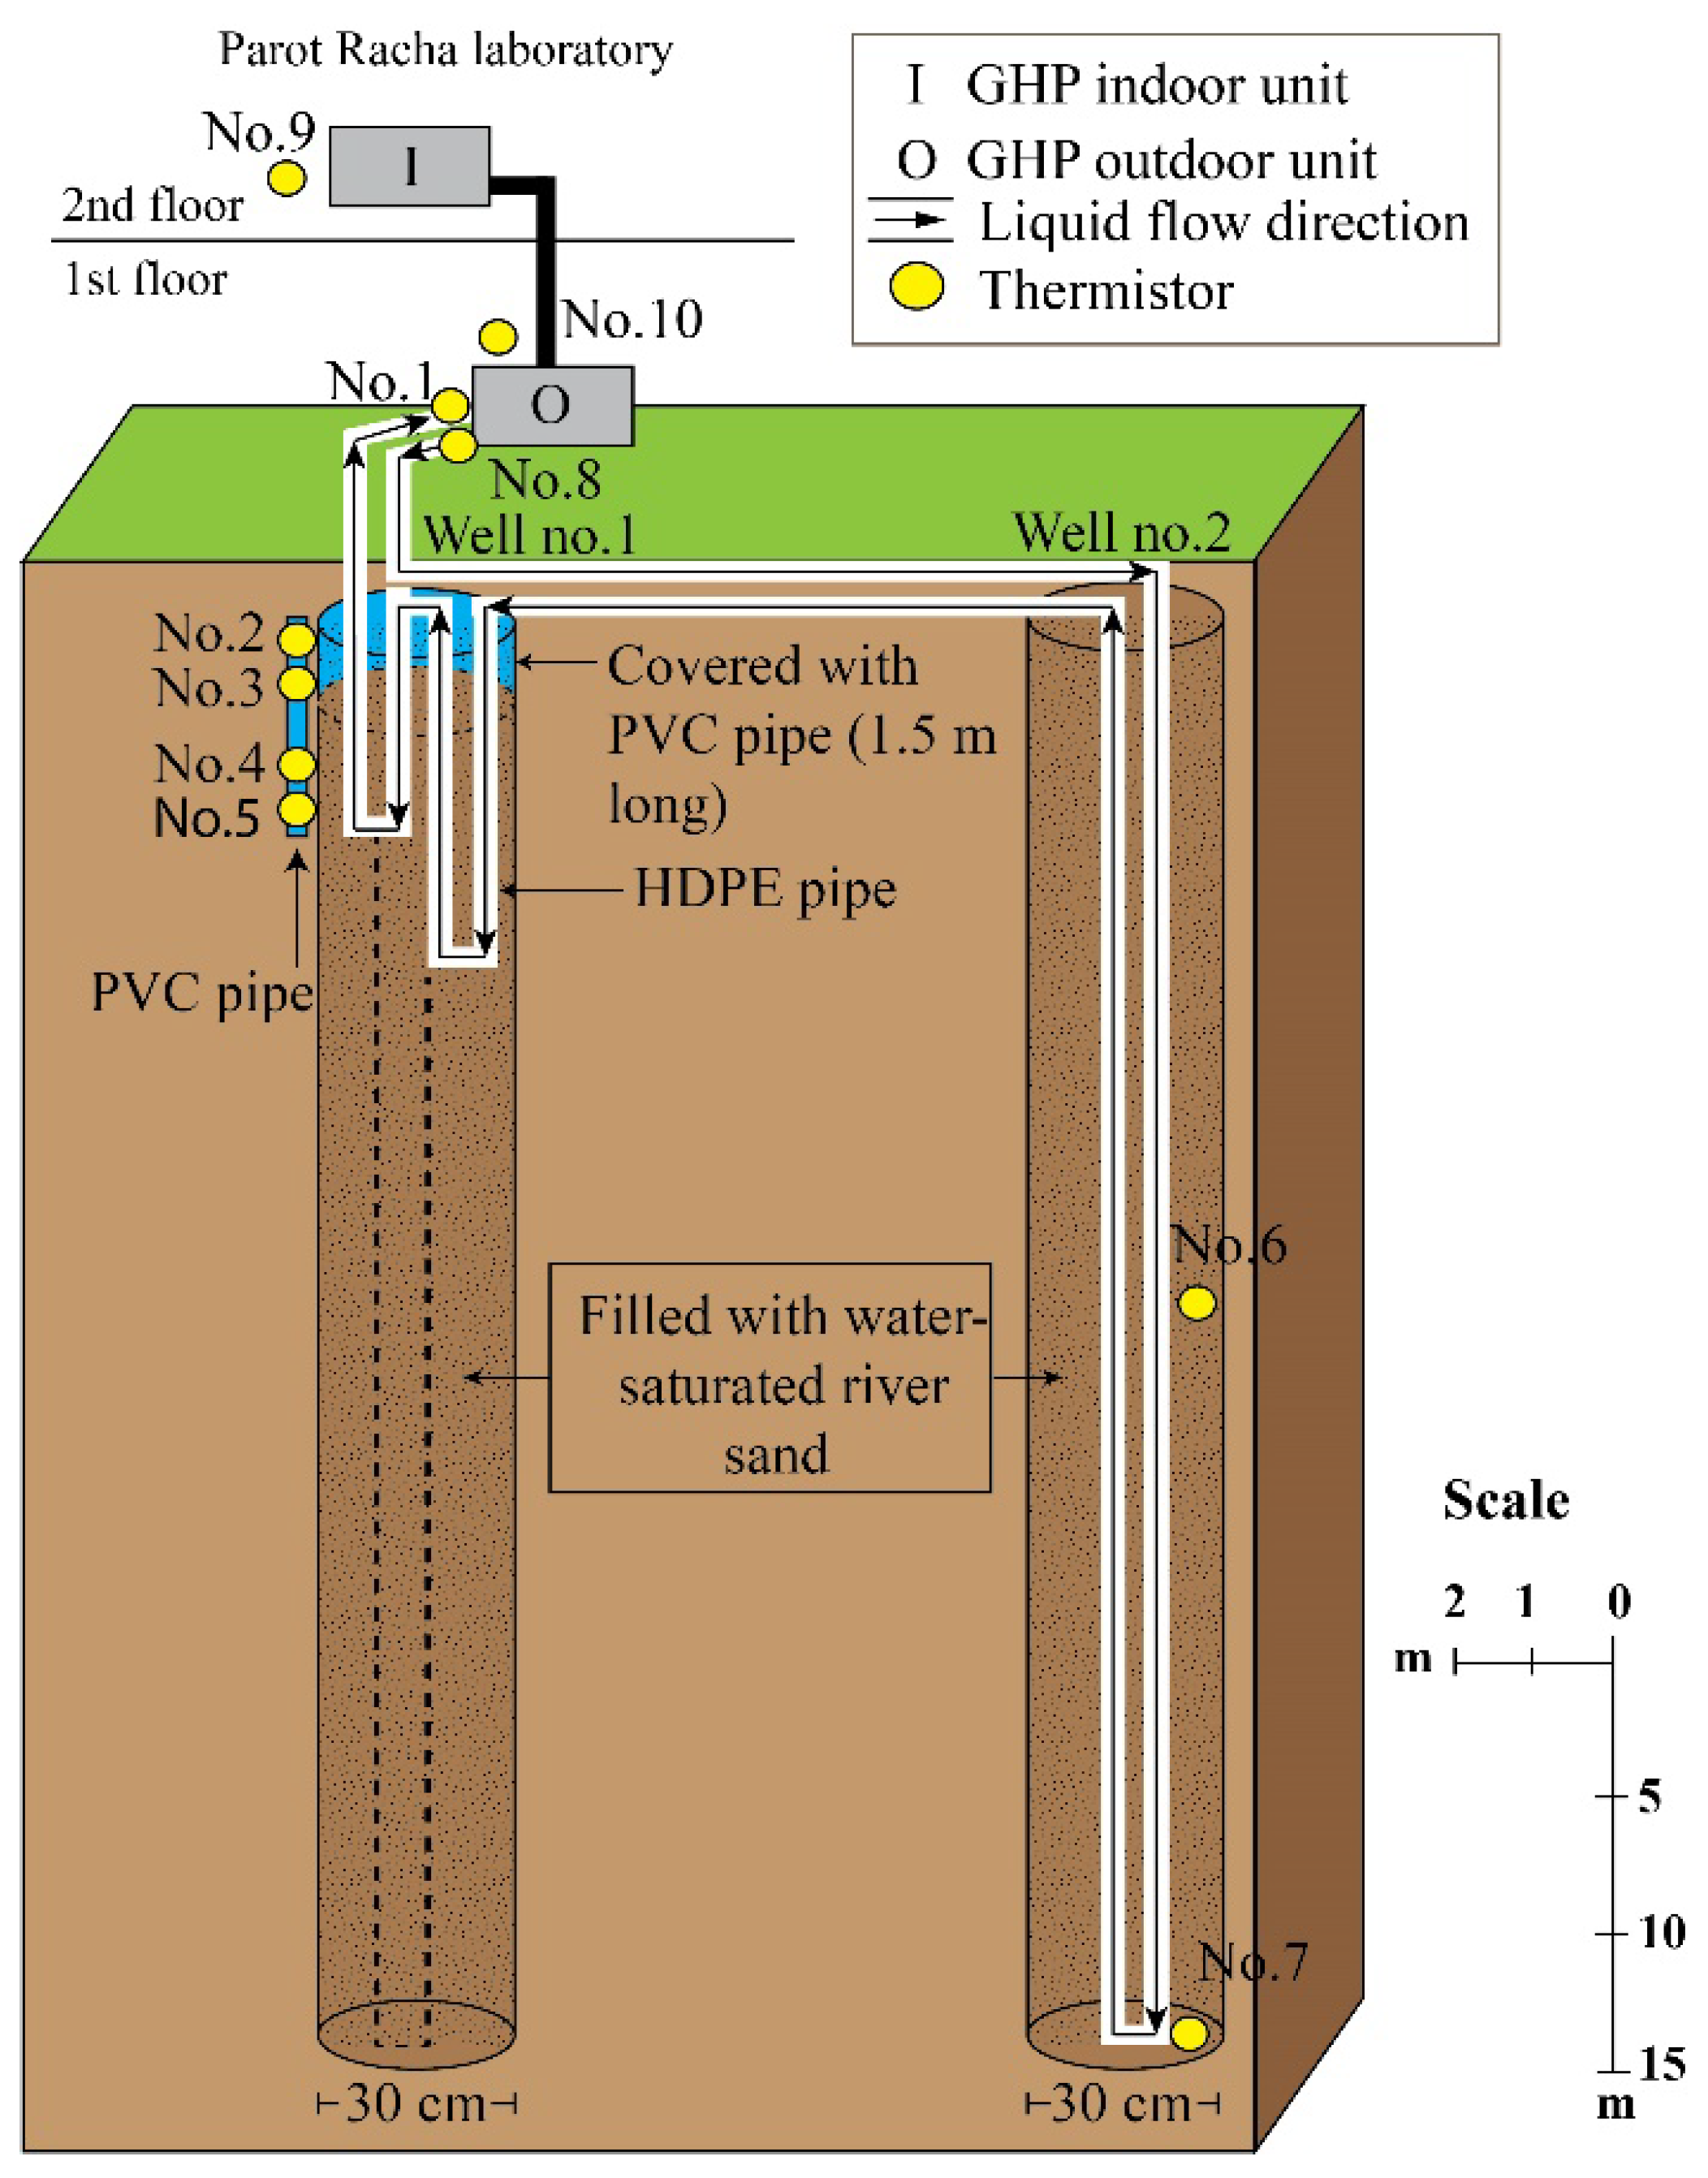
2.2. System Setting for GHP Experiment
3. Results
3.1. Stratigraphy of Wells for System Setting
3.2. Operation and Data Acquisition
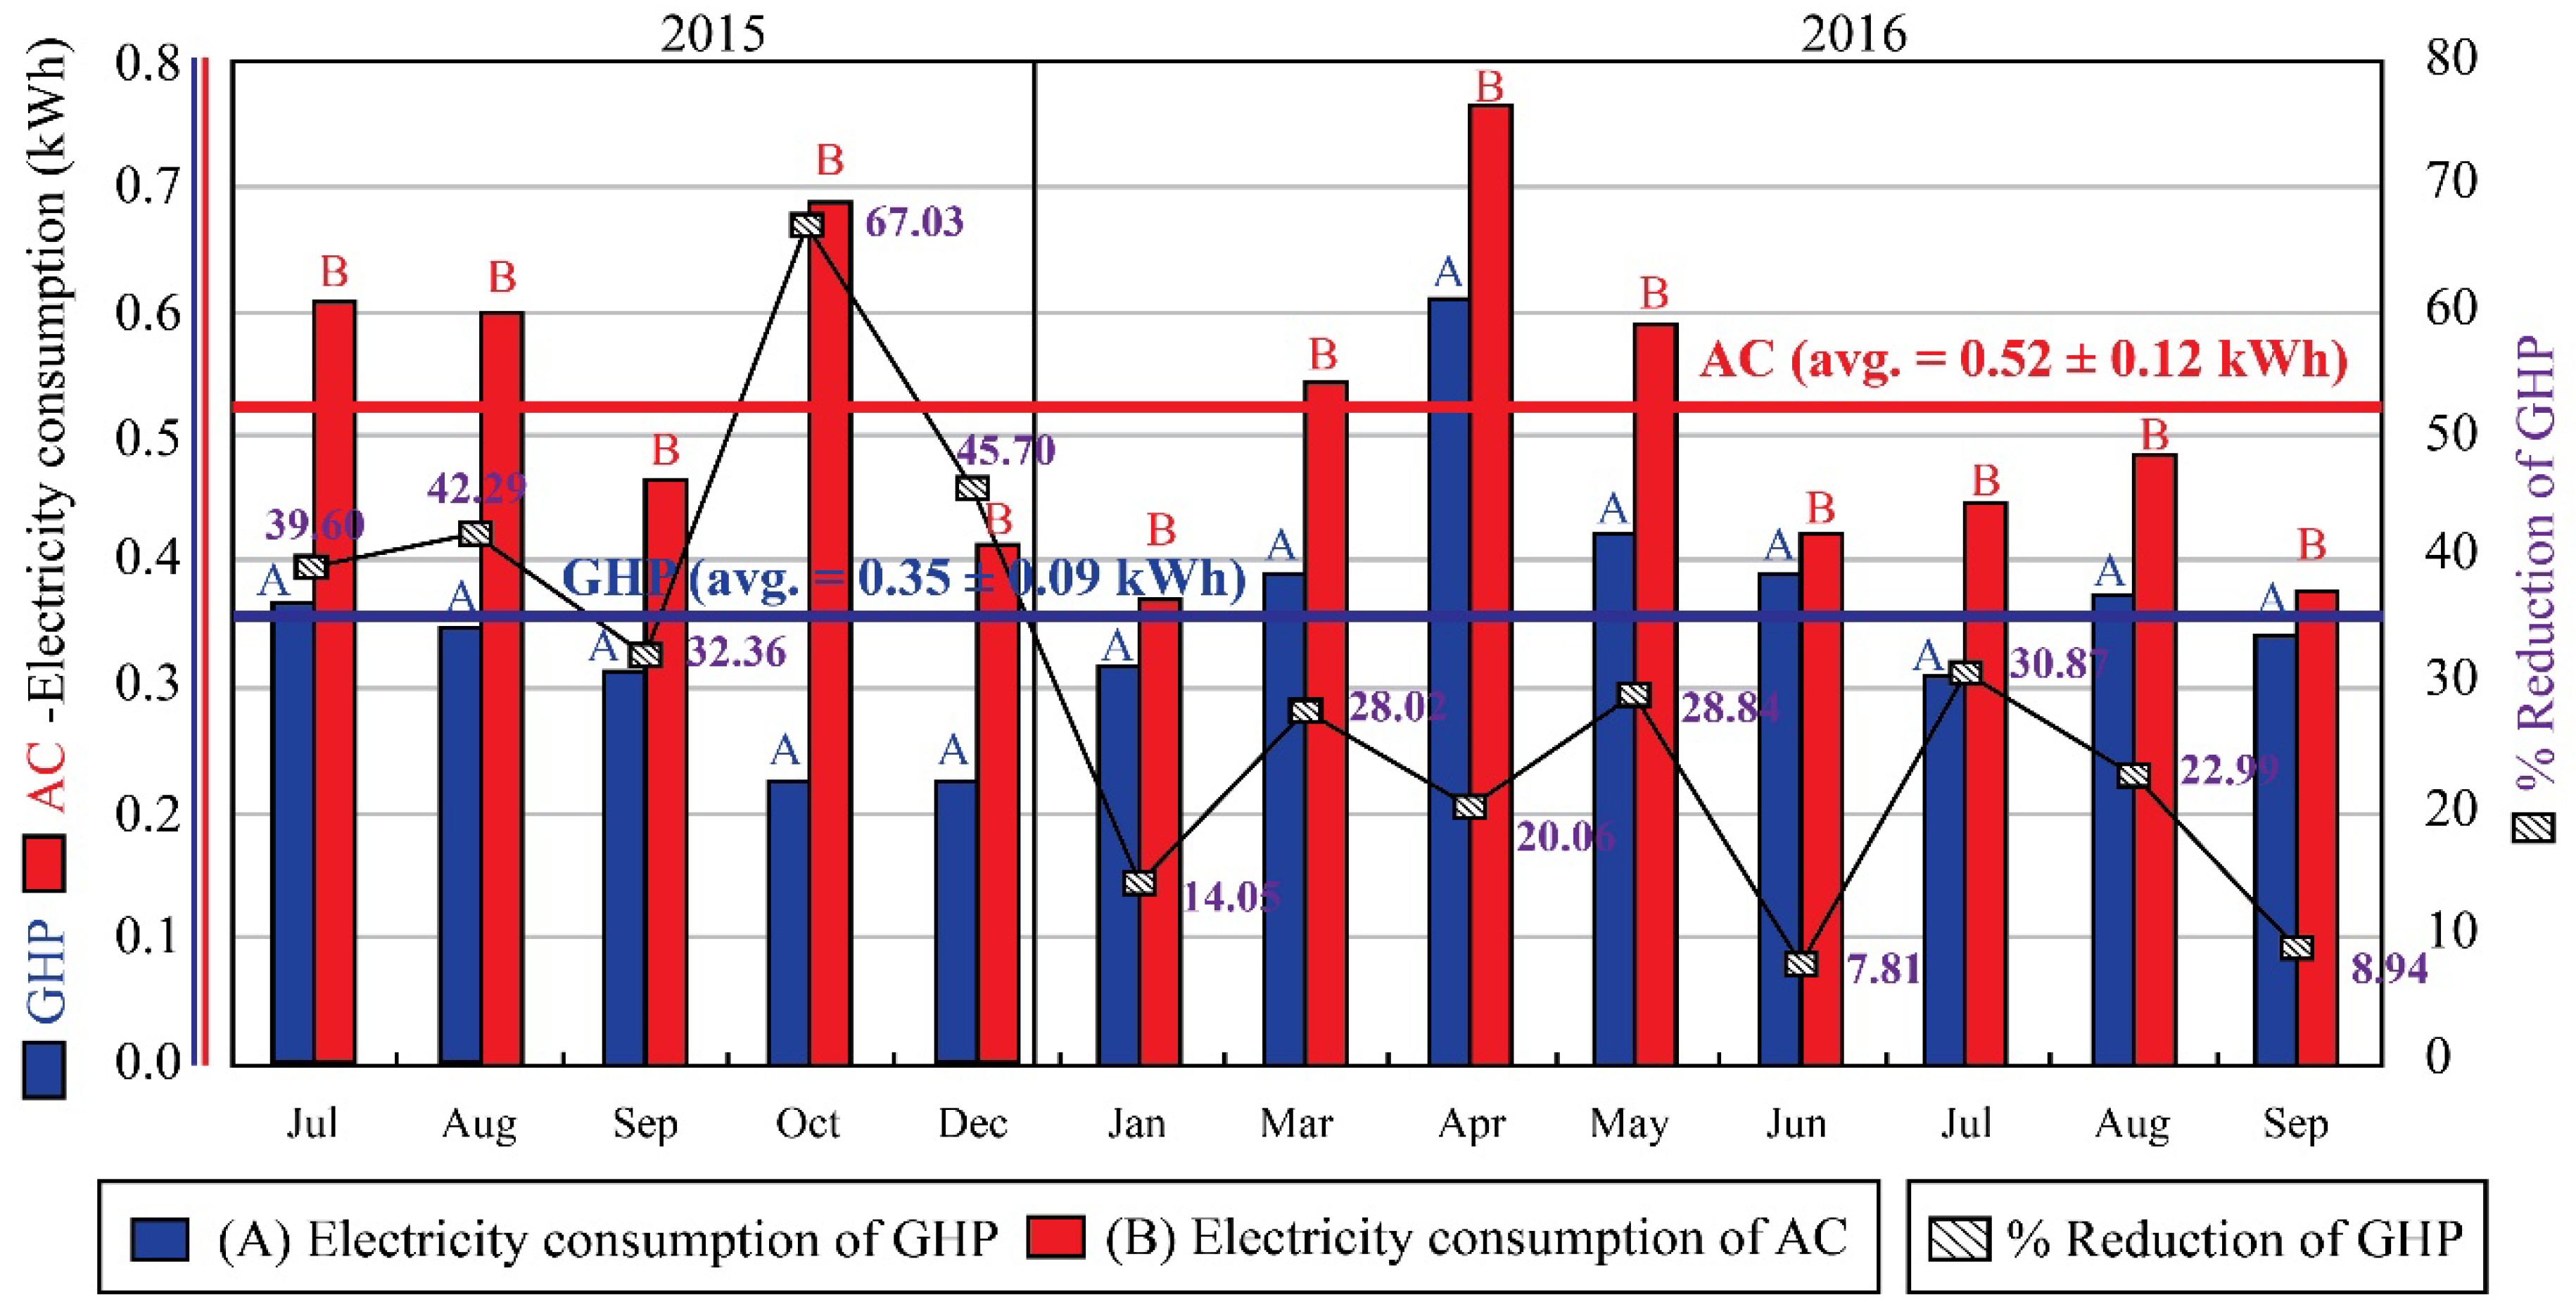
3.3. Electricity Consumption
4. Discussion
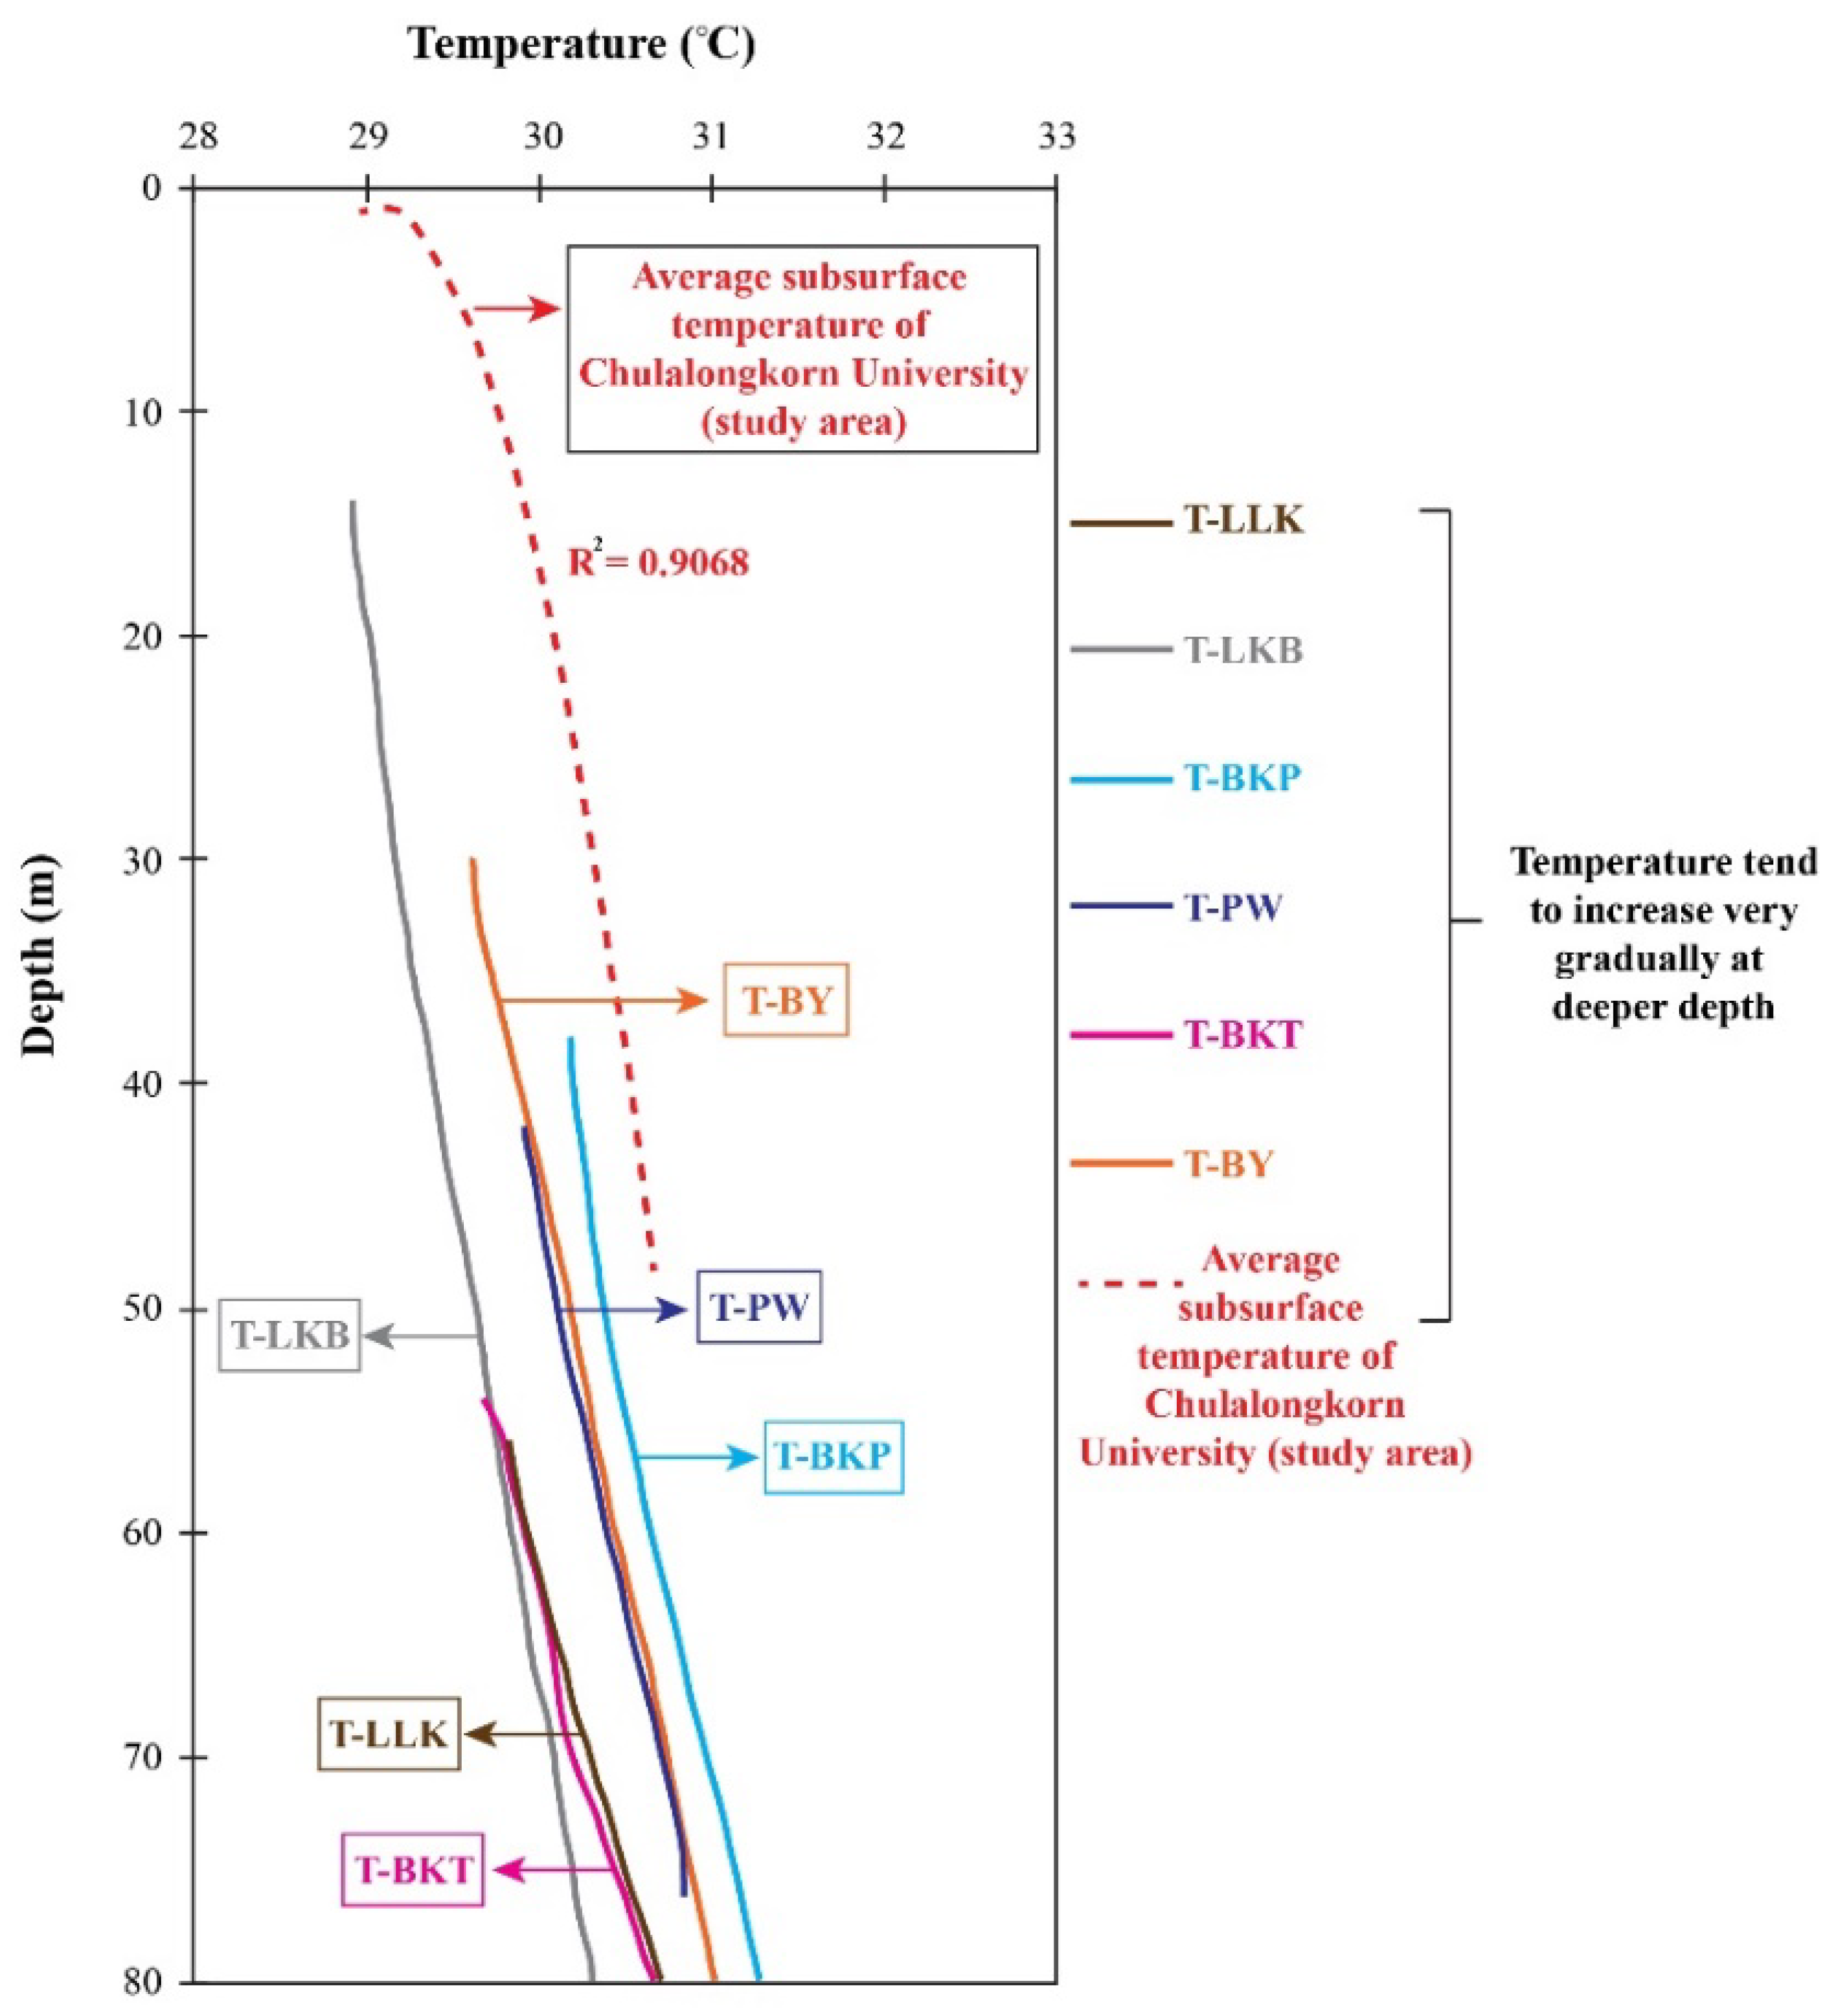
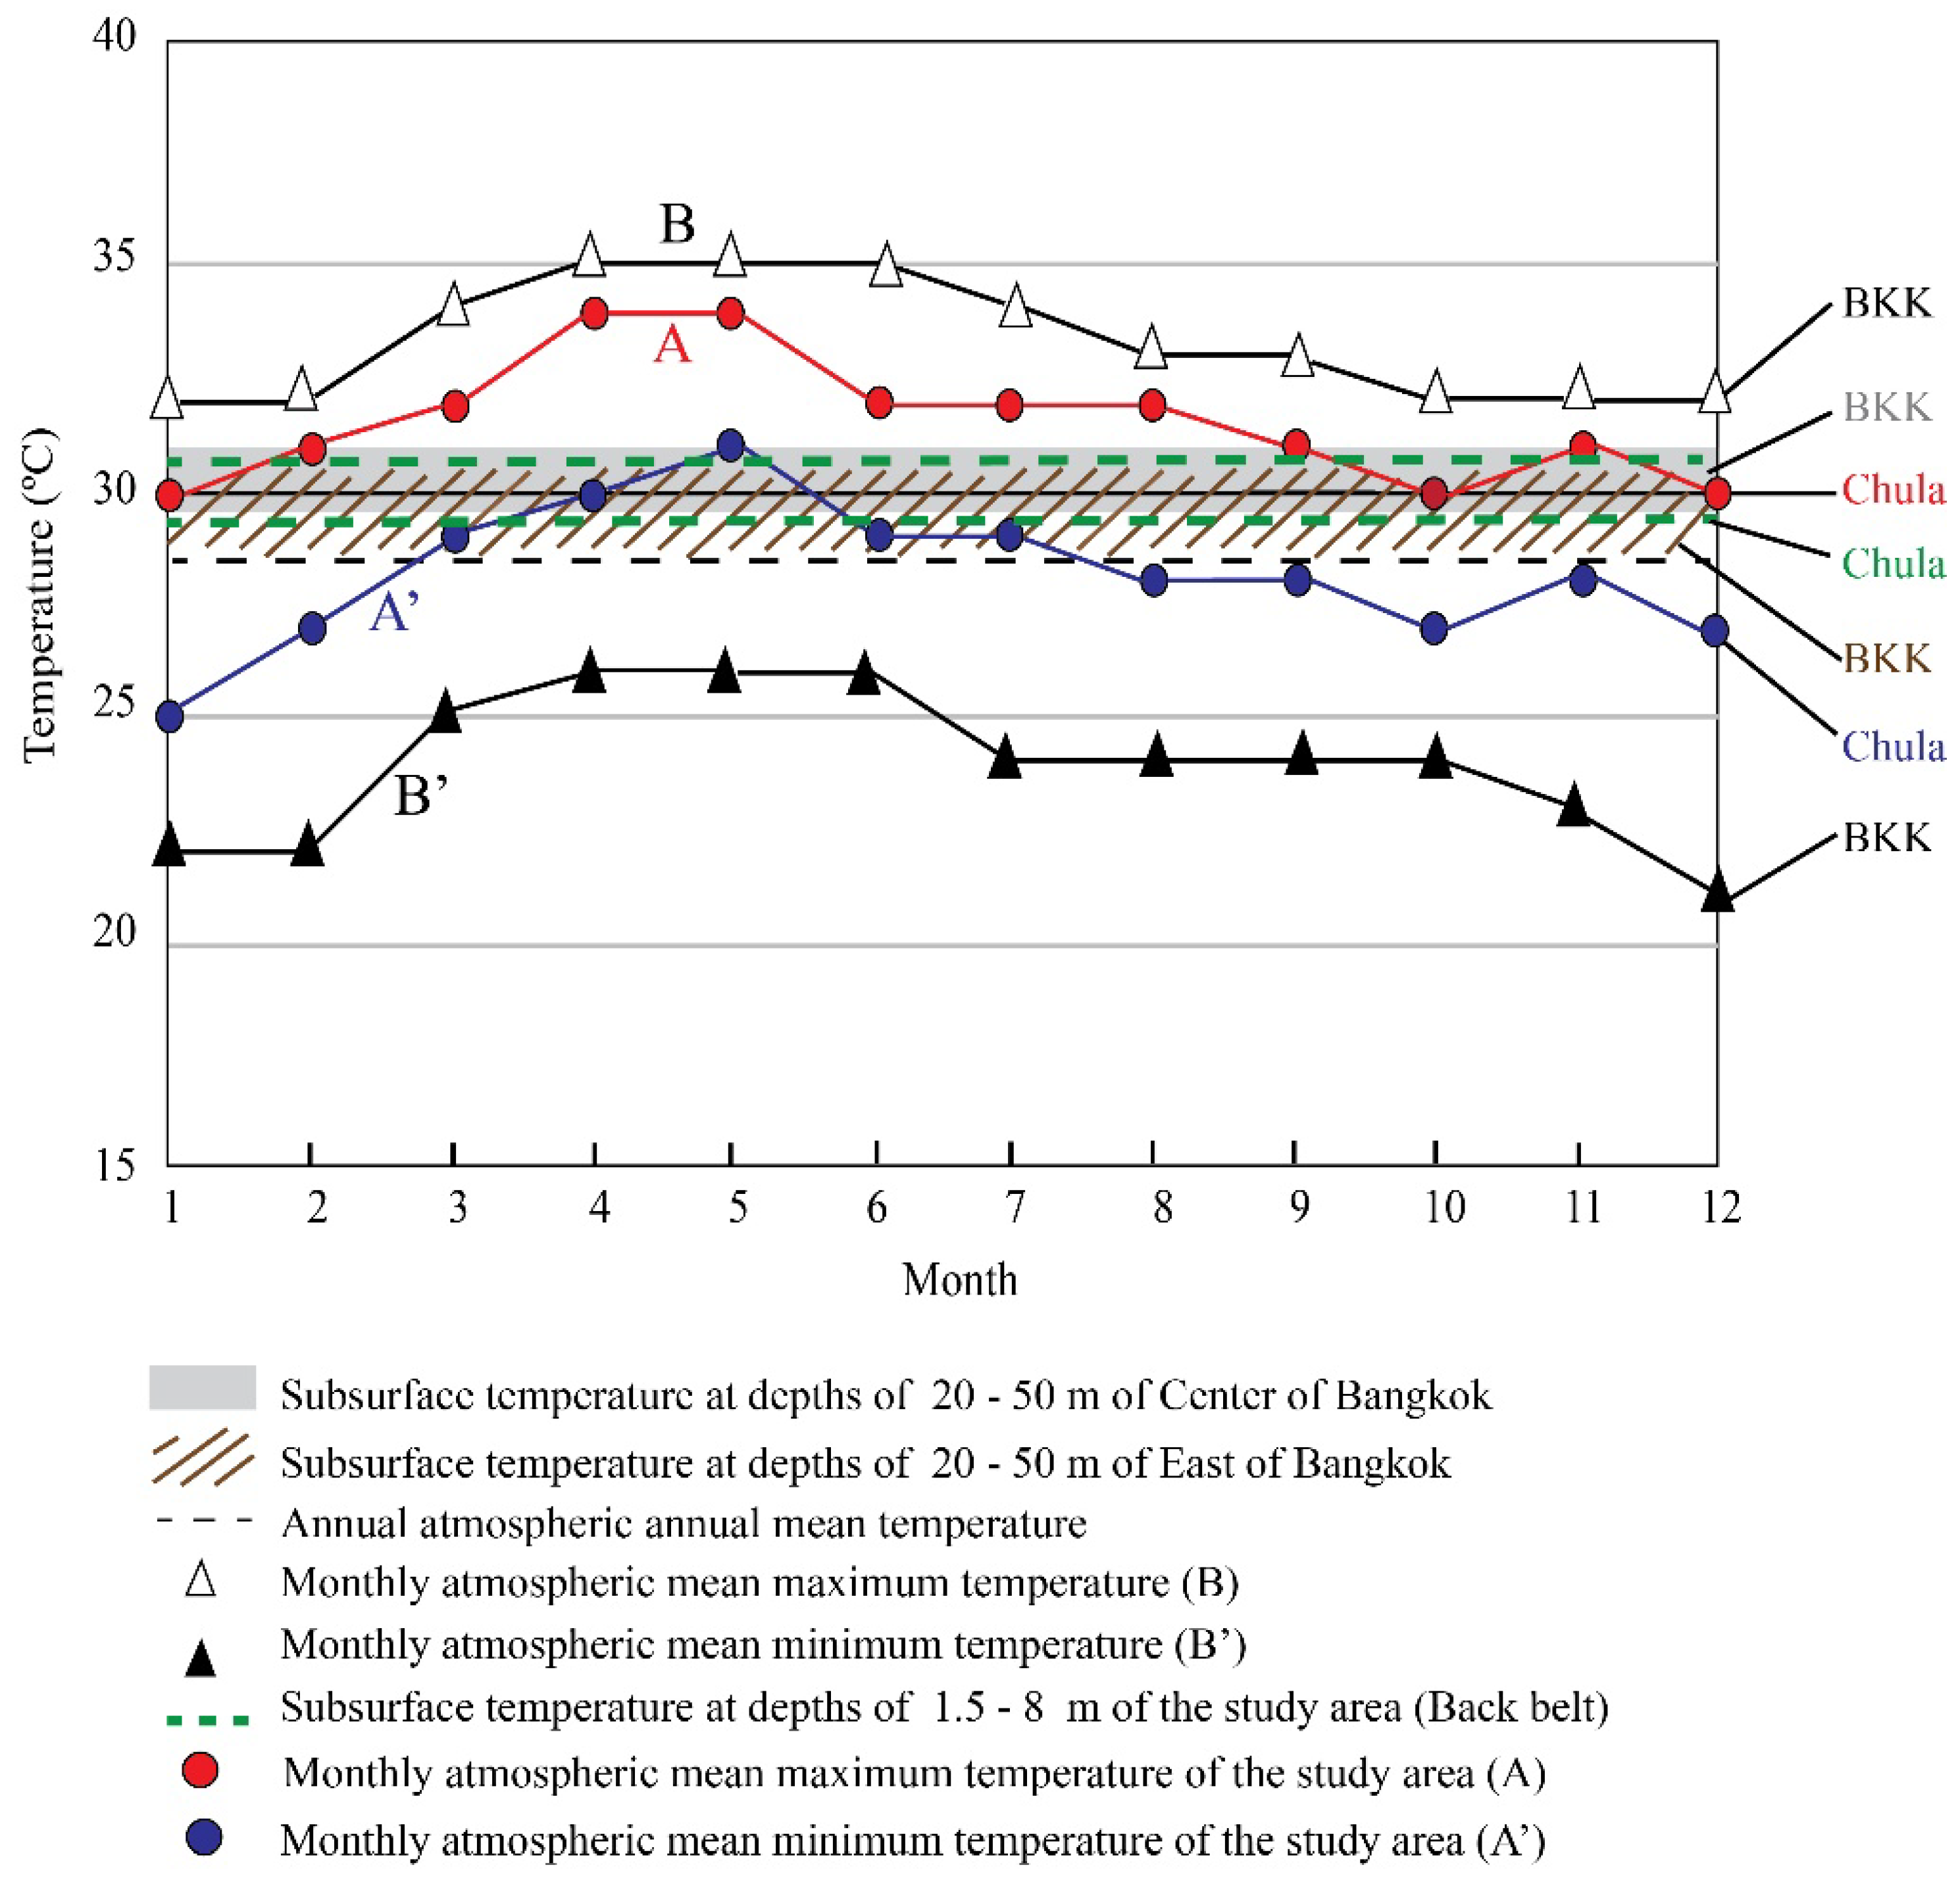
4.1. Comparisons between Subsurface Temperatures and Outside Air Temperatures
4.2. Suitable Depth for Heat Exchange Wells
4.3. Factors of Energy Saving
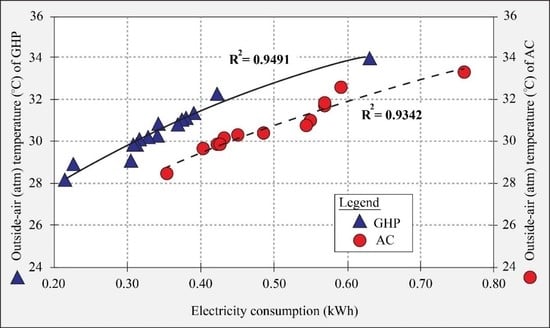
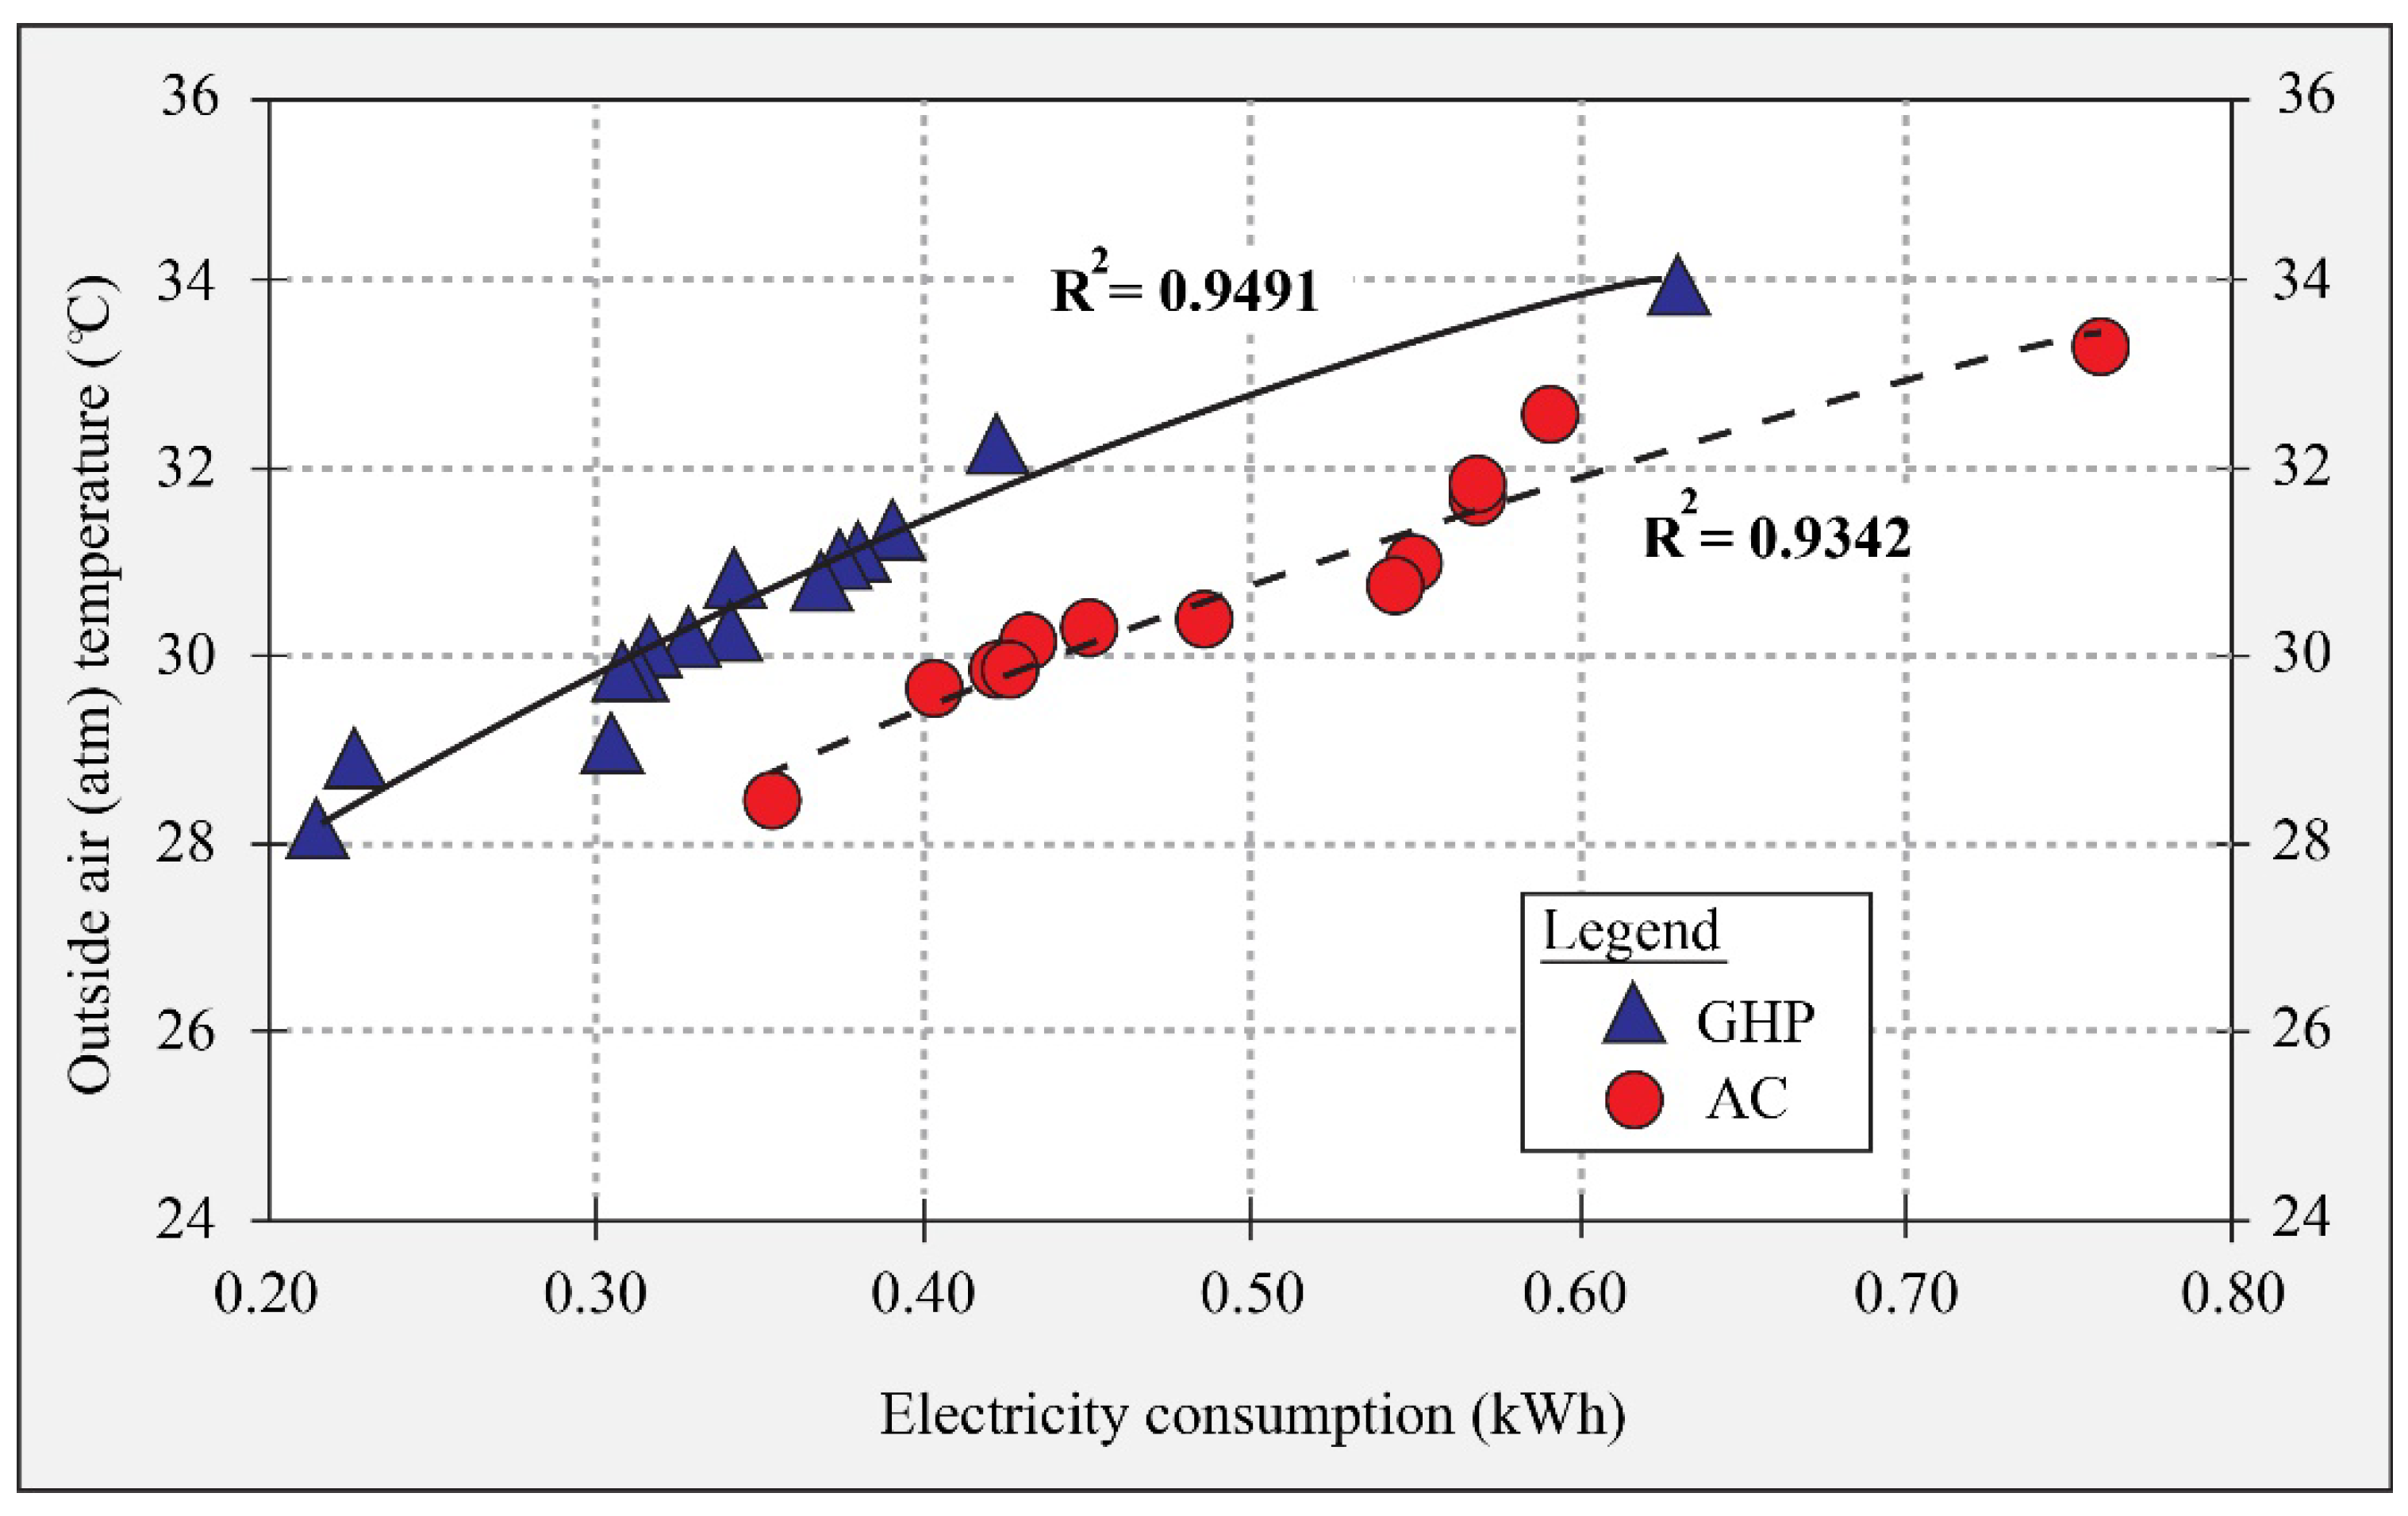
4.3.1. Outside Air Temperatures
4.3.2. Humidity
4.4. Coefficient of Performance (COP)
4.5. Interpretation of the Results and Importance of This Study
5. Conclusions
- (1)
- The suitable depth of GHP piping should be lower than that of the water table (25 to 50 m in eastern Bangkok, 30 to 50 m in the western part of Bangkok, and 25 to 30 m in central Bangkok). However, for the actual site selection other factors must be considered.
- (2)
- The underground temperatures of Bangkok area range between 29 to 31 °C at the depth of 0 to 50 m. These temperatures are 1 to 1.5 °C different depending on the location. Our GHP experiment indicates good electricity saving even when the site is located on a relatively high underground temperature area.
- (3)
- A comparison was made between the GHP and the normal air conditioner (AC) in the same room with similar specifications, and it was found that the electricity consumption was reduced by about 30% when using of the GHP system.
- (4)
- The electricity consumption showed clear a relation to the atmospheric temperature, namely, high electric consumption was recorded in high-temperature days and vice versa. The COP was in the range between 6.7 and 2.3 with an average of 4.38 showed also the same tendency. For humidity, we could not directly show relation with the power consumption of the cooling system.
- (5)
- The inlet and outlet temperature was 34.2 °C and 36.0 °C in April 2015. Even with such high temperatures of the circulating cooling water, the energy saving was very good. It is further recommended that the horizontal-loop GHP system should be compared with the vertical-loop system.
- (6)
- In economic point of view, the installation cost of GHP system was higher than normal air conditioner. There was an advantage of GHP system after operating for 14 years [35].
- (7)
- In the future research, it would be interesting to perform a building model validation for precise prediction of energy saving in building [36].
Author Contributions
Funding
Acknowledgments
Conflicts of Interest
References
- Qian, H.; Wang, Y. Modeling the interactions between the performance of ground source heat pumps and soil temperature variations. Energy Sustain. Dev. 2014, 23, 115–121. [Google Scholar] [CrossRef]
- Fujii, H.; Inatomi, T.; Itoi, R.; Uchida, Y. Development of suitability maps for ground-coupled heat pump systems using groundwater and heat transport models. Geothermics 2007, 36, 459–472. [Google Scholar] [CrossRef]
- Lund, R.; Ilic, D.D.; Trygg, L. Socioeconomic potential for introducing large-scale heat pumps in district heating in Denmark. J. Clean Prod. 2016, 139, 219–229. [Google Scholar] [CrossRef]
- Majuri, P. Ground source heat pumps and environmental policy—The Finnish practitioner’s point of view. J. Clean. Prod. 2016, 139, 740–749. [Google Scholar] [CrossRef]
- Sanner, B. Prospect for Ground Source Heat Pumps in Europe. Newsl. IEA Heat Pump Cent. 1999, 17, 19–20. [Google Scholar]
- Rybach, L.; Sanner, B. Ground-source heat pump systems the European experience. GHC Bull. 2000, 21, 16–26. [Google Scholar]
- Lienau, P.J. Geothermal heat pumps performance and utility programs in the United States. Energy Sources 1997, 19, 1–8. [Google Scholar] [CrossRef]
- Petit, P.J.; Meyer, J.P. A techno-economic analytical comparison of the performance of air-source and horizontal-ground-source air-conditioners in South Africa. Int. J. Energy Res. 1997, 21, 1011–1021. [Google Scholar] [CrossRef]
- Wang, H.; Luo, Y.; Feng, G.; Li, G.; Liu, X.; Bai, B.; Chi, L. Measurement and analysis of the groundwater source heat pump system in Shenyang. Procedia Eng. 2015, 121, 1389–1396. [Google Scholar] [CrossRef]
- Zheng, K.; Mo, Y.; Chen, L. Twenty years of Geothermal Heat Pumps in China. In Proceedings of the World Geothermal Congress, Melbourne, Australia, 19–25 April 2015; pp. 1–4. [Google Scholar]
- Chang, Y.; Gu, Y.; Zhang, L.; Wu, C.; Liang, L. Energy and environmental implications of using geothermal heat pumps in buildings: An example from north China. J. Clean. Prod. 2017, 167, 484–492. [Google Scholar] [CrossRef]
- Tarnawski, V.R.; Leong, W.H.; Momose, T.; Hamada, Y. Analysis of ground source heat pumps with horizontal ground heat exchangers for northern Japan. Renew. Energy 2009, 34, 127–134. [Google Scholar] [CrossRef]
- Tsubaki, K.; Mitsutake, Y. Ground Source Heat Pump System Controlled by Refrigerant Average Density. Procedia Eng. 2015, 105, 153–159. [Google Scholar] [CrossRef]
- Blum, P.; Campillo, G.; Münch, W.; Kölbel, T. CO2 savings of ground source heat pump systems—A regional analysis. Renew. Energy 2010, 35, 122–127. [Google Scholar] [CrossRef]
- Bayer, P.; Saner, D.; Bolay, S.; Rybach, L.; Blum, P. Greenhouse gas emission savings of ground source heat pump systems in Europe: A review. Renew. Sustain. Energy Rev. 2012, 16, 1256–1267. [Google Scholar] [CrossRef]
- Li, H.; Xu, W.; Yu, Z.; Wu, J.; Sun, Z. Application analyze of a ground source heat pump system in a nearly zero energy building in China. Energy 2017, 125, 140–151. [Google Scholar] [CrossRef]
- Yasukawa, K.; Takashima, I.; Uchida, Y.; Tenma, N.; Lorphensri, O. Geothermal heat pump application for space cooling in Kamphaengphet, Thailand. Bull. Geol. Surv. Jpn. 2009, 60, 491–501. [Google Scholar] [CrossRef]
- Uchida, Y.; Yasukawa, K.; Tenma, N.; Taguchi, Y.; Suwanlert, J.; Buapeng, S. Subsurface Thermal Regime in the Chao-Phraya Plain, Thailand. Bull. Geol. Surv. Jpn. 2009, 60, 469–489. [Google Scholar] [CrossRef]
- Permchart, W.; Tanatvanit, S. Study on using the ground as g heat sink for a 12,000-Btu/h modified air conditioner. World Acad. Sci. Eng. Technol. Int. J. Agric. Biosyst. Eng. 2009, 3, 120–123. [Google Scholar]
- Takashima, I.; Yasukawa, K.; Uchida, Y.; Yoshioka, M.; Won-In, K. A Geothermal Heat Pump System in Bangkok, Thailand. In Proceedings of the 9th Asian Geothermal Symposium, Kagoshima, Japan, 7–9 November 2011; pp. 96–101. [Google Scholar]
- Yasukawa, K.; Uchida, Y.; Tenma, N.; Taguchi, Y.; Muraoka, H.; Ishii, T.; Suwanlert, J.; Buapeng, S.; Nguyen, T.H. Groundwater temperature survey for geothermal heat pump application in tropical Asia. Bull. Geol. Surv. Jpn. 2009, 60, 459–467. [Google Scholar] [CrossRef]
- Department of Mineral Resources (DMR). Geology of Thailand: The Royal Crest Commemorating the 6th Cycle Birthday Anniversary 5th December 2009; DMR: Bangkok, Thailand, 2011. (In Thailand)
- Piancharoen, C. Ground water and land subsidence in Bangkok, Thailand. In Proceedings of the Anaheim Symposium, Anaheim, CA, USA, 13–17 December 1976. [Google Scholar]
- Suwanwiwattana, P.; Chantawarangul, K.; Mairaing, W.; Apaphant, P. The development of Geotechnical database of Bangkok subsoil using GRASS-GIS. In Proceedings of the 22nd Asian Conference on Remote Sensing, Singapore, 5–9 November 2001. [Google Scholar]
- Sinsakul, S. Late Quaternary geology of the Lower Central Plain, Thailand. J Asian Earth Sci. 2000, 18, 415–426. [Google Scholar] [CrossRef]
- Schuenemeyer, J.H.; Drew, L.J. Statistics for Earth and Environmental Scientists; John Wiley & Sons Inc.: Hoboken, NJ, USA, 2011. [Google Scholar]
- Dehkordi, S.E.; Schincariol, R.A. Effect of thermal-hydrogeological and borehole heat exchanger properties on performance and impact of vertical closed-loop geothermal heat pump systems. Hydrogeol. J. 2014, 22, 189–203. [Google Scholar] [CrossRef]
- Yoshioka, M.; Takakura, S.; Uchida, Y. Estimation of groundwater flow from temperature monitoring in a borehole heat exchanger during a thermal response test. Hydrogeol. J. 2017, 1–15. [Google Scholar] [CrossRef]
- Sommer, W.T.; Doornenbal, P.J.; Drijver, B.C.; van Gaans, P.F.M.; Leusbrock, I.; Grotenhuis, J.T.C.; Rijnaarts, H.H.M. Thermal performance and heat transport in aquifer thermal energy storage. Hydrogeol. J. 2014, 22, 263–279. [Google Scholar] [CrossRef]
- Galgaro, A.; Emmi, G.; Zarrella, A.; De Carli, M. Possible applications of ground coupled heat pumps in high geothermal gradient zones. Energy Build. 2014, 79, 12–22. [Google Scholar] [CrossRef]
- National Rural Electric Cooperative Association; Oklahoma State University; Division of Engineering Technology. Closed-Loop/Ground-Source Heat Pump Systems: Installation Guide; International Ground Source Heat Pump Association: Stillwater, OK, USA, 1988. [Google Scholar]
- Zhai, X.Q.; Yu, X.; Yang, Y.; Wang, R.Z. Experimental investigation and performance analysis of a ground-coupled heat pump system. Geothermics 2013, 48, 112–120. [Google Scholar] [CrossRef]
- Luo, J.; Rohn, J.; Bayer, M.; Priess, A.; Wilkmann, L.; Xiang, W. Heating and cooling performance analysis of a ground source heat pump system in Southern Germany. Geothermics 2015, 53, 57–66. [Google Scholar] [CrossRef]
- Lund, J.W.; Boyd, T.L. Direct utilization of geothermal energy 2015 worldwide review. Geothermics 2016, 60, 66–93. [Google Scholar] [CrossRef]
- Shimada, Y.; Kurishima, H.; Uchida, Y. Environmental and cost evaluation of introduction of ground source heat pump in Bangkok, Thailand. In Proceedings of the Grand Renewable Energy 2018 International Conference and Exhibition, Yokohama, Japan, 17–22 June 2018. [Google Scholar]
- Salvalai, G.; Pfafferott, J.; Jacob, D. Validation of a low-energy whole building simulation model. In Proceedings of the SIMBUILD Conference, New York, NY, USA, 11–13 August 2010; pp. 32–39. [Google Scholar]


| Date | Time | Subsurface Temperature (°C) | |||
|---|---|---|---|---|---|
| 8 m | 10 m | 25 m | 50 m | ||
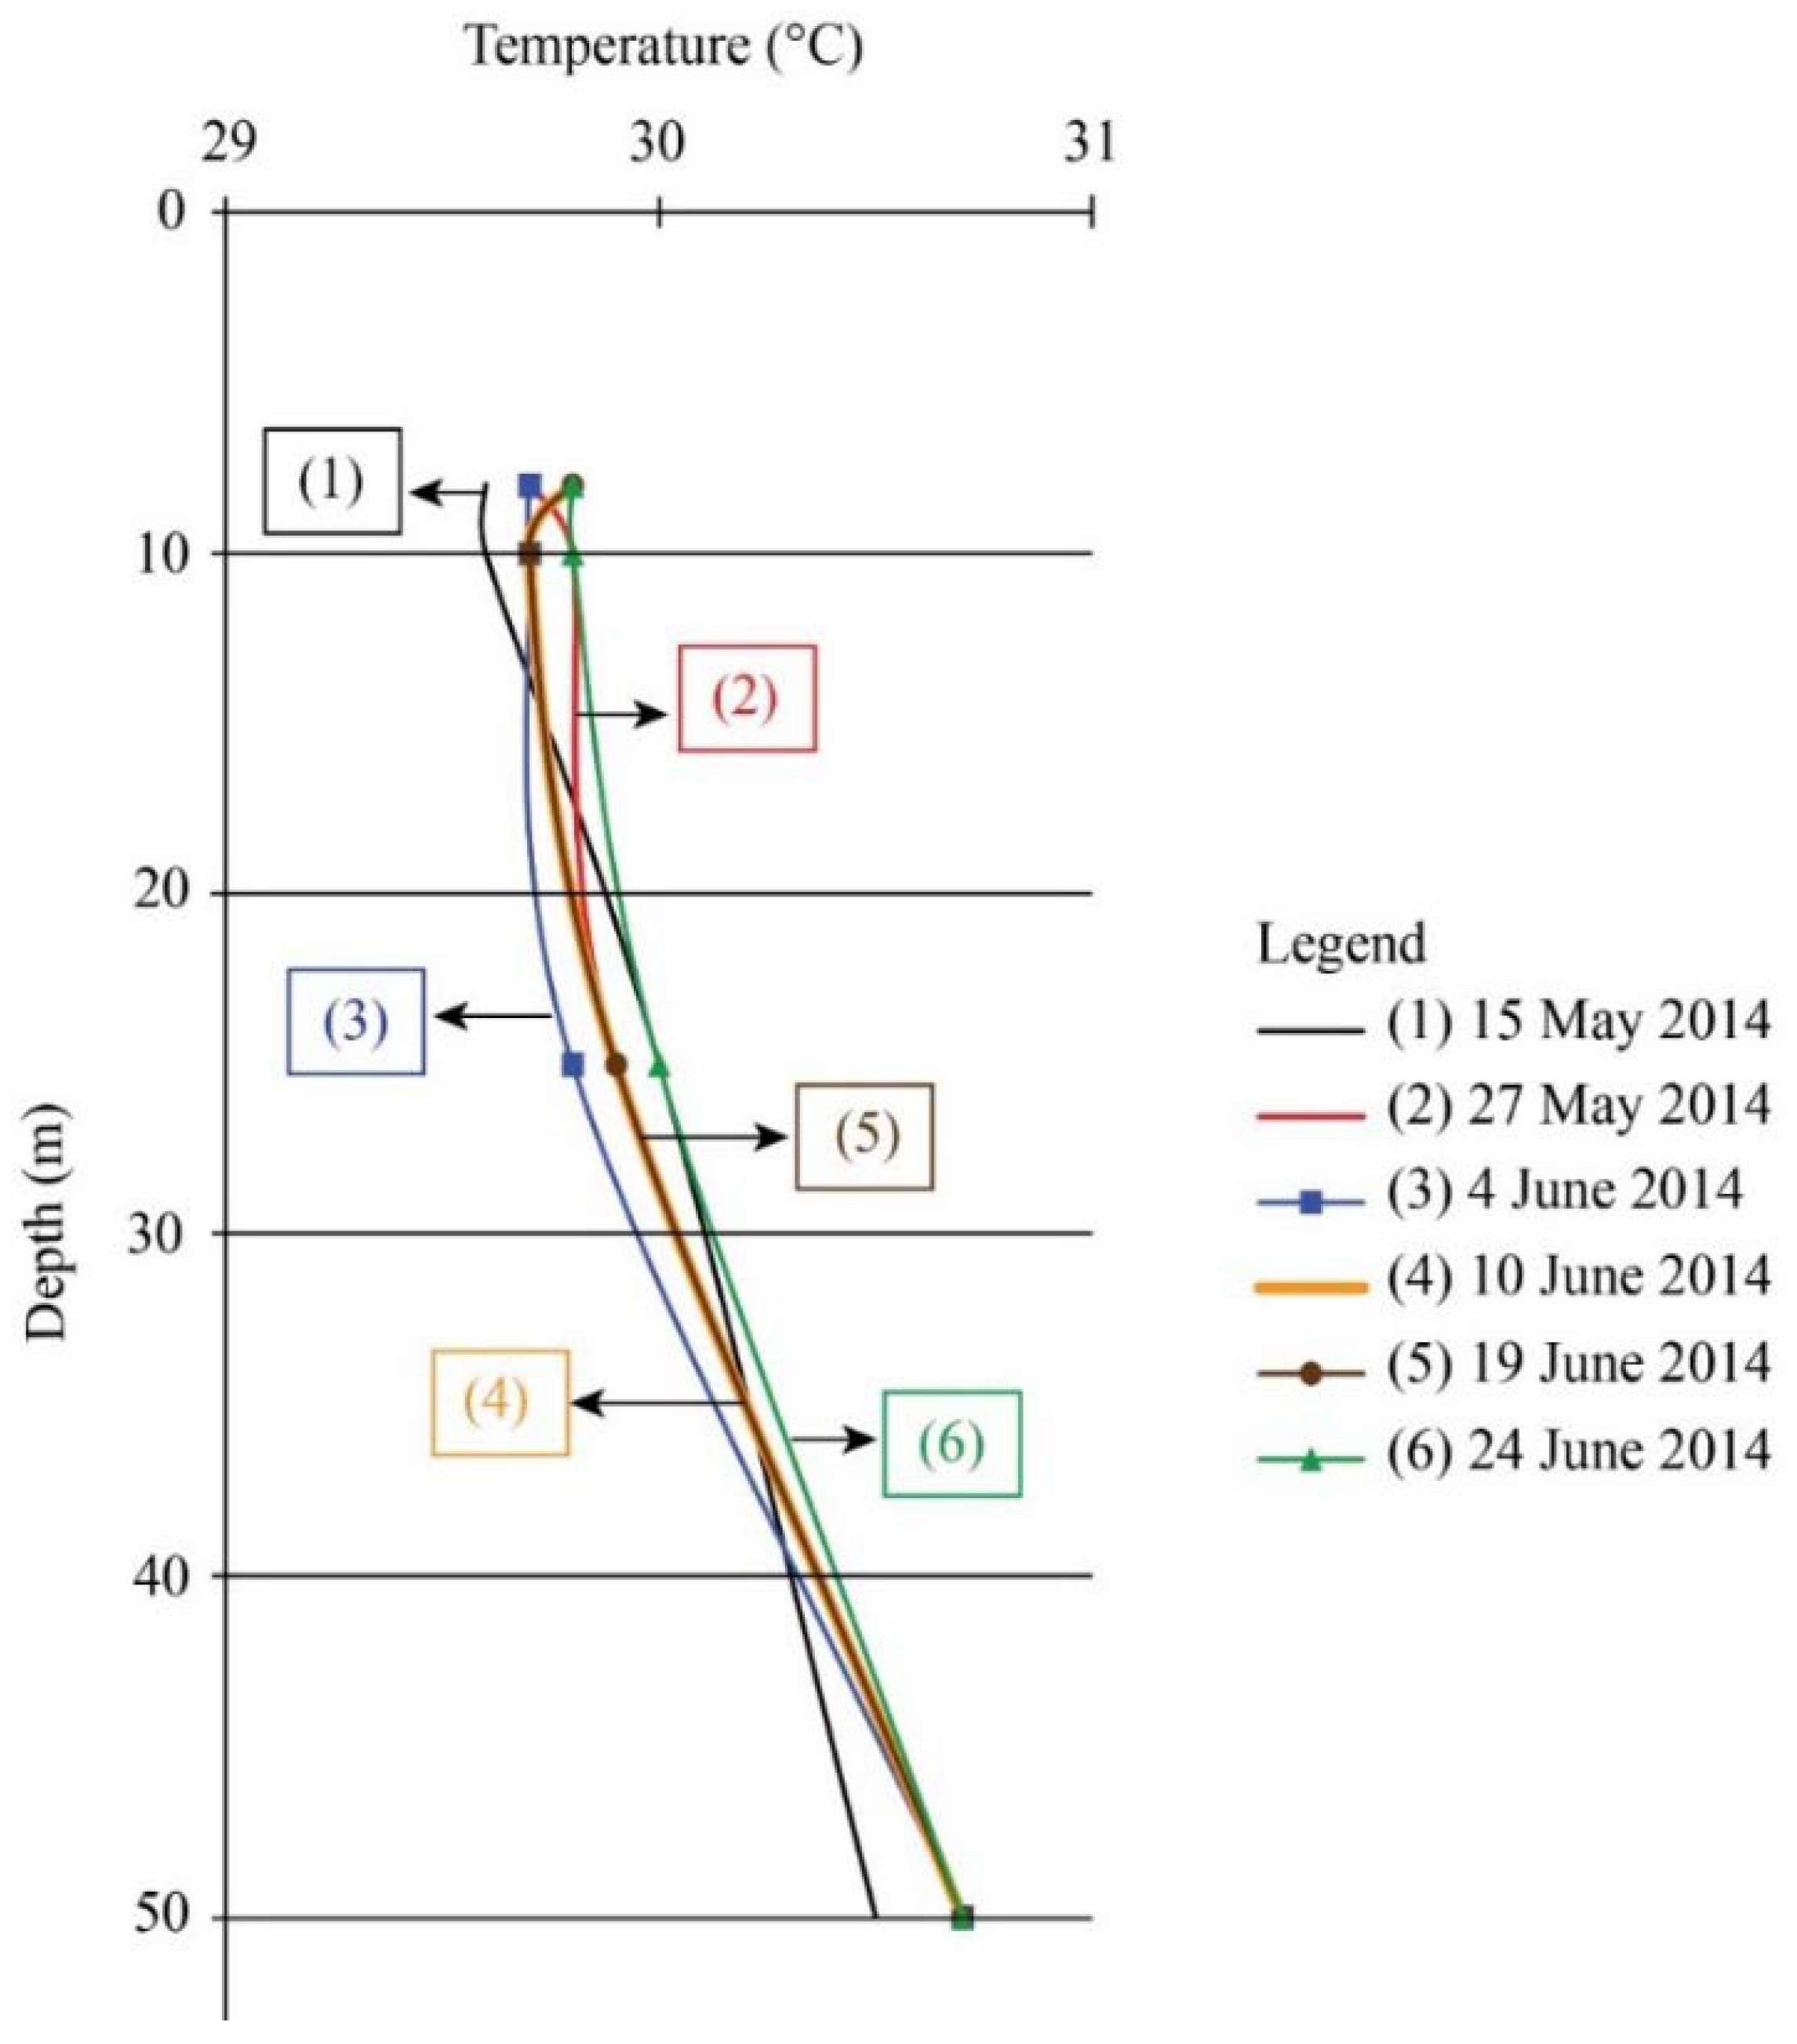
| 15 May 2014 | 10.00 a.m. | 29.6 | 29.6 | 30.0 | 30.5 |
| 27 May 2014 | 10.00 a.m | 29.7 | 29.8 | 29.9 | 30.7 |
| 4 June 2014 | 10.36 a.m. | 29.7 | 29.7 | 29.8 | 30.7 |
| 10 June 2014 | 10.05 a.m. | 29.8 | 29.7 | 29.9 | 30.7 |
| 19 June 2014 | 10.00 a.m. | 29.7 | 29.8 | 30.0 | 30.7 |
| 24 June 2014 | 10.00 a.m. | 29.8 | 29.8 | 30.0 | 30.7 |
© 2018 by the authors. Licensee MDPI, Basel, Switzerland. This article is an open access article distributed under the terms and conditions of the Creative Commons Attribution (CC BY) license (http://creativecommons.org/licenses/by/4.0/).
Share and Cite
Chokchai, S.; Chotpantarat, S.; Takashima, I.; Uchida, Y.; Widiatmojo, A.; Yasukawa, K.; Charusiri, P. A Pilot Study on Geothermal Heat Pump (GHP) Use for Cooling Operations, and on GHP Site Selection in Tropical Regions Based on a Case Study in Thailand. Energies 2018, 11, 2356. https://doi.org/10.3390/en11092356
Chokchai S, Chotpantarat S, Takashima I, Uchida Y, Widiatmojo A, Yasukawa K, Charusiri P. A Pilot Study on Geothermal Heat Pump (GHP) Use for Cooling Operations, and on GHP Site Selection in Tropical Regions Based on a Case Study in Thailand. Energies. 2018; 11(9):2356. https://doi.org/10.3390/en11092356
Chicago/Turabian StyleChokchai, Sasimook, Srilert Chotpantarat, Isao Takashima, Youhei Uchida, Arif Widiatmojo, Kasumi Yasukawa, and Punya Charusiri. 2018. "A Pilot Study on Geothermal Heat Pump (GHP) Use for Cooling Operations, and on GHP Site Selection in Tropical Regions Based on a Case Study in Thailand" Energies 11, no. 9: 2356. https://doi.org/10.3390/en11092356
APA StyleChokchai, S., Chotpantarat, S., Takashima, I., Uchida, Y., Widiatmojo, A., Yasukawa, K., & Charusiri, P. (2018). A Pilot Study on Geothermal Heat Pump (GHP) Use for Cooling Operations, and on GHP Site Selection in Tropical Regions Based on a Case Study in Thailand. Energies, 11(9), 2356. https://doi.org/10.3390/en11092356