Article

Improvement of Wastewater Treatment Performance and Power Generation in Microbial Fuel Cells by Enhancing Hydrolysis and Acidogenesis, and by Reducing Internal Losses

by
Miguel Ángel López Zavala
*,
Pamela Renée Torres Delenne
and
Omar Israel González Peña
Tecnológico de Monterrey, Water Center for Latin America and the Caribbean. Av. Eugenio Garza Sada Sur No. 2501, Col. Tecnológico, Monterrey 64849, Mexico
*
Author to whom correspondence should be addressed.
Energies 2018, 11(9), 2309; https://doi.org/10.3390/en11092309
Submission received: 29 June 2018 / Revised: 21 August 2018 / Accepted: 27 August 2018 / Published: 2 September 2018
(This article belongs to the Special Issue Microbial Electrochemical Systems)

Abstract

:
In this study, biodegradation performance and power generation in MFCs were improved. Domestic wastewater was biodegraded in a dual-chamber MFC system equipped with a DupontTM Nafion® 117 proton exchange membrane, graphite electrodes (8.0 cm × 2.5 cm × 0.2 cm) in both chambers and an external electric circuit with a 100 Ω resistor. Experiments were conducted using an anaerobic inoculum that was prepared onsite by acclimating mixed liquor from municipal wastewater. Aqueous hydrochloric acid (0.1 M HCl, pH 1.82) was used as the electrolyte in the cathode chamber. Free-oxygen conditions were promoted in both chambers by means of a vacuum (77.3 kPa). Low pH (< 5) and mixing conditions were maintained in the anode chamber and all the tests were carried out at 25 ± 1 °C. These conditions enhanced the hydrolysis and acidogenesis, inhibited the methanogenesis and reduced the internal losses. All of them together contributed to improve the treatment performance and power generation of the MFCs. Results of batch tests show COD reductions of up to 95%, voltages peaks of 0.954 V, maximum power densities on the order of 2.1 W·m−2 and 36.9 W·m3, and energy generation peaks of 99.4 J·mg−1 COD removed. These values are greater than those reported in the MFCs’ literature for municipal wastewater (26 mW·m−2–146 mW·m−2), industrial wastewater (419 mW·m−2) and culture medium solutions (1.17 W·m−2), and similar to those of glucose (3.6 W·m−2). Thus, these results can contribute to further enhancing the energy generated in MFCs and moving forward to make the MFCs more ready for practical applications of bioenergy production.

1. Introduction

The development and progress achieved by humanity have been possible through the use of fossil fuels as a power source; however, their indiscriminate use has generated water contamination and adverse environmental effects. Furthermore, natural fossil fuel resources are insufficient to support the energy-consuming life style of a growing population and world reserves and supplies are decreasing. In this regard, renewable energy solutions are needed to alleviate the current situation and bioenergy can be one of those solutions; particularly, microbial fuel cells (MFCs), which generate electricity directly by electrochemical reactions utilizing low-grade organic matter in wastewater streams, in comparison with liquid biofuels such as bioethanol and biodiesel [1].
Conventional configuration of a microbial fuel cell (MFC) consists of two chambers: The anode and the cathode compartments, normally separated by an ion-selective membrane and electrically connected via an external circuit containing a resistor or power user that consumes the energy generated by the reactions. In the anode, bacteria degrade the organic matter and catalyze the electron transfer to the anodic electrode. In the cathode, the reduction of the terminal electron acceptor takes place. Different types of electron acceptors have been reported in the literature, among them can be mentioned: oxygen (O2), potassium hexacyanoferrate (K3Fe(CN)6) and perchlorate and nitrate (NO3). In the cathode chamber, electrochemical or bio-electrochemical reactions can be promoted depending on the catalyst involved. Bacteria can be used as catalysts to promote the electron transfer from the cathodic electrode to the final electron acceptor [2,3,4,5].
MFC have importantly drawn the attention of researchers around the world due to the potential to treat wastewater and produce bioenergy simultaneously [6]. In this respect, important advances have recently been achieved in electrode materials, ion-selective membranes, bioreactor configurations, applications on different types of wastewater, and MFC modelling in which the scientific community is excited by the idea of scaling up this technology to the “real-world”. Recently, practical applications of MFCs have been reported in electronic/robotics with prototypes that demonstrated the potential of MFCs as a power source [7]. The use of benthic and marine MFCs to power sensors is the case of another field trial [8,9,10]. These field trials involved the use of electronics to match the MFCs’ lower but constant energy generation to the higher and intermittent energy needs. More recently, large pilot-scale MFCs treating real wastewater and urine in a continuous flow mode, MFC in constructed wetlands, prototypes integrated to wastewater treatment plants, and floating MFCs combined with plants to power sensors installed in natural water bodies have been tested [11,12]. Despite these achievements, power generation is still limited (600 mW, 1.3 W·m−2, 54 W·m−3) and remains one of the main challenges to be overcome in the coming years for full-scale and massive application of MFCs.
Thus, this paper shows how to improve the treatment performance and the bioelectricity generation in a dual-chamber MFC by means of enhancing the hydrolysis and acidogenesis processes, inhibiting the methanogenesis and reducing the energy internal losses. Deep discussion is conducted to elucidate the factors that have contributed to high biodegradation and electricity generation rates. Figure 1 shows the conceptual MFC and operating conditions used in this study.

2. Materials and Methods

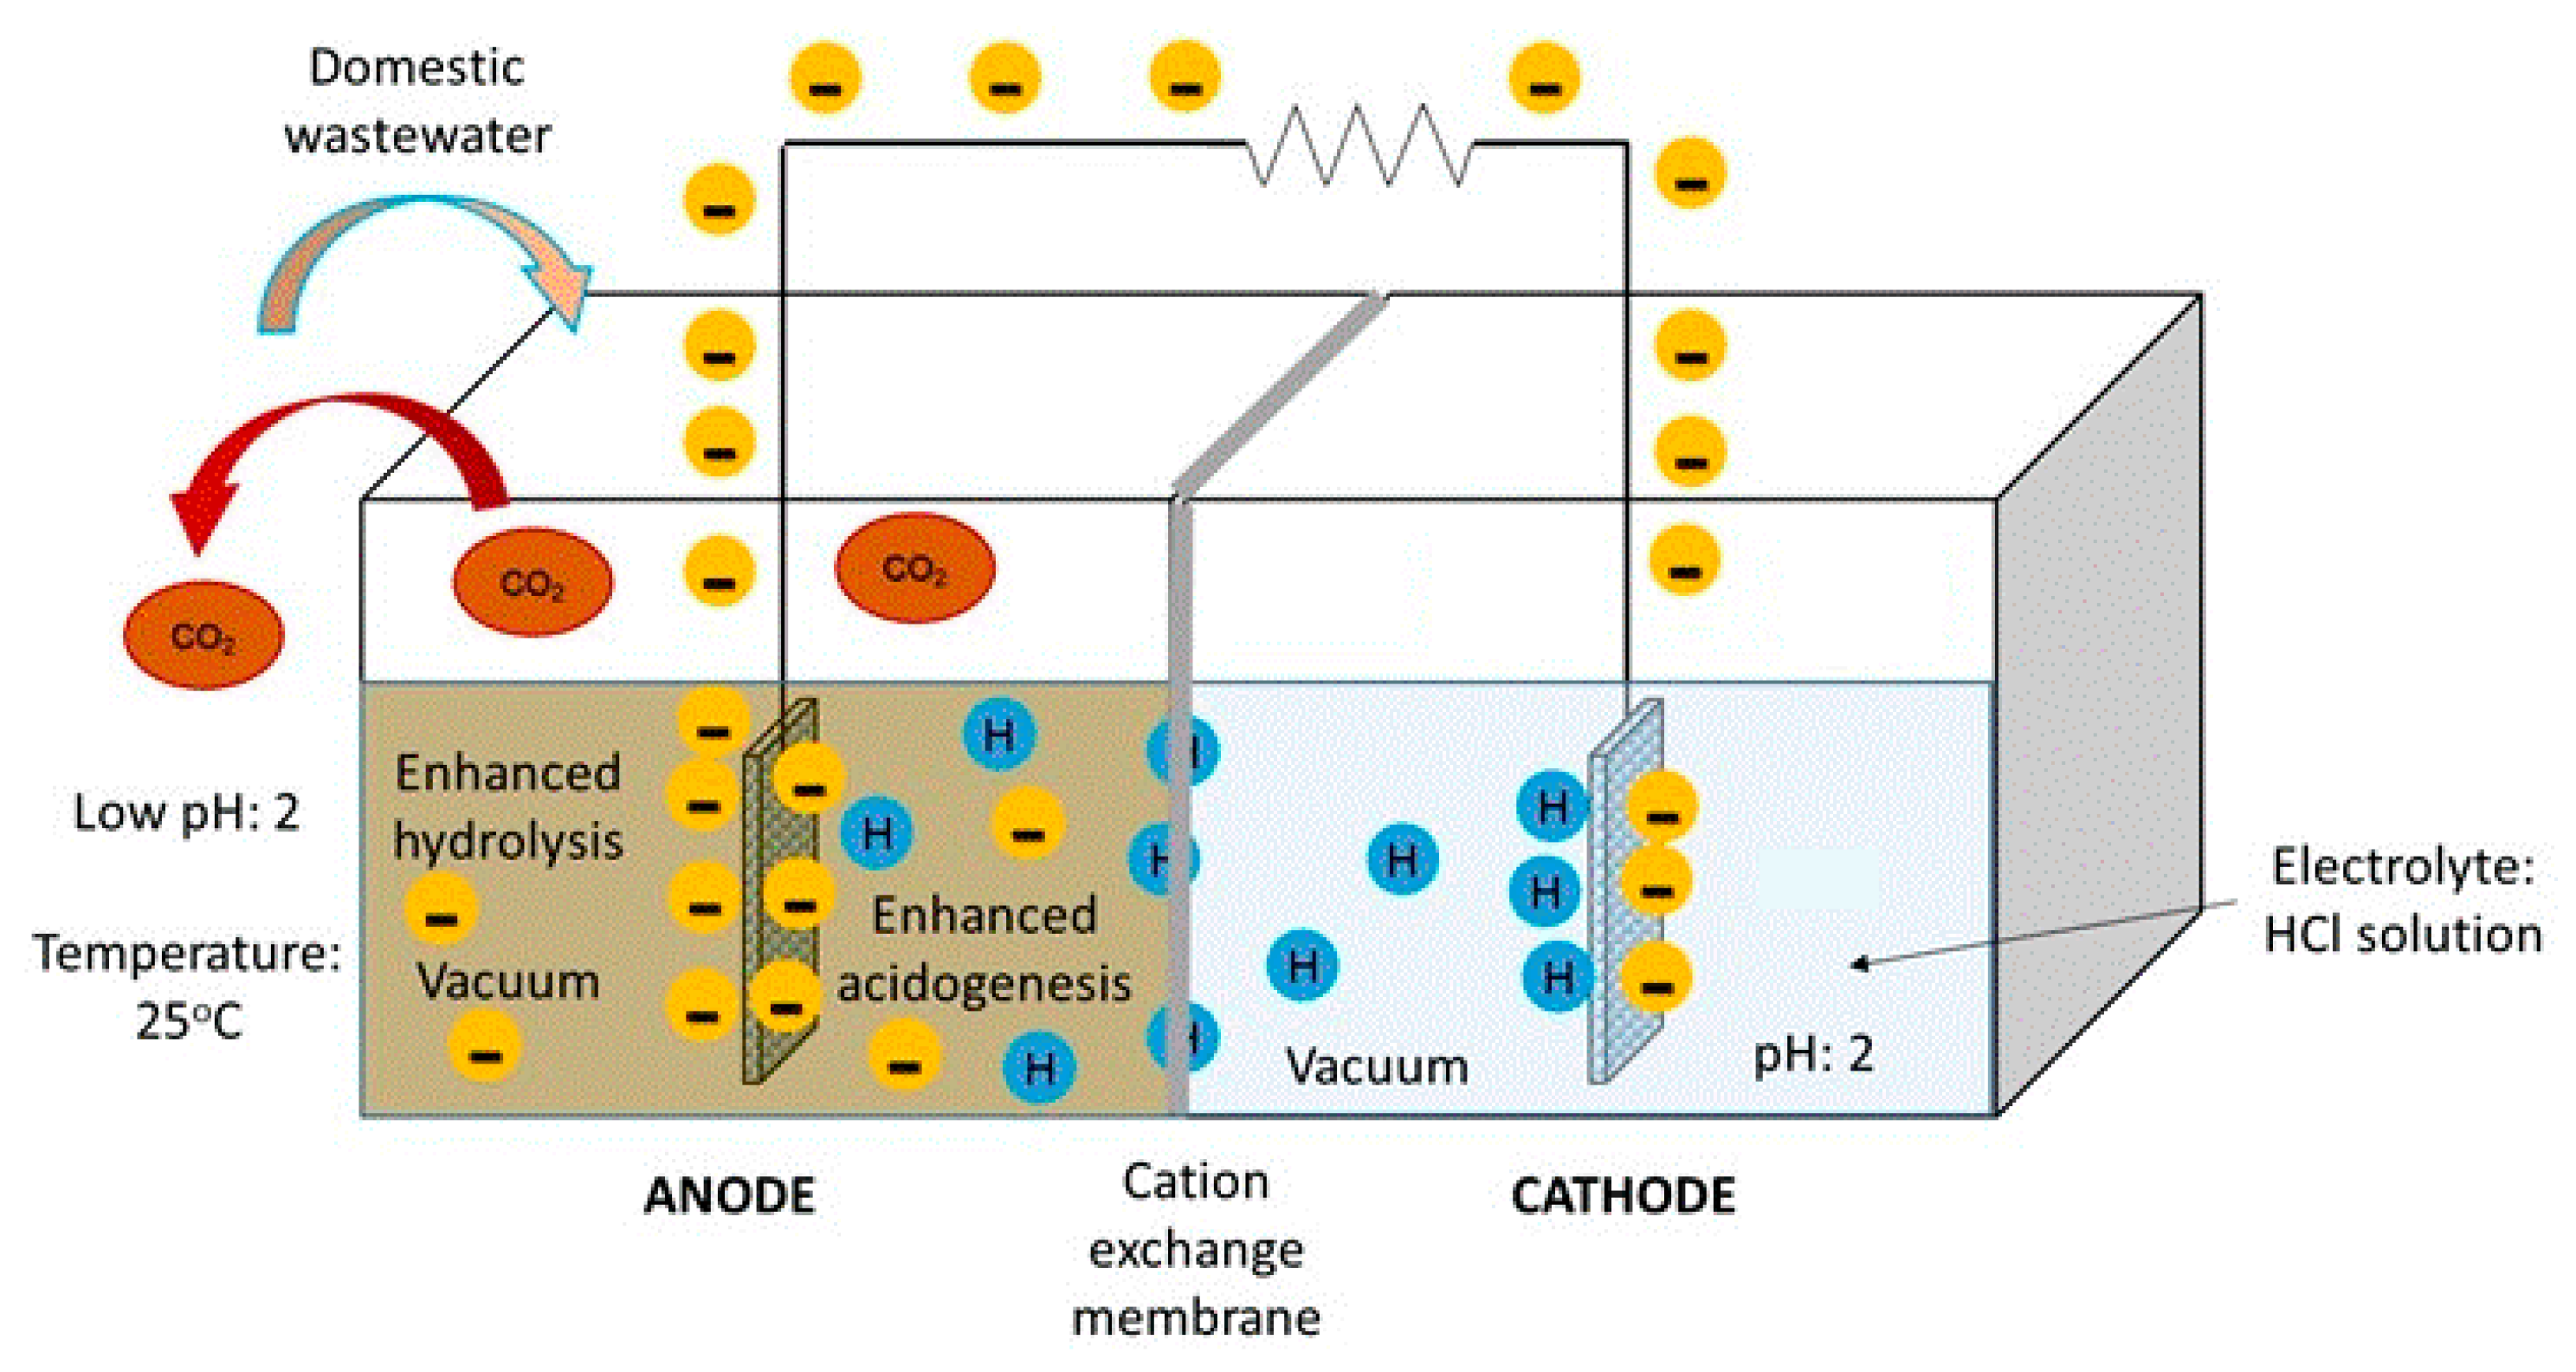
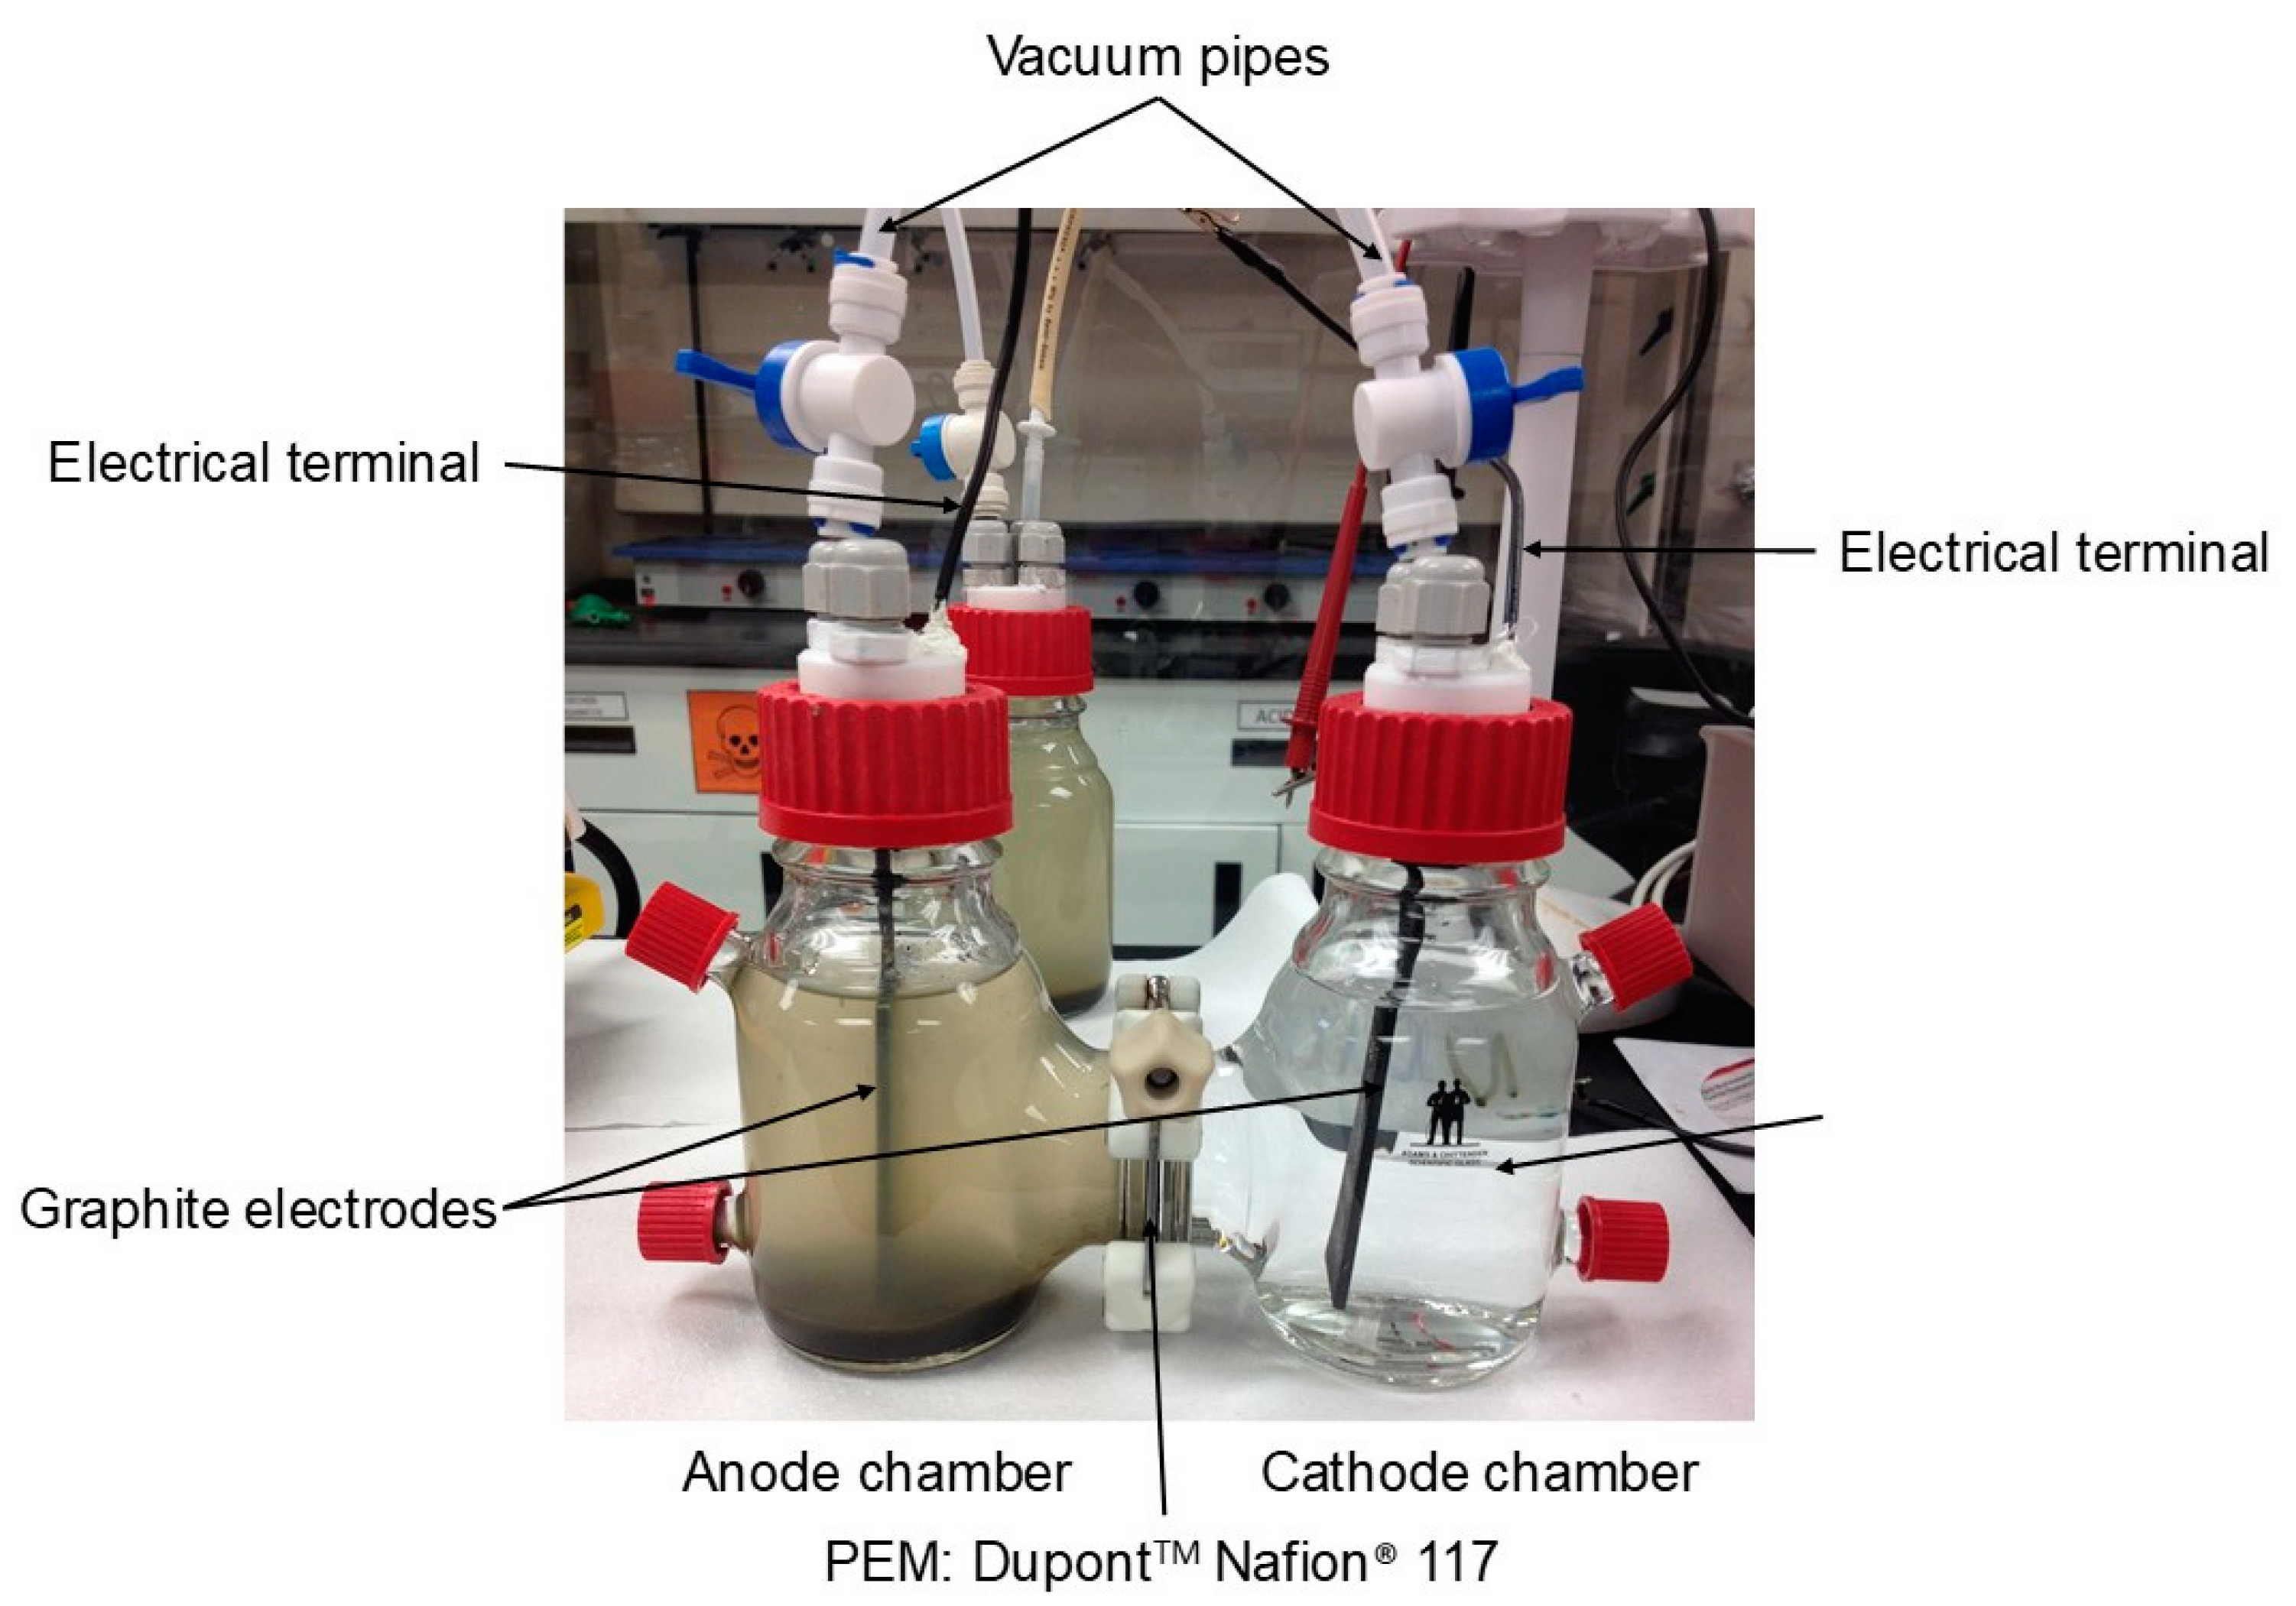
2.1. Experimental Device

Figure 2 shows the experimental device used in this research. A Dual-chamber MFCs (Adams & Chittenden Scientific Glass, Berkeley, CA, USA) with DupontTM Nafion® 117 proton exchange membrane (PEM) was used. Graphite electrodes (8.0 cm × 2.5 cm × 0.2 cm) placed in each chamber were connected to an external circuit with a 100 Ω resistor. Additionally, the electrode of the anode chamber was prepared with 2 mm circular indentations uniformly distributed on both sides of the electrode to ease the attachment of the anaerobic inoculum (biomass). The PEM was activated following the procedure described by Hasani-Sadrabadi et al. [13]. The voltage generated in the device was measured with a voltmeter. A hydrochloric acid solution (0.1 M HCl, pH 1.8) was used in the cathode chamber as an electrolyte. A vacuum (77.3 kPa) was applied in both chambers to drive air and dissolved oxygen out of the chambers. These chambers were provided with inlets for sampling the mixed liquor, the electrolyte and the gases generated by the biological reactions. Mixing of the liquor in the anode chamber was conducted using a magnetic stirrer. Two experimental devices were set in parallel to run the process by duplicate. Additionally, another system under non-mixing conditions and non-electrolyte in the cathode chamber was set as a control.

2.2. Procedures

2.2.1. Preparation of the Inoculum and Conditioning of the Anode

The inoculum used in this study was prepared onsite by acclimating anaerobically mixed liquor taken from the bioreactor of a municipal wastewater treatment plant (MWTP) located in the city of Monterrey, Mexico. In a 1.2 L flask, 400 mL mixed liquor was mixed with 800 mL domestic wastewater taken from the sewerage of the Tecnológico de Monterrey Campus. The flask was sealed perfectly and once a day intense mixing of the mixture was conducted, followed by 30 min of biomass settling. Gases generated were released and 800 mL supernatant was disposed; then the flask was replenished again with domestic wastewater. This procedure was repeated during 10 days at 25 ± 1 °C; after this period, the biomass became acclimated to anaerobic conditions and the inoculum was ready to be used.
On the other hand, during the inoculum preparation, the electrode of the anode chamber was submerged into the flask liquor to ease the biomass growth and attachment over its surface. This conditioning process also took 10 days.

2.2.2. Biodegradation of Wastewater

Degradation of domestic wastewater was conducted in the MFCs regarding two scenarios, not mixing (NMC) and mixing (MC) conditions in the anode chamber. The scenario NMC was carried out by duplicate and the scenario MC by quadruplicate at 25 ± 1 °C. Additionally, a control process was conducted under not mixing conditions and not electrolyte in the cathode chamber. Temperature control and mixing were conducted by using Cimarec™ Digital Stirring Hotplates (Thermo Fisher Scientific, Monterrey, N.L., Mexico). For each trial, the MLVSS of the inoculum and the organic load of the wastewater (in terms of COD) were determined based on the procedures described in the Standard Methods for the Examination of Water and Wastewater [14]. Based on these measurements, the initial operating conditions of the MFCs and the control reactor were set (Table 1). As seen, the volume of the electrolyte was equal to that of the anode chamber liquor. A vacuum (77.3 kPa) was applied in both chambers of the MFCs during 10 min and then valves were closed keeping negative pressure inside. Under these conditions, the experiments were run and monitoring of the degradation process was conducted as follows:
(a)
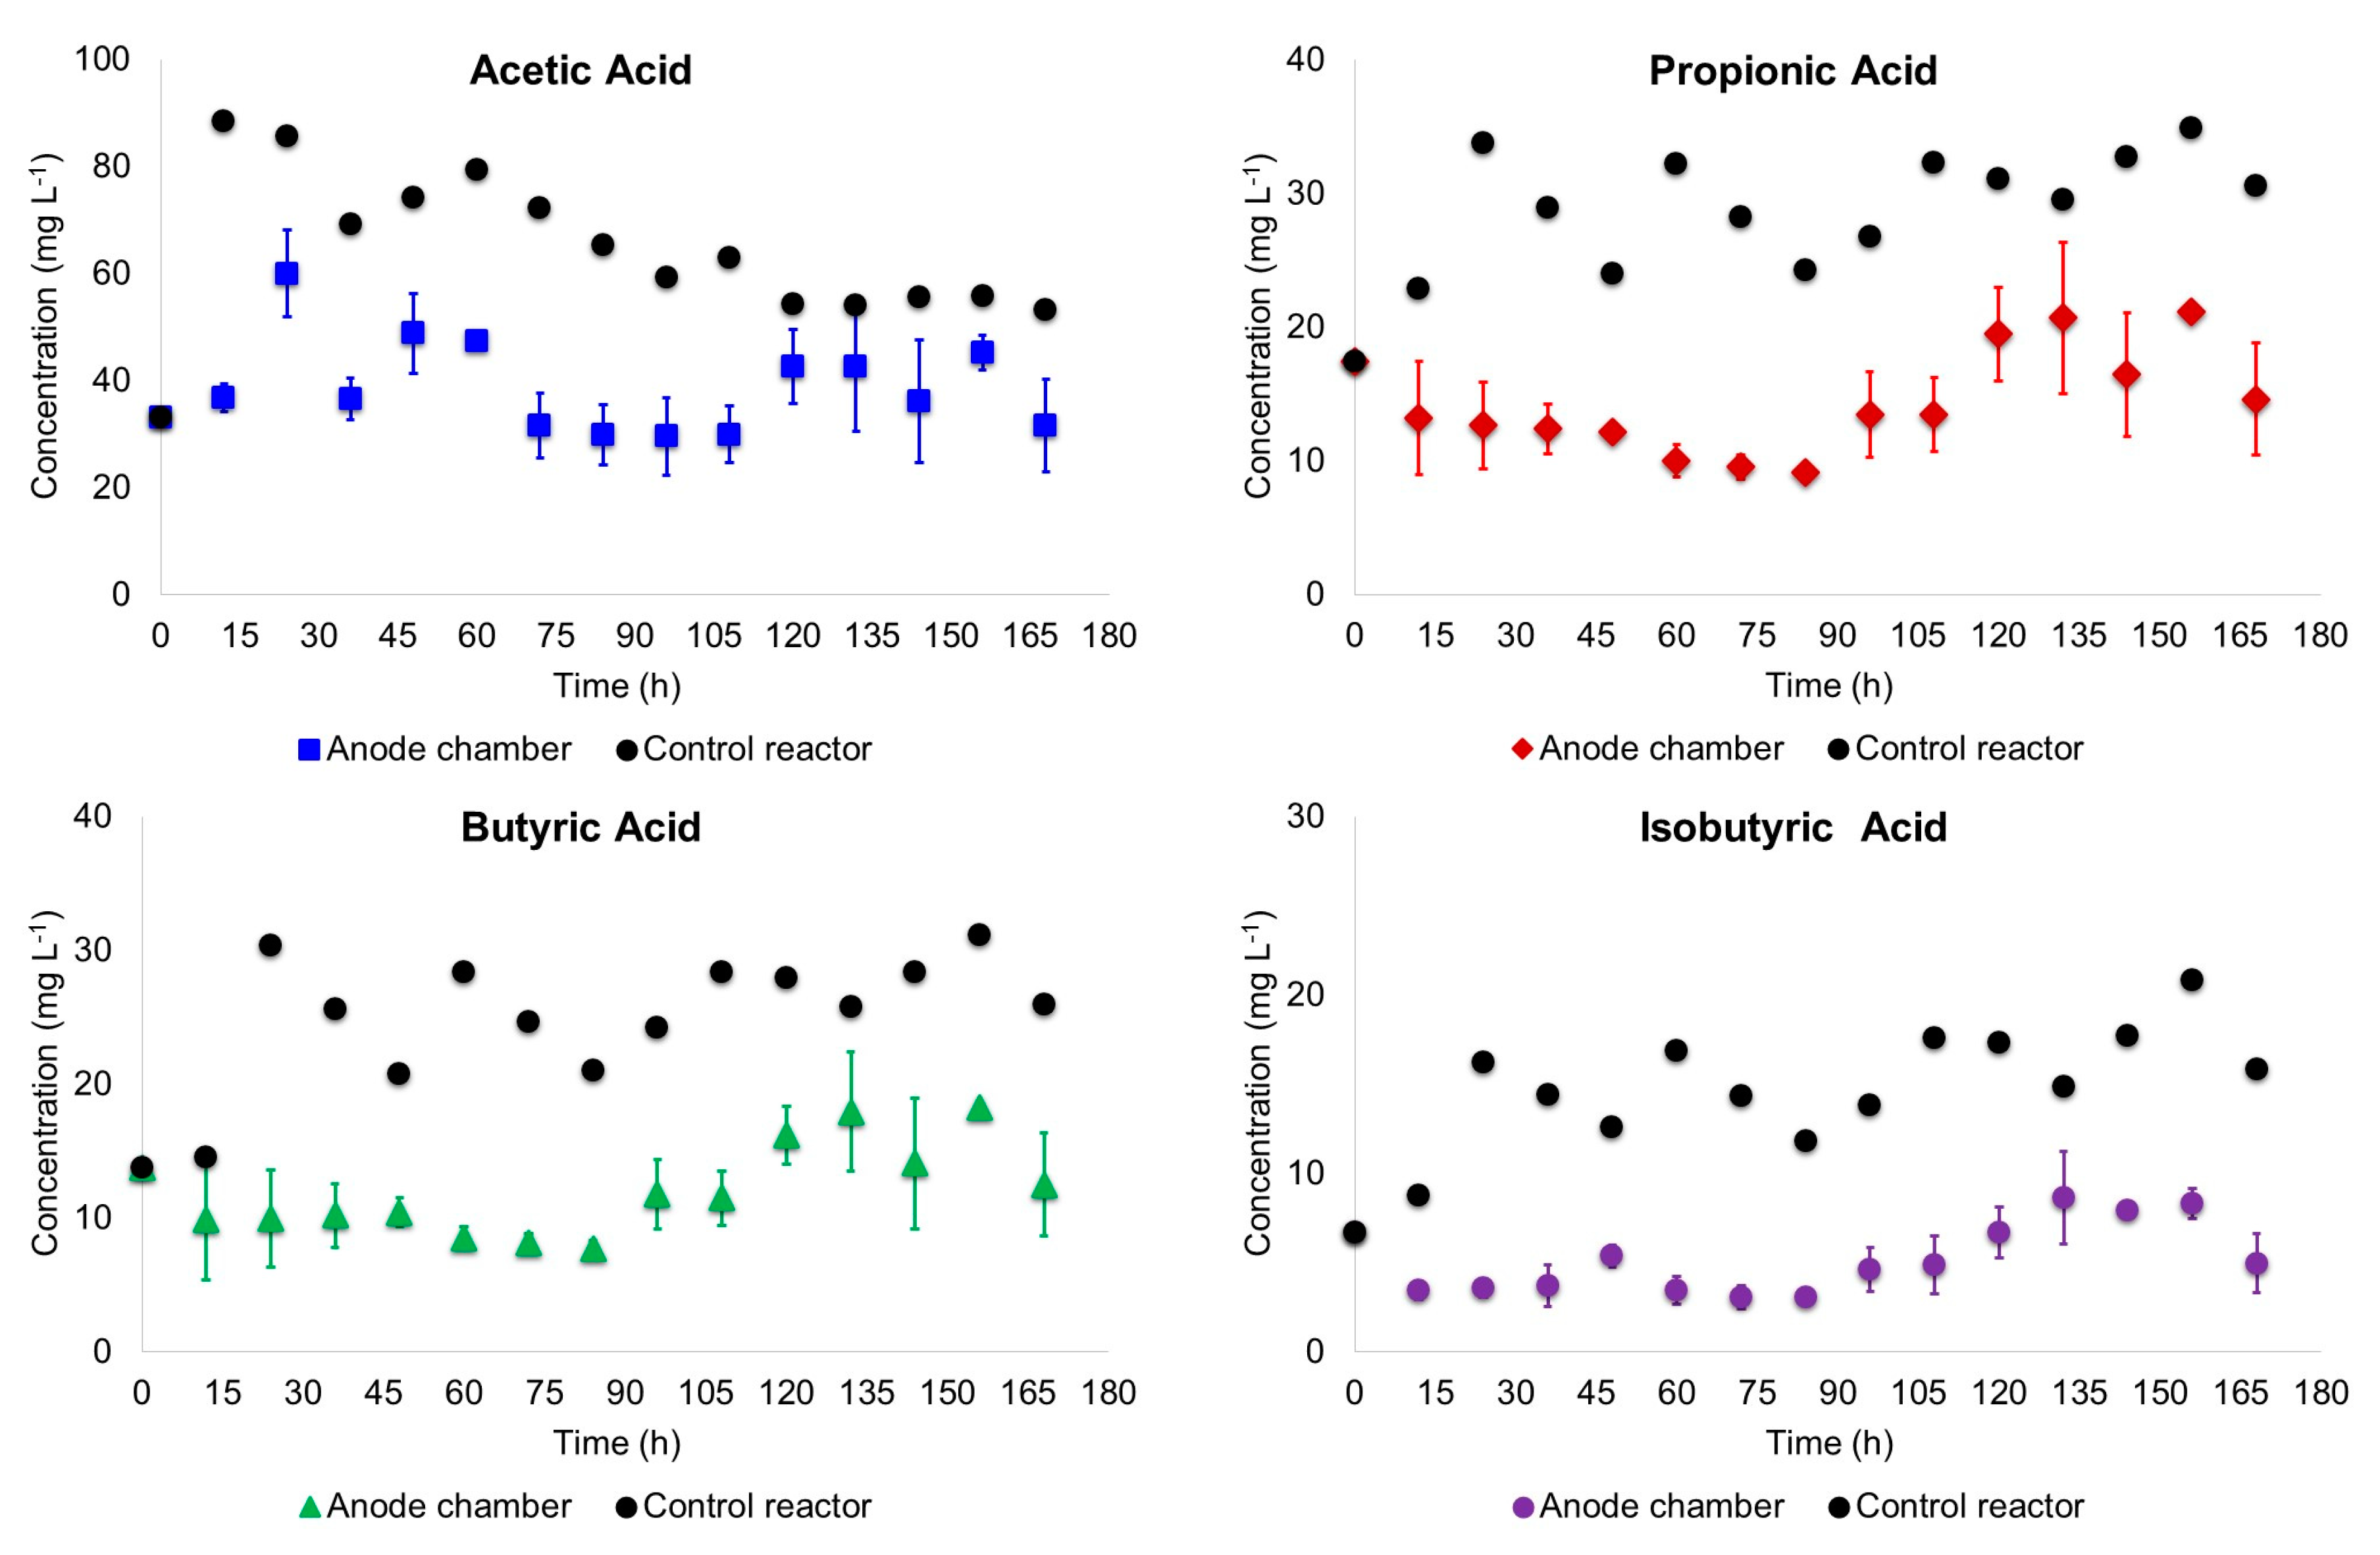
Supernatant samples of the anode chamber liquor were taken every 12 h. For the scenario MC, mixing in the anode chamber was paused and settling of the suspended biomass was permitted per 1 h; then 5 mL supernatant was taken using plastic syringes and needles (BD Plastik). COD, pH and volatile fatty acids (VFA) of the samples were measured. COD and pH were determined based on the procedures described in the Standard Methods for the Examination of Water and Wastewater [14]. Volatile fatty acids were determined by GC-FID with a HP-FFAP (25 m × 0.32 mm × 0.50 µm) column. The standards (organic acids kit) used to prepare the calibration curves were obtained from Sigma-Aldrich (Toluca, Mexico).
(b)
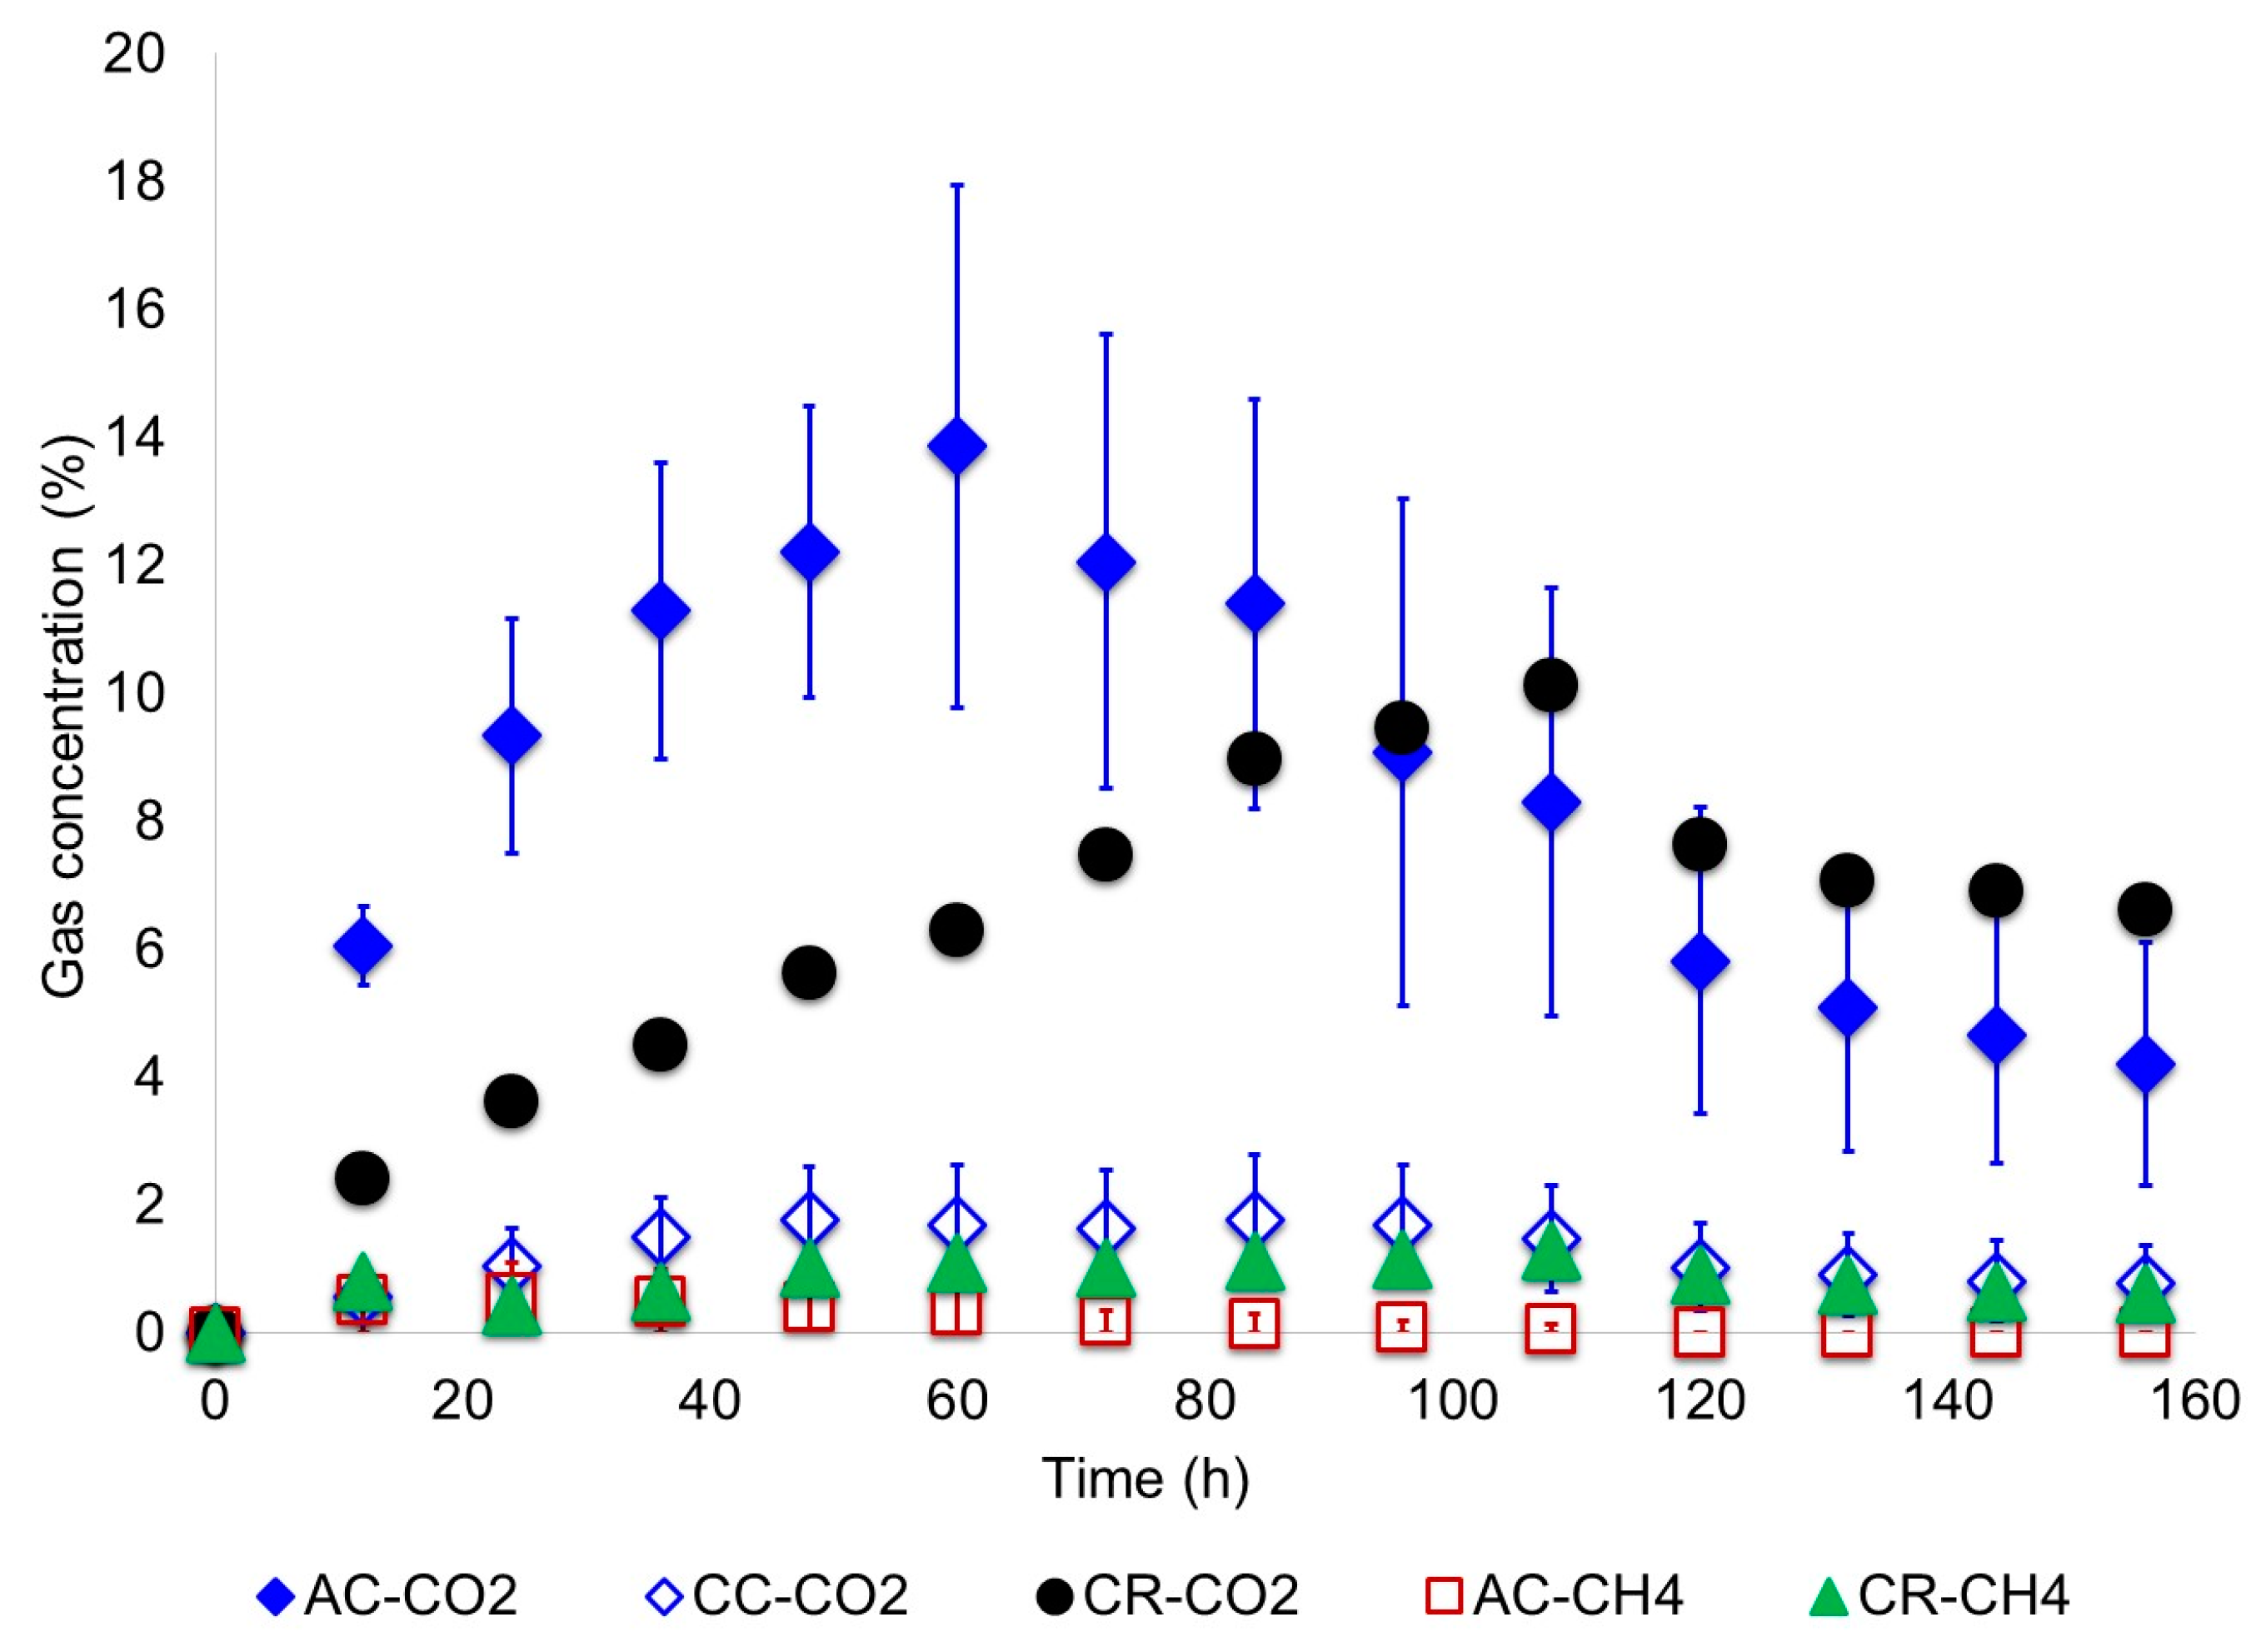
Gases generated in the anode chamber such as H2, CO2 and CH4 were measured every 12 h. To do that, a 300 μL gas sample was taken with a micro gas-tight syringe provided with a push-pull valve. Then, the sample was analyzed by GC-TCD with a HP-MOLESIEVE (30 m × 0.53 mm × 25 µm) column. Calibration of the chromatographer was conducted with a standard gases mixture of hydrogen (5%), methane (5%), carbon dioxide (5%) and helium (85%) obtained from INFRA Air Products (Mexico).

2.2.3. Generation of Electricity

As described in Section 2.1 (experimental device), a 100 Ω resistor was integrated into the external electric circuit. Thus, the current generated in the MFCs was calculated with Equation (1) based on the electric resistance and the voltage measured. The electric power and energy were computed with Equations (2) and (3):
I = V/R
P = I∙V = V2/R
E = P∙t
where: I: current intensity (A); V: voltage difference between the anode and cathode (V); R: electric resistance (Ω); P: power (W); E: electric energy (J); and t: time (s).
Additionally, current density (A·mg−1 COD removed), power density (W·m−2 and W·m−3), electric energy generation (J·mg−1 COD removed) and the coulombic efficiency (CE) were determined for each scenario. In this study, the coulombic efficiency was calculated as the ratio of the current flowing across MFCs to the theoretical current based on the total wastewater organic matter oxidized in the anode chamber [4].
C E = 0 t I d t F V l [ b o C O D M o ] × 100
where I is the current produced (A); t is the time period of the test (s); Mo is the molecular weight of oxygen (32 g·mol−1); Vl is the mixed liquor volume in the anode chamber of the MFC (L); bo is the stoichiometric number of moles of electrons exchanged per mole of oxygen (4 mol e mol−1); F is the Faraday’s constant = 96,485.3 C mol−1 e; and ∆COD is the change in COD (g L−1) over the time t.

3. Results and Discussion

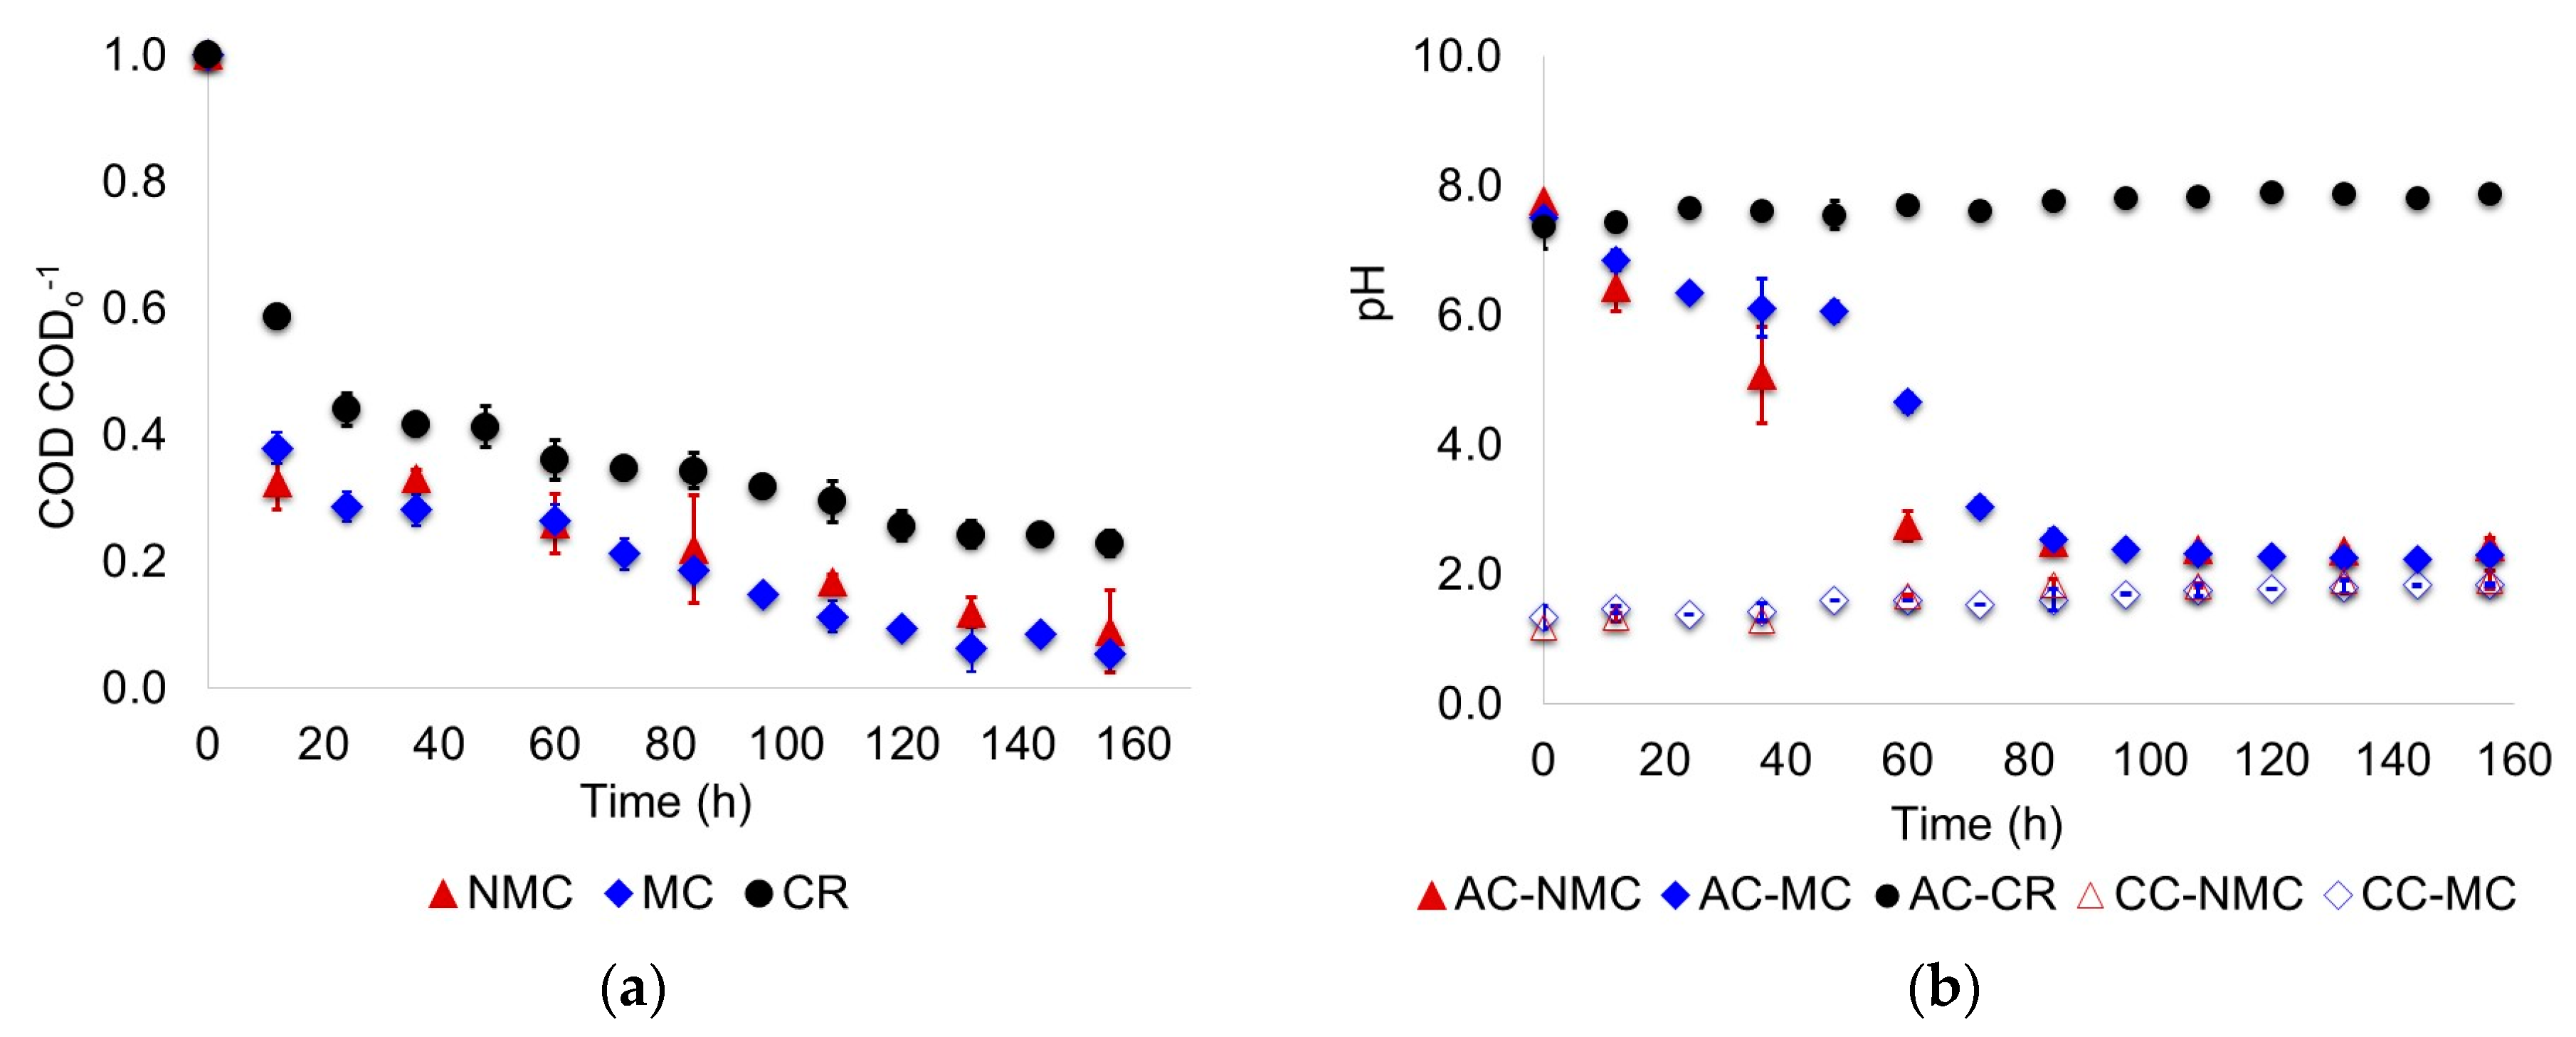
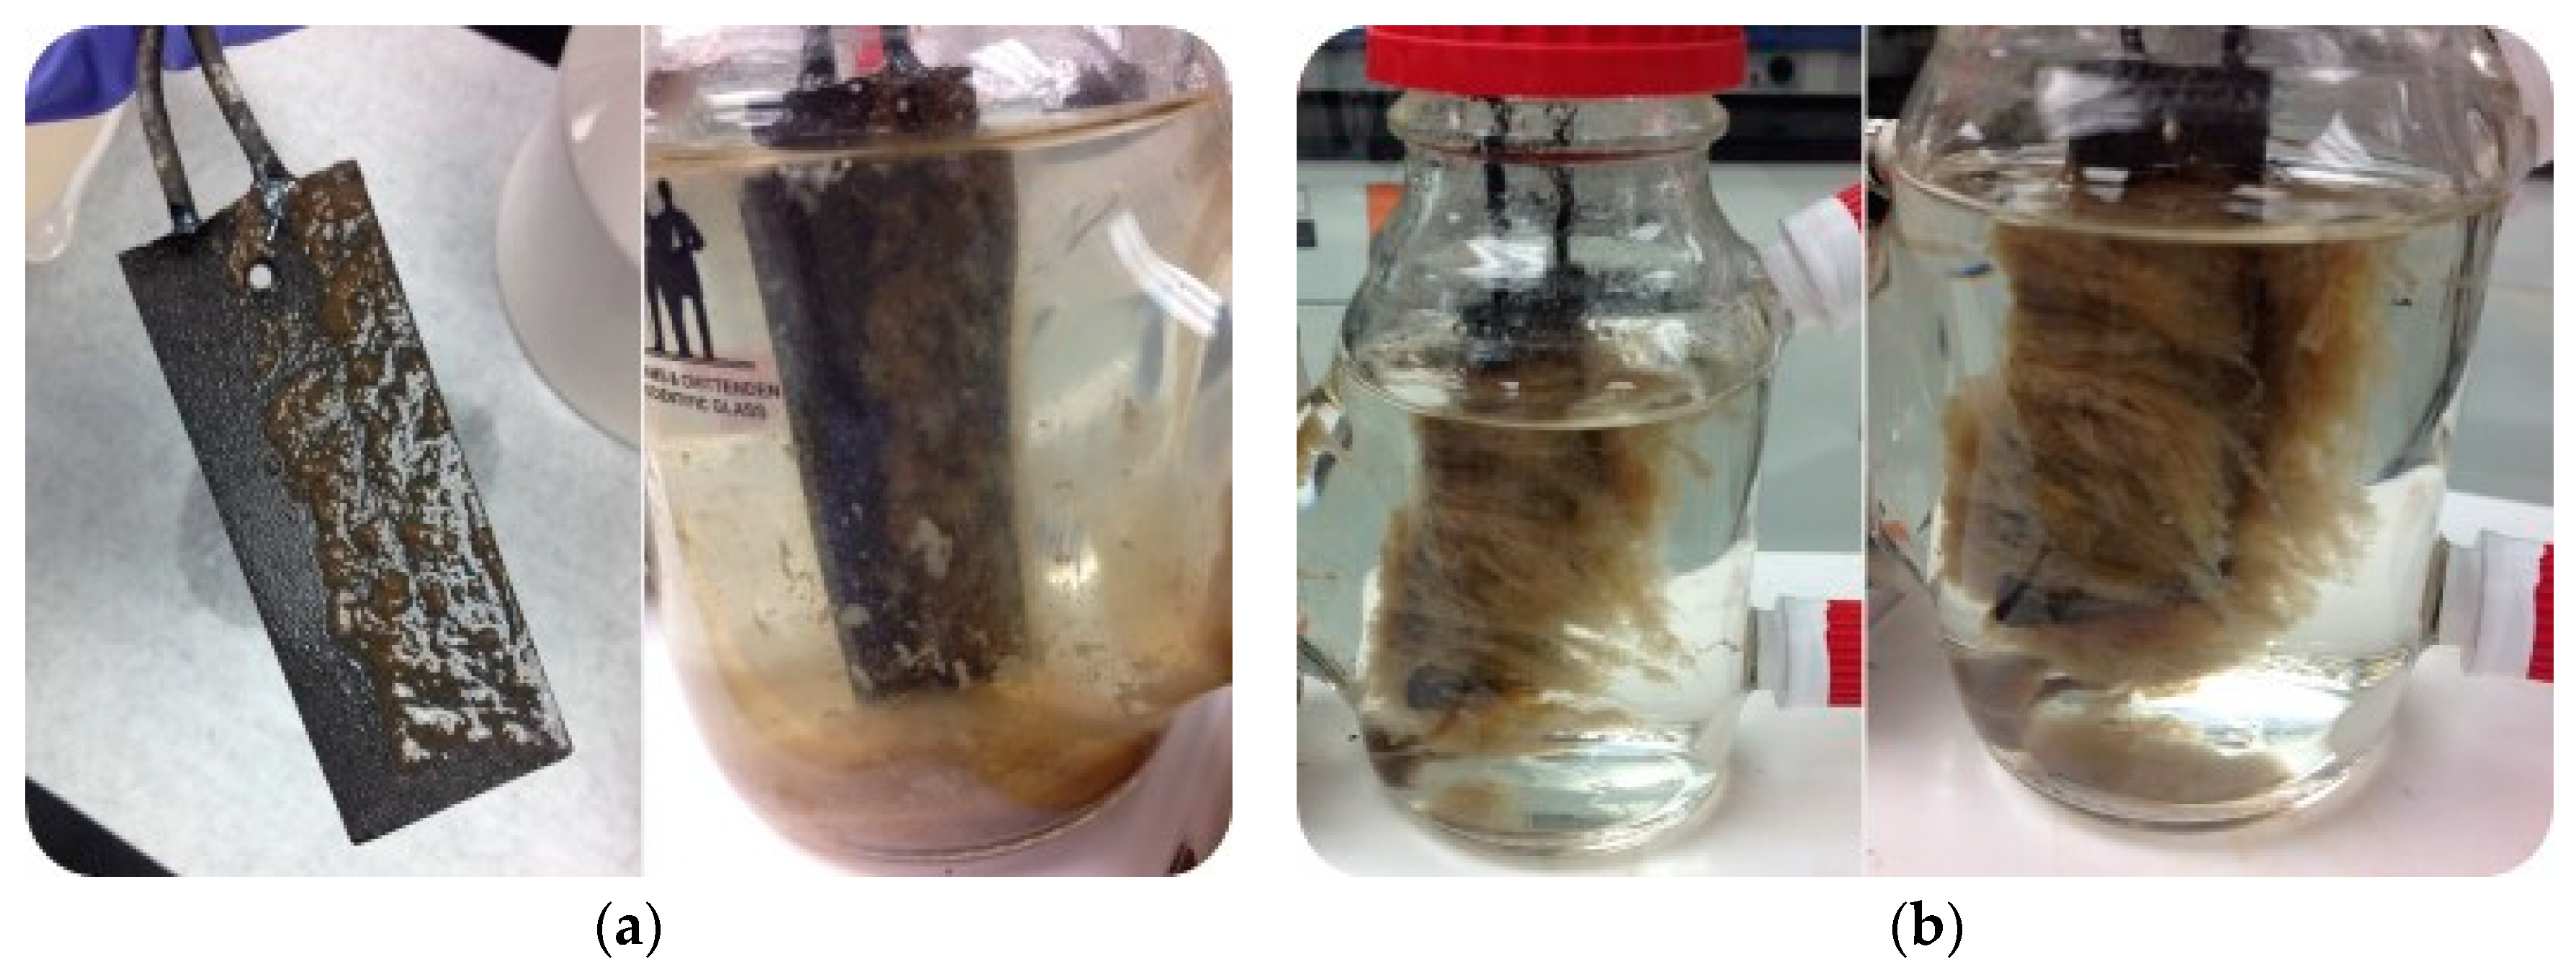
3.1. Biodegradation of Wastewater

Total solids and volatile suspended solids of the inoculum liquor varied from 3254.0 to 6377.0 mg·L−1 and from 2205.0 to 4441.0 mg·L−1, respectively, with average values of 5055.4 mg·L−1 and 3546.8 mg·L−1, respectively. On the other hand, the organic load of domestic wastewater presented great variability; total COD varied from 466.7 to 1280.0 mg·L−1. Based on these results, the initial conditions for the experiments were set, as shown in Table 1.
Figure 3a shows the normalized COD reduction observed in the experiments conducted in the MFCs and in the control reactor (CR). As seen, the COD reduction in the MFCs was greater than that of the control reactor. The average COD reduction in the control reactor was 77.5% after 156 h of reaction. This value is in the order of those values reported by the literature for domestic wastewater degradation in conventional MFCs [15,16]. Moreover, in the MFCs, the COD reduction in the scenario NMC was less than that of the scenario MC. The average COD reduction observed in the scenario NMC after 156 h of running time was on the order of 90%; meanwhile, 95% was achieved in the scenario MC. As seen, degradation data for the NMC scenario showed the greatest variability (greatest standard deviation) despite the same sources of wastewater and inoculum being used. In the MC scenario, wastewater with two different organic loads (Table 1) were used; but degradation data showed less variability. Thus, greater variability in the NMC scenario seems to be associated with the non-mixing conditions prevailing in the reactor. On the other hand, in the MFCs, biodegradation performance was better than that observed in the control reactor. Mixing in the anode chamber and the other conditions under which the biodegradation process was conducted in the MFCs contributed to enhance the wastewater’s organic matter degradation, as discussed below.
In the NMC and MC scenarios, a 0.1 M HCl solution was used as an electrolyte; it diffused to the anode chamber through the proton exchange membrane, as seen in Figure 3b. The pH in the anode chamber decreased rapidly reaching a value of 2.5 in 84 h. After this time, the pH remained almost constant until the end of the experiments. In this figure, it is also observed that the pH of the control reactor was kept almost constant (approximately 7.7) during the experiment. It means that fermentation products did not modify the alkalinity and the buffer capacity of the liquor. In the lower part of the same figure, the pH of the electrolyte in the cathode chamber of both scenarios is depicted (not filled markers). The pH of the electrolyte increased a little bit to reach almost the pH of the anode chamber, confirming the diffusion through the PEM. Similarly to the COD results, pH data for the NMC scenario showed the greatest variability, confirming that mixing contributed to having more homogeneous conditions in the anode chamber of the MFCs.
As seen in Figure 4, concentration of the volatile fatty acids in the control reactor was greater than that observed in the MFCs, where the HCl solution was used as an electrolyte. Diffusion of the HCl solution to the anode chamber enhanced the biodegradation of wastewater in two ways. First, by enhancing the hydrolysis of complex particulate organic matter and, second, by enhancing the acidogenesis process. During hydrolysis, HCl acid catalysed the transformation of complex biodegradable particulates into large soluble organic molecules such as carbohydrates, proteins and lipids that were further reduced into simpler molecules such as sugars, amino acids, and long chain fatty acids by hydrolytic extracellular enzymes secreted by fermentative electrochemical active bacteria (acidogenic), which are an important component of the acidogenesis process. Low pH conditions in the anode chamber inhibited the methanogens growth and enhanced the growth of acidogenic bacteria. Acidogenic bacteria are resistant to low pH values [17]. Thus, during the acidogenesis, sugars and amino acids were degraded by fermentative reactions generating intermediate degradative products (volatile fatty acids) like propionic, butyric and isobutyric acids (Figure 4). Unlike the conventional MFCs, acetic acid was less generated during fermentation; furthermore, HCl acid enhanced the anaerobic oxidation of volatile and long-chain fatty acids. As seen in Figure 4, the concentration of acetic acid increased a little bit in the anode chamber in the first 24 h and then decreased gradually remaining almost constant, near to 39 mg·L−1. Concentration of other volatile fatty acids was maintained almost constant in the first 84 h and then showed a little increasing tendency, but their average concentration was lower than 15 mg·L−1, particularly the isobutyric acid with an average concentration of 5 mg·L−1. Accumulation of propionic acid is well known to occur in conventional MFCs; but in this study, the increase was negligible. As seen, VFA data showed some variability, which could be associated with the difference on the organic load and biodegradability of the wastewater samples used in the scenario MC (Table 1).
Regarding the contribution of mixing conditions to have greater COD reductions (scenario MC), it is clear that mixing homogenized the constituents of the liquor in the anode chamber and together with the catalytic activity of HCl, enhanced the hydrolysis process. Furthermore, complete mixing conditions made the concentrations of all hydrolysis products uniform throughout the anode chamber, enhancing their assimilation by the electrochemically-active microorganisms.
On the other hand, mixing also favored the growth of healthy biomass over the anode that promoted greater COD reductions and better electron transfer, as will be explained below. Figure 5 presents the differential growth of biomass on the electrode of the anode chamber for the scenarios NMC and MC. As seen, important differences on the growth and attachment of biomass over the electrode are evident for both scenarios.
Regarding the gas production in the anode chamber, Figure 6 depicts the measurements conducted for the scenario MC. As seen, CO2 data of the anode chamber showed variability due to the differences of the organic load of the wastewater samples (Table 1). Despite this variability, it is evident that CO2 generation in the anode chamber was faster and greater than in the control reactor, denoting greater biomass activity in the MFCs. On the other hand, carbon dioxide was detected in the cathode chamber; this means that CO2 was diffused to the cathode chamber through the proton exchange membrane. Variability observed in these data were also linked to the differences on the organic load of the wastewater samples (Table 1). Methane concentration in the anode chamber is also depicted in Figure 6. As seen, methane was produced permanently in the control reactor; but, in the anode chamber of the MFCs, the methane was detected only when pH was greater than 5. These results confirm that methanogens activity was inhibited at low pH values, while the activity of acidogenic microorganisms was enhanced, as explained above.
On the other hand, hydrogen gas was not detected in the anode chamber of the MFCs nor in the control reactor. In the control reactor, H+ protons were used by methanogenic bacteria to constantly produce methane, as observed in Figure 6. In the case of the MFCs, the non-production of H2 gas in the anode chamber is confirmed by no formation of acetic acid [18], as shown in Figure 4. This means that H+ protons produced during the acidogenesis process might migrate to the cathode chamber to compensate the negative electrical charge transported through the external circuit; thus, maintaining the charge equilibrium between the anode and cathode chamber.

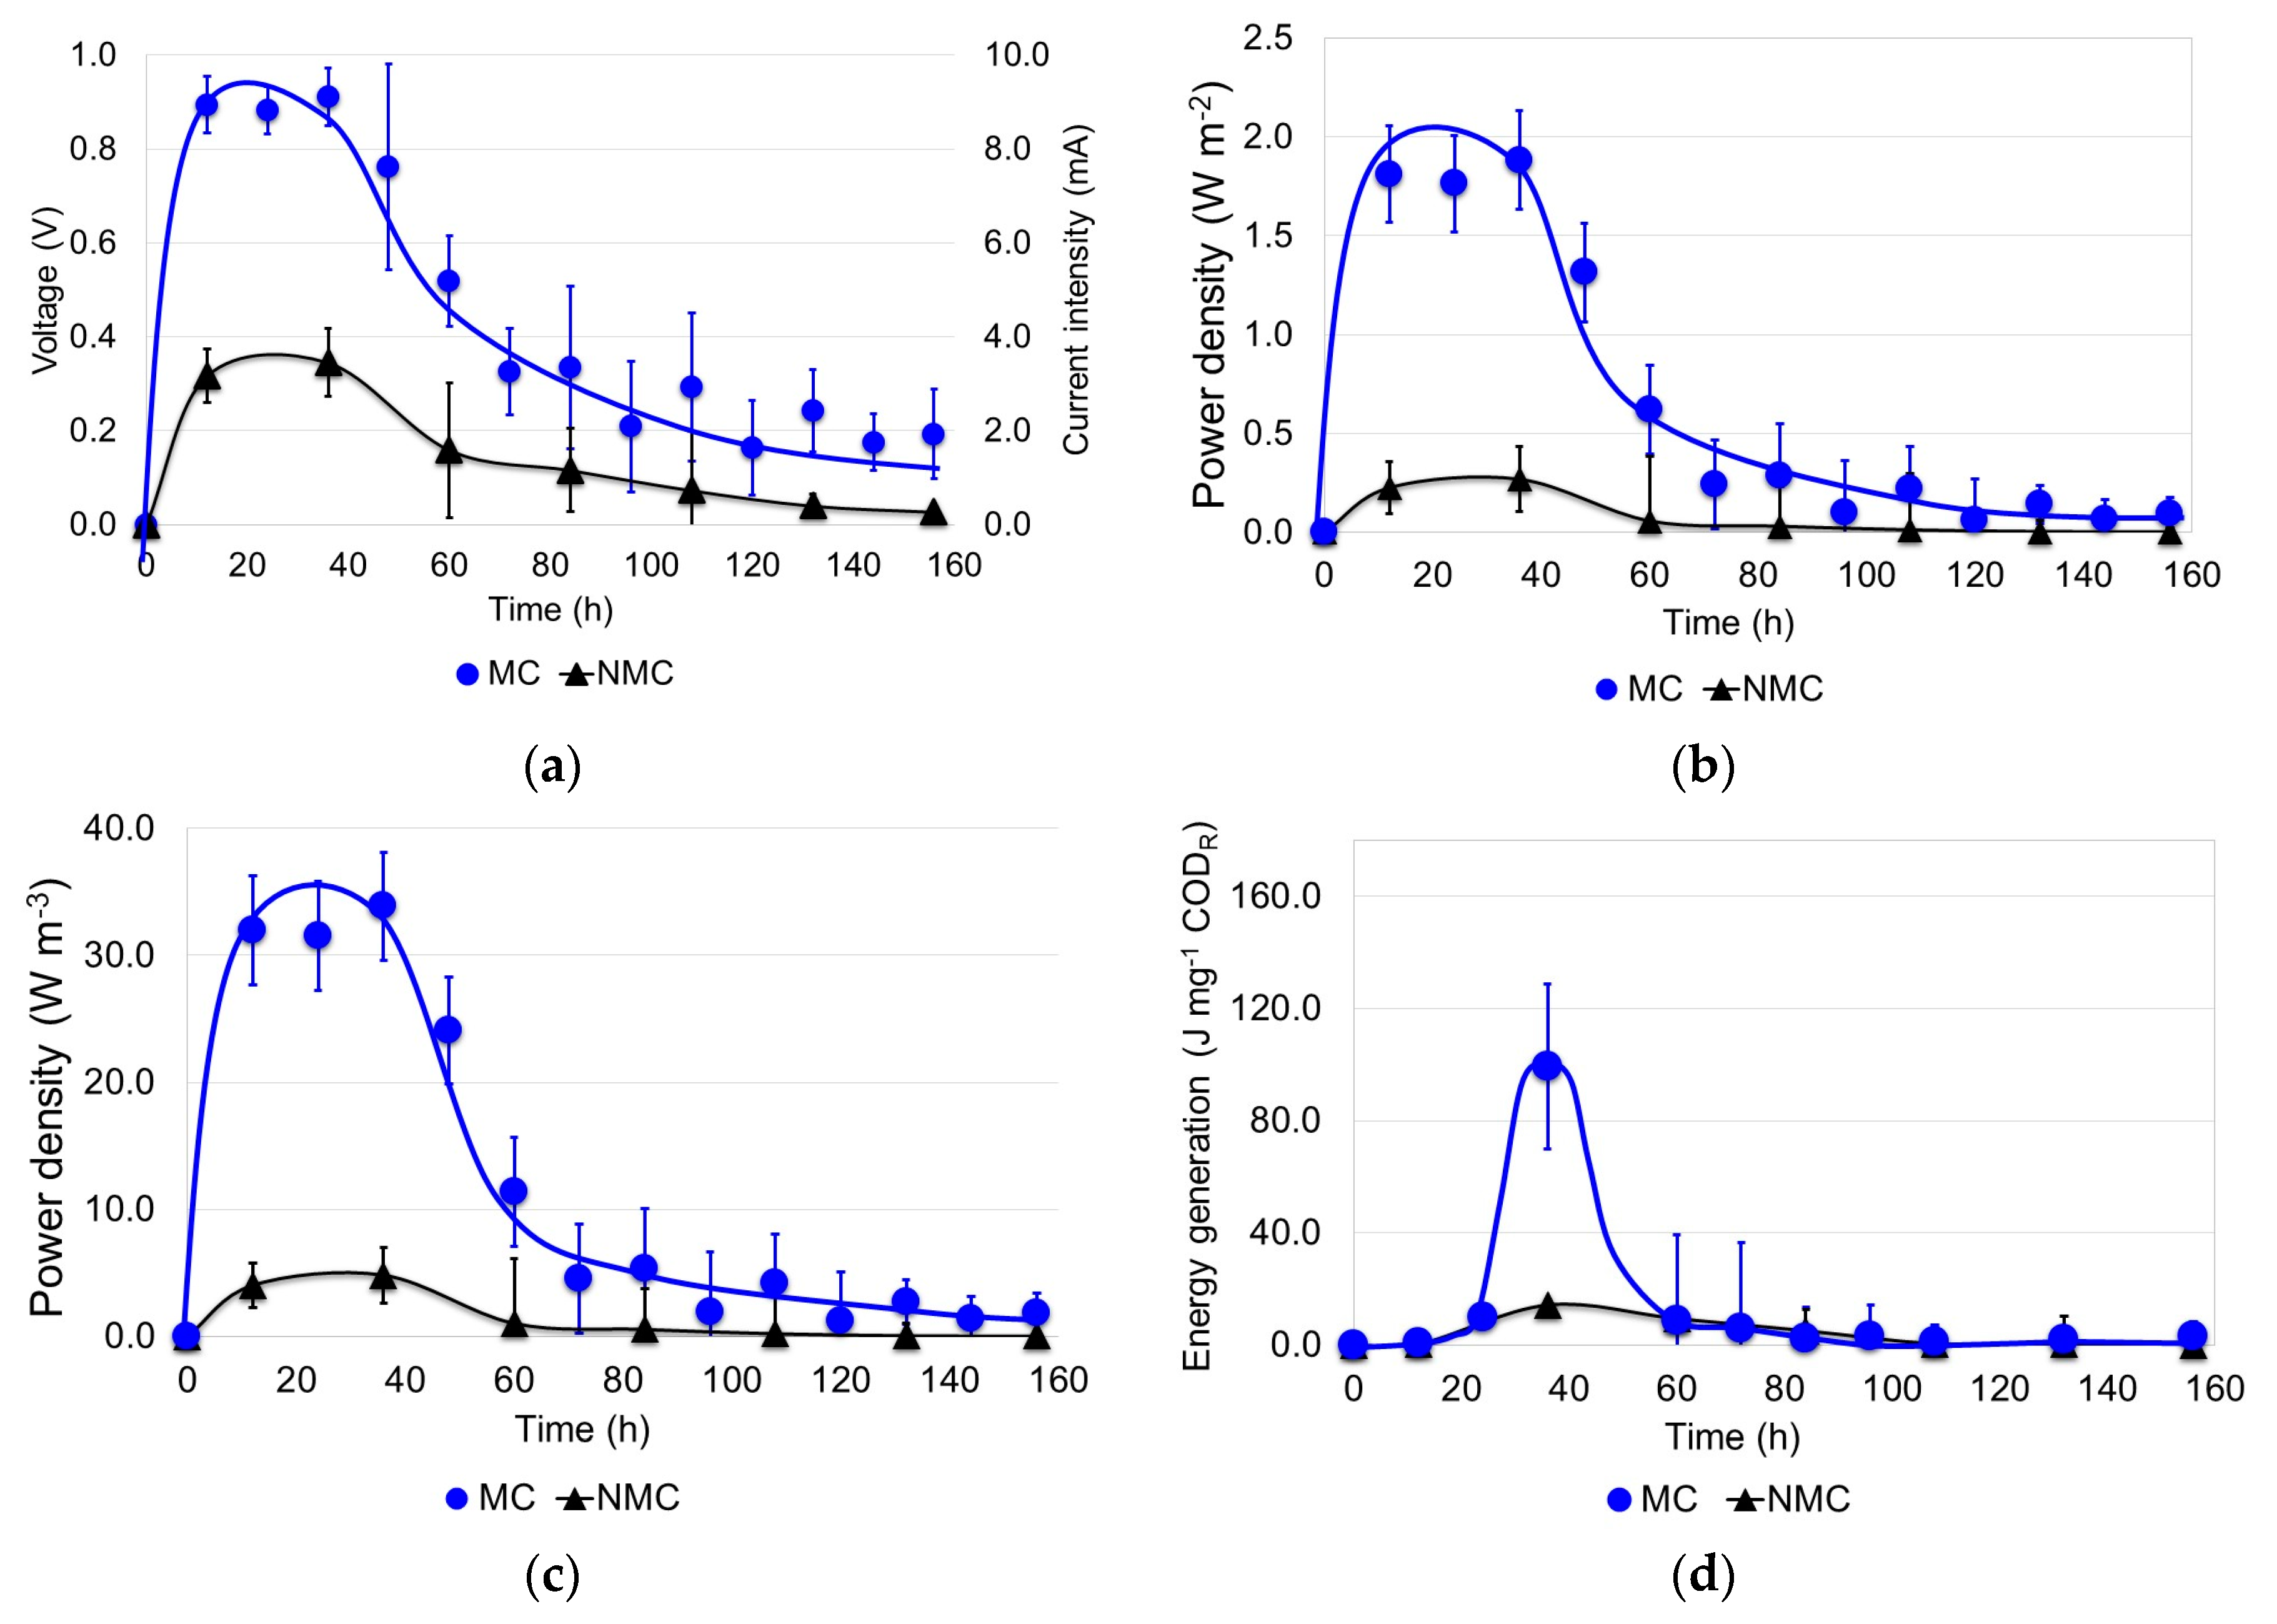
3.2. Generation of Electricity in the MFCs

In the control reactor, the biodegradation process was conducted under a vacuum with no mixing conditions and no electrolyte in the cathode chamber. Voltage was not detected in the system; therefore, current intensity, power and energy were not determined. In the control reactor, electrons generated in the anode chamber during the oxidation process did not flow through the resistor to the cathode because no electron acceptor was available in the cathode chamber, due to the vacuum conditions. Thus, bacteria were unable to utilize the electrode as an electron acceptor and the electrons generated were consumed in the anode chamber by electron acceptors such as carbon dioxide during fermentation and/or methanogenesis.
Unlike the control process, in the MFCs, under mixing and not mixing conditions, voltage was detected and measured. Based on these measurements, current intensity, power density and electric energy generation were determined for each scenario based on Equations (1)–(3). The results are shown in the Figure 7. As seen, variability of the data is observed in both scenarios. In the scenario MC, variability is associated with the differences of the wastewater organic load (Table 1). In the case of the NMC scenario, variability is mainly related to the variability observed in the COD measurements caused by the heterogeneity prevailing in the anode chamber. Greater power generation was observed in the scenario MC, in comparison with the scenario NMC. The evolution of the voltage and the current intensity for the two scenarios is presented in Figure 7a. As seen, both parameters started growing rapidly until the peak was reached, approximately 36 h after the experiments began. Then, they decreased gradually until the end of the tests. A remarkable difference on the peak values was observed between both scenarios, 0.954 V and 9.54 mA for the scenario MC and only 0.35 V and 3.54 mA for the scenario NMC. As shown in Section 3.1, in the scenario MC, oxidation of wastewater organic matter and biomass formation over the anode were better. This contributed to a greater release of electrons and better transfer to the anode that caused greater current intensity in the MFCs. Regarding the power densities and the energy generated; greater power density and energy generation were observed at higher voltage. Similarly to the voltage and current intensity, the power density peaks were obtained 36 h after the experiments began. These results are in agreement with those reported by Chou et al. [19].
For the scenario NMC, the maximum power density (0.27 W·m−2 and 4.8 W·m−3) and the energy generated (14.2 J·mg−1 COD removed) were greater than those values reported by the la literature for conventional MFC when municipal wastewater is treated (26 mW·m−2–146 mW·m−2) and for MFC with modified cathodes when activated sludge is used as anolyte (80 mW m−2 for GP-TiO2 and 220 mW·m−2 for GP-HG) and within the range when synthetic (3.5 W·m−3–17.1 W·m−3) and industrial (419 mW·m−2) wastewater is degraded [2,11,12,20,21,22,23,24,25,26,27,28,29,30,31,32,33,34,35,36,37,38,39,40,41,42,43,44]. This means mesophilic temperature, low pH and free-oxygen conditions and the diffusion of the electrolyte to the anode chamber contributed positively to enhance the current and power generation of the MFCs.
On the other hand, for the scenario MC, the peaks of the power density and the energy generation were 7.7 times and 10.7 times, respectively, greater than the peaks observed in the scenario NMC. Peaks of the power density and energy generation of the order of 2.1 W·m−2 and 36.8 W·m−3, and 99.4 J·mg−1 COD removed, respectively, were greater than those values reported for culture medium solutions (1.17 W·m−2) and similar to those values reported for glucose (3.6 W·m−2) in conventional MFCs [2,11,12,20,21,22,23,24,25,26,27,28,29,30,31,32,33,34,35,36,37,38,39,40,41,42,43,44]. Thus, besides the mesophilic temperature, low pH and free-oxygen conditions and the use of the electrolyte, mixing in the anode chamber also contributed positively, causing greater hydrolysis of particulate organic matter, better anaerobic oxidation of fermentation products and long chain fatty acids, and better biomass formation over the anode that consequently enhanced the power generation of the MFC’s.
An important parameter to evaluate the performance of the MFCs in terms of electricity generation is the columbic efficiency (CE). This parameter was calculated for each scenario based on Equation (4). Current intensity profiles of Figure 7a were integrated over the time to estimate the coulombs transferred from the substrate to the anode. Thus, the coulombs recovered were 850.4 for the scenario NMC and 2676.4 for the scenario MC. The maximum possible Coulombs in substrate were estimated as FboVlΔCOD/Mo; where, ΔCOD is the COD change over the reaction time and the rest of the parameters are those defined for Equation (4). The change on COD was determined based on the total COD of the raw wastewater and the final COD of the supernatant in the anode chamber. Thus, the maximum possible Coulombs in substrate were 2958.1 for the scenario NMC and 4199.8 for the scenario MC, and the coulombic efficiencies were 28.9% for the scenario NMC and 63.7% for the scenario MC. As seen, an important difference in the coulombic efficiency of the MFCs was observed depending on the mixing condition. As explained above, mixing enhanced the HCl catalytic effect on the hydrolysis and oxidation of the substrate that increased the electrons production. Furthermore, the well-growth and attachment of biomass on the anode facilitated the transfer of these electrons to the electrode. The coulombic efficiencies obtained in this study were greater than those reported for wastewater and similar to those of glucose when degraded in MFCs [2,6,20,21,22,23,24,25,26,27,28,29,30,31,32,33,34,35,36,37,38,39,40,41,42,43,44].
Good performance of the MFCs in terms of electricity generation, particularly in the scenario MC, can also be explained based on the reduction of internal losses. The maximum attainable MFC voltage (Eemf) is theoretically in the order of 1.1 V, based on acetate [4]. In conventional MFC configurations, the measured MFC voltage is considerably lower due to a number of losses. In an open circuit, when no current is flowing, the maximum MFC voltage achieved is on the order of 0.80 V; meanwhile, during current generation it remains below 0.62 [4,21]. The difference between the measured voltage and the cell electromotive force (Eemf) is called overvoltage and is the sum of the overpotentials of the anode and the cathode, and the ohmic losses of the system. Thus, the MFC performance can be assessed in terms of overpotentials and ohmic losses or in terms of the open circuit voltage (OCV) and the internal losses such as ohmic losses, activation losses, bacterial metabolic losses, and concentration losses [4]. In this study, the maximum measured MFCs voltage during current generation was 0.954 V for the scenario MC, value greater than 0.62 V and even greater than 0.80 V. Analysis of the reduction of internal losses is conducted as follows. In the scenario MC, the HCl diffusion to the anode chamber and mixing conditions increased the conductivity of the liquor that reduced the resistance to the flow of ions through the PEM and the flow of electrons through the anodic and cathodic electrolytes. Furthermore, vacuum conditions in the anode chamber limited the activity of oxygen as an electron acceptor; consequently, more electrons were transferred to the anode surface. In conventional MFCs, oxygen diffuses from the cathode to the anode chamber through the PEM [19]. Improvement of the electrode catalysis by the use of the electrolyte (HCl solution) and the well-growth and establishment of biofilm on the anode reduced the activation losses (or activation polarization) that occurred during the transfer of electrons from the substrate to the electrode surface. On the other hand, low pH values in the anode chamber promoted the growth of electrochemically-active microorganisms that converted amino acids, sugar, alcohols, and volatile and long-chain fatty acids into bicarbonate, ammonium, protons and electrons. These microorganisms have the distinctive feature of transferring electrons to a solid electron acceptor, such as the graphite electrode used in the anode chamber [39]. Thus, electrochemically active microorganisms played a key role in reducing the bacterial metabolic losses. Finally, mixing in the anode chamber limited diffusional gradients in the bulk liquor. This enhanced the flux of substrate to the biofilm, the discharge of oxidized species from the electrode surface, and the supply of reduced species toward the electrode that finally reduced the ratio between the oxidized and the reduced species at the electrode surface that caused a reduction of the electrode potential.
As mentioned at the end of Section 3.1, to compensate for the negative electrical charge transport through the external circuit, H+ protons generated by the oxidation of the substrate might migrate to the cathode. Additionally, high concentration of H3O+ ions in the cathode chamber due to the HCl dissociation might increase the polarization of the cathode and consequently enhance the transfer of electrons through the external circuit.
On the other hand, regarding the potential of using HCl as an electrolyte in practical applications of the MFCs, HCl was not consumed/degraded neither by the biodegradation process nor by the electrochemical reactions, as seen in Figure 3b, where the pH level was kept almost constant in the cathode chamber. Therefore, the results obtained in this study are promising and the operating conditions under which the MFCs were operated in this study arise as a potential strategy not only to improve the wastewater treatment performance, but also to enhance the power generation.

4. Conclusions

In this study, improvement of wastewater treatment performance and power generation in microbial fuel cells was achieved by enhancing hydrolysis and acidogenesis and by inhibiting methanogenesis and reducing internal losses. COD removals, voltages, power densities and energy generation were greater than those reported for conventional MFCs. All of this was possible by using HCl solution as an electrolyte in the cathode chamber and its diffusion to the anode chamber through the proton exchange membrane, by maintaining low pH (< 5) conditions in the anode chamber, by mixing conditions in the anode chamber, by enhancing the growth and attachment of biomass over the anode surface, and by keeping almost free-oxygen conditions in both chambers by means of a vacuum. Diffusion of the HCl solution from the cathode to the anode chamber enhanced the biodegradation of wastewater in two ways. First, by enhancing the hydrolysis of complex particulate organic matter of wastewater, and second, by enhancing the acidogenesis process. During hydrolysis, HCl catalysed the transformation of complex biodegradable particulates into large soluble organic molecules such as carbohydrates, proteins and lipids that were further reduced to more simple molecules such as sugars, amino acids, and long-chain fatty acids, respectively, by hydrolytic extracellular enzymes secreted by fermentative electrochemical active bacteria (acidogenic). Low pH (< 5) conditions in the anode chamber inhibited the methanogens growth and enhanced the growth of acidogenic bacteria. During the acidogenesis, sugars and amino acids were degraded by fermentative reactions generating intermediary degradative products (volatile fatty acids) like propionic, butyric and isobutyric acids. Unlike the conventional MFCs, acetic acid was less generated during fermentation; furthermore, HCl enhanced the anaerobic oxidation of volatile and long-chain fatty acids.
Regarding the contribution of mixing in the anode chamber, it was clear that mixing homogenized the concentration of HCl and the constituents of the liquor, enhancing the hydrolysis process. Furthermore, complete mixing conditions made the concentrations of all hydrolysis products uniform throughout the anode chamber, enhancing their assimilation by the electrochemically-active microorganisms. Mixing also favored the growth of healthy biomass over the anode that promoted greater COD reductions and better electron transfer.
Regarding the power generation, the HCl diffusion from the cathode chamber and the mixing conditions in the anode chamber increased the conductivity of the liquor that reduced the resistance to the flow of electrons through the anodic and cathodic electrolytes and of ions through the PEM. Improvement of the electrode catalysis by the use of HCl as an electrolyte and the well-growth and establishment of biofilm on the anode reduced the activation losses that occurred during the transfer of electrons from the substrate to the electrode surface. Low pH (< 5) values in the anode chamber promoted the growth of electrochemically-active microorganisms that enhanced the transfer of electrons to the anode. Mixing in the anode chamber limited diffusional gradients in the bulk liquor that enhanced the flux of substrate to the biofilm. The discharge of oxidized species from the electrode surface and the supply of reduced species toward the electrode finally reduced the ratio between the oxidized and the reduced species at the electrode surface that then caused a reduction of the electrode potential.
In summary, the conditions under which the biological process in the MFCs was conducted in this study constitutes a potential strategy not only to improve the wastewater treatment performance, but also to enhance the production of bioelectricity, making the MFCs more ready for practical applications.

Author Contributions

M.Á.L.Z. obtained the funds to conduct the research. Furthermore, he conceived and designed the experimental procedure, analyzed and discussed the results, prepared tables and figures, and wrote the paper. P.R.T.D. conducted all the experiments, prepared some figures, and analyzed the raw data. O.I.G.P. carried out the cyclic voltammetry, prepared some figures, and analyzed the raw data.

Funding

This research received not external funding.

Conflicts of Interest

The authors declare no conflict of interest. The founding sponsors had no role in the design of the study; in the collection, analyses, or interpretation of data; in the writing of the manuscript; or in the decision to publish the results.

References

  1. Zhou, M.; Yang, J.; Wang, H.; Jin, T.; Hassett, D.J.; Gu, T. Bioelectrochemistry of microbial fuel cells and their potential applications in bioenergy. In Bioenergy Research: Advances and Applications; Gupta, V.K., Tuohy, M.G., Kubicek, C.P., Saddler, J., Xu, F., Eds.; Elsevier: Amsterdan, The Netherlands, 2014; Volume 9, pp. 131–152. [Google Scholar]
  2. Virdis, B.; Freguia, S.; Rozendal, R.A.; Rabaey, K.; Yuan, Z.; Keller, J. Microbial fuel cells. In Treatese on Water Science, Water Quality Engineering; Wilderer, P., Hanaki, K., Vereijken, T., Eds.; Elsevier: Amsterdan, The Netherlands, 2011; Volume 4, pp. 641–665. [Google Scholar]
  3. Logan, B. Microbial Fuel Cells; Wiley: Hoboken, NJ, USA, 2008. [Google Scholar]
  4. Logan, B.; Hamelers, B.; Rozendal, R.; Schröder, U.; Keller, J.; Freguia, S.; Aelterman, P.; Verstraete, W.; Rabaey, K. Microbial fuel cells: Methodology and technology. Environ. Sci. Technol. 2006, 40, 5181–5192. [Google Scholar] [CrossRef] [PubMed]
  5. Surajbhan, S.S.; Sreekishnan, T.R.; Pous, N.; Puig, S.; Pant, D. Bioelectroremediation of perchlorate and nitrate contaminated water: A review. Bioresour. Technol. 2018, 255, 331–339. [Google Scholar]
  6. Hernández-Fernández, F.J.; De Los Ríos, A.P.; Salar-García, M.J.; Ortiz-Martínez, V.M.; Lozano-Blanco, L.J.; Godínez, C.; Tomás-Alonso, F.; Quesada-Medina, J. Recent progress and perspectives in microbial fuel cells for bioenergy generation and wastewater treatment. Fuel Process Technol. 2015, 138, 284–297. [Google Scholar] [CrossRef]
  7. Wilkinson, S. “Gastrobots”—Benefits and challenges of microbial fuel cells in food powered robot applications. Auton. Robots 2000, 9, 99–111. [Google Scholar] [CrossRef]
  8. Ieropoulos, I.; Melhuish, C.; Greenman, J. Artificial metabolism: Towards true energetic autonomy in artificial life. Adv. Artif. Life Proc. 2003, 2801, 792–799. [Google Scholar]
  9. Shantaram, A.; Beyenal, H.; Raajan, R.; Veluchamy, A.; Lewandowski, Z. Wireless sensors powered by microbial fuel cells. Environ. Sci. Technol. 2005, 39, 5037–5042. [Google Scholar] [CrossRef] [PubMed]
  10. Tender, L.M.; Gray, S.A.; Groveman, E.; Lowy, D.A.; Kauffman, P.; Melhado, J.; Tyce, R.C.; Flynn, D.; Petrecca, R.; Dobarro, J. The first demonstration of a microbial fuel cell as a viable power supply: Powering a meteorological buoy. J. Power Sources 2008, 179, 571–575. [Google Scholar] [CrossRef]
  11. Walter, X.A.; Merino-Jiménez, I.; Greenman, J.; Ieropoulus, I.A. PEE POWER® urinal II–Urinal scale-up with microbial fuel cell scale-down for improved lighting. J. Power Sources 2018, 392, 150–158. [Google Scholar] [CrossRef] [PubMed]
  12. Gajda, I.; Greenman, J.; Santoro, C.; Serov, A.; Melhuish, C.; Atanassov, P.; Ieropoulos, I.A. Improved power and long term performance of microbial fuel cell with Fe-N-C catalyst in air-breathing cathode. Energy 2018, 144, 1073–1079. [Google Scholar] [CrossRef] [PubMed] [Green Version]
  13. Hasani-Sadrabadi, M.M.; Dashtimoghadam, E.; Majedi, F.S.; Kabiri, K.; Solati-Hashjin, M.; Moaddel, H. Novel nanocomposite proton exchange membranes based on Nafion® and AMPS-modified montmorillonite for fuel cell. J. Membr. Sci. 2010, 365, 286–293. [Google Scholar] [CrossRef]
  14. APHA; AWWA; WEF. Standard Methods for the Examination of Water and Wastewater, 21st ed.; American Public Health Association: Washington, DC, USA, 2005. [Google Scholar]
  15. Huang, L.; Logan, B. Electricity generation and treatment of paper recycling wastewater using a microbial fuel cell. Appl. Microbiol. Biot. 2008, 80, 349–355. [Google Scholar] [CrossRef] [PubMed]
  16. Min, B.; Logan, B. Continuous electricity generation from domestic wastewater and organic substrates in a flat plate microbial fuel cell. Environ. Sci. Technol. 2004, 38, 5809–5814. [Google Scholar] [CrossRef] [PubMed]
  17. Ostrem, K. Greening Waste: Anaerobic Digestion for Treating the Organic Fraction of Municipal Solid Wastes; Department of Earth and Environmental Engineering, Columbia University: New York, NY, USA, 2004. [Google Scholar]
  18. Grady, C.P.L.; Daigger, G.Y.; Lim, H.C. Biological Wastewater Treatment, 2nd ed.; Marcel-Dekker: New York, NY, USA, 1999. [Google Scholar]
  19. Chou, T.Y.; Whiteley, C.G.; Lee, D.J. Anodic potential on dual-chambered microbial fuel cell with sulfate reducing bacteria biofilm. Int. J. Hydrogen Energy 2014, 39, 19225–19231. [Google Scholar] [CrossRef]
  20. Zhou, M.; Gu, T. The next breakthrough in microbial fuel cells and microbial electrolysis cells for bioenergy and bioproducts. J. Microb. Biochem. Technol. S 2013, 12, 2. [Google Scholar] [CrossRef]
  21. Liu, H.; Logan, B. Electricity generation using an air-cathode single chamber microbial fuel cell in the presence and absence of a proton exchange membrane. Environ. Sci. Technol. 2004, 38, 4040–4046. [Google Scholar] [CrossRef] [PubMed]
  22. Karra, U.; Troop, E.; Curtis, M.; Scheible, K.; Tenaglier, C.; Patel, N.; Li, B. Performance of plug flow microbial fuel cell (PF-MFC) and complete mixing microbial fuel cell (CM-MFC) for wastewater treatment and power generation. Int. J. Hydrogen Energy 2013, 38, 5383–5388. [Google Scholar] [CrossRef]
  23. Vizhemehr, A.; Kariminia, H.; Yaghmaei, S. Prediction of electricity generation in a duel chamber microbial fuel cell. Iran. J. Chem. Eng. 2012, 9, 3–11. [Google Scholar]
  24. Nien, P.C.; Lee, C.Y.; Ho, K.C.; Adav, S.; Liu, L.; Wang, A.; Lee, D.J. Power overshoot in two-chambered microbial fuel cell (MFC). Bioresour. Technol. 2011, 102, 4742–4746. [Google Scholar] [CrossRef] [PubMed]
  25. Yuan, Y.; Zhao, B.; Zhou, S.; Zhong, S.; Zhuang, L. Electrocatalytic Activity of anodic biofilm responses to pH changes in microbial fuel cells. Bioresour. Technol. 2011, 102, 6887–6891. [Google Scholar] [CrossRef] [PubMed]
  26. Huang, J.; Yang, P.; Guo, Y.; Zhang, K. Electricity generation during wastewater treatment: An approach using an AFB-MFC for alcohol distillery wastewater. Desalination 2011, 276, 373–378. [Google Scholar] [CrossRef]
  27. Fornero, J.; Rosenbaum, M.; Angenent, L. Electric power generation from municipal, food, and animal wastewaters using microbial fuel cells. Electroanalysis 2010, 22, 832–843. [Google Scholar] [CrossRef]
  28. Mathuriya, A.S.; Sharma, V.N. Bioelectricity production from various wastewaters through microbial fuel cell technology. J. Biochem. Tech. 2009, 2, 133–137. [Google Scholar]
  29. Rozendal, R.; Hamelers, H.; Rabaey, K.; Keller, J.; Buisman, C. Towards practical implementation of bioelectrochemical wastewater treatment. Trends Biotechnol. 2008, 26, 450–459. [Google Scholar] [CrossRef] [PubMed]
  30. Rodrigo, M.; Cañizares, P.; Lobato, J.; Paz, R.; Sáez, C.; Linares, J. Production of electricity from the treatment of urban wastewater using a microbial fuel cell. J. Power Sources 2007, 169, 198–204. [Google Scholar] [CrossRef]
  31. Oh, S.E.; Logan, B. Proton exchange membrane and electrode surface areas as factors that affect power generation in microbial fuel cells. Appl. Microbiol. Biotechnol. 2006, 70, 162–169. [Google Scholar] [CrossRef] [PubMed]
  32. Rozendal, R.; Hamelers, H.; Buisman, C. Effects of membrane cation transport on pH and microbial fuel cell performance. Environ. Sci. Technol. 2006, 40, 5206–5211. [Google Scholar] [CrossRef] [PubMed]
  33. Rabaey, K.; Verstraete, W. Microbial fuel cells: Novel biotechnology for energy generation. Trends Biotechnol. 2005, 23, 291–298. [Google Scholar] [CrossRef] [PubMed]
  34. Rabaey, K.; Boon, N.; Höfte, M.; Verstraete, W. Microbial phenazine production enhances electron transfer in biofuel cells. Environ. Sci. Technol. 2005, 39, 3401–3408. [Google Scholar] [CrossRef] [PubMed]
  35. Liu, H.; Cheng, S.; Logan, B. Production of electricity from acetate or butyrate using a single-chamber microbial fuel cell. Environ. Sci. Technol. 2005, 39, 658–662. [Google Scholar] [CrossRef] [PubMed]
  36. Liu, H.; Ramnarayanan, R.; Logan, B. Production of electricity during wastewater treatment using a single chamber microbial fuel cell. Environ. Sci. Technol. 2004, 38, 2281–2285. [Google Scholar] [CrossRef] [PubMed]
  37. Jang, J.; Pham, T.; Chang, I.; Kang, K.; Moon, H.; Cho, K.; Kim, B. Construction and operation of a novel mediator and membrane less microbial fuel cell. Process Biochem. 2004, 39, 1007–1012. [Google Scholar] [CrossRef]
  38. Rabaey, K.; Lissens, G.; Siciliano, S.; Verstraete, W. A microbial fuel cell capable of converting glucose to electricity at high rate and efficiency. Biotechno. Lett. 2003, 25, 1531–1535. [Google Scholar] [CrossRef]
  39. Ayyaru, S.; Dharmalingam, S. A study of influence on nanocomposite membrane of sulfonated TiO2 and sulfonated polystyrene-ethylene-butylene-polystyrene for microbial fuel cell application. Energy 2015, 88, 1–7. [Google Scholar] [CrossRef]
  40. Pant, D.; Van, B.G.; Alvarez, G.Y.; Diels, L.; Vanbroekhoven, K. Evaluation of bioelectrogenetic potential of four industrial effluents as substrate for low cost microbial fuel cells operation. Environ. Eng. Manag. J. 2016, 15, 1897–1904. [Google Scholar] [CrossRef]
  41. Fatemi, S.; Ghoreyshi, A.A.; Rahimnejad, M.; Darzi, G.N.; Pant, D. Sulfide as an alternative electron donor to glucose for power generation in mediator-less microbial fuel cell. J. Environ. Sci. Health. A 2017, 52, 1150–1157. [Google Scholar] [CrossRef] [PubMed]
  42. Mashkour, M.; Rahimnejad, M.; Pourali, S.M.; Ezoji, H.; ElMekawy, A.; Pant, D. Catalytic performance of nano-hybrid graphene and titanium dioxide modified cathodes fabricated with facile and green technique in microbial fuel cell. Pro. Nat. Sci. Mater. 2017, 27, 647–651. [Google Scholar] [CrossRef]
  43. Choudhury, P.; Prasad Uday, U.S.; Bandyopadhyay, T.K.; Ray, R.N.; Bhunia, B. Performance improvement of microbial fuel cell (MFC) using suitable electrode and Bioengineered organisms: A review. Bioengineered 2017, 8, 471–487. [Google Scholar] [CrossRef] [PubMed] [Green Version]
  44. Jannelli, N.; Nastro, R.A.; Cigolotti, V.; Minutillo, M.; Falcucci, G. Low pH, high salinity: Too much for Microbial Fuel Cells? Appl. Energy 2017, 192, 543–550. [Google Scholar] [CrossRef]
Figure 1. Schematic representation of a dual-chamber microbial fuel cell used for enhancing the wastewater treatment performance and power generation.
Energies 11 02309 g001
Figure 2. Experimental dual-chamber microbial fuel cells.
Energies 11 02309 g002
Figure 3. COD reduction and evolution of pH in the MFCs and the control reactor (CR). (a) Normalized COD reduction in the NMC and MC scenarios and the CR; (b) pH evolution in the anode chamber (AC), cathode chamber (CC) and the CR.
Energies 11 02309 g003
Figure 4. Evolution of the volatile fatty acids concentration in the anode chamber of the MFCs (scenario MC) and in the control reactor.
Energies 11 02309 g004
Figure 5. Differential growth and attachment of biomass on the electrode of the anode chamber. (a) Scenario NMC; (b) Scenario MC.
Energies 11 02309 g005
Figure 6. Gases production in the anode chamber of the MFCs for the scenario MC and in the control reactor. AC: Anode chamber; CC: Cathode chamber; CR: Control reactor; CH4: Methane.
Energies 11 02309 g006
Figure 7. Electricity generation in the MFCs. (a) Voltage (V) and current intensity (mA); (b) Power density (W·m−2); (c) Power density (W·m−3); (d) Electric energy generation (J·mg−1 COD removed).
Energies 11 02309 g007
Table 1. Initial conditions of the MFCs and the control reactor.
Constituent UnitNMCMCCR
Inoculum (MLVSS)Vol.mL33.033.0–37.033.0–37.0
Massmg112.4112.4–113.4112.4–113.4
WastewaterVol.mL250.0250.0250.0
Total CODmg·L−1906.7906.7–1253.3906.7–1253.3
Electrolyte (0.1 M HCl)Vol.mL283.0283.0–287.0
NMC: Not mixing conditions; MC: Mixing conditions. CR: Control reactor.

