Article

Alternating Current Discharge Characteristics and Simulation Analysis of Rod-Plane Short Air Gaps under Salt Fog Conditions

Hebei Provincial Key Laboratory of Power Transmission Equipment Security Defense, North China Electric Power University, Baoding 071003, China
*
Authors to whom correspondence should be addressed.
Energies 2018, 11(9), 2251; https://doi.org/10.3390/en11092251
Submission received: 16 July 2018 / Revised: 22 August 2018 / Accepted: 24 August 2018 / Published: 27 August 2018

Abstract

:
In this paper, smog meteorological conditions in the natural environment is simulated by the salt fog method. The study of the alternating current (AC) discharge characteristics of rod-plane short air gaps in salt fog environments has important guiding significance for how to strengthen the external insulation strength of ultra-high voltage (UHV) transmission lines and electrical equipment in smog environments. The rod-plane short air gap is selected as the model to simulate the extremely uneven electric field. The AC discharge test is carried out in the salt fog environment with different conductivity, and the finite element method (FEM) is used to simulate the distribution of electric field in air gap under salt fog environment conditions. The results show that under clean fog conditions the AC discharge voltage in the air gap increased by 15.1% to 35.5% compared to that under dry conditions. With the increased conductivity of salt fog, the AC discharge voltage in air gap decreased by 4.1% to 9.2% compared to that under clean fog conditions, and the reduction is within 10%. The distortion of the electric field and the adsorption of free electrons in the gap by droplets lead to the decrease of the electric field intensity in the air gap. With the increase of the conductivity, the electric field intensity in the air gap increases slightly. Meanwhile, the influence of salt fog and its conductivity on the AC discharge voltage of rod-plane short air gap is examined, becoming saturated with the increase of the gap distance and the conductivity of salt fog.

1. Introduction

With the continuous acceleration of China’s industrialization process, large amounts of industrial wastes have caused incalculable damage to the environment, causing frequent hazy weather episodes in recent years. According to the statistics, from 1973 to 2007, the number of days when visibility was less than 10 km in Beijing, Shanghai and Guangzhou has increased significantly [1]. The influence of smog on the external insulation of transmission lines and electrical equipment is complicated. The solid particles in the haze act as condensation nuclei for the tiny water droplets in the fog, increasing their diameter through mutual collision and coexisting with pollutants for a long time, thus distorting the electric field and affecting the number of charged particles around them, thus greatly increasing the probability of flashover in the air gap [2,3,4].
The main factor affecting the external insulation characteristics of power transmission and transformation equipment is the soluble salt ion content in the dirt on the insulation surface, while the ion content in smog changes in proportion to its conductivity. Therefore, in the field of external insulation research, it is appropriate to simulate the smog environment with salt fog and characterize the pollution degree of smog with the conductivity of salt fog [3].
At present, there are few domestic or foreign studies on the effect of salt spray on the gap discharge phenimenon. In 1990, Vasudev et al. of the Central Electric Power Research Institute of India conducted AC and DC voltage breakdown experiments in the rod-plane air gap (20–50 cm) under dry, wet and salt spray conditions [5]. In the same year, Mei at the Yunnan Electric Power Experimental Research Institute studied the influence of various air pollution factors on the discharge voltage of the rod-plane air gap. Through experimental analysis, it was concluded that the influence of fog on the discharge voltage of the air gap was the result of the combined effect of fog particles and humidity [6]. In 1995, Hui and others in Canada used a gas-water spray device and NaCl solution to perform a breakdown test of a rod-rod short air gap under different conductivity in an artificial fog chamber. The experimental results showed that the breakdown of the rod-rod short air gap decreases with the increase of the fog conductivity [7]. In 2013, Huang of Chongqing University studied the discharge mechanism and discharge characteristics of typical rod-plane short air gapd in natural fog through simulation and field experiments. The experimental results showed that the change of water content in fog had a significant effect on the gap discharge voltage [8]. To sum up, previous studies have failed to compare and analyze AC discharge voltage of the short air gap under different fog water conductivity. Moreover, the models used in the simulation are relatively simple and can only be analyzed qualitatively.
In this paper, the smog environment under natural condition is simulated by salt fog. According to the actual working conditions, most of discharges are from extremely uneven electric fields. The rod-plane air gap is selected to simulate an extremely uneven electric field, and gap discharge tests under AC voltage are carried out. The distribution of the electric field of the rod-plane air gap model in the salt fog environment is calculated by the finite element method, and the influence of salt fog on the electric field in the air gap is analyzed quantitatively.
The experimental data and results obtained in this paper will have important reference value for how to strengthen the external insulation strength of UHV transmission lines and electrical equipment in smog environments.

2. Experimental Work

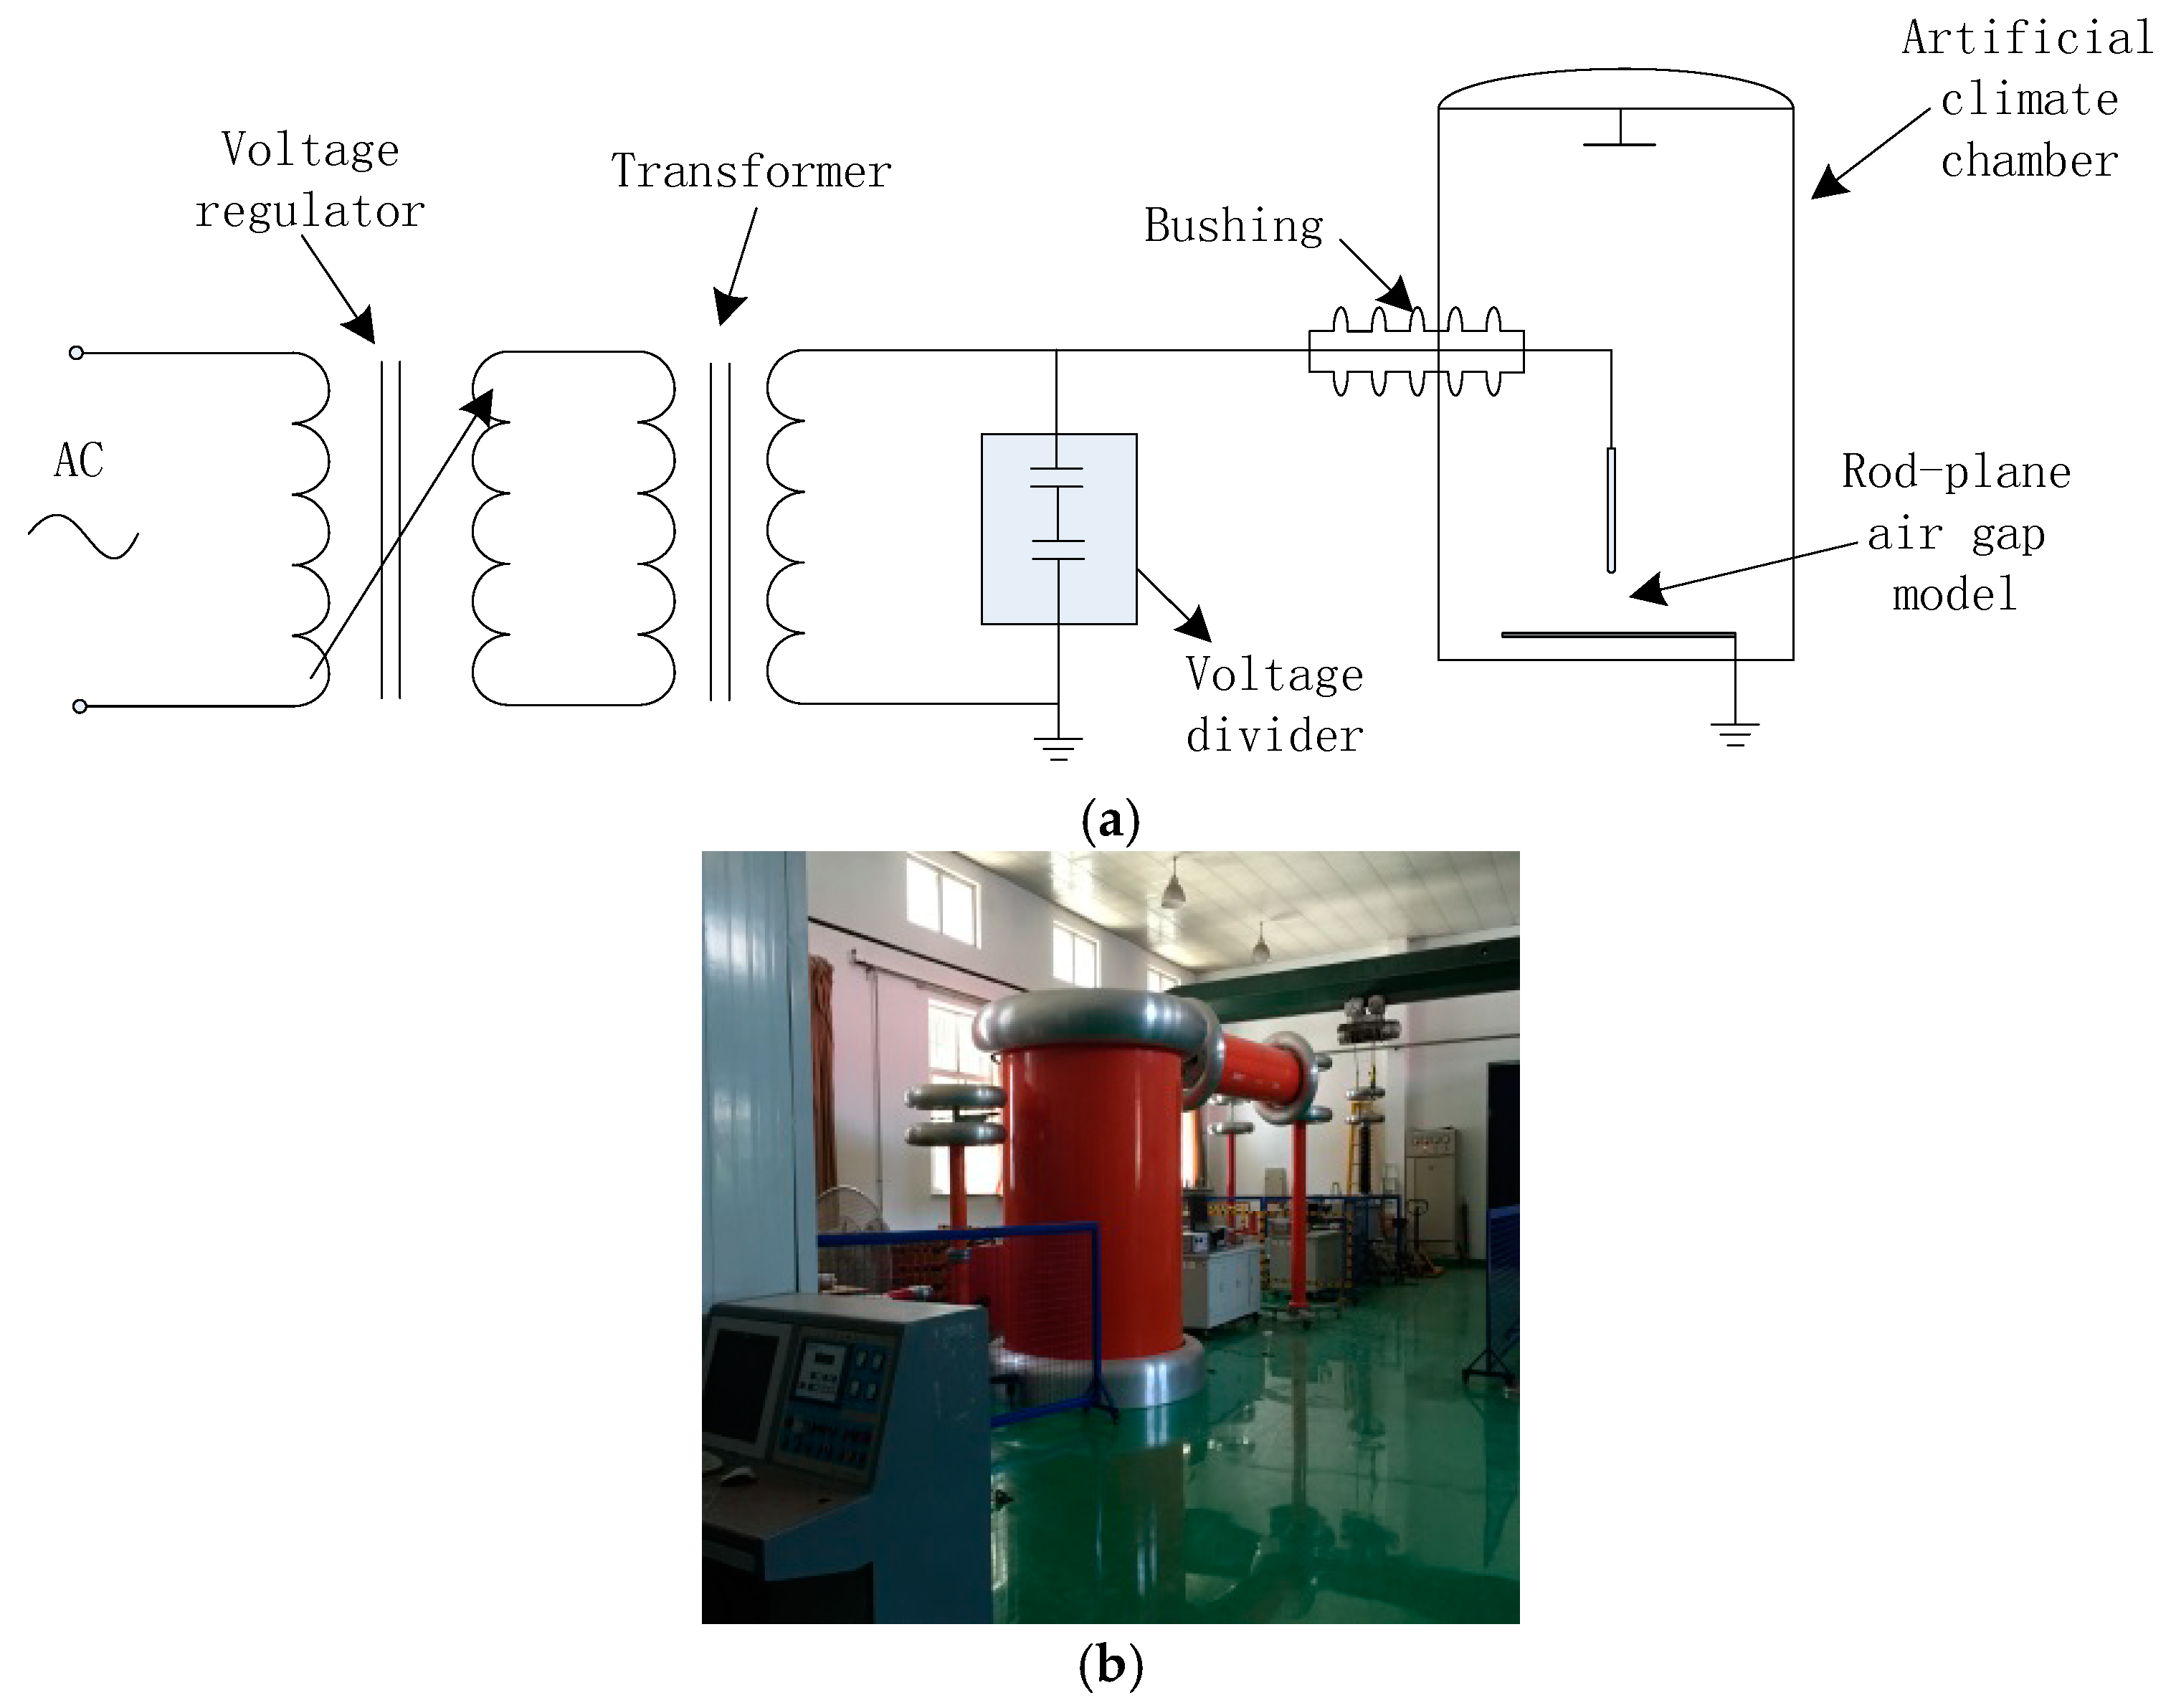
2.1. Test Power Supply and Test Method

In this paper, AC discharge voltage means flashover voltage. AC voltage is provided by a YDJ-350 AC test transformer (Leiyu High Voltage Equipment Co. Ltd., Yangzhou, China) which has a rated current of 4 A and a short-circuit current of over 10 A (Figure 1), which meets the external insulation test requirements in high-humidity conditions. The test power supply is connected to the artificial climate chamber through a 220 kV dry high-pressure wall bushing, and the bushing was 1.6 m from the edge of the climate chamber. The test voltage was measured by a TAWF−300 AC capacitor voltage transformer (CVT, Leiyu High Voltage Equipment Co. Ltd., Yangzhou, China) with a voltage division ratio of 2000:1. The constant-pressure lifting method specified in standard IEC 60060-1-2010 [9] is adopted in the experiment, and rising voltage at 10% to 20% of the expected flashover voltage per second, and test data is discarded with a standard deviation greater than 5%. The average discharge voltage of the rod-plane air gap (Ub, kV) and its standard deviation percentage (σ%) in the test are calculated as:
{ U b = i = 1 , N U f ( i ) N σ % = 100 U b i = 1 N ( U f ( i ) U b ) 2 N 1
where Uf (i) is the number i effective voltage value, kV; N is the total number of valid tests, N ≥ 20.
Before the test, the spaces are filled for about 15 min, and a voltage is applied when the fog concentration reached equilibrium in the climate chamber.

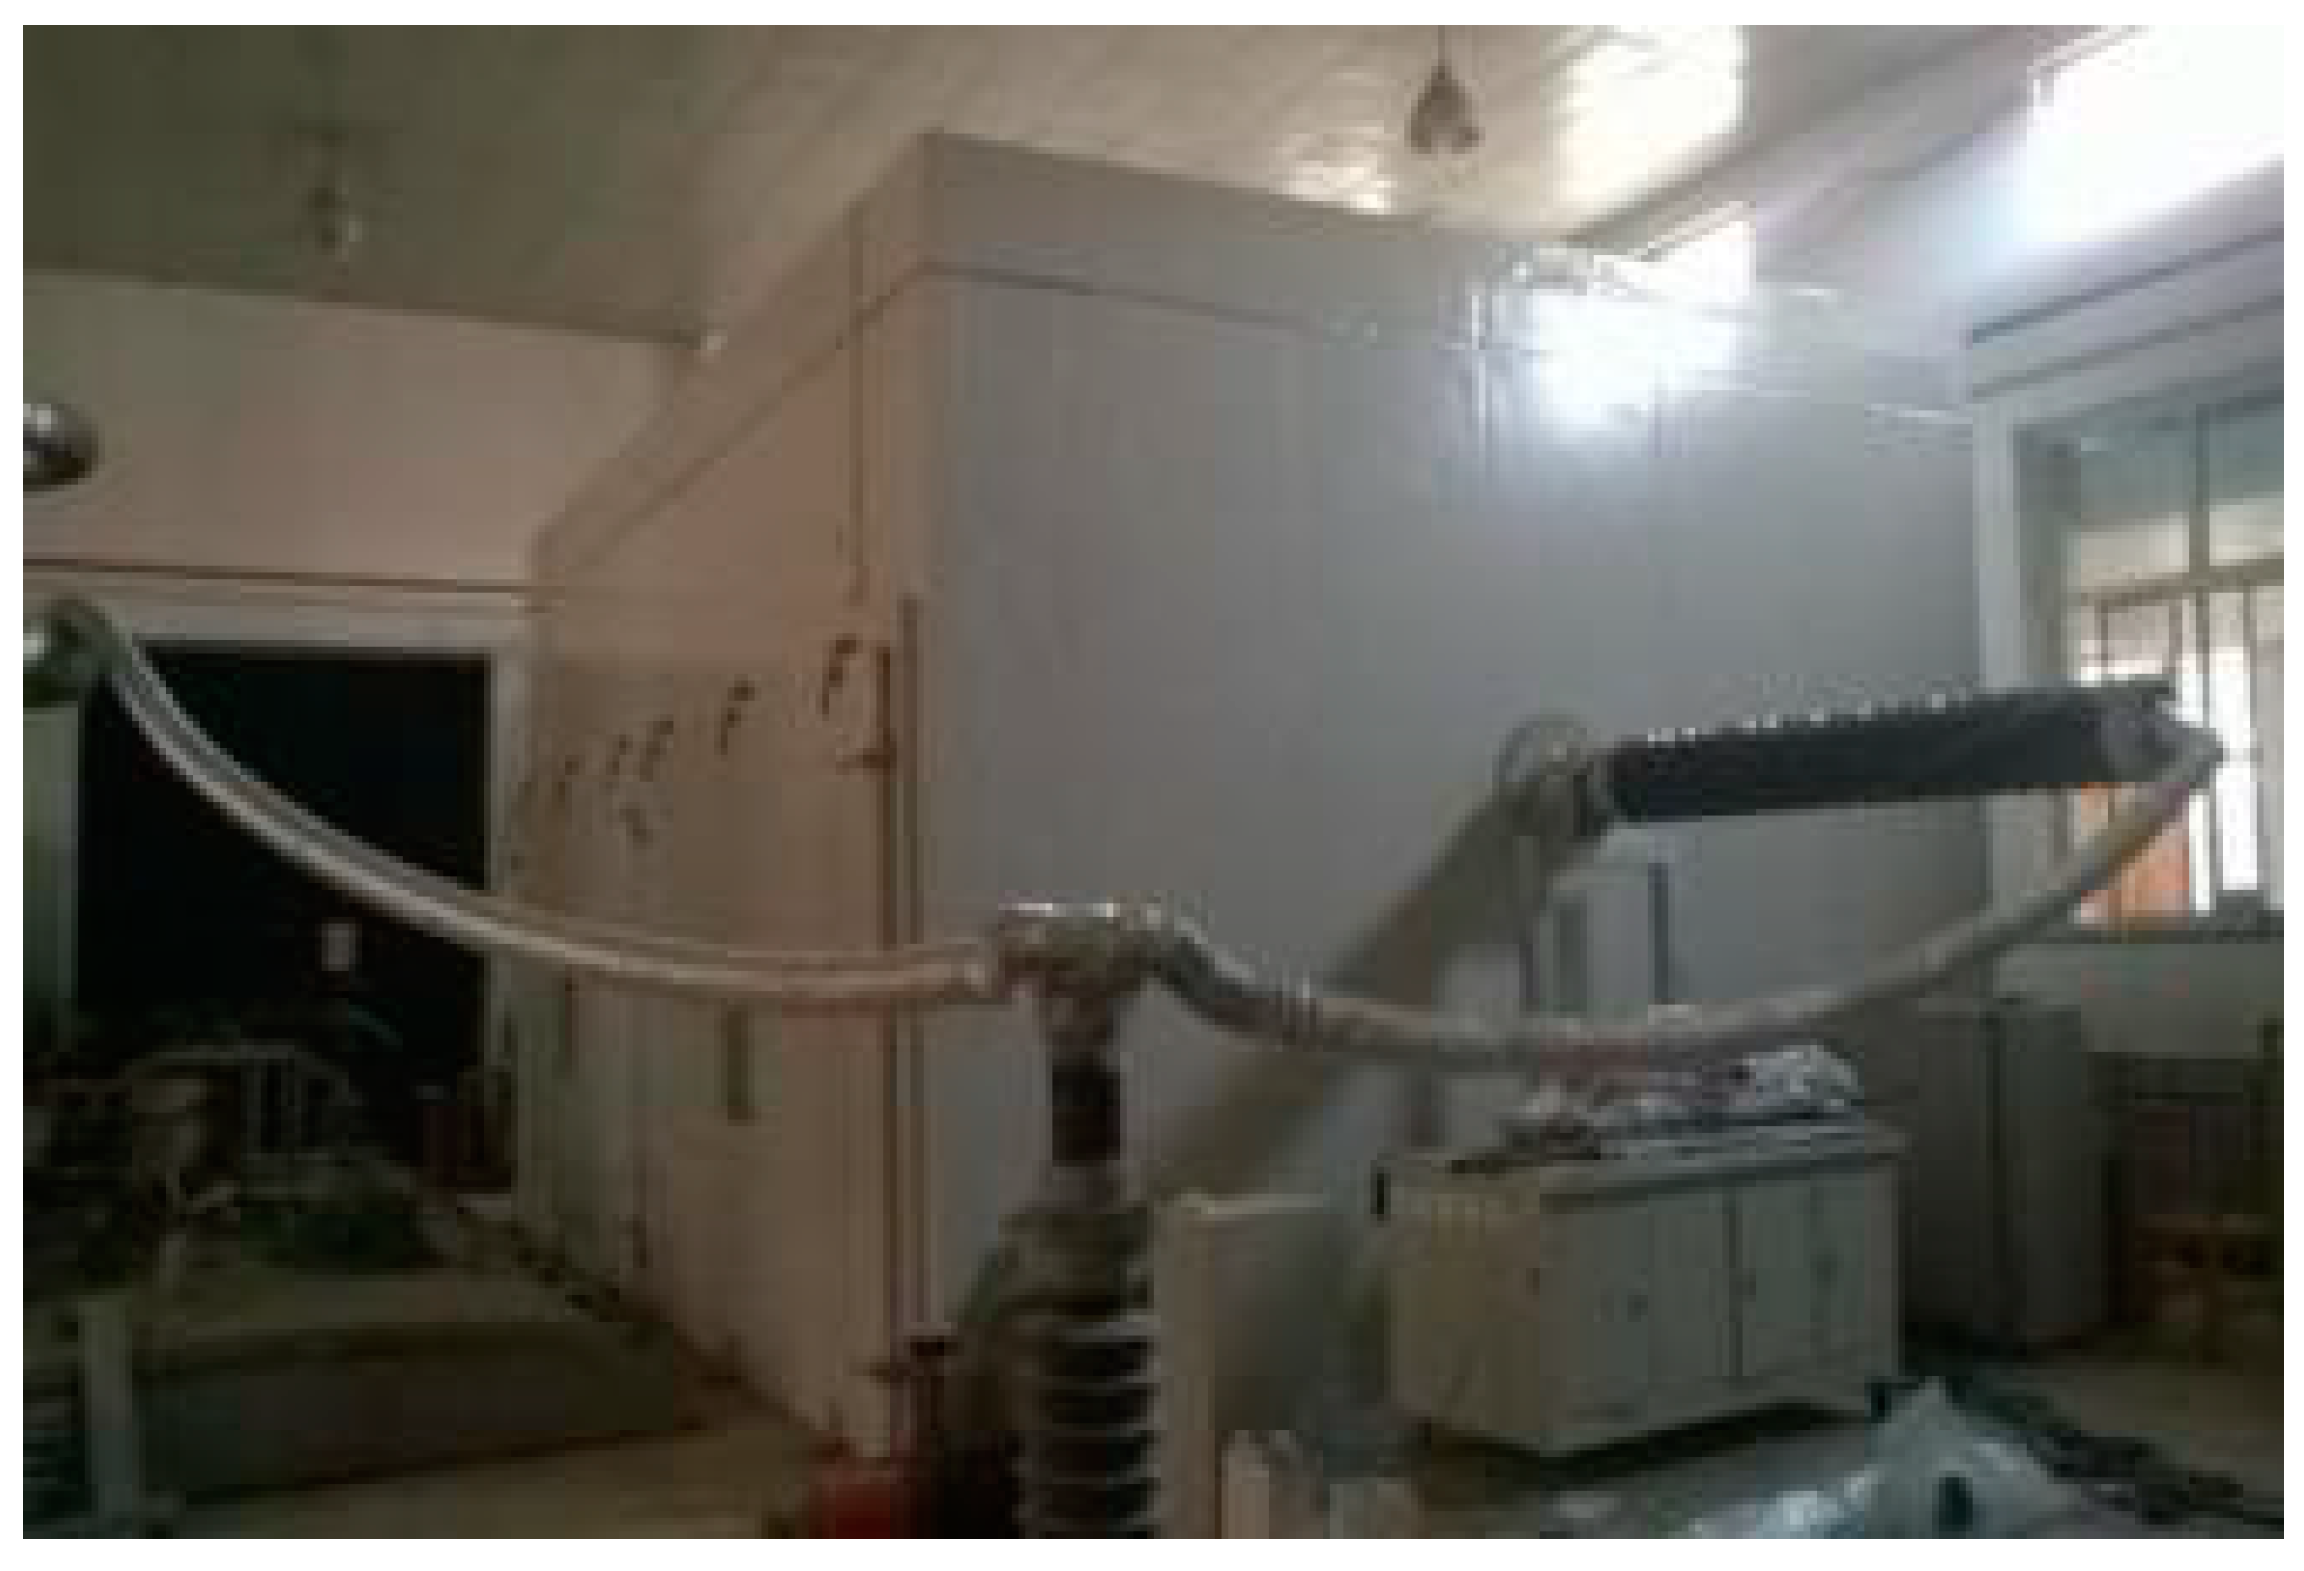
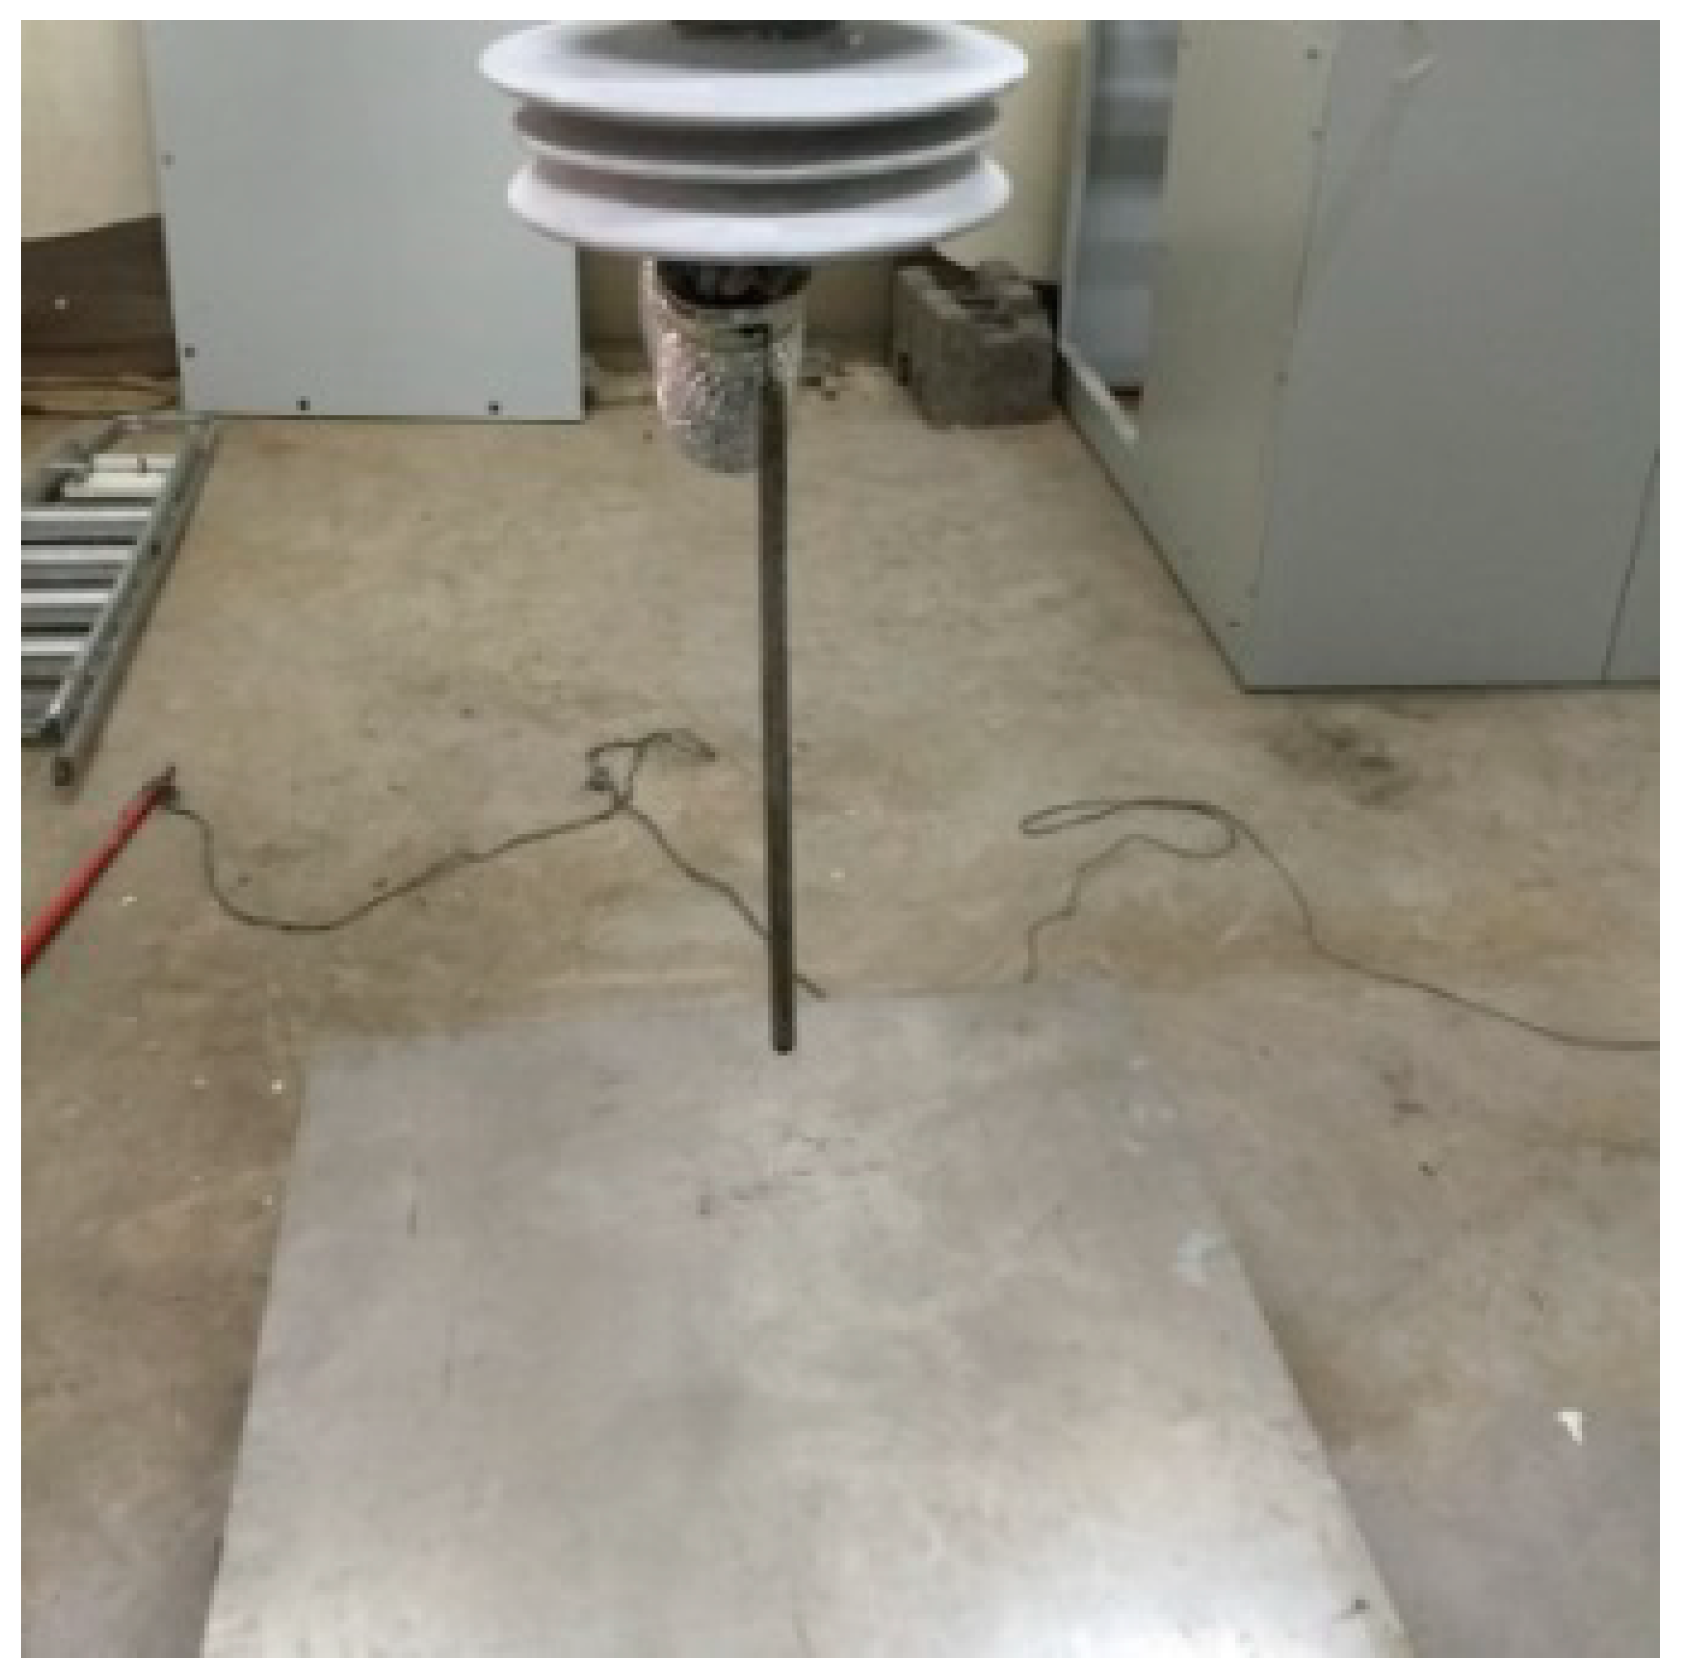
2.2. Artificial Climate Chamber and Air Gap Model

The artificial climate chamber (Figure 2) measures 8 m × 6 m × 3 m and has an adjustable range of indoor temperatures of −20 °C to 40 °C, an adjustable range of relative humidity of 30% to 98%, and the maximum allowable voltage is 300 kV. The structural material of the artificial climate chamber is an eccentric hook-type assembly cold storage plate, and rigid polyurethane foams are used as the heat insulating material. The fog is sprayed into the artificial climate chamber through a high-pressure sprayer. After the softened water is pressurized, it is atomized and sprayed through a special high-pressure nozzle to simulate natural fog. The high-pressure nozzle adopts a special ceramic nozzle which is resistant to wear and corrosion, and the high-pressure nozzles are evenly distributed side by side on the gap model. A DP-02 laser particle size analyser (Omec Co., Beijing, China) was used to analyse the sprayed droplets: the average size of droplets is 29.72 μm, which is in the particle size range of natural fog [10].
In this paper, according to standard IEC 60060-1-2010, the salt fog is prepared by adding a suitable amount of NaCl to soft water. The purity of the NaCl is more than 99.5%, and the conductivity of the salt fog is adjusted by changing the NaCl content. The conductivity of salt fog in this experiment is set to 18 (clean fog), 1000, 2750, and 4000 μS/cm, respectively.
The rod-plane short air gap model is vertically arranged: the rod electrode is made of a hemispherical aluminium rod with a diameter of 2 cm and its length is 59 cm. The plane electrode is a square iron plane with a thickness of 0.12 cm and a side length of 180 cm. The rod-plane short air gap model is shown in Figure 3. The gap distance for AC discharge tests are set to 5, 10 and 15 cm.

3. Experimental Results and Analysis

In this paper, to minimise the influence of atmospheric and other factors on the test results, the temperature in the artificial climate chamber is kept constant at 25 °C, and the pressure is held constant at 102.6 kPa. According to the IEC 60060-1-2010 standard, the experimental data are corrected to standard atmospheric conditions. The humidity of the artificial climate chamber is 95% to 100%, and saturated humidity condition should be achieved before the test voltage is applied.
Table 1 shows the AC discharge voltage at different gap distances under salt fog conditions, and Table 2 shows confidence intervals (confidence level 95%) of the AC discharge voltages. According to the data in Table 1 and Table 2, the AC discharge voltage of the clean fog condition is compared with that of the dry condition, and the AC discharge voltage varies with the conductivity of the salt fog, as shown in Figure 4a,b.
Figure 4a,b show that the AC discharge voltage of the clean fog condition is 35.5%, 20.6%, and 15.1% higher than that of the dry condition for the three gap distances of 5 cm, 10 cm and 15 cm respectively, because free electrons easily collide with the positive water molecules to form neutral water molecules under clean fog conditions, resulting in a decrease in free electrons and hindering the development of streamers. As the conductivity of the salt fog increases from 18 μS/cm to 4000 μS/cm, the AC discharge voltage decreased by 9.2%, 9.2%, and 4.1% under the three gap distances of 5 cm, 10 cm and 15 cm respectively, because the number of ions and free electrons in the unit space gradually increase with the increasing conductivity, and this promotes the formation of electron avalanches and the development of discharges. The above data show that for the rod-plane air gap, the AC discharge voltage of the clean fog condition is higher than that under dry conditions, and decreases with the increase of the conductivity. However, the reduction is within a factor of 10%.

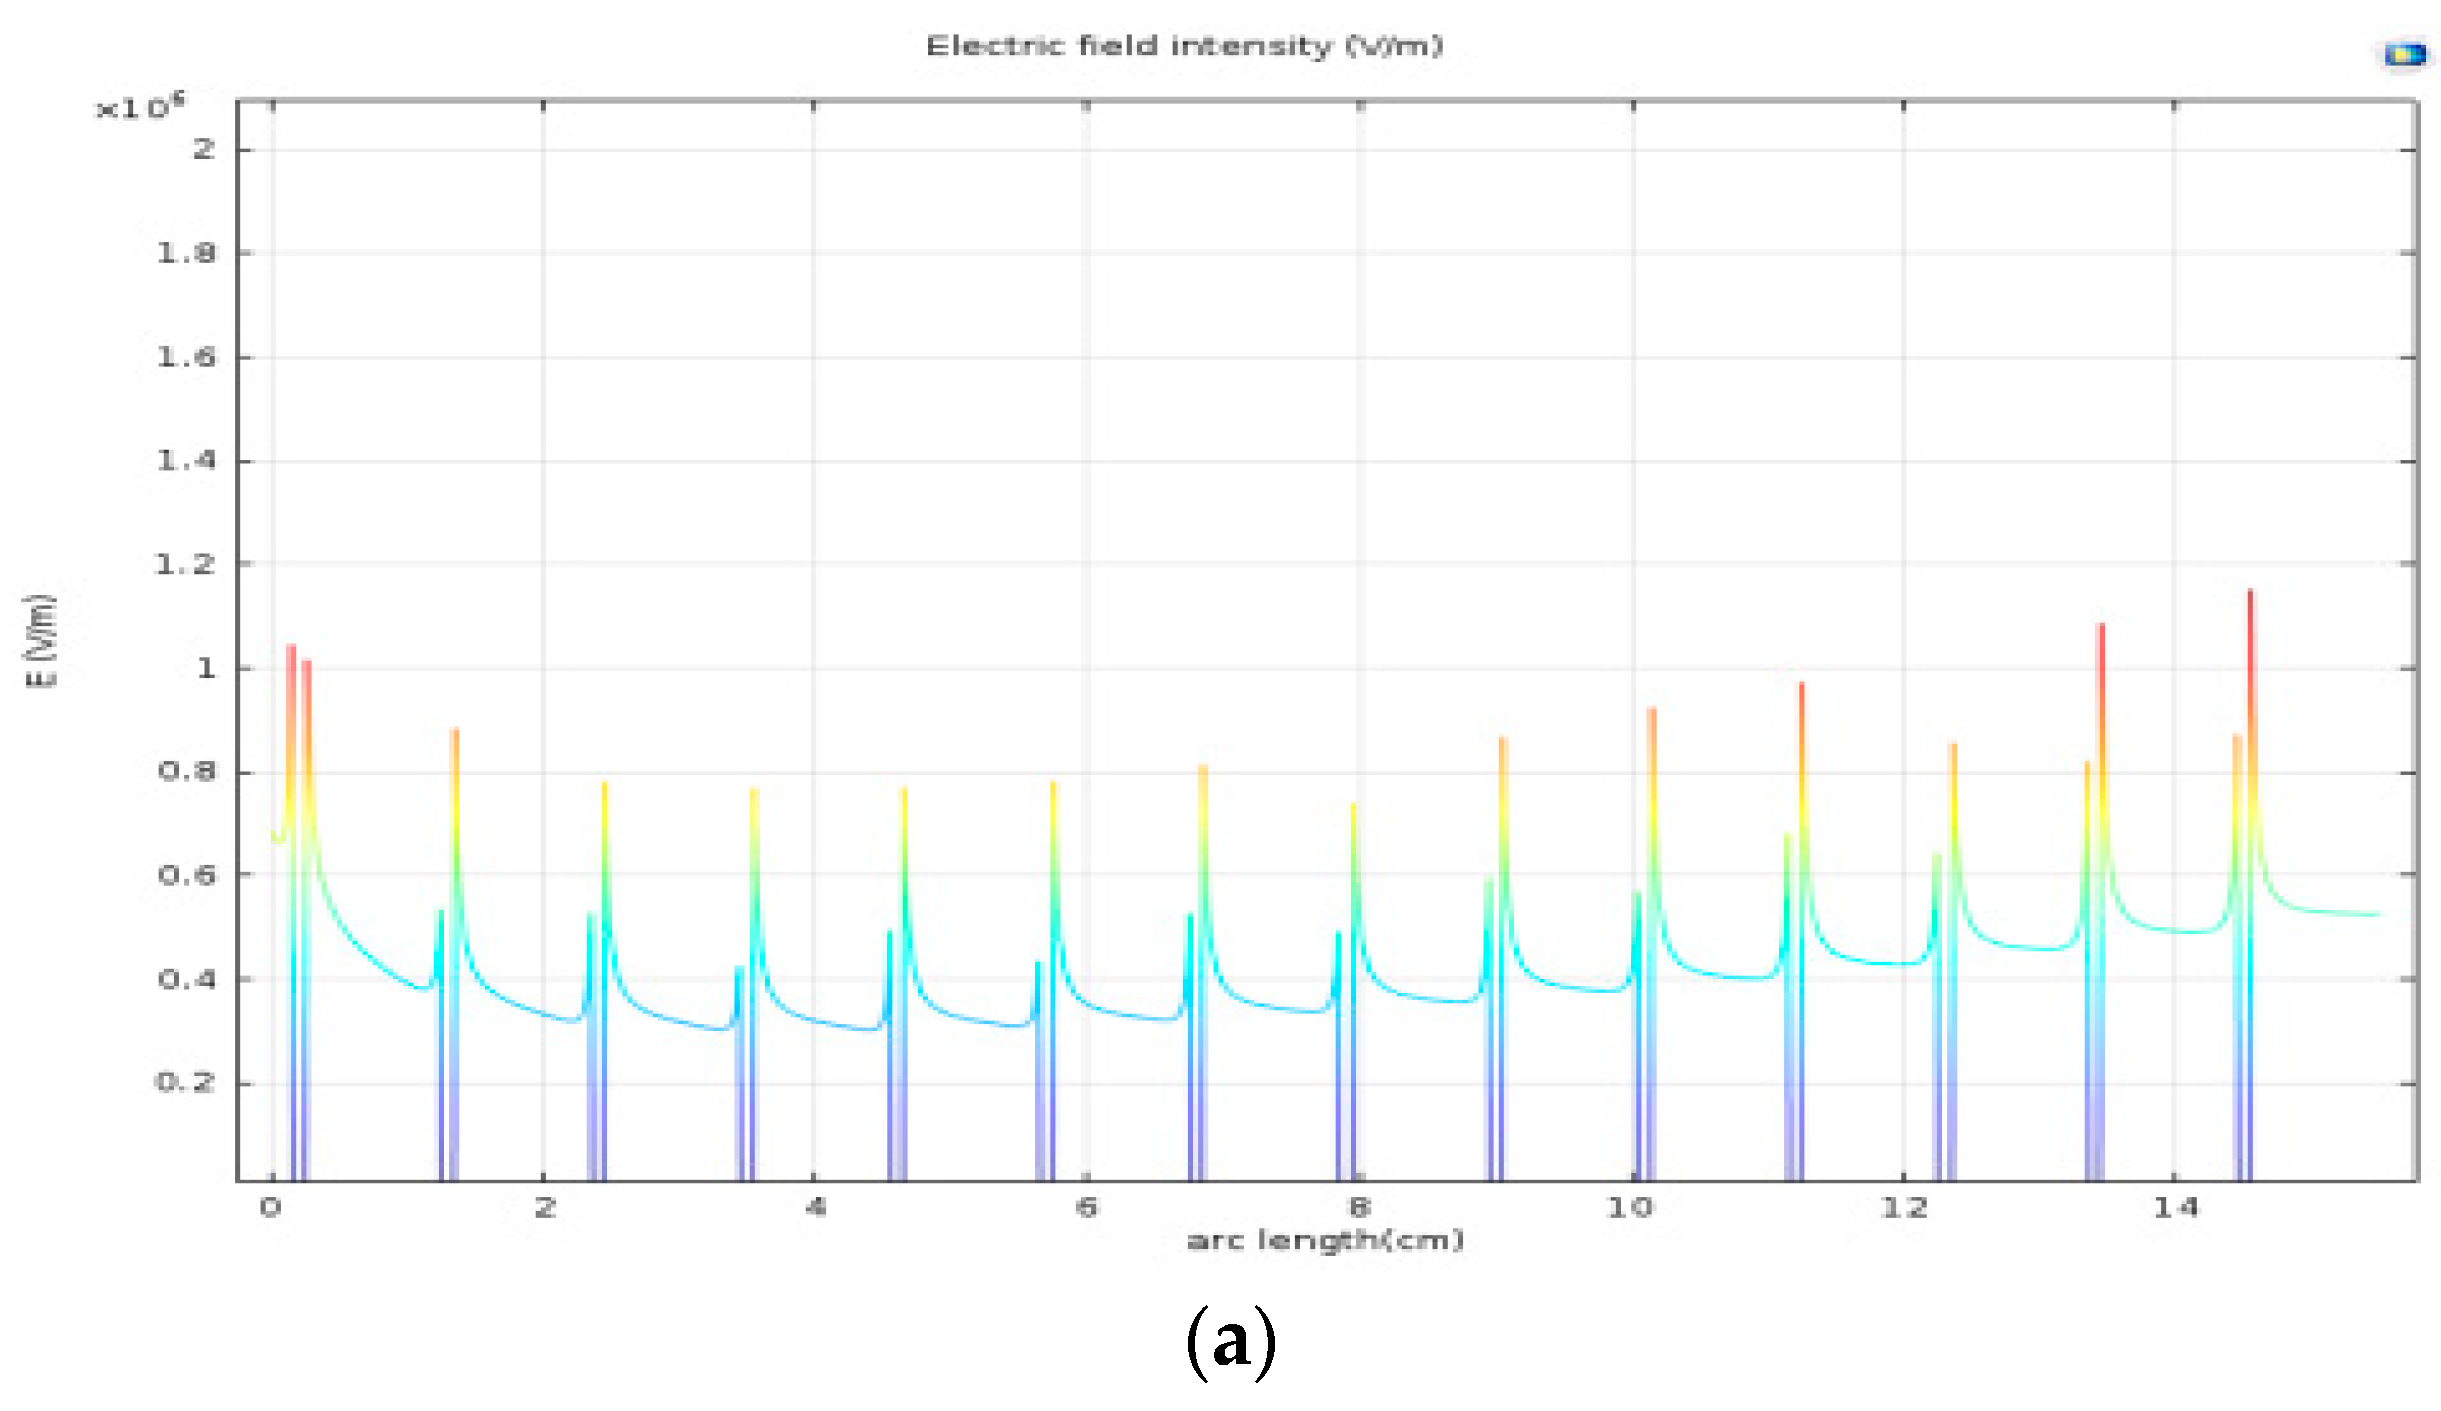
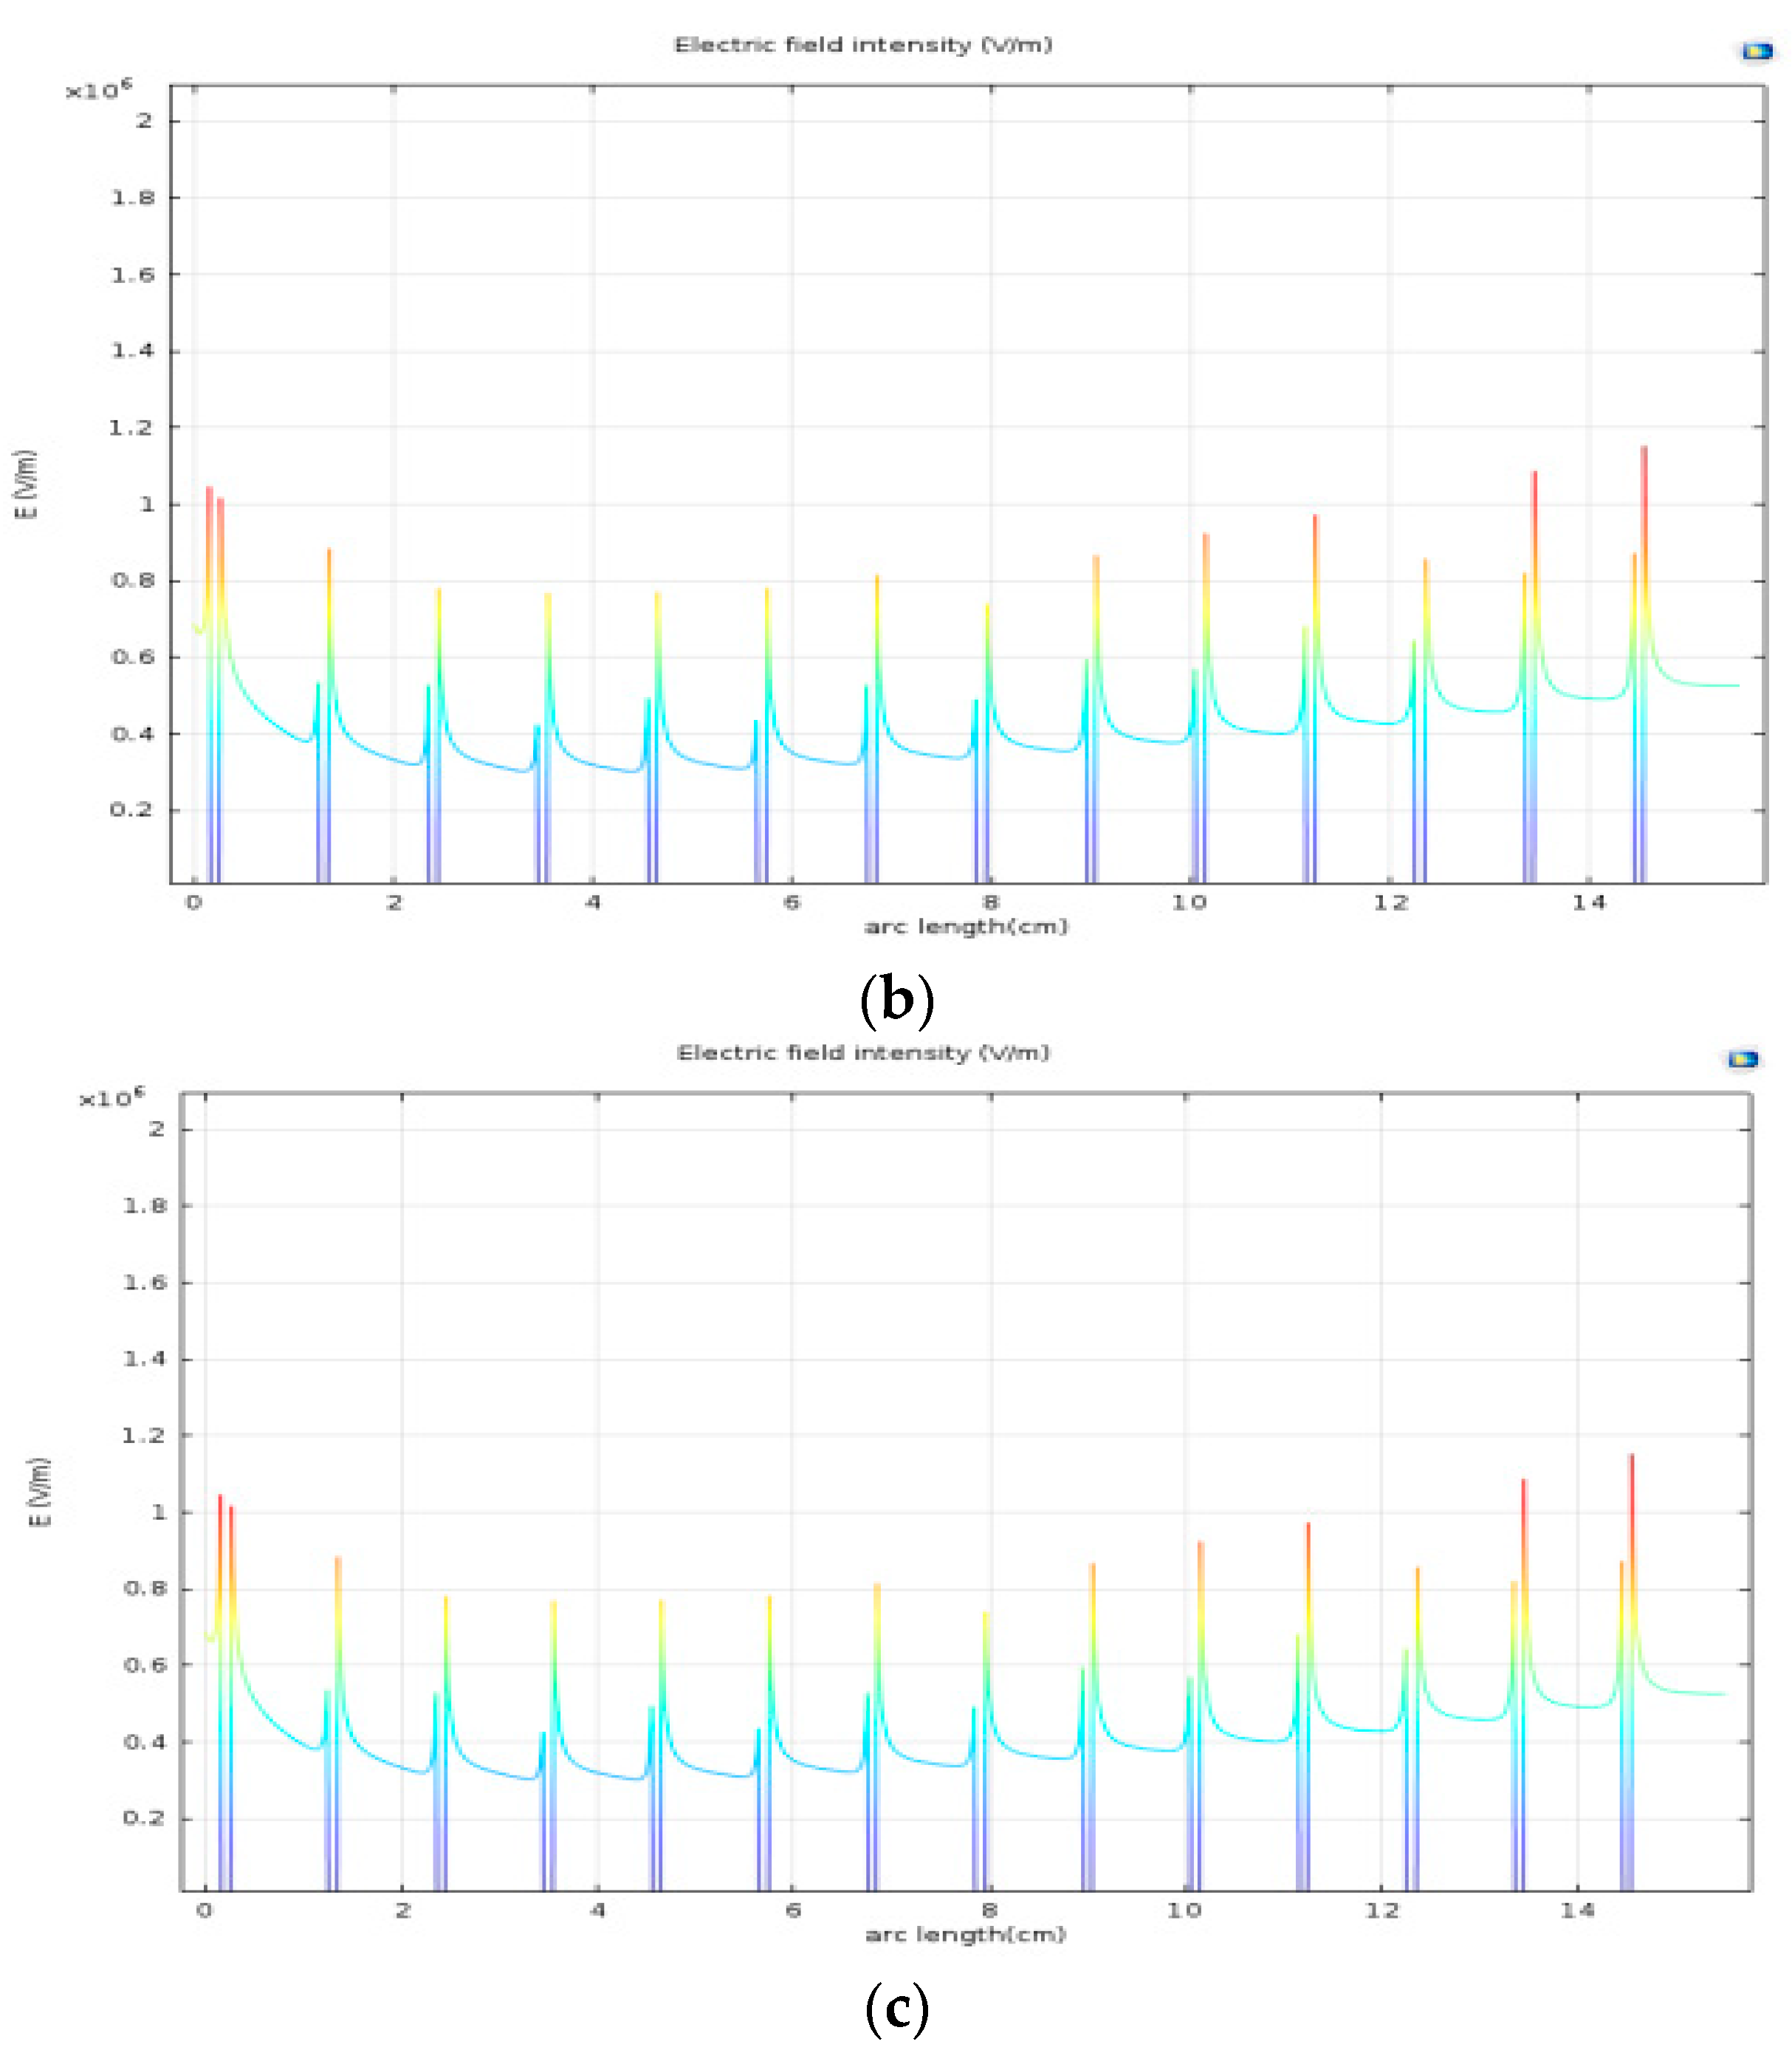
4. Simulation and Theoretical Analysis

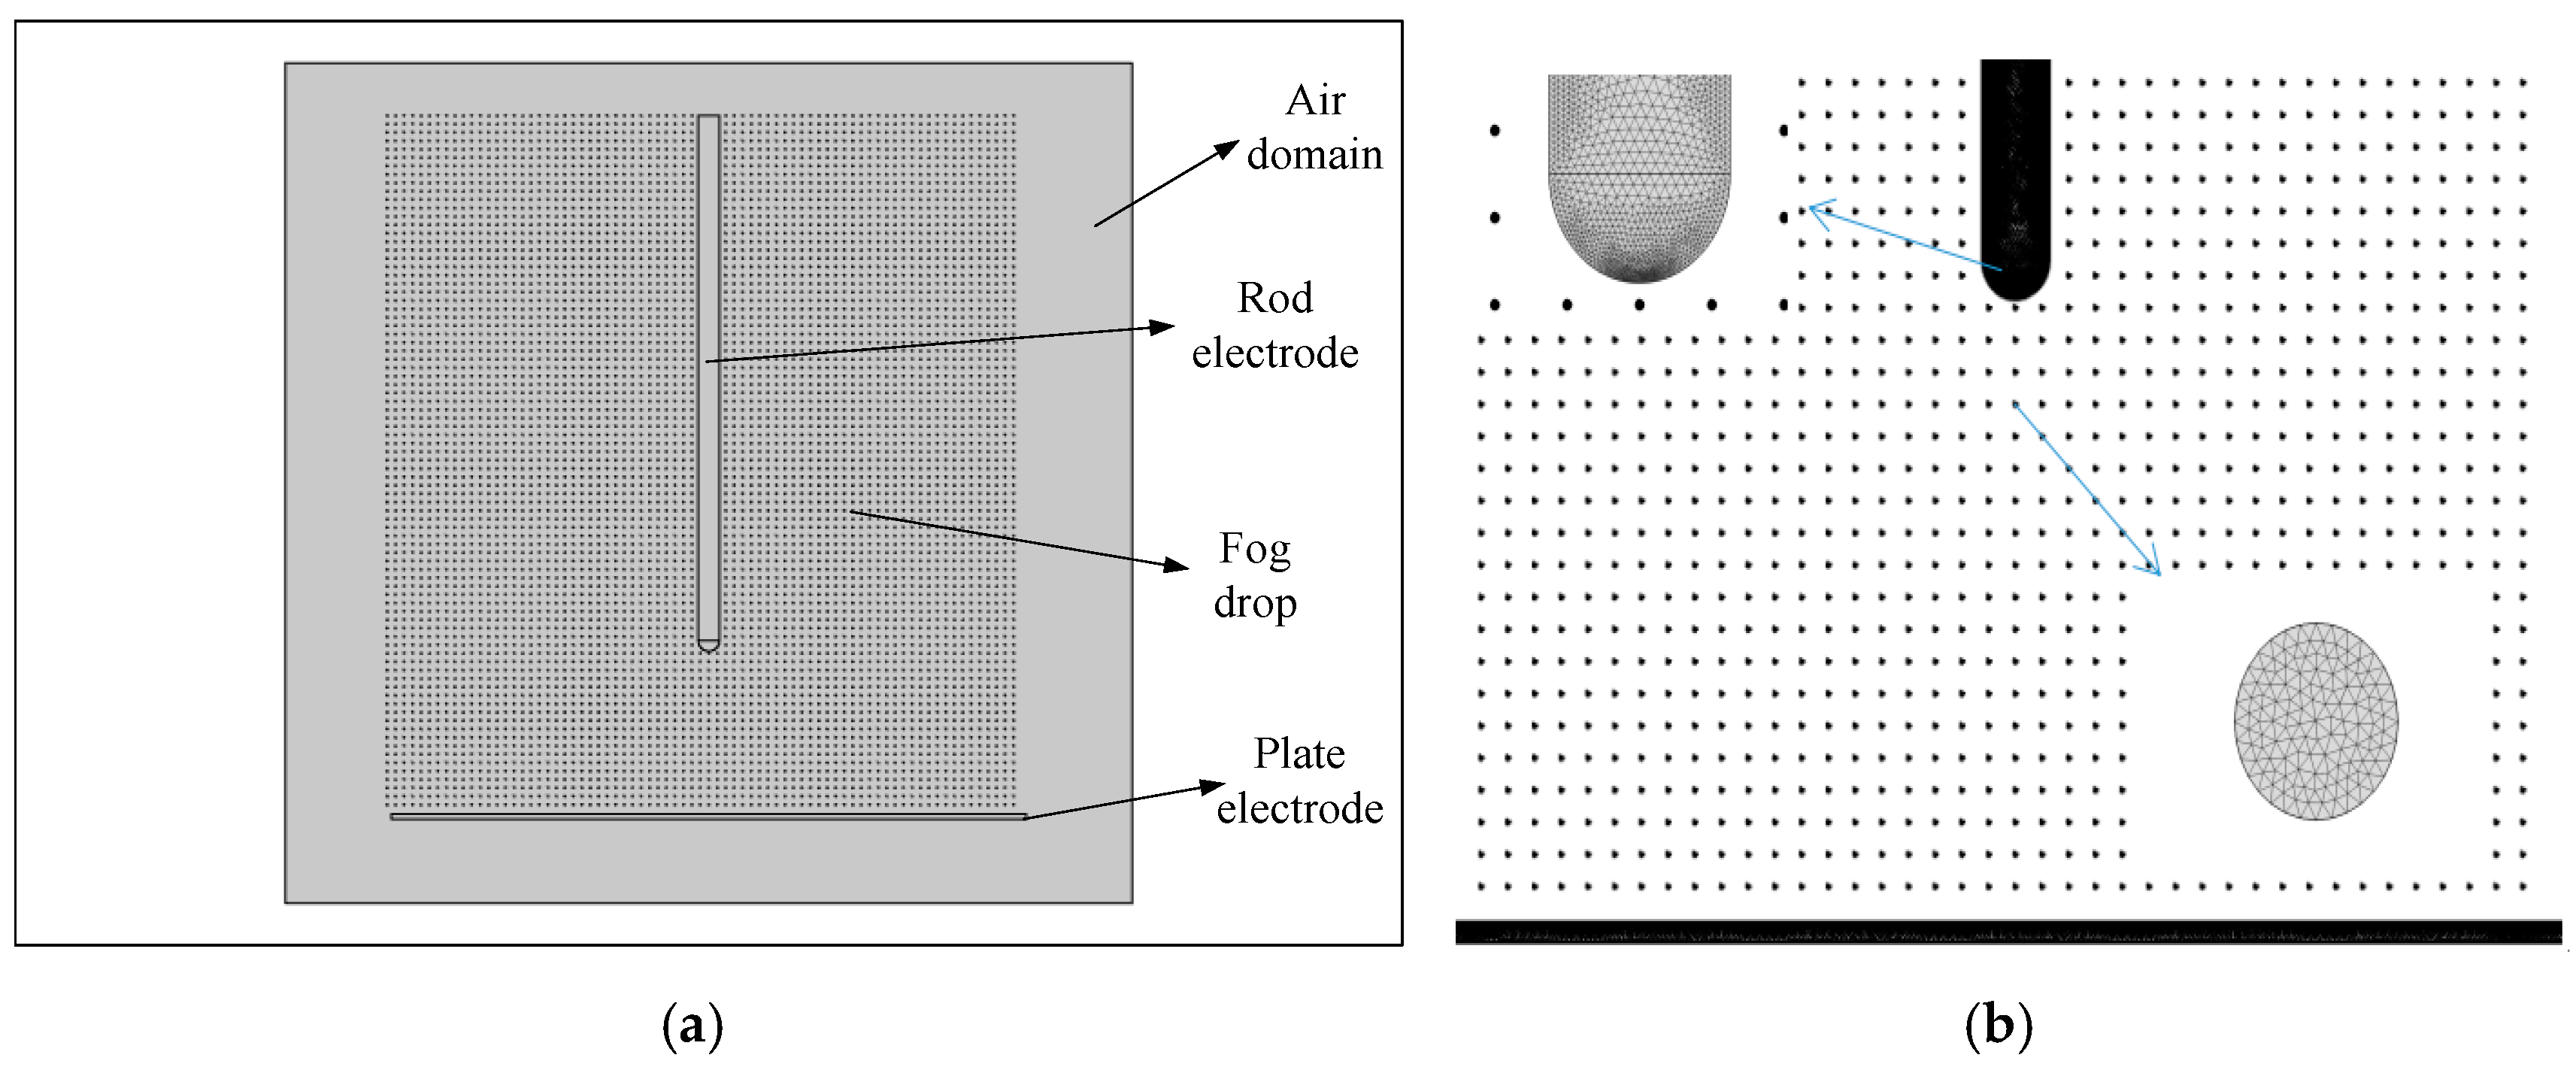
4.1. Model Establishment

Based on the finite element method, the electric field distribution of the rod-plane air gap in salt fog is simulated using the Comsol Multiphysics software. In the calculation process, assuming that the outer boundary of the air domain is infinity and the potential is zero, the internal potential of the conductor is equal everywhere, and there is no free charge in the space, and the MUMPS steady-state solver is applied. The dimensions of the electrode model are the same as those used in the test, and the model material parameters are shown in Table 3. In this paper, the droplets in the salt fog are simulated by a sphere with a diameter of 0.005 cm, and the entire rod-plane air gap model is filled with 6105 droplets. The conductivity of the droplets is set to 18, 1000, 2750 and 4000 μS/cm, respectively. The entire model is wrapped in the air domain and the model divided into finite element meshes, as shown in Figure 5.
The initial value of the potential applied to the rod electrode satisfies φ 1 = φ 0 , and the initial value of the potential applied to the finite boundary satisfies φ 2 = 0 .

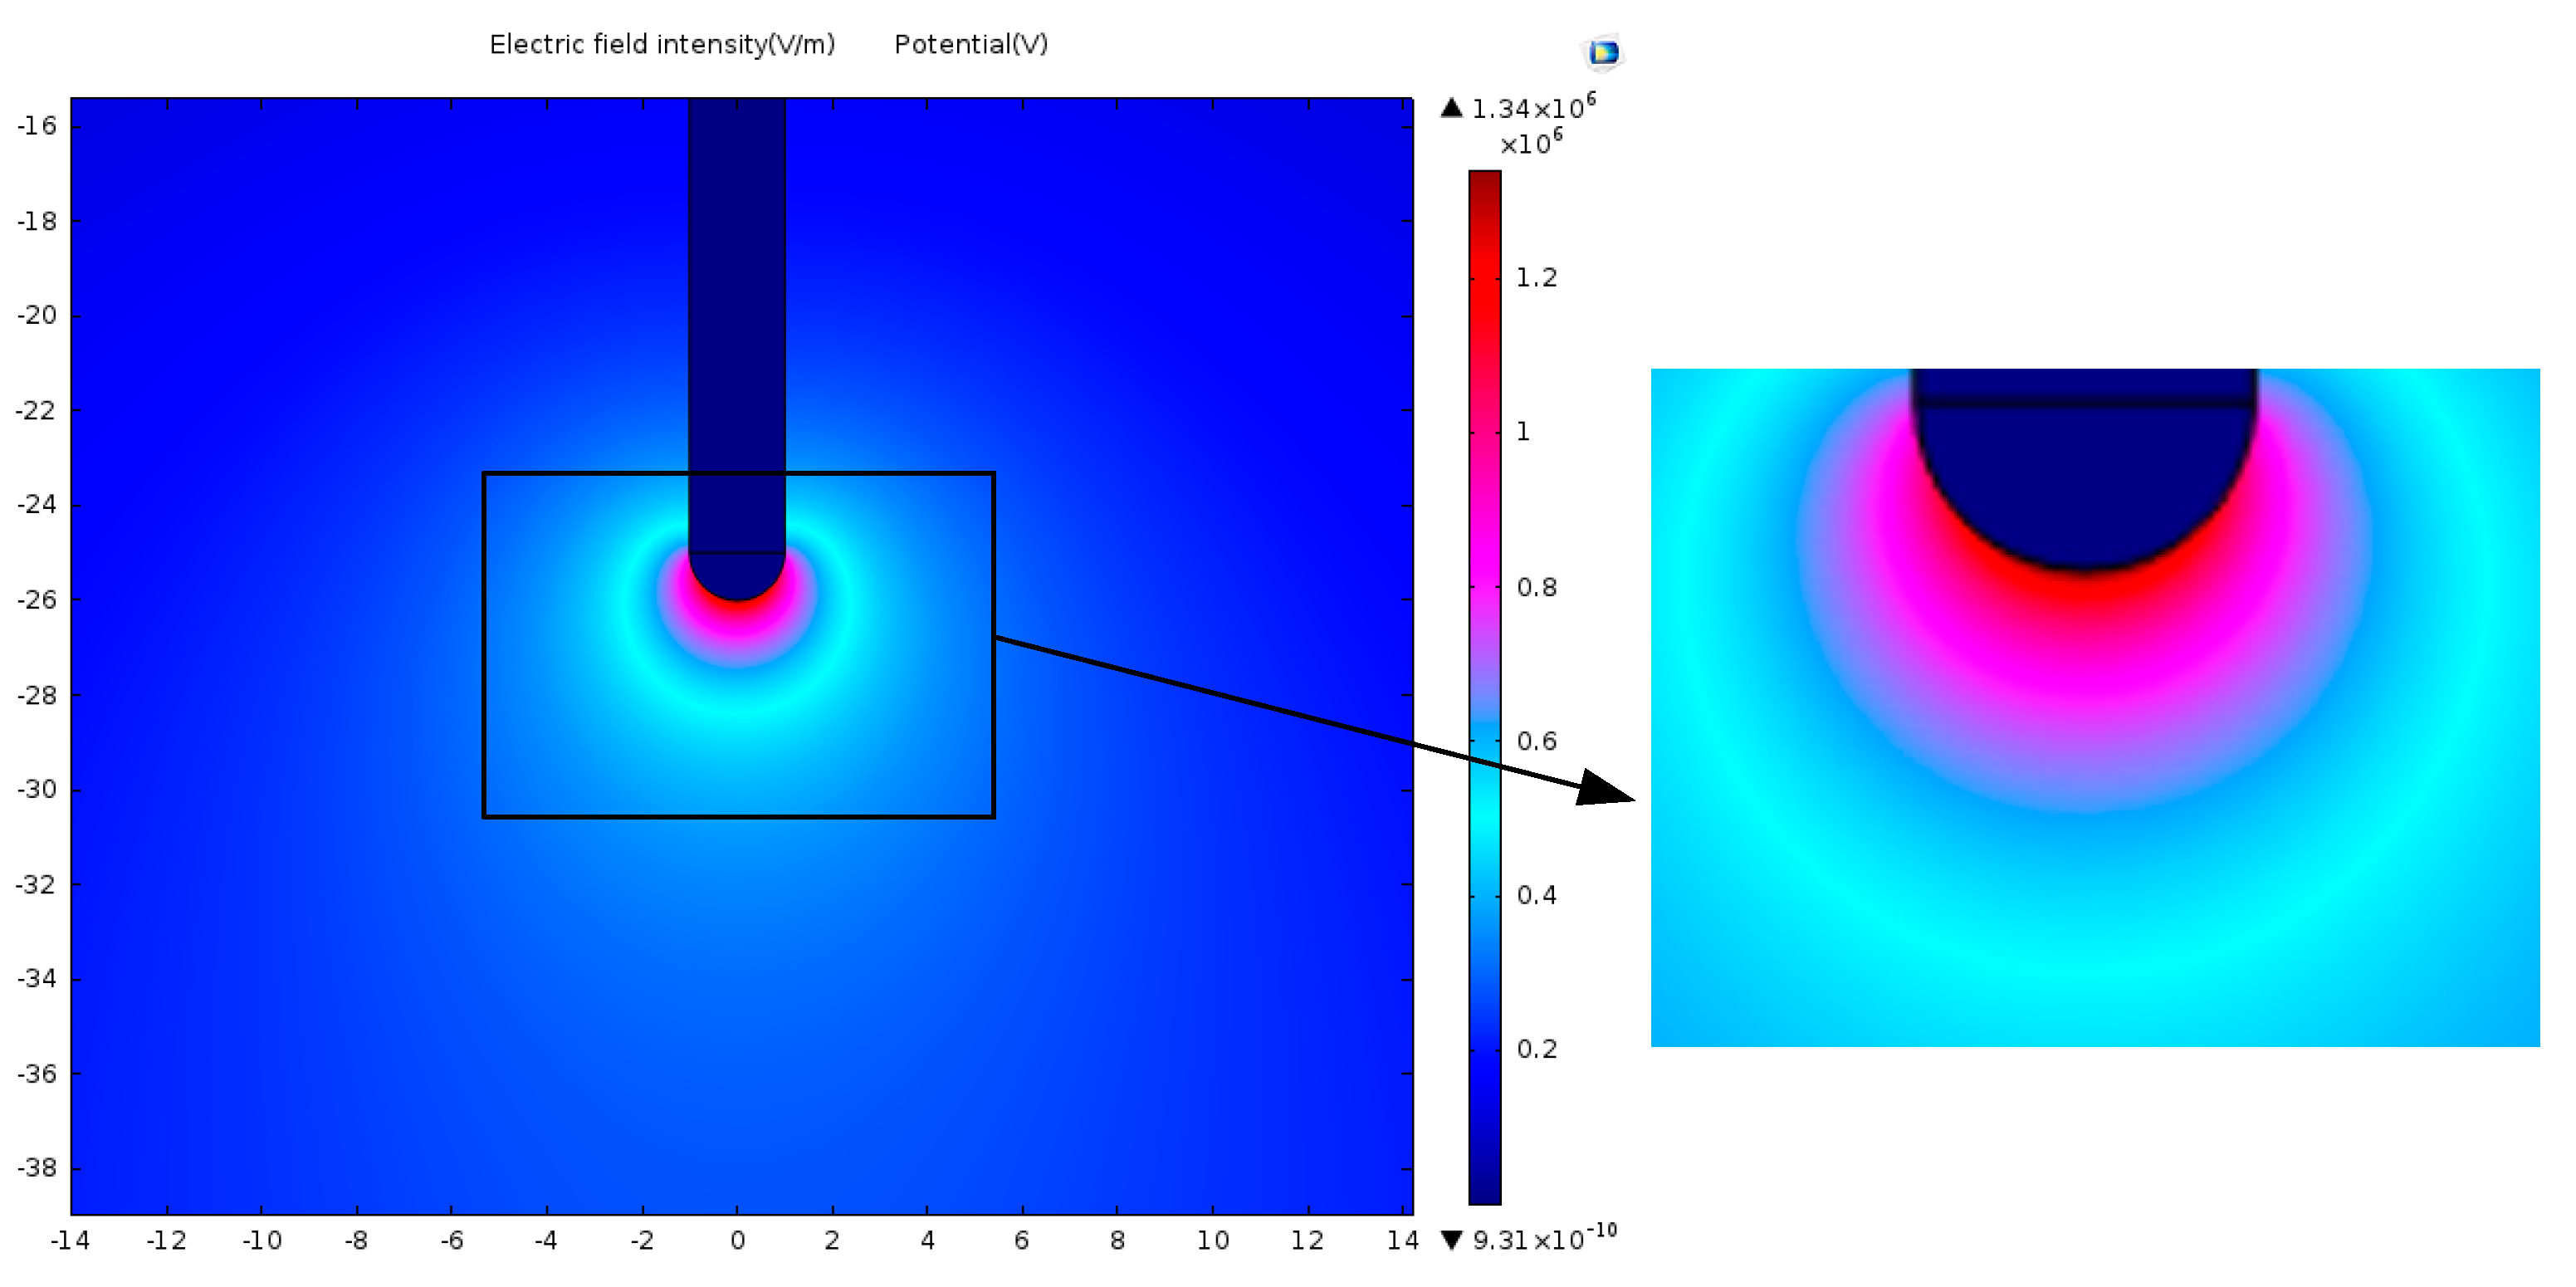
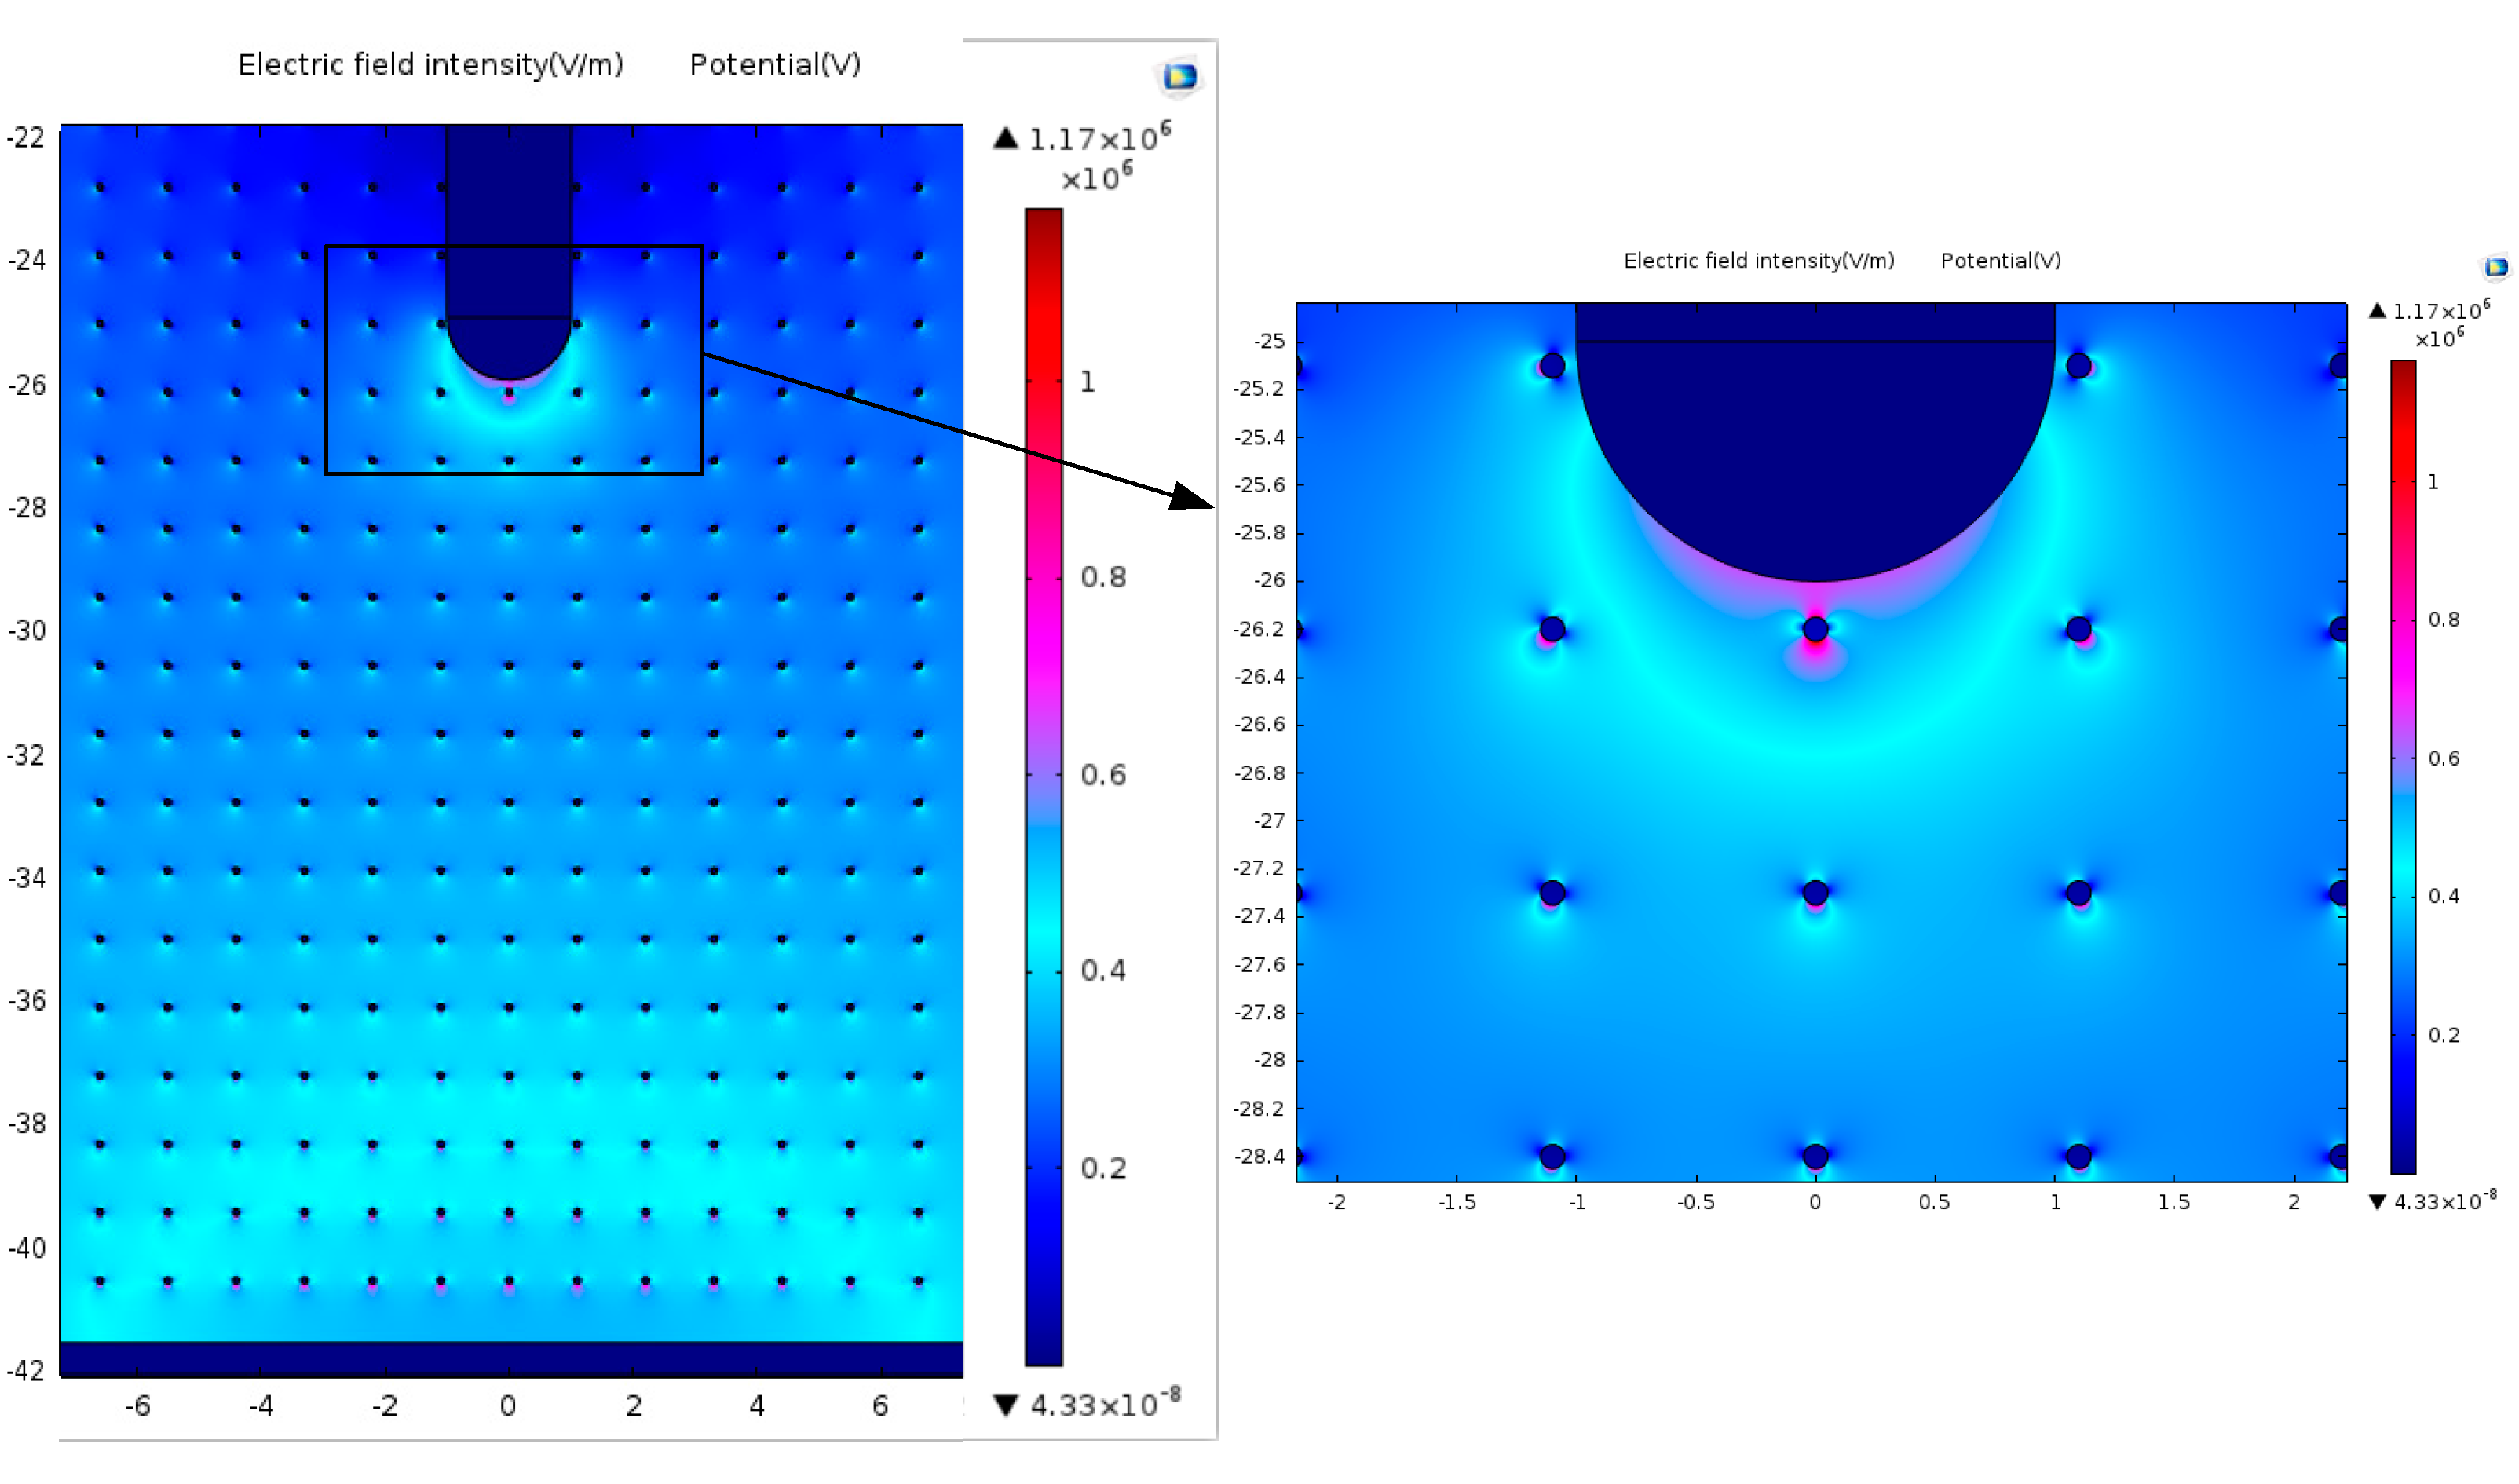
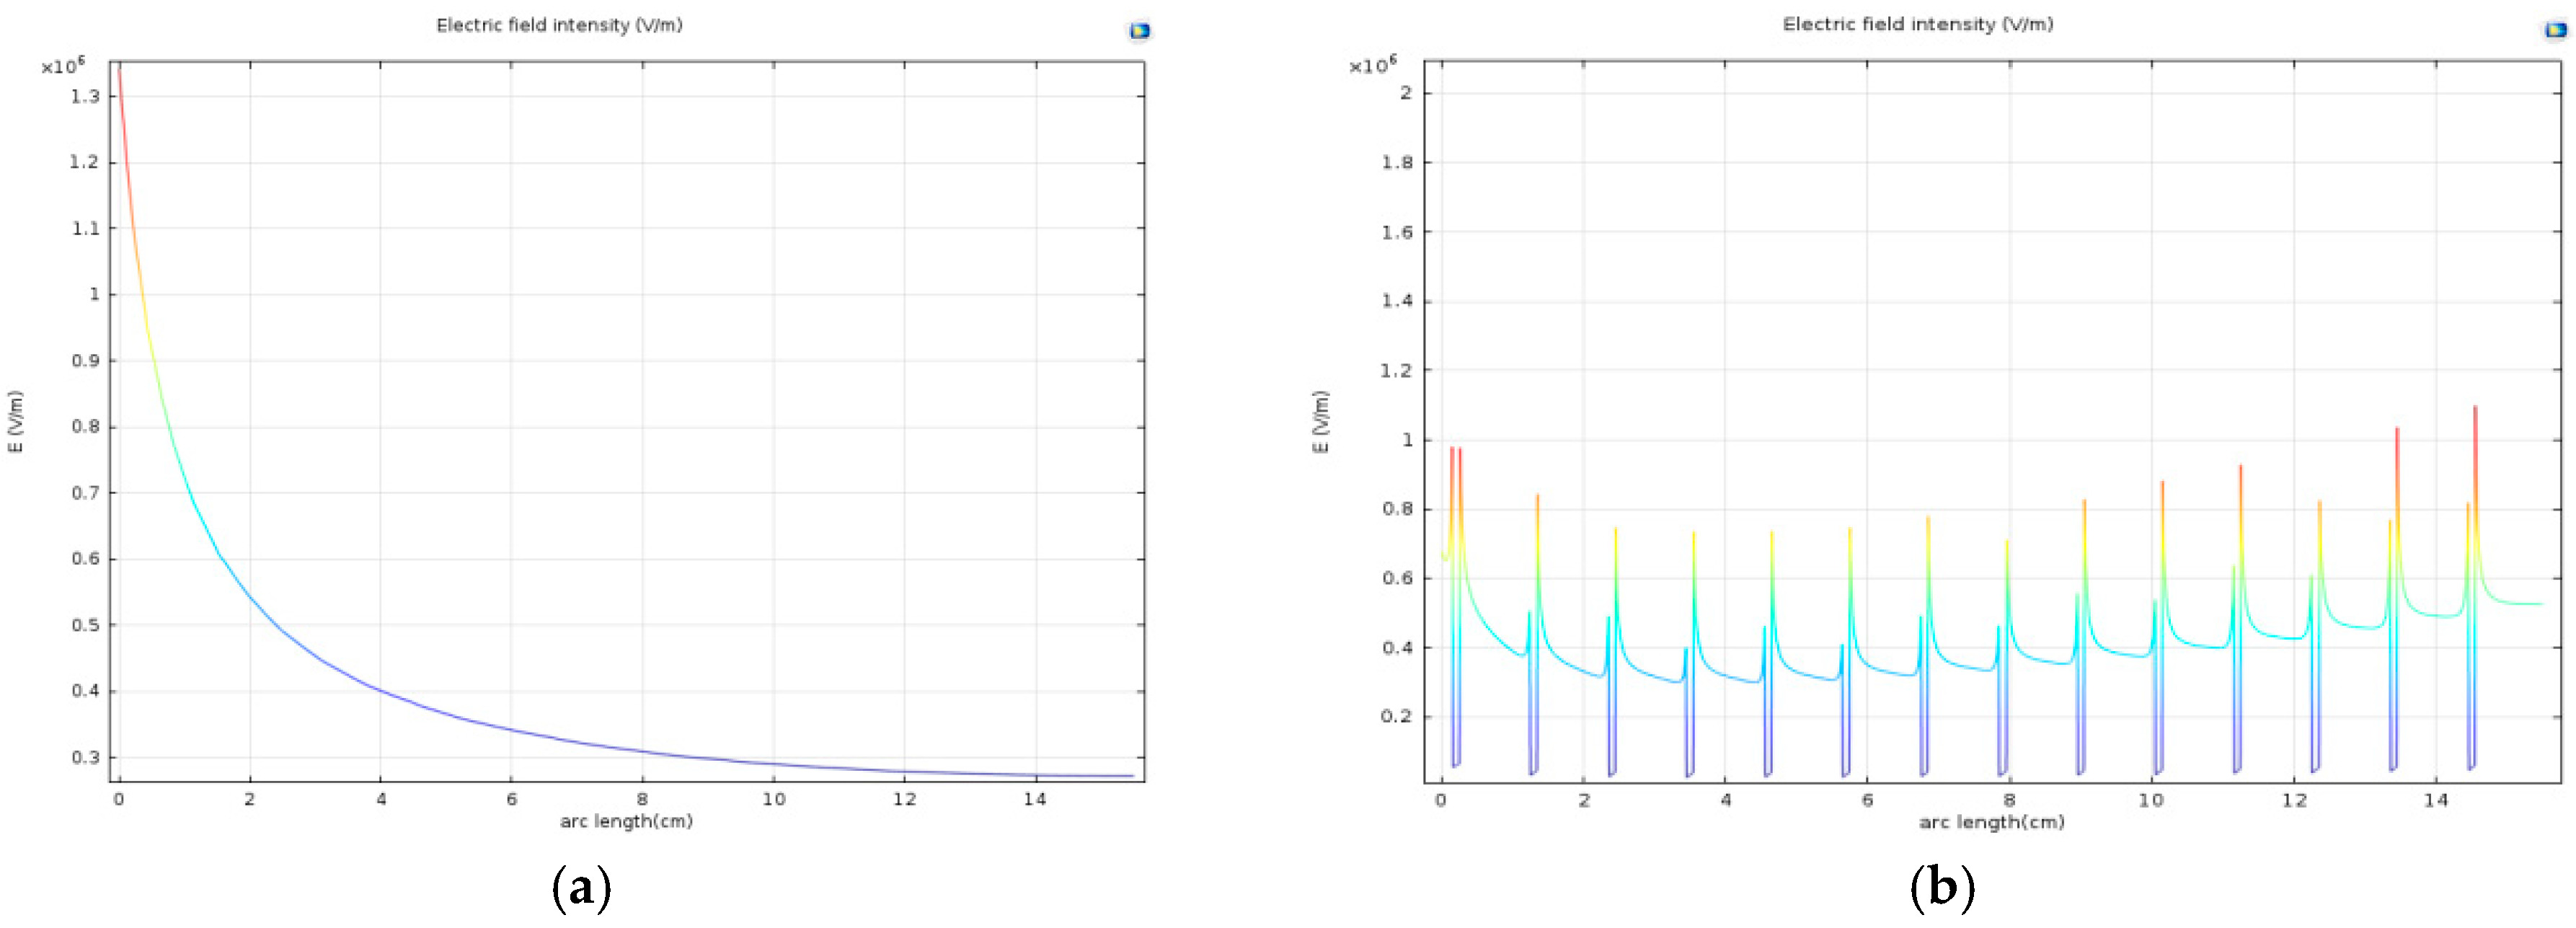
4.2. Simulation Results and Theoretical Analysis

The frequency of alternating current voltage is very low (50 Hz), and the maximum size of the test circuit is less than one tenth of the wavelength of the AC voltage, so the lumped parameter method can be used in simulations, and the effect of applying direct current (DC) voltage and AC voltage in the simulation is the same. The potential at the top of the rod electrode is set to 20, 40 and 60 kV (DC voltage), respectively, corresponding to a 5, 10 and 15 cm air gap, and the upper surface of the plane electrode was grounded. The following simulation figure is illustrated by taking the 15 cm gap model as an example. The calculation results of the spatial electric field distribution under dry condition and salt fog condition are shown in Figure 6 and Figure 7.
As can be seen from figures, the space electric fields are severely distorted by the droplets in the salt fog. In order to facilitate the quantitative analysis, the distribution curve of the electric field intensity on the axis between the rod and plane is extracted, as shown in Figure 8 and Figure 9.
Figure 10 and Table 4 show that the space electric field is severely distorted by the droplets. On the one hand, the electric field intensity jumps on the surface of each droplet, and on the other hand, the electric field intensity drops sharply inside the droplet.
At the same time, the droplets have an adsorption effect on the free electrons in the space, so the maximum value of electric field intensity on the axis is reduced relative to that of the dry condition, and the reduction range is between 16% and 20%. With the increase of gap distance, the degree of the effect of salt fog on electric field intensity is reduced.
Due to the close distance from the rod electrode, a large amount of electrons are absorbed by the rod electrode, causing the positive water molecules to gather near the rod electrode, and the electric field intensity is greatly weakened near the rod electrode, and the starting voltage of the streamer is increased [11,12].
With the increase of voltage, an initial electron avalanche occurs near the rod electrode, and a large amount of positive charge is accumulated at the avalanche head; because of the large surface area of the droplets, droplets are easily struck by photons to cause photoionization, while cationic clusters and free electrons are generated [13]. With the development of space photoionisation, the electron avalanche continues towards the plane electrode. When the free electrons move towards the rod electrode, free electrons easily collide with the positive water molecules to form neutral water molecules, resulting in a decrease in free electrons and hindering the development of streamer. Therefore, corona inception voltage is higher in presence of fog, because around the tip of high voltage electrode electrical field intensity is decreased and free electrons are decreased. It hinders the development of discharge in the air gap to a certain extent [14,15]. With the increasing of corona inception voltage the discharge voltage is higher in presence of fog.
In further research, the conductivity parameter of the droplets in the model are set to 1000, 2750 and 4000 μS/cm, respectively, and the distribution curve of the electric field intensity on the axis between the rod and plane is shown in Figure 9.
It can be seen from Figure 11 and Table 5 that the electric field intensity on the axis increases in various degrees, as the conductivity of the salt fog increases from 18 μS/cm to 4000 μS/cm. For the three gap distances of 5, 10 and 15 cm, the maximum electric field intensity values are increased by 8.62%, 8.08% and 4.90%, as the conductivity increases from 18 μS/cm to 4000 μS/cm. This shows that the electric field intensity is improved with the increase of the conductivity, but the effect is within 10%. At the same time, the influence trend of the conductivity on the electric field intensity is saturated with the increase of the conductivity. Because the number of ions in the unit space gradually becomes saturated with the increase of the conductivity, the effect of the conductivity on the development of the discharge in the air gap is gradually saturated.
In conclusion, under the superimposed influence of the droplets of salt fog and its conductivity, the space electric field of the rod-plane short air gap is distorted, significantly weakening the electric field intensity near the rod electrode, and slightly strengthening that near the plane electrode. Therefore, compared with the dry conditions, the AC discharge voltage of the short air gap under the salt fog conditions is improved. The experimental results are in good agreement with the simulated ones, which has important guiding significance and reference value for how to strengthen the external insulation strength of UHV transmission line and electrical equipment in smog environments.

5. Conclusions

Comparing the previous already published results, the AC discharge voltage increases by 5.1% under clean fog conditions. As the fog-water conductivity increases from 100 to 5150 μS/cm, the AC discharge voltage of 5–15 cm air gap decreases by 2.7–9.1%. Some simulation results show that with the increase of the fog water content, the droplets on the surface of electrode end can lead to serious distortion of the spatial distribution of surface electric field [13,14,15,16]. In this paper, more in-depth and meticulous research is conducted, and the results are as follows:
(1)
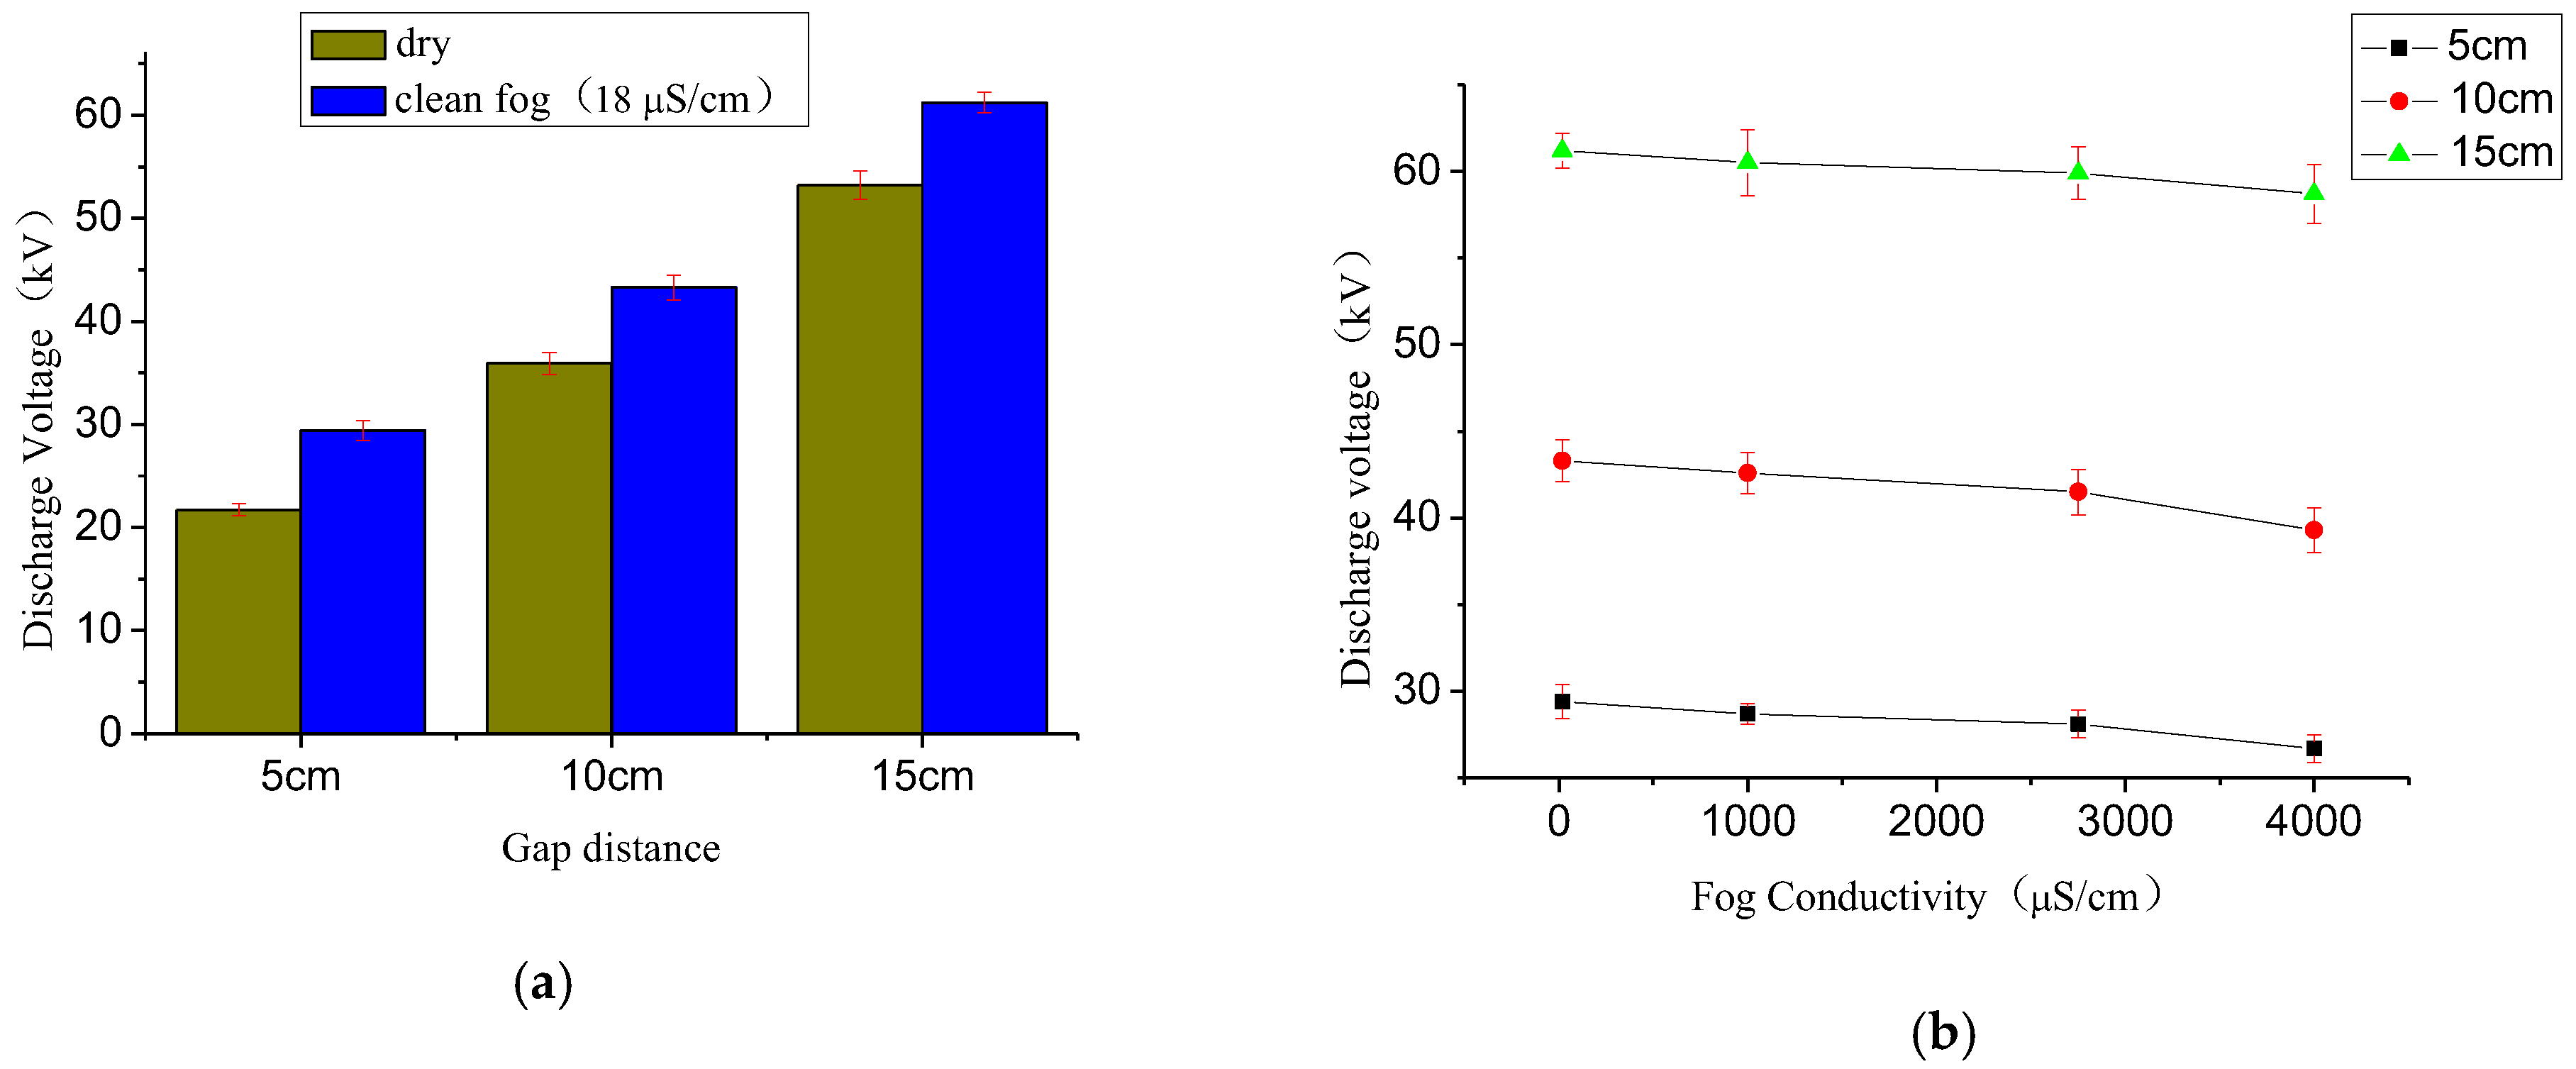
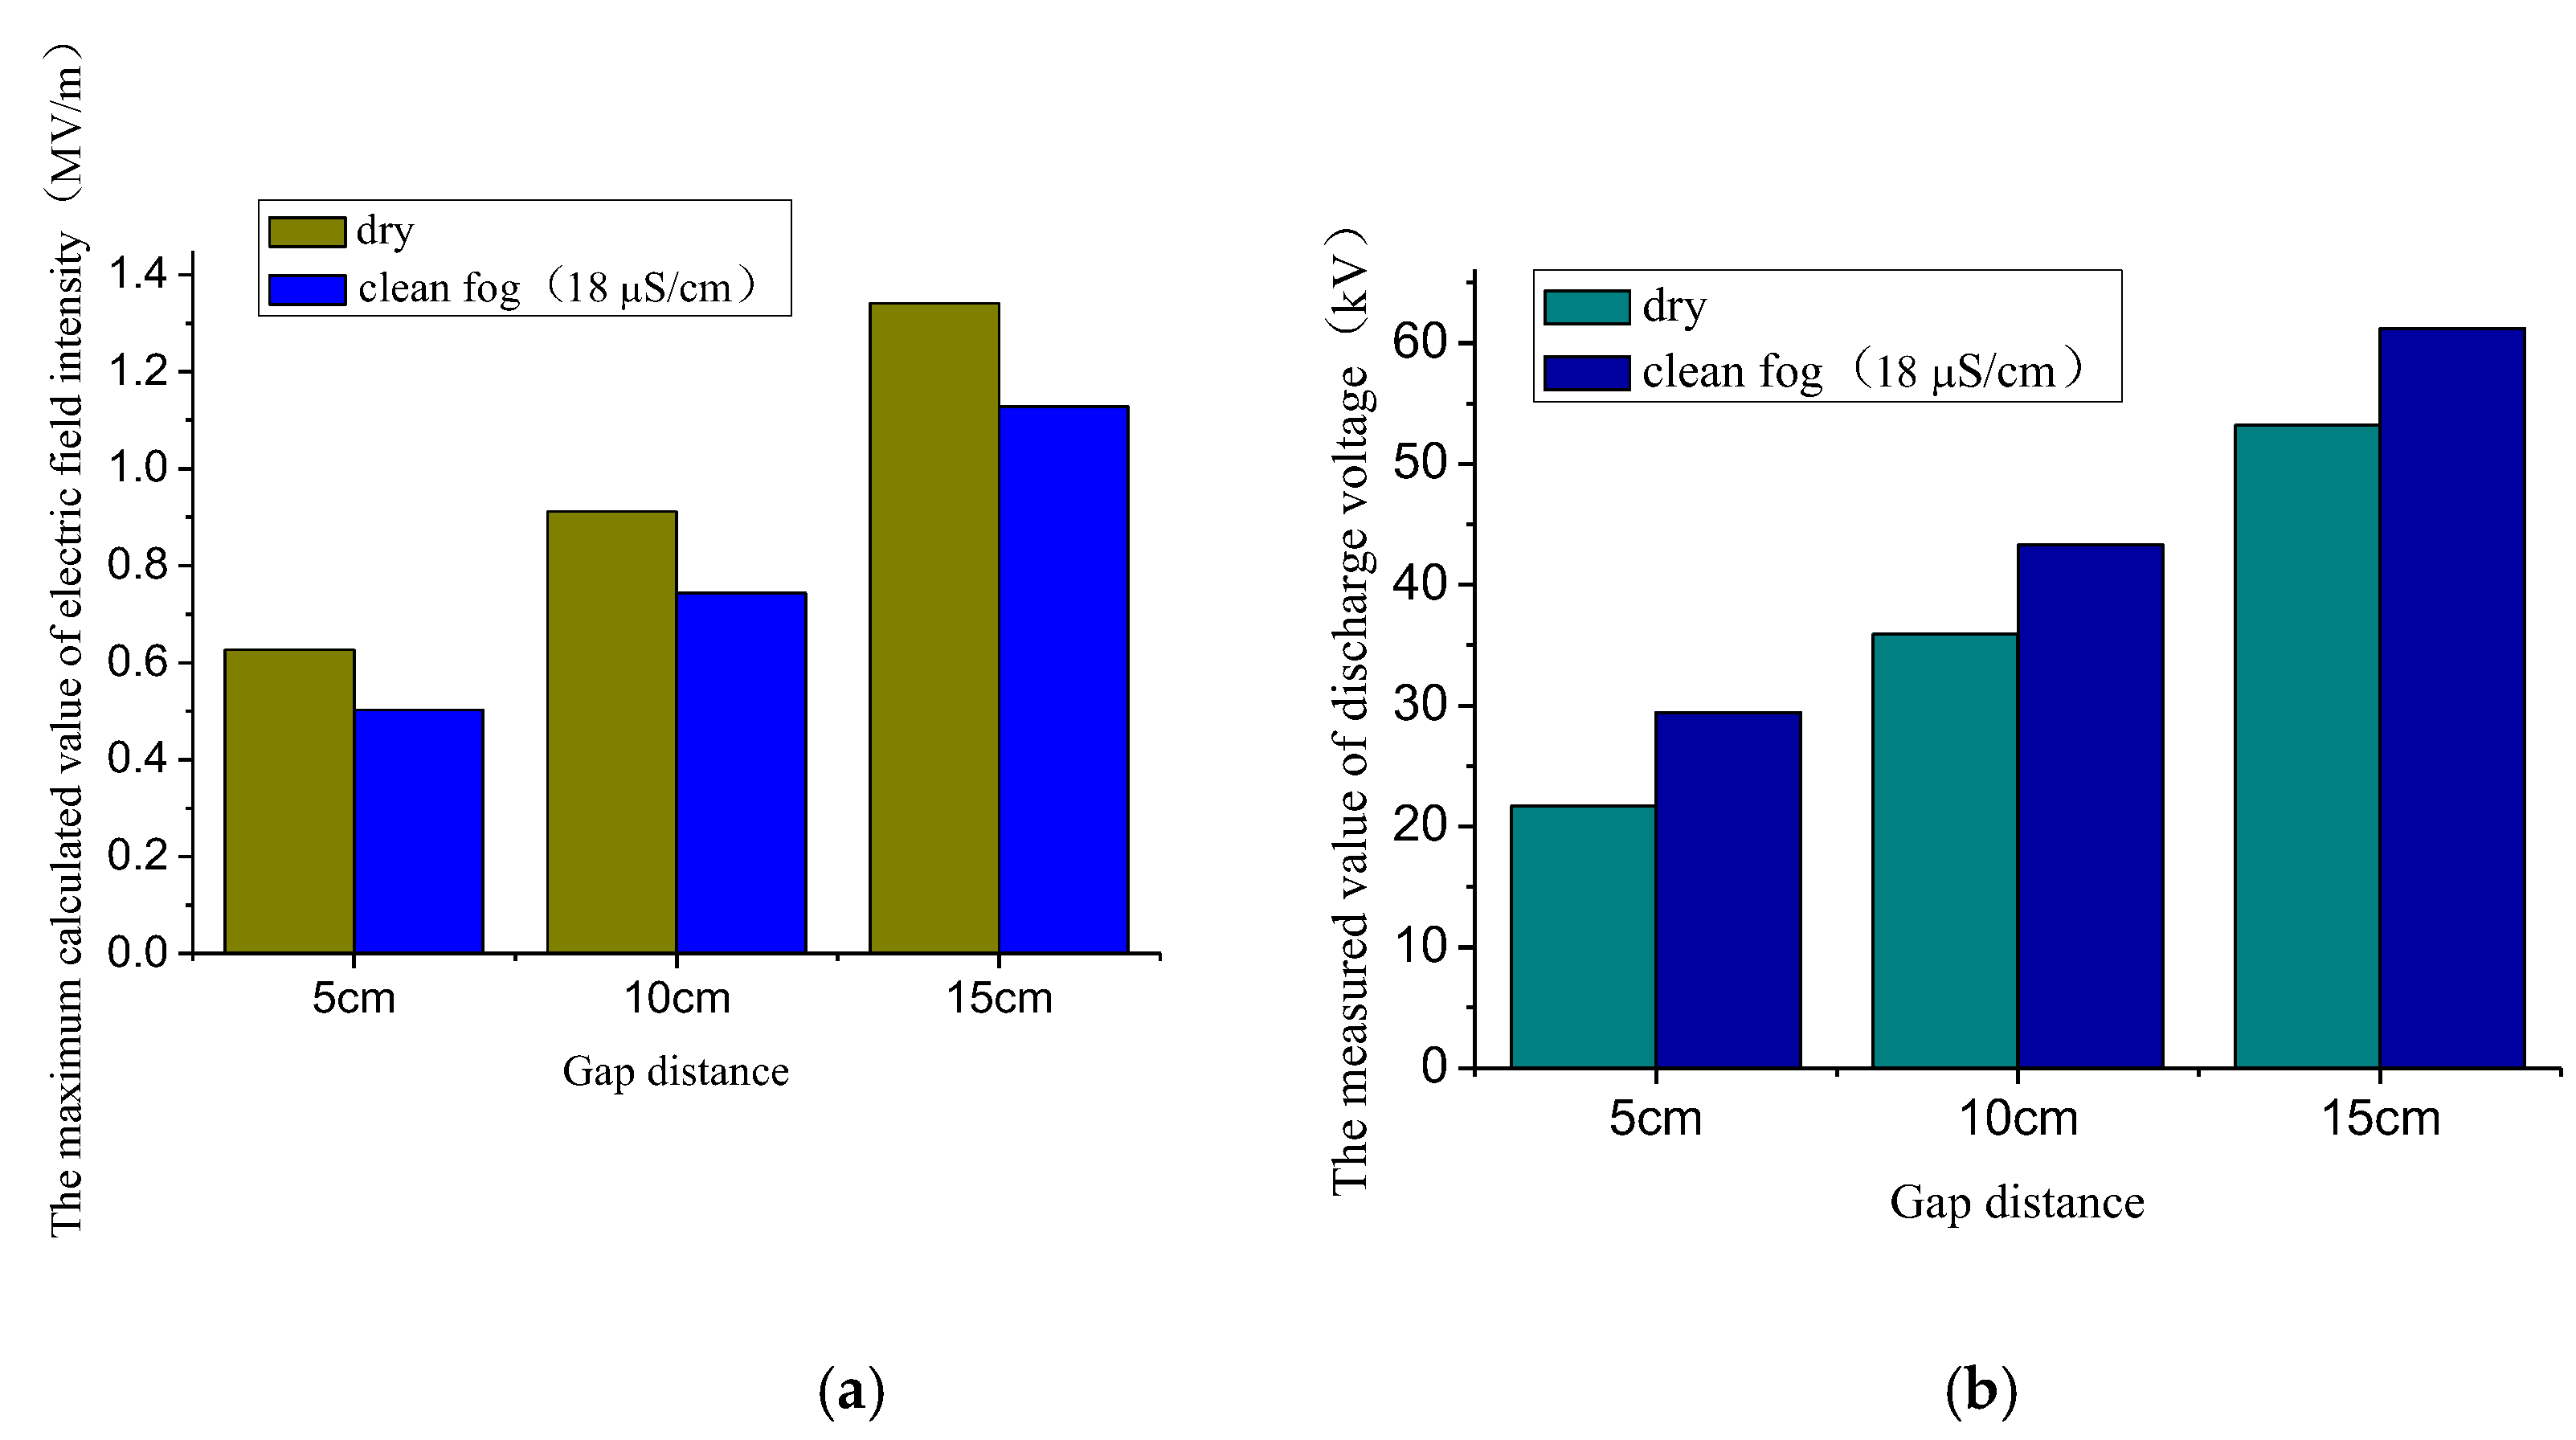
Under AC voltage, corresponding to different gap distances the discharge voltage of the clean fog (18 μS/cm) condition is 15.1% to 35.5% higher than that of dry conditions, and the influence trend decreases with the increase of the gap distance.
(2)
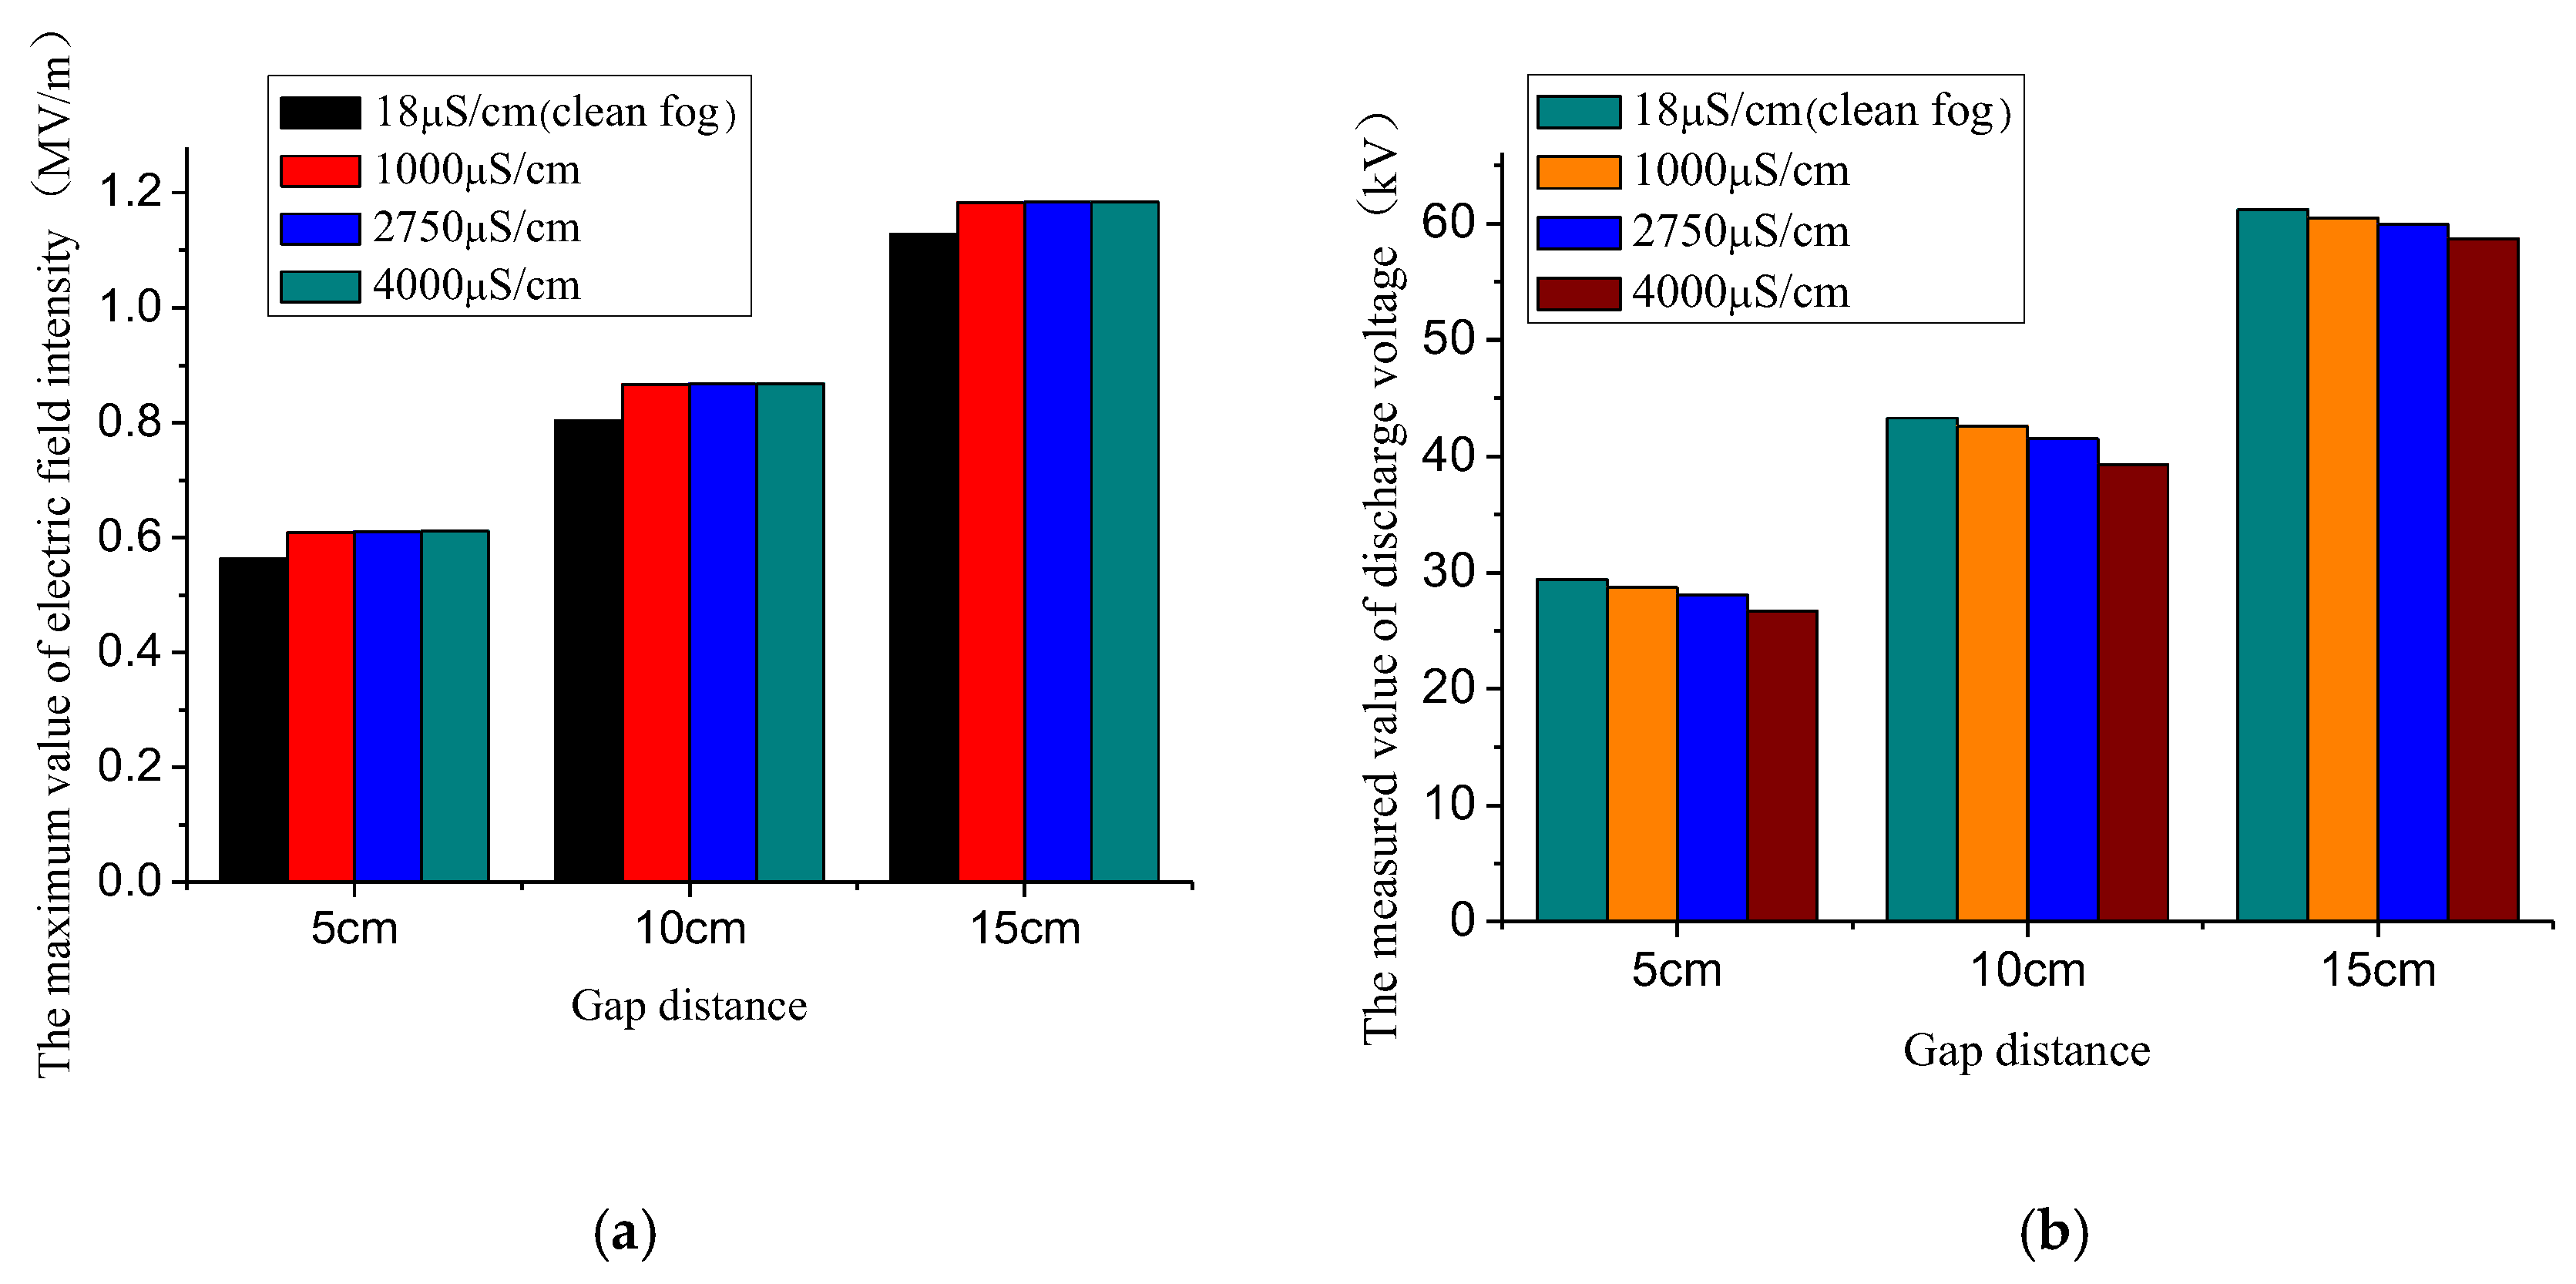
With the increase of the conductivity of salt fog, the AC discharge voltage is 4.1% to 9.2% lower than that of clean fog conditions, and the influence trend of the conductivity on the AC discharge voltage is saturated with the increase of the conductivity.
(3)
As the simulation shows, the space electric field is seriously distorted by the salt fog. Due to the adsorption of free electrons by droplets in salt fog, the maximum value of electric field intensity on the axis between rod and plane under clean fog condition is 15.87% to 19.81% lower than that under dry conditions.
(4)
The simulation results show that the electric field intensity in air gap increases with the increase of the conductivity corresponding to different gap distances. As the conductivity of salt fog increases from 18 to 4000 μS/cm, the maximum value of the electric field intensity on the axis increased from 4.90% to 8.62%.

Author Contributions

Conceptualization, Y.L. and F.L.; Methodology, Y.L.; Software, Z.Z.; Validation, J.G., S.J. and Z.Z.; Formal Analysis, Z.Z.; Investigation, Z.Z.; Resources, Y.L.; Data Curation, J.G.; Writing—Original Draft Preparation, S.J.; Writing—Review & Editing, S.J.; Visualization, S.J.; Supervision, J.G.; Project Administration, Y.L.; Funding Acquisition, Y.L.

Acknowledgments

This work is supported by “State Grid Corporation’s Science and Technology Project (5228001600DV)”, and “the Fundamental Research Funds for the Central Universities (2017MS105)”.

Conflicts of Interest

The authors declare no conflict of interest.

References

  1. Niu, H.; Zhuang, X.; Yi, Z.; Liu, Y.; Zhang, G. Meteorological Condition of Dramatic Decline of Air Gap Breakdown Voltage. High Volt. Eng. 2014, 40, 3343–3348. [Google Scholar]
  2. Kang, J.; Li, P.; Wang, S.; Tan, F.; Qu, Q.; He, Z. Influence of Salt Spray on AC/DC Breakdown Voltage of Rod-plane Gap. High Volt. Eng. 2015, 41, 1989–1994. [Google Scholar]
  3. Su, Z. Influences of Fog-Haze on External Insulation of Transmission and Distribution Equipments. Power Syst. Technol. 2013, 8, 2284–2290. [Google Scholar]
  4. Fuang, S.; Li, M.; Zhang, X.; Zhang, G. Overvoltage Calculation and Selection of Switching Impulse Minimum Air Gap for 500 kV Double-Circuit Transmission Line on Same Tower. Insul. Surge Arrest. 2016, 2, 106–110. [Google Scholar]
  5. Vasudev, N.; Ravi, K.N.; Mujumdar, A.K. Breakdown characteristics of rod-plane gap under salt fog for AC and DC voltages. In Proceedings of the Annual Conference on Electrical Insulation and Dielectric Phenomena, Pocono Manor, PA, USA, 28–31 October 1990; pp. 581–586. [Google Scholar]
  6. Electrical Insulation and Dielectric Phenomena. Available online: https://ieeedeis.org/event/conference-on-electrical-insulation-and-dielectric-phenomena/ (accessed on 17 August 2018).
  7. Mei, Z. The Effeets of various atmospheriec conditions on the breakdown vollages of Rod-Plane air gap. High Volt. Eng. 1990, 1, 39–44. [Google Scholar]
  8. Deng, H.; Hackam, R.; Chang, R.J. Effects of fog salinity, air pressure and water flow rate on ac flashover of iron-rod short air gaps. In Proceedings of the Electrical Insulation and Dielectric Phenomena, Virginia Beach, VA, USA, 22–25 October 1995; pp. 145–148. [Google Scholar]
  9. High-Voltage Test Techniques—Part 1: General Definitions and Test Requirements. Available online: https://global.ihs.com/doc_detail.cfm?&csf=TIA&document_name=IEC%2060060-1&item_s_key=00035813&item_key_date=890331 (accessed on 17 August 2018).
  10. Li, Z. Fog research in China in recent 40 years. ACTA Meteorol. Sin. 2001, 5, 616–624. [Google Scholar]
  11. Masayuki, S. High-efficiency Sterilizer by High-voltage Pulse using Concentrated-Field Electrode System. IEEE Trans. Ind. Apply 2001, 37, 1646–1650. [Google Scholar]
  12. Ye, Q. Study on Mixed Two-Phase Discharge and Its Application in Water Treatment. Ph.D. Thesis, Huazhong University of Science and Technology, Wuhan, China, January 2001. [Google Scholar]
  13. Yang, C. Theoretical and Experimental Study on the Phenomena/Mechanism of Discharge in Air-Water Two-Phase Mixture. Ph.D. Thesis, Huazhong University of Science and Technology, Wuhan China, October 2005. [Google Scholar]
  14. Hu, J. Research on Discharge Characteristics and Mechanism of Rod-Plane Short Air Gaps in Natural Fog. Ph.D. Thesis, Chongqing University, Chongqing, China, May 2013. [Google Scholar]
  15. Sunka, P.; Babicky, V.; Clupek, M.; Lukes, P.; Simek, M.; Schmidt, J.; Cernák, M. Generation of Chemically Active Species by Electrical Discharges in Water. Plasma Sources Technol. 1999, 8, 258–265. [Google Scholar] [CrossRef]
  16. Dong, B. Study on Effect of Fog on Discharge Performance of Short Air Gaps and Insulators. Ph.D. Thesis, Chongqing University, Chongqing, China, May 2014. [Google Scholar]
Figure 1. Test layout (a) and YDJ-350 AC test transformer (b).
Energies 11 02251 g001
Figure 2. Artificial climate chamber appearance.
Energies 11 02251 g002
Figure 3. Rod-plane short air gap model layout.
Energies 11 02251 g003
Figure 4. Comparison of discharge voltage under different environmental conditions: (a) dry and clean fog conditions; (b) salt fog conditions (18–4000 μS/cm).
Energies 11 02251 g004
Figure 5. Finite element analysis of rod-plane gap model: (a) schematic of the model; (b) finite element splitting diagram.
Energies 11 02251 g005
Figure 6. Gap electric field intensity distribution under dry condition.
Energies 11 02251 g006
Figure 7. Gap electric field intensity distribution under salt fog condition.
Energies 11 02251 g007
Figure 8. Distribution curve of electric field intensity on the gap axis under dry (a) and clean fog (b) (18 μS/cm) condition.
Energies 11 02251 g008
Figure 9. Distribution curve of electric field intensity on the gap axis under salt fog with different conductivity condition. (a) 1000 μS/cm; (b) 2750 μS/cm; (c) 4000 μS/cm.
Energies 11 02251 g009aEnergies 11 02251 g009b
Figure 10. Comparison of the maximum value of electric field intensity and discharge voltage under dry and clean fog (18 μS/cm) condition: (a) comparison of the maximum value of electric field intensity; (b) comparison of the measured value of discharge voltage.
Energies 11 02251 g010
Figure 11. Comparison of the maximum value of electric field intensity and discharge voltage under salt fog conditions with different conductivity values: (a) comparison of the maximum value of electric field intensity; (b) comparison of the measured value of discharge voltage.
Energies 11 02251 g011
Table 1. Discharge voltage at different gap distances under salt fog condition.
Voltage TypeGap Distance Discharge Voltage (kV)
Dry The Conductivity of Fog
18 μS/cm (Clean Fog)1000 (μS/cm)2750 (μS/cm)4000 (μS/cm)
AC voltage5 cm21.729.428.728.126.7
10 cm35.943.342.641.539.3
15 cm53.261.260.559.958.7
Table 2. Confidence intervals of the AC discharge voltages (kV).
Gap
Distance
Dry18 mS/cm
(Clean Fog)
1000 μS/cm2750 μS/cm4000 μS/cm
5 cm(21.1, 22.3)(28.4, 30.4)(28.1, 29.3)(27.3, 28.9)(25.9, 27.5)
10 cm(34.8, 37.0)(42.1, 44.5)(41.4, 43.8)(40.2, 42.8)(38.0, 40.6)
15 cm(51.8, 54.6)(60.2, 62.2)(58.6, 62.4)(58.4, 61.4)(57.0, 60.4)
Table 3. Material parameters.
MaterialAluminum (Rod Electrode)Iron (Plane Electrode)Air (Air Domain)Water (Fog Drop)
Relative permittivity11181
Conductivity (μS/cm) 3.774 × 1031.12 × 10310−101.8 × 10⁻⁷
Table 4. The maximum value of electric field intensity on the gap axis under dry and clean fog (18 μS/cm) condition.
Gap DistanceThe Maximum Value of Electric Field Intensity E D E C E D   ( % )
Dry (ED)Clean Fog (EC)
5 cm0.6271 MV/m0.5029 MV/m19.81%
10 cm0.9124 MV/m0.7433 M/m18.53%
15 cm1.3414 MV/m1.1285 MV/m15.87%
Table 5. The maximum value of electric field intensity under salt fog with different conductivity condition.
Gap DistanceThe Maximum Value of Electric Field Intensity
Clean Fog (18 μS/cm)1000 μS/cm2750 μS/cm4000 μS/cm
5 cm0.5629 MV/m0.6089 MV/m0.6106 MV/m0.6114 MV/m
10 cm0.8033 MV/m0.8667 MV/m0.8678 MV/m0.8682 MV/m
15 cm1.1285 MV/m1.1830 MV/m1.1837 MV/m1.1838 MV/m

