Voltage Stability of Low-Voltage Distribution Grid with High Penetration of Photovoltaic Power Units


1
Department of Electrical and Robotic Engineering, Shahrood University of Technology, Shahrood 3619995161, Iran
2
Department of Energy Technology, Aalborg University, 6700 Esbjerg, Denmark
*
Author to whom correspondence should be addressed.
Energies 2018, 11(8), 1960; https://doi.org/10.3390/en11081960
Submission received: 28 June 2018
/
Revised: 23 July 2018
/
Accepted: 26 July 2018
/
Published: 27 July 2018
(This article belongs to the Special Issue Integration of PV in Distribution Networks)
Abstract
:Voltage stability analysis of power distribution systems with high photovoltaic (PV) penetration is a challenging problem due to the stochastic generation of a solar power system. Voltage stability is an important benchmark for defining PV’s penetration level in active distribution networks considering loading capacity. The massive integration of PV power units, the effect of distribution system characteristics, like high ratio of R/X, and the reported collapses in power networks come up in serious studies that investigate their impact and upcoming problems on distribution networks. Therefore, this paper proposes analytical voltage stability and it is implemented on IEEE 34 nodes radial distribution systems with 24.9 kV and 4.16 kV voltage levels. In this regard, in addition to given properties in stability and power loss analysis, a penetration coefficient for PVs is considered. Simulation results prove that the applied method can illustrate the positive and negative effects of PV in distribution networks.
1. Introduction
Since existing synchronous generators are decreasing their power production with the increased penetration of photovoltaic (PV) generation at distribution systems, the impact on their voltage stability has become non-negligible and more analysis is needed [1,2]. Reviewing research literature shows that they have focused on the impact of solar–PV generation on short- and long-term voltage stability [3,4]. Developing studies conduct an investigation into the effect of these systems on power distribution systems [5,6]. For instance, the impact of the dynamic behavior of photovoltaic (PV) power generation systems on short-term voltage stability of the transmission system has been investigated in Reference [5] and it has been suggested in Reference [6], high PV penetration can influence the voltage profile depending on loading conditions and amount of PV penetration. The obtained results illustrate that the available control equipment does not have the potential of compensating the transient effects of the PV system, such as the effects of clouds [7]. Therefore, in recent years many studies have proposed advanced control strategies for grid-connected distributed energy resources which have been implemented on power electronic converters. Hence, the stability analysis and control techniques for voltage source converters like modular multilevel converter, as in References [8,9], and active power control strategy with high penetration of distributed generation units into power grids, as in References [10,11], have been introduced. A proportional resonant-based control technique for interfaced power electronic converters, enhancing the stable operation of the power grid is proposed in [10]. The main purpose in [11] is developing a control strategy for shunt active filter which stable operating region for the interfaced converter during the integration time with the utility grid.
Moreover, injection of reactive power-by-power inverters through a decentralized controller in order to contribute to voltage regulation in distribution networks has been proposed, as in Reference [12]. Furthermore, the regulation of an on-load tap changer (OLTC) and capacitor-switching have been done in order to study voltage stability in distributed systems [13]. Therefore, it is obtained from the mentioned literatures that, in order to optimize the network voltage profile, it is vital to manage the reactive power supplied by PV inverters and perform voltage regulation in distribution grids [14]. Utilizing higher amounts of PV generation units reduces distribution system inertia. Study outcomes, as in Reference [15], show that over 20% PV penetration may cause voltage fluctuation problems. These concerns have initiated operations in countries such as Germany to employ distributed generation (DG) contribution to voltage regulation. Low-voltage distribution grids have special characteristics, for example unbalanced nature, line drop compensation (LDC) devices, small-size PVs, and dynamic loads [16]. The cables interconnecting the buses often have higher ratios between their conductance and susceptance, G/B, than those found in transmission networks. A consequence of this higher ratio is that dynamics governing voltage and phase are more highly coupled, thereby making it more difficult to guarantee voltage stability. For this purpose, other studies have been concentrated on power distribution system analysis with penetration of distributed generation. In [17], the impact of DGs on the voltage profile and power losses of distribution systems is established in detail. A decision-making algorithm that has been expanded for the optimal sizing and placement of DGs in distribution systems is offered by [18]. It improves the voltage profile and reduces the total power losses. The proposed algorithm has been tested on the IEEE 33-bus radial distribution system. In addition to DG sitting; the review of recent studies also presents that there is a significant amount of research work available from the perspective of different topology in distribution system. A potential study has been discussed in Reference [19], which essentially concentrates on upgrading the radial topology into different types of loops and is reinforced by a lot of potential analysis. In the same way, a multi-stage planning mechanism based on sensitivity approach and a non-dominated sorting genetic algorithm II (NSGA-II) is suggested in in Reference [20] to determine the optimal DG sitting and sizing in distribution systems. In all discussed literatures, the physical and technical characteristics of DG units have not been considered and the impact of daily production characteristics of PV unit has not been addressed in detail.
In other hand, steady and reliable performance in a large-scale transmission system does not necessarily mean the same performance can be achieved in a geographically small distribution system, as the local network can lose almost all PV power support in the area due to cloud coverage within a short period [21]. Such a system is important and needs to be examined thoroughly, but currently few detailed literatures are available on this issue.
The main theme in all these studies is the fact that high PV penetration levels can affect the steady-state voltage magnitudes at low-voltage distribution levels; therefore, more investigations may be required for potential voltage-stability analysis of high PV penetration in a geographically small grid due to fast PV power swings. For instance, voltage swing in a distribution grid caused by cloud transients was described in Reference [22]. It obtained that voltage fluctuation might be a problem when PV penetration exceeds 20%. However, no detailed analyses were presented.
Therefore, following the same aim in this paper, analytical voltage stability is introduced for typical distribution grids. The PV penetration level of a node is defined as the ratio of the installed PV power on the available node to the load power of the node. In this regard, in addition to given properties in voltage stability and power loss analysis, a penetration coefficient for PVs is considered. Finally, a stability criterion is defined for the weakest lines connected to the critical nodes in order to identify stability boundaries of each node. Although most of the previous research has concentrated on reactive power injection from the PV’s inverter, in all analysis, the contribution of active power production of PV units is investigated on the problem of voltage stability.
Moreover, the effect of daily power generation on the voltage stability criterion for each node is considered. Compared to previous studies, this paper presents a comprehensive solution for distribution operators to see the effect of PV penetration on the voltage stability of each node and gives a road map for the future installation of PV units.
The paper is organized as follow: In Section 2, the voltage stability analysis of distribution systems by using V-P and Loading capability curves is explained. An algorithm is proposed for obtaining the V-P Curve in a specific node that confirms and validates the result of the voltage stability criterion. In Section 3, the drawn V-P curves in the presence of PV power generation systems are presented. The effect of existent PV on voltage stability of distribution systems is illustrated by doing a simulation study in Section 4. Finally, comprehensive conclusions are given in Section 5.
2. Voltage Stability Analysis of Distribution Power Systems
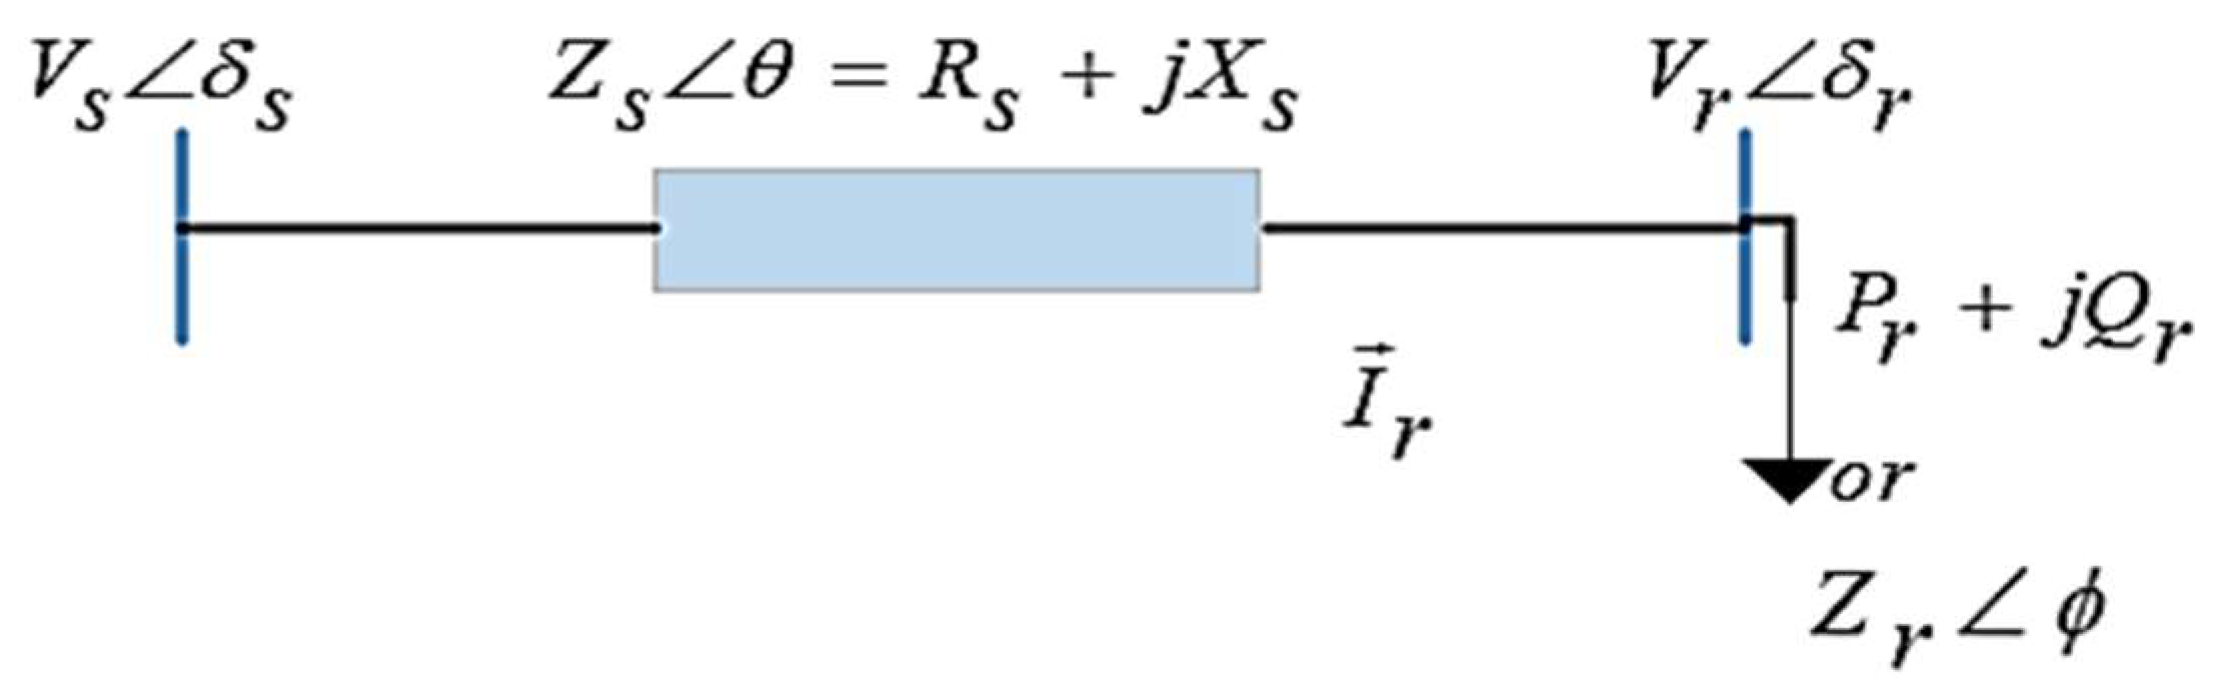
Voltage stability is the ability to maintain voltage on acceptable levels. In other words, when a sudden growth of load demand in the network happens, there should be enough control over power and voltage simultaneously. Considering a two-node system, which is shown in Figure 1, a comprehensive analysis can be presented for voltage stability [23].
Voltage at the receiver node can be calculated by Equation (1) using KVL:
In which Zs is line equivalent impedance from beginning of feeder to each node obtained from Equation (2).
According to Equations (3) and (4), loading will cause a reduction in receiver node voltage, Vr, and consequently apparent power of receiver node, Sr, reduces. The phase difference between Zr and Zs is equal to β = θ − ϕ.
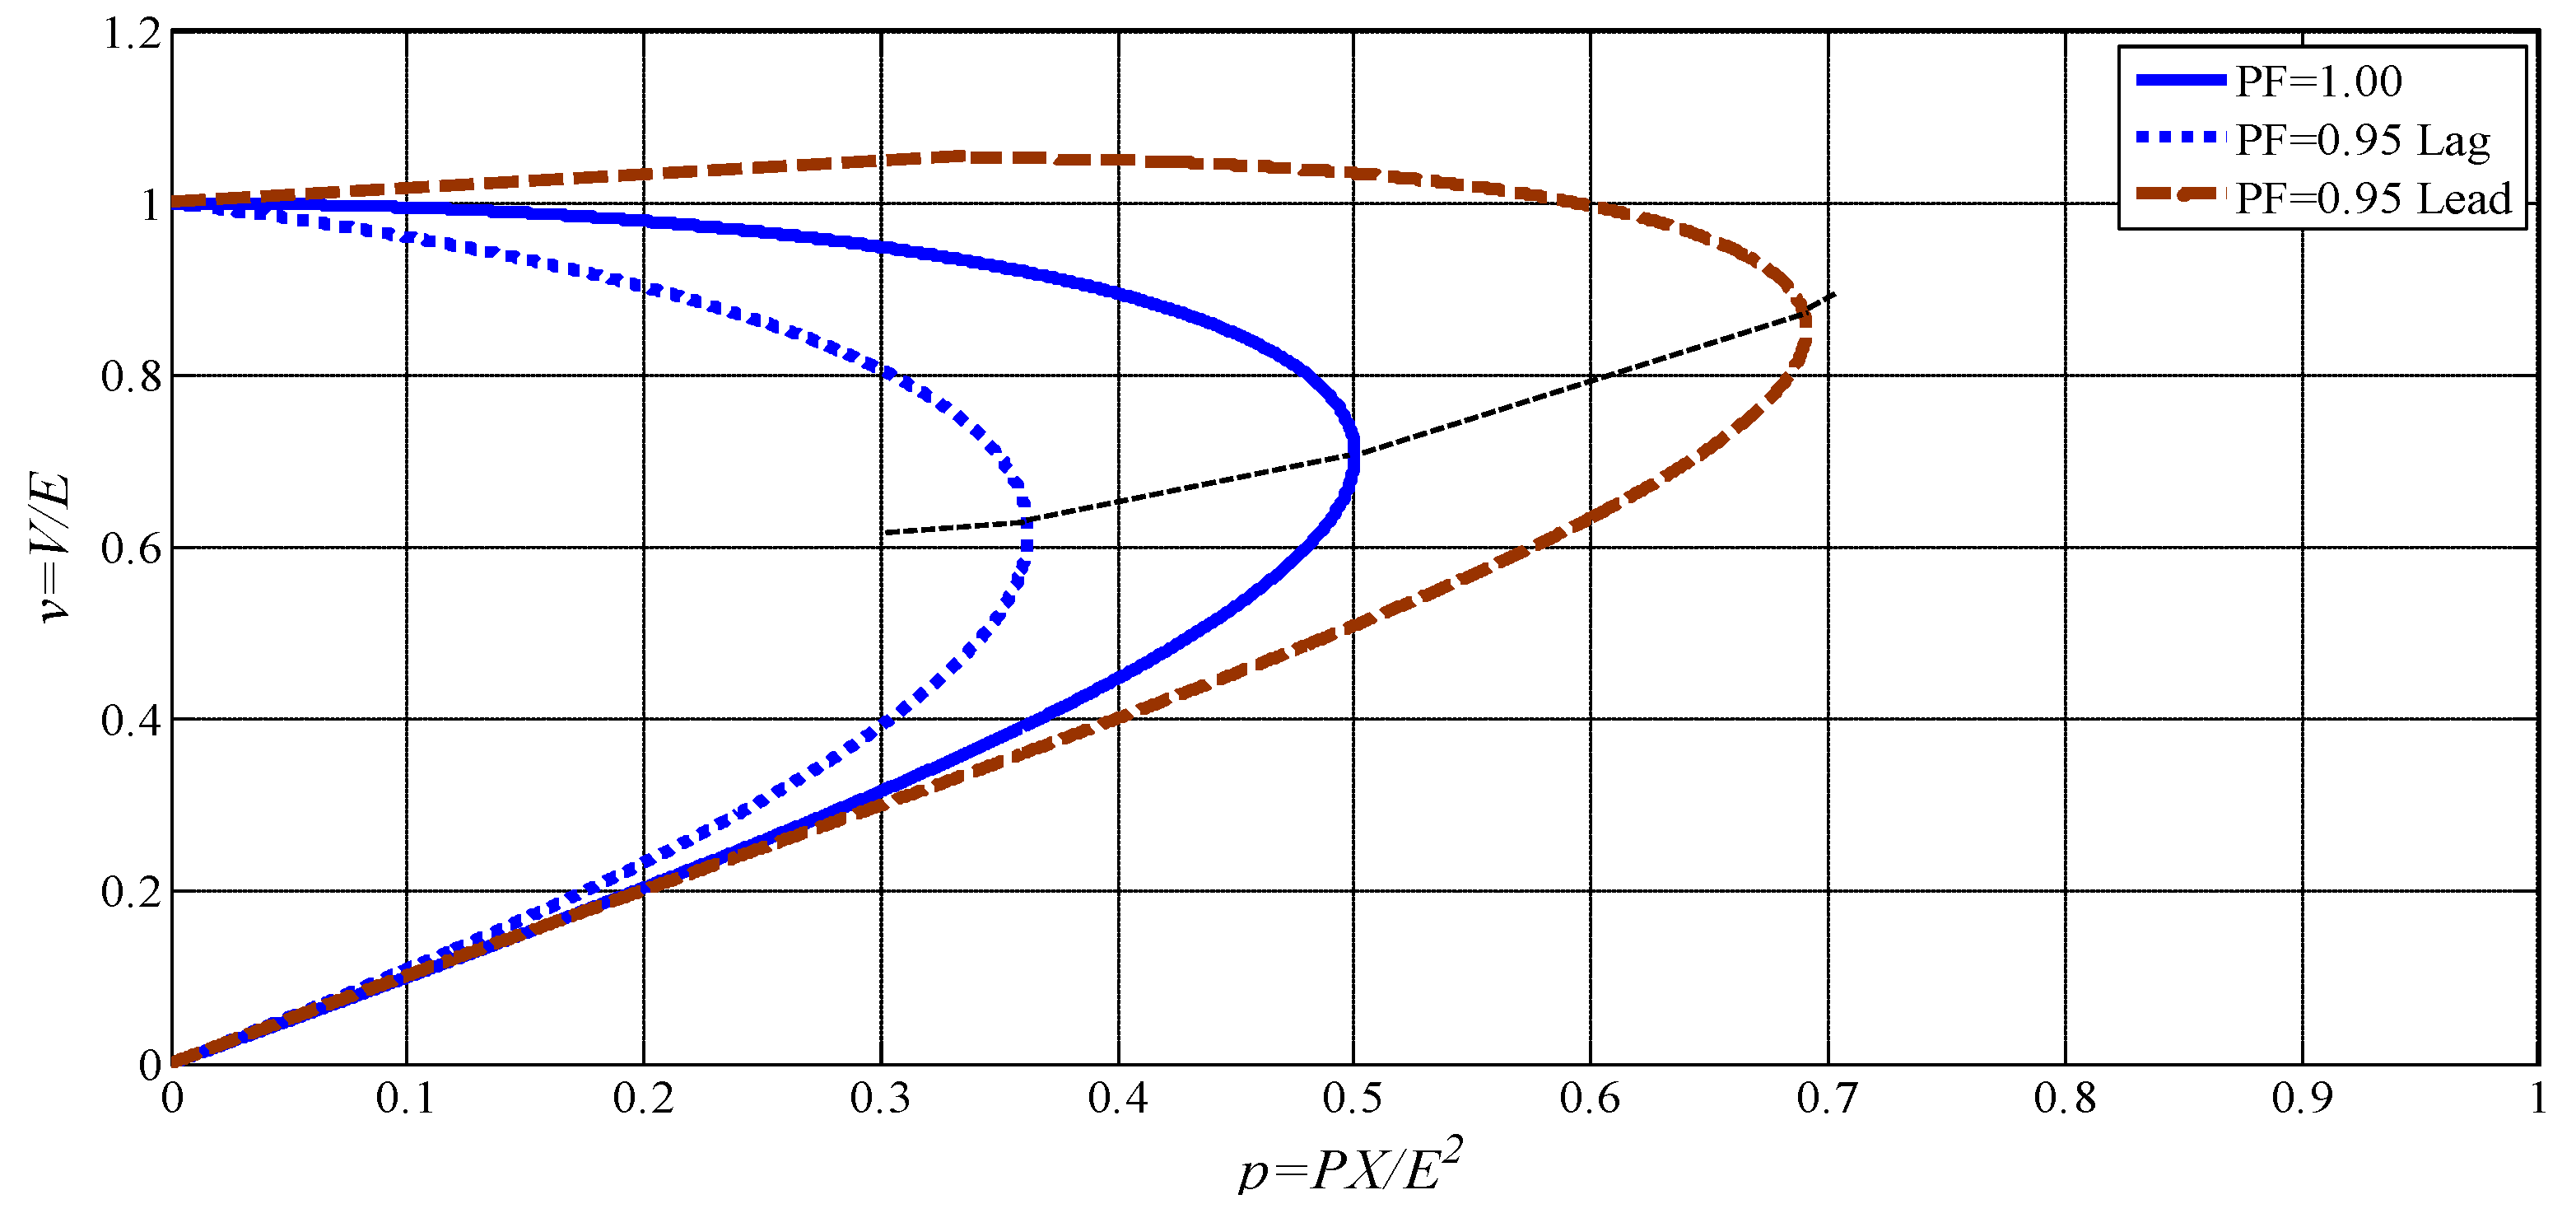
By increasing load power demand, the absolute value of impedance reduces and the current in the receiver node, Ir, increases. Figure 2 is a general approach that can be used to define the stability margin. The relation between normalized voltage and power variables is shown in Equation (5) [24]. This equation is used to obtain the V-P curve for the two-node system of Figure 1.
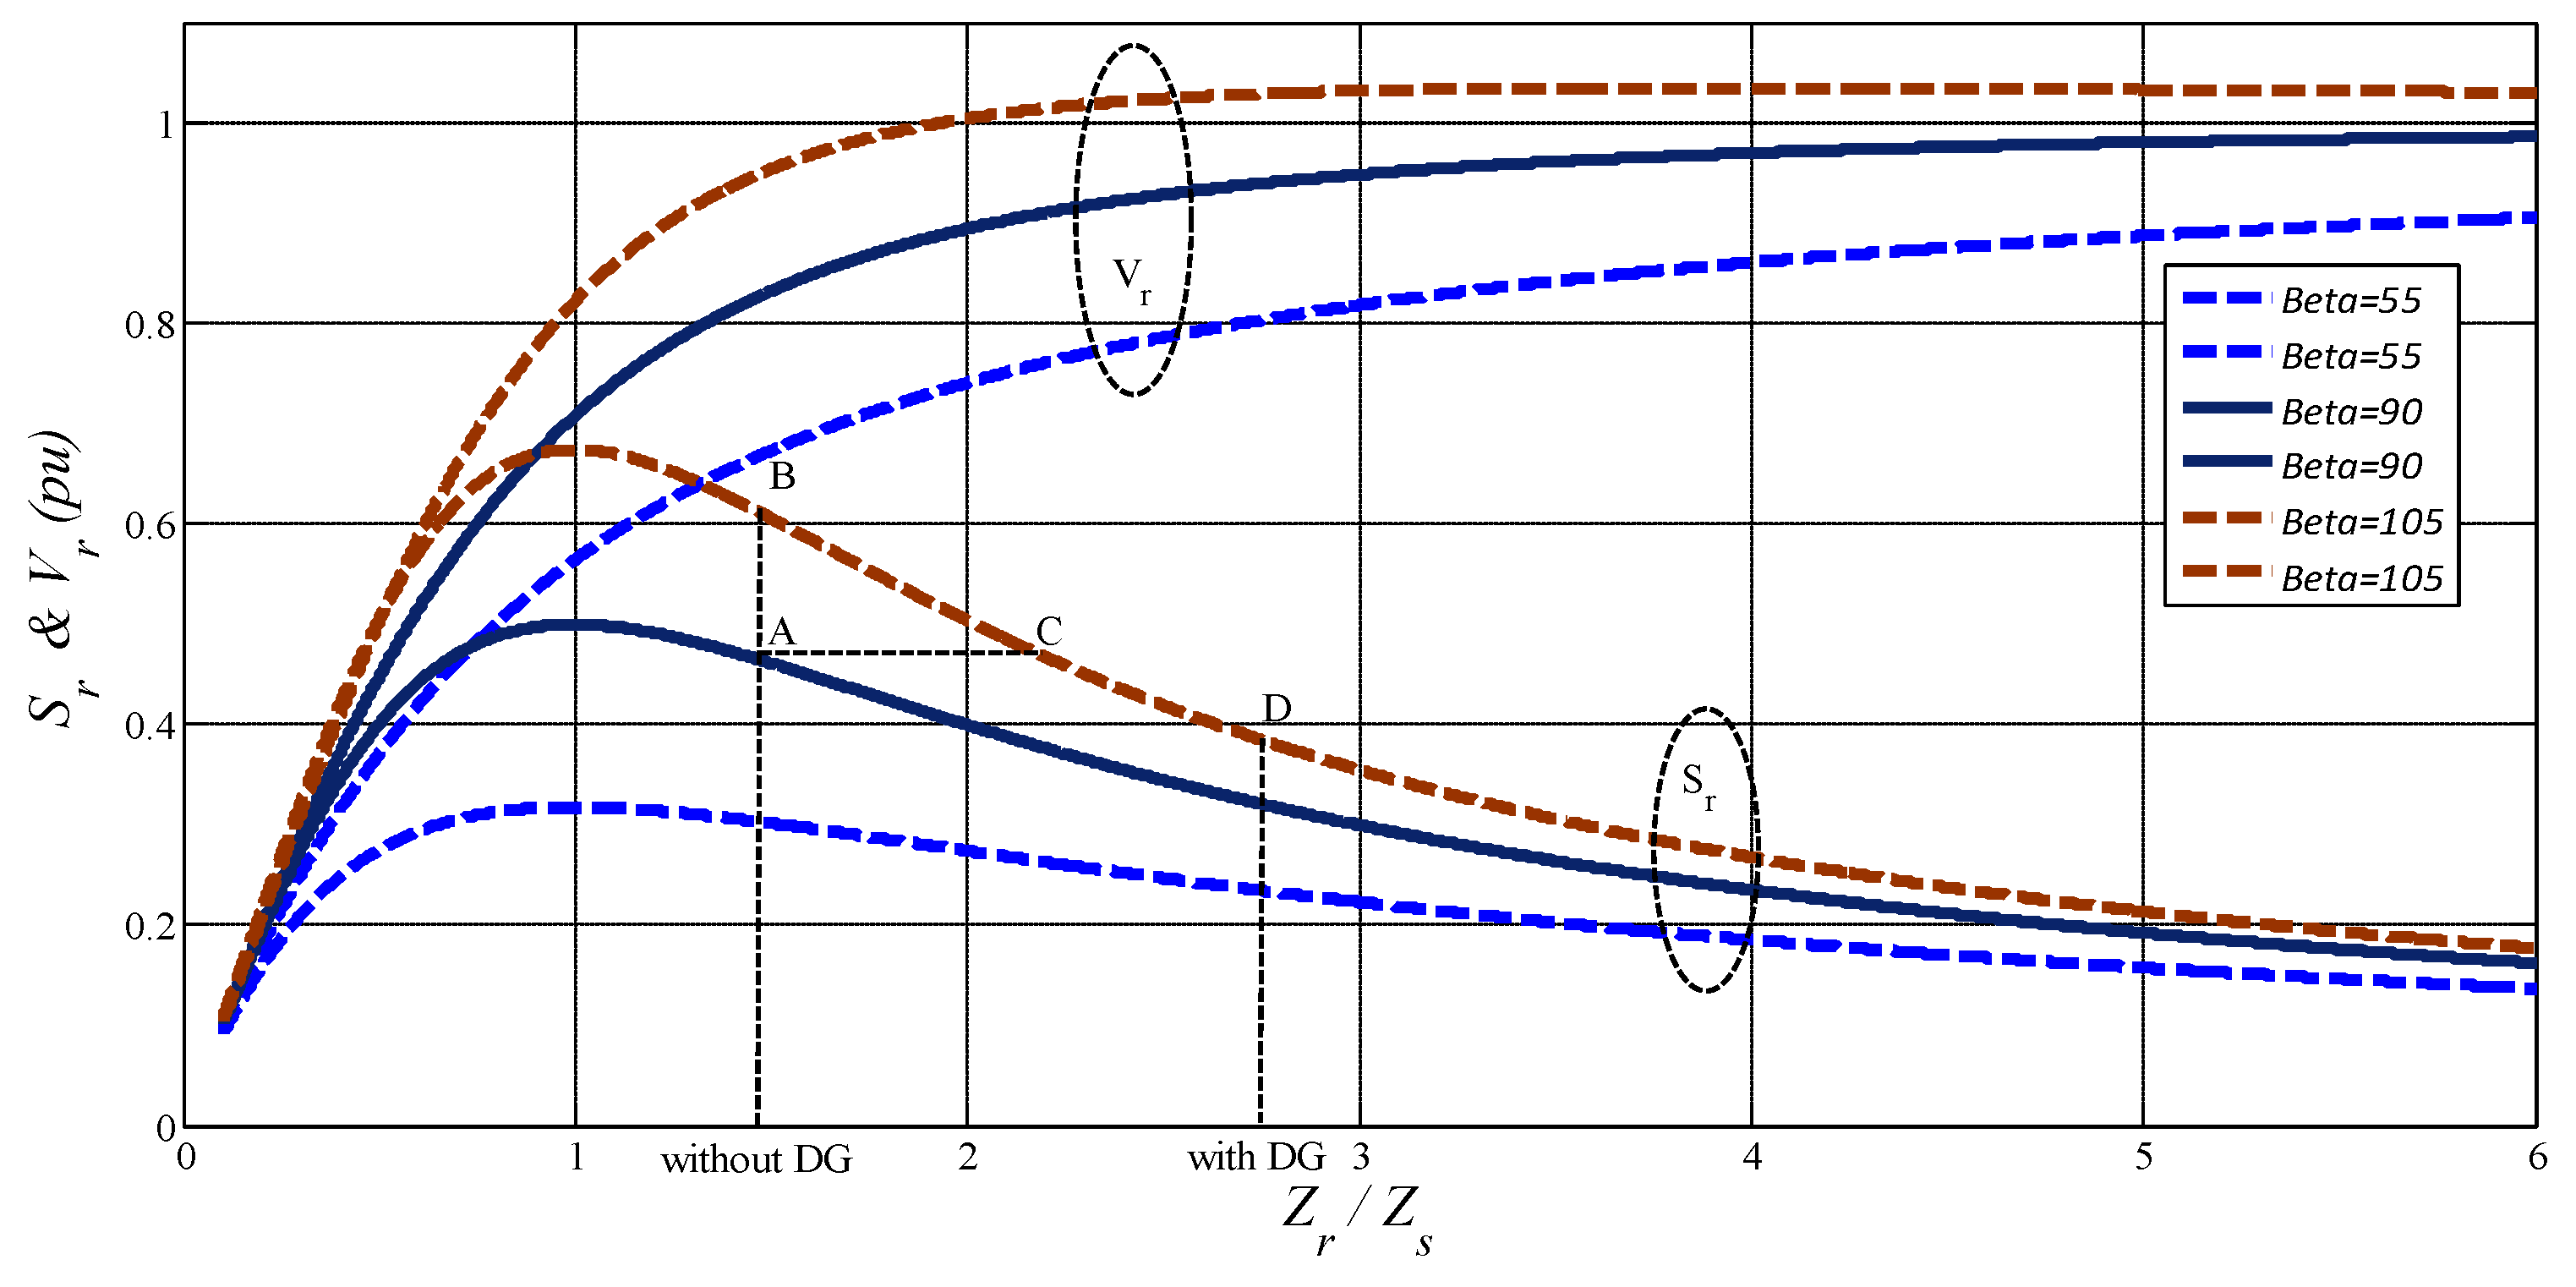
Figure 2 and Figure 3 are schematic representations of Equations (3) to (5) in different load conditions with and . As can be seen in Figure 2, maximum power of load is delivered while . In general, , which means sudden increase of Zr, or sudden decrease of Zs, should be controlled, in order to avoid network instability. Moreover, to have an acceptable response, the value of Vr should be high enough. According to Equation (6), an increase in PDG causes a reduction in ϕ at the load side that, in turn, causes an increase in β.
As it is shown in Figure 3, injection of PDG improves the voltage profile. But, the important question is if the selected PDG size is proper for installation. Referring to the Sr curves, it is proven that improper selection of PDG will reduce system loading and stability from point A to point D. By increasing the value of PDG, the ration of becomes bigger. The results show that the best capacity of PDG is the value that can provide a condition in which .
V-P Curve in a Specific Node
As already stated, V-P curves can be used to investigate voltage stability. To obtain this curve, the test node should be selected in an important line. The power, P, represents the total load power in a region or transmitted power in the line. The process of obtaining the V-P curve at the test node will be given further. If the injected reactive power to the test node n is equal to a specified value of Qn = Q*, the V-P curve can be plotted according to the following algorithm:
The first step—The nth node is considered as a PQ node. Then, considering current value of active power and Qn = Q*, the power flow is performed and the voltage of node Vn is obtained.
The second step—Now, nth node is considered as a PV node and the voltage value is considered as in which:
Then, for the supposed Pn, power flow is performed and the injected reactive power to shin n, Qn, is obtained. Without alteration of Pn, to have , the injected reactive power to nth node, Qn, should be less than Q*. So we have:
The third step—The aim is to define the new value of Pn in accordance with the new Vn and without the alteration of reactive power in nth node. It is known that the sensitivity of voltage value to active power is less than its sensitivity to reactive power. Accordingly, if the new Pn needs to be obtained without alteration of reactive power, we should suppose that:
As in this step, ΔPn is not defined; it is supposed to be as follows:
Now the power flow of nth shin is performed, considering and that result in a new value of reactive power, Qn. By applying , in the condition of , the algorithm goes to the second step (ε is a certain small positive value). Otherwise, from Equations (8) and (10), is calculated and power flow is performed again to obtain Qn. This process continues until the condition of becomes true.
The fourth step—The above-mentioned steps are repeated until the V-P curve is obtained.
3. Voltage Stability Criterion in Presence of PV Units
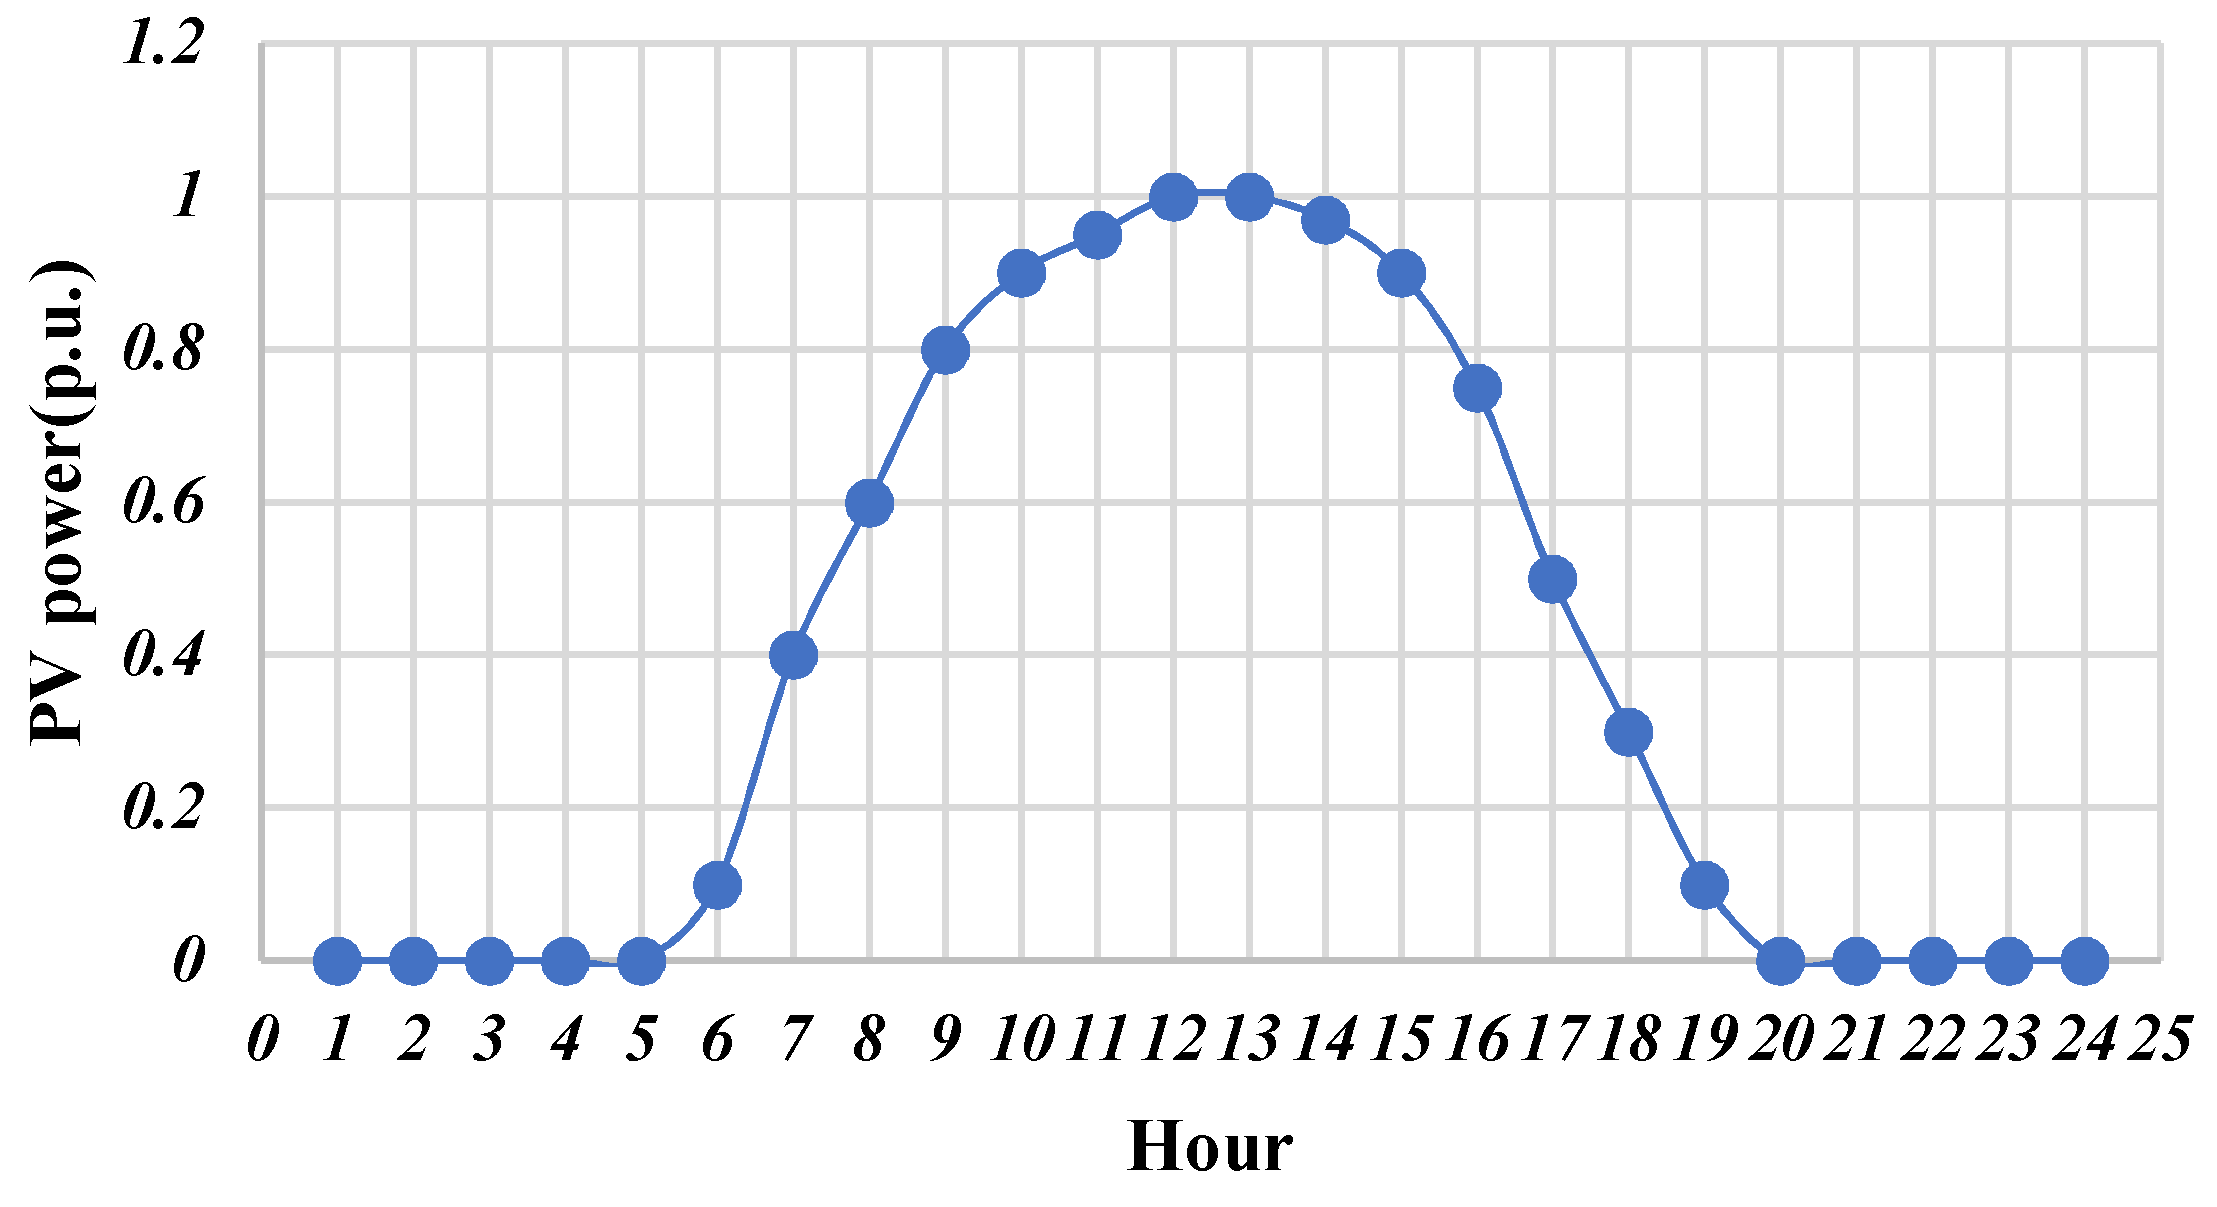
The PV penetration level of a node is defined as the ratio of the installed PV power on the node to the load power of the node. For instance, for a node with 15 Kw PV and load of 100 Kw, the penetration is 15%. Accordingly, it is enough to have PV penetration value and the load value of each node and in each phase to investigate voltage stability. The model of PV used in this work is selected from the study of Reference [25] and is shown in Figure 4.
Voltage instability analysis is a dynamic issue in power systems. But for deterministic load systems, static analysis can be used to estimate the distance of system performance from the knee point of the V-P curve. Using power flow from Equation (1) and converting it into real and imaginary parts, it gives:
In which is the phase difference between source node of the feeder and the receiver node. Omitting δ from Equations (11) and (12) gives:
According to quadratic equation solution, the receiver node voltage can be calculated as:
In which:
To have a proper solution , accordingly:
That gives:
Lk is a stability criterion that is defined for the weakest lines connected to the critical nodes. While the Lk of a node reaches unity, the voltage of the node will collapse. In other words, the less of this criterion, the more stable the node.
4. Simulation Results and Analysis
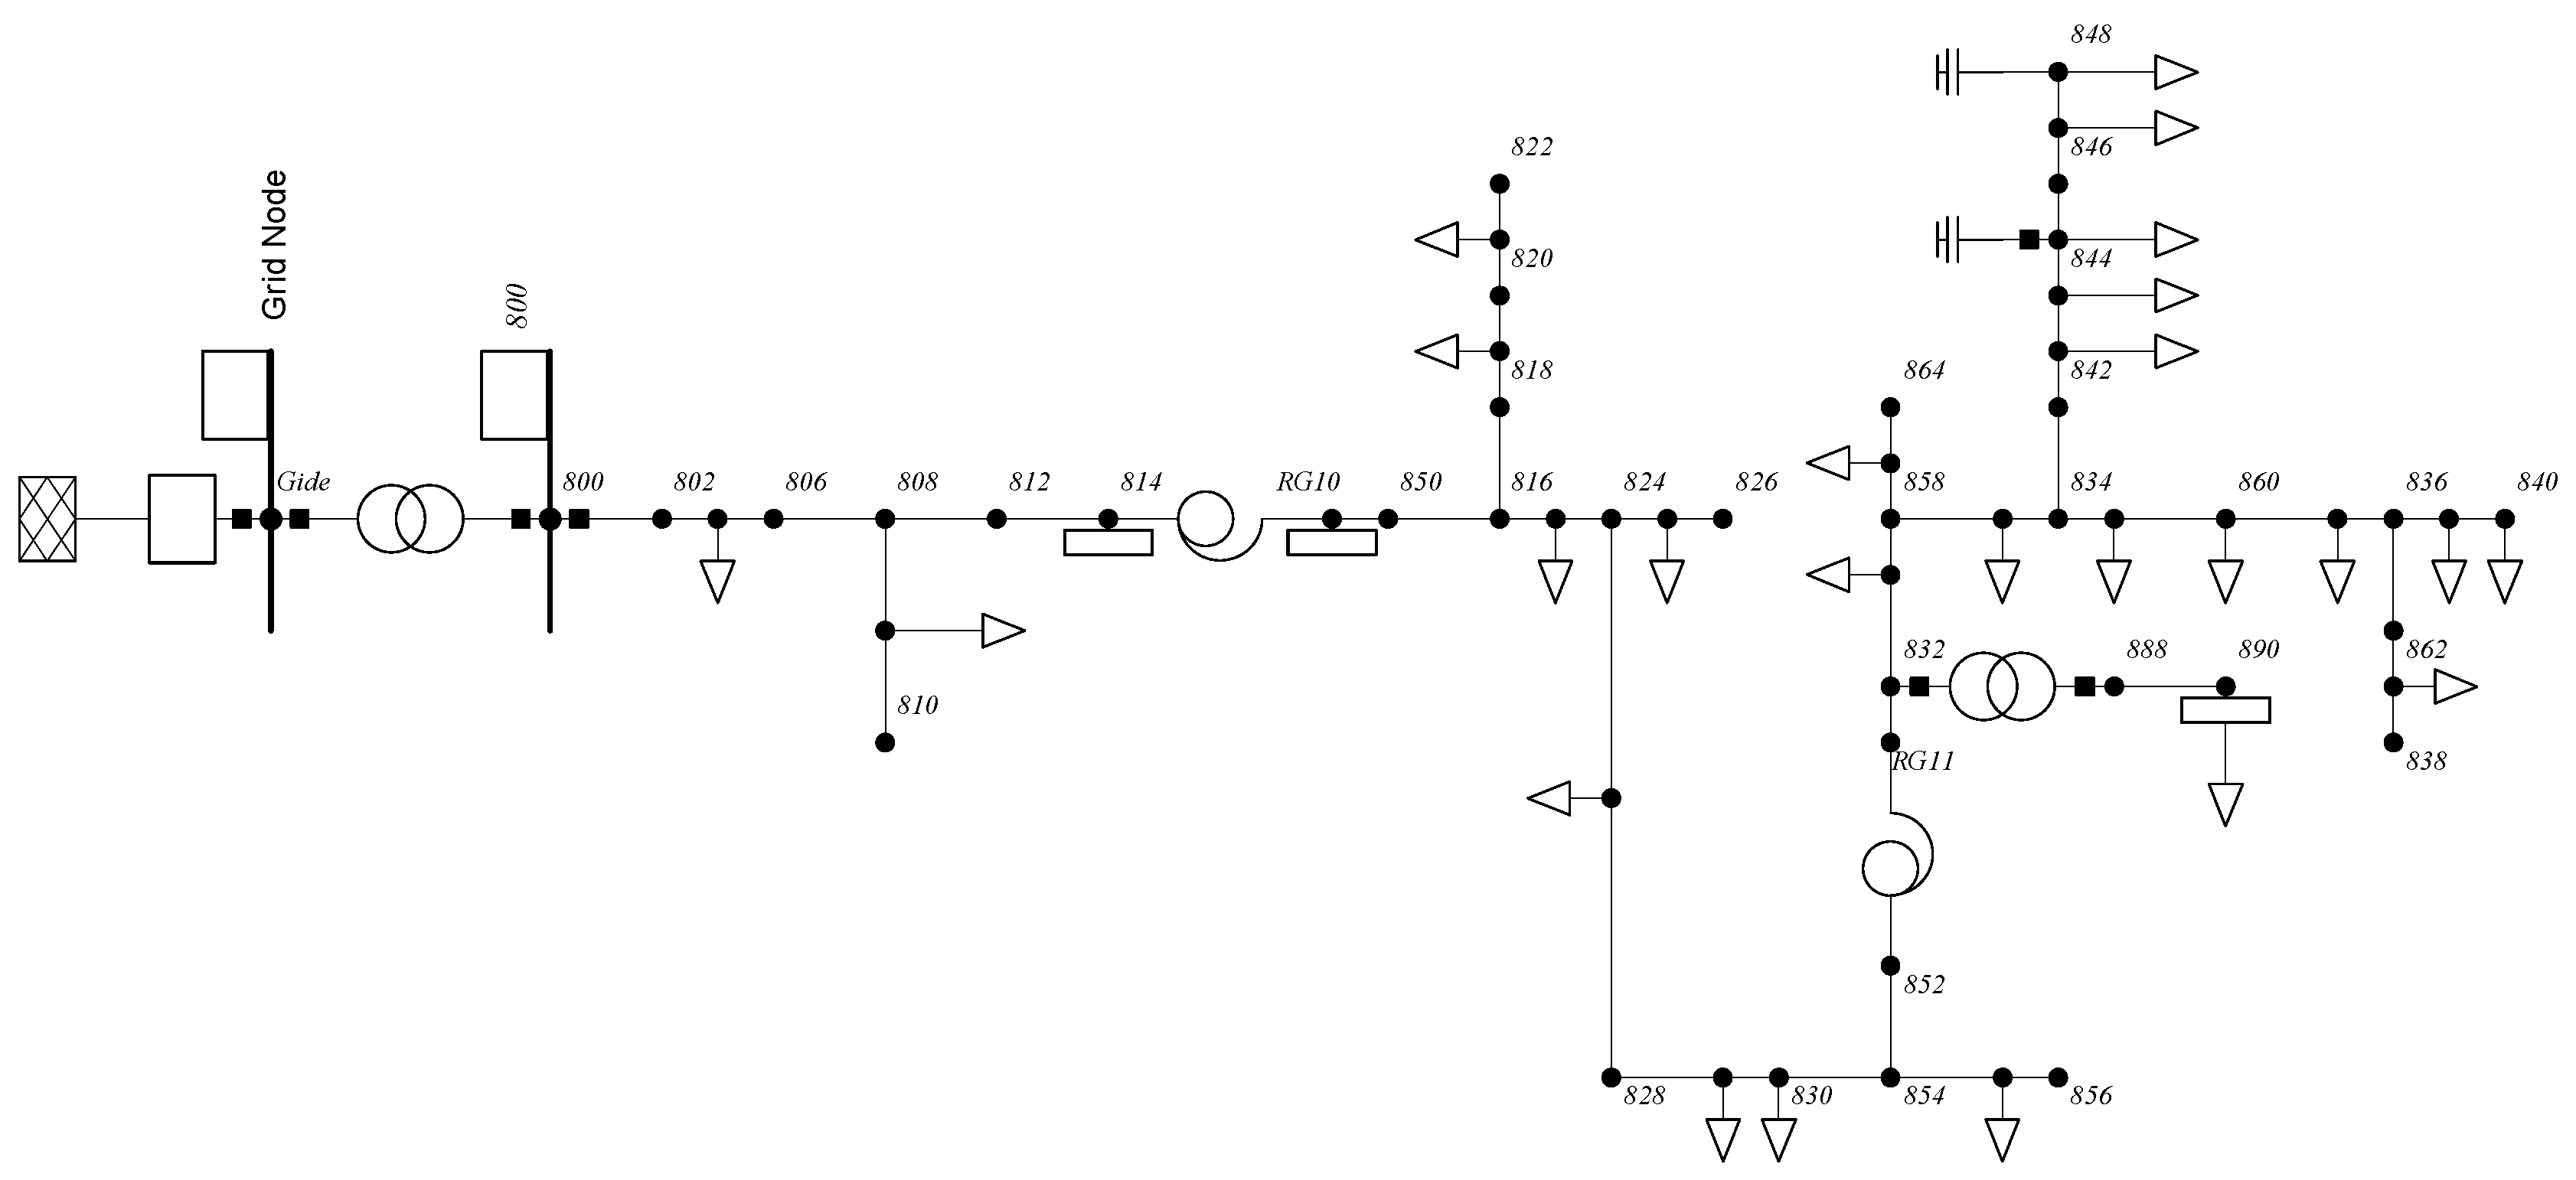
In order to implement the proposed voltage stability method, the IEEE 34 node test system that is shown in Figure 5 [26] was considered. This system has technical specifications, like unbalance characteristics, four lines, two voltage regulators, and a load with ZIP properties.
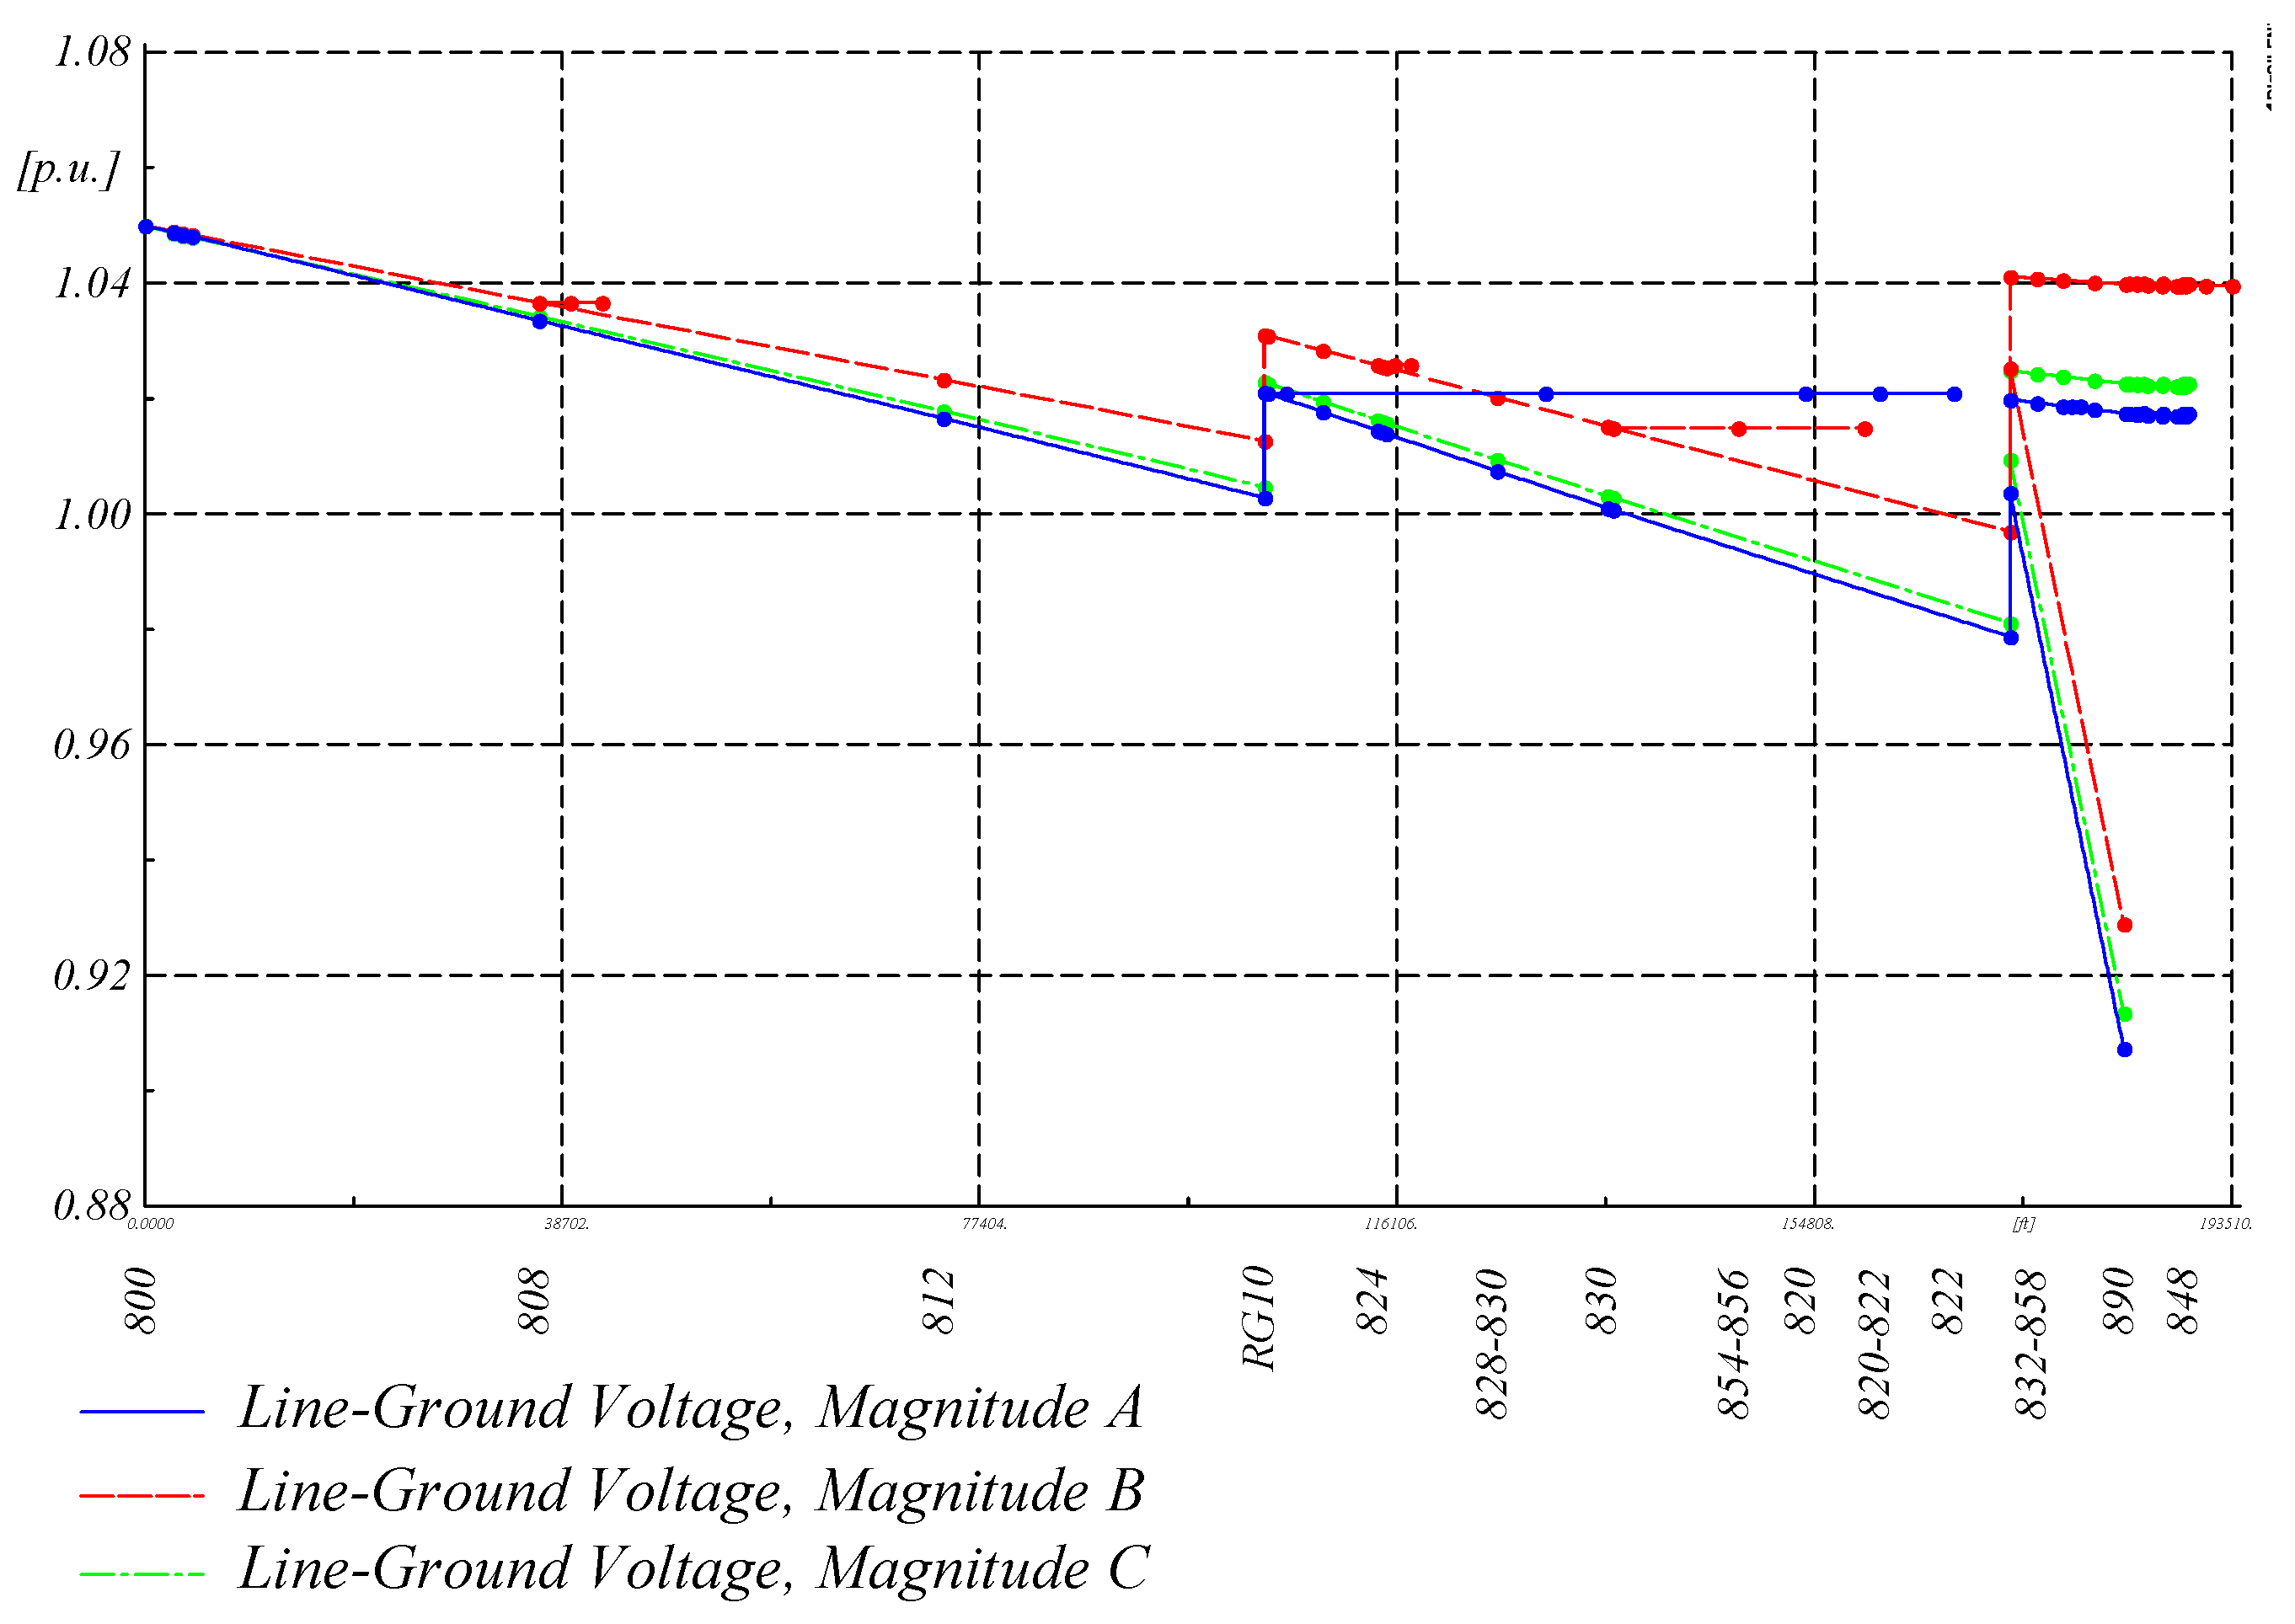
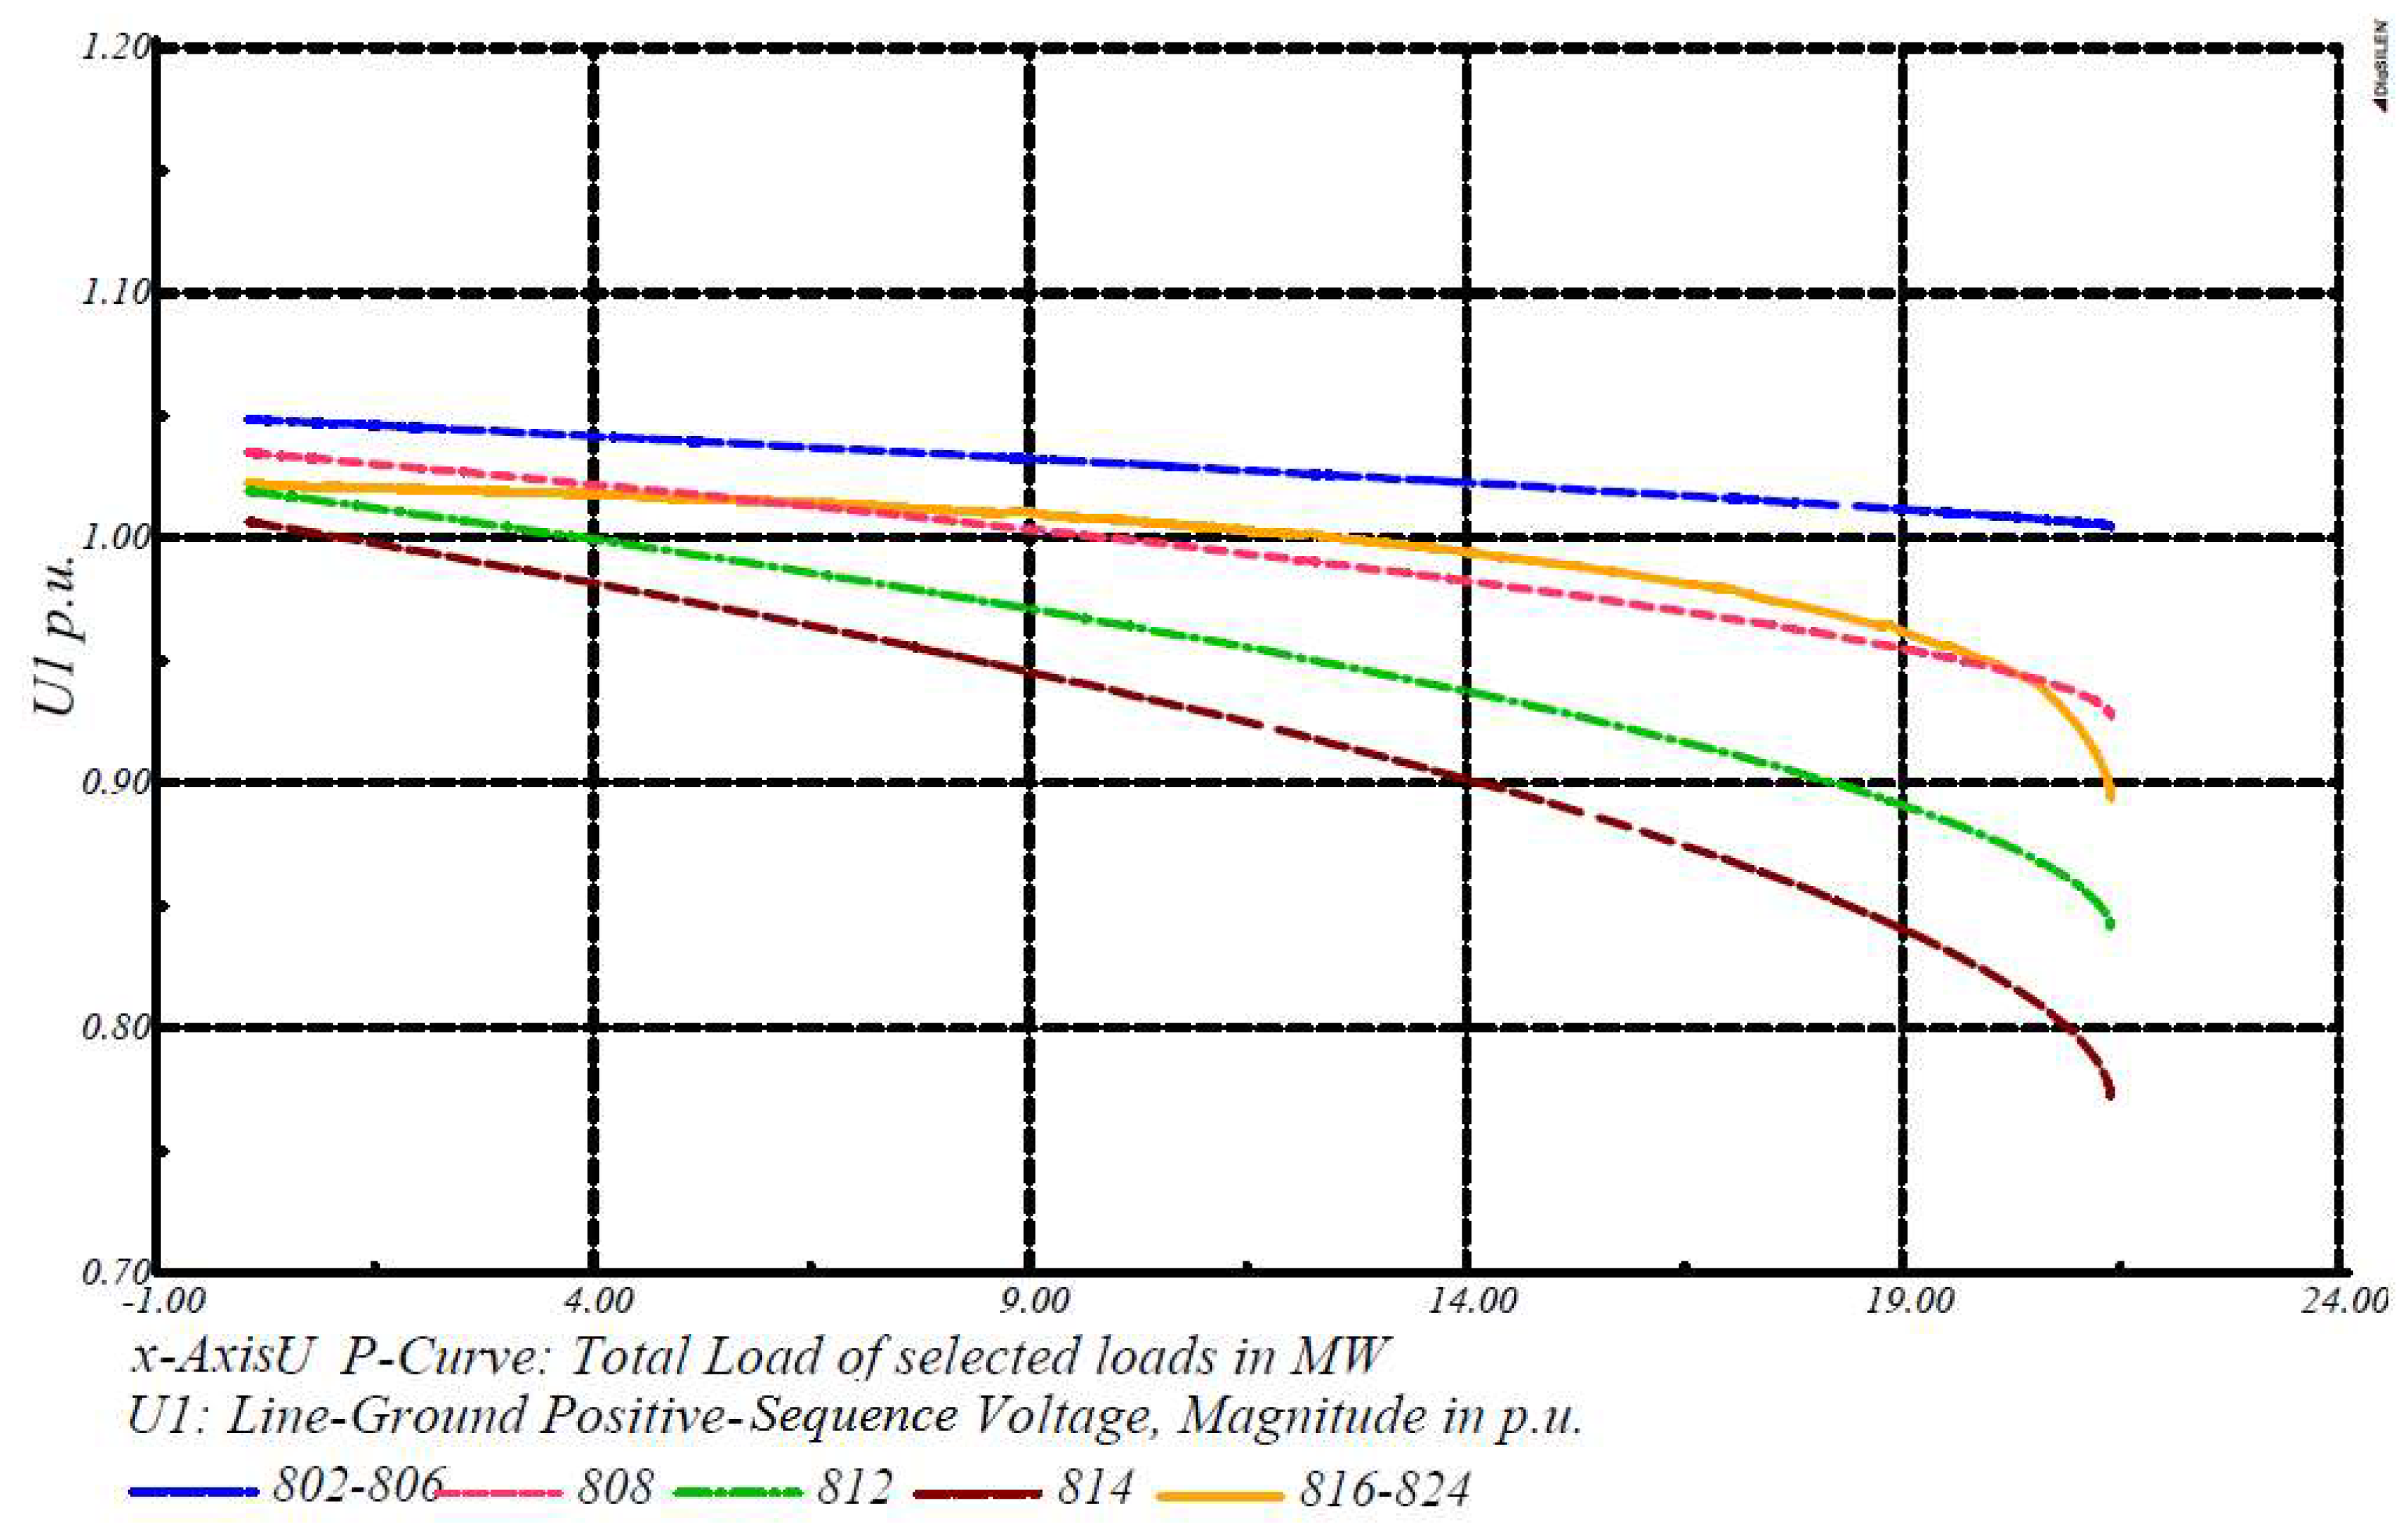
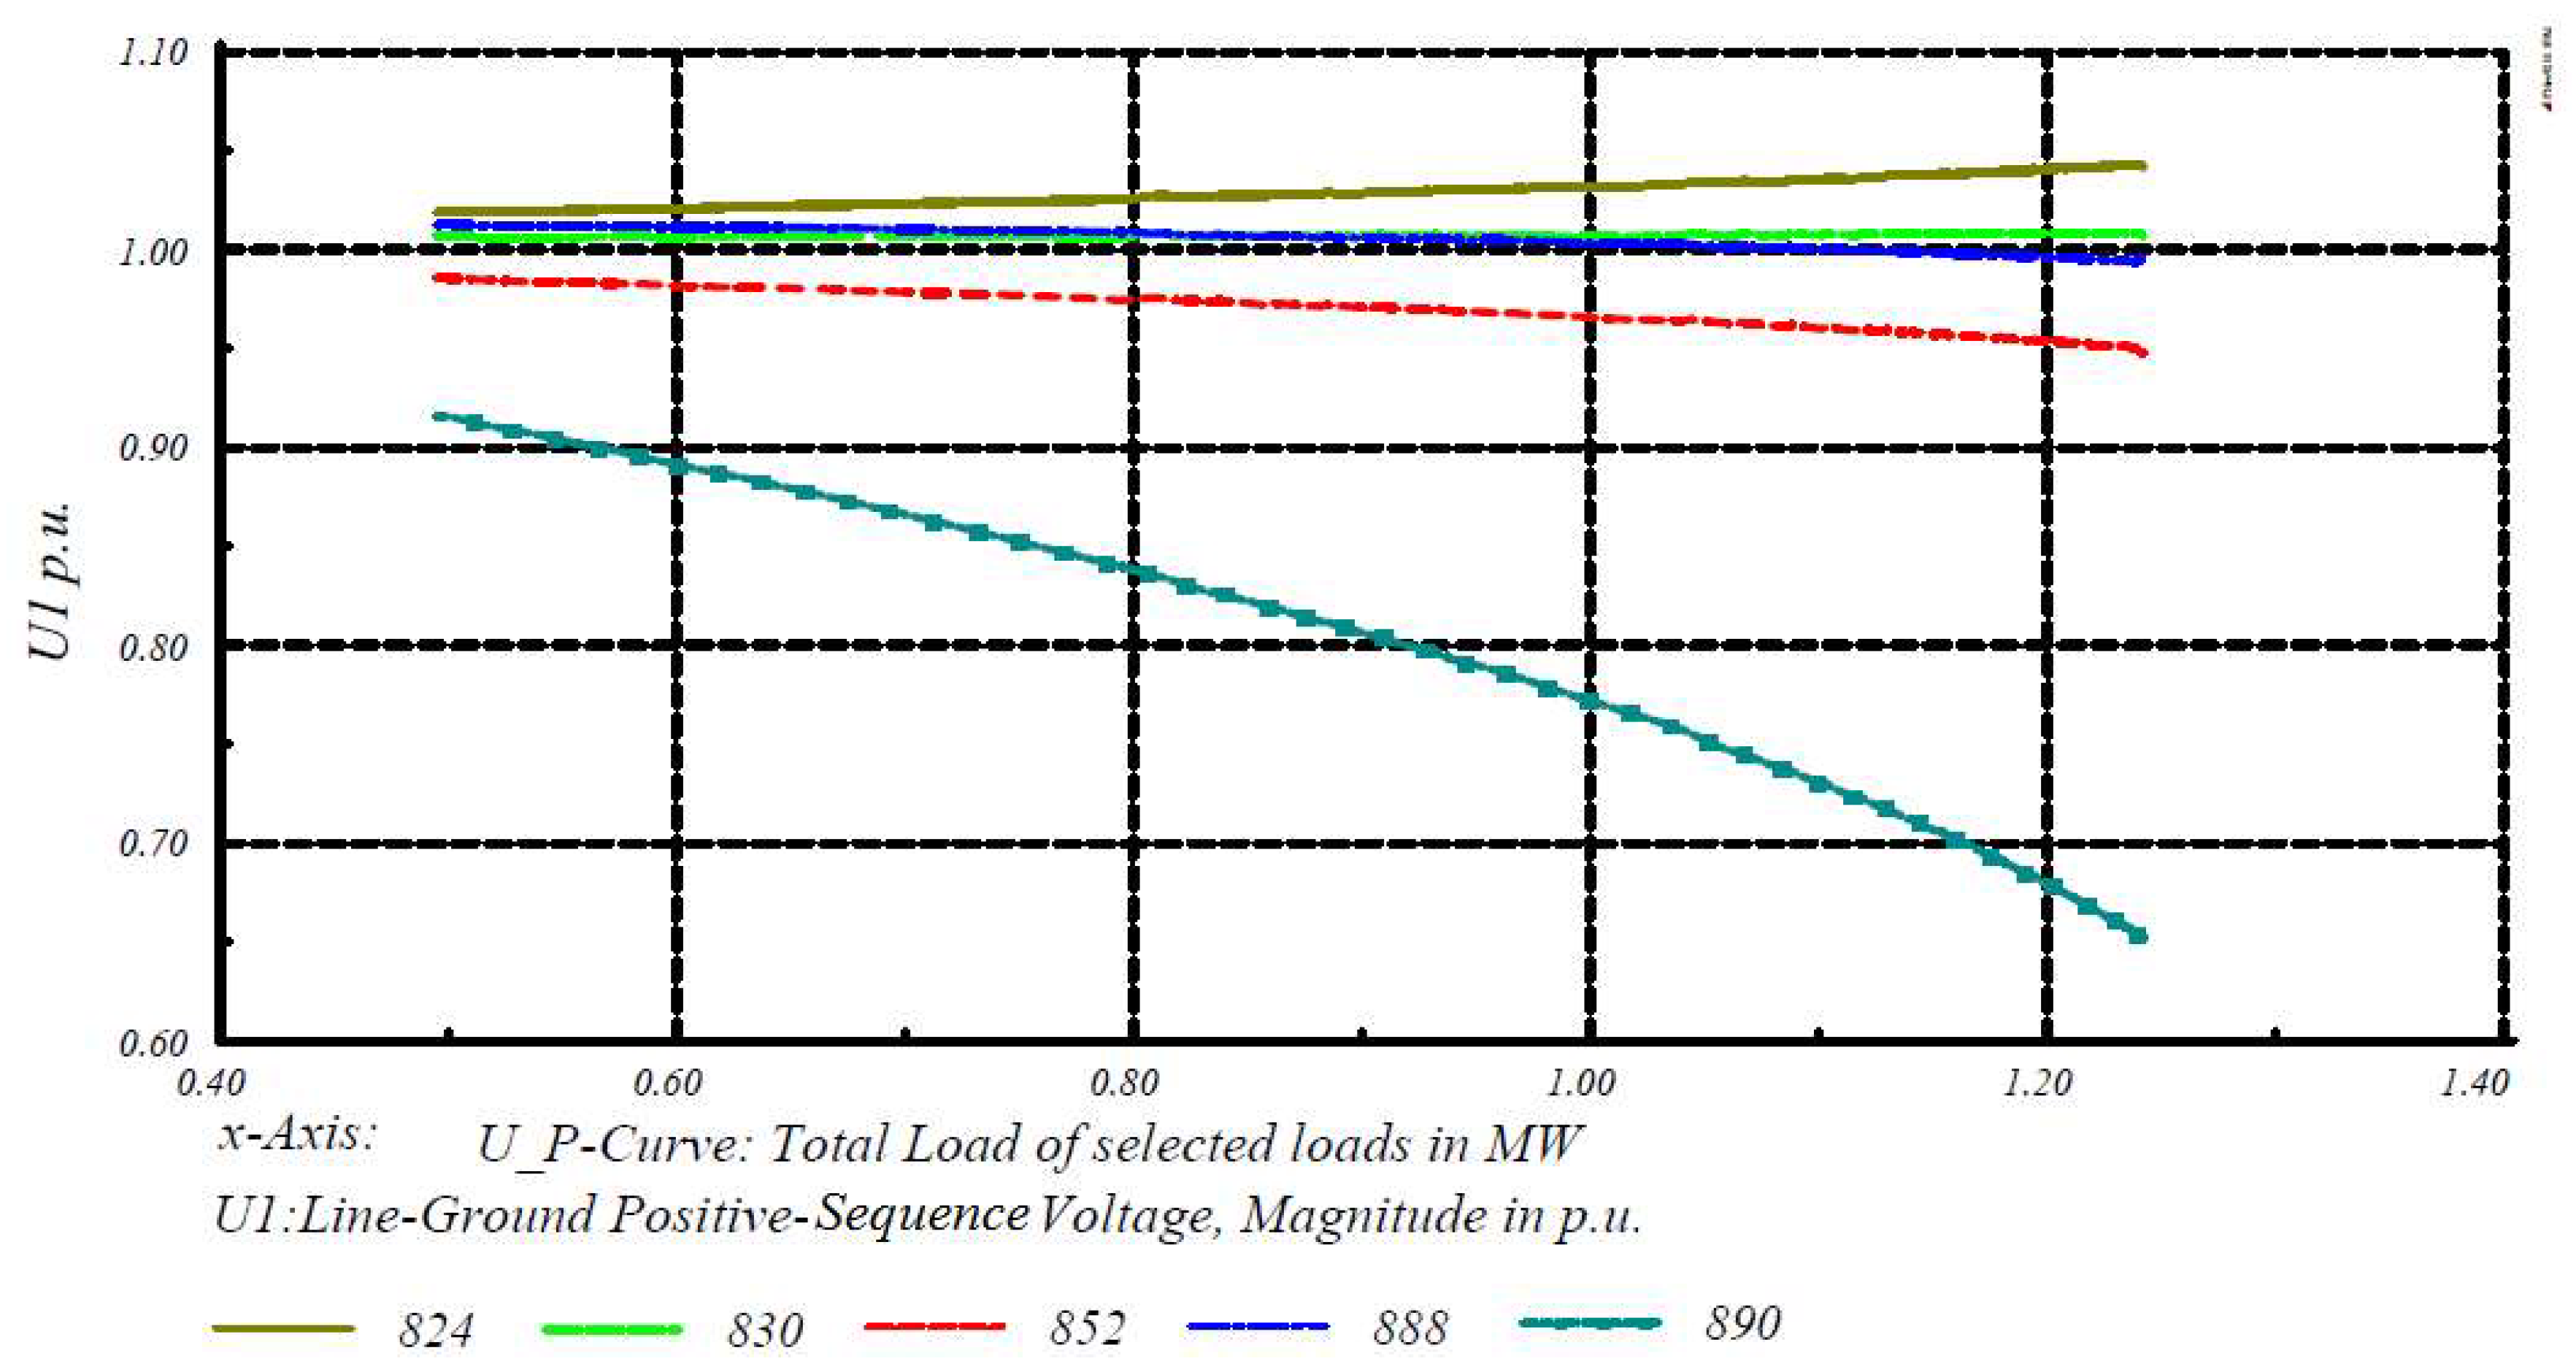
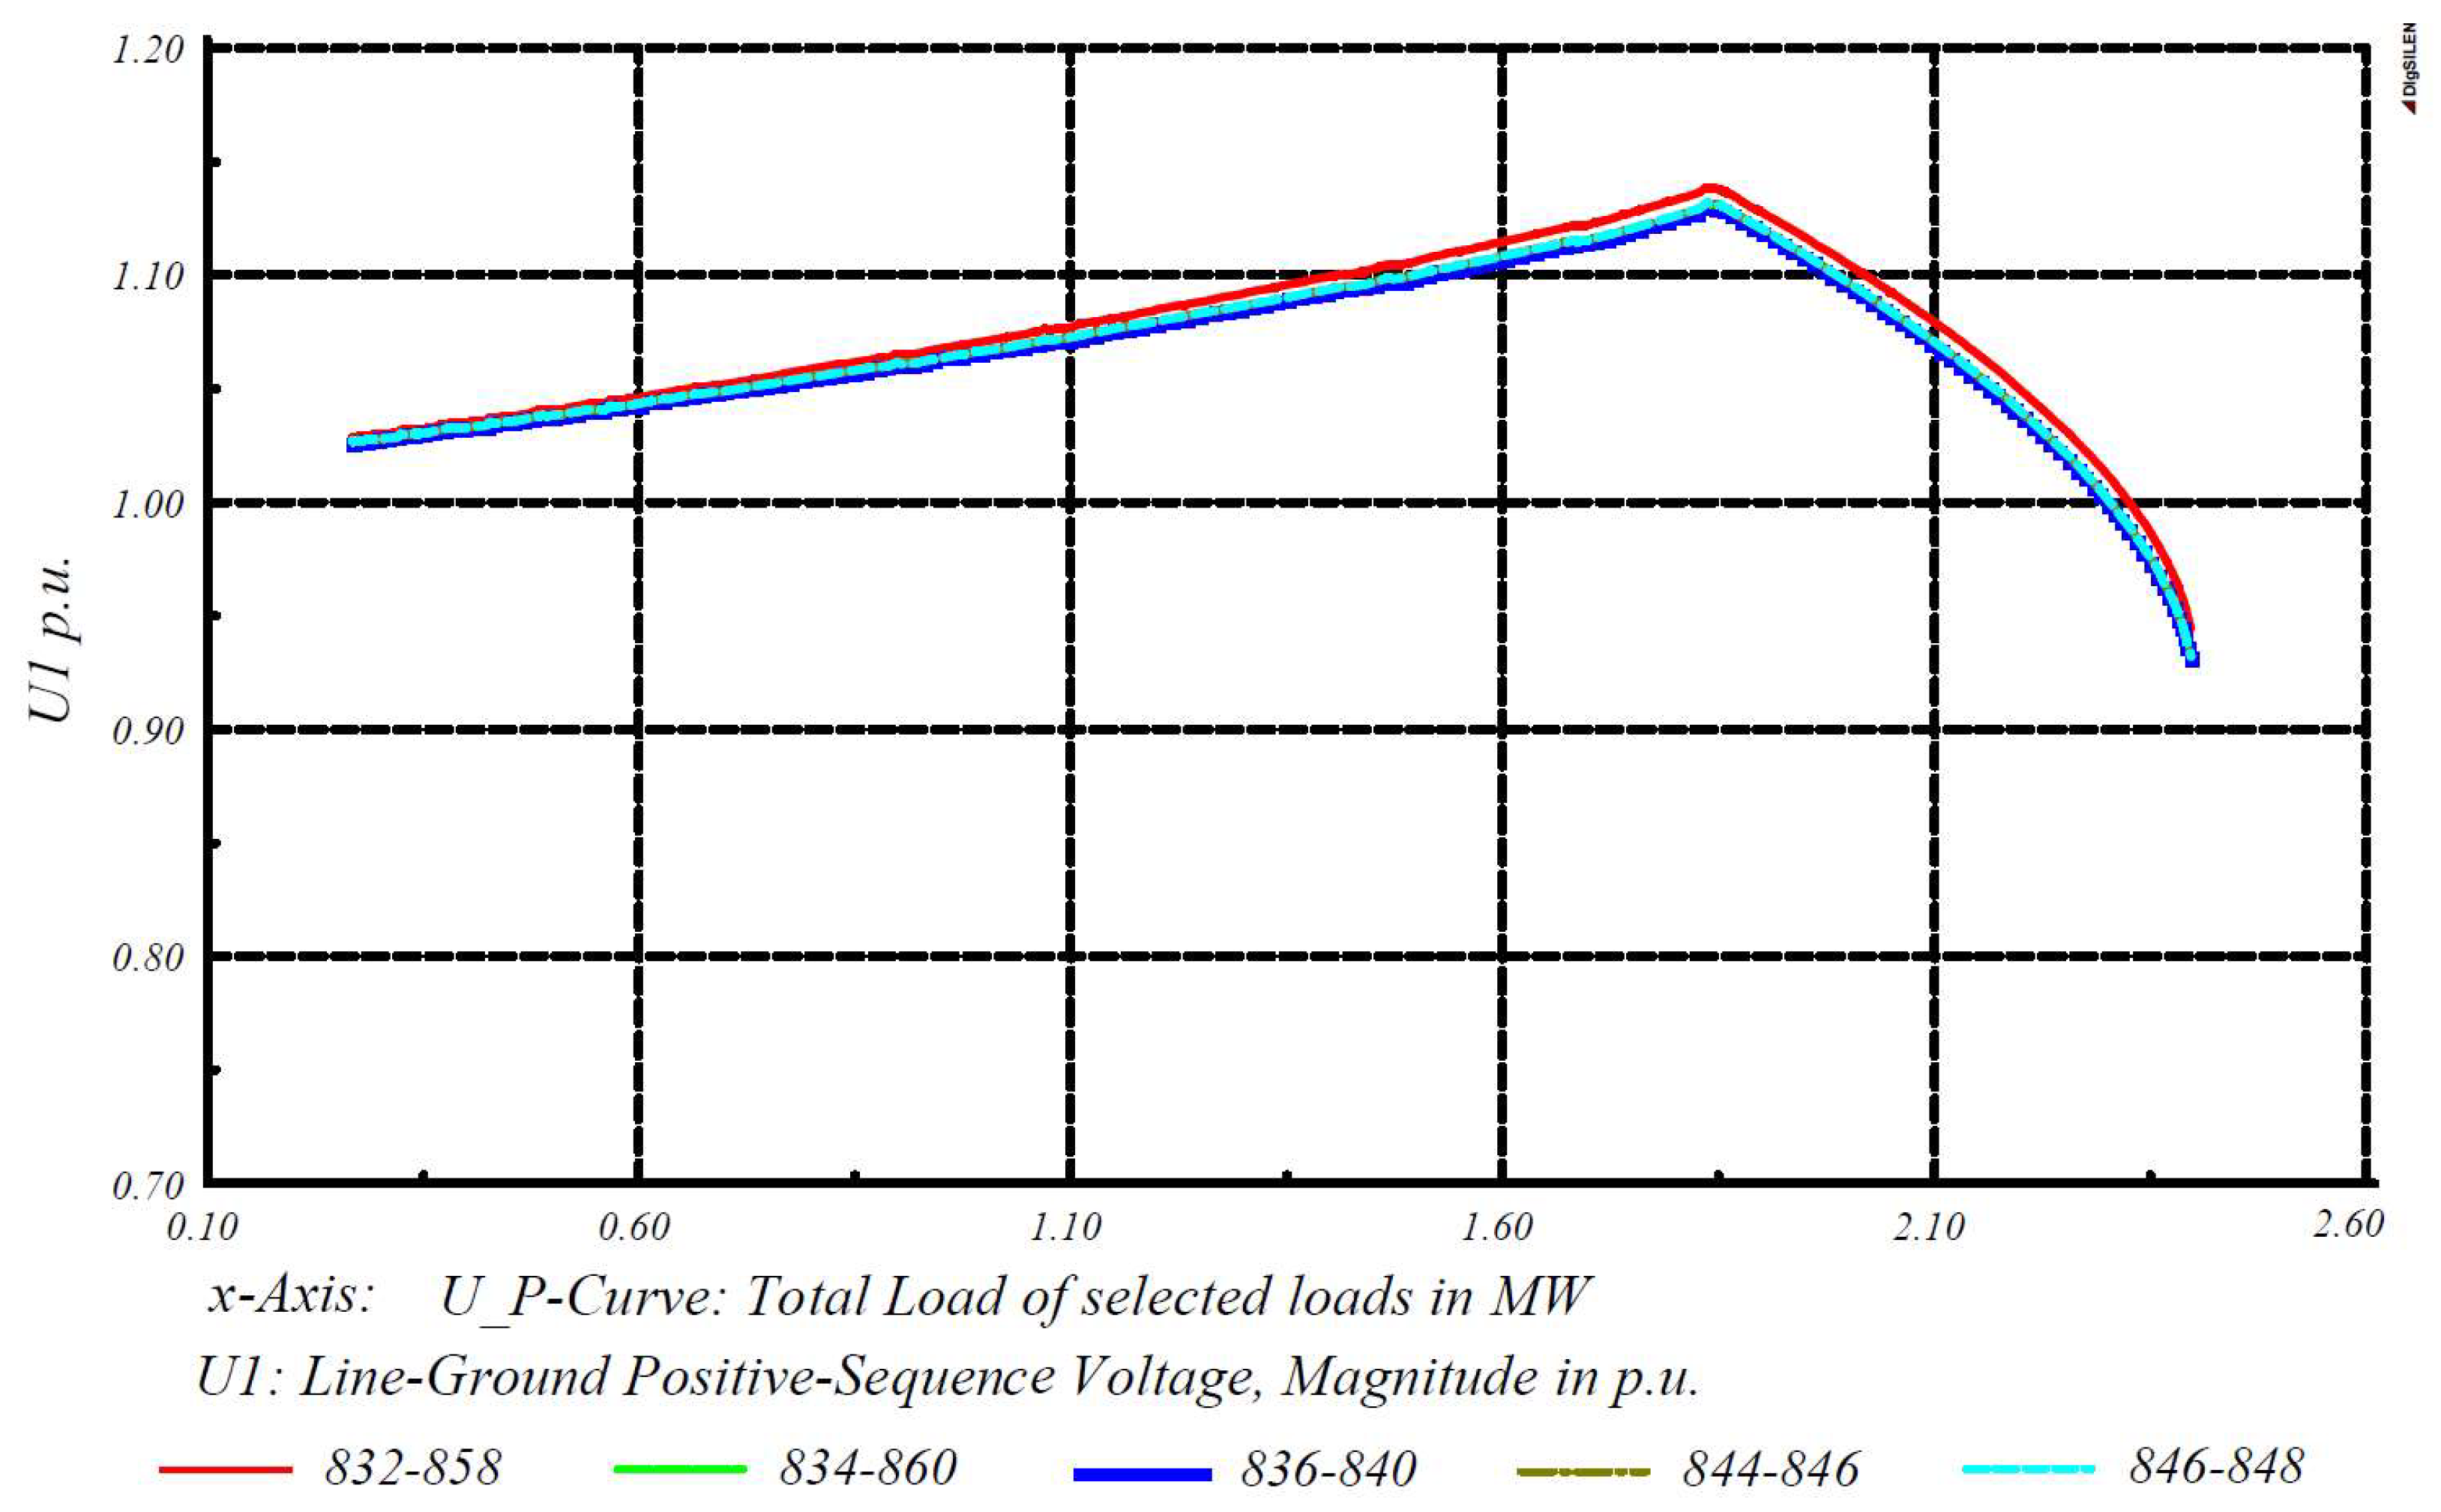
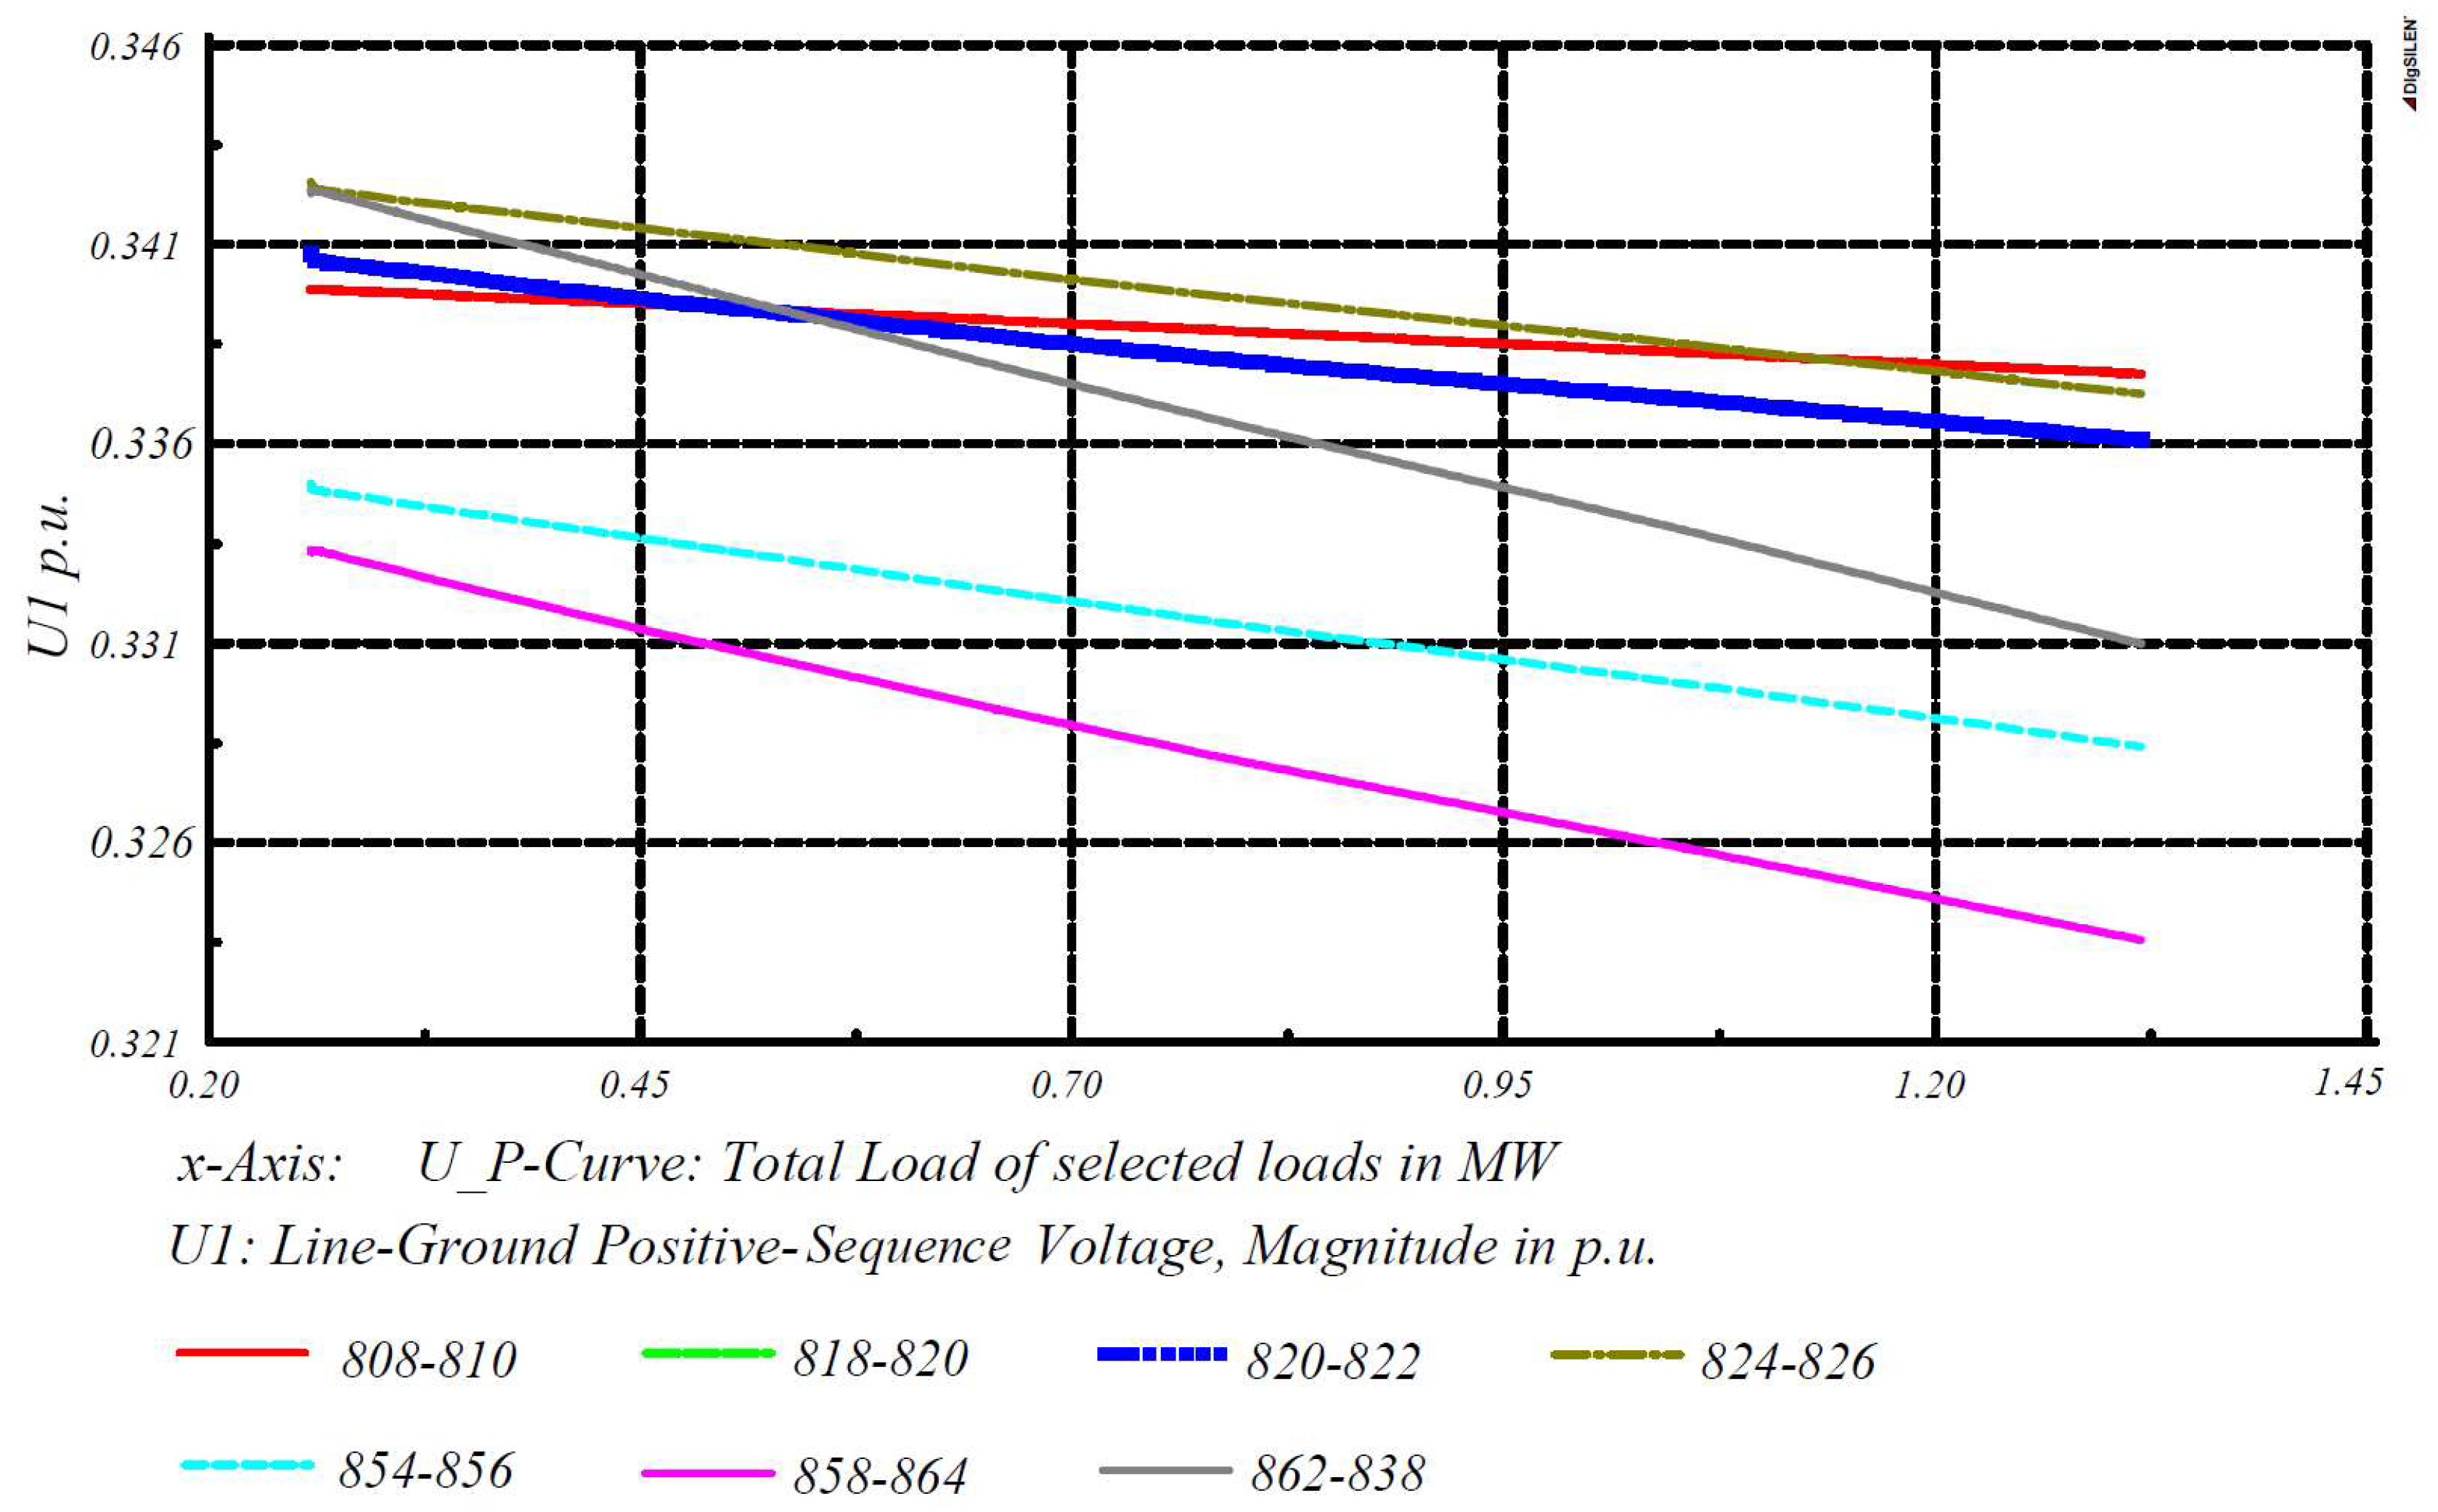
Voltage stability analysis was performed using DIgSILENT software. Figure 6 shows the voltage profile of the network with an industrial voltage level of 24.9 and 4.16 KV. Figure 7, Figure 8, Figure 9 and Figure 10 show the V-P curves for the weakest nodes of the IEEE 34 node test system. In this regard, in order to derive V-P curves, positive sequence components of voltage according to power variations were calculated. The obtained results indicate that the weakest V-P characteristics appear in node 890. As mentioned, the worst case is related to node 890. The main reasons are further distance of the node from reference node (# 800) and nonaccessibility of the node to the capacitor bank at the end of network.
Figure 10 depicts the V-P curve related to the single-phase IEEE 34 node test system. Accordingly, positive, negative, and zero sequence components of voltage are equal, and their values are one-third of the single-phase line voltage value. Briefly, the curves indicate the following facts:
- Some curves have decreasing trend in response to an increase in loading. There is an exception for the nodes represented in Figure 9. In response to a load increase up to 1.85 MW, there is an upward trend, and, for loads higher than 1.85 MW, there is a downward trend. This can be due to the existence of two noticeable capacitances at the end nodes of the network. This fact can be justified according to normalized V-P curves, presented in Figure 2, for networks and loads with capacitive properties.
- Node number 890 has the weakest V-P characteristics, in which power loading of up to 1.25 MW causes a critical point of voltage stability.
- V-P curves of the nodes presented in Figure 7 have higher loading capability in comparison with other nodes. This is because the lines at the beginning of the network have better quality of line impedance.
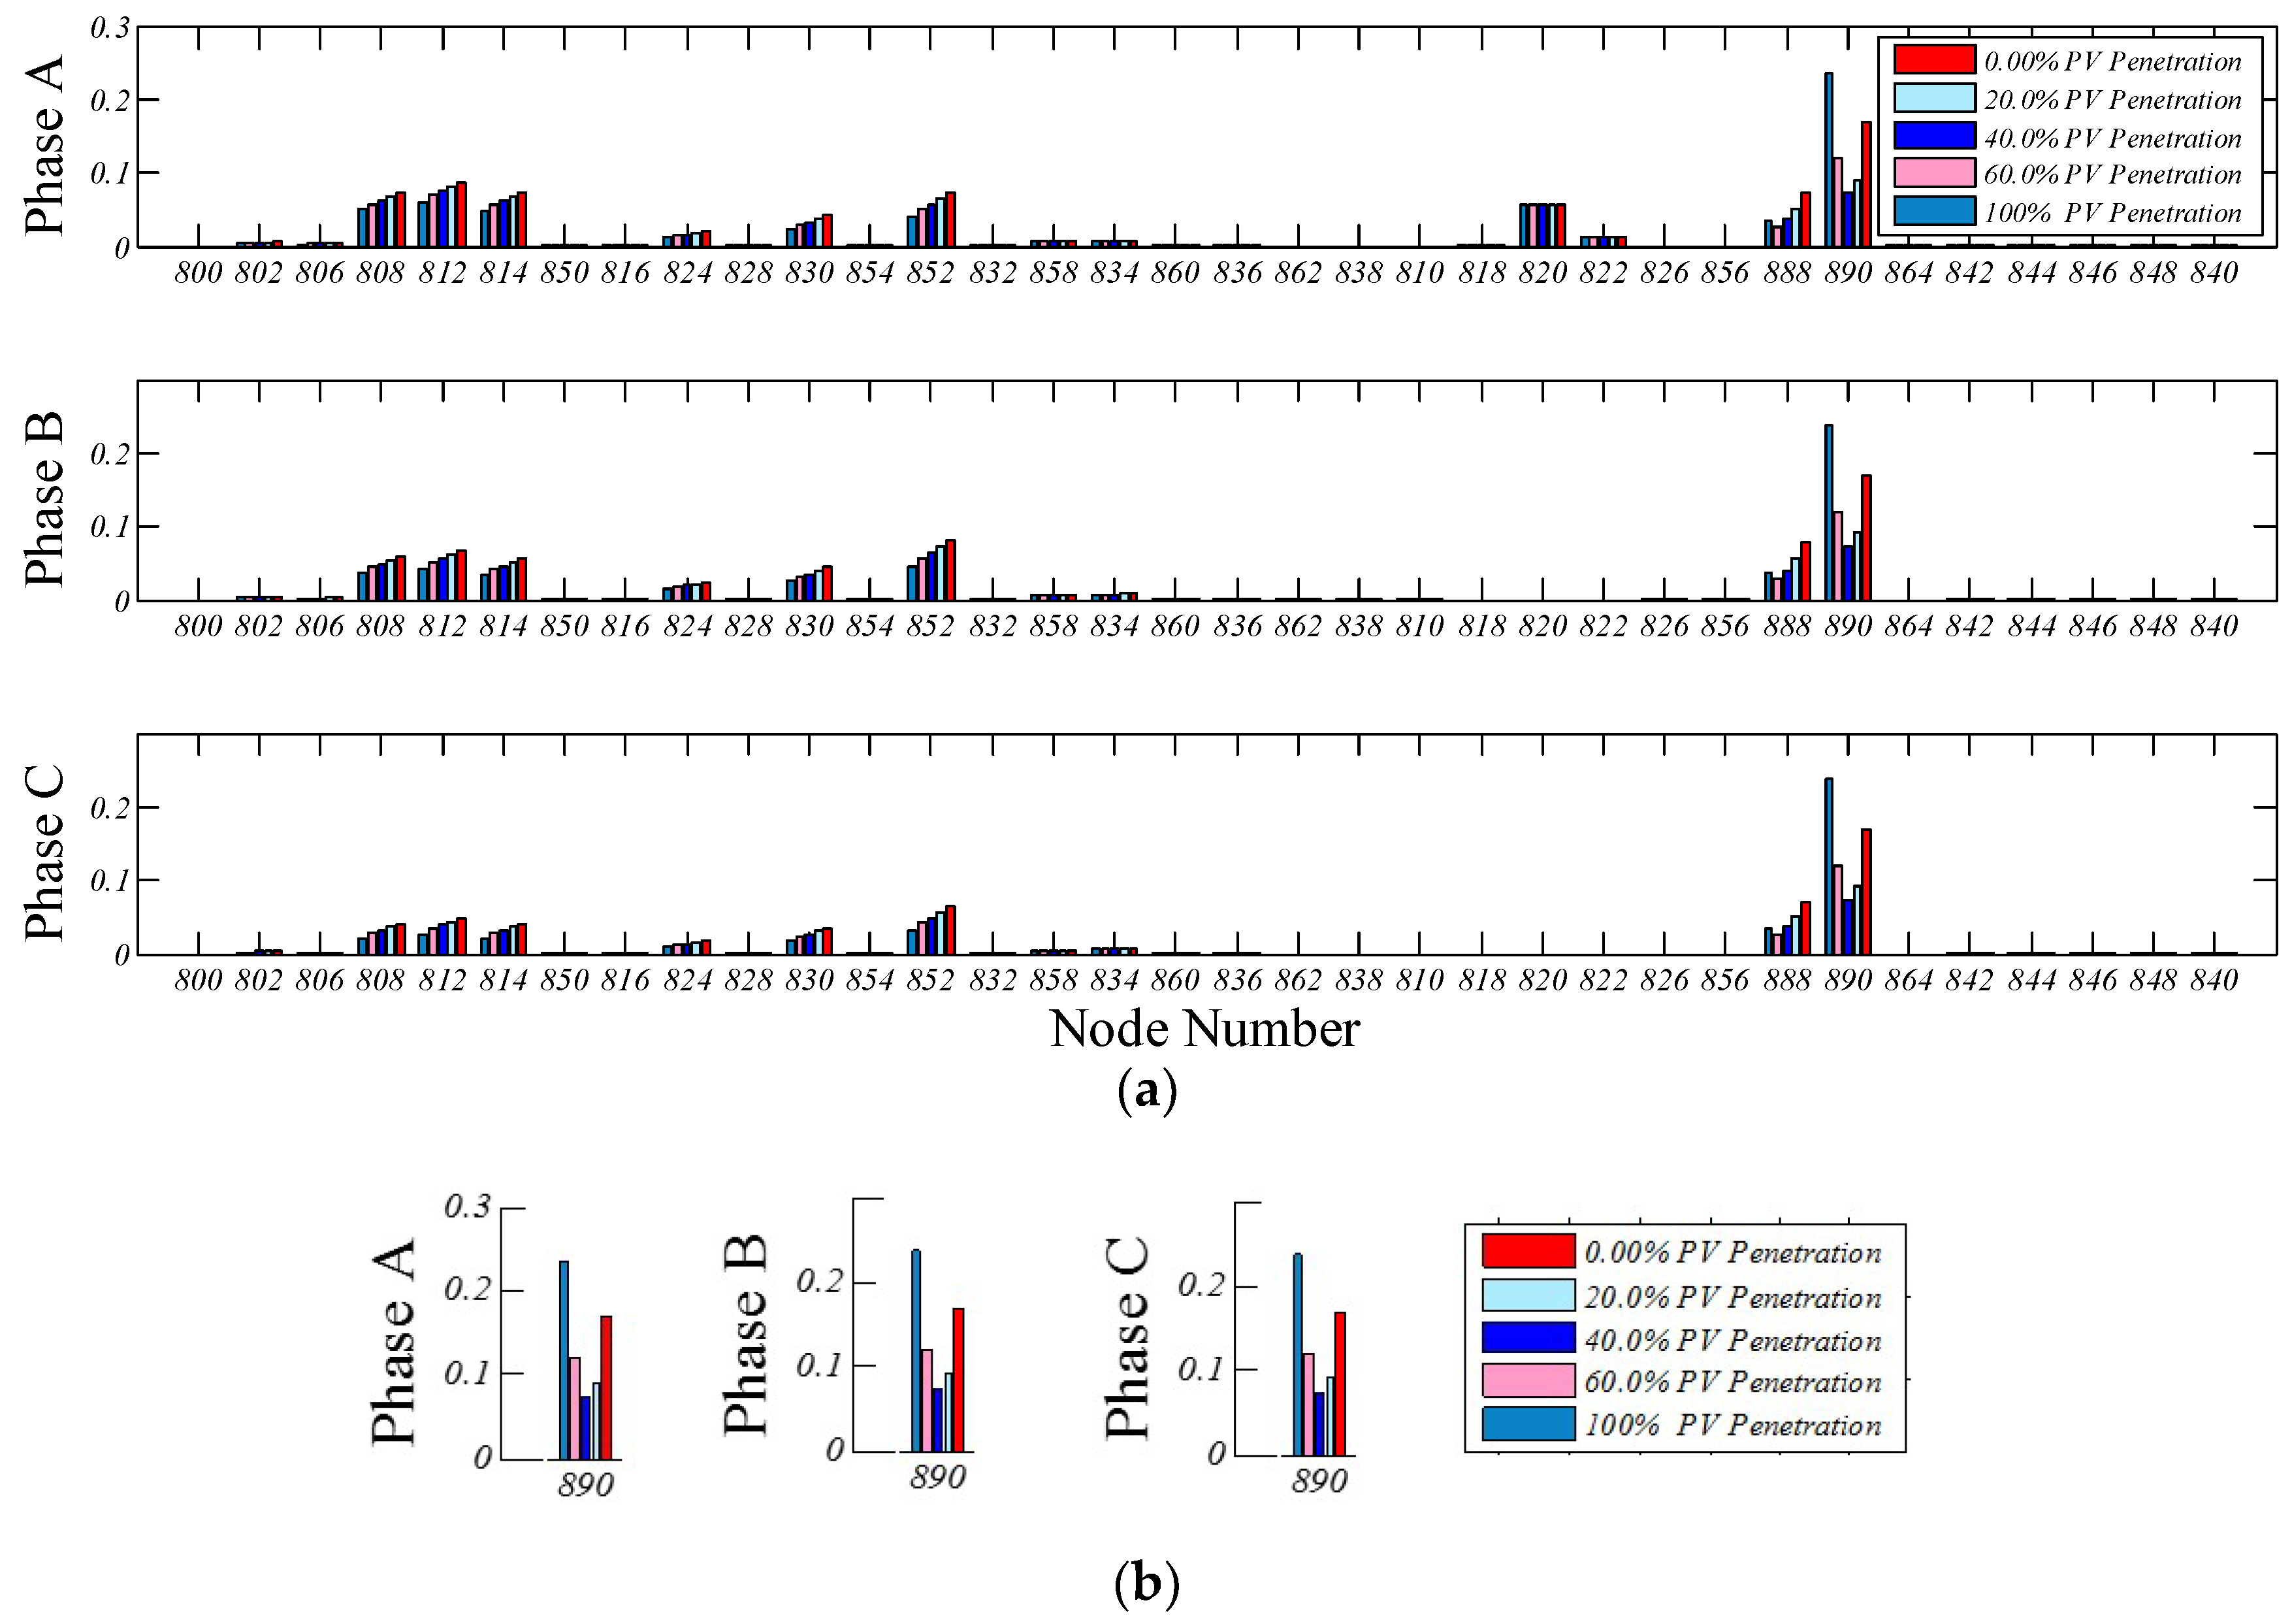
Now, it is possible to calculate the voltage stability criterion for all nodes of IEEE 34 node distribution systems in different PV penetration levels. Based on Section 1 and Section 2, the weakest nodes of the system are known. Accordingly, the stability criterion was investigated for the mentioned nodes versus different PV penetration. The results are presented in Figure 11a. Based on IEEE-1547 and IEEE-929 standards for distribution systems, operation of PV units in order to regulate voltage by injecting reactive power is not allowed [16]. In these standards, operation of PV units should be with power factors of more than 0.85. Hence, many PV systems and related controls of their convertors are based on active power production [27].
It is useful to note that the concentration of this work is focused on the stability of weaker nodes (node 890) because of having more constraints in terms of stability and being the worst case study. Figure 11b illustrates the effect of PV installation with different penetration levels on the stability of node 890 in three different phases. PV penetration levels are selected as proper proportions of the load power at each node. The simulation results of the stability criterion present that, at a penetration level of 40% (180 Kw of PV power versus 450 Kw load power at node 890), the system has the best voltage stability criterion. The worst voltage stability criterion occurs in penetration of 100% with Lk = 0.25. Regarding the voltage stability criterion, in penetration of more than 40% there is the worst condition of voltage stability. Penetration of 100% in comparison with other penetrations is closer to the voltage instability threshold. In fact, in this condition, the limitation of transferring apartment power makes the worst condition of voltage stability and consequently increases the value of the stability criterion.
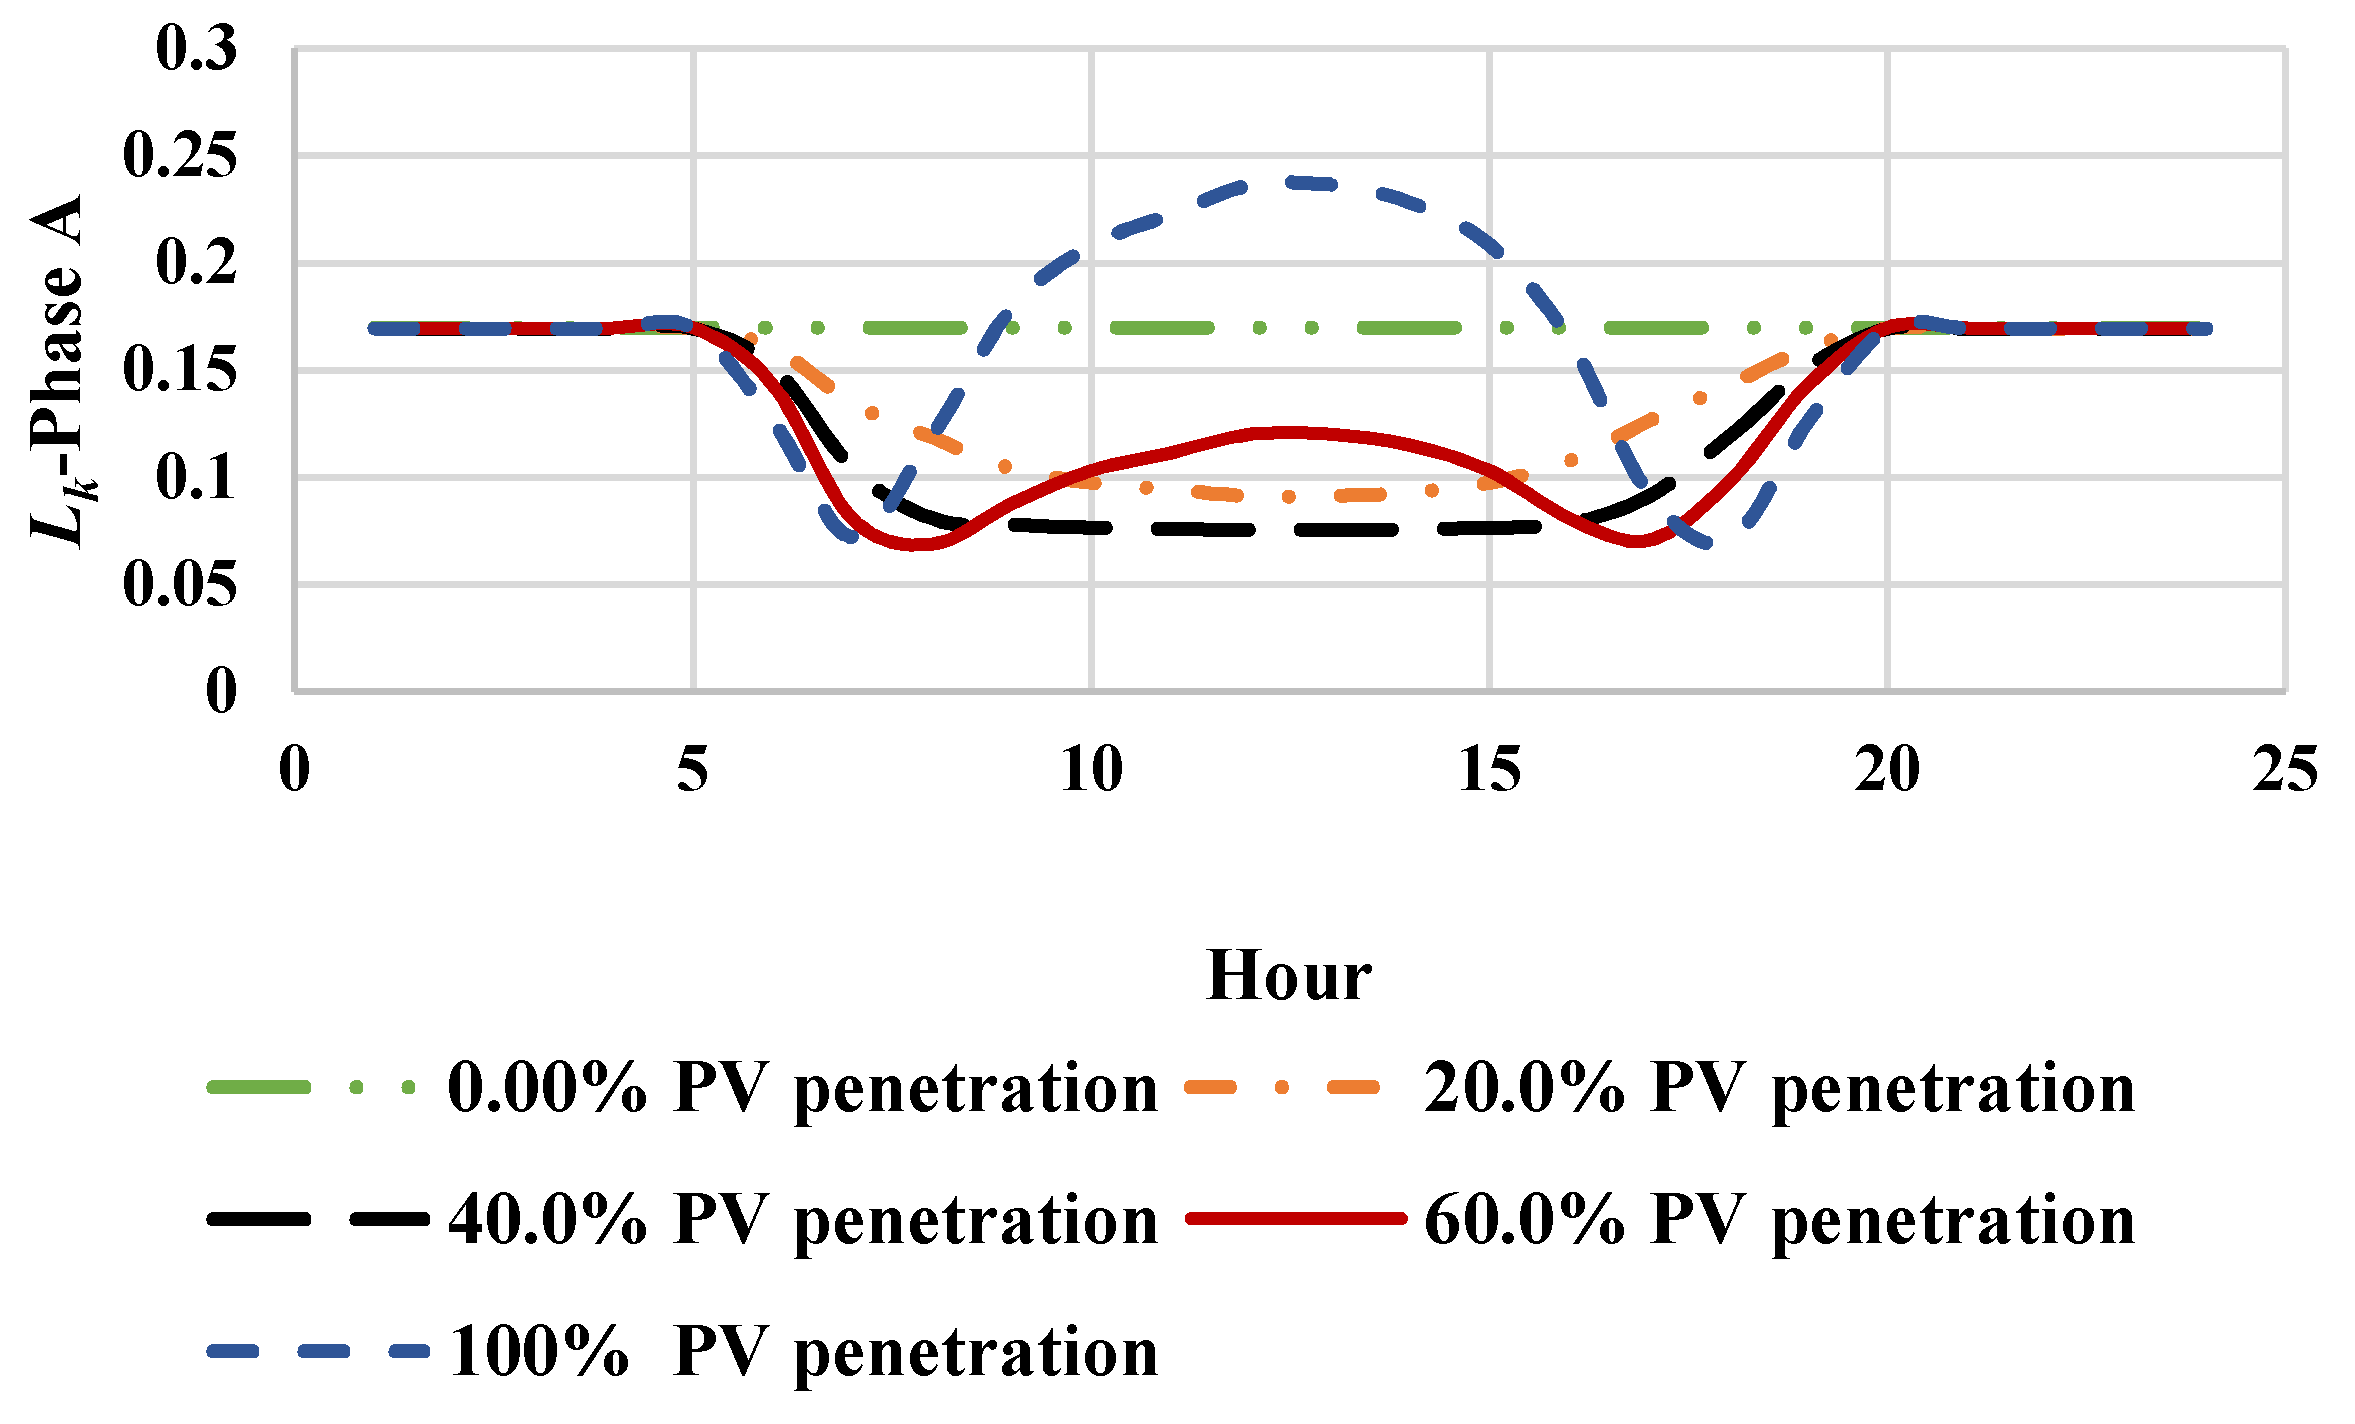
Only in a limited period of time in 24 h of a day does power generation of PV reach its nominal capacity. The aim of this section was to study the impact of PV on voltage stability of node 890 during different times of day. The proposed model of PV shows its power changes during the day. This means that, in low-power generation time, it has lower penetration level, and in maximum-power generation time, it has the highest penetration level. Consequently, based on the values given in Figure 5 and the load power connected to node 890, PV generation power for grid connections in different penetration levels is defined. Then, according to the specifications mentioned about PV, voltage stability of node 890 for 24 h is calculated.
Figure 12 demonstrates the voltage stability criterion in various penetrations considering the daily power profile model of PV for phase A at node 890. As it can be observed in Figure 12, the negative impact of a high PV penetration level is limited to specific times. For example, for the penetration of 100%, the negative impact of the operation is limited to 9 to 16 o’clock. It is also obvious that the best stability condition happens for a penetration of 40% and, specifically, when the power generation of PV reaches its nominal values. There are some small periods of time in which other penetration levels have their best stability conditions. For instance, penetration level of 60% has its best stability condition at two short periods, around 8 and 17 o’clock. These time spans are very short, so the penetration of 60% cannot be a good choice.
5. Conclusions
This paper studied the effect of PV penetration on the voltage stability of distribution networks. The penetration level of a node is defined as the ratio of node-connected PV’s power generation over load power capacity at the node. Accordingly, this study can give a proper engineering overview for distribution network expansion with PV generation units. The investigation was performed on the IEEE 34 node test feeder, considering load power and distribution line impedance. The study results show that some load locations at the end of uncompensated distribution lines, considering length and position of feeders can be critical nodes in terms of voltage stability investigation. According to the simulation results, node 890 was recognized as the weakest node and was chosen for further investigation on voltage stability. Consequently, considering PV penetration, the level voltage stability criterion at weakest nodes and the optimum stability obtained at 40% of PV penetration level were investigated. Then, using the daily power generation profile of a PV, the impact of different PV penetration levels on voltage stability during daytime was studied. The results show that the optimum nominal PV penetration level is again 40%.
Author Contributions
M.G. designed the DIgSILENT-based simulation of the proposed work and prepared the initial draft of paper. A.H. designed the formulation of the overall work and contributed significantly in writing the paper.
Funding
This research received no external funding.
Conflicts of Interest
The authors declare no conflict of interest. The funding sponsors had no role in the design of the study; the collection, analyses, or interpretation of data; the writing of the manuscript; and in the decision to publish the results.
References
- Kamaruzzaman, Z.A.; Mohamed, A.; Shareef, H. Effect of grid-connected photovoltaic systems on static and dynamic voltage stability with analysis techniques—A review. In Przeglad Elektrotechniczny; University Kebangsaan Malaysia: Selangor, Malaysia, 2015; pp. 134–138. [Google Scholar]
- Alam, M.J.; Muttaqi, K.M.; Sutanto, D. A novel approach for ramp-rate control of solar PV using energy storage to mitigate output fluctuations caused by cloud passing. IEEE Trans. Energy Convers. 2014, 29, 507–518. [Google Scholar]
- Tamimi, B.; Canizares, C.; Bhattacharya, K. System stability impact of large-scale and distributed solar photovoltaic generation: The case of Ontario Canada. IEEE Trans. Sustain. Energy 2013, 4, 680–688. [Google Scholar] [CrossRef]
- Remon, D.; Cantarellas, A.M.; Mauricio, J.M.; Rodriguez, P. Power system stability analysis under increasing penetration of photovoltaic power plants with synchronous power controllers. IET Renew. Power Gener. 2017, 11, 733–741. [Google Scholar] [CrossRef] [Green Version]
- Kawabe, K.; Tanaka, K. Impact of Dynamic Behavior of Photovoltaic Power Generation Systems on Short-Term Voltage Stability. IEEE Trans. Power Syst. 2015, 30, 3416–3424. [Google Scholar] [CrossRef]
- Kabir, Sh.; Krause, O.; Bartlett, S. Impact of Large-Scale Photovoltaic System on Short and Long Term Voltage Stability in Sub Transmission Network. In Proceedings of the Australasian Universities Power Engineering Conference AUPEC 2013, Hobart, TAS, Australia, 29 September–3 October 2013. [Google Scholar]
- Yan, R.; Saha, T.K. Investigation of voltage stability for residential customers due to high photovoltaic penetrations. IEEE Trans. Power Syst. 2012, 27, 651–662. [Google Scholar] [CrossRef]
- Mehrasa, M.; Pouresmaeil, E.; Zabihi, S.; Catalao, J.P.S. Dynamic Model, Control and Stability Analysis of MMC in HVDC Transmission Systems. IEEE Trans. Power Deliv. 2017, 32, 1471–1482. [Google Scholar] [CrossRef]
- Mehrasa, M.; Pouresmaeil, E.; Zabihi, S.; Vechiu, I.; Catalao, J.P.S. A multi-loop control technique for the stable operation of modular multilevel converters in HVDC transmission systems. Int. J. Electr. Power Energy Syst. 2018, 96, 194–207. [Google Scholar] [CrossRef]
- Mehrasa, M.; Pouresmaeil, E.; Rodriguez, E.M.G.; Vechiu, I.; Catalao, J.P.S. Synchronous Active Proportional Resonant-Based Control Technique for High Penetration of Distributed Generation Units into Power Grids. In Proceedings of the IEEE PES Innovative Smart Grid Technologies Conference Europe, Torino, Italy, 26–29 September 2017. [Google Scholar]
- Mehrasa, M.; Pouresmaeil, E.; Rodriguez, E.M.G.; Vechiu, I.; Catalao, J.P.S. A control strategy for the stable operation of shunt active power filters in power grids. Energy 2016, 96, 325–334. [Google Scholar] [CrossRef]
- Cagnano, A.; Tuglie, E.D. A decentralized voltage controller involving PV generators based on Lyapunov theory. Renew. Energy 2016, 86, 664–674. [Google Scholar] [CrossRef]
- Ortega, M.J.; Hernandez, J.C.; Garcia, O.G. Measurement and assessment of power quality characteristics for photovoltaic systems: Harmonics, flicker, unbalance, and slow voltage variations. Electr. Power Syst. Res. 2013, 96, 23–35. [Google Scholar] [CrossRef]
- Cagnano, A.; Tuglie, E.D.; Dicorato, M.; Forte, G.; Trovato, M. PV plants for voltage regulation in distribution networks. In Proceedings of the 47th International Universities Power Engineering Conference (UPEC), London, UK, 4–7 September 2012. [Google Scholar]
- Ackermann, T.; Andersson, G.; Söder, L. Distributed generation: A definition. Electr. Power Syst. Res. 2001, 57, 195–204. [Google Scholar] [CrossRef]
- Jayasekara, N.; Wolfs, P.; Masoum, M.A. An optimal management strategy for distributed storages indistribution networks with high penetrations of PV. Electr. Power Syst. Res. 2014, 116, 147–157. [Google Scholar] [CrossRef]
- Vita, V.; Alimardan, T.; Ekonomou, L. The impact of distributed generation in the distribution networks’ voltage profile and energy losses. In Proceedings of the 9th IEEE European Modeling Symposium on Mathematical Modeling and Computer Simulation, Madrid, Spain, 6–8 October 2015; pp. 260–265. [Google Scholar]
- Vita, V. Development of a decision-making algorithm for the optimum size and placement of distributed generation units in distribution networks. Energies 2017, 10, 1433. [Google Scholar] [CrossRef]
- Chen, T.H.; Huang, W.T.; Gu, J.C.; Pu, G.C.; Hsu, Y.F.; Guo, T.Y. Feasibility study of upgrading primary feeders from radial and open loop to normally closed-loop arrangement. IEEE Trans. Power Syst. 2004, 19, 1308–1316. [Google Scholar] [CrossRef]
- Buayai, K.; Ongsaku, W.; Mithulananthan, N. Multi-objective micro-grid planning by NSGA-II in primary distribution system. Eur. Trans. Electr. Power 2011, 22, 170–187. [Google Scholar] [CrossRef]
- Sarkar, T.; Bhattacharjee, A.; Mukhopadhyay, K.; Bhattacharya, K.D.; Saha, H. Energy Non-Availability in Distribution Grids with Heavy Penetration of Solar Power: Assessment and Mitigation through Solar Smoother. Energies 2018, 11, 709. [Google Scholar] [CrossRef]
- McGranaghan, M.; Ortmeyer, T.; Crudele, D.; Key, T.; Smith, J.; Baker, P. Advanced Grid Planning and Operations; Tech. Rep. NREL/SR-581-42294/SAND2008-0944 P; Sandia National Laboratories: Albuquerque, NM, USA; Livermore, CA, USA, 2008.
- Wiszniewski, A. New criteria of voltage stability margin for the purpose of load shedding. IEEE Trans. Power Deliv. 2007, 22, 1367–1371. [Google Scholar] [CrossRef]
- Machowski, J.; Bialek, J.; Bumby, J. Power System Dynamics: Stability and Control, 2nd ed.; John Wiley & Sons.: Hoboken, NJ, USA, 2011. [Google Scholar]
- Hasheminamin, M.; Agelidis, V.G.; Salehi, V.; Teodorescu, R.; Hredzak, B. Index-Based Assessment of Voltage Rise and Reverse Power Flow Phenomena in a Distribution Feeder Under High PV Penetration, Photovoltaics. IEEE J. Photovolt. 2015, 5, 1158–1168. [Google Scholar] [CrossRef]
- IEEE 34 Node Test Feeder. Available online: http://ewh.ieee.org/soc/pes/dsacom/testfeeders (accessed on 30 May 2017).
- IEEE Recommended Practice for Utility Interface of Photovoltaic (PV) Systems; IEEE Standard; IEEE: Piscataway, NJ, USA, 2000.
Figure 1.
A two-node system with equivalent impedance of Zs and electromotive force of Vs.

Figure 2.
Voltage characteristics vs. power.

Figure 3.
Loading capability curve.

Figure 4.
Proposed model for photovoltaic (PV) during 24 h.

Figure 5.
Simulation of IEEE 34 node test feeder in DIgSILENT.

Figure 6.
Voltage profile of IEEE 34 node feeder versus feeder length.

Figure 7.
V-P curves in the nodes close to reference IEEE 34 node feeder.

Figure 8.
V-P curves in the nodes with weaker stability conditions according to the voltage stability criterion.
Figure 8.
V-P curves in the nodes with weaker stability conditions according to the voltage stability criterion.

Figure 9.
V-P curves in the compensated nodes of the IEEE 34 node feeder system.

Figure 10.
V-P curves in the single-phase nodes of the IEEE 34 node feeder system.

Figure 11.
The stability criterion, Lk (a) for all nodes and for (b) node 890 in IEEE 34 node feeder with various PV penetration.
Figure 11.
The stability criterion, Lk (a) for all nodes and for (b) node 890 in IEEE 34 node feeder with various PV penetration.

Figure 12.
The value of the stability criterion of phase A, Lk, in various PV penetration levels for node 890.
Figure 12.
The value of the stability criterion of phase A, Lk, in various PV penetration levels for node 890.

© 2018 by the authors. Licensee MDPI, Basel, Switzerland. This article is an open access article distributed under the terms and conditions of the Creative Commons Attribution (CC BY) license (http://creativecommons.org/licenses/by/4.0/).
Share and Cite
MDPI and ACS Style
Ghaffarianfar, M.; Hajizadeh, A. Voltage Stability of Low-Voltage Distribution Grid with High Penetration of Photovoltaic Power Units. Energies 2018, 11, 1960. https://doi.org/10.3390/en11081960
AMA Style
Ghaffarianfar M, Hajizadeh A. Voltage Stability of Low-Voltage Distribution Grid with High Penetration of Photovoltaic Power Units. Energies. 2018; 11(8):1960. https://doi.org/10.3390/en11081960
Chicago/Turabian StyleGhaffarianfar, Majid, and Amin Hajizadeh. 2018. "Voltage Stability of Low-Voltage Distribution Grid with High Penetration of Photovoltaic Power Units" Energies 11, no. 8: 1960. https://doi.org/10.3390/en11081960
Note that from the first issue of 2016, this journal uses article numbers instead of page numbers. See further details here.